Article

Traffic–Tourism Spatial Interaction of Lai-Qu Expressway Based on the Traffic Flow Data

1
Transport Planning and Research Institute, Ministry of Transport, Beijing 100028, China
2
Laboratory of Transport Pollution Control and Monitoring Technology, Beijing 100028, China
3
School of Geographic Sciences and Environment, Shijiazhuang University, Shijiazhuang 050035, China
*
Authors to whom correspondence should be addressed.
Land 2025, 14(6), 1197; https://doi.org/10.3390/land14061197
Submission received: 15 April 2025 / Revised: 28 May 2025 / Accepted: 30 May 2025 / Published: 3 June 2025
(This article belongs to the Special Issue Territorial Space and Transportation Coordinated Development)

Abstract

:
In the Taihang Mountain Tourism Development Plan (2020–2035), the Taihang Mountain Expressway is included in the construction of the National Tourism Scenic Road around Taihang Mountain to promote the integrated development of regional transportation and tourism. The Lai-Qu Expressway is part of the Baoding section of the Taihang Mountain Expressway. Based on the data of traffic flow on the Lai-Qu Expressway, data of regional tourism resources, and data of regional economic and social development, this paper studies the interaction between the traffic and tourism space of the Lai-Qu Expressway by using spatial interaction, geographically weighted regression (GWR), and other geospatial analysis theories and methods. The results show that the traffic flow of the Baishishan Tollgate is directly correlated with the passenger flow of the Baishishan scenic spot. The spatial pattern of two tourism resource cluster centers and one sub-center, and one residential cluster center and one sub-center is expected to be formed along the Lai-Qu Expressway. The newly built traffic routes extend the influence of the traffic space and overlaps with the regional tourism space, not only providing new opportunities and possibilities for the development of regional tourism, but also promoting the change in the regional tourism spatial pattern and the cluster form of tourism resources. The research on the interaction between the traffic–tourism space in this paper can help to enrich the theoretical connotation of the research on the integration of transport and tourism, and can also be used to evaluate the tourism impact of newly built transport routes and serve the regional tourism development.

1. Introduction

Driven by the integration of transportation and tourism modes, high-speed tourism transportation is transitioning from a single transportation function to offering a rich travel experience and enhanced tourism services, so as to meet diverse and personalized travel needs [1]. With the improvement in the diversified and comprehensive transportation system, road transportation plays an increasingly obvious driving role in the development of the tourism industry [2,3], which is mainly manifested in location optimization, spatial reorganization, resource integration, and other aspects [4]. For example, Park et al. [5] found that road traffic infrastructure facilitates travel to tourist destinations, thereby having a positive impact on community living standards and tourism development. Nunkoo [6] argued that the development of road transportation creates employment opportunities, thus generating active support for the community and the regional tourism industry. Kanwal et al. [7] proposed that road traffic construction would have dual impacts on the development of the tourism industry and the changing concepts of local residents. In addition, some studies have shown that road traffic often plays a framework and supporting role in the formation of the regional tourism spatial pattern. For example, Novianti et al. [8] studied the planning and development of tourism destinations in the Ocean Road region of Australia and the dispersion and mobility of tourists. It is found that tourism transportation is the strategic basis for a region tourism destination and will continue to influence the development direction and spatial composition of tourism destinations. Best [9] took the No. 11 Highway in Canada as an example with which to study the role of the tourist highway in shaping regional lifestyles and developing natural tourism resources. It is found that road traffic has a profound impact on the business development mode of tourist destinations and the composition of the tourist communities. Ishikura et al. [10] studied the impact of urban high-speed traffic on the tourism economy and transportation network by taking Ring Road in Tokyo as an example and found that high-speed traffic has a significant impact on reducing transportation costs, enhancing tourism agglomeration, and avoiding monopolistic competition. It can be seen that most studies on the integration of transport and tourism are about the framework and conceptual spatial impact, and it is difficult to effectively correlate traffic data indicators with the regional tourism spatial impact and tourism industry development, and the impact evaluation of newly built tourism roads is still insufficient.
The “Taihang Mountain Tourism Development Plan (2020–2035)” integrates the Taihang Mountain Expressway into the construction category of the National Tourism Scenic Byway around Taihang Mountain, and suggests that the Taihang Mountain Expressway should be taken as an important basis for building a tourism scenic road with an environment-friendly feature from an ecological perspective, a rich cultural landscape, and the orderly separation of passengers and goods. The Lai-Qu Expressway is a part of the Baoding section of the Taihang Mountain Expressway, which was completed and opened to traffic at the end of 2018. It is a representative example of transportation infrastructure construction promoting the development of the tourism industry. Its completion and opening have changed the original pattern of traffic flow in the region. In the process of statistics and collation of traffic flow data of the Lai-Qu Expressway, it has been found that the traffic flow changes with the seasonal changes in tourism, the traffic flow at the exit of the same tollgate is greater than the traffic flow at the entrance, and the traffic flow gap between tollgates is large.
This study aims to explore the interaction between the influence space of expressways and the tourism space. To achieve this research goal, the newly built Lai-Qu Expressway is taken as the research area, the expressway traffic data and regional tourism data are used as the research data, and social exchange theory and geographical enhanced regression are used as the main theory and method. The application of the geographical spatial analysis method will help to enrich the ideas, methods, and theoretical connotation of the research on the integration of transportation and tourism. The results will serve the regional tourism development of the East Taihang Mountain and the construction of the regional tourism transportation system with a fast–slow combination, and can also be used to evaluate the tourism impact of newly built transport routes.

2. Theoretical Basis and Research Methods

2.1. Theoretical Basis

Tourism spatial interaction (TSI) and social exchange theory (SET) serve as the theoretical underpinnings of the research presented in this paper.
The spatial expression of tourism spatial interaction on tourism behavior encompasses the spatial attributes of tourists’ behaviors, the spatial configurations of tourism resources, and other dimensions [11]. It represents the concept of elucidating the relationship between man and land in the region and the correlation, interaction, and dynamic response among each subspace within the framework of tourism geography [12]. In the gravity model, travel time is often used to replace travel distance, and space extension is expressed by space–time compression, agglomeration effect, and regional cooperation, so as to study the interaction between spaces [13]. In this theory, the newly built tourism highways break the original traffic framework structure of the region, improve the accessibility of the whole region [14], reduce the accessibility differences of the region, and are more likely to guide tourists to the tourist resources with high attraction and high agglomeration in the reachable region [15], and then promote the agglomeration development of tourism resources and the linkage of scenic spot marketing [16]. Then, the spatial pattern of tourism is restructured with the extension of traffic-influenced space.
From the perspective of social interaction, social exchange theory establishes the relationship between people such as interest exchange and demand acquisition, and emphasizes the social relations formed by individuals and groups based on resource exchange [17]. It has been widely used in the analysis and research of community support, population mobility, resource interaction, and individual–group social relations in regional tourism development [18]. For instance, the establishment of the China–Pakistan Economic and Cultural Corridor (CPEC) is underpinned by transportation infrastructure, which facilitates the integration of critical elements such as population dynamics, resource allocation, environmental sustainability, and cultural exchange [17]. Social exchange theory can provide interaction possibility, travel motivation, and benefit analysis for regional tourism development on the needs of different groups. And it can also include infrastructure factors [7], social and economic factors [19], environmental protection factors [20], and other multiple influencing factors into regional tourism analysis and research.
Based on spatial interaction theory and social exchange theory, this paper regards tourism resource points as an important attraction of traffic flow, uses traffic volume to reflect the intensity of spatial interaction, and constructs the transportation–tourism spatial interaction relationship of “tourism resource points attract traffic flow and traffic flow promotes tourism spatial agglomeration”. In view of the dual significance of regional tourism to the development of tourism resources and community development, it is necessary that we regard residential area as an important factor affecting regional traffic flow, and link transportation–tourism–community all together when analyzing the impact of road traffic on regional tourism development. Finally, the multi-type space composed of traffic routes, tourism resources, and residential areas in the study area is analyzed by superposition and interaction.

2.2. Research Methods

Geographically weighted regression (GWR) is a local linear spatial regression model that utilizes a correction algorithm to assess the variation in influencing parameters in response to the spatial heterogeneity of factors [21]. It has obvious advantages in the study of spatial parameter difference and spatial differentiation of influencing factors and the analysis of difference and imbalance of influencing factors in different geographical Spaces. Local spatial reinforcement regression based on global regression has been widely used in regional spatial analysis [22], and regional traffic volume assessment. The geographical weighted regression model is planned to be used to analyze the spatial impact of traffic flow on tourism resources and residential areas in the study area in this paper. The model is constructed as follows: y i = β 0 u i , v i + k β k u i , v i x k , i + ε i , where y i is the dependent variable of the i element unit, u i , v i is the geographical coordinates of the i element unit, β k u i , v i is the value of the continuous function β k u , v on the i element unit (that is, the coefficient of the independent variable x k on the i element unit), x k , i is the independent variable, and ε i is the random error. Finally, the spatial expression and influence characteristics analysis of the non-linear and heterogeneous impacts of regional tourism development of the high-speed transportation obtained by geographically weighted regression are analyzed to construct the self-organizing space of tourism destinations, in the continuous plane [15], and show the influence process of newly built expressway on regional tourism traffic flow from disorder to new dynamic order.
In addition, the Tyson polygon rule, a geographical method that can localize the discrete sampling points, is used to determine the tourism resource points and residential areas of the actual influence of each tollgate along the Lai-Qu expressway before regression calculation [23]; the correlation analysis, a method that can be used to identify, analyze, and quantify the correlation between elements, is used to determine regression variables before regression calculation [7]; and the fuzzy density calculation method, which can be used for spatial geographic information extraction and clustering calculation, is used to process the regression results after regression calculation [24].

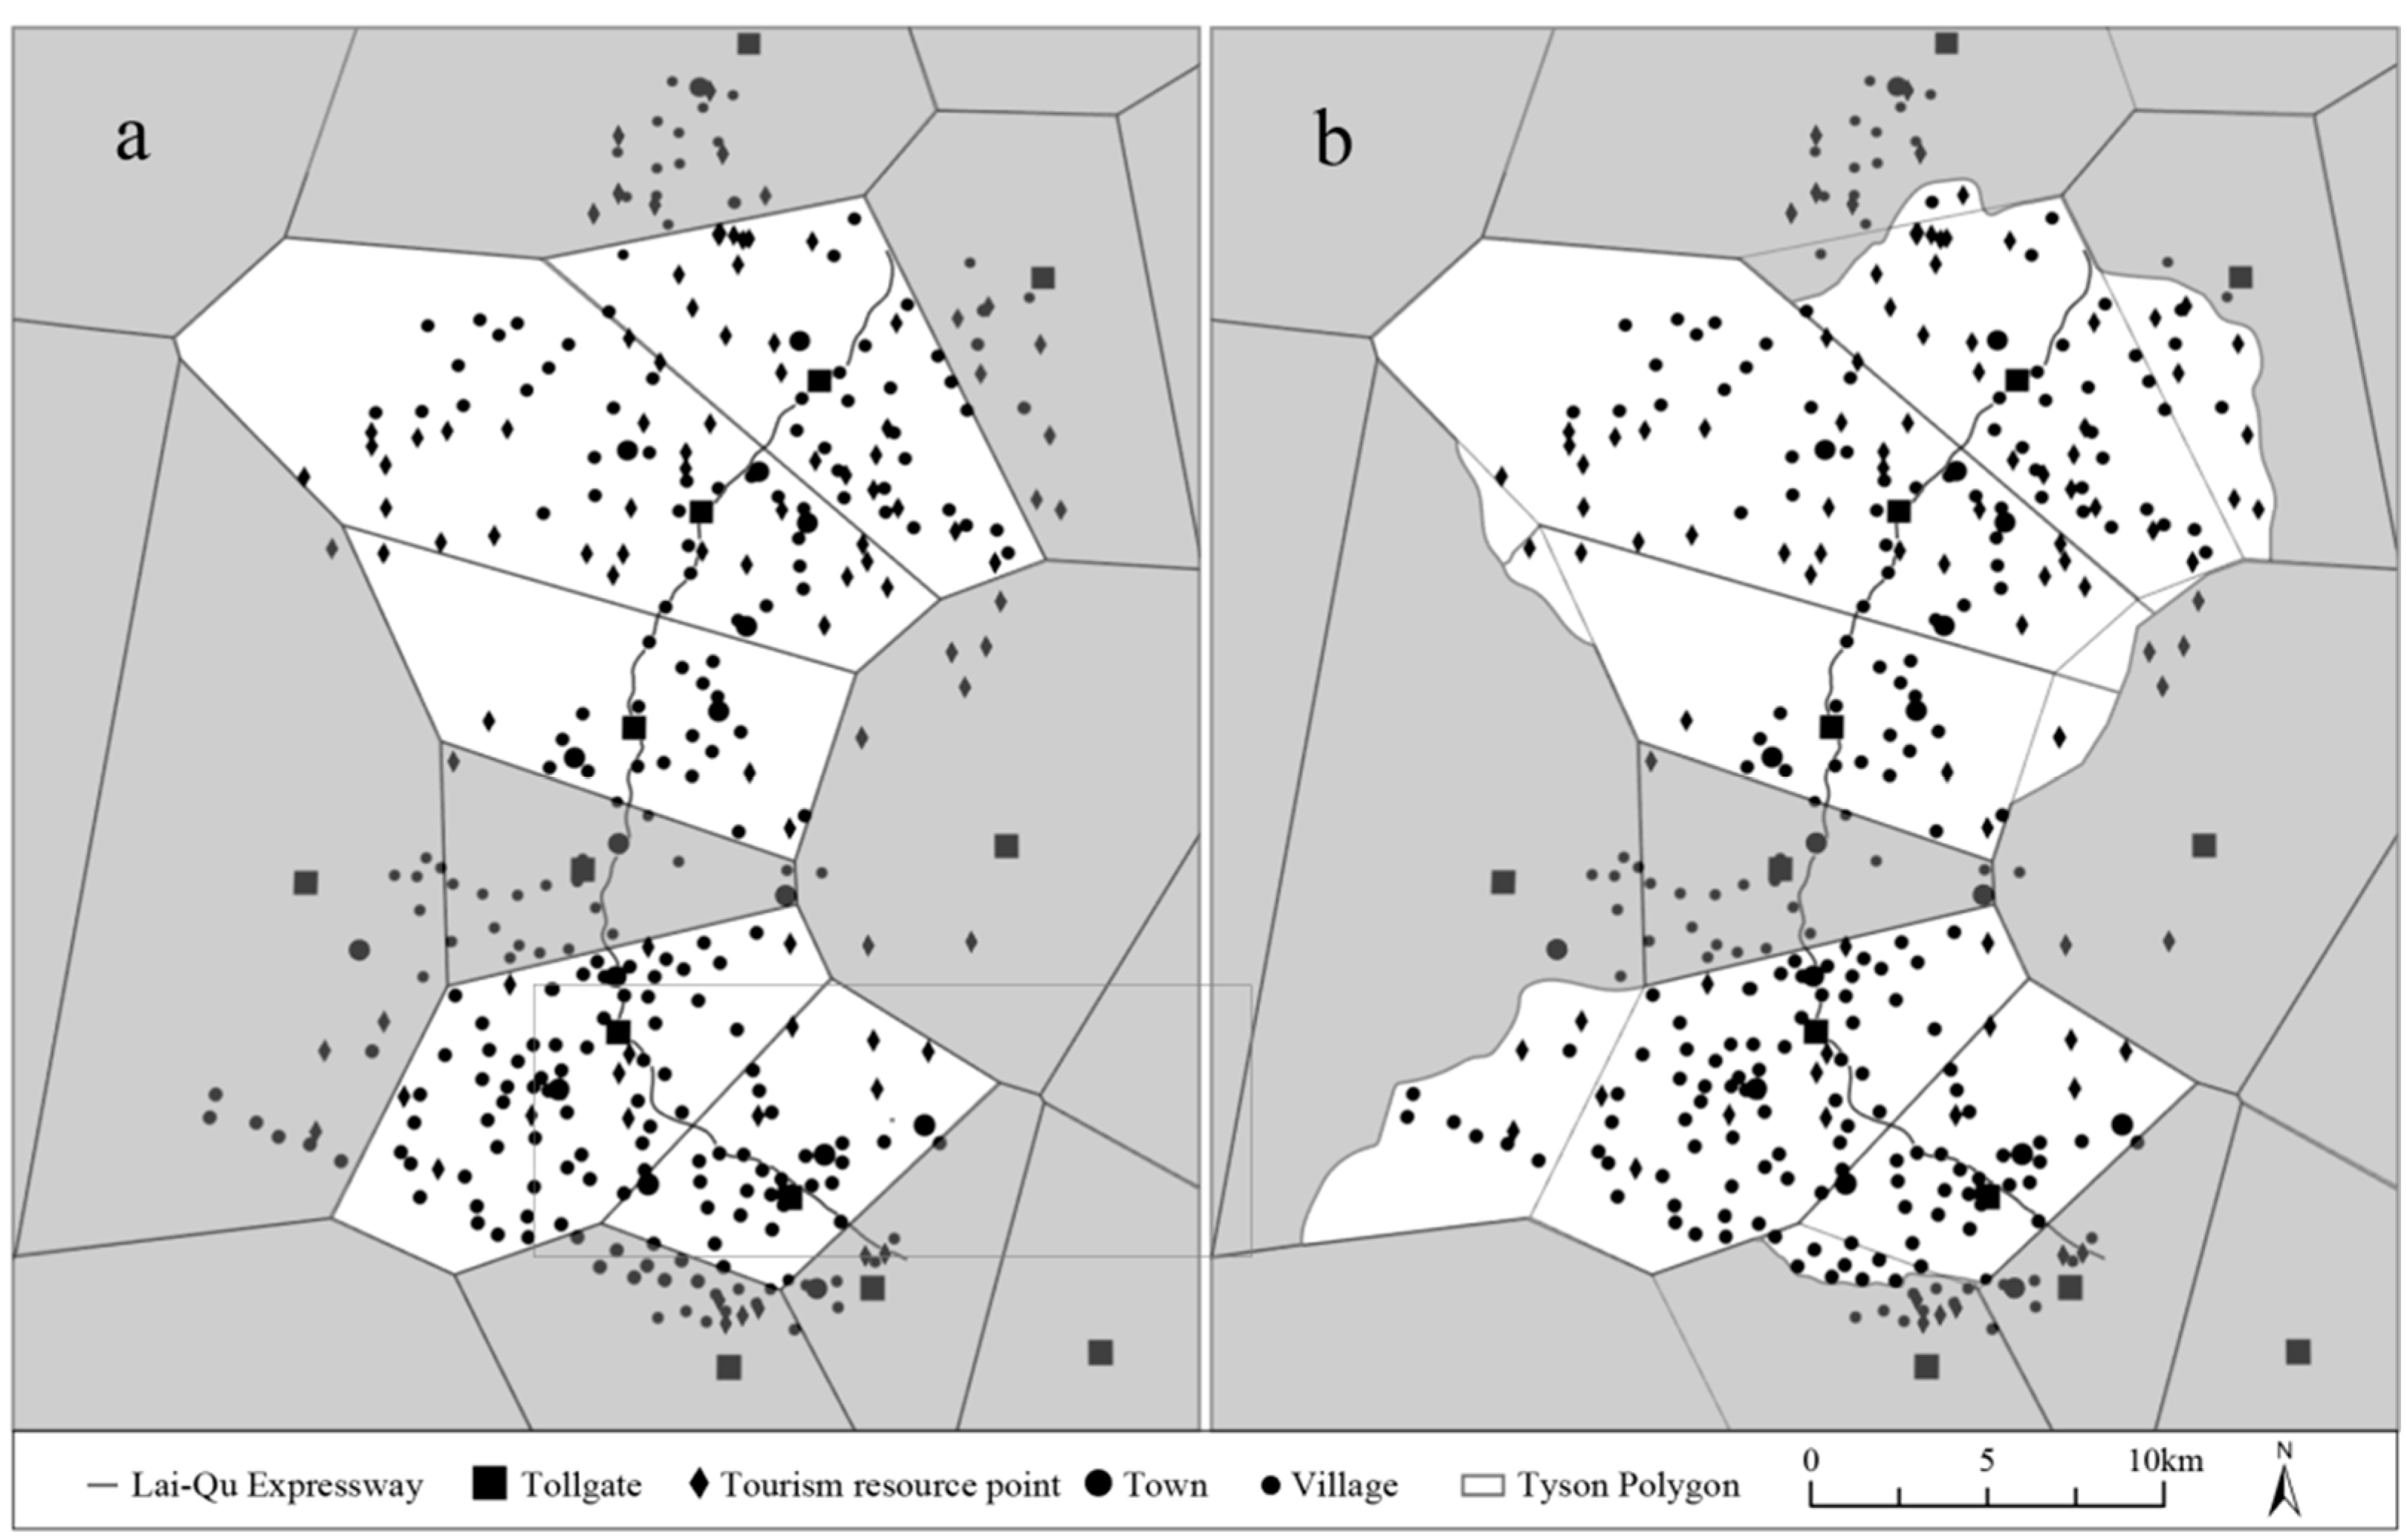
3. Case Area and Data

The Lai-Qu Expressway (S31), a provincial-level expressway, originates from Yansuya Village in Laiyuan County, Baoding City, and extends southward through Laiyuan County and Tang County to Quyang County. It connects to the Rongwu Expressway in the north and the Beijing–Kunming Expressway and Quyang–Huanghuagang Expressway in the south. The expressway has a total length of 72.8 km and a design speed of 100 km/h. There are five tollgates along it, and its traffic impact covers more than 20 towns. The completion and opening of the expressway have altered the traffic location of the surrounding areas, resulting in complex changes in regional traffic flow [7]. At the same time, many tourism entities in the region that have no hierarchical relationship have been effectively organized and coordinated to form a self-organizing space of tourism destinations that are not restricted by administrative regions [15]. By improving the regional tourism traffic location and optimizing the regional tourism road traffic, it has an impact on the surrounding areas; that is, there is a spatial interaction between the Lai-Qu Expressway and the tourism resource points and residential areas along the route.
The real traffic data along the Lai-Qu Expressway from May 2019 to December 2020 are obtained through the actual daily statistical data report form of the five tollgates, including the export traffic flow, the entrance traffic flow, the vehicle category, and the tolls. The traffic flow data are counted by day. A total of 948,573 entrance traffic flows and 1,434,876 export traffic flows are investigated and counted, and the annual total traffic toll is about 47.31 million yuan (Table 1). The traffic flow data of the section is obtained through the local database of the Transportation Management Center, and a total of 175,213 vehicle flows of the section were counted. Comprehensive statistical data are obtained through the website of the Transportation Department of Hebei Province as a supplement to other necessary data (http://jtt.hebei.gov.cn/jtyst/zwgk/jcxxgk/jttj/zhtjfx/, accessed on 7 March 2021).
Through database screening and a field investigation, the data of tourism resources in this study area are obtained, including the names of completed scenic spots, the available development tourism resources, the longitude and latitude, and the counties to which they belong. According to the national standard [15], the classification, single investigation, and evaluation of tourism resources (1–5) are carried out, and 109 tourism resources points that may be affected by the Lai-Qu Expressway are initially identified and investigated (Figure 1a). Through the database screening and field investigation, the detailed data of residential areas along the route are obtained, including the name of settlements, latitude and longitude, and administrative districts. Among them, the township point coordinates the location of the government, and the village-level settlements coordinate the village-level administrative boundary polygon geometric center. According to the population, economy, and other factors of the settlements, 17 township-level settlements and 237 villages that may be affected by the Lai-Qu Expressway are initially identified and graded (Figure 1a).
The data information of other expressways around the Lai-Qu Expressway, including expressway line data and tollgate data, are continuously collected, and all the collected tollgate data (including tollgates along the Lai-Qu Expressway) are divided into polygon regions by Arcgis Pro according to the Tyson polygon rule to initially identify the influence area of each tollgate along the Lai-Qu Expressway (Figure 1a). According to the topography, traffic flow direction, residents’ travel habits, administrative district management, and other factors, combined with the results of the field research, the Tyson polygon boundary is adjusted to obtain the actual influence area of each tollgate of the Lai-Qu Expressway (Figure 1b). According to the statistics, 81 tourism resource points, 13 towns-level residential areas, and 181 villages are affected by the Lai-Qu Expressway (Table 2). The statistical data of 13 towns are obtained by querying the Statistical Yearbook, including the area of jurisdiction, the number of village committees, the household registration population, the number of enterprises, and the number of comprehensive stores (Table 2), which are used to reflect the basic situation of regional economic, social, and tourism development, and to conduct the following spatial impact analysis of the Lai-Qu Expressway.
In order to study the impact of the traffic flow of the Lai-Qu Expressway on regional tourism development, the annual traffic flow of the Baishishan Tollgate and the tourist flow of the Baishishan Scenic Spot in 2019 were statistically sorted out (Table 3). As a scenic spot with the highest level (5A) and popularity in the case area, its main tourist source market is the Beijing–Tianjin–Hebei region, followed by Inner Mongolia, Shanxi, and other regions. The total number tourists of the Baishishan Scenic Spot in 2019 was 1.5026 million person-times, accounting for nearly three-quarters of the total tourists in the area affected by the Baishishan Tollgate (http://www.laiyuan.gov.cn/ldjh/1246.jhtml, accessed on 17 November 2021).
The completion and opening of the Lai-Qu Expressway effectively communicates the tourist flow of Shijiazhuang, Xingtai, Handan, and other cities in the central and southern part of Hebei Province, which can better reflect the interaction between traffic flow and tourism flow, and traffic space and tourism space. That is, the completion and opening of the Lai-Qu Expressway has changed the traffic location of the case area and the Baishishan Scenic Spot, and provided more diversified and direct route choices for tourists from the source to the destination. Therefore, this paper takes the tourism flow of the Baishishan Scenic Spot as the representative of regional tourism flow research, and studies the correlation between the transportation and tourism industry development based on the traffic flow data of the Lai-Qu Expressway and the tourism flow data of the Baishishan Scenic Spot.

4. Results

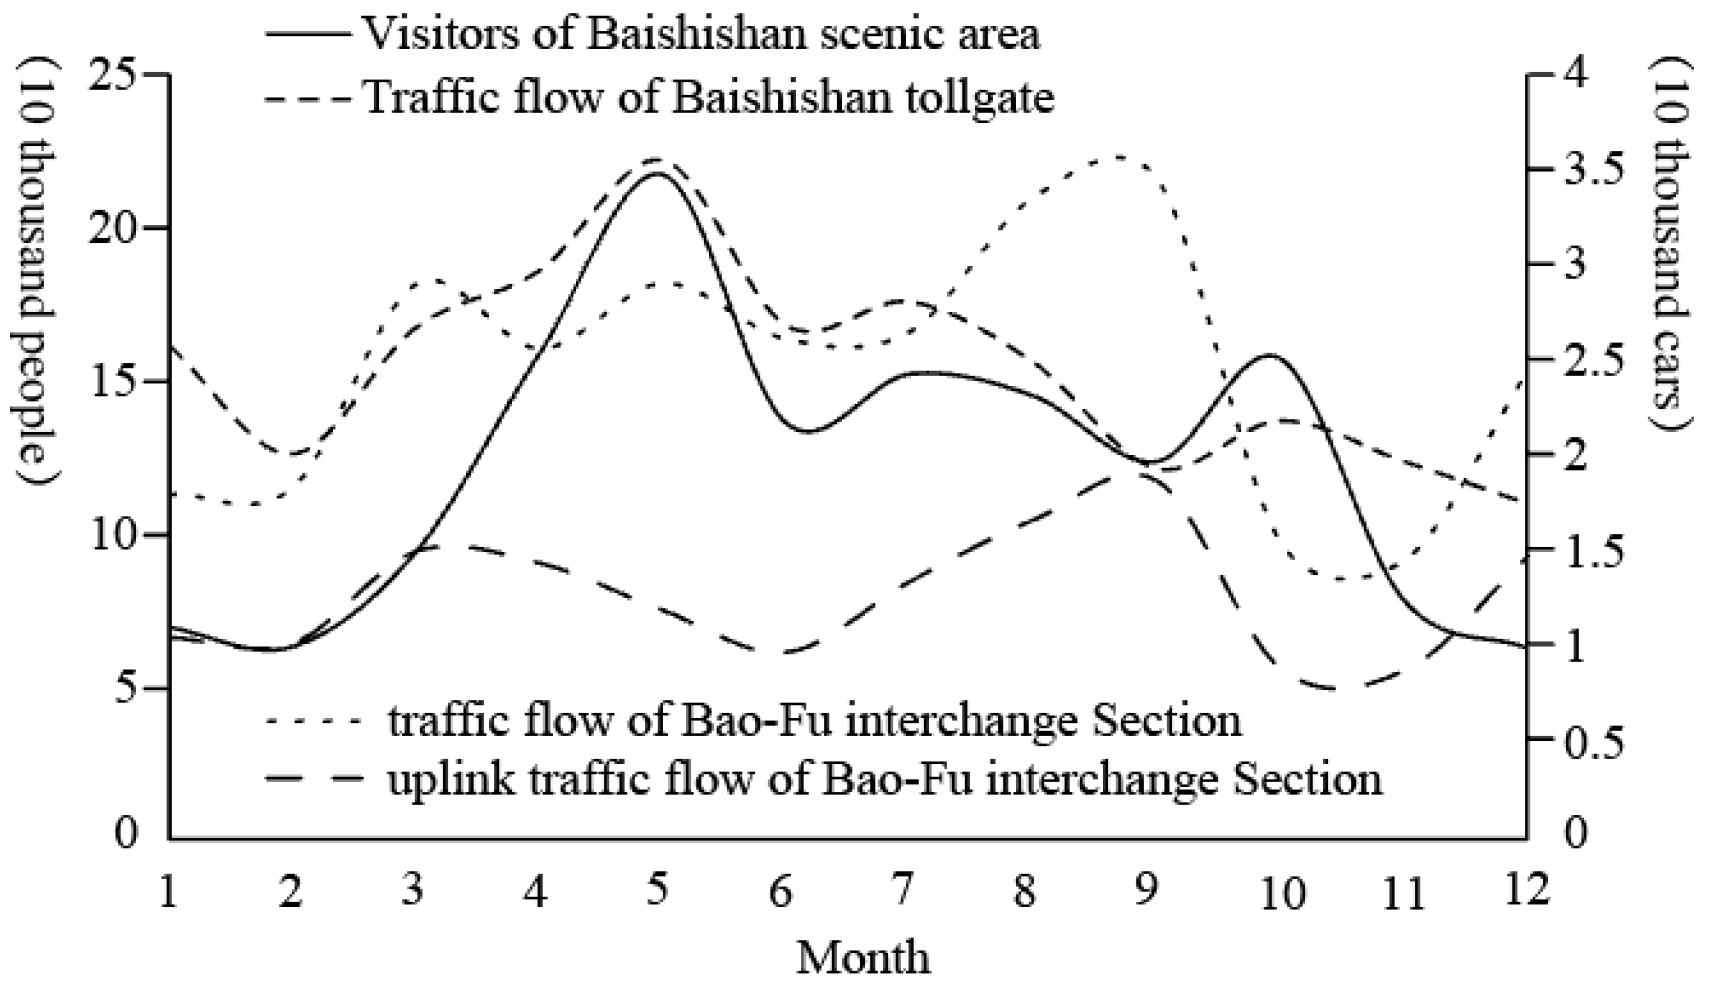
4.1. The Correlation Between Lai-Qu Expressway Traffic Flow and Tourist Flow of the Scenic Spots

A correlation analysis (Table 4) and a curve comparison analysis (Figure 2) are conducted between the tourism flow of the Baishishan Scenic Spot and the traffic flow of the Baishishan Tollgate on the Lai-Qu Expressway. Simultaneously, the traffic flow data of the Baofu Interchange (noting that there is no traffic flow data available for 2019 at the Yansuya Interchange), which is in close proximity to the Baishishan Tollgate, are incorporated into the comparative study. The findings are as follows: (1) The tourism flow of the Baishishan Scenic Spot is correlated with the traffic flow of the Baishishan Tollgate of the Lai-Qu Expressway and the correlation is significant, but the correlation with the traffic flow of the interchange section is not obvious, whereas the traffic flow of the interchange section is correlated with the upward traffic flow. (2) Although there is no obvious parallel structure between the tourism flow of the Baishishan Scenic Spot and the traffic flow curve of the Baishishan Tollgate, there is still a strong correlation. The peak–valley value of tourism flow and traffic flow almost appear at the same time, especially in May, when the annual maximum tourism flow statistics of the Baishishan Scenic Spot (28,000 tourists on May 2) and the annual maximum traffic flow statistics of the Baishishan Tollgate (2009 vehicles on May 2) appear. (3) The upward traffic flow is directly related to the amount of interchange section traffic flow, but the curve synchronization between the interchange section traffic flow and tourism flow is not obvious. Although the peak–valley values of the two are also obvious, there is a certain lag or buffer in the interchange section data, which may be related to the traffic flow from Beijing, Tianjin, and other directions (the Yansuya interchange data may be better verified), the non-one-day travel traffic flow, and the local residents’ travel and regional development.

4.2. The Correlation Between Toll Charges and Regional Development Index

To verify the correlation between traffic flow and regional development, the traffic flow data of the Lai-Qu Expressway were subdivided, and statistical analyses were conducted according to the categories of entrance, exit, cars/buses, and vans to assess the correlation between the regional economy, social development, the regional impacts of the Lai-Qu Expressway, and its development significance. SPSS (27.0) software was employed to analyze the correlation between the aforementioned statistical data and regional development data in the affected area (Table 5). It was found that the import traffic flow (0.769) and the export total traffic flow (0.753) has a strong correlation with the number of village committees in the region, the export car/bus (0.897) had the strongest correlation with the regional household registration population, the charge data (0.715/0.871/0.687) all had the strongest correlation with the number of village committees, but the export van charges had a weak correlation and poor significance compared with the other two indicators. The number of village committees (0.871) has the strongest correlation with the export car/bus charge data, and the household registration population (0.897) has the strongest correlation with the export car/bus data. The administrative area and the number of enterprises are negatively correlated with the traffic flow, and the correlation is weak. The number of general stores (0.788) has the strongest correlation with the export car/bus data.
In summary, the number of settlements, the regional population, and the level of the agriculture and economy are directly related to the traffic flow of the Lai-Qu Expressway, in addition to other indicators that failed to be reflected. In other words, settlements with a high population density, high per capita income, and high level of agricultural development along the Lai-Qu Expressway are more likely to build up a close relationship between transportation, tourism, and community, and are more prominent in areas with a high concentration of settlements.

4.3. Characteristics of Tourism Spatial Impact of Lai-Qu Expressway

The GWR model is employed to investigate the spatial relationship between the traffic flow at each tollgate and the tourism resource points, as well as residential areas along the Lai-Qu Expressway. Based on the analysis results presented in Section 4.1, and drawing upon the screening methodologies for the explanatory variables of the GWR model utilized in previous studies, the grade, quantity, and distance between tourism resource points and the nearest toll station are initially selected as the explanatory variables of the GWR model pertaining to tourism resource points. Similarly, in accordance with the analysis results in Section 4.2, and referring to the screening approaches for the explanatory variables of the GWR model adopted in other research, the number of residential areas, the distance to the nearest tollgate, the regional area, and the regional population are initially designated as explanatory variables of the GWR model associated with residential points. SPSS software was utilized to perform standardized processing and collinearity tests on the aforementioned explanatory variables. Subsequently, the explanatory variable “regional area”, which had a variance inflation factor (VIF) exceeding 10, was eliminated. Finally, three explanatory variables related to tourism resource points (grade, quantity, and distance to the nearest tollgate) and three explanatory variables related to residential areas (quantity, distance to the nearest tollgate, and household population) were determined, respectively.
The GWR calculation is carried out for tourism resource points and residential areas, respectively, and the regression formula of tourism resource points is constructed as   y i = β 0 i + β 1 i R G i + β 2 i R N i + β 3 i R D i + + ε ( i ) , where y i is the traffic flow of each tollgate, R G i is the grade of tourist resource points, R N i is the number of tourist resource points, and R D i is the distance between tourism resource points and the nearest expressway tollgate. With the help of the Arcgis GWR analysis tool for data calculation, the AICc value is 343.94, the Neighbors value is 10.55 km, the R2 value is 0.9206, and the adjusted R2 is 0.9046. The regression formula of the residential area is constructed as y i i = β 0 i i + β 1 i i P N i i + β 2 i i P D i i + β 3 i i P P i i + ε ( i i ) , where y i i is the traffic flow of each tollgate, P N i i is the number of residential areas, P D i i is the distance between residential area and the nearest expressway tollgate, and P P i i is the registered population of the residential area. With the help of the Arcgis GWR analysis tool for data calculation, the AICc value is 209.65, the Neighbors value is 14.19 km, the R2 value is 0.9083, and the adjusted R2 is 0.8889. The rule is that the value of R2 tends to be 1 and, the better the fitting degree is, the better the regression results of tourism resource points are compared to those of residential areas; that is, the regression results of tourism resource points can better reflect the actual situation of the spatial impact of the Lai-Qu Expressway.

4.3.1. Characteristics of Spatial Influence of Traffic Flow on Tourism Resource Points

As illustrated in Figure 3, the regression results of the spatial relationship between the traffic flow of the Lai-Qu Expressway and the tourism resource points show that the above attributes of the tourism resource points ( β 1 β 3 ) have an impact on the traffic flow from big to small in order of the tourism resource point grade ( β 1 ), the distance to the nearest tollgate station ( β 2 ), and the number of tourism resource points ( β 3 ). The significance of its impact is in order of the tourism resource point grade ( β 1 ), the number of tourism resource points ( β 3 ), and the distance to the nearest tollgate ( β 2 ).
Specifically, the Baishishan Tollgate and Chuanli Tollgate are associated with more tourism resource points (including the highest level of the Baishishan Scenic Spot in the region). Under the influence of the Baishishan Tollgate and Chuanli Tollgate, several tourism resource points in the northern section of the Lai-Qu expressway show a close relationship with the traffic flow, and the interaction between the two tollgates and tourism resource points is obvious. The Gubeiyue Tollgate has the fewest tourism resource points, and the correlation between tourism resource points and tollgate traffic flow is poor. There are few tourism resource points associated with the Lingshannan Tollgate and Quyangbei Tollgate, but the interaction characteristics between the distance to the nearest tollgate and the traffic flow is obvious, and the influence is significant. In terms of the spatial characteristics, the two tollgates in the northern section of the Lai-Qu Expressway provide opportunities and possibilities for the formation of high-level and high-density tourism resource cluster centers. The spatial interaction between the Lai-Qu Expressway and tourism resource points is obvious, and the impact is significant. The Gubeiyue Tollgate in the middle section is associated with fewer tourism resource points, and its spatial interaction with tourist resource points is insufficient. The two tollgates in the southern section have obvious interaction characteristics with the associated tourist resource points of distance attenuation.

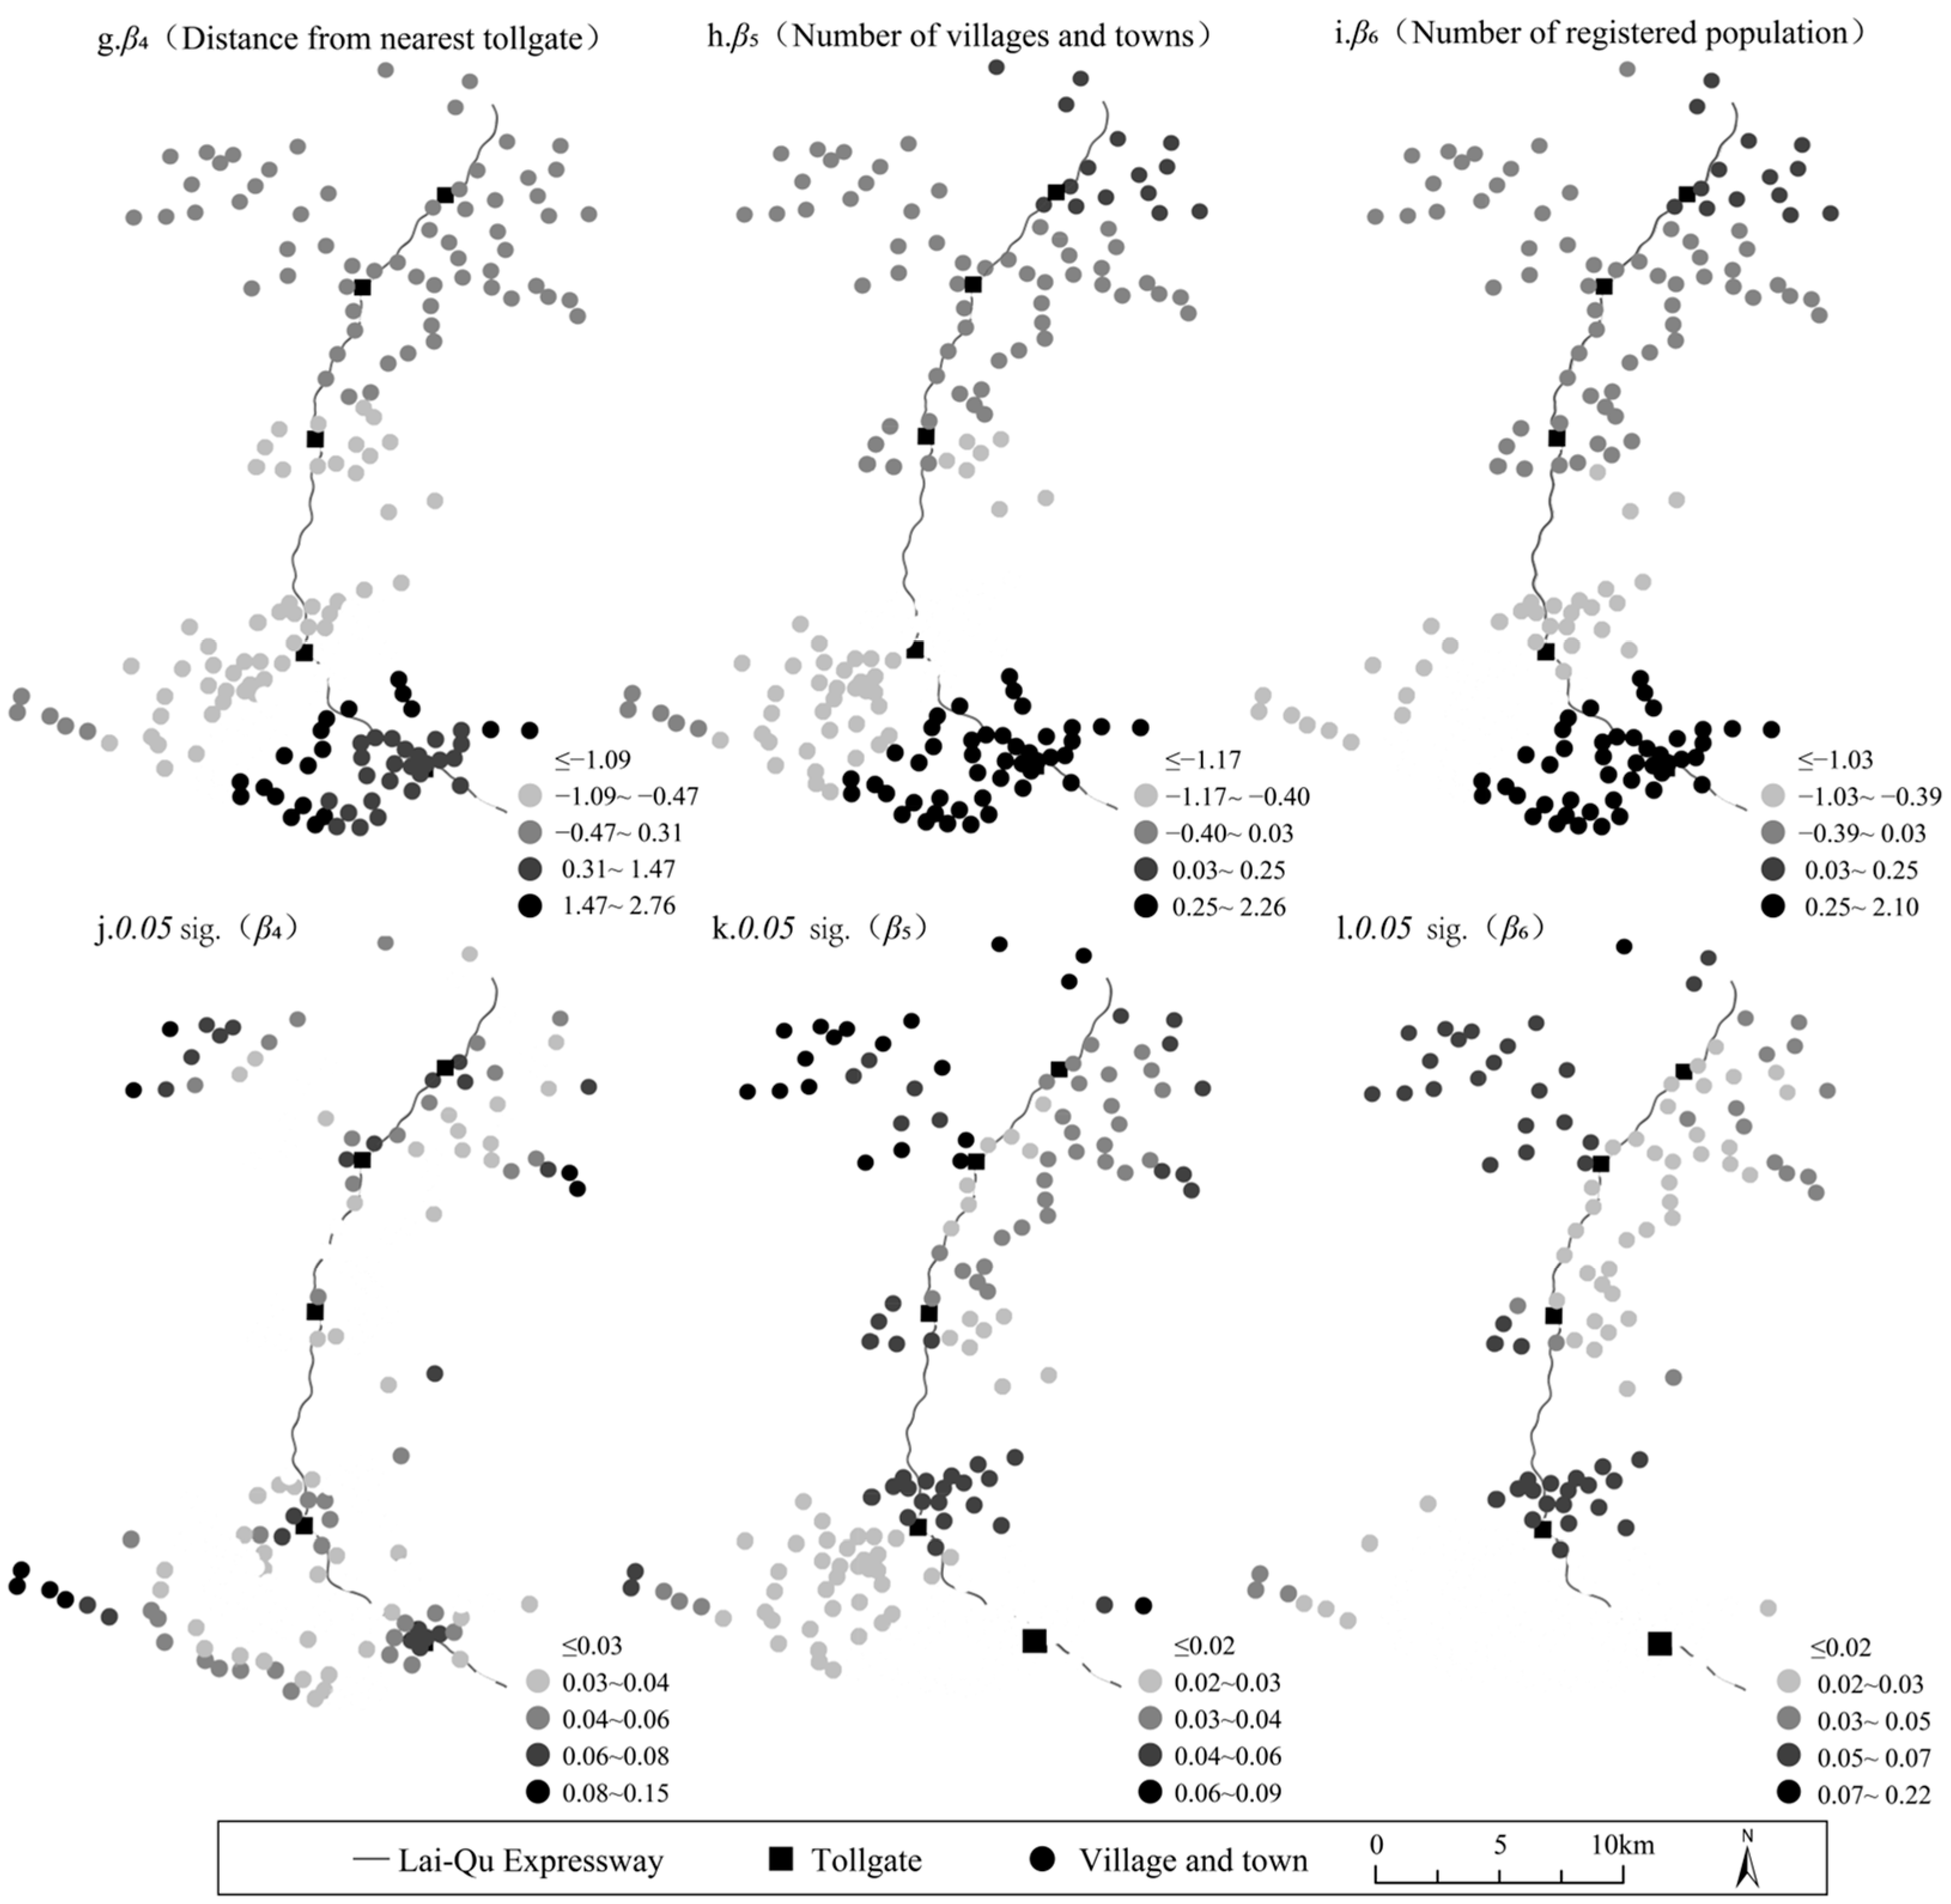
4.3.2. Characteristics of Spatial Influence of Traffic Flow on Residential Area

As shown in Figure 4, the regression results of the spatial relationship between the traffic flow of the Lai-Qu Expressway and the residential areas show that the above attributes of the residential areas ( β 4 β 6 ) have an impact on the traffic flow from big to small in order of the number of residential areas ( β 5 ), the household population ( β 6 ), and the distance to the nearest tollgate ( β 4 ). The significance of its impact is in order of the distance to the nearest tollgate station ( β 4 ), the household population ( β 6 ), and the number of residential points ( β 5 ).
Specifically, the Baishishan Tollgate and Chuanli Tollgate are associated with a large number of scattered residential areas, and the interaction between each property of the settlements and the Lai-Qu Expressway is positive. The Gubeiyue Tollgate has the fewest residential areas, and the correlation between the residential areas and the traffic flow is not strong. The Lingshannan Tollgate and Quyangbei Tollgate are associated with a large number of dense settlements, but the interaction between them and the associated residential areas is different. The interaction between the Lingshannan Tollgate and the associated residential areas is poor and only one attribute ( β 4 ) is significant, while the interaction between the Quyangbei Tollgate and the associated residential areas is very obvious and significant. In terms of the spatial characteristics, the interaction between the two tollgates in the northern section and the associated residential areas is mostly positive, but not significant; the distance decay characteristics between the Gubeiyue Tollgate and Lingshannan Tollgate and the associated residential areas are very obvious; the agglomeration characteristics of the associated residential areas in the southern section of the Lai-Qu Expressway are obvious, and the influence of the number of residential areas and the household population on the traffic flow of the Lai-Qu Expressway is more significant.

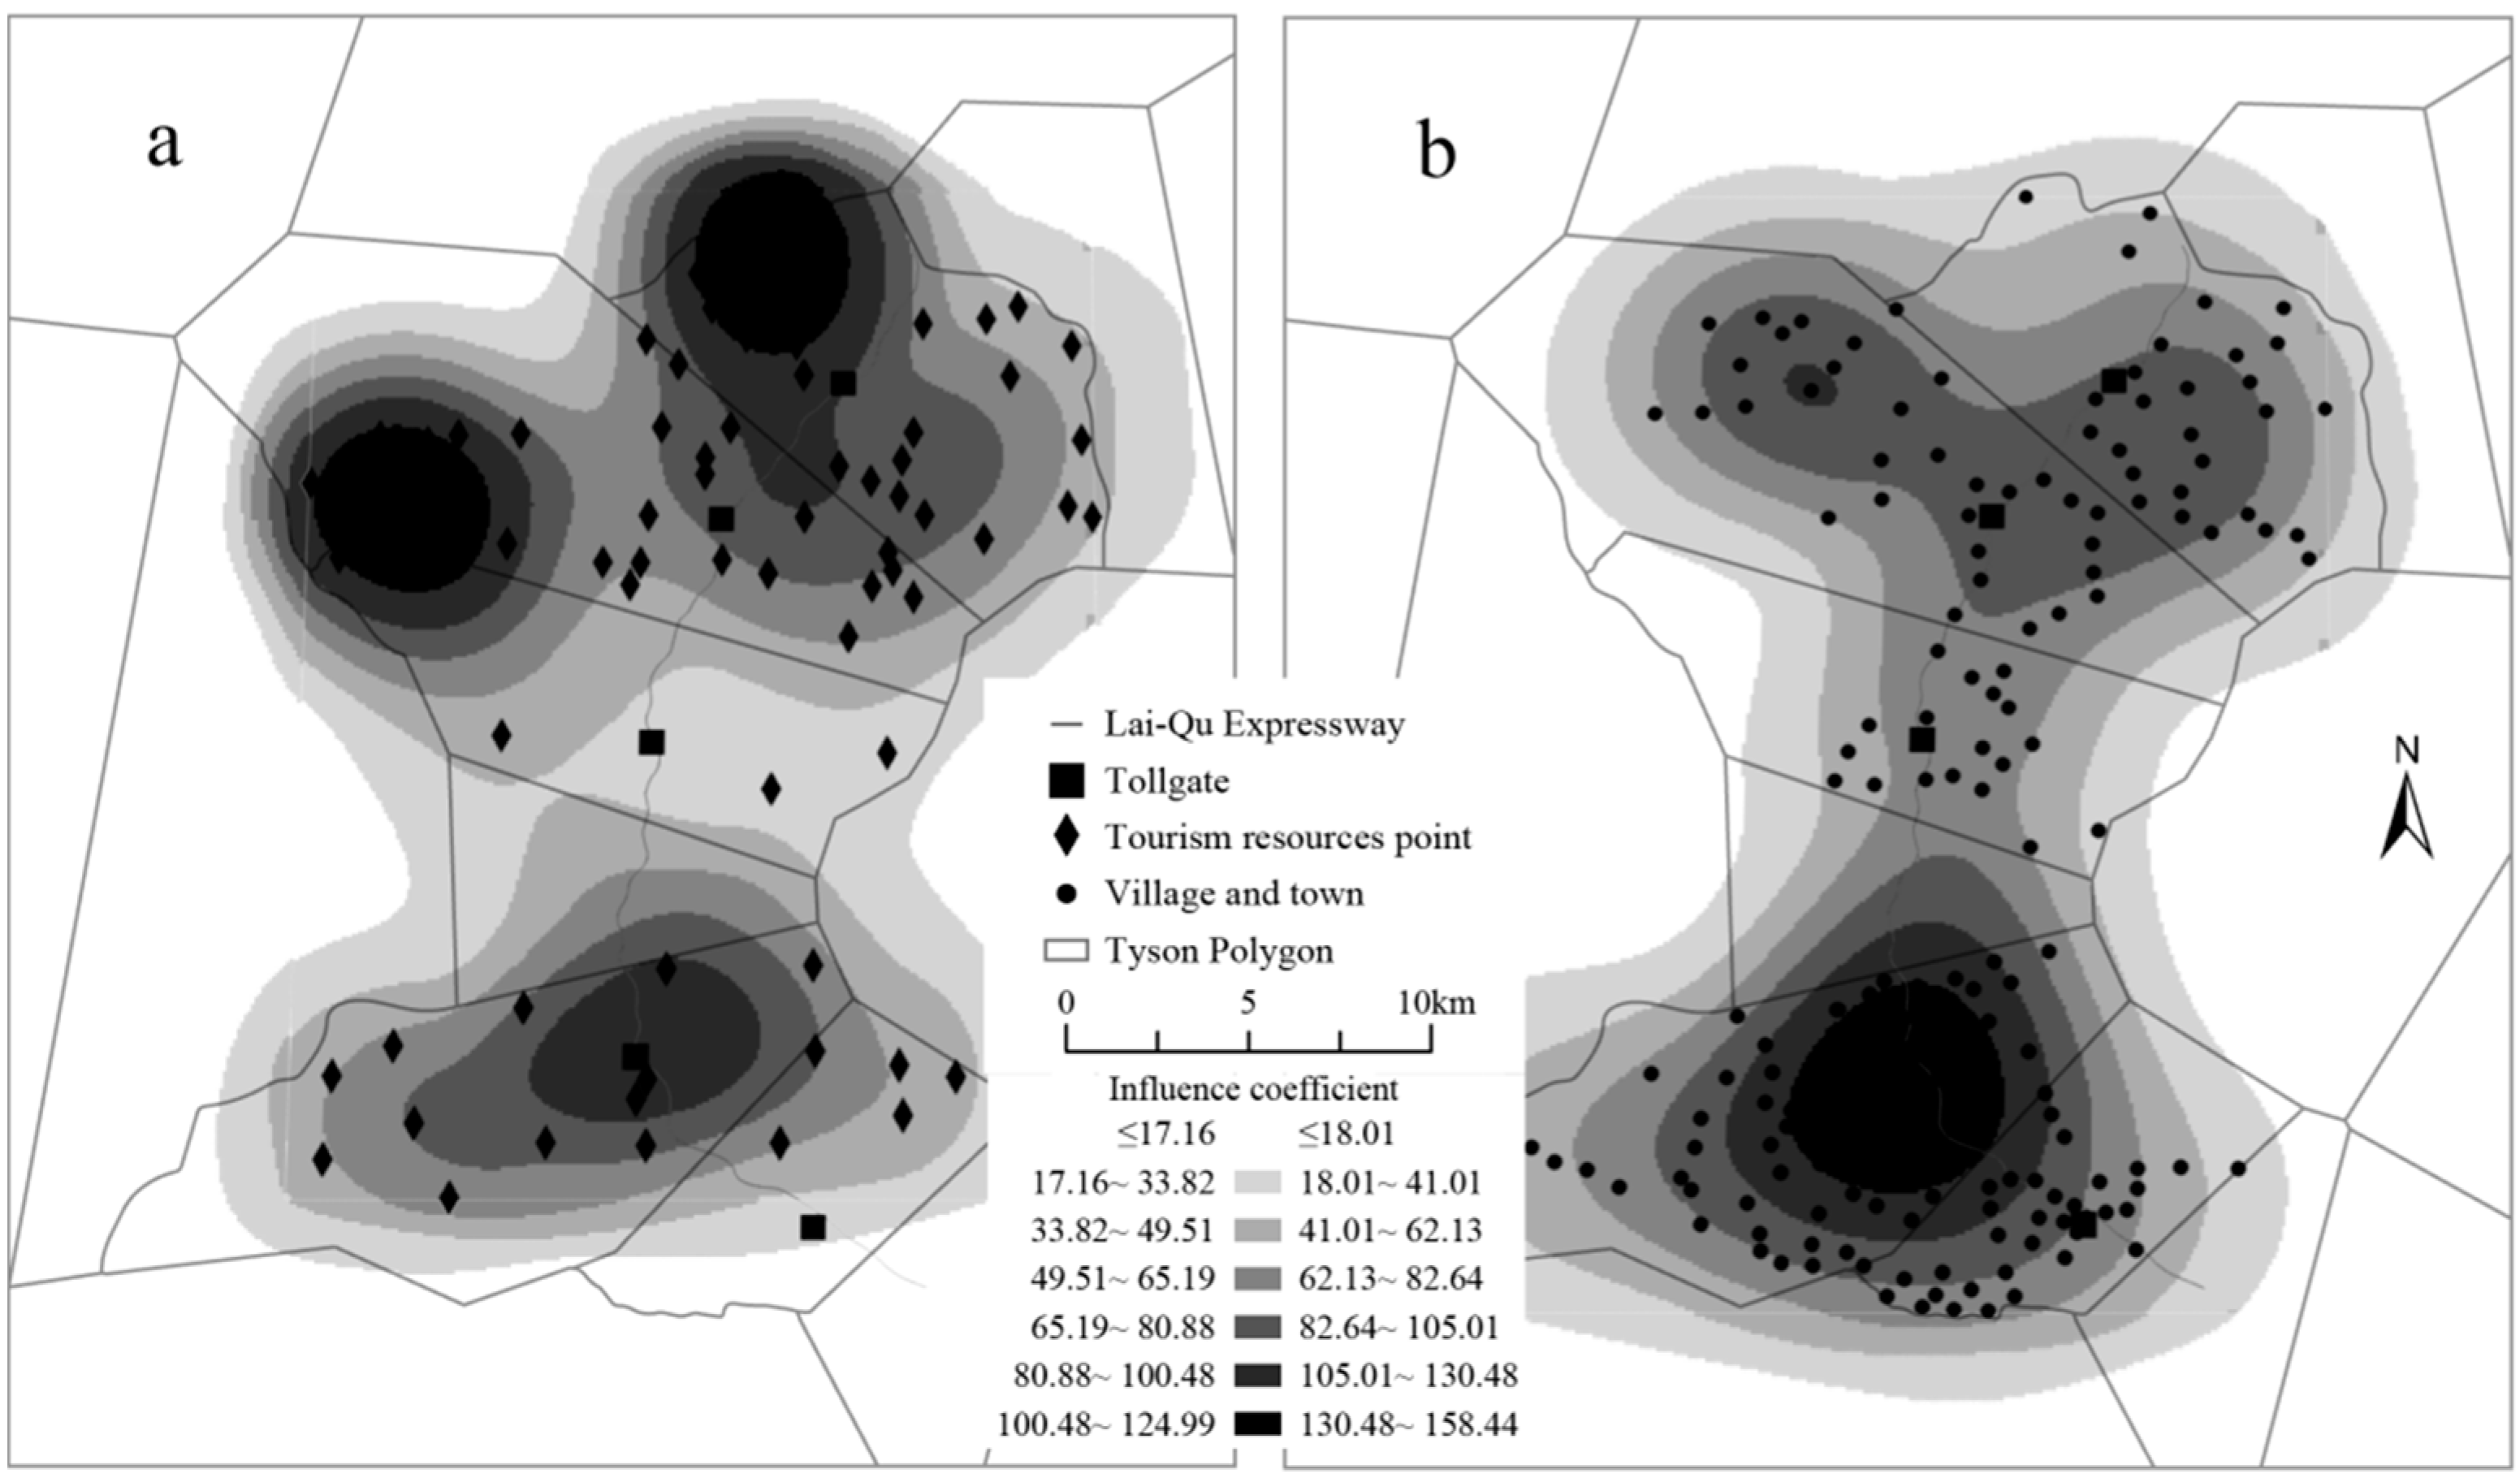
4.3.3. The Interactive Characteristics of Traffic–Tourism Space

The above analysis shows that the interaction between transport–tourism space is mainly reflected in the extension of the influence space of rapid transportation in this region after the completion and opening of the Lai-Qu Expressway, which not only provides more opportunities and possibilities for regional tourism development, but also affects the spatial agglomeration of regional tourism resources. In the regression results of β 1 β 6 , the grade of the tourist resource points ( β 1 ) and number of residential areas ( β 5 ) have important effects on the traffic flow of each tollgate along the Lai-Qu Expressway. The regression results are rasterized, and the raster output image size is set to 1.70; then, the fuzzy density calculation method is used to calculate and analyze the regression results of β 1 β 6 , respectively, and the spatial interaction map of transportation–tourism and transportation–residential areas are obtained (Figure 5); and the distance decay curves of the influence spatial range of each tollgates are also obtained (Figure 6).
It can be seen from the figure that the Lai-Qu Expressway provides opportunities and possibilities for the formation of two tourism resource clustering centers in the northern section and one tourism resource clustering sub-center in the southern section (Figure 5a). It also provides opportunities and possibilities for the formation of one residential area clustering sub-center in the northern section and one in the southern section (Figure 5b). In terms of regional development, the transportation–tourism interaction is obvious in the northern section, and the completion and opening of the Lai-Qu Expressway provides the possibility for the development of regional tourism and the construction of regional tourism destinations. The transportation–residential interaction is obvious in the southern section, and the completion and opening of the Lai-Qu Expressway improves the traffic location of regional economic and social development along the expressway. The whole expressway effectively links the tourist resource points in the northern section and the residential areas in the southern section, creating conditions for close tourism travel, and optimizing the route selection for linking with the tourism source market in central and southern Hebei Province. In terms of spatial impact characteristics, the spatial impact of each tollgate attenuates differently with distance (Figure 6). The northern section of the Lai-Qu Expressway mainly slows down its distance attenuation effect due to the existence of a large number of tourism resource points, and the influence range of the Lai-Qu Expressway is extended due to the traffic–tourism interaction (Figure 6a). The southern section of the Lai-Qu Expressway mainly slows down its distance attenuation effect due to the agglomeration of a large number of residential areas, and the interaction between traffic and residential areas extends the influence range of the Lai-Qu Expressway (Figure 6b).

5. Conclusions and Discussion

The findings of the study are as follows:
(1)
The influence space of high-speed transportation extends along with the newly built expressway, and realizes the spatial interaction between transportation and tourism in the process of overlapping of the transportation-affected space and regional tourism space, which provides new opportunities and possibilities for regional tourism, and will also promote the change in the regional tourism spatial pattern and agglomeration form of tourism resources.
(2)
The peak–valley value data of the Baishishan Tollgate traffic flow and Baishishan Scenic Spot tourist flow almost simultaneously show that they are directly correlated. The GWR results of tourism resource points show that the grade of tourism resource points ( β 1 ) has the greatest impact and the strongest significance on the traffic flow of the Lai-Qu Expressway. In the interaction between the traffic and tourism space, it is shown that the northern section of the Lai-Qu Expressway is expected to form a high-grade and high-density tourism resource agglomeration area.
(3)
The traffic flow of the Lai-Qu Expressway has the strongest correlation with the number of residential areas ( β 5 ). The results of the GWR of residential areas show that the number of residential areas ( β 5 ) has the greatest impact on the traffic flow at each tollgate of the Lai-Qu Expressway, but the most significant explanatory variable is the distance between settlements and the nearest tollgate ( β 4 ); that is, the impact of residential areas on the traffic flow of the Lai-Qu Expressway is obviously attenuating with distance, which is most typical in the Lingshannan Tollgate.
(4)
The interaction map of the transportation–tourism space of the Lai-Qu Expressway is calculated by the fuzzy density calculation method and the GWR results shows that it is expected to form a spatial pattern of two tourism resource cluster centers and one sub-center, and one residential cluster center and one sub-center under the influence of the Lai-Qu Expressway. The distance attenuation curve shows that the tollgates in the northern section of the Lai-Qu Expressway are associated with a large number of tourism resource points, and the transportation–tourism spatial interaction extends the spatial impact of the Lai-Qu Expressway. A large number of residential areas associated with the southern section of the Lai-Qu Expressway slows down the distance attenuation effect, and the interaction between traffic and residential areas extends the spatial influence of the Lai-Qu Expressway.
The regional tourism spatial impact of the Lai-Qu Expressway starts from the optimization of the traffic location of tourism resource points, and provides opportunities and possibilities for the development of regional tourism along the route. Based on the integration of transportation and tourism, we hold the following beliefs:
(1)
With regard to the research on the spatial interaction of transportation and tourism at a small scale and a small sample size, this paper adopts the form of eigenvalue sampling similar to that in statistics, that is, to compare and analyze the traffic flow of the Baishishan Scenic Spot and the traffic flow data of the Baishishan Tollgate, to obtain the interaction between regional transportation and tourism development. The evaluation method of the tourism efficiency and high-speed traffic coordination degree provided by Guo et al. [25] can also better reflect the regional transportation–tourism interaction and spatial interaction, but this method is not adopted in this paper. The reason is that this method is more suitable for a large-scale and multi-sample analysis, and needs the support of multiple regional development statistics. And the analytical method for the spatial interaction between transportation and tourism under small-scale spatial and limited sample conditions, as proposed in this study, demonstrates a greater suitability for county-level spatial planning and tourism policy formulation. In other words, this approach internalizes externalities such as transportation networks, regional policies, and ecological development into regional development “responses” [26]. The findings offer practical cases for enhancing transportation networks and optimizing regional spatial development.
(2)
With regard to the positioning of residential areas in the study of the transportation–tourism spatial interaction and the development of regional tourism destinations, many achievements of the social exchange theory generally believe that communities (residential areas) play an important role in regional tourism development [19,20]. Considering the regional conflict of functional–structural space units and the dynamic space–time evolution of the “production–ecological” space in territorial spatial planning, the boundary between scenic spots and communities in areas where tourism resources are concentrated becomes more unclear. Therefore, this paper also tends to regard residential areas as the elements to be considered in regional tourism development under the guidance of social exchange theory. Residential areas can serve regional tourism development from the aspects of characteristic dwellings, labor force, infrastructure construction, and so on. Simultaneously, the regional development role of the Lai-Qu Expressway is “optional” rather than “alternative”. Under the framework of the social exchange theory, this perspective integrates external factors (including transportation network integrity and policy coordination between tourism and ecological development) into a comprehensive regional development framework. This integration enables a holistic analysis of the expressway’s regional impacts, making the methodology better suited to small-scale spatial contexts for transportation planning and evaluation, as well as tourism strategy development.
(3)
With regard to the construction of tourism resource agglomeration areas and regional tourism destinations, with the opening up of newly built highways and the continuous effect on regional tourism development, the status quo of the “isolated island” development and integrated development of low-concentration industries will be broken, and replaced by the organic series of scattered tourism resources, the contiguous development of tourism resources along highways, and the development of cross-administrative region boundaries. For example, in the research results of this paper, the northern section of the Lai-Qu Expressway may form two tourism resource agglomeration centers. Gao et al. [24] mentioned in their research on tourism agglomeration areas in Hebei Province that the formation of agglomeration areas needs the support of traffic conditions and takes high-level scenic spots as the core attraction of agglomeration areas. As time goes on, the influence of the Lai-Qu Expressway on the development of the regional tourism industry and the spatial pattern of tourism will be more obvious.

Author Contributions

Conceptualization, L.B. and J.L.; methodology, L.B., H.Z. and Q.Z.; software, Y.G.; validation, S.L. and Q.Z.; formal analysis, H.Y.; investigation, J.L.; resources, S.L., J.C. and Q.Z.; data curation, Y.G., L.B. and J.C.; writing—original draft, L.B.; writing—review and editing, Y.G. and Q.Z.; supervision, H.Z. and H.Y.; project administration, L.B.; funding acquisition, Y.G. All authors have read and agreed to the published version of the manuscript.

Funding

This research was funded by the Key Science and Technology Projects in the Transportation Industry (grant number: 2020-MS4-113); and the National Natural Science Foundation of China (grant number: U23A2007).

Data Availability Statement

The original contributions presented in the study are included in the article, further inquiries can be directed to the corresponding authors.

Conflicts of Interest

The authors declare no conflicts of interest.

References

  1. Van, N.; Shimizu, T. The effect of transportation on tourism promotion: Literature review on application of the Computable General Equilibrium (CGE) Model. Transp. Res. Procedia 2017, 25, 3096–3115. [Google Scholar]
  2. Palhares, L. The role of transport in tourism development: Nodal functions and management practices. Int. J. Tour. Res. 2003, 5, 403–407. [Google Scholar] [CrossRef]
  3. Huang, T.; Xi, J.; Ge, Q. Spatial differentiation and integration optimization of an urban agglomeration tourism system under the influence of high-speed railway network evolution. Appl. Spat. Anal. Policy 2019, 12, 349–376. [Google Scholar] [CrossRef]
  4. Fisher, M.; Wood, A.; Roh, H.; Kim, C.K. The geographic spread and preferences of tourists revealed by user-generated information on Jeju Island, South Korea. Land 2019, 8, 73. [Google Scholar] [CrossRef]
  5. Park, B.; Nunkoo, R.; Yoon, Y.S. Rural residents’ attitudes to tourism and the moderating effects of social capital. Tour. Geogr. 2015, 17, 112–133. [Google Scholar] [CrossRef]
  6. Nunkoo, R.; Ramkissoon, H. Developing a community support model for tourism. Ann. Tour. Res. 2011, 38, 964–988. [Google Scholar] [CrossRef]
  7. Kanwal, S.; Rasheed, I.; Pitafi, H.; Pitafi, A.; Ren, M. Road and transport infrastructure development and community support for tourism: The role of perceived benefits, and community satisfaction. Tour. Manag. 2020, 77, 104014. [Google Scholar] [CrossRef]
  8. Novianti, S.; Fauzi, C.; Suhartanto, D. Spatial analysis of tourist dispersal and mobility for tourism destination planning and development: A case study of great ocean road region, Australia. IOP Conf. Ser. Mater. Sci. Eng. 2020, 830, 032081. [Google Scholar] [CrossRef]
  9. Best, K. Highways and Lifeways: Highway 11 and the Shaping of the Ways of Life and Senses of Place of Nature-Based Tourism Operators in South-Central Almaguin, Ontario, Canada; University of Northern British Columbia: Prince George, BC, Canada, 2016. [Google Scholar]
  10. Ishikura, T.; Yoshikawa, H.; Yokoyama, F. Spatial economic impacts of ring road highway development in Greater Tokyo Area. In Proceedings of the 22nd Annual Conference on Global Economic Analysis, Warsaw, Poland, 19–20 June 2019; pp. 1–16. [Google Scholar]
  11. Lee, J. Conflict mapping toward ecotourism facility foundation using spatial Q methodology. Tour. Manag. 2019, 72, 69–77. [Google Scholar] [CrossRef]
  12. Lin, R.; Chen, K. Design and Research of Traffic-Tourism Integration Service System Based on Scenario Theory. In International Conference on Green Intelligent Transportation System and Safety; Springer Nature: Singapore, 2022; pp. 539–548. [Google Scholar]
  13. Feng, B. Coupling and coordinated development of traffic accessibility and regional tourism economy. Res. Transp. Bus. Manag. 2023, 49, 101010. [Google Scholar] [CrossRef]
  14. Ravazzoli, E.; Streifeneder, T.; Cavallaro, F. The effects of the planned high-speed rail system on travel times and spatial development in the European Alps. Mt. Res. Dev. 2017, 37, 131–140. [Google Scholar] [CrossRef]
  15. Bai, L.; Lu, Z.; Gao, Y.; Gao, W. Study on Spatial Pattern of Regional Tourism under Influence of High-Speed Tourism Corridor: Case Study of Taihang Mountain Expressway. J. Highw. Transp. Res. Dev. 2021, 15, 102–110. [Google Scholar] [CrossRef]
  16. Masson, S.; Petiot, R. Can the high speed rail reinforce tourism attractiveness? The case of the high speed rail between Perpignan (France) and Barcelona (Spain). Technovation 2009, 29, 611–617. [Google Scholar] [CrossRef]
  17. Ali, L.; Mi, J.; Shah, M.; Khan, A.; Imran, M. Transport culture akin to the China-Pakistan economic corridor. Hum. Syst. Manag. 2017, 36, 381–396. [Google Scholar] [CrossRef]
  18. Sun, F.; Jia, Y. Influence factors of residents’ political trust from perception of tourism community residents: Based on explanation of social exchange theory. J. Beijing Inst. Technol. (Soc. Sci. Ed.) 2020, 22, 90–99. (In Chinese) [Google Scholar]
  19. Gursoy, D.; Chi, G.; Dyer, P. Locals’ attitudes toward mass and alternative tourism: The case of Sunshine Coast, Australia. J. Travel Res. 2010, 49, 381–394. [Google Scholar] [CrossRef]
  20. Kanwal, S.; Pitafi, H.; Rasheed, I.; Pitafi, A.; Iqbal, J. Assessment of residents’ perceptions and support toward development projects: A study of the China-Pakistan Economic Corridor. Soc. Sci. J. 2022, 59, 102–118. [Google Scholar] [CrossRef]
  21. Brunsdon, C.; Fotheringham, S.; Charlton, M. Geographically weighted regression. J. R. Stat. Soc. 1998, 47, 431–443. [Google Scholar] [CrossRef]
  22. Yu, H.; Wang, Q.; Zhang, B.; Liu, J. Driving mechanism and the spatial differentiation of coupling coordinated development of tourism supply and demand in China. Sci. Geogr. Sin. 2020, 40, 1889–1898. (In Chinese) [Google Scholar]
  23. Napitupulu, D.; Rahmaitria, F.; Rosita, R. The Effect of tourism accessibility perception towards tourists visiting intention to Toba lake in samosir district. J. Indones. Tour. Hosp. Recreat. 2021, 4, 39–52. [Google Scholar] [CrossRef]
  24. Gao, W.; Zhang, Q.; Lu, Z.; Wu, D.; Du, X. Modelling and application of fuzzy adaptive minimum spanning tree in tourism agglomeration area division. Knowl.-Based Syst. 2018, 143, 317–326. [Google Scholar] [CrossRef]
  25. Guo, X.; Mu, X.; Ding, Z.; Ming, Q. The coordination pattern of tourism efficiency and high-speed transportation: A case study of 41 cities in the Yangtze River Delta. Geogr. Res. 2021, 40, 1042–1063. (In Chinese) [Google Scholar]
  26. Du, X.; Li, Z.; Bai, L.; Pan, L. Navigating sustainable development: Empirical analysis of corporate social responsibility, eco-friendly production, and stakeholder green commitment through the lens of stakeholder theory. Sustain. Dev. 2024, 32, 4250–4260. [Google Scholar] [CrossRef]
Figure 1. The influence areas before adjustment (a) and after adjustment (b) of each tollgate along Lai-Qu Expressway based on Tyson polygon law.
Land 14 01197 g001
Figure 2. Comparison of traffic flow data of Lai-Qu Expressway and visitors of Baishishan Scenic Spot in 2019.
Land 14 01197 g002
Figure 3. Spatial characteristics of the impacts of tourism resource point level, number, and distance to the nearest tollgate on the traffic flow of Lai-Qu Expressway.
Land 14 01197 g003
Figure 4. Spatial characteristics of the impact of the distance to the nearest tollgate, the number of residential points, and the number of residents on the traffic flow of Lai-Qu Expressway.
Land 14 01197 g004
Figure 5. The spatial interaction map of traffic–tourism (a) and traffic–residential points (b) on Lai-Qu Expressway.
Land 14 01197 g005
Figure 6. The distance attenuation curve of each tollgate along Lai-Qu Expressway under the interaction of traffic–tourism (a) and traffic–residential points (b).
Land 14 01197 g006
Table 1. Traffic flow data of Lai-Qu Expressway in 2019.
Name of TollgateTotal Annual Traffic FlowAnnual Entrance Traffic FlowAnnual Export Traffic FlowTotal Annual TollsLocation of Section PointSection Traffic Flow
Baishishan306,714116,556190,1586,549,596.79Yansuya interchange/
Chuanli171,19770,434100,7632,458,500.18Bao-Fu interchange85,062
Gubeiyue88,18428,84559,3392,340,639.21Dongwang interchange90,151
Lingshannan280,674109,371171,3032,823,291.08
Quyangbei1,536,680623,367913,31333,133,209.25
The Yansuya interchange monitoring site was completed in September 2020, so there is no statistical data in 2019.
Table 2. Overview of areas along Lai-Qu Expressway in 2019.
Name of TollgateNumber of Tourist Resource PointsNumber of VillagesNumber of Township-Level SettlementsOverview of Township-Level Settlements
The Serial NumberAreaNumber of Village CommitteesThe Registered PopulationEnterprise NumberNumber of General Stores
Baishishan29292159302533,720669
268022533,215432
Chuanli29314312,1203570,12350107
4503914988900
554001740,404022
692001412,230522
Gubeiyue6182797002323,3274527
811,8002217,204020
Lingshannan12692910,3008432809
1023,2002114,502244
Quyangbei53431115,7002019,5462650
1210,100148961322
1357231426,72035629
Table 3. Statistics of traffic flow at Baishishan Tollgate of Lai-Qu Expressway and visitors of Baishishan Scenic Area in 2019.
JanuaryFebruaryMarchAprilMayJuneJulyAugustSeptemberOctoberNovemberDecemberTotal
Baishishan Tollgate2.672.082.773.083.682.782.912.582.002.262.041.8130.67
Baishishan Scenic Area7.086.439.6716.4222.5214.0415.7214.9812.7416.258.036.38150.26
Table 4. Correlation between traffic flow data of Lai-Qu Expressway and visitors of Baishishan Scenic Spot in 2019.
abcd
a////
b0.737/0.006///
c0.312/0.3230.416/0.179//
d−0.030/0.0920.105/0.7460.860/0.000/
a: traffic flow of Baishishan Tollgate. b: tourism flow of Baishishan Scenic Spot. c: traffic flow of Bao-Fu interchange section. d: uplink traffic flow of Bao-Fu interchange section.
Table 5. Correlation between the traffic flow of Lai-Qu Expressway and statistical data of regional economic and social development.
Entrance Traffic FlowExport Traffic FlowExport Passenger CarsExport VansTotal Export ChargesExport Passenger Car ChargesExport Van Charges
Number of village committees0.769/0.1290.753/0.1410.795/0.1080.724/0.1660.715/0.1750.871/0.0550.687/0.200
The registered population0.728/0.1630.725/0.1650.897/0.0390.656/0.2290.641/0.2430.841/0.0740.609/0.276
Area−0.296/0.696−0.305/0.618−0.356/0.557−0.282/0.646−0.249/0.687−0.310/0.612−0.238/0.700
Number of enterprises−0.141/0.696−0.238/0.7000.056/0.929−0.326/0.593−0.333/0.585−0.090/0.886−0.361/0.551
Number of general stores0.563/0.3230.557/0.3290.788/0.1130.472/0.4220.466/0.4290.720/0.1700.428/0.472
Disclaimer/Publisher’s Note: The statements, opinions and data contained in all publications are solely those of the individual author(s) and contributor(s) and not of MDPI and/or the editor(s). MDPI and/or the editor(s) disclaim responsibility for any injury to people or property resulting from any ideas, methods, instructions or products referred to in the content.

