Abstract
The coordinated improvement of urban land green use efficiency (ULGUE) requires an in-depth exploration of its spatial correlation network characteristics and impacts. However, the existing studies on the matter have not yet formed a unified evaluation index system, ignoring energy inputs and positive ecological outputs, and the spatial correlation analysis is limited to geographic proximity rather than revealing the characteristics of the network structure. Therefore, taking 283 Chinese cities as the research object, this investigation constructs an evaluation index system for ULGUE, based on its core attributes. It then examines the spatial correlation network structure and impact by conducting social network analysis and applying Pearson’s correlation coefficients. The results reveal the following: (1) Between 2003 and 2020, China’s overall ULGUE trended upward in stages, with reduced disparities among cities and a significant geospatial clustering phenomenon. (2) The spatial correlation network of China’s ULGUE increased gradually, transforming from a unipolar-dominant to a multi-core-led network structure centered around Beijing, Shanghai, Wuhan, and Chongqing. Moreover, the overall balanced development of ULGUE in eastern, central, and western China was strengthened. (3) The spatial equilibrium of the ULGUE was impeded by a more efficient hierarchical structure of the network, while improved degree centrality, betweenness centrality, and closeness centrality had significant positive impacts on the ULGUE. These findings can serve as a theoretical reference for strengthening the coordinated improvement of ULGUE in China, offering significant insights for other developing nations that are seeking to make similar improvements.
1. Introduction
Urban land is an important framework that supports production, living, and ecological activities. The key to resolving the conflict between people and land is increasing urban land use efficiency. Currently, over 55% of the global population lives in urban areas, and this figure is expected to exceed 68% by 2025 [1]. However, rapid population growth combined with limited land resources will lead to inefficient land use, increased environmental pollution, and population urbanization lags, exacerbating the conflict between land and people. This outcome, in turn, will hamper the healthy and sustainable development of urbanization, which will become an increasingly serious global crisis [2]. As part of its Sustainable Development Goals, the United Nations has proposed building inclusive, healthy, safe, and sustainable cities and communities [3]. In this context, green development has become a strategic approach to urban development, making the promotion of the green utilization of urban land a crucial concern [4]. Enhancing the green utilization of urban land is key to resolving the conflict between limited land resources and the growing demand for land. Under the dual constraints of resources and the environment, the green utilization of land represents a new development model for realizing sustainable urban land use, one that prioritizes the coordinated integration of resource, socioeconomic, and ecological systems. Therefore, improving urban land green use efficiency (ULGUE) is key to promoting the healthy and sustainable development of future cities [5]. For developing countries, urbanization entails entering a period of rapid development, during which inefficient land development, environmental pollution, and green space reduction become increasingly problematic. Accordingly, improving ULGUE and achieving a synergy between the high-efficiency development of urban land use and ecological protection are urgent tasks that developing countries must address to promote green urbanization.
ULGUE is a key indicator for evaluating urban land use, with a focus on maximizing economic value, while minimizing resource utilization and the environmental impacts [6,7]. Traditional measures of urban land use efficiency denote the relationship between land inputs and economic outputs, focusing on the harmonization of these two variables, but disregarding the link between land inputs and environmental outputs [8]. With the emergence of ecological civilization construction, green development has gained popularity on a global scale in recent years [9,10]. The eco-environmental benefits and undesired outputs of urban land use efficiency have been merged to form an evaluation index system, spurring the development of ULGUE studies, including its research objects, scale, and methods [6,11,12]. First, ULGUE studies focus on the green utilization efficiency (GUE) of different land types, including construction and industrial land [13,14]. Second, ULGUE research has evolved from the meso–macro scale, covering watersheds and provinces, to the micro scale, encompassing municipalities and counties [15,16,17]. Third, this type of research is mainly divided into three categories: indicator evaluations, parametric methods, and non-parametric methods. Researchers have mostly used a single indicator to assess land use efficiency. Although it is a straightforward, efficient method, using a single indicator cannot capture the efficiency relationships between multiple inputs and outputs in regard to urban land use. This limitation led to the development of multi-factor evaluation methods. The stochastic frontier approach is representative of parametric methods that require the setting of a specific production function, which may result in systematic errors [18,19]. In contrast, owing to advancements in green development and research methodologies and technologies, the parametric method, represented by the DEA model, has gradually become the mainstream method for measuring ULGUE. The parametric approach can determine the weights of multiple inputs through optimization, avoid human subjective factors, and more objectively assess decision-making units with multiple input and output (including non-expected outputs) indicators [20,21,22].
In terms of content, research on ULGUE focuses on two aspects: (1) the spatiotemporal characteristics and convergence of ULGUE, and (2) the factors influencing ULGUE. First, employing methods such as the Terre index, spatial autocorrelation models, trend surface analysis, and kernel density analysis, scholars discovered that ULGUE has a “space club” convergence phenomenon [10,11]. Second, numerous scholars have extensively investigated the impact of various factors on ULGUE, including the industrial structure, technological innovation capacity, urbanization level, human capital, and external dependences [11,16,23]. Through the use of spatial measurement techniques, researchers have further explored the spatial distribution, convergence, and spillover of ULGUE, demonstrating that ULGUE has spatial effects at the geographic scale of neighborhoods [4,24,25].
The above findings illustrate the progress made in ULGUE research, serving as a reference and as guidance for improving land use efficiency. However, existing research is limited by the selection of indicators and the content used for the ULGUE evaluation. Regarding index selection, as no unified input–output index system has been developed, different indicator selections lead to inconsistent research results. The majority of studies consider only land, labor, and capital inputs in regard to urban land use, while disregarding the input of energy, the operation of various urban economic activities, and both the desired and undesired outputs of urban land use, all of which should be included in the input index system. In addition, in terms of the ecological environment in regard to urban land use, most studies consider only the negative ecological outputs and ignore the positive ecological outputs. These positive outputs are a critical factor affecting the urban ecological environment and should be accounted for as desired outputs in the process of land use. Regarding the research content, while some studies have acknowledged the spatial effects of ULGUE and several analyses have been conducted, shortcomings remain. One, an existing piece of spatial research only considers the geographical adjacency or adjacency effects between two regions, making it difficult to comprehend the spatial correlation characteristics of ULGUE at the overall regional level. Two, since related research is based on attribute data rather than relational data, the results are not representative of the network structure characteristics of the ULGUE spatial correlation, which are essential aspects of spatial correlation studies. As regional coordinated development strategies have expanded, population growth and the flow of technology and resources within regions have accelerated, improving the spatial correlation of socioeconomic development among provinces and cities. During this process, the spatial impact of urban land use has breached the traditional limitations of geographic proximity, revealing the characteristics of spatial networks [26,27]. Hence, geographic proximity is no longer a hindrance to the spatial correlation of ULGUE, as improvements in information and transportation networks now enable the formation of more complex spatial correlation networks across regions.
Drawing on relational data and a network perspective, this study takes 283 Chinese cities as research objects and designs an evaluation index system for ULGUE in regard to the three dimensions of economy, society, and ecology, by defining the connotations of ULGUE. We use the global parametric super-efficiency SBM model to measure the ULGUE from 2003 to 2020. We also apply social network analysis and Pearson’s correlation coefficients to investigate the spatial correlation network structure of ULGUE and its impact, providing scientific insights for the coordinated improvement of ULGUE and the promotion of healthy, sustainable development. Compared with existing research on ULGUE, the marginal contributions of this study are as follows: (1) clarifying the concept of ULGUE within the framework of ecological civilization construction and the “two mountains” theory, thus improving the evaluation index system for ULGUE; and (2) investigating the characteristics of the spatial correlation network of ULGUE and its impact from a relational data and network perspective, thereby providing a novel perspective for its synergistic improvement.
2. Theoretical Analysis
2.1. The Context of ULGUE
The concept of green development was first introduced by Rachel Carson in her book Silent Spring (1962). In 1990, the term “green utilization efficiency” (GUE), also known as “ecological efficiency”, was first extended from ecology to the social sciences by the German scholars, Schaltegger and Sturm. They defined it as the ratio of the value generated by the resource input to the environmental impact produced [28]. In 1992, the World Business Council for Sustainable Development (WBCSD) further expanded this concept by proposing that resource consumption should both satisfy the basic needs of society and ensure that the ecological impacts remain within the earth’s environmental carrying capacity [29]. By considering both socioeconomic development and resource and environmental protection, this expanded definition effectively solves the problem of quantifying both aspects on the same level, and has since been further extended and applied by various organizations and scholars in different fields. For example, the European Environment Agency (EEA) defines GUE as the creation of the maximum social welfare value with minimum natural inputs to meet diverse human needs [30]. Meanwhile, for the World Bank (WB), green use is an environmentally friendly approach to economic growth that aims to achieve the efficient use of natural resources to minimize emissions [31]. For Lu et al. (2020), the GUE of resources should include three dimensions: (1) economic, namely to optimize the economic benefits; (2) social, namely to elevate living standards and maintain social security and stability; and (3) ecological, namely to minimize environmental and ecosystem damage [32]. In summary, the above definitions illustrate that the core idea of GUE is the same, that is, maximizing the welfare value per unit of resource inputs, while minimizing the undesired outputs. In addition, their main difference merely lies in the interpretation of welfare value. GUE or ecological efficiency seeks to coordinate the development of a composite resource–socioeconomic–ecological system, by pursuing the improvement of human welfare, while reducing resource consumption and environmental losses.
As a platform for urban production, living, and ecological spaces, urban land is utilized to maximize the welfare derived from each unit of production invested in the area, while minimizing eco-environmental losses. Its core objective is to integrate the “Golden Mountain” (economic development) and the “Green Mountain” (the ecological environment) into the urban land use system and balance the relationship between land inputs and outputs, resource consumption, and environmental protection. Urban land green use is a new development model established under resource and environmental constraints to achieve sustainable urban land use. ULGUE is a practical indicator of urban land use within the context of green development. On this basis, the present study defines ULGUE as the degree to which economic, social, and ecological environmental benefits created by production activities are maximized through multiple resource inputs in regard to urban land use under production technology conditions. In particular, it is the degree to which the desired outputs (e.g., economic, social, ecological benefits) can be maximized, while the undesired outputs (e.g., industrial wastewater, industrial sulfur dioxide, industrial dust) can be minimized through the input of production factors, such as land, capital, labor, and energy. The goal of ULGUE is the coordinated development of a composite resource–socioeconomic–ecological system (Figure 1).
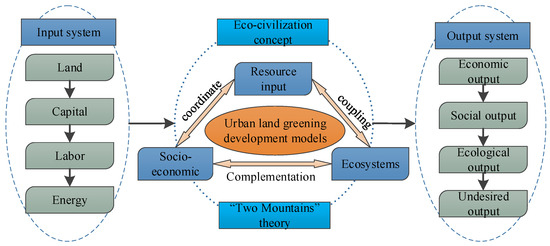
Figure 1.
Three dimensions of the connotations of green land use efficiency of urban land.
2.2. Mechanism of Spatial Association Network Formation of ULGUE
Spatial interaction theory is one of the key theoretical foundations for the formation of spatial association networks. Ulman [33] defines spatial interactions as dynamic flows of elements within a spatial context under specific preconditions (i.e., the existence of complementarities, accessibility, and opportunities for intermediation). As a non-mobile resource, the permanence and scarceness of urban land enable the spatial flow of factors, because such resources are used at varying rates during the relevant processes. Configuration theory suggests that improved transportation infrastructure and high-speed networks continuously reduce the distance between geographic regions. This not only strengthens industrial cooperation between regions, but also accelerates the flow of production factors between cities, improving the interaction effects among these factors [34]. Upgrading transportation and information networks between cities can contribute to the easy accessibility and exchange of various resources, such as capital, technology, and labor. Under the current “3 + 2 + 1” major regional strategies, the level of cooperation and exchange among local governments has increased, promoting the cross-regional flow of various factors. In regard to spatial interactions, core node cities often possess superior resources and technologies. Through industrial transfer and technology diffusion, these cities can drive adjacent cities to upgrade their industrial structure, pursue green transformation, and ultimately improve their ULGUE.
Second, the peer effect among local governments forms a theoretical foundation for the spatial correlation network. The peer effect refers to a social endogenous interaction in which the behavioral decision making of individuals within the same group is influenced by others in the same group; in other words, individual decision making is not completely independent, but is influenced by group dynamics [35,36]. In regard to urban land development and usage, urban land, as a special platform for social production, is a key input in urban social and economic development and the basic carrier of other production factors. Therefore, as dominant players, local governments, driven by the peer effect, inevitably compete with and emulate neighboring governments in regard to their urban land development and usage. Through continuous interactions, they optimize their individual land development and utilization strategies, forming a spatial correlation network for urban land development and usage. However, the tendency of social network structure characteristics toward blind imitation in regard to decision making, even when aimed at the coordinated improvement of regional land GUE, can also lead to negative outcomes. For instance, Xu et al. [37] revealed the interactive behavior of environmental regulations among 283 Chinese cities, from 2003 to 2019, using a spatial autoregressive model. Their results show that the internal learning effects associated with officials’ performance and promotion practices among local environmental regulations diminished the peer effect of environmental regulations, whereas external learning effects and competition mechanisms had the opposite impact. Third, synergistic governance offers macro-level guidance for building spatially linked networks in regard to urban land development and usage [38].
From a humanist perspective, urban ecological civilization and coordinated urban green development highlight the relative balance and collective enhancement achieved among different regions. Synergistic governance between governments can leverage the different roles of various urban land use stakeholders, compensate for market allocation failures, manage the negative externalities of land development and utilization, weaken institutional barriers and local protectionism, and maximize the overall benefits of urban land development and usage, by promoting positive intermunicipal mutual feedback. Such coordinated governance helps raise regional environmental quality, stimulate green synergies in land use among cities, and enhance the overall GUE.
Basically, the spatial correlation network of ULGUE comprises the distribution of factors influenced by external forces (e.g., peer effects, collaborative governance). This distribution occurs between liquidity factor resources, such as capital and labor, and non-liquidity factor resources, such as land. As a result, spatial differences in land GUE emerge and are transmitted between regions, finally forming a complex organization that combines points, lines, and surfaces (Figure 2).
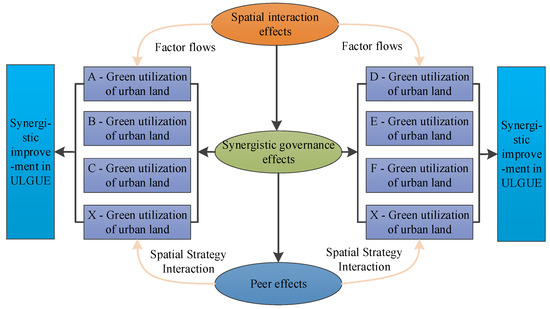
Figure 2.
Mechanism of spatial correlation network formation for the green utilization of urban land.
3. Methods and Data Sources
3.1. Overview of the Study Area
Since the 1980s, China has become one of the fastest urbanizing nations in the world and the largest developing country [22,39]. However, this rapid growth has resulted in uncoordinated regional development, inefficient land use and development, and environmental pollution [40,41]. Thus, China is currently tackling the challenge of maximizing ULGUE to achieve healthy and sustainable urban development. Owing to the completeness and availability of data, this study takes 283 Chinese cities at the prefecture level and above as the research objects. Based on the geographic regions and economic conditions of these cities, we divide them into four major economic zones: east, central, west, and northeast (Figure 3).
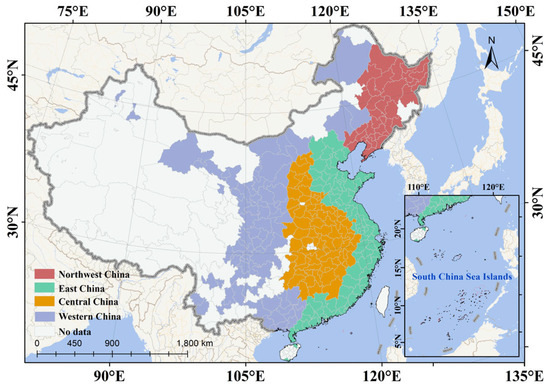
Figure 3.
Study area.
3.2. Methods
3.2.1. Global Parametric Super-Efficient SBM Modeling
In this study, we measure ULGUE by building a global parametric super-efficiency SBM model, based on undesired outputs. The model achieves two advantages: it solves the efficiency measurement bias caused by the slack variable problem in terms of inputs and outputs, and it addresses the inability of the traditional DEA efficiency measurement model to carry out inter-period comparisons of various efficiency levels [42]. The model is expressed as follows:
where is the number of decision-making units, with each decision-making unit consisting of inputs , desired outputs , and non-desired outputs ; , , and are elements in the corresponding input, desired output, and non-desired output matrices, respectively; and is the value of the ULGUE.
3.2.2. Non-Parametric Kernel Density Estimation
Kernel density estimation is a non-parametric method that can be used to describe the distribution pattern and evolutionary characteristics of ULGUE, using continuous density curves, without the need for parametric modeling assumptions [43]. Its calculation formula is:
where is the sample size, is the bandwidth, represents the value of the ULGUE, denotes the mean of the observations, and is the kernel function.
3.2.3. Spatial Correlation Network Analysis
- (1)
- Modified gravity model
Social network analysis is based on the development of a spatial association network matrix. Analyzing the spatial correlation network structure of the ULGUE in China requires a matrix to be constructed first. This study uses the gravity model to construct the spatial correlation relationships in terms of the ULGUE and introduces the GDP per capita to measure the combined effects of the economic and geographic distance on these relationships [44]. On the basis of the formation mechanism of the ULGUE correlation network, we introduce the proportion of urban land factor inputs relative to the sum of the land factor inputs of a pair of correlated cities as a moderating factor to adjust the gravity coefficient. The specific expression of the modified gravity model is denoted as follows:
where represents the degree of spatial correlation of the ULGUE between cities i and j; and denote the land GUE of cities i and j, respectively; and represent the total population of cities i and j, respectively; is the economic distance between cities i and j; is the spherical distance between cities i and j, obtained using QGIS; and are the per capita GDP of cities i and j, respectively; is the moderating factor, representing the contribution of city i to the spatial correlation of the ULGUE between cities i and j; and and are the land factor inputs for cities i and j, respectively.
- (2)
- Social Network Analysis
In social network analysis, the relationship is taken as the basic unit of analysis. As an interdisciplinary method for analyzing relational data, it has been widely used in many fields [45,46,47]. After obtaining the spatial correlation matrix of ULGUE, this study performs social network analysis to depict the spatial correlation network structure characteristics of the ULGUE in China in terms of its individual and overall network structure characteristics.
- (1)
- Overall network characterization index
The overall network characteristics can be characterized by their density, relevance, hierarchy, and efficiency. In this study, we investigate the overall network structure of the ULGUE association, using the following calculation formula:
where D, C, H, and E denote the density, relevance, hierarchy, and efficiency of the network, respectively; is the number of cities in the network; is the number of actual connections in the network; and are the numbers of unreachable and reachable pairs in the network, respectively; is the maximum number of symmetrically reachable pairs that may be in the network; is the number of redundant connections in the network; and is the maximum possible number of redundant connections.
- (2)
- Individual network characterization index
The individual network characteristics can be assessed using the degree centrality, closeness centrality, and betweenness centrality. To analyze the centrality of the ULGUE correlation network, this study applies the calculation formula shown below:
where , , and denote the degree centrality, closeness centrality, and betweenness centrality, respectively; is the number of network members that a member is associated with; and is the closest distance between cities i and j. Moreover, is the ability of city i to control spatial associations between cities j and k, where is the number of short paths between cities i and k, and is the number of short paths passing through city i between cities i and k, and .
3.2.4. Pearson’s Correlation Coefficient Method
Pearson’s correlation coefficient reflects the degree of correlation between two variables, where an absolute value of the coefficient close to 1 indicates a strong linear correlation between the variables [48]. This study uses this method to evaluate the correlation between the spatial correlation network structure of urban land green efficiency and the intensity and efficiency differences in terms of land GUE in China. The specific calculation formula is as follows:
where is the correlation coefficient of the two correlation degrees, within the value range of [−1, 1]; n is the sample size; and x and y represent the overall network structure characteristic index or individual structure characteristic index and ULGUE value, respectively.
3.3. Indicator System Construction and Data Sources
We combine the ULGUE definition above with the input–output characteristics of the DEA model to construct the evaluation index system for the ULGUE in regard to the dimensions of economy, society, and ecology. Drawing on existing research and the current characteristics of green urban land use in China [49,50,51], we define the input indicators of urban land use in terms of land, capital, labor, and energy. Economic, social, and ecological outputs are used to characterize the desired output indicators of urban land use, while urban industrial wastewater, industrial sulfur dioxide, and industrial soot emissions characterize the undesired output indicators. Table 1 below presents the constructed indicator system.

Table 1.
Evaluation index system for ULGUE.
The data required for this study are the ULGUE input and output, total urban population, and per capita GDP for 283 Chinese cities at the prefecture level and above, from 2003 to 2020. These data are sourced mainly from the China Urban Statistical Yearbook (2004–2021), provincial and municipal statistical yearbooks (2004–2021), and special statistical reports (2004–2021). Any missing data are filled in using interpolation. As the DEA model cannot accommodate numerous output indicators, we adopt entropy weighting to eliminate the magnitude difference among the indicators and simplify the output indicators. This process helps derive composite indexes for the desired social outputs and undesired outputs. In addition, we deflate all the prices, with 2003 as the base period, to minimize the impact of the price factor, where the capital stock, with the prices deflated, is adjusted accordingly, through the use of the perpetual inventory method.
4. Results
4.1. Characterization of the Temporal and Spatial Dynamic Evolution of the ULGUE in China
4.1.1. Analysis of the Time-Series Dynamic Evolution of the ULGUE in China
Through the use of Matlab 2018a, we applied the global parametric Super-SBM model, with non-expected outputs, to assess the land GUE of 283 Chinese cities from 2003 to 2020. We, likewise, used kernel density estimation to explore the evolution of regional differences in the ULGUE over time. Figure 4 illustrates that, overall, China’s ULGUE shows a steady upward trend, from 0.14 in 2003 to 0.29 in 2020. In particular, the 2003–2016 period exhibits a slow rise, and the 2016–2019 period shows a rapid rise. However, urban efficiency is relatively low and there is considerable potential for improvement. In terms of subregions, the annual average value of the ULGUE in the four major economic zones trends progressively upward, albeit with small fluctuations, in the general order of east > west > northeast > central. The significant differences in terms of these four zones concerns resource endowment, the level of economic development, and other factors that affect the resource allocation in regard to urban land use, which, in turn, affects the level of efficiency. Additionally, there are notable geographical differences.
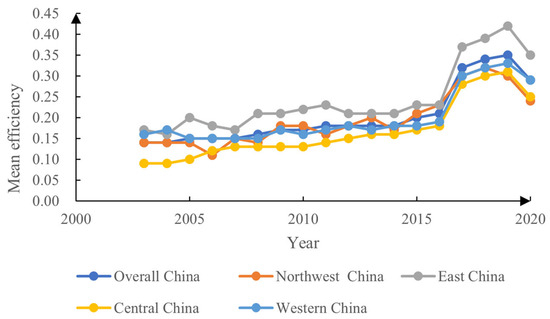
Figure 4.
Evolutionary trend of ULGUE in China (2003–2020).
Using the results of the ULGUE measurements in China from 2003 to 2020, we selected the efficiency values for 2005, 2010, 2015, and 2020 as reference points. Three-dimensional kernel density curves for the ULGUE were then plotted for China and the four major economic zones at both overall and local scales. This approach underscores the overall evolution of the ULGUE and its regional variations across China (Figure 5). First, the overall density curve for China from 2003 to 2020 displays a right–left–right–right–left–right oscillation, with the overall efficiency moving from medium–low to high efficiency. The curve shows a “single peak–multiple peak” change pattern, characterized by a main peak on the left and a secondary peak on the right. Over time, the height of the main peak exhibits a decreasing trend, while that of the secondary peak has been increasing since 2013, and the gap between the two peaks is gradually narrowing. This pattern indicates that the overall ULGUE in China improved during the study period, with the efficiency differences decreasing and a significant mean value effect emerging. Second, during the study period, the kernel density curves of the four major economic zones display a right–left–right–left–right oscillation, with the overall efficiency value moving from medium–low to medium–high efficiency. The curve follows a “multi-peak–single peak” pattern in the northeast, a “multi-peak” pattern in the east and west, and a “multi-peak–single peak–multi-peak” pattern in the central region. In the medium–low efficiency range, the peak density of the curve in the northeast decreases and the secondary peak shifts to the left, indicating a strong polarization effect. In contrast, wave peaks in the eastern and western regions are uniformly distributed and relatively flat, signifying that the polarization effect has dwindled, while the mean effect has strengthened. However, the heights of both the primary and secondary peaks in the eastern region are lower and narrower than those in the western region. These trends indicate a relatively stronger homogenization effect in the eastern region. The main peak in the central region is primarily concentrated in the low-efficiency zone, and its kernel density is the steepest among the four major economic zones, with the width of the peak gradually decreasing. This result indicates that the central region has the strongest mean effect in the medium- and low-efficiency zones.
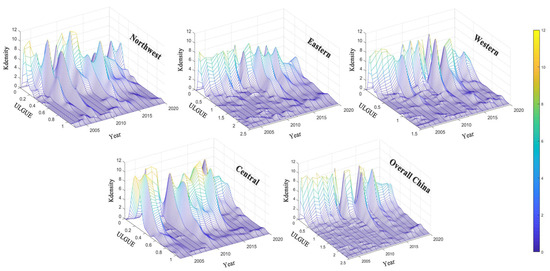
Figure 5.
Kernel density estimation curves of ULGUE in China and the four major economic zones.
4.1.2. Analysis of the Spatial Pattern Evolution of the ULGUE in China
We used the Jenks method [52] to categorize the cities into four efficiency zones based on their ULGUE values: low-value zone = 0.00–0.17, medium–low value zone = 0.18–1.30, medium–high value zone = 0.31–0.57, and high-value zone = 0.58 and above (Table 2). Figure 6 presents a spatial distribution map of the proportion of the efficiency classes in Chinese cities from 2003 to 2020. Table 2 shows that the proportion of low-efficiency cities in China overall decreased year by year, from 85.16% in 2003 to 33.90% in 2020. The proportion of high, medium–high, and medium–low efficiency cities increased annually, with the latter increasing the most, from 8.13% to 29.60%. Meanwhile, the proportion of medium–high and high-efficiency cities increased by 13.83% and 6.06%, respectively, indicating a gradual equalization of China’s urban efficiency hierarchy. Regarding the structural changes in the urban efficiency classes across the four major economic zones, all the zones present an evolutionary trend of being low-efficiency cities shifting to other classes. In 2015, the proportion of medium–low efficiency cities in the northeast surpassed that of low-efficiency ones; yet, by 2017, the proportion of medium–low efficiency cities in the eastern, central, and western regions exceeded that of low-efficiency cities. As of 2020, the central region had the highest percentage of low-efficiency cities (11%), followed by the western and eastern regions. In comparison, the eastern region had the highest percentage of high-efficiency cities (5.65%), followed by the western and central regions.
Table 2.
Proportion of ULGUE classes in the four major economic zones in China from 2003 to 2020 (%).
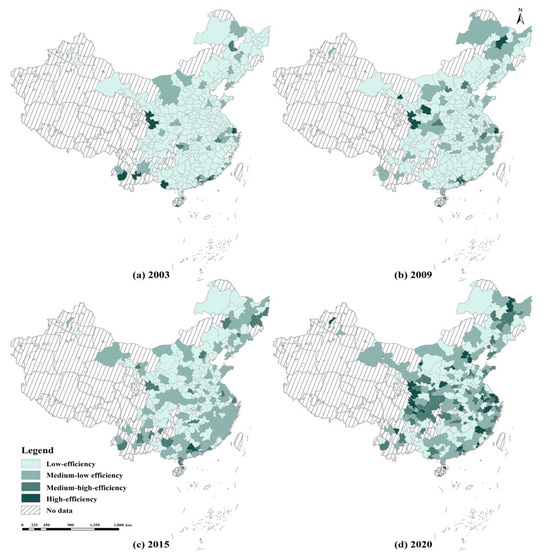
Figure 6.
Spatial distribution of ULGUE levels in China from 2003 to 2020.
In terms of the spatial distribution pattern, Figure 6 reveals that, from 2003 to 2020, the high and medium–high value ULGUE in China’s four major economic zones had a development pattern of east–west agglomeration–northeast group–regional dispersion–coastal agglomeration along the river, while the low-efficiency and medium–low-efficiency cities had a north–south group distribution pattern. As time passed, the degree of agglomeration in high- and low-value cities deepened, year by year. Specifically, the spatial distribution patterns of China’s ULGUE in 2003 and 2009 were similar, with cities in the high-efficiency zone, mainly in the southwest and the east coast, while cities in the low-efficiency zone were mainly in the central inland areas, with the higher-efficiency zones clustered along the Yangtze River Basin. This pattern indicates a significant imbalance in the development of the central region. By 2015, the total number of cities in the high-efficiency zone decreased by eight from 2009, but that of the medium–high-efficiency zone increased by 12. Of the four economic regions, the central region had the smallest change in efficiency rating, while the eastern region had the largest change. The medium- and low-efficiency cities present relatively even distributions, with coastal agglomerations, and the low-efficiency cities are still mainly distributed in the northern and southern regions of the Yangtze River Basin. Compared with the pattern in 2015, cities in the high and medium–high ULGUE zones increase by 241%, while those in the central region increase by 700%. In the western region, the medium–high and high-value cities post the second highest increase of 283%, clustering mainly in the central section of the region, manifesting as provincial capitals. The eastern and northeastern regions, which have highly efficient cities, generally transition from medium-efficiency cities. In addition, within the four major economic zones, the changes in the ULGUE mainly occur in provincial capitals. The efficiency values of adjacent cities show a considerable decline and a more apparent siphoning effect. Hence, the overall development of urban efficiency seems to be poorly coordinated.
4.2. Spatial Correlation Network Characteristics and Effect Analysis of the ULGUE in China
4.2.1. Network Characterization
From the analysis above, we observe a spatial clustering phenomenon in the ULGUE across China, pointing to a spatial correlation in the efficiency levels among the cities (Figure 6). Accordingly, to explore this correlation further, we aim to construct the spatial relationship of the ULGUE, using the gravity model, and to investigate the network characteristics of the correlation from a geospatial perspective. This study used UCINET (version 6) and QGIS 3.4 software to map the topology of the correlation network of the ULGUE in China for 2003 and 2020 (Figure 7). As shown in Figure 7, the ULGUE in China has significant geographic clustering, evolving from a single-core dominant, multi-core dispersed structure in 2003 (Shanghai) to a multi-core dominant structure in 2020 (Beijing, Shanghai, Shenzhen, Wuhan, Chongqing). Among the four economic regions, the east experienced a substantial increase in the number of associated cores, becoming the central hub of the network. Each region produced a core of leading cities, such as Shenyang in the northeast, Wuhan in the center, and Chongqing in the west. The network of spatial factor linkages among these four cities reflects the gradual move toward equilibrium and stability across the economic zones.
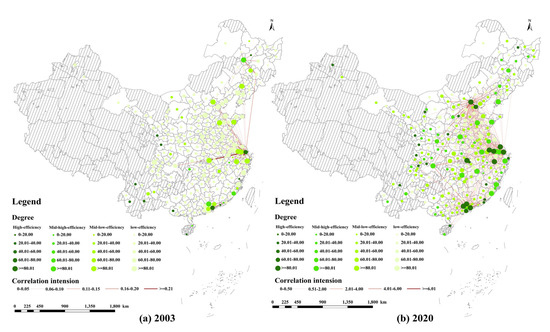
Figure 7.
Spatial network evolution of ULGUE in China, 2003–2020.
First, based on the overall network characterization, this research examines the spatial correlation network structure of the ULGUE in China via social network analysis, using the overall network characteristics (Figure 8). The analysis reveals several key insights into the evolution of the ULGUE network over time. First, the results reveal that the connectedness of the network of the ULGUE in China from 2003 to 2020 remained consistently at 1. This suggests that the land GUE among cities is closely related, with apparent spatial correlation and peer effects, but no island nodes in the network. Second, while the network density in each region only fluctuated moderately, its value increased by 0.01 in 2020 compared to 2003. This finding indicates that the spatial linkage of land use among the nodes is stable, but at a later stage, the interaction among the cities gradually improved. Third, the network level showed a rising M-shaped trend, signaling that the spatial correlation network of the ULGUE in China steadily evolved into a well-defined hierarchical structure, with most of the cities now clustered at the periphery of this evolving network. In general, the network efficiency showed a fluctuating downward trend. From 2003 to 2017, it increased from 0.633 to 0.735, but then decreased to 0.618 by 2020. This movement indicates an increase in the spatial correlation of the ULGUE and its redundant paths. However, the network efficiency remained at a high level throughout the study period, indicating that the inter-municipal associations remained relatively singular, forming a somewhat rigid network structure, with cities such as Beijing, Shanghai, Wuhan, and Chongqing at the core. In addition, the spatial association network of the ULGUE in China is characterized by a lack of closeness.
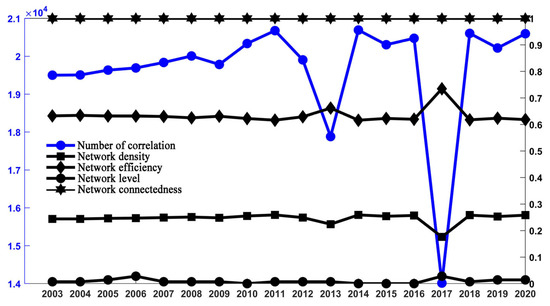
Figure 8.
Interannual change in the overall network structure of ULGUE in China from 2003 to 2020.
Second, based on the characterization of the node network, the overall network characterization can only describe the overall characteristics of the spatial correlation network of the ULGUE, and cannot reflect the role attributes of each city in the network structure. Accordingly, this study further characterizes the spatial association network structure of the ULGUE in China in terms of individual characteristics. We utilize the potential analysis tool in QGIS to visualize the centrality of the ULGUE network in China in 2003 and 2020 in the form of a 3-D global trend map. The goal is to identify its spatial evolution characteristics and analyze the evolution pattern of its centrality over time through a comparison of different periods. From the perspective of the spatiotemporal distribution characteristics (Figure 9), all three major network centrality degrees of Chinese cities display a monotonically rising trend from west to east, with a flat rising curve. This result indicates that the network centrality of Chinese cities rises steadily from west to east, with relatively small changes. In the south–north direction, the change in centrality shows an inverted “U” shape, and the trend becomes increasingly significant over time. This outcome indicates that the centrality of the urban network in central China has reached its maximum value, while decreasing along the north–south direction. Among them, the most significant is the inverted “U” pattern of the degree centrality, with the largest peak in the central region, followed by closeness centrality and then betweenness centrality. In terms of centrality among the subregions, leading cities in the four economic zones are roughly distributed in Shanghai, Suzhou, and Nanjing in the east; Dalian, Changchun, and Daqing in the northeast; Wuhan, Changsha, Hefei, and Nanchang in the center; and Chongqing, Chengdu, Baotou, and other coastal cities along the river in the west. This result means that these cities have a high degree of association with other cities and are at the center of the spatial factor association network, making them crucial to the formation and stability of the network.
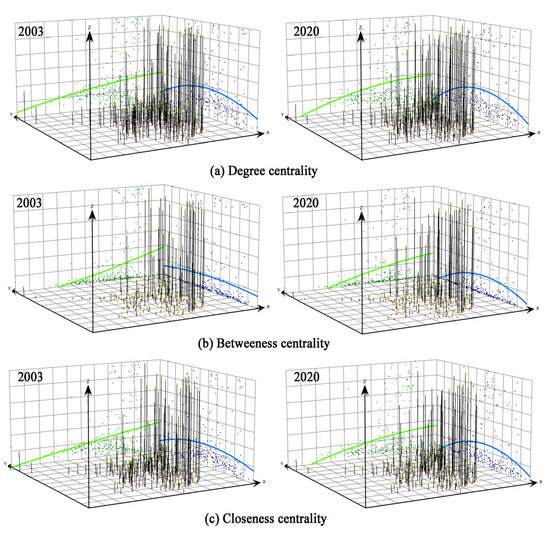
Figure 9.
Global trend in the centrality of urban land factor association networks in China, 2003 and 2020 (In Figure 9, the Z-axis represents the magnitude of the three major center degree values, the X-axis arrow points in the spatial geographic east direction, and the Y-axis arrow points in the spatial geographic north direction).
In terms of the spatiotemporal evolution characteristics (Table 3), the overall degree centrality and closeness centrality of ULGUE networks in China exhibit an upward trend throughout the study period, while the betweenness centrality tends to be stable. This finding implies that green land use among Chinese cities is increasingly interconnected and has a high degree of mutual influence. Nonetheless, each city continues to have a critical role in decision making regarding green land use, giving them a high degree of horizontal competitiveness that, to some extent, hampers improvements to network accessibility and stability. As of 2020, the eastern region has the highest centrality within the spatial correlation network of the ULGUE, indicating that it remains the core of China’s land GUE network. In comparison, the central and western regions show overall increases in network centrality, with the former displaying the greatest growth. This result reveals that the central and western regions are increasingly reducing the overall influence of the eastern region on the spatial correlation network of the ULGUE, emerging as principal players in the land use efficiency network. In contrast, the centrality of the ULGUE network in the northeast has been decreasing annually, indicating that the region is becoming a peripheral actor in the green use of urban land. Overall, the spatial correlation network of China’s ULGUE gradually evolved from unipolar dominance to a polycentric pattern from 2003 to 2020. While the eastern region remains the center of the spatial correlation network, the central and western regions are developing progressively, thereby strengthening the overall balanced development between eastern and western China. This transformation may be attributed to regional economic development and coordinated development policies.
Table 3.
Interannual mean of spatial correlation centrality of ULGUE in China, 2003–2020.
Figure 10 further illustrates that cities with the greatest increase in centrality are clustered along the central border between the west and east, whereas those with the greatest decrease are located in the central part of the western and northeastern regions. Shanghai, Beijing, and Nanjing top the centrality rankings, followed by Wuhan, Hefei, and Chongqing. On the contrary, Wenzhou, Taizhou, and Qinhuangdao are at the bottom, while Yancheng, Cangzhou, and Zhangzhou show the most significant increases. These results further highlight the growing importance of the central and western cities and the increasing equalization of the central structure among the four major economic zones.
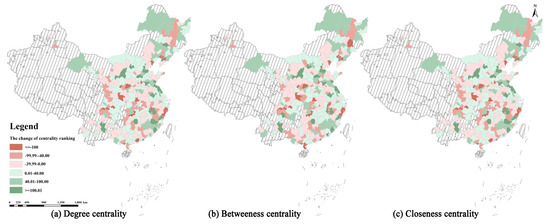
Figure 10.
Interannual variations in ULGUE social network centrality from 2003 to 2020.
4.2.2. Analysis of Network Structure Effects
This study analyzes the characteristics of the spatial correlation network structure of the ULGUE to further explore its impact on the attribute data of land green use. Using Pearson’s correlation coefficient, it empirically examines the relationship between the overall and individual network structures of the ULGUE and the efficiency intensity and differences in Chinese cities. We measure the efficiency differences, using the standard deviation of the efficiency, to reflect the spatial equilibrium of green land use in the region.
First, based on the overall network structure effects, Figure 11 illustrates a significant positive correlation (coefficient = 0.426) between the spatial correlation network level of the ULGUE and the standard deviation of land GUE. This finding indicates that a more developed spatial correlation network hierarchy in the land GUE significantly inhibits the spatial equilibrium in the ULGUE and, consequently, its coordinated improvement. The results on the correlation effect with the efficiency intensity show that while increasing the level of the spatial correlation network enhances the ULGUE, the effect is not significant. An increase in the network level will further complicate the network structure, with an increasing number of subordinate cities. In such cases, the dominant node city may lead subordinate cities toward the green win–win road because of its geographic location and efficient green land use policies. However, cities with high betweenness centrality have a higher degree of control over their subordinate cities, which may impede the capability of neighboring cities to achieve synergistic efficiency. In addition, the correlations between the network density, network efficiency, and network level with efficiency intensity and the differences vary significantly. Among these factors, the network level had the strongest correlation, followed by network efficiency, while network density showed a negative correlation, although its coefficients were not statistically significant. An increase in the network efficiency reflects greater urban connectivity within the spatial linkage network, facilitating the spillover of technology, talent, and other social resources in the land green use linkage network. This outcome, in turn, enhances the ULGUE of each node city. Meanwhile, a higher network density indicates an increase in the number of cities associated with the center city of each node, resulting in a more stable and efficient network structure that reduces the comparative advantage in green land use of a single city and the interregional differences in the ULGUE.
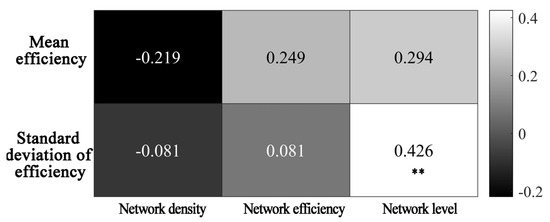
Figure 11.
Correlation between overall network structure characteristic indicators and the ULGUE (In Figure 11, the ** denotes significant at the 5% level).
Second, based on the individual network structure effects, in general, the degree centrality, betweenness centrality, and closeness centrality are all significantly positively correlated with the ULGUE intensity in China (Figure 12), suggesting that the spatial correlation network contributes to the green and efficient use of urban land. The network of nodal center cities is widely connected and has a high degree of local connection. This structure can strengthen the impact of the overall network on individual cities, allowing them to collaborate in asserting leadership, reorganizing production factors, and maximizing the benefits of green land use. With their abundant resources, diverse channels for cooperation, and central position, intermediary cities can safeguard their interests and improve their efficiency in regard to coordinating the improvement of urban land green utilization. Adjacent cities can also lower costs, while increasing efficiency through factor mobility and industry transfer. At the regional level, the roles of degree centrality, betweenness centrality, and closeness centrality are most prominent in the east, due perhaps to this region controlling the integration and allocation of resources and the development of middle- and high-level industrial activities. As a result, the east region obtains more benefits from this situation, while achieving pollution reduction through multi-channel and wide-ranging regional governance, making full use of the positive externalities of the network. Meanwhile, in the west, degree centrality and closeness centrality are significantly negatively correlated with the ULGUE intensity. This may be attributed to the limited impact of the region’s node center cities and intermediaries in promoting the concept of the green use of urban land and related policies and technologies. Additionally, the diffusion of various factors has not changed the green use of land in neighboring cities.
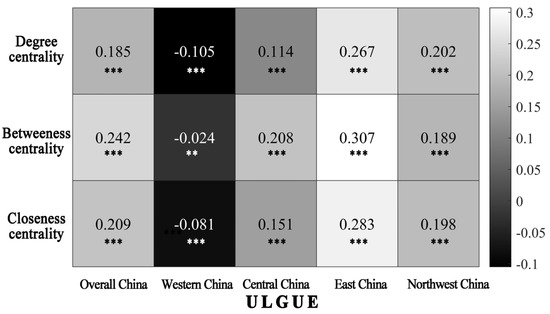
Figure 12.
Correlation between individual network structure characteristic indicators and the ULGUE (In Figure 12, the **, *** represent significant at the 5% and 10% levels, respectively).
5. Discussion
5.1. Discussion of the Findings
This research built an evaluation index system for ULGUE, based on economic, societal, and ecological dimensions. It simultaneously measured the ULGUE in China using the global reference Super-SBM model and analyzed its dynamic research characteristics through the use of kernel density estimation. Compared with previous studies [16,49,53], the value of the ULGUE derived in this work is relatively small, primarily because the built evaluation index system incorporates the energy inputs supporting the operation of various economic activities in urban areas into the input index system, as well as the positive ecological outputs into the desired output accounting. Over time, the ULGUE in China has increased, while efficiency differences have decreased, indicating a significant mean effect. This trend may be explained by the complementary nature of the production factors (e.g., capital, technology, labor) related to the green use of urban land among cities. All these factors benefit from well-developed transportation and information networks in the region, which facilitate the dynamic flow of factors. As a result, urban land use practices gradually converge, ultimately reducing the regional differences in the ULGUE. In addition, this study differs from the prior literature by focusing on the spatial spillover effect and the evident core–periphery structure of the ULGUE in China from the perspective of its relationship based on the gravity model. Existing research, in contrast, primarily applies exploratory spatial data analysis, kernel density estimation, and dynamic spatial convergence to analyze the spatial pattern and spatial spillover effect of land GUE from the aspects of efficiency spatial distribution, efficiency convergence, and spatial spillover. Thus, by enhancing the characterization of the spatial correlation of urban land use, this study transforms the research focus from the interaction based on geographical proximity to the interaction based on the perspective of a complex network. Specifically, it investigates the spatial correlation network structure characteristics and effects of the ULGUE in China from the perspective of complex networks. The overall ULGUE in China exhibits complex spatial network characteristics, with the network gradually evolving from unipolar dominance to multi-center collaborative development. Among the local governments, the spatial interaction generated by the spatial flow of the production factors and the effects of peer and collaborative governance are the main external forces for the formation of the spatial correlation network structure of the ULGUE in China.
5.2. Policy Recommendations
Coordinating the development of the green use of urban land demands a practical and in-depth understanding of the structural characteristics of the spatial correlation network of the ULGUE and its impact in China. Drawing on the findings of this study, we propose several policy recommendations. First, stakeholders must optimize the network structure and explore effective strategies for rational resource allocation. Although a stronger network level enhances the efficiency intensity in Chinese cities, it is not conducive to the spatial equalization of efficiency. To address this, the government should optimize the network association structure by leveraging the positive impact of both overall and individual network structures to enhance the ULGUE, while maintaining relative spatial equalization. It should explore strategies to strengthen the spatial linkages between urban land elements, as well establish mechanisms and institutions for coordinating cross-regional environmental regulation and urban efficiency. These initiatives can increase the number of connections within the efficiency network and reduce negative peer group effects. To enhance the stability of spatial linkages in urban networks, we recommend the addition of channels for the rational allocation of regional resources, thereby promoting the synergistic enhancement of urban efficiency in regional clusters.
Second, policies based on the spatial externality of the ULGUE can be implemented by zone to create a positive peer effect in regard to green land use. On the one hand, such policies have led to the formulation of a differentiated negative list in regard to industrial access. An “R&D–manufacturing–service” gradient collaboration mechanism can be established between nearby cities, and market-based means, such as tax sharing and carbon emissions trading, can be used to guide staggered development, reduce homogeneous competition between cities, and form a positive “1 + 1 > 2” cohort effect in regard to spatial interactions. On the other hand, such policies will strengthen the role of high-efficiency cities along the river in regard to radiating and driving the efficiency level of medium- and low-efficiency cities. A special fund for the green development of riverine urban clusters can be set up to promote the export of energy-saving technologies from high-efficiency cities to low-efficiency cities by adopting the mode of “technology export, talent stationing, and joint research”, so as to promote the synergistic improvement of the ULGUE along riverside coasts and in peripheral cities.
Third, stakeholders should fully leverage the coordination and cooperation capabilities of provincial governments to realize coordinated improvements, from top to bottom. On the one hand, the ability of provincial governments to coordinate and collaborate with each other has been brought into play. A joint provincial conference system could be established, a special fund for regional integration and development could be set up, and a unified negative list for market access and a mechanism for mutual recognition of environmental standards could be formulated. A pilot could be constructed involving three to five inter-provincial industrial cooperation demonstration zones, and the establishment of a big data platform for factor trading could be used to facilitate the circulation of factors among provincial governments. On the other hand, the internal coordination and collaboration capacity of provincial governments should be utilized. Select 30% of urban land cities as “benchmark cities for green land use”, set up technology transformation centers and experience-sharing cloud platforms, and formulate differentiated assessment indicators. A three-tier transmission system involving a “core city–node city–satellite city” should be established to realize the two-way flow of factors through the enclave economy and ecological compensation. Through collaboration among provincial governments and internal coordination within provincial governments, urban clusters with complementary advantages will gradually be formed, radiating from the province to the country as a whole and narrowing the differences in the efficiency of green utilization of urban land within the region.
5.3. Research Limitations and Future Prospects
Based on the context of ULGUE, this study constructs an evaluation index system from three dimensions: economy, society, and ecology. However, due to the availability of data, this study can only construct undesired output indexes from the perspective of three major pollutant emissions from cities, excluding carbon emissions from urban land use from the scope of measurement. In addition, the research is limited to 283 Chinese cities in four major economic zones. Therefore, the measurement of the level of ULGUE and the structure of its spatial correlation network in China require further improvement. Second, to investigate the spatial linkage of the ULGUE and its impact, this study uses spherical distance as the distance variable in the modified gravity model to construct the linkage network. However, it does not consider the influence of factors such as the horizontal compensation of local finances, which may affect the degree of linkage in the ULGUE. In exploring the network structure and impact, we only analyze the spatial structure to identify the possible causes of the structural differences and effects. We do not incorporate the internal mechanism of local governments to explore the influence mechanism of the green cohort effect.
Therefore, model correction and parameter localization can be further quantified accurately in future research. The change mechanism of the network relationship of the ULGUE in regard to the local government peer effect needs to be analyzed as well. The choice of research methods for examining these effects should also be optimized to better capture the spatial relationships. Third, while the formation mechanism and spatial correlation network characteristics of China’s ULGUE show significant peer effects, how these peer effects further influence the mechanism of the ULGUE has yet to be investigated. Constructing a spatial econometric model that enables an in-depth examination of how peer effects among local governments influence the ULGU, is of crucial value for improving the coordination mechanism of the green utilization of urban land.
6. Conclusions
Based on the context of the ULGUE, this research builds an evaluation index system for the ULGUE from the dimensions of the economy, society, and ecology. Specifically, it measures the GUE of 283 Chinese cities from 2003 to 2020 and explores its dynamic evolution and spatial correlation network characteristics. The main findings from this study are presented below:
(1) During the study period, China’s overall ULGUE trended upward in stages, while the efficiency differences continuously diminished, displaying a significant mean value effect. With regard to the spatial pattern, a significant spatial clustering phenomenon in China’s ULGUE is observed. Medium- and high-efficiency cities showed the development pattern of “east–west clustering–northeast grouping–regional decentralization–riverine and coastal clustering”, while medium- and low-efficiency cities showed a north–south clustering distribution;
(2) From 2003 to 2020, the spatial correlation network of the ULGUE in China gradually evolved from single-core led and multi-core dispersed to a multi-core-led structure. The overall fluctuation in the network density was moderate, the network level trended upward in an “M” shape, while the network efficiency generally decreased, eventually forming a relatively strict network structure, with Beijing, Shanghai, Wuhan, and Chongqing as the core. Based on the structure of the node network, the spatial correlation network of the ULGUE in China gradually evolved from unipolar dominance to a polycentric pattern. Although the eastern region remained the center of the spatial correlation network, the central and western regions steadily developed as well, and, overall, the development of the eastern and western regions became more balanced;
(3) Improvements in the spatial correlation network level of the ULGUE in China significantly inhibited the spatial equilibrium of the ULGUE, whereas increases in degree, betweenness, and closeness centrality generated a significant positive impact on the improvement of the ULGUE. These positive changes were most prominent in the central part of the country, but likely had an inhibitory impact on the western part.
Author Contributions
M.L.: conceptualization, methodology, software, funding acquisition, writing original draft, writing—review and editing. P.H.: data curation, validation, software, writing original draft. A.Z.: conceptualization, writing review and editing. All authors have read and agreed to the published version of the manuscript.
Funding
This study was supported by the National Natural Science Foundation of China (NO.42401324); the Humanities and Social Sciences Foundation of the Ministry of Education of China (NO.24YJCZH175); and the Project on cultivating young scientific and technological talents in early vocational stage in Jiangxi Province (20244BCE52032).
Data Availability Statement
The datasets used and/or analyzed during the current study are available from the corresponding author on reasonable request.
Conflicts of Interest
The authors declare that there are no conflicts of interest.
References
- UN-Habitat. World Cities Report 2022: Envisaging the Future of Cities; UN-Habitat: Nairobi, Kenya, 2022. [Google Scholar]
- Wu, H.; Fang, S.; Zhang, C.; Hu, S.; Nan, D.; Yang, Y. Exploring the impact of urban form on urban land use efficiency under low-carbon emission constraints: A case study in China’s Yellow River Basin. J. Environ. Manag. 2022, 311, 114866. [Google Scholar] [CrossRef] [PubMed]
- Caprotti, F.; Cowley, R.; Datta, A.; Broto, V.C.; Gao, E.; Georgeson, L.; Herrick, C.; Odendaal, N.; Joss, S. The New Urban Agenda: Key opportunities and challenges for policy and practice. Urban Res. Pract. 2017, 10, 367–378. [Google Scholar] [CrossRef]
- Sun, Y.F.; Jia, Z.; Chen, Q.; Na, H.Y. Spatial Pattern and Spillover Effects of the Urban Land Green Use Efficiency for the Lanzhou-Xining Urban Agglomeration of the Yellow River Basin. Land 2023, 12, 59. [Google Scholar] [CrossRef]
- Lu, X.H.; Kuang, B.; Li, J. Regional difference decomposition and policy implications of China’s urban land use efficiency under the environmental restriction. Habitat Int. 2018, 77, 32–39. [Google Scholar] [CrossRef]
- Chen, Q.; Zheng, L.; Wang, Y.; Wu, D.; Li, J.F. A comparative study on urban land use eco-efficiency of Yangtze and Yellow rivers in China: From the perspective of spatiotemporal heterogeneity, spatial transition and driving factors. Ecol. Indic. 2023, 151, 110331. [Google Scholar] [CrossRef]
- Song, Y.; Yeung, G.; Zhu, D.L.; Xu, Y.; Zhang, L.X. Efficiency of urban land use in China’s resource-based cities, 2000–2018. Land Use Policy 2022, 115, 106009. [Google Scholar] [CrossRef]
- Xie, H.L.; Wang, W. Spatiotemporal differences and convergence of urban industrial land use efficiency for China’s major economic zones. J. Geogr. Sci. 2015, 25, 1183–1198. [Google Scholar] [CrossRef]
- Skea, J.; Nishioka, S. Policies and practices for a low-carbon society. Clim. Policy 2008, 8, S5–S16. [Google Scholar] [CrossRef]
- Li, H.Y.; Wang, Z.Q.; Zhu, M.Y.; Hu, C.X.; Liu, C. Study on the spatial-temporal evolution and driving mechanism of urban land green use efficiency in the Yellow River Basin cities. Ecol. Indic. 2023, 154, 110672. [Google Scholar] [CrossRef]
- Xue, D.; Yue, L.; Ahmad, F.; Draz, M.U.; Chandio, A.A.; Ahmad, M.; Amin, W. Empirical investigation of urban land use efficiency and influencing factors of the Yellow River basin Chinese cities. Land. Use Policy 2022, 117, 106117. [Google Scholar] [CrossRef]
- Zheng, H.Z.; Wu, Y.J.; He, H.M.; Delang, C.O.; Qian, J.; Lu, J.A.; Yao, Z.Y.; Li, G.Z. Urban land use eco-efficiency and improvement in the western region of China. J. Clean. Prod. 2023, 412, 137385. [Google Scholar] [CrossRef]
- Gao, J.X.; Song, J.B.; Wu, L.F. A new methodology to measure the urban construction land-use efficiency based on the two-stage DEA model. Land. Use Policy 2022, 112, 105799. [Google Scholar] [CrossRef]
- Chen, W.; Ning, S.Y.; Chen, W.J.; Liu, E.N.; Wang, Y.N.; Zhao, M.J. Spatial-temporal characteristics of industrial land green efficiency in China: Evidence from prefecture-level cities. Ecol. Indic. 2020, 113, 106256. [Google Scholar] [CrossRef]
- Su, H.; Yang, S. Spatio-Temporal Urban Land Green Use Efficiency under Carbon Emission Constraints in the Yellow River Basin, China. Int. J. Environ. Res. Public. Health 2022, 19, 12700. [Google Scholar] [CrossRef]
- Ma, D.L.; Zhang, J.W.; An, B.T.; Guo, Z.M.; Zhang, F.T.; Yan, Y.; Peng, G.C. Research on urban land green use efficiency and influencing factors based on DEA and ESTDA models: Taking 284 cities in China as an example. Ecol. Indic. 2024, 160, 111824. [Google Scholar] [CrossRef]
- Yuan, T.; Zhang, J.; Xiang, Y.; Lu, L.Y. Exploring the Temporal and Spatial Evolution Laws of County Green Land-Use Efficiency: Evidence from 11 Counties in Sichuan Province. Buildings 2022, 12, 816. [Google Scholar] [CrossRef]
- Xiao, Y.P.; Ma, D.L.; Zhang, F.T.; Zhao, N.; Wang, L.; Guo, Z.M.; Zhang, J.W.; An, B.T.; Xiao, Y.D. Spatiotemporal differentiation of carbon emission efficiency and influencing factors: From the perspective of 136 countries. Sci. Total Environ. 2023, 879, 163032. [Google Scholar] [CrossRef]
- Zhang, C.Q.; Chen, P.Y. Applying the three-stage SBM-DEA model to evaluate energy efficiency and impact factors in RCEP countries. Energy 2022, 241, 122917. [Google Scholar] [CrossRef]
- Yu, J.Q.; Zhou, K.L.; Yang, S.L. Land use efficiency and influencing factors of urban agglomerations in China. Land Use Policy 2019, 88, 104143. [Google Scholar] [CrossRef]
- Yang, Q.K.; Wang, L.; Qin, X.H.; Fan, Y.T.; Wang, Y.Z.; Ding, L.L. Urban Land Use Efficiency and Contributing Factors in the Yangtze River Delta Under Increasing Environmental Restrictions in China. Chin. Geogr. Sci. 2022, 32, 883–895. [Google Scholar] [CrossRef]
- Tan, S.K.; Hu, B.X.; Kuang, B.; Zhou, M. Regional differences and dynamic evolution of urban land green use efficiency within the Yangtze River Delta, China. Land. Use Policy 2021, 106, 105449. [Google Scholar] [CrossRef]
- Yang, L.S.; Ni, M.Y. Is financial development beneficial to improve the efficiency of green development? Evidence from the “Belt and Road” countries. Energ. Econ. 2022, 105, 105734. [Google Scholar] [CrossRef]
- Zhao, Y.; Jiang, X.; Lu, X.H.; Wang, H.Z. Spatial convergence and its determinants of green urban land use efficiency: Empirical evidence from 284 cities in China. Environ. Dev. Sustain. 2024. [Google Scholar] [CrossRef]
- Ge, K.; Zou, S.; Chen, D.L.; Lu, X.H.; Ke, S.A. Research on the Spatial Differences and Convergence Mechanism of Urban Land Use Efficiency under the Background of Regional Integration: A Case Study of the Yangtze River Economic Zone, China. Land 2021, 10, 1100. [Google Scholar] [CrossRef]
- Zhou, J.L. Spatial-temporal evolution and spatial spillover of the green efficiency of urban construction land in the Yangtze River Economic Belt, China. Sci. Rep. 2023, 13, 14387. [Google Scholar] [CrossRef]
- Chen, Q.; Zheng, L.; Wang, Y.; Wu, D.; Li, J.F. Spillover effects of urban form on urban land use efficiency: Evidence from a comparison between the Yangtze and Yellow Rivers of China. Environ. Sci. Pollut. Res. 2023, 30, 125816–125831. [Google Scholar] [CrossRef]
- Schaltegger, S.; Sturm, A. Ecological rationality: Starting points for the design of ecology-oriented management instruments. Die Unternehm. 1990, 44, 272–290. [Google Scholar]
- WBCSD. Eco-Efficiency: Leadership for Improved Economic and Environmental Performance; WBCSD: Geneva, Switzerland, 1992; Volume 3–16, pp. 3–16. [Google Scholar]
- Moll, S.; Gee, D. Making sustainability accountable: Eco-efficiency, resource productivity and innovation. In Proceedings of the Workshop on the Occasion of the Fifth Anniversary of the European Environment Agency (EEA), Copenhagen, Denmark, 28–30 October 1998. [Google Scholar]
- WB. Inclusive Green Growth; World Bank Publications: Washington, DC, USA, 2012. [Google Scholar]
- Lu, X.; Qu, Y.; Sun, P.L.; Yu, W.; Peng, W.L. Green Transition of Cultivated Land Use in the Yellow River Basin: A Perspective of Green Utilization Efficiency Evaluation. Land 2020, 9, 475. [Google Scholar] [CrossRef]
- Ulman, E.L. American Commodity Flow: A Geographical Interpretation of Rail and Water Traffic based on Principles of Spatial Interchange; University of Washington Press: Seattle, WA, USA, 1957. [Google Scholar]
- Magistretti, S.; Dell’Era, C.; Doppio, N. Design sprint for SMEs: An organizational taxonomy based on configuration theory. Manag. Decis. 2020, 58, 1803–1817. [Google Scholar] [CrossRef]
- Zimmerman, D.J. Peer effects in academic outcomes: Evidence from a natural experiment. Rev. Econ. Stat. 2003, 85, 9–23. [Google Scholar] [CrossRef]
- Glaeser, E.L.; Sacerdote, B.I.; Scheinkman, J.A. The Social Multiplier. J. Eur. Econ. Assoc. 2003, 1, 345–353. [Google Scholar] [CrossRef]
- Xu, J.J.; Wang, J.C.; Yang, X.J.; Xiong, C.Q. Peer effects in local government decision-making: Evidence from urban environmental regulation. Sustain. Cities Soc. 2022, 85, 104066. [Google Scholar] [CrossRef]
- Zhang, Y.; Dai, Y.Q.; Ke, X.L. Spatial correlation network of new urbanization in China and its impact on land use eco-efficiency—Based on the perspective of network node centrality. China Land Sci. 2023, 37, 117–129. [Google Scholar]
- Zhu, X.H.; Zhang, P.F.; Wei, Y.G.; Li, Y.; Zhao, H.R. Measuring the efficiency and driving factors of urban land use based on the DEA method and the PLS-SEM model-A case study of 35 large and medium-sized cities in China. Sustain. Cities Soc. 2019, 50, 101646. [Google Scholar] [CrossRef]
- He, J.H.; Pan, Z.Z.; Liu, D.F.; Guo, X.N. Exploring the regional differences of ecosystem health and its driving factors in China. Sci. Total Environ. 2019, 673, 553–564. [Google Scholar] [CrossRef]
- Liu, W.W.; Guo, Z.L.; Jiang, B.; Lu, F.; Wang, H.N.; Wang, D.A.; Zhang, M.Y.; Cui, L.J. Improving wetland ecosystem health in China. Ecol. Indic. 2020, 113, 106184. [Google Scholar] [CrossRef]
- Pastor, J.T.; Lovell, C.A.K. A global Malmquist productivity index. Econ. Lett. 2005, 88, 266–271. [Google Scholar] [CrossRef]
- Sheather, S.J. Density estimation. Stat. Sci. 2004, 19, 588–597. [Google Scholar] [CrossRef]
- Wu, C.; Ye, X.Y.; Du, Q.Y.; Luo, P. Spatial effects of accessibility to parks on housing prices in Shenzhen, China. Habitat Int. 2017, 63, 45–54. [Google Scholar] [CrossRef]
- Sun, L.C.; Qin, L.; Taghizadeh-Hesary, F.; Zhang, J.J.; Mohsin, M.; Chaudhry, I.S. Analyzing carbon emission transfer network structure among provinces in China: New evidence from social network analysis. Environ. Sci. Pollut. Res. 2020, 27, 23281–23300. [Google Scholar] [CrossRef]
- Huo, T.F.; Cao, R.J.; Xia, N.N.; Hu, X.; Cai, W.G.; Liu, B.S. Spatial correlation network structure of China’s building carbon emissions and its driving factors: A social network analysis method. J. Environ. Manag. 2022, 320, 115808. [Google Scholar] [CrossRef] [PubMed]
- Hu, F.; Qiu, L.P.; Wei, S.B.; Zhou, H.Y.; Bathuure, I.A.; Hu, H. The spatiotemporal evolution of global innovation networks and the changing position of China: A social network analysis based on cooperative patents. RD Manag. 2024, 54, 574–589. [Google Scholar] [CrossRef]
- Edelmann, D.; Móri, T.F.; Székely, G.J. On relationships between the Pearson and the distance correlation coefficients. Stat. Probabil Lett. 2021, 169, 108960. [Google Scholar] [CrossRef]
- Ma, D.L.; Zhang, J.W.; Zhang, F.T.; Xiao, Y.P.; Tan, H.M.; Guo, Z.M.; An, B.T. What were the spatiotemporal evolution characteristics and the influencing factors of urban land green use efficiency? A case study of the Yangtze River Economic Belt. Environ. Monit. Assess 2023, 195, 806. [Google Scholar] [CrossRef]
- Hu, W.B.; Li, Z.F.; Chen, D.L.; Zhu, Z.Y.; Peng, X.T.; Liu, Y.B.; Liao, D.M.; Zhao, K. Unlocking the potential of collaborative innovation to narrow the inter-city urban land green use efficiency gap: Empirical study on 19 urban agglomerations in China. Environ. Impact Asses 2024, 104, 107341. [Google Scholar] [CrossRef]
- Ma, L.D.; Xu, W.X.; Zhang, W.Y.; Ma, Y.A. Effect and mechanism of environmental regulation improving the urban land use eco-efficiency: Evidence from China. Ecol. Indic. 2024, 159, 111602. [Google Scholar] [CrossRef]
- North, M.A. A Method for Implementing a Statistically Significant Number of Data Classes in the Jenks Algorithm. In Proceedings of the FSKD 2009, Sixth International Conference on Fuzzy Systems and Knowledge Discovery, Tianjin, China, 14–16 August 2009; Volume 6. [Google Scholar]
- Zhang, L.Y.; Xiao, Y.; Guo, Y.M.; Qian, X.M. Spatial-temporal distribution and key factors of urban land use ecological efficiency in the Loess Plateau of China. Sci. Rep. 2023, 13, 22306. [Google Scholar] [CrossRef]
Disclaimer/Publisher’s Note: The statements, opinions and data contained in all publications are solely those of the individual author(s) and contributor(s) and not of MDPI and/or the editor(s). MDPI and/or the editor(s) disclaim responsibility for any injury to people or property resulting from any ideas, methods, instructions or products referred to in the content. |
© 2025 by the authors. Licensee MDPI, Basel, Switzerland. This article is an open access article distributed under the terms and conditions of the Creative Commons Attribution (CC BY) license (https://creativecommons.org/licenses/by/4.0/).