1. Introduction
In recent years, global climate change has become a serious environmental challenge, manifesting in more frequent extreme weather events and a long-term warming trend in temperatures [
1]. At the same time, accelerated urbanization has led to denser cityscapes and higher population densities, accompanied by dramatic changes in land use and land cover (LULC), including primarily the expansion of impervious surfaces and the loss of green spaces and watersheds. These changes have resulted in slower heat dissipation, elevated urban surface temperatures, greater vulnerability to urban heat island (UHI) effects, and ultimately a poorer urban thermal environment [
2,
3]. Human activities such as transportation, industrial production, and residential energy use contribute substantial heat pollution, further intensifying local warming [
4]. Numerous studies have demonstrated that various land use modes, particularly in urban areas, significantly affect surface temperatures. Continuous intensification of the UHI effect is a direct consequence of LULC changes [
5]. To enhance living comfort, residents increasingly rely on cooling and heating measures, increasing energy consumption (EC) [
6]. In the context of climate change and rising urban energy demand, understanding the specific influence of urban LULC changes on surface temperature, UHI intensity, and energy consumption has become a critical focus for achieving sustainable development [
7].
The UHI phenomenon refers to the temperature difference between urban and rural areas, which affects both air and ground surfaces [
8]. Currently, more than half of the global population resides in the cities. The continuous expansion of urban areas has led to changes in land use and land surface temperature (LST), intensifying the UHI effect. This phenomenon significantly affects energy consumption and the ecological environment [
9]. Numerous studies have shown that changes in LULC not only shape the spatial distribution of the UHI effect but also directly affect the processes of heat absorption and dissipation in urban environments [
10,
11]. To quantitatively assess the impact of LULC on UHI effects, remote sensing (RS) technology has been widely applied. Among the commonly used indices, the normalized difference vegetation index (NDVI), the modified normalized difference water index (MNDWI), and the normalized difference built-up index (NDBI) are particularly important. These indices not only facilitate the identification and quantification of various land cover types in urban areas but also provide insight into how different land surfaces contribute to UHI intensity under varying environmental conditions.
The NDVI is a common RS index used to measure the extent and health status of vegetation coverage [
12]. It is typically employed to assess the distribution of urban green spaces. Studies have shown that areas with higher NDVI values typically correspond to green spaces or urban forests, which helps reduce temperature [
13]. Dense plant coverage in these areas can mitigate the impacts of extreme weather by blocking solar radiation [
14], increasing air humidity through evapotranspiration [
15], and regulating the carbon–oxygen balance [
16]. However, urban expansion often reduces vegetation cover, leading to elevated surface temperatures and intensified UHI effects [
17]. The MNDWI is primarily used to identify water body distribution [
18]. By suppressing the reflectance of the built-up surfaces, it enhances the detection accuracy of water features. As natural heat sinks, water bodies help mitigate the UHI effect through evaporative cooling. Studies have suggested that the MNDWI effectively reveals the spatial distribution of urban water bodies. In particular, during urban expansion, water bodies play a significant role in alleviating LST and UHI effects at both macro- and micro-spatial scales [
9]. The NDBI can effectively distinguish built-up areas from non-built-up surfaces in urban environments [
19]. Urban infrastructure, typically constructed with impervious materials such as concrete, asphalt, and glass, exhibits low albedo and specific heat capacity, which results in increased heat absorption and storage, thereby intensifying the UHI effect [
20]. Research has found a positive correlation between NDBI values and UHI intensity, with densely built areas exhibiting stronger UHI effects [
21]. A combined analysis of the NDVI, MNDWI, and NDBI provides a comprehensive understanding of urban land use patterns and their respective influences on the UHI effect. Integrating these indices allows for a more accurate assessment and prediction of UHI dynamics, offering a scientific foundation for urban planning and heat mitigation strategies.
In recent decades, extensive research has been conducted on factors that influence building energy consumption. The primary data sources for such research included field surveys and model simulations. Physical modeling typically requires computer-based simulation tools, with commonly used software, including DOE-2, eQUEST, DeST, EnergyPlus, and TRNSYS [
22]. Researchers have applied various analytical methods to different building types and usage scenarios and have yielded diverse results. These methods include convolutional neural networks, the Logarithmic Mean Divisia Index (LMDI) method, and Gaussian process regression [
23,
24]. Buildings can be classified by function, such as residential, office, or commercial, and the energy consumption patterns vary significantly across these categories [
25]. In addition, numerous studies have explored how surface temperature and land cover characteristics influence building energy demand [
26,
27], particularly the seasonal effects of solar radiation, vegetation cover, and climate conditions on daily average temperatures. A synthesis of existing research highlights that the key determinants of building energy consumption include physical building characteristics, urban block morphology, occupant energy use behavior, and socio-economic conditions.
However, most existing studies have focused on the influence of individual factors and have not comprehensively investigated the combined effects of different land use types across diverse urban environments. Although some studies have examined the impact of land use on the UHI effect, few have thoroughly explored the interactions among various land use patterns and their joint influence on UHI intensity and building energy consumption. Using a mediated-effects model, Wang P. et al. [
27] analyzed the relationship between the NDVI and LST in relation to electricity consumption across different seasons over the past three decades in Nanjing, China. Their findings confirmed that LST had a mediating effect on seasonal electricity consumption. An increase in impervious surfaces elevates the surface temperature and exacerbates the UHI effect. Consequently, changes in the NDVI lead to variations in LST and the UHI index. A single index often fails to comprehensively capture the impact of building energy consumption. Constructing a multi-dimensional index system and employing an objective weighting method for composite measurements provide a more comprehensive approach. Among these, the entropy weighting method is particularly advantageous. This mathematical technique assigns weights based on the amount of information contained in each index, thereby ensuring high credibility and reliability [
28].
A review of existing literature highlights several gaps. (1) Most studies have focused on individual buildings within specific regions, offering a limited understanding of the quantitative relationships between LULC, UHI, and urban building energy consumption at the city scale. Furthermore, the mechanism of LULC’s influence on the heat island effect in different climate zones is still incomplete. (2) Studies have rarely analyzed the combined positive and negative impacts of LULC and UHI across seasons, leaving the extent of their year-round effects underexplored. (3) When examining the effects of LULC and UHI on urban energy consumption, existing research predominantly employs methods such as XGBoost and SVR. Although these approaches enable qualitative analysis, they lack the ability to provide precise quantitative insights. (4) Current studies have primarily focused on natural factors, such as the NDVI or surface temperature, often neglecting a comprehensive consideration of natural, economic, and social influences. This narrow focus increases the risk of estimation errors and biased conclusions. To address these gaps, this study employed GIS and RS technologies to calculate NDVI, MNDWI, NDBI, LST, and UHI data and analyze their relationships with building energy consumption in Harbin from 2000 to 2024. The main objectives of this study were as follows: (1) to analyze the spatiotemporal distribution and trends of LULC, LST, UHI, and EC at the city scale in Harbin; (2) to conduct cross-seasonal raster-based analysis in a severely cold region, such as Harbin, thereby enriching the climatic perspectives addressed in existing research; (3) to quantify the mediating effect of UHI on the relationship between the NDVI, NDBI, and building energy consumption and to systematically evaluate the combined influence of the NDVI, MNDWI, NDBI, and UHI using an entropy weighting approach; and (4) to construct regression models incorporating indicators, such as Gross Domestic Product (GDP) and population, to assess energy consumption from an integrated nature–economy–society perspective. These findings offer practical insights for optimizing land use planning, promoting energy conservation, and supporting emission reduction strategies in severely cold regions.
2. Data and Methods
2.1. Study Area
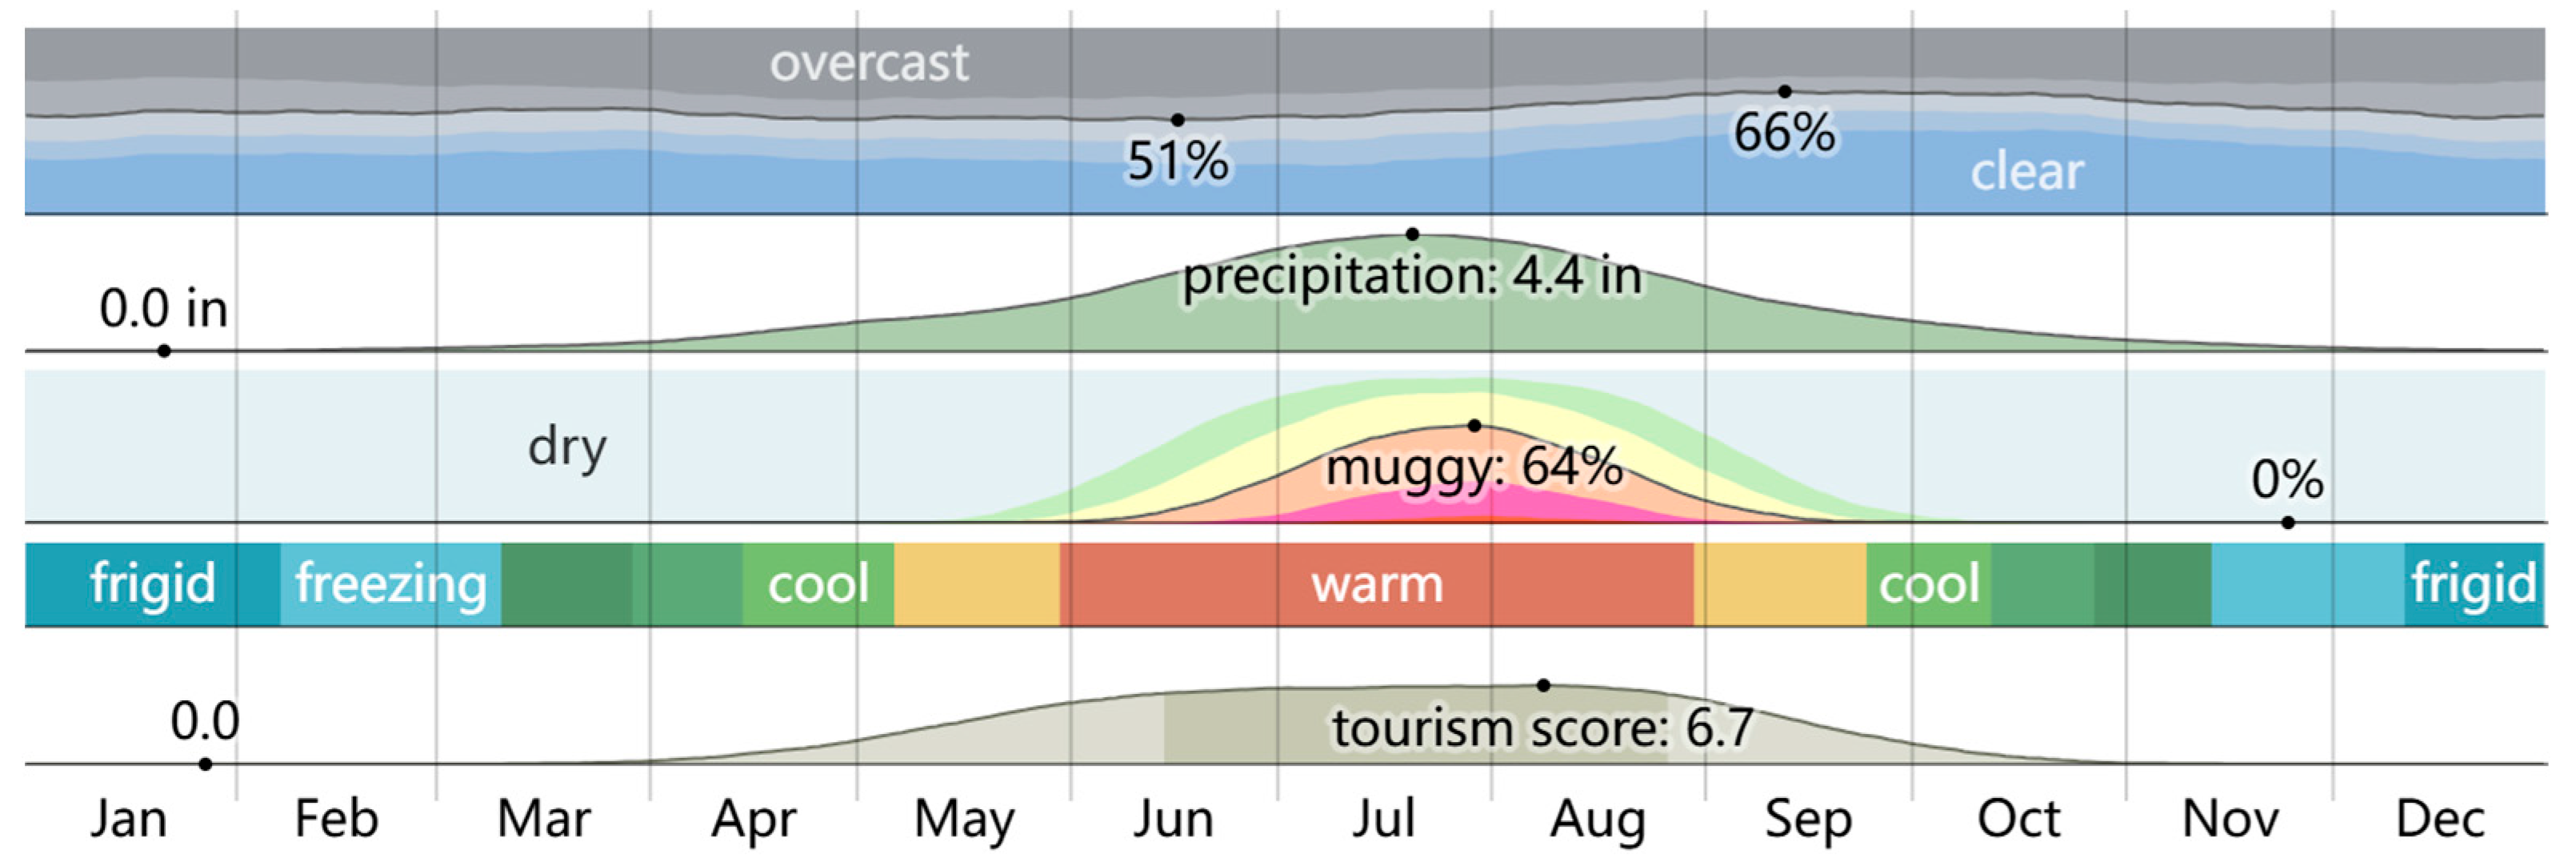
Harbin (E125°42′–130°10′, N44°04′–46°40′) is the capital of Heilongjiang Province in northeast China, covering a total area of 53,076.4 km2, and has a registered population of 9.395 million by the end of 2024. The city experiences long winters (November–March) and short summers (July–August), which features a typical cold region. The winter temperatures average −24.6 °C, with lows reaching −31 °C, while the summer temperatures average 20.8 °C, with a peak of 36.5 °C. The average annual precipitation is 569.1 mm. The precipitation is mainly concentrated from June to September, accounting for 60% of the annual precipitation. The wind speed peaks in spring, and the next highest speed is in autumn. In winter, the average wind speed is lowest while the southwest wind prevails.
The data from the Harbin Meteorological Station (2018–2024) indicate that July and August recorded the highest summer temperatures, peaking at approximately 35 °C, whereas December and January experienced the coldest winter temperatures, dropping to approximately −30 °C (
Figure 1). During these months, buildings face the highest cooling and heating demands. This study selected representative months from both winter and summer to investigate the effects of land cover change on surface temperature, UHI intensity, and energy consumption. Five principal administrative districts—Nangang, Daoli, Daowai, Xiangfang, and Songbei—were identified as the study areas (
Figure 2), as they encompass the majority of Harbin’s population and represent the city’s primary urban core. In recent decades, these districts have undergone rapid urbanization, resulting in intricate interactions among land cover dynamics, urban morphology, and thermal environmental conditions. These attributes render Harbin a representative case for systematically examining the impacts of land cover transformation on urban microclimate and energy demand in cold-region cities.
2.2. Data Description
This study utilized surface temperature data from Landsat 5 Thematic Mapper (2000, 2001, 2006, 2010, and 2011) and Landsat 8 Thematic Mapper (2016, 2022, and 2024). Remote sensing images were preprocessed using GIS and RS techniques, including radiometric correction, spatial correction, and cropping. Land use data were sourced from the study by Yang et al. [
29]. Satellite images from winter and summer between 2000 and 2024 were analyzed, with representative years selected based on a cloud cover of less than 5% in the study area. Because of the cloud cover and missing images in the summers of 2000, 2005, 2010, 2015, 2020, and 2021, as well as in the winters of 2005, 2015, 2020, and 2021, the summers of 2001, 2006, 2011, 2016, 2022, and 2024 and the winters of 2000, 2006, 2010, 2016, 2022, and 2024 were selected as representative periods for the analysis.
The building energy consumption data for the districts in Harbin used in this study were sourced from government departments and the Harbin Statistical Yearbook, which also provides data on the total permanent population and other variables related to building energy consumption. To account for price changes over a 25-year period, this study utilized the absolute social electricity consumption in Harbin’s administrative districts during summer and winter from 2000 to 2024 as raw data and normalized it using the consumer price index (CPI) with 2000 as the base period.
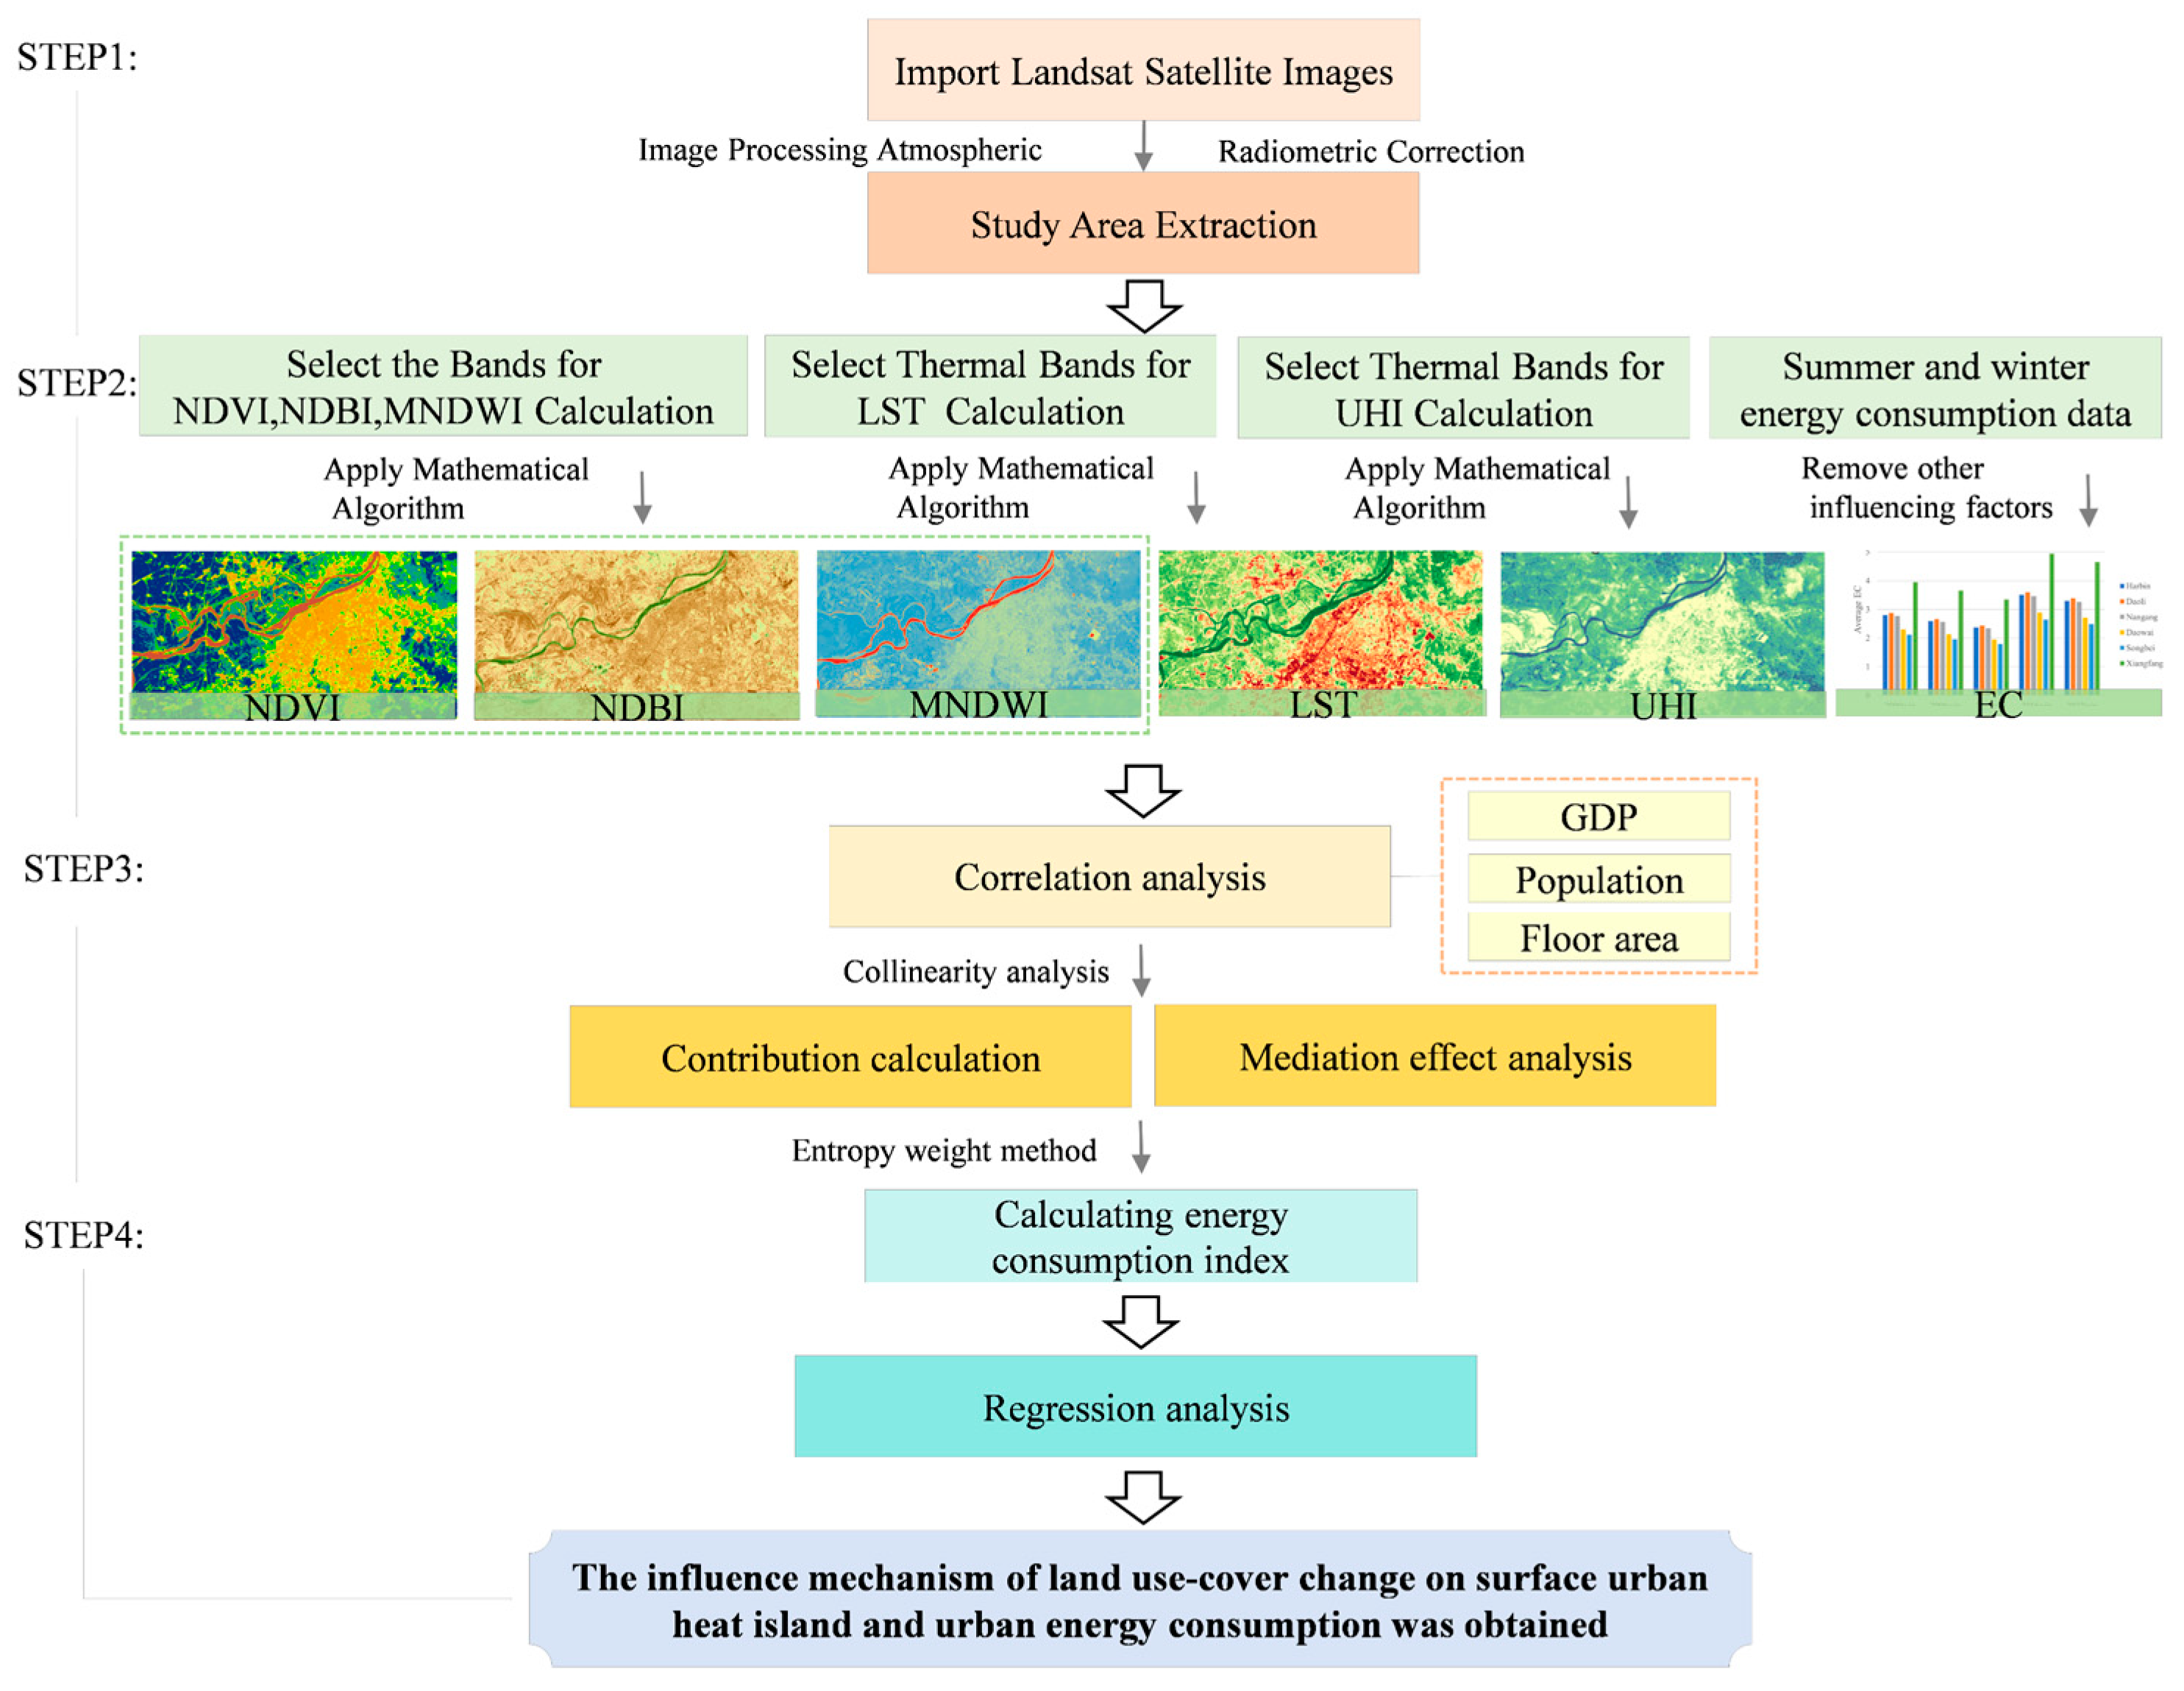
Table 1 details the variables, and
Figure 3 outlines the methodological process.
2.3. Classification of LULC Classes
Land use data from 2000, 2001, 2006, 2010, 2011, 2016, 2022, and 2024 were analyzed, encompassing nine land use types that were reclassified into six categories: cultivated land, forest land, grassland, water bodies, bare land (unused land), and impervious surfaces. The satellite images of the study area were categorized as follows: (a) agricultural land, including areas used for food production; (b) forest land, consisting of densely wooded areas; (c) water bodies, including oceans, rivers, canals, ponds, and reservoirs; (d) grassland, covering natural, improved, and artificial grasslands; (e) unutilized land, comprising saline land, swamp land, sandy land, bare land, and bare rock; and (f) impervious surfaces, encompassing residential, commercial, mixed-use, and industrial areas and transportation networks.
2.4. Calculation of NDVI, MNDWI, and NDBI
The
NDVI is a widely used indicator of land surface vegetation cover, known for its clear physical interpretation, ability to reduce radiometric errors, and high sensitivity to vegetation. It has been extensively applied to distinguish between vegetated and non-vegetated areas [
30] as well as to analyze changes in vegetation patterns [
31]. The
MNDWI is an RS index commonly used to detect water bodies. It has also been applied for monitoring drought, water stress, and soil erosion [
32]. The
NDBI is an important index that reflects the intensity of urban construction and distribution of built-up areas [
33]. In this study, the
NDVI,
MNDWI, and
NDBI were used to characterize land use changes, and the relationship between land use change, the urban UHI effect, and building energy consumption was explored. The indices were calculated using the following equations:
where
NIR is the near-infrared band,
R is the red band,
G is the green band,
SWIR is the shortwave infrared band, and
MIR is the mid-infrared band.
2.5. Calculation of LST and SUHI
Traditional meteorological observation methods are limited in capturing the specific spatial distribution of LST, making RS the mainstream approach for inverting urban LST [
34]. This study estimated LST using the thermal bands of Landsat images using different methods applied to Landsat 5 and Landsat 8. For Landsat 5, thermal band 6 was used to calculate LST [
35], whereas Landsat 8 employed thermal band 10 [
36]. The detailed formulas and steps are provided in Rahman M.N., Rony M.R.H., and Jannat F.A. et al. [
37].
To validate the quantified LST, this study compared it with atmospheric temperature data recorded by the Harbin Meteorological Department and calculated the standard deviation and mean deviation.
Table 2 presents the accuracy matrix for the quantified LST across the study period. The high similarity between satellite-derived LST values and ground station observations confirmed the consistency of LST with recorded atmospheric temperatures.
Owing to interannual variations in atmospheric conditions, such as near-surface water vapor content, direct comparison of LST values across multiple time periods is not methodologically rigorous. Therefore, in this study, LST was used only as a reference variable for calculating surface urban heat island (SUHI) intensity. SUHI intensity was adopted as the primary indicator for comparative analysis across different periods.
The UHI effect refers to a phenomenon in which the surface or air temperatures in urban areas are higher than those in surrounding regions [
38]. Based on the research scope, UHIs are categorized into boundary layer heat islands (BLUHIs), canopy heat islands (CLUHIs), and SUHIs [
39]. The SUHI is typically derived by inverting the LST using satellite thermal images. A common approach for quantifying the
SUHI effect involves comparing urban temperatures with those of surrounding areas [
40], where higher
SUHI values indicate a more severe heat island phenomenon. The specific calculation equation for SUHIs is as follows [
41]:
where
T is the LST of the study area,
Tm is the mean LST of the corresponding rural area (defined as a buffer zone approximately 20 km beyond the urban boundary), and
Tsd is the standard deviation of LST.
2.6. Quantitative Analysis
2.6.1. Random Forest Model
To further investigate the impact of factors such as the NDVI on EC, this study employed the random forest model proposed by Breiman to predict the importance of each influencing factor [
42]. Random forest is an ensemble learning method that combines the predictions of multiple decision trees to improve overall accuracy and model robustness. It is known for its strong fitting and generalization capabilities, making it effective in minimizing the risk of overfitting. For the specific situation of this study, the random forest model has certain advantages in matching the research objectives and data characteristics. First, this study involves many variables and a relatively small sample size, and random forest has the advantages of strong overfitting resistance and more robustness to small samples through bootstrap resampling and random selection of feature subsets. Second, EC is jointly influenced by multiple factors such as land cover, the heat island effect, economy, and population, and there may be interaction or nonlinear relationships among them. The random forest model is well suited for capturing such complex nonlinear relationships and handling variable interactions automatically. Finally, the random forest model can provide an intuitive and reliable indicator of the importance of variables. The use of the OOBPermutedPredictorDeltaError metric allows for an effective assessment of the relative importance of each variable, which is closely aligned with the analytical goals of this study.
This study constructed a random forest model and divided the input data into training and test sets at a ratio of either 8:2 or 7:3. To mitigate overfitting and enhance model interpretability under a limited sample size, key hyperparameters were manually calibrated. For the summer model, the number of trees was set to 60 based on performance stability during preliminary tests. The maximum depth was limited to 10 to prevent overly complex trees, and the number of features considered at each split was set to 1.0 (i.e., all features). Additional parameters included a minimum of one sample per leaf and a minimum of two samples required to split an internal node. For the winter model, the number of trees was set to 300, and the maximum depth was limited to 5. The model used out-of-bag (OOB) samples to internally estimate generalization performance, supporting model robustness without a separate validation set. Bootstrap sampling was applied to randomly extract samples with replacements from the original dataset, followed by regression fitting between each influencing factor and the sampled data. The final predicted EC was obtained by averaging the results of multiple regression trees. The contribution of each input variable to the predicted EC was used to determine its relative importance. Model performance was evaluated using coefficient of determination (R2), mean absolute error (MAE), and root mean square error (RMSE). R2 was used to assess the model’s goodness-of-fit. MAE was applied to quantify the average absolute difference between the predicted and observed values, with a smaller MAE indicating a higher predictive accuracy. RMSE, the square root of the mean squared differences between the predicted and actual values, was used to evaluate the overall model performance, with lower RMSE values reflecting a better fit. A multi-input, single-output random forest regression model was developed to evaluate the contributions of the NDVI, MNDWI, NDBI, SUHI, GDP, and population to EC. These variables were used as feature predictors to estimate EC and identify the most influential factors for subsequent regression analysis.
2.6.2. Mediation Effect Analysis
To explore the mediating roles of the NDVI, MNDWI, NDBI, SUHI, and EC, this study analyzed the temporal variations in Harbin over the study period. Pearson correlation analysis was used to examine relationships between these variables. Mediation effects were tested using the procedure commonly employed in existing research [
43], in combination with the bootstrap method proposed by Preacher and Hayes [
44], implemented via SPSS 25.0 using PROCESS 4.1 macro. Compared with the traditional causal stepwise regression method used in earlier studies [
45], the bootstrap method offers greater methodological robustness, deeper analytical insights, and improved statistical power. The analysis followed these steps. First, random resampling with replacement was conducted based on the total sample size to generate bootstrap samples. Second, path coefficients were calculated: coefficient a, representing the effect of the independent variable on the mediator, and coefficient b, representing the effect of the mediator on the dependent variable after controlling for the independent variable. The product ab was then used to represent the indirect (mediating) effect. Finally, this procedure was repeated multiple times to generate a distribution of mediation effects. The 2.5th and 97.5th percentiles of this distribution were used to construct 95% confidence intervals. If the interval excluded 0, the mediation effect was considered significant; if 0 was included, the mediation effect was considered statistically insignificant.
2.6.3. Entropy Method to Calculate a Comprehensive Evaluation Index
To account for the simultaneous changes in multiple factors influencing EC, this study employed the entropy method to construct a comprehensive evaluation index that integrated the main influencing variables for regression analysis. First, the original data were standardized using positive and negative index transformation formulas. In summer, the NDVI and MNDWI exhibited cooling effects. Higher values of these indices corresponded to lower EC, classifying them as negative indicators. In contrast, the NDBI and UHI exhibited warming effects. Higher values were associated with increased EC and thus categorized as positive indicators. In winter, the NDVI and UHI were treated as negative indicators, whereas the MNDWI and NDBI were considered positive indicators. Next, the entropy weight method was applied to determine the weight of each index. Finally, a comprehensive evaluation index was calculated as the weighted sum of the standardized values and their corresponding entropy-derived weights. The equation is presented as follows:
where
S is the comprehensive evaluation index,
W is the weight of a certain influencing factor, and
X′ is the standardized value after dimensionality reduction of the original data.
2.6.4. Regression Analysis
To further investigate the potential nonlinear relationship between the Comprehensive Evaluation Index of the Urban Thermal Environment and EC, this study employed a spline regression model for modeling and analysis. Compared with traditional linear regression, spline regression allows for flexible fitting of trends within different intervals by introducing piecewise polynomial functions over continuous variables. This method does not require a predefined functional form and is well suited for capturing complex nonlinear relationships with unknown structures. Combined with the research objectives, data characteristics, and modeling requirements of this study, spline regression has certain advantages. First, spline regression provides a flexible yet stable approach to capturing nonlinear relationships, allowing precise control over the smoothness through predefined degrees of freedom. Second, given the relatively small sample size, spline regression reduces the risk of overfitting compared to more complex models such as Generalized Additive Models (GAMs). Finally, the spline model enables further coefficient interpretation and the estimation of average marginal effects, which better quantifies the main findings.
Given that the relationship between the urban thermal environment and EC may exhibit characteristics such as threshold effects or nonlinear inflection points, the use of quadratic B-spline functions enables smooth and continuous curve fitting while preserving high interpretability. To enhance model stability, this study employed a spline function with two degrees of freedom. Additionally, GDP and population size, both standardized, were included as control variables to account for and eliminate the potential influence of broader macroeconomic factors on EC.
3. Results
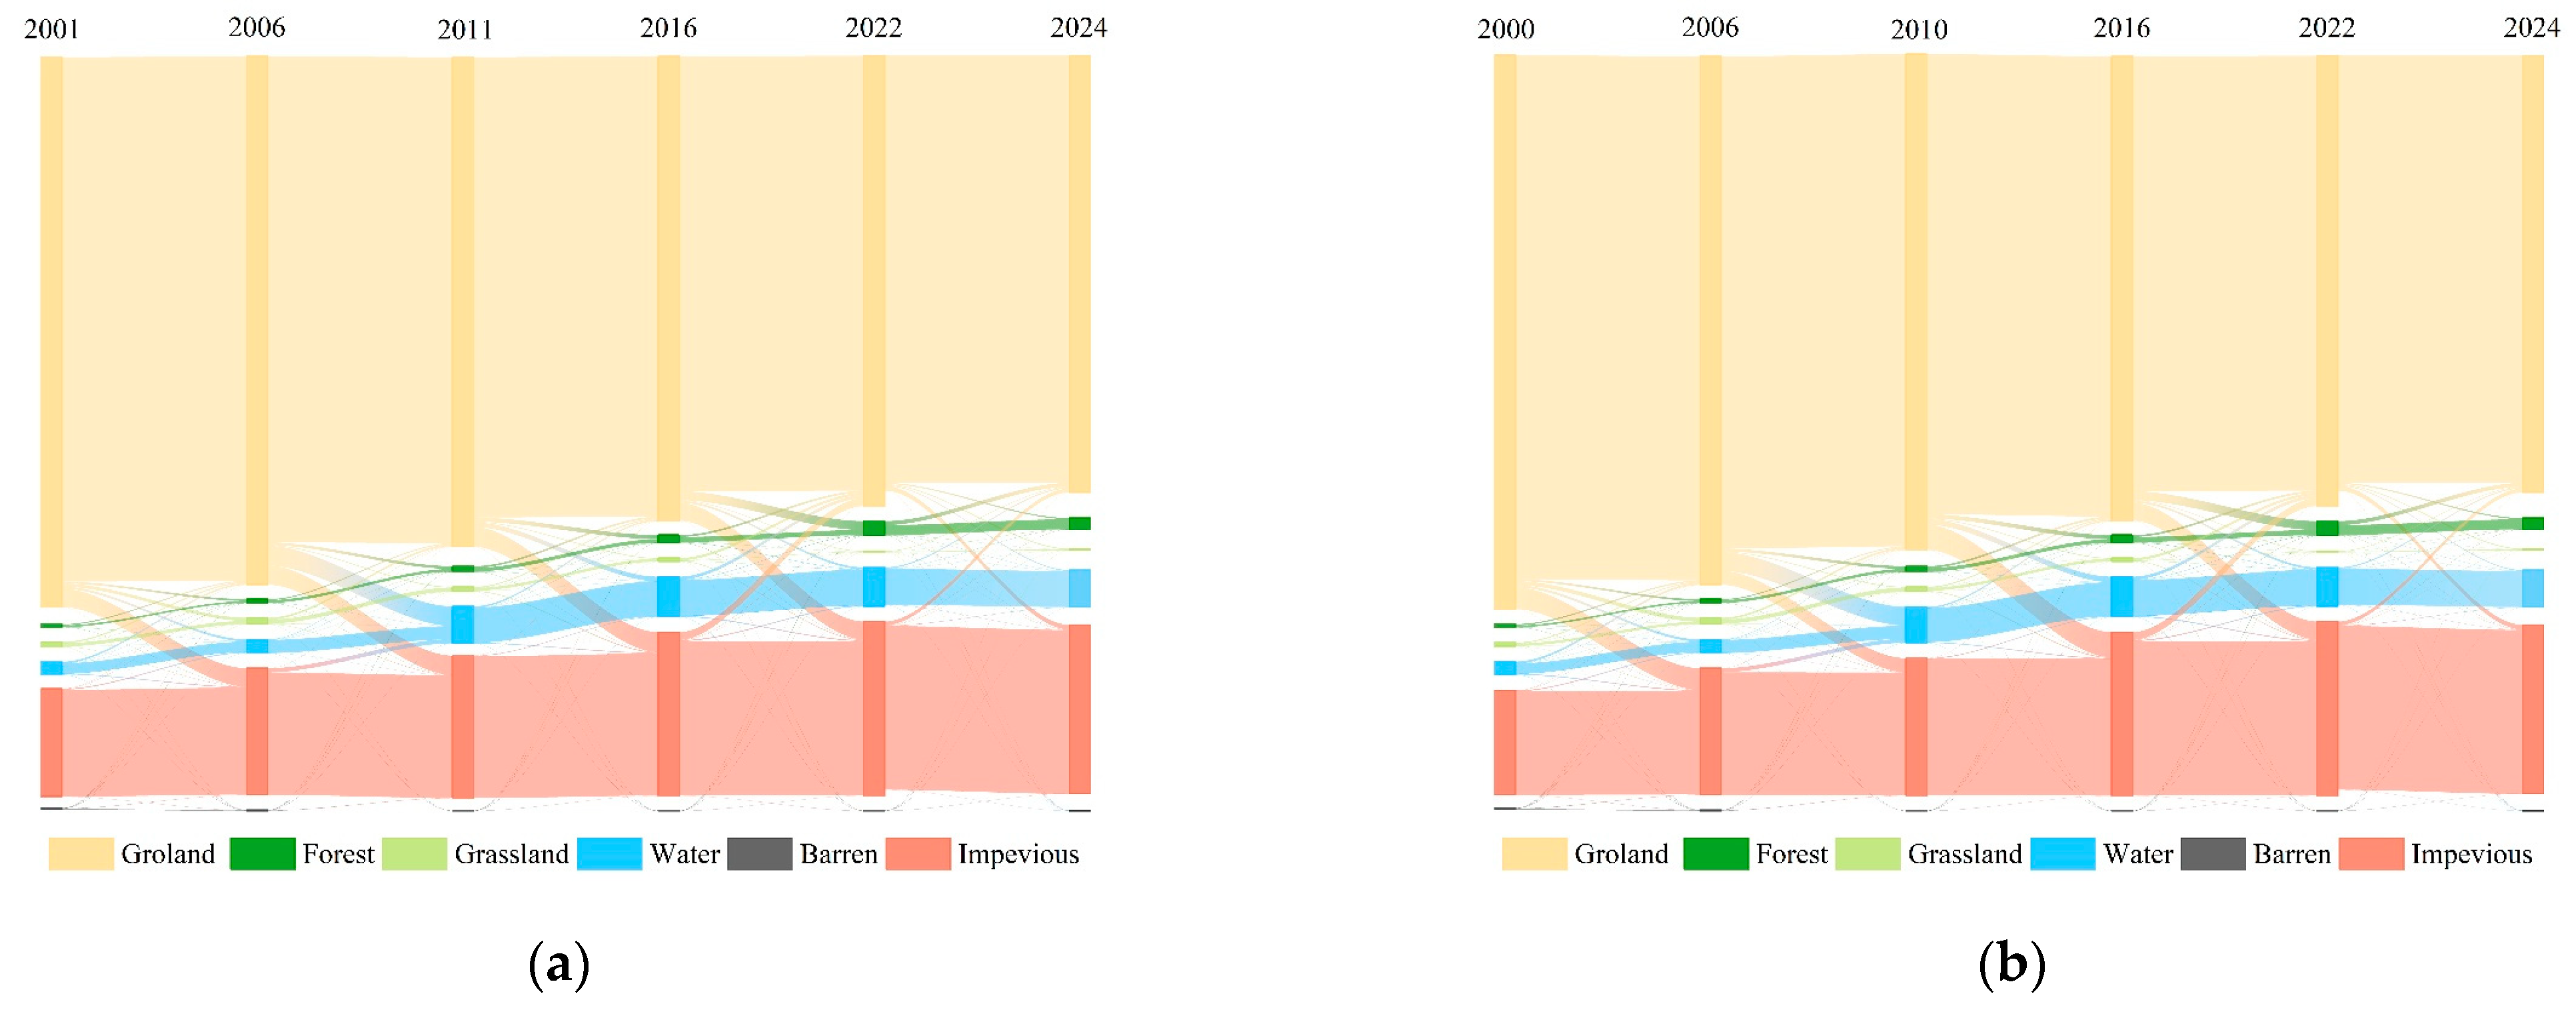
3.1. LULC Changes
Figure 4 illustrates the changes in land use types from 2000 to 2024, revealing increases in impervious surfaces, water bodies, and forest land over this period. The most significant growth in impervious surfaces occurred between 2010 and 2016, whereas water bodies experienced the greatest expansion from 2006 to 2011. During the 25-year study period, cultivated land and grassland exhibited decreasing trends. Cultivated land experienced the largest decline, with the most substantial reduction occurring between 2006 and 2011, whereas the loss of grassland was comparatively minor. Notably, the largest portion of the cultivated land was converted to impervious surfaces during this period.
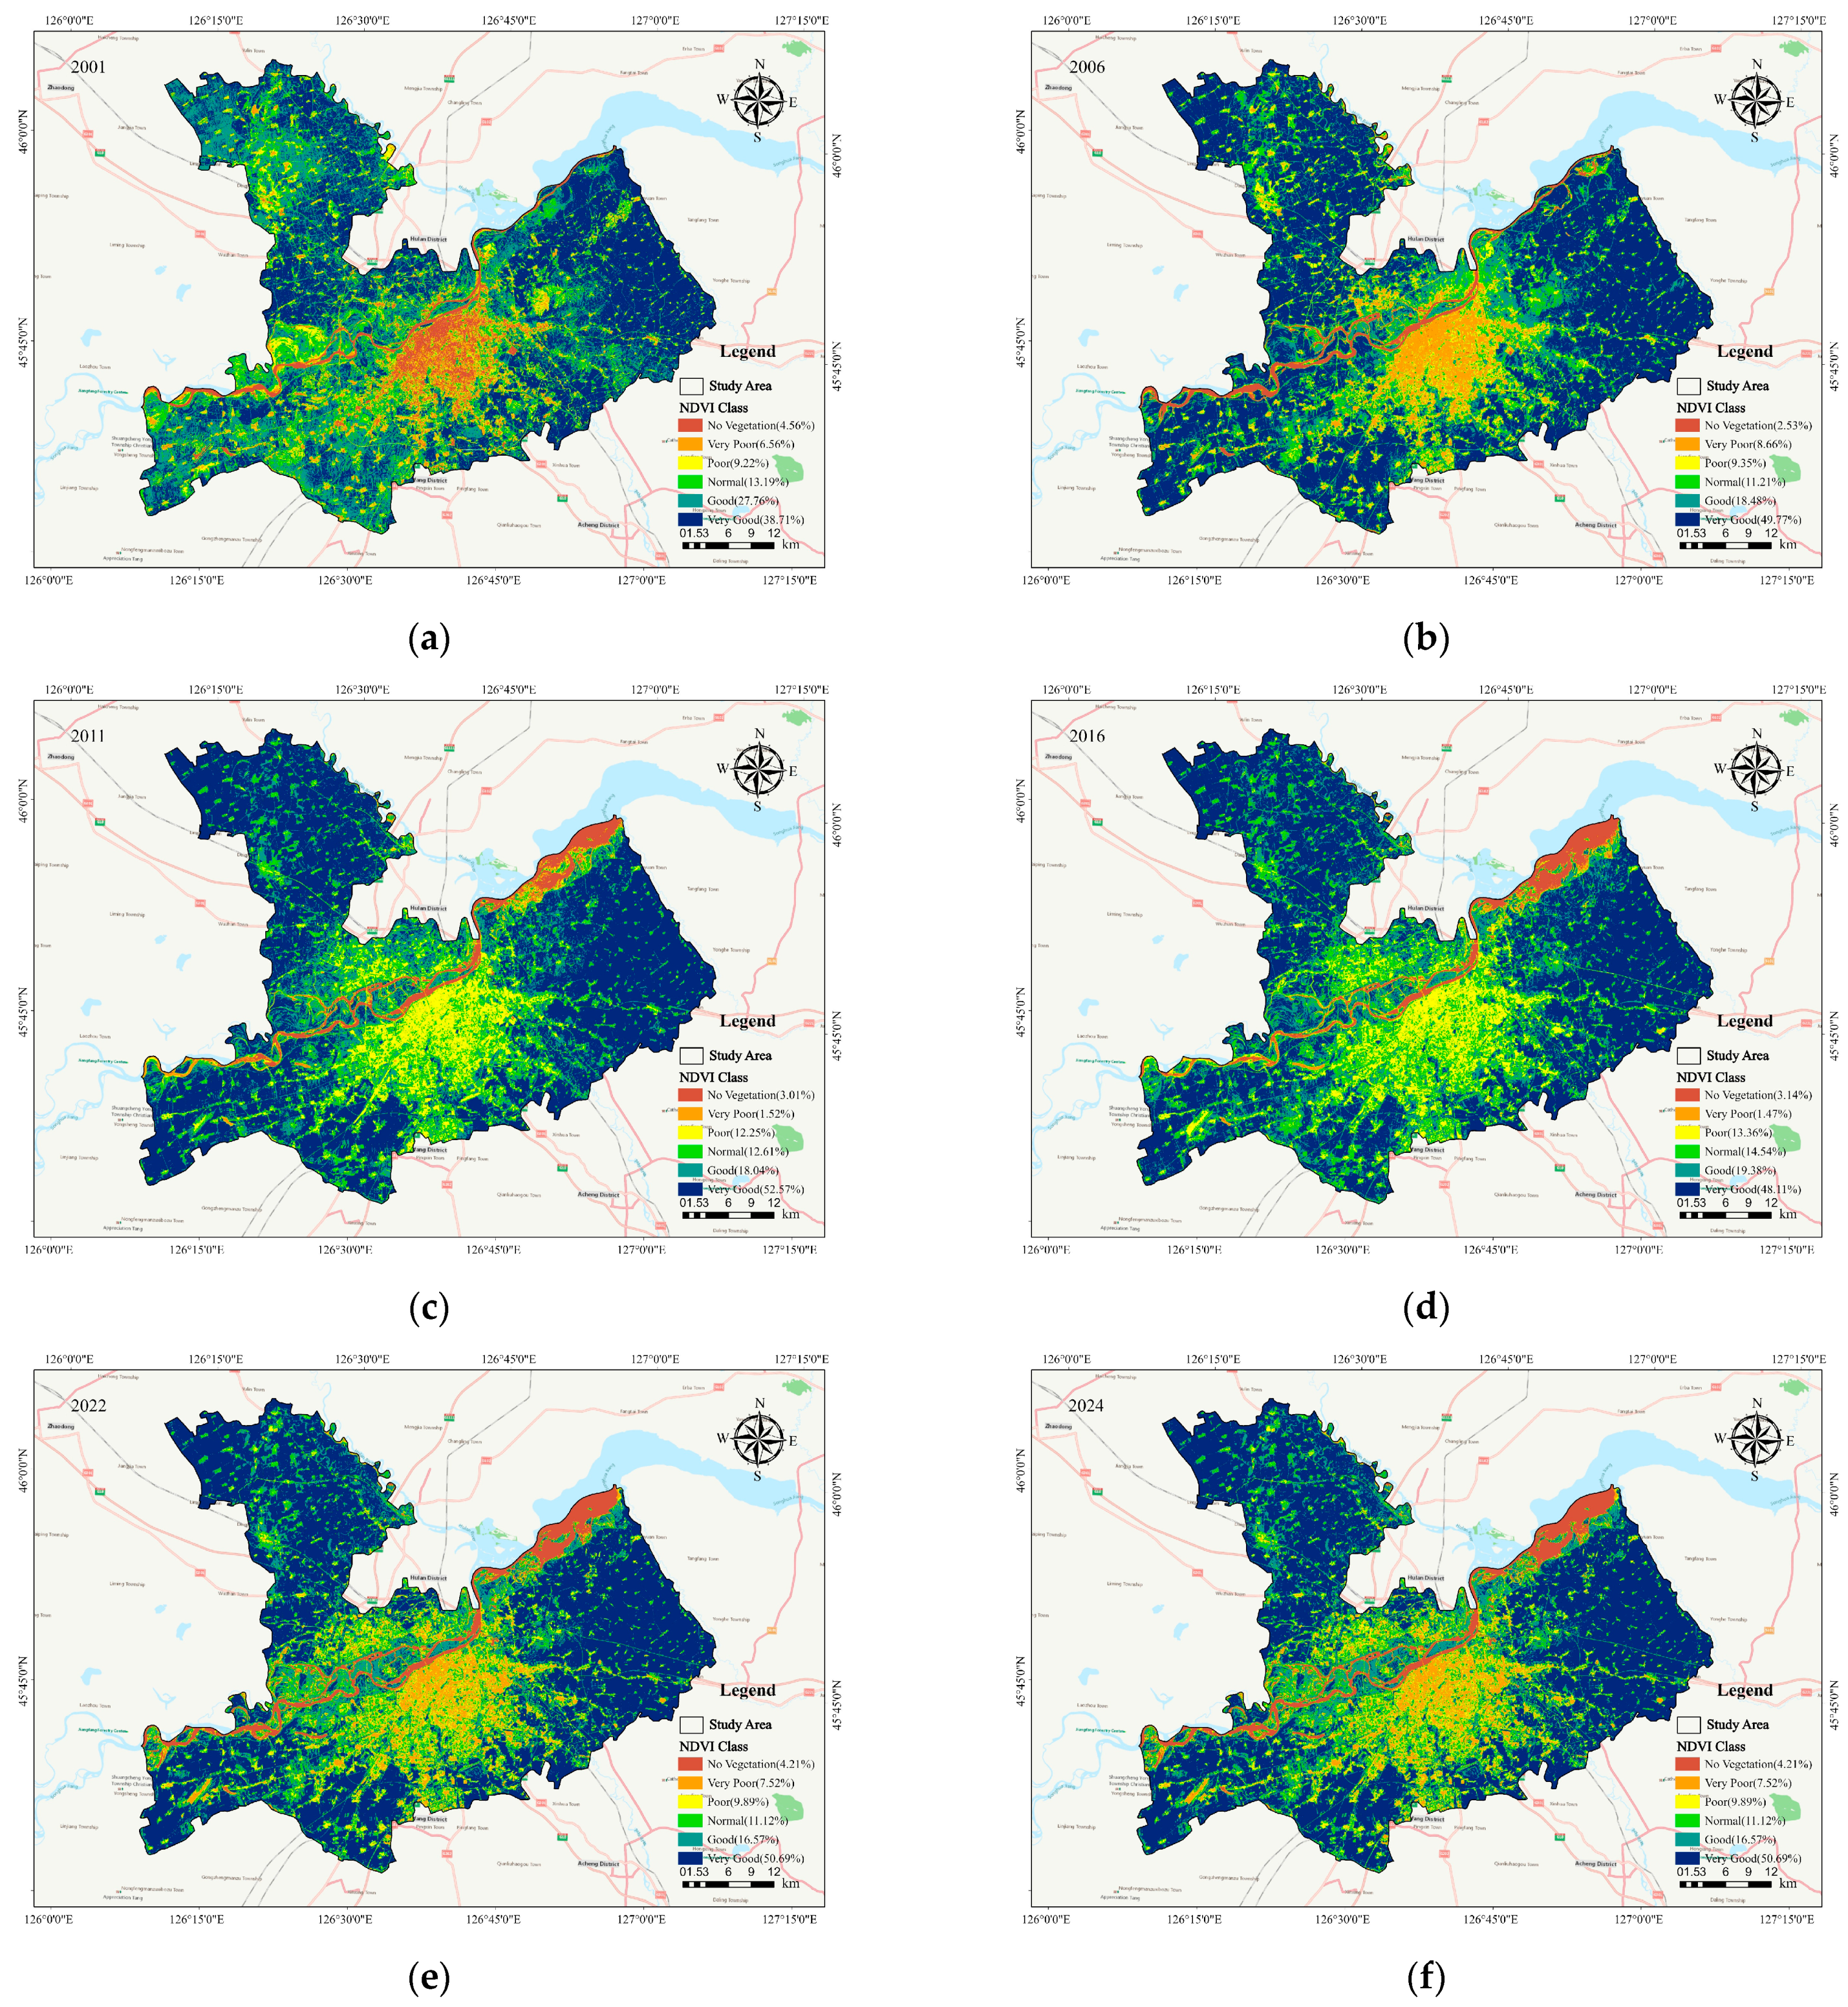
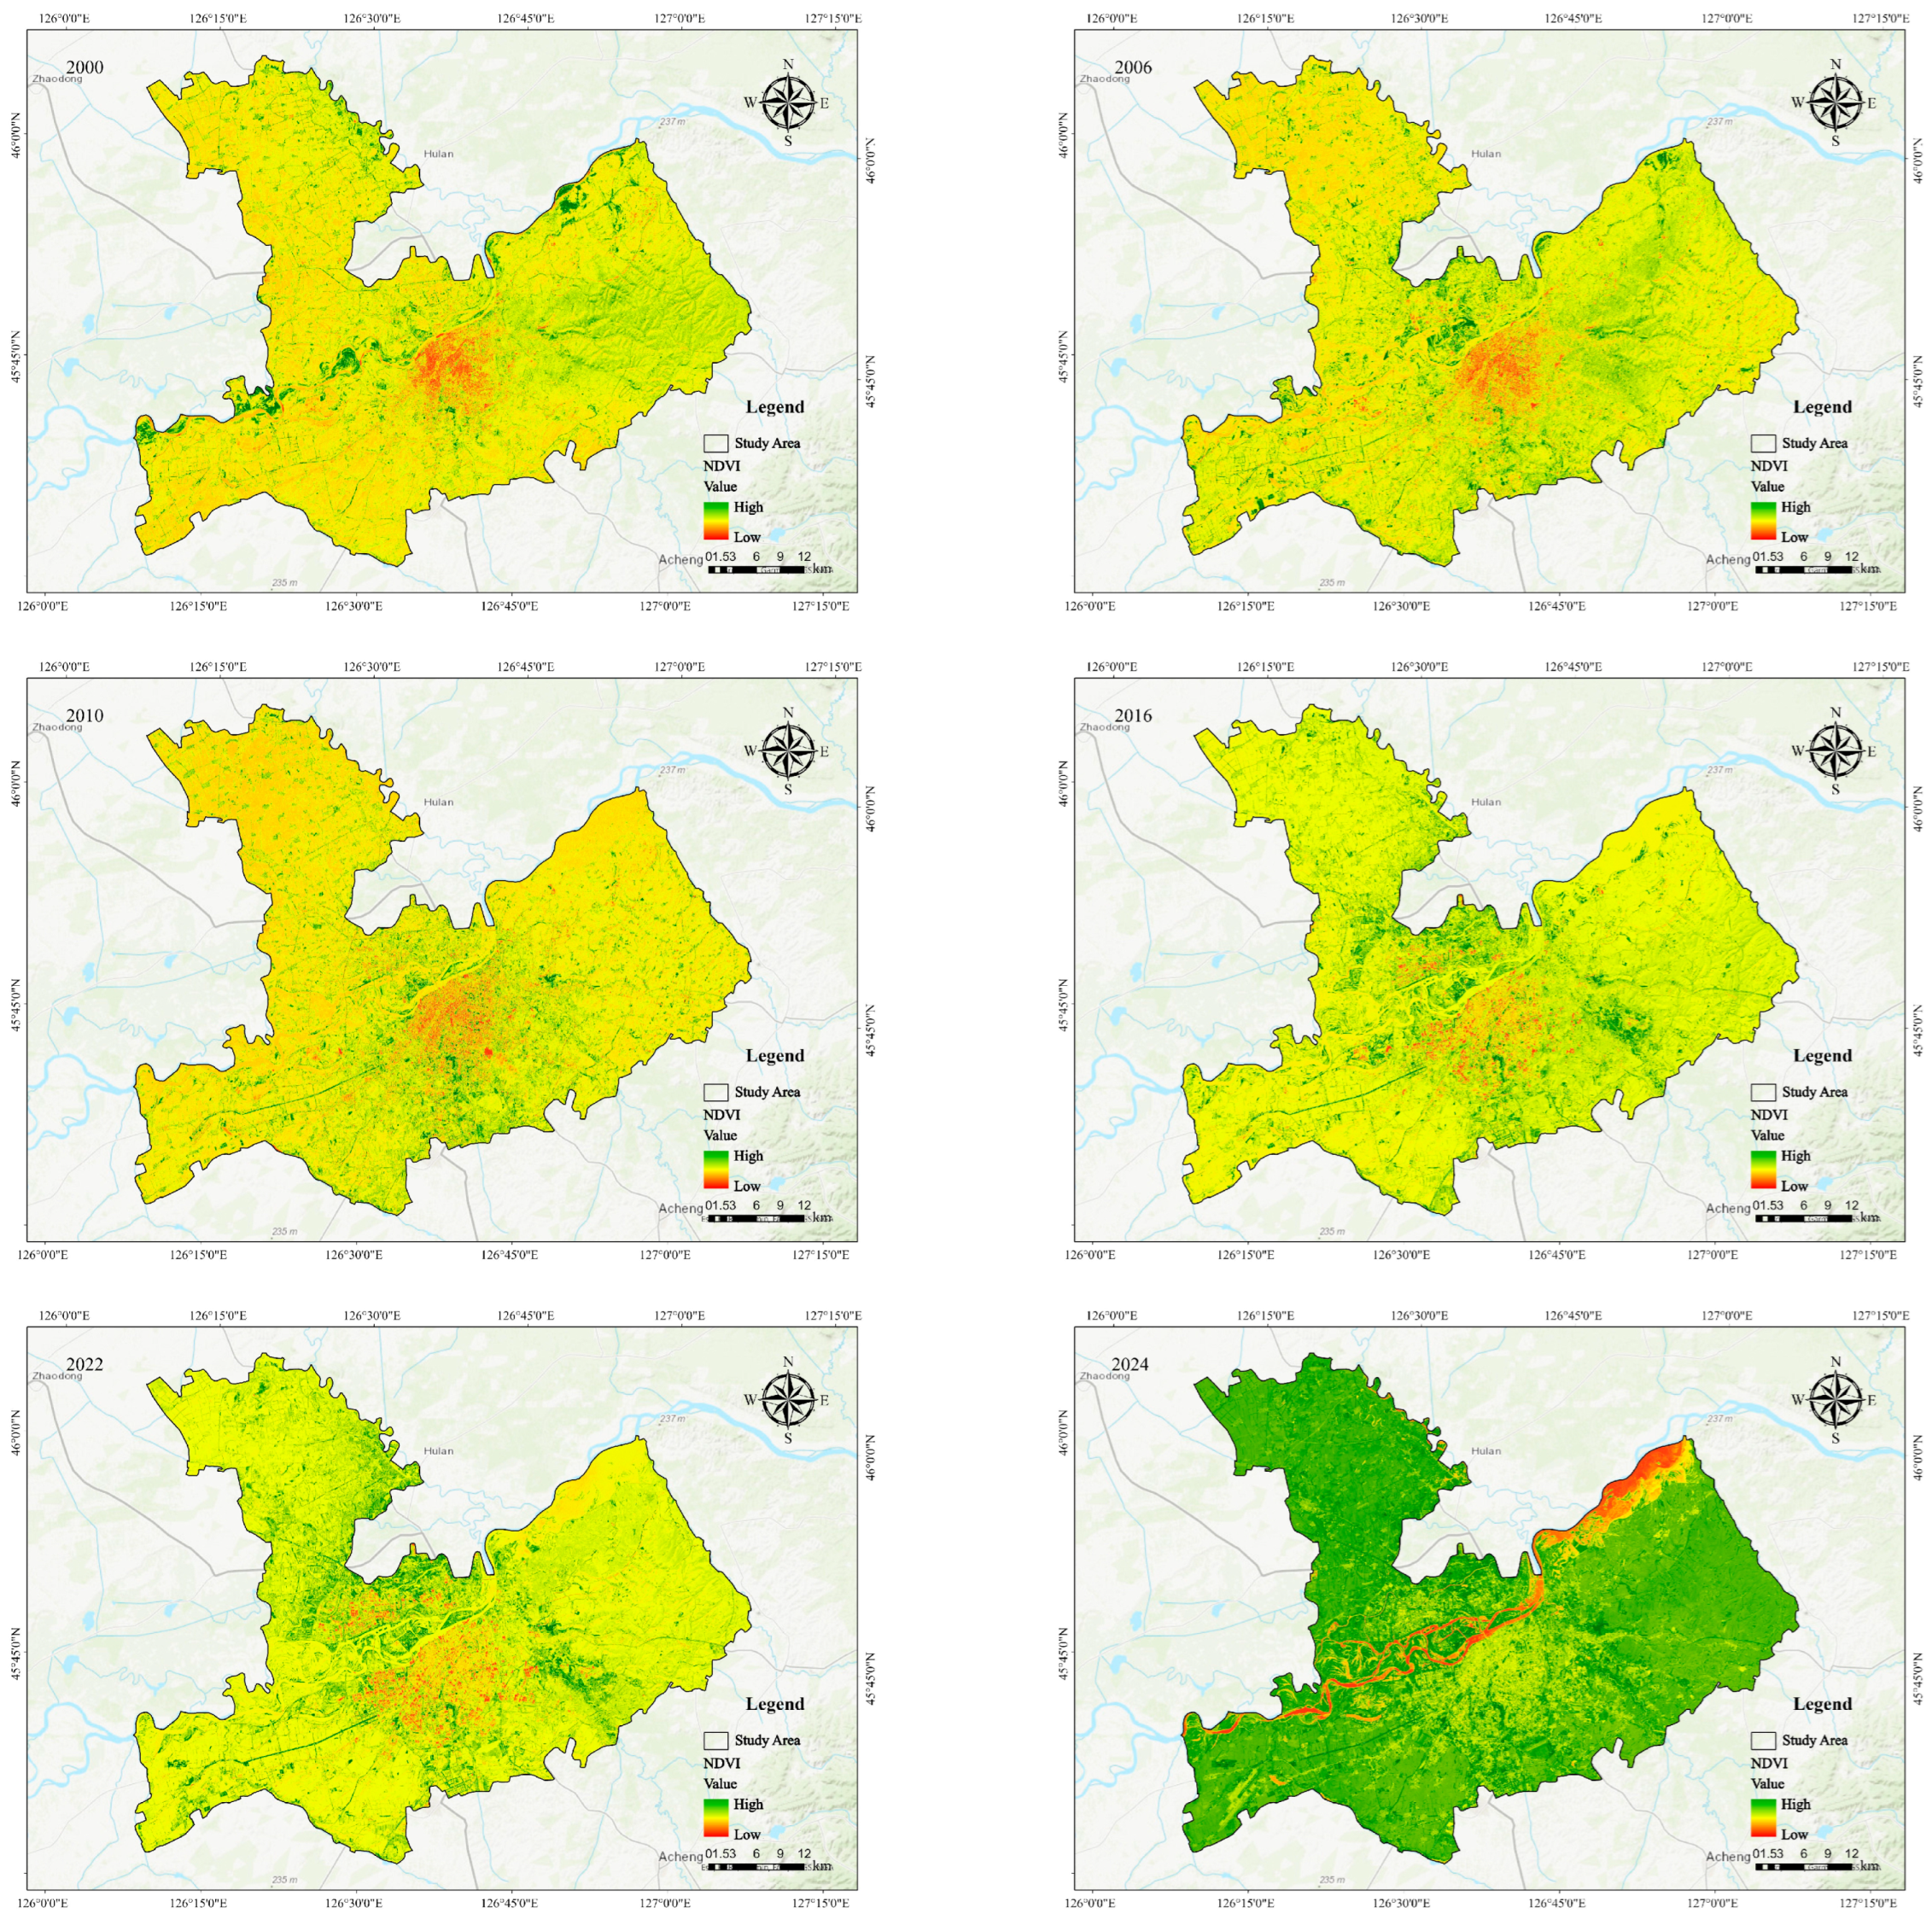
Figure 5a–f present the summer NDVI distribution map of Harbin’s main urban area, highlighting fluctuations in vegetation coverage over the past 25 years. The summer NDVI was categorized into six classes: no vegetation, very poor, poor, normal, good, and excellent. In contrast, Harbin’s winter NDVI values, generally ranging from 0.02 to 0.04 (
Figure 5), exhibited minimal fluctuation, making the summer classification unsuitable for winter vegetation observations. Thus, winter NDVI values were divided by color only. In 2001, the excellent NDVI area in Harbin during summer accounted for 38.71% of the study area (
Figure 5a). From 2001 to 2024, this excellent area increased steadily, reaching 50.69% in 2024. During the same period, the area classified as having no vegetation or very poor conditions increased by 5.5%, primarily because of the expansion of water bodies. The winter vegetation cover distribution from 2000 to 2024 mirrored that of summer, with low values concentrated in urban areas and high values in surrounding regions (
Figure 6). Over the past 25 years, Harbin’s NDVI generally exhibited an upward trend, with a summer growth rate of 4.55%.
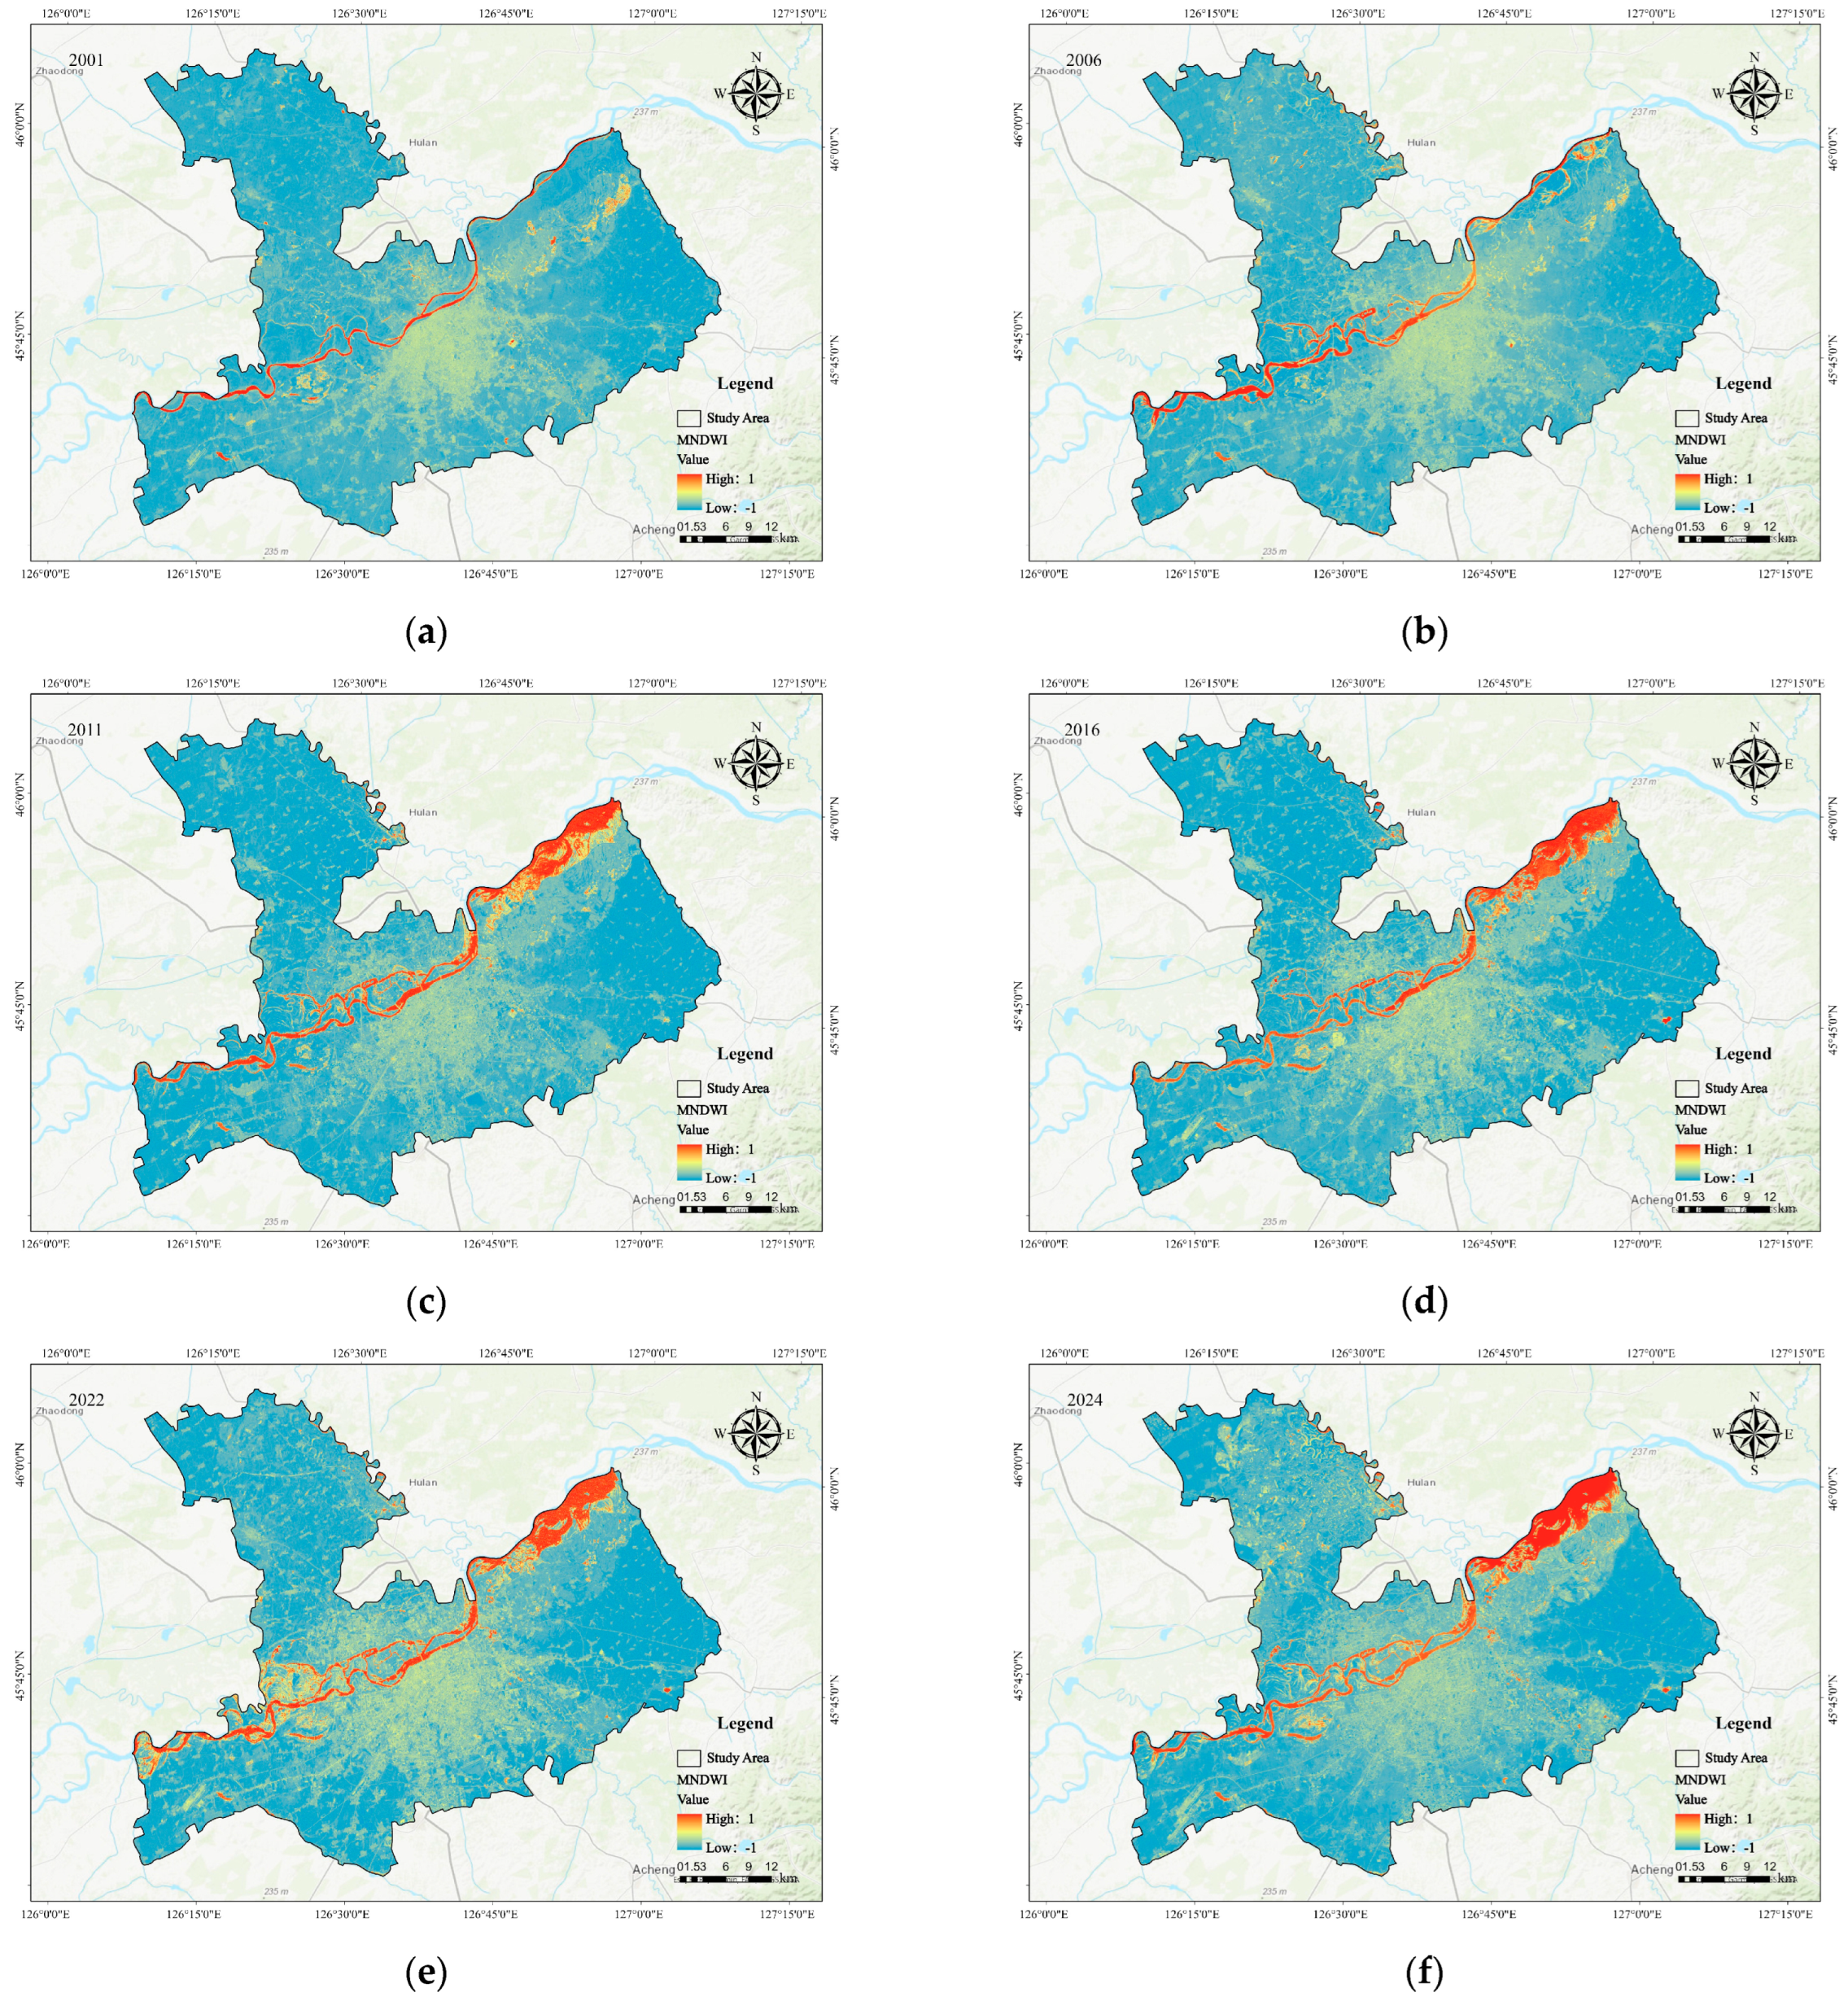
Figure 7a–f present the spatial distribution of the MNDWI in the main urban area of Harbin, illustrating fluctuations in water coverage over the past 25 years. The areas shaded in red indicate MNDWI values greater than 0, which theoretically correspond to water bodies. The water coverage in Harbin is primarily concentrated along the river basin, which runs east–west through the city. From 2001 to 2024, the eastern section of the river showed steady expansion. The mean MNDWI values in summer for the years 2000–2024 were −0.423, −0.413, −0.389, −0.378, −0.380, −0.369, and −0.367, respectively. Overall, the MNDWI in Harbin showed an increasing trend, with the largest increase of 5.8% from 2006 to 2011.
Figure 8a–f illustrate the spatial distribution of the NDBI in the main urban area of Harbin, reflecting the changes in built-up areas over the past 25 years. Areas shaded in dark yellow indicate NDBI values greater than zero, which theoretically represents urban land cover. Built-up areas are primarily concentrated in the central part of the city. From 2001 to 2024, urban expansion gradually extended outward from the city center to surrounding areas. Overall, the NDBI in Harbin exhibited an increasing trend during the study period, with the most substantial growth occurring from 2011 to 2016 (a 10.9% increase).
3.2. Assessing LST Distribution and SUHI Effect over the Study Area
Figure A1 illustrates the spatiotemporal variation in the average summer surface temperatures in Harbin’s main urban area from 2001 to 2024, with high-temperature zones represented in red. The spatial distribution of surface temperatures generally showed a decreasing trend from the city center to the suburbs. In the summer of 2022, the temperature difference between the maximum and minimum values was the largest, reaching 9.74 °C.
Figure A2 depicts the temporal and spatial distributions of the average winter surface temperatures from 2000 to 2024, highlighting significant variations. Winter 2000 recorded the lowest surface temperatures, followed by 2016, with the largest temperature difference of 7.55 °C occurring in 2000. Over the past 25 years, Harbin’s average surface temperature exhibited a slight increase in summer and a more pronounced increase in winter.
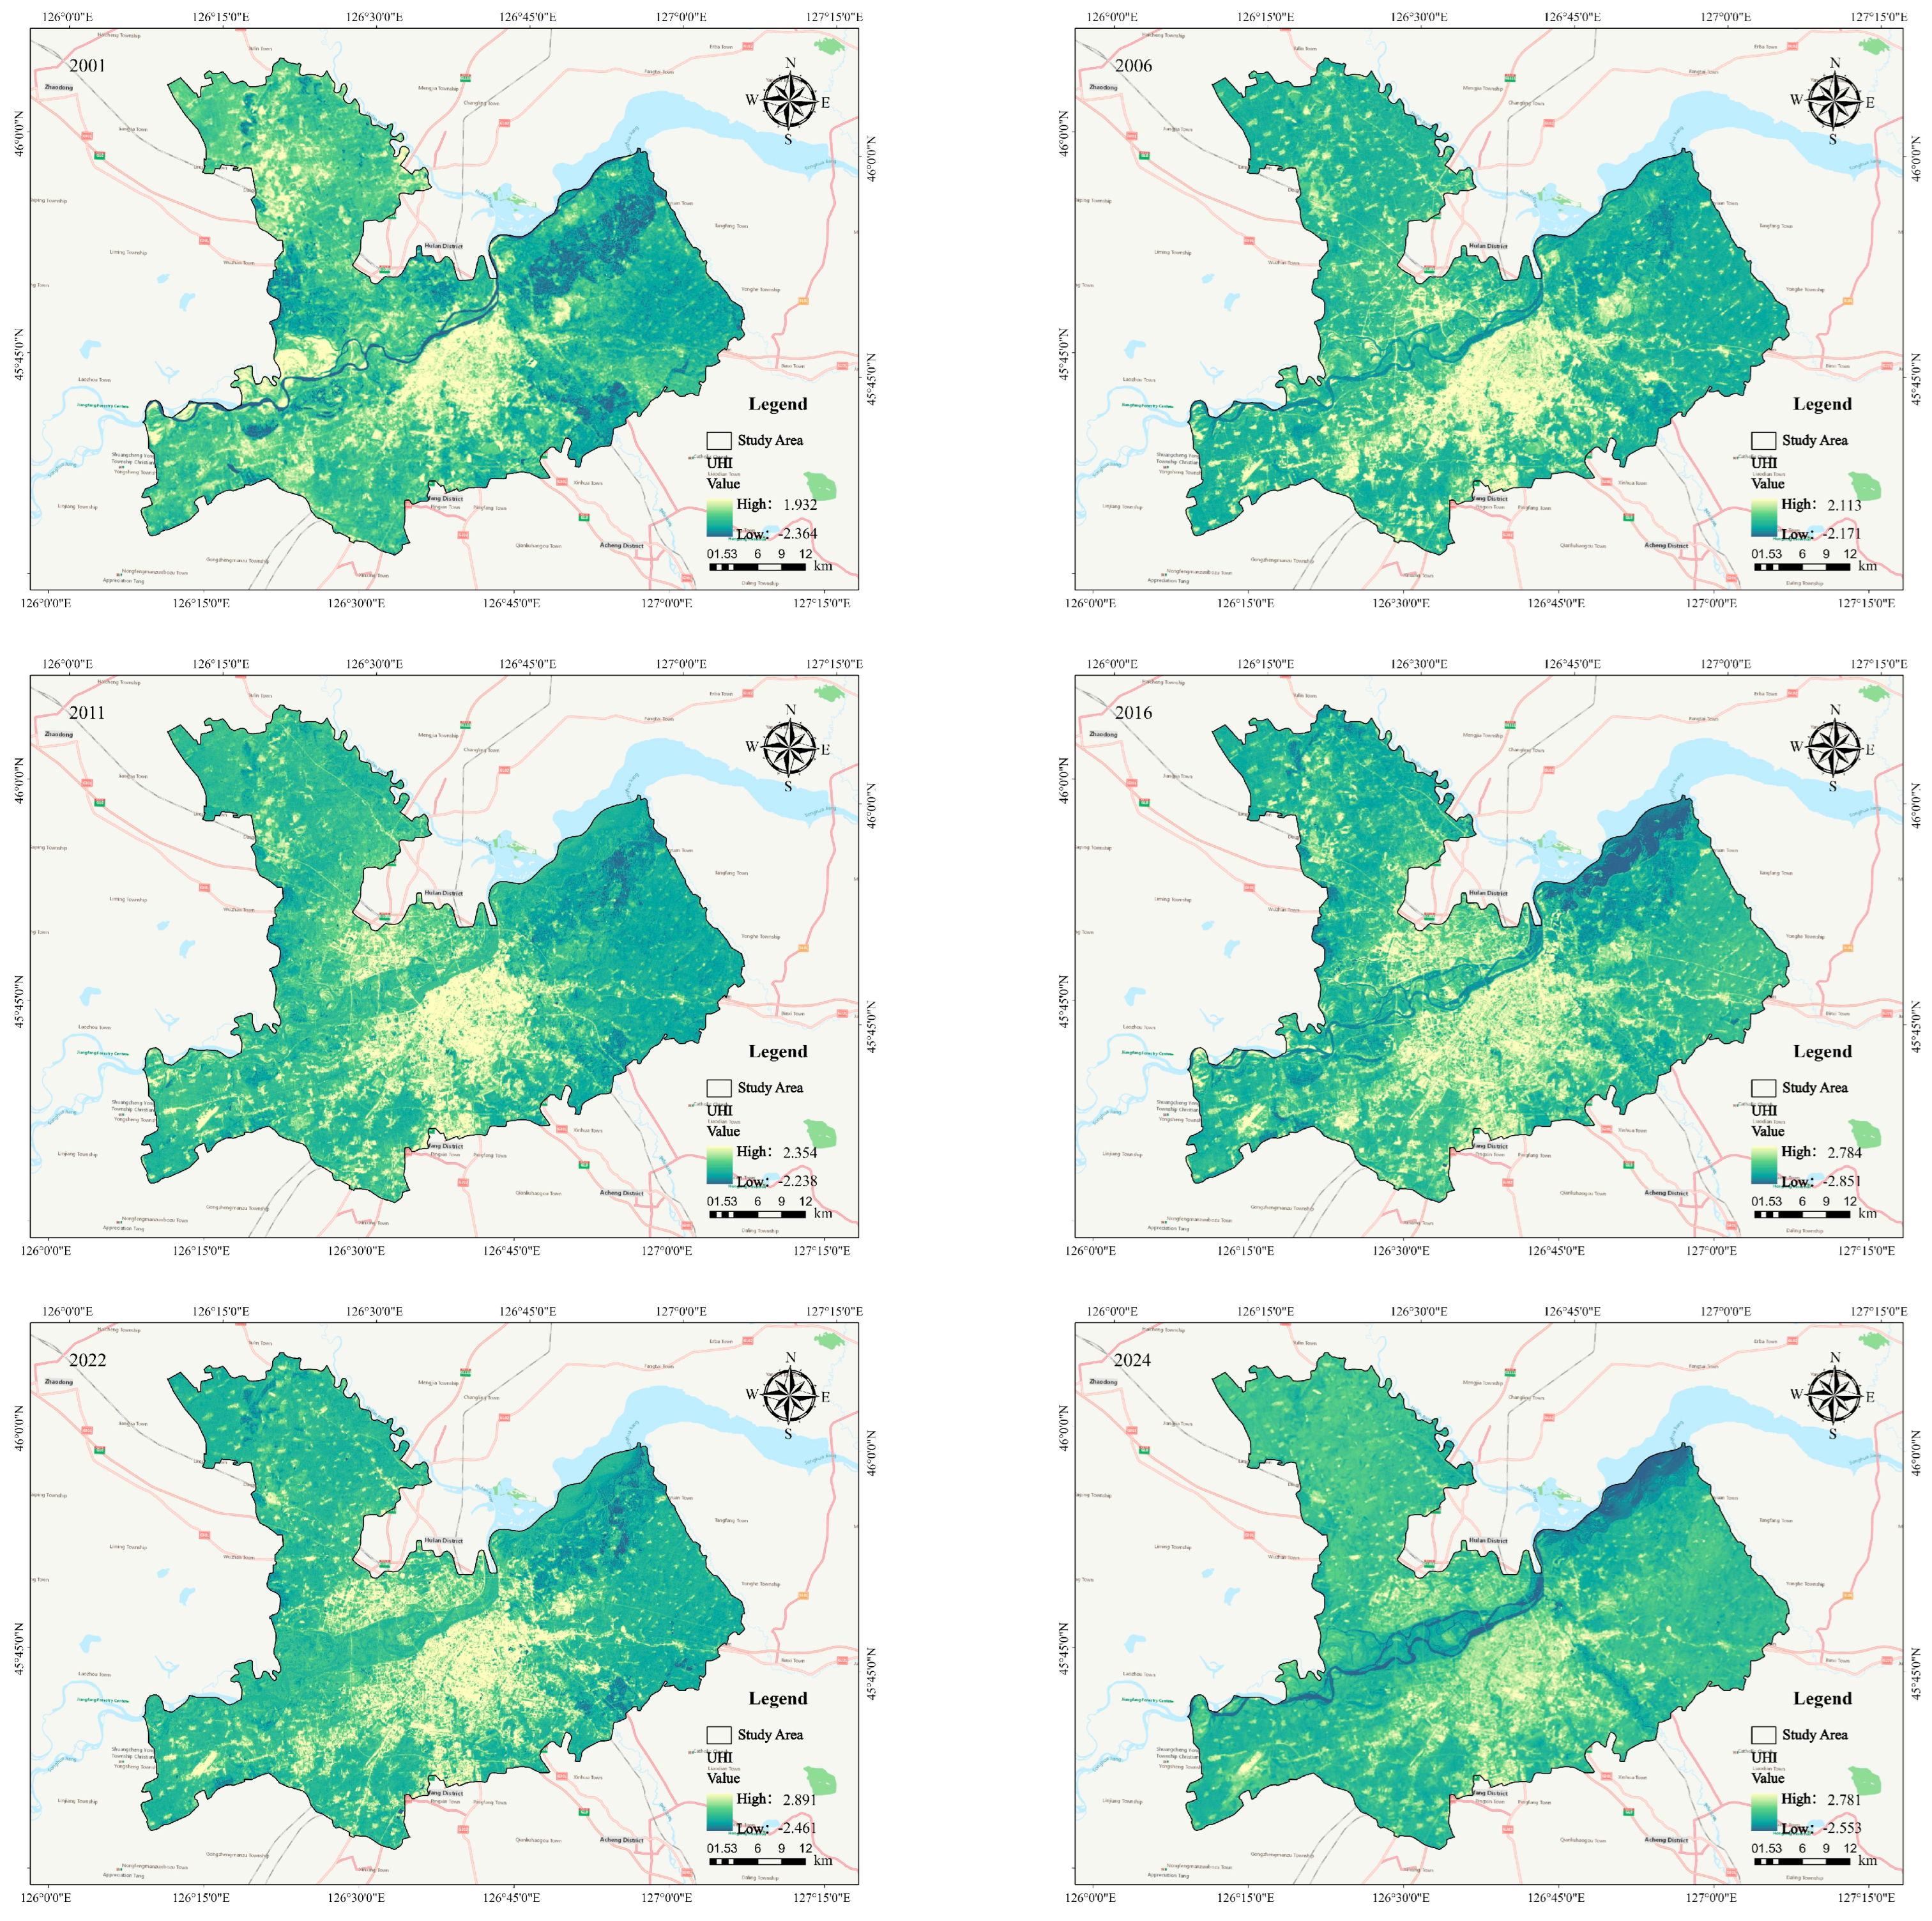
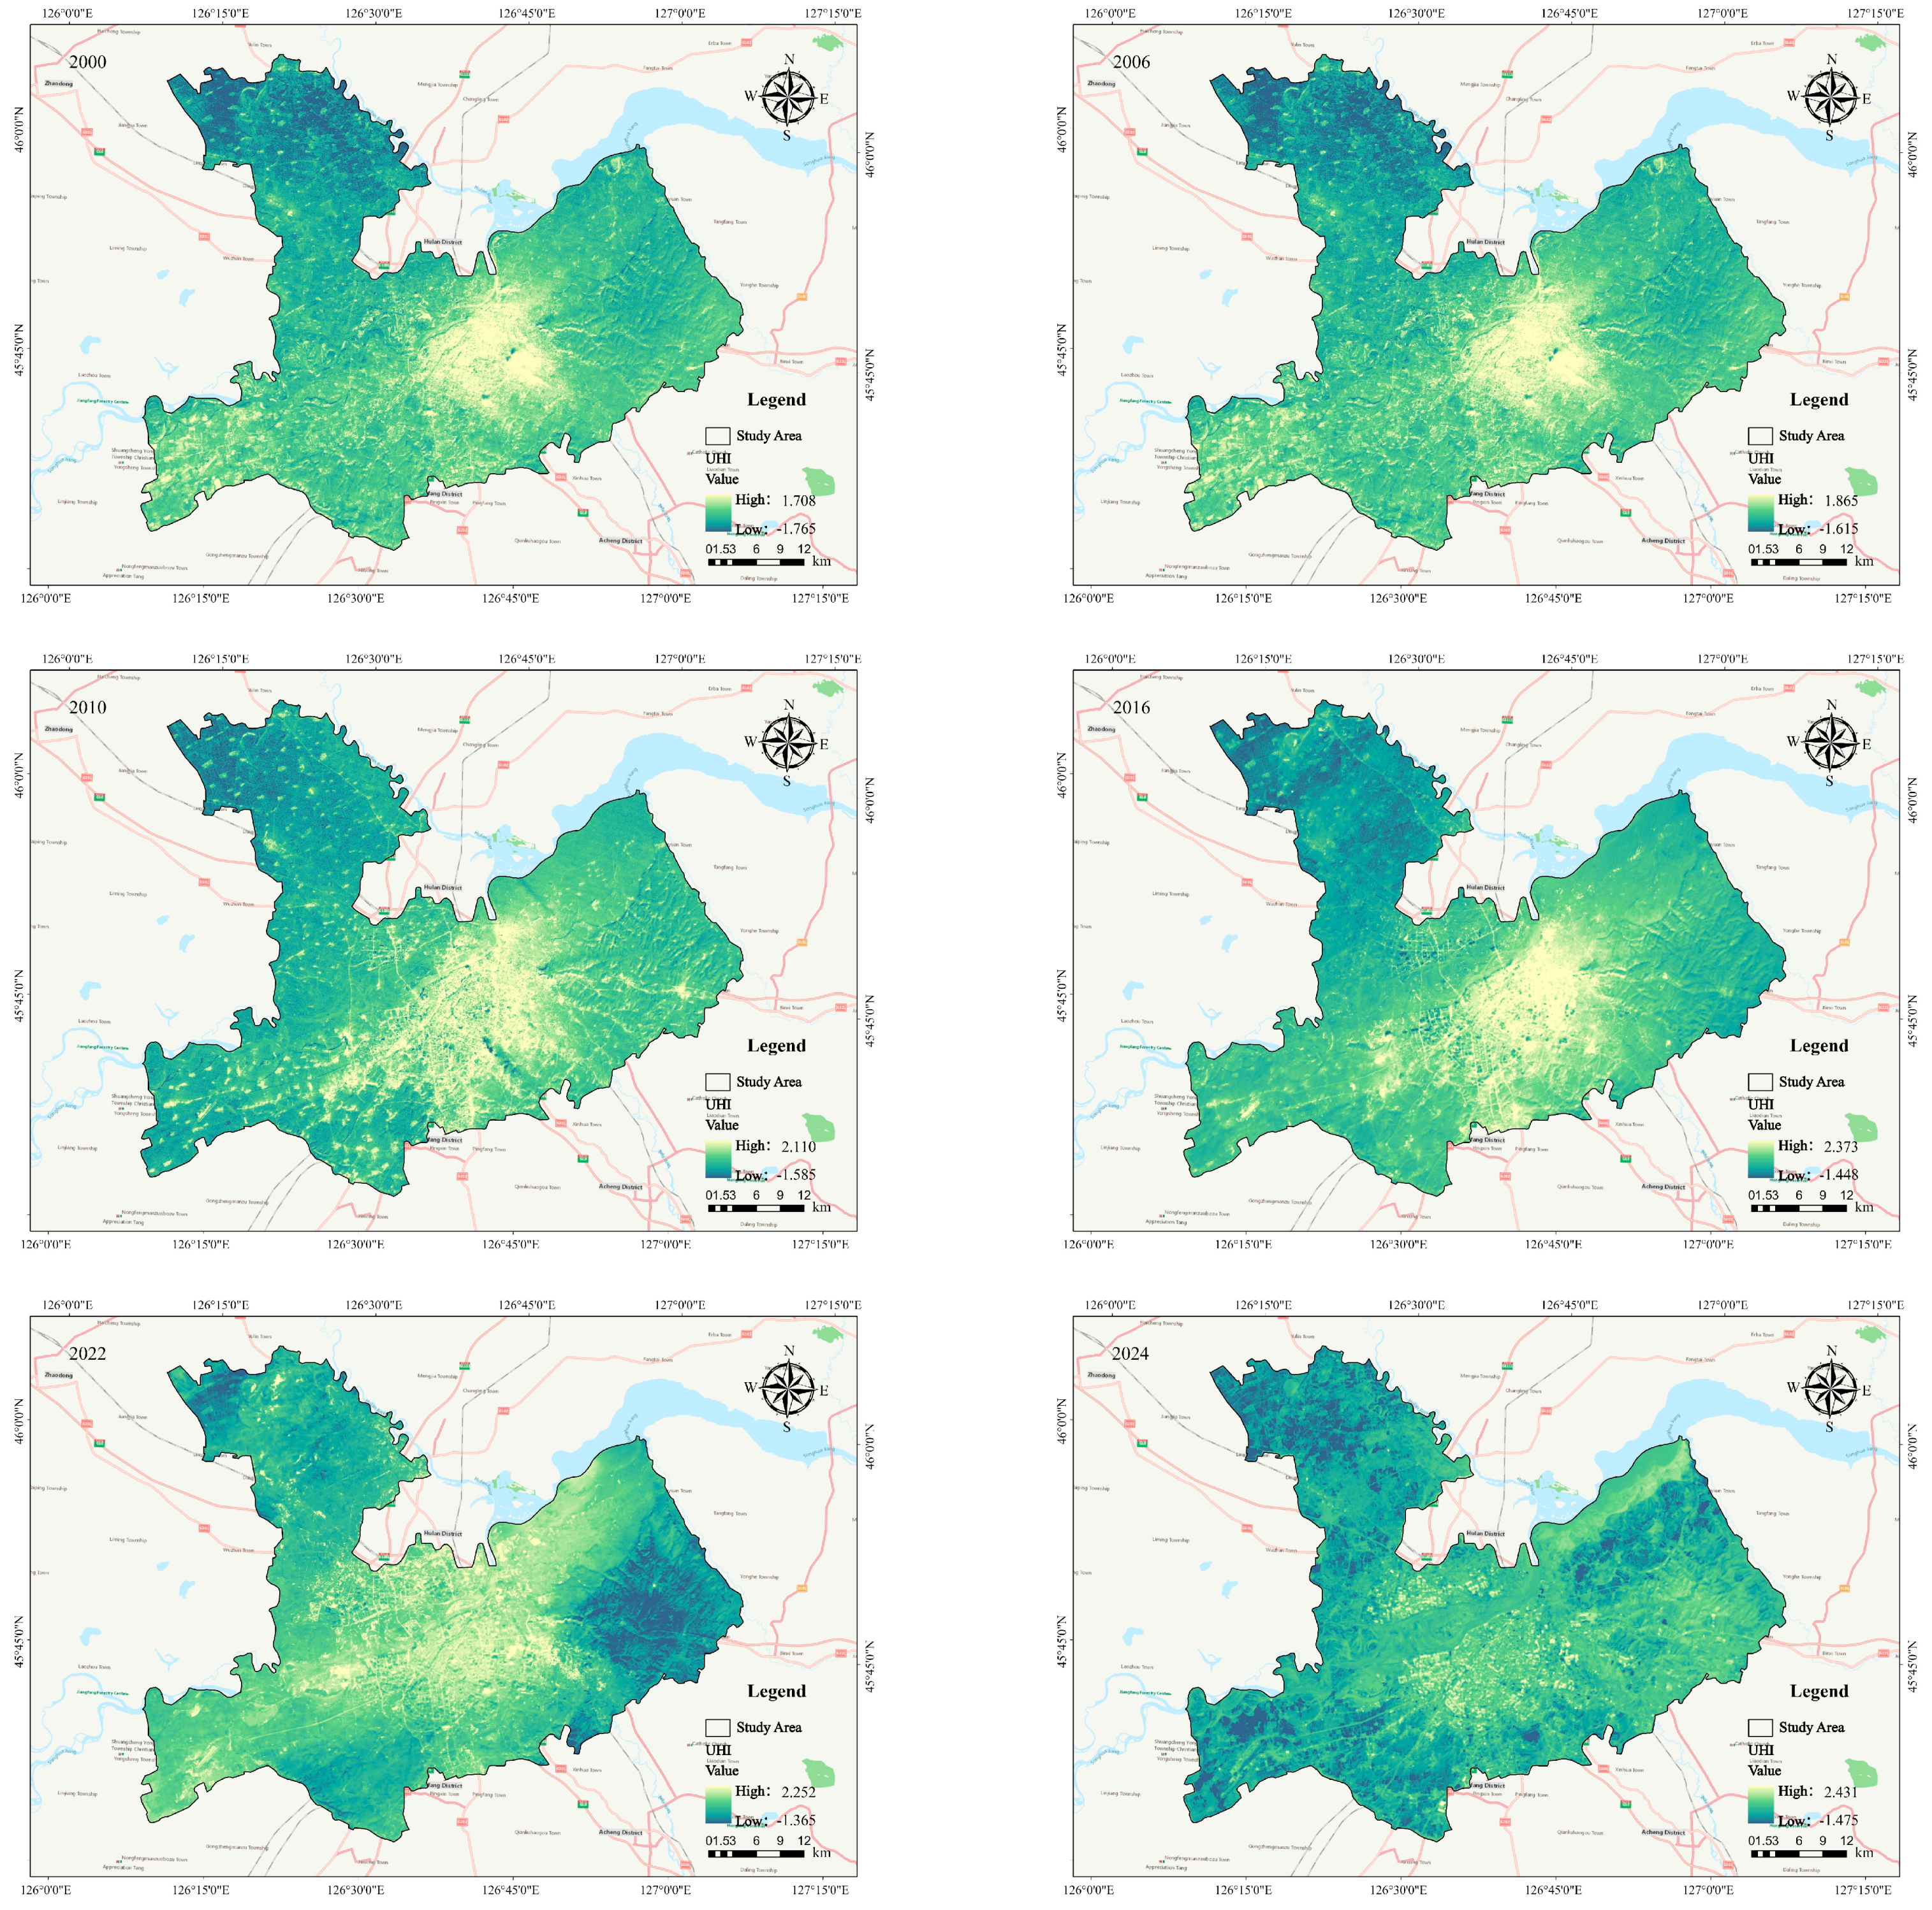
Figure 9 and
Figure 10 depict the urban heat island effect in the study area over the past 25 years. The highest summer urban heat island intensity was recorded in 2022, with a maximum value of 2.891, whereas the lowest was recorded in 2001 at 1.932. Overall, intensity demonstrated a steady upward trend, with the most significant increase (approximately 18%) occurring between 2011 and 2016. The strongest summer heat island effects of Harbin were predominantly concentrated in the city center, with both intensity and spatial extent increasing over time. The intensity decreased with increasing distance from the city center. In winter, the UHI effect tended to be weaker but generally maintained a similar spatial distribution, with the intensity gradually decreasing with distance from the city center.
3.3. Correlation Analysis of Influencing Factors and EC
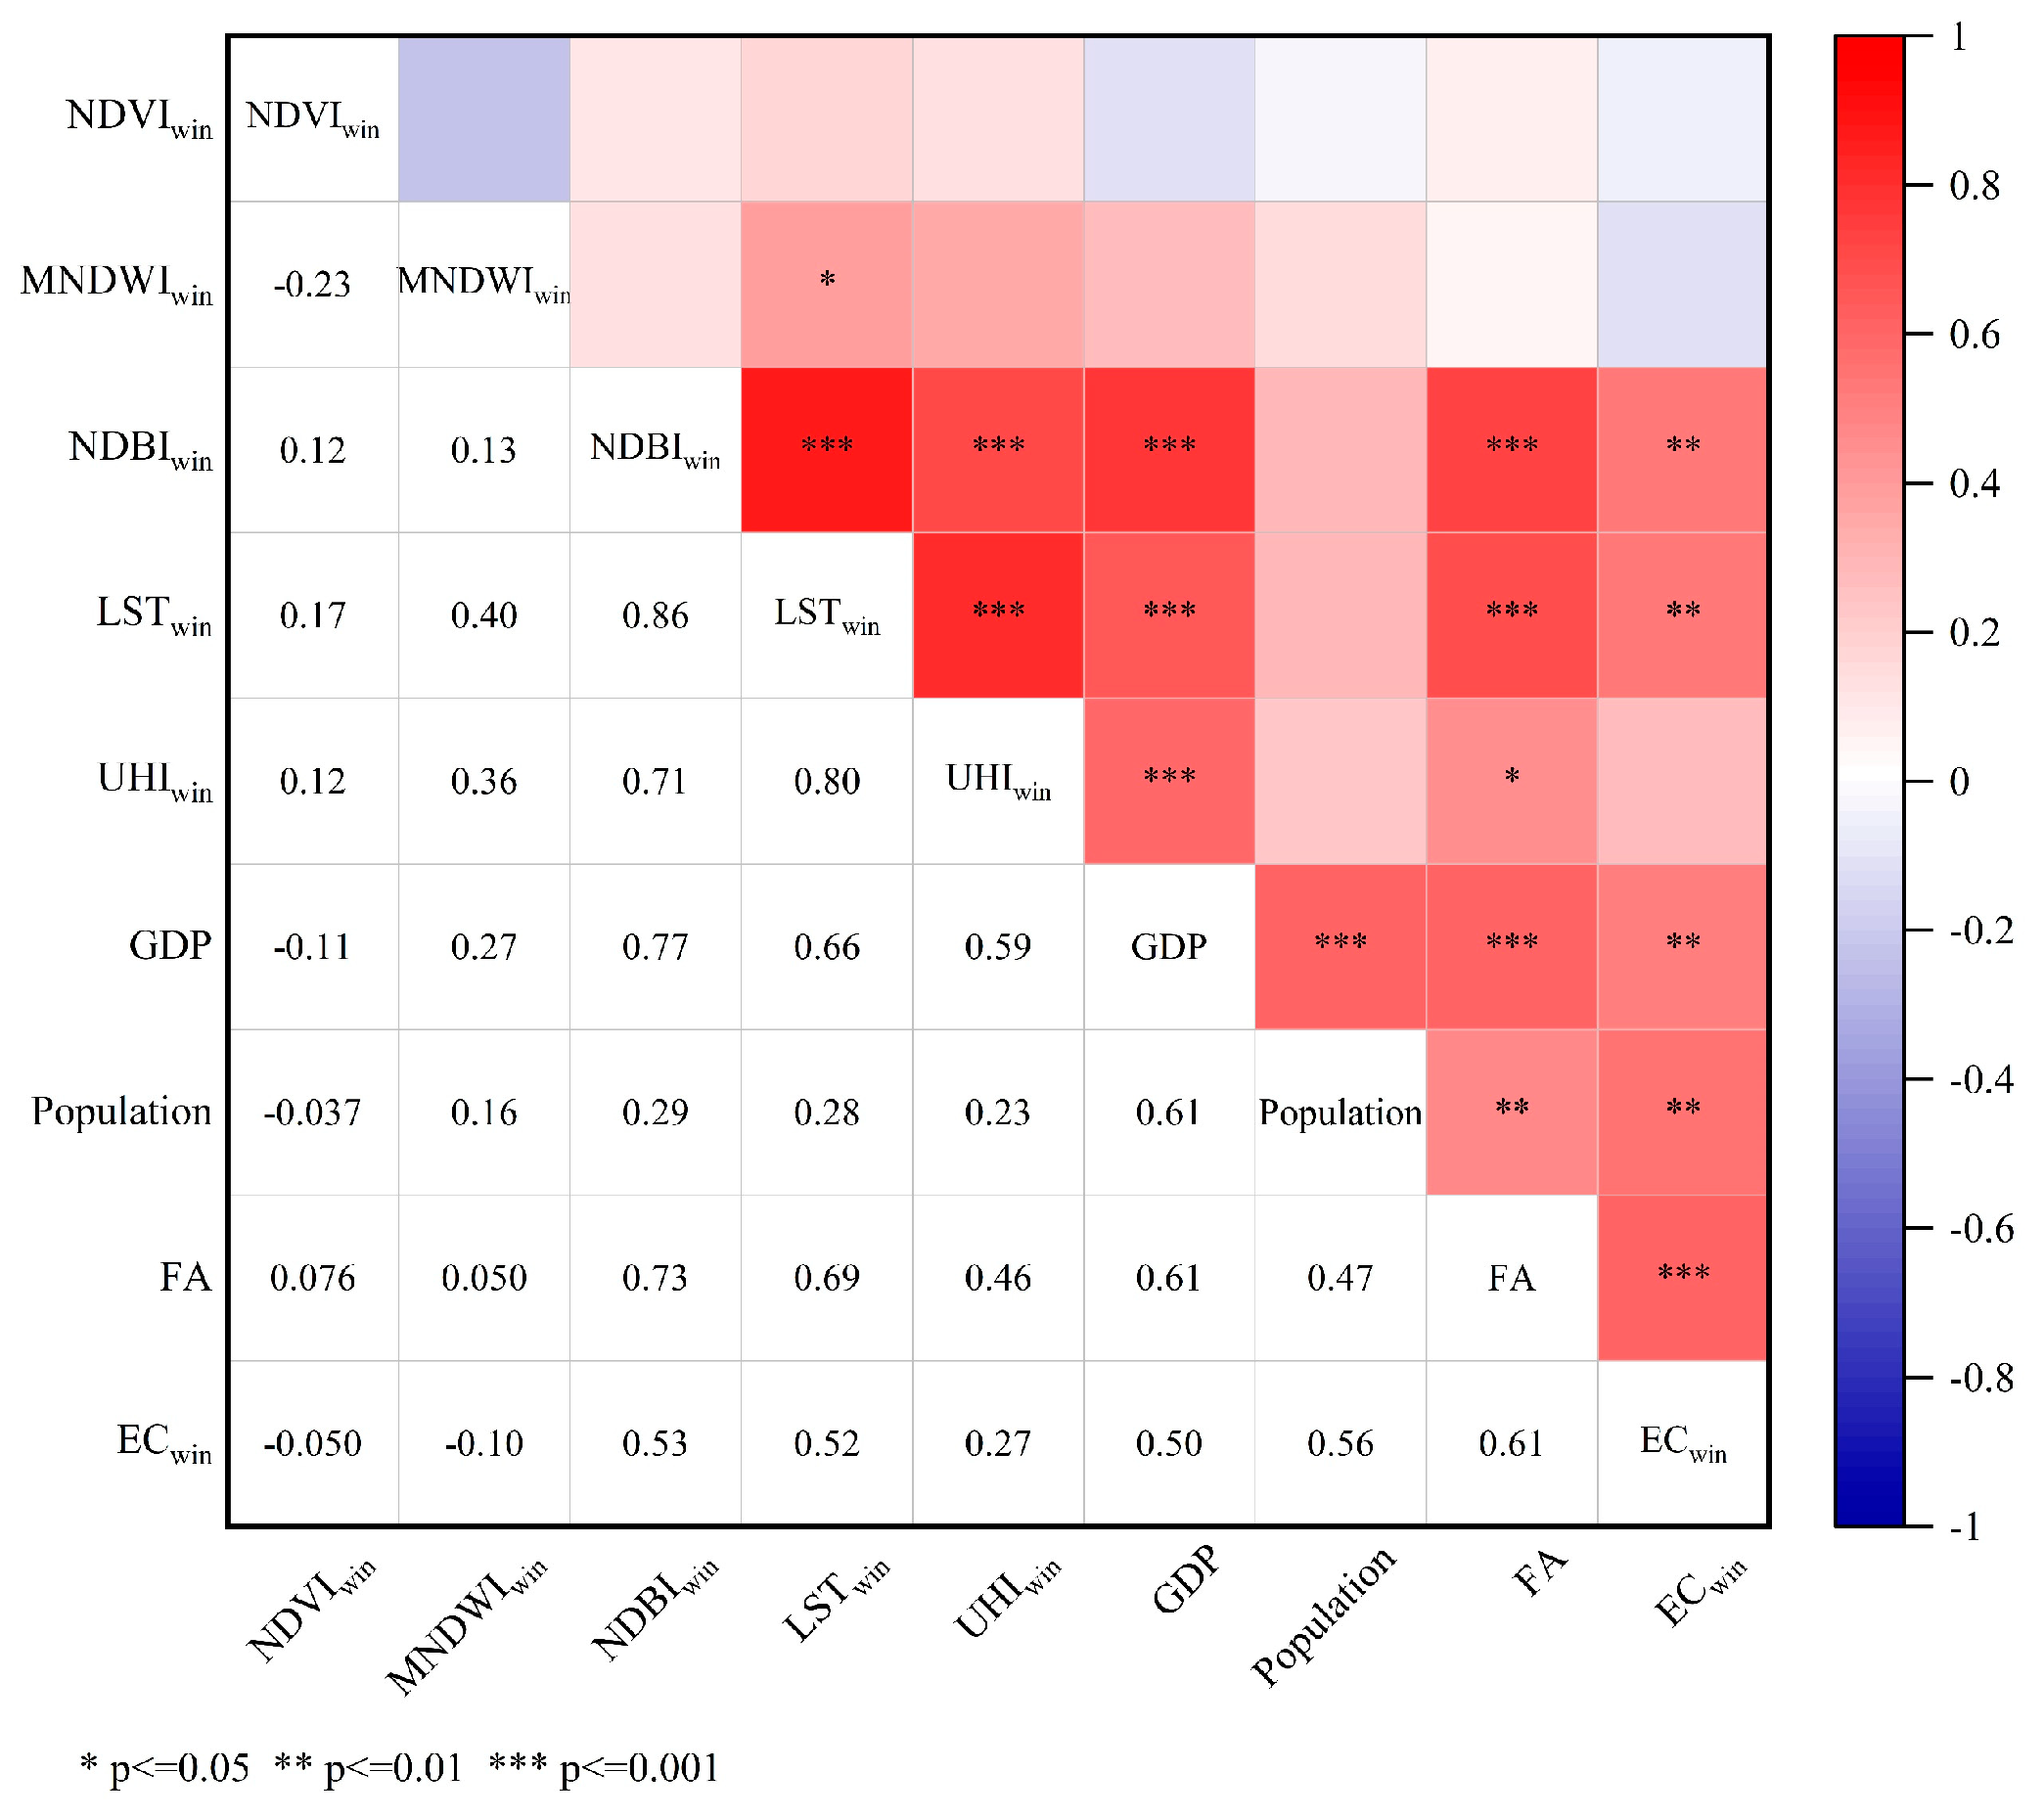
Figure 11 and
Figure 12 present the results of Pearson correlation analyses between the NDVI, MNDWI, NDBI, LST, SUHI, selected socioeconomic factors, and EC, highlighting notable seasonal differences in their relationships. In summer, all variables, except the MNDWI, showed significant correlations (
p < 0.01). The NDVI exhibited strong negative correlations with the surface temperature (−0.63), SUHI (−0.61), and residential electricity consumption (−0.52). In contrast, the NDBI showed strong positive correlations with the surface temperature (0.86), SUHI (0.72), and residential electricity consumption (0.72). The SUHI was also significantly positively correlated with surface temperature (0.84) and residential electricity consumption (0.67). In winter, the NDVI was not significantly correlated with the surface temperature, SUHI, or total energy consumption (which included both residential electricity and heating energy). However, the NDBI remained strongly positively correlated with the surface temperature (0.86), SUHI (0.71), and total energy consumption (0.53). The surface temperature also exhibited significant positive correlations with the SUHI (0.80) and total energy consumption (0.52). The MNDWI did not show statistically significant correlations with any of the examined variables in either season.
3.4. Screening Important Factors Affecting EC Based on Random Forests
Figure 13 compares the predicted EC values from the random forest model with the actual observed data.
Figure 13a shows the results for the summer training set, with an R
2 of 0.96, MAE of approximately 2 million kWh, and RMSE of approximately 3 million kWh.
Figure 13b presents the results for the summer test set, yielding an R
2 of 0.80, MAE of approximately 6 million kWh, and RMSE of approximately 7 million kWh.
Figure 13c displays the results for the winter training set, with an R
2 of 0.96, MAE of approximately 95 million kWh, and RMSE of approximately 111 million kWh.
Figure 13d shows the results for the winter test set, with an R
2 of 0.83, MAE of approximately 88 million kWh, and RMSE of approximately 121 million kWh. The R
2 values exceeding 0.80 across both training and test sets indicated that the random forest regression model demonstrated strong predictive performance, capturing over 80% of the variability in EC. To ensure robustness, the model was trained and evaluated across multiple random seeds, and performance metrics (e.g., R
2, RMSE) remained consistent, indicating stable behavior of the model across different OOB samples.
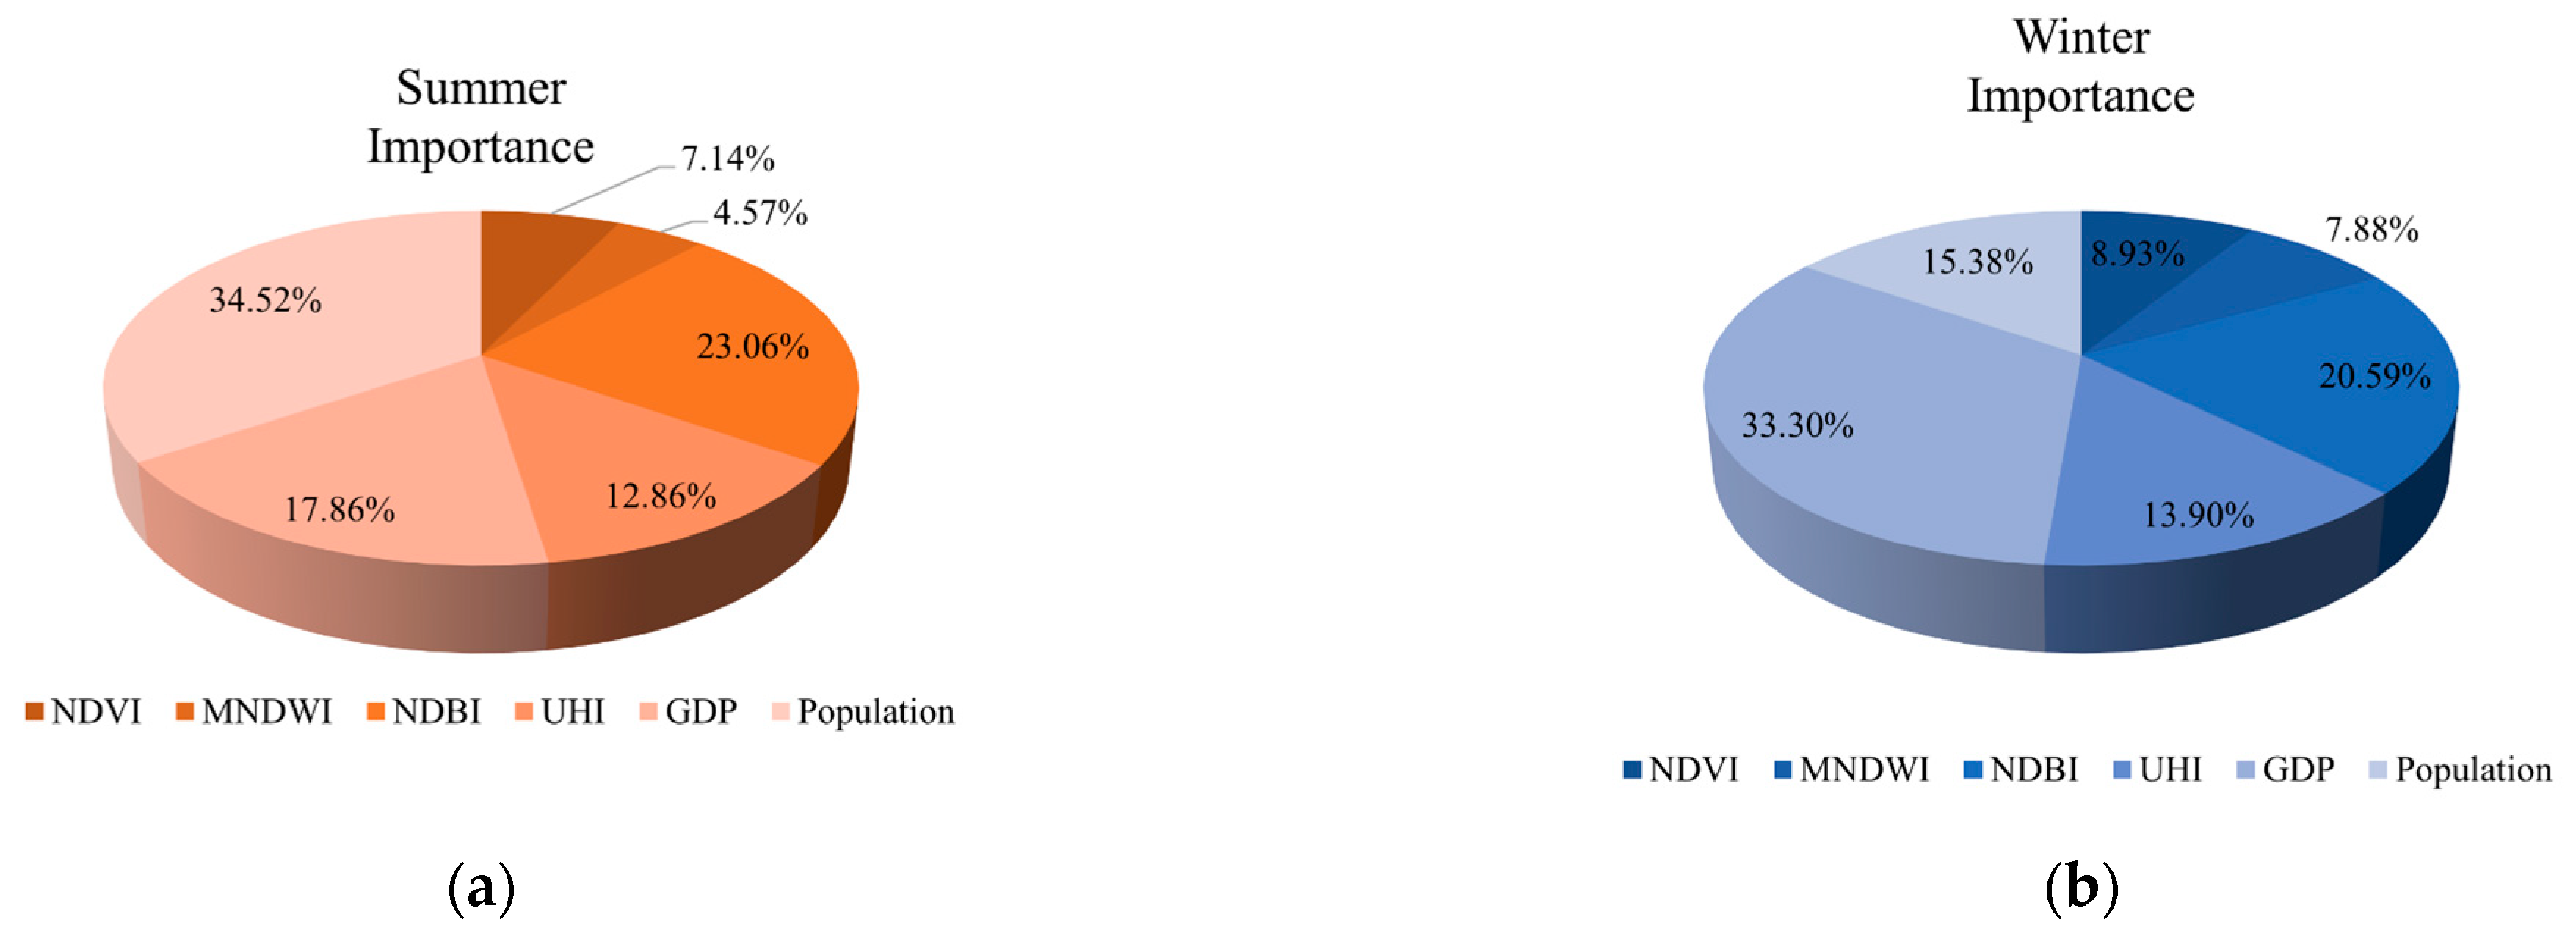
Figure 14 shows the predicted importance of various factors influencing EC in Harbin. In summer, the contribution rates of the influencing factors were as follows: population (34.52%), NDBI (23.06%), GDP (17.86%), SUHI (12.86%), NDVI (7.14%), and MNDWI (4.57%). In winter, the corresponding contribution rates were as follows: GDP (33.30%), NDBI (20.59%), population (15.38%), SUHI (13.90%), NDVI (8.93%), and MNDWI (7.88%). Population (as a social variable) and GDP (as an economic variable) were included as control variables in the subsequent regression analysis. The NDBI, NDVI, MNDWI, and SUHI were retained as the key environmental indicators.
3.5. Analysis of the Mediating Role of SUHI Between NDVI, NDBI, and EC
To further explore the underlying mechanisms through which the NDVI, MNDWI, and NDBI influence EC, the SUHI was introduced as a mediating variable in a structural equation model. However, due to the lack of a significant correlation between the MNDWI and SUHI in summer, the analysis focused solely on the mediating effects of the SUHI on the relationships between the NDVI, NDBI, and EC. Additionally, GDP and total population were included as control variables. Model 4 was used to test the mediating role of the urban heat island.
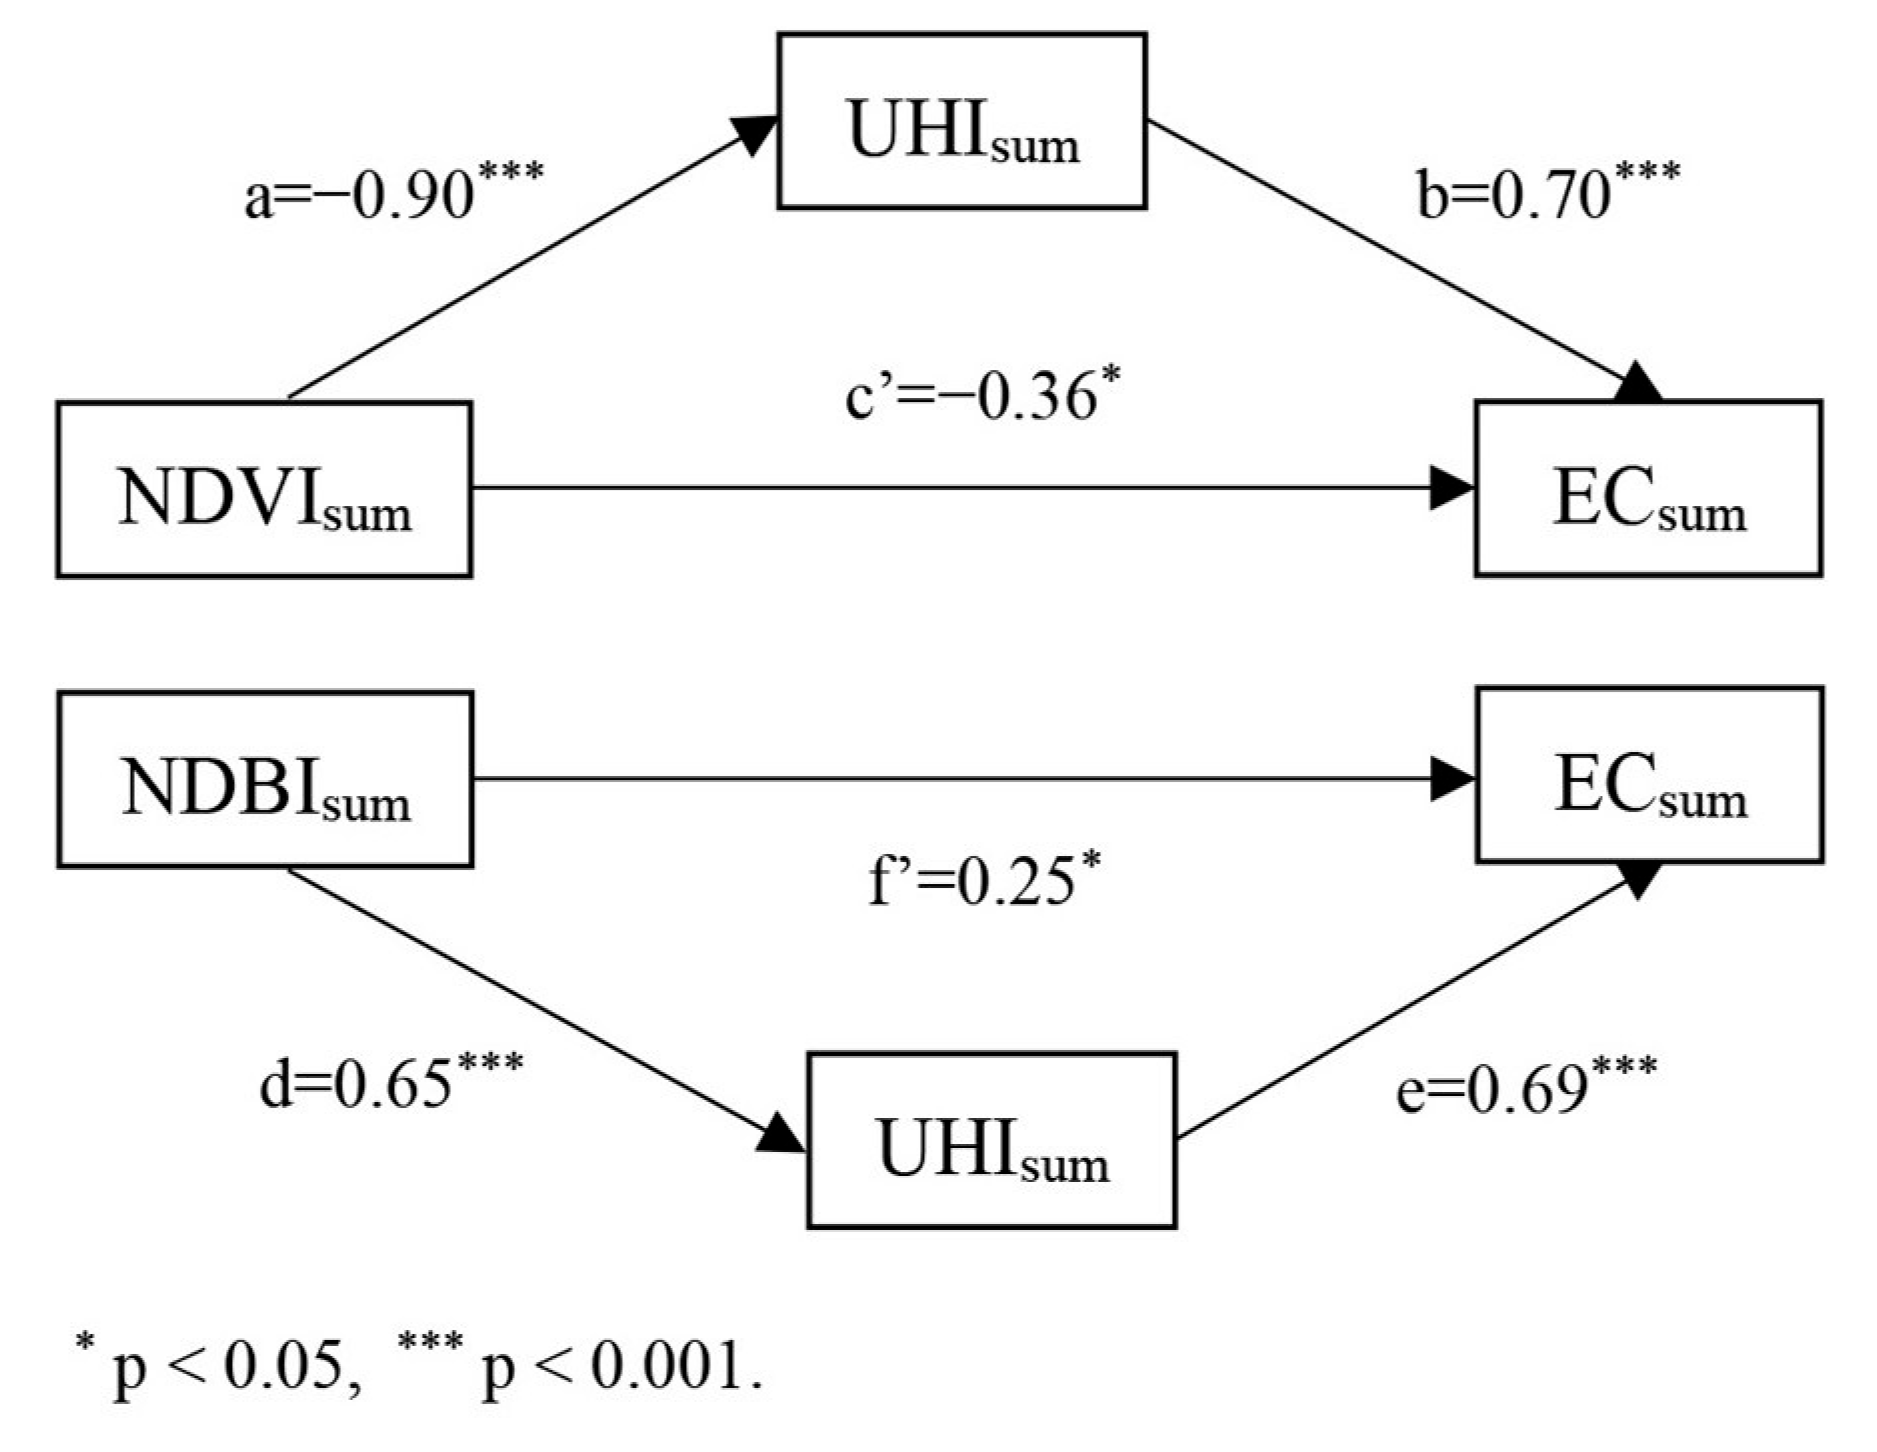
The path coefficients illustrating the relationships between the NDVI, NDBI, SUHI, and total urban building energy consumption in summer are presented in
Figure 15. Based on the correlation analysis, neither the NDVI nor SUHI showed significant correlations with EC in winter; therefore, only the NDBI was analyzed. According to
Table 3, the upper and lower limits of the bootstrap 95% confidence intervals for the mediating effect of the NDVI on total urban building energy consumption and surface temperature in summer in Harbin did not include zero. Specifically, the direct effect (−0.36) and mediating effect (−0.63) accounted for 36.28% and 63.72% of the total effect (−0.99), respectively. Additionally, the upper and lower limits of the bootstrap 95% confidence intervals for the effect of the NDBI on the SUHI and the subsequent effect of the SUHI on EC in summer also excluded zero. In this case, the indirect effect of the SUHI accounted for 63.68%.
According to the model calculation, in the influence path of the mediator variable SUHI on EC in winter, the 95% bootstrap confidence interval for the indirect effect included zero, indicating that the mediating effect was not statistically significant. After controlling for the mediator SUHI, the direct effect of the NDBI on EC remained statistically significant (p = 0.0088).
3.6. Comprehensive Evaluation Index Calculation and Regression Result Analysis
Based on the variable importance results from the random forest model, four remote sensing indices (the NDVI, MNDWI, NDBI, and SUHI) were selected to represent urban vegetation cover, water distribution, building density, and thermal environmental characteristics, respectively. These indices were then used to construct the urban thermal environment comprehensive index (UTEI).
According to the results of the entropy method, the weights of the NDVI, MNDWI, NDBI, and SUHI in Harbin in summer were 0.28, 0.13, 0.31, and 0.28, respectively. In winter, the corresponding weights were 0.16, 0.24, 0.32, and 0.28, respectively.
The UTEI exhibited both temporal and spatial variation across different regions and seasons (
Figure 16). From 2000 to 2024, the overall UTEI in summer demonstrated a clear upward trend. Among the districts, Daowai and Songbei showed relatively low index values, whereas Nangang District consistently recorded the highest UTEI scores. In winter, UTEI values across the five main urban districts of Harbin also showed a gradual increase over time, although the overall differences among administrative regions were relatively small.
The regression results for summer and winter are presented in
Table 4 and
Table 5. In terms of model performance, both seasonal models exhibited strong explanatory power, with R
2 values of 0.935 for summer and 0.908 for winter. Regarding the primary variable, both spline terms of the summer UTEI were statistically significant (
p = 0.013 and
p = 0.001). The coefficients of the first and second spline functions were 0.162 and 0.146, respectively, indicating positive effects. In the winter model, only the second spline term was statistically significant (
p = 0.005), with a significantly larger coefficient of 5.909. For the control variables, the standardized coefficients of summer GDP and population were 0.116 and 0.074, respectively, whereas those of winter were significantly higher at 2.674 and 1.712. All coefficients reached a 1% significance level. The summer regression results exhibit relatively small standard errors and narrow 95% confidence intervals, indicating higher robustness for both spline segments.
The variance inflation factor (VIF) test results for the regression variables indicated that, except for the constant term, all VIF values were below the empirical threshold of five. This indicated that multicollinearity was not a serious issue in the model, and the regression estimates were considered robust.
As shown in
Figure 17 and
Figure 18, although some local fluctuations were observed in the scatter plots, the fitted spline curves remained stable, and the 95% confidence intervals were relatively narrow, indicating a robust model fit. Marginal effect estimates derived from the spline regression model showed that, holding standardized GDP and population constant, a one-unit increase in the UTEI corresponded to an average increase of approximately 22 million kWh in EC during summer. In winter, a one-unit increase in the UTEI was associated with an average increase of approximately 1.16 billion kWh in EC.
4. Discussion
4.1. Effects of NDVI, MNDWI, NDBI, and SUHI on EC
With Harbin’s rapid economic development, ongoing urbanization, and implementation of policies such as reforestation and farmland-to-forest conversion, both impervious surface area and forested land have increased steadily. From 2000 to 2024, the NDVI in Harbin exhibited fluctuations but showed an overall upward trend. The MNDWI and NDBI also demonstrated consistent year-on-year increases. Previous studies have reported significant increases in the NDVI, predicted NDVI, and residual NDVI across various regions of China [
46], consistent with the trends observed in this study. As shown in
Figure 11 and
Figure 12, the NDVI in summer exhibits a significant negative correlation with both the SUHI and total building energy consumption, indicating that urban vegetation plays a crucial ecological role in mitigating heat stress and reducing energy demand. Conversely, the significant positive correlations between the NDBI and energy consumption in both summer and winter highlight the negative impacts of densely built environments on energy consumption. These areas not only exacerbate urban heat island effects during hot periods but also increase total heating demand during cold seasons. This research result is similar to other studies [
47,
48,
49]. These findings suggest that land cover characteristics have a direct impact on microclimate regulation and urban energy performance. Incorporating remote sensing indices such as the NDVI and NDBI into urban planning and management frameworks can enhance energy efficiency and support the sustainable development of cities in cold climate regions. The current findings confirmed significant correlations among the NDVI, MNDWI, NDBI, SUHI, and EC, supporting existing research showing that these remote sensing indices affect the urban climate and residents’ energy demand [
33,
50].
Based on the data analysis presented in
Table 3, the results of the summer mediation model indicated that both the NDVI and NDBI exerted direct effects on EC while also influencing EC indirectly through the SUHI. In contrast, the winter mediation model showed that the indirect effect of the SUHI was not statistically significant, whereas the direct effect of the NDBI on EC remained significant. This finding differs from those reported in previous studies [
27]. A possible explanation for this discrepancy lies in Harbin’s climatic conditions. Winters in Harbin are extremely cold, necessitating centralized heating, which constitutes a major component of total energy consumption during this season. As a result, the overall energy demand in winter was less sensitive to variations in SUHI intensity. From an urban planning perspective, these findings highlight the importance of seasonally adaptive strategies. In summer, increasing urban vegetation and reducing impervious surfaces can effectively mitigate the urban heat island effect and lower cooling-related energy consumption. In contrast, winter strategies should focus on controlling the growth of building density and improving the efficiency of heating systems to reduce winter energy use.
In the entropy weight method calculation, although the NDVI and MNDWI did not exhibit significant correlations with winter EC, they were still included as key components in the thermal environment evaluation system. This decision was based on the premise that the NDVI and MNDWI may affect EC through indirect mechanisms, such as modifying the microclimate and influencing building heat loads. Theoretically, a higher value of the comprehensive index corresponds to greater EC. To objectively reflect the overall influence of each factor on the urban thermal environment, this study quantified the degree of dispersion of each index across different regions and automatically assigned weights using the entropy method. This approach effectively minimizes subjective bias, thereby enhancing the scientific rigor and reliability of comprehensive evaluation results. In summer, the NDBI received the highest weight, indicating that the spatial variation in building density was the dominant factor influencing the urban thermal environment. Changes in built-up area distribution, structural layout, and urban morphology significantly affected EC, which is closely linked to Harbin’s high-density development pattern and uneven land use. In winter, the NDBI and SUHI continued to carry relatively high weights (0.32 and 0.28, respectively), whereas the NDVI received the lowest weight. This suggested that the spatial variation in vegetation cover during winter was limited, and its influence on the overall thermal environment was relatively minor.
This study found that the UTEI exhibited both regional and seasonal variation (
Figure 16). In summer, the UTEI showed a consistent upward trend from 2000 to 2024, indicating that the ongoing urban development in various districts of Harbin has resulted in the expansion of built-up areas, a gradual decline in vegetation and water body coverage, and the deterioration of the urban thermal environment. The UTEI values in Daowai and Songbei districts remained relatively low, likely due to the presence of natural ecological elements, such as wetlands and rivers, which contribute to thermal regulation. In contrast, the UTEI score in Nangang District remained persistently high in summer, potentially attributable to its high building density, limited green space, and intensified UHI effects. These conditions reflect the relatively poor regional thermal environment. In winter, the UTEI values across the five major urban districts of Harbin exhibited a gradual upward trend. This suggests that, as urbanization progresses, the capacity to regulate the thermal environment in winter has weakened, placing a greater burden on the energy system. Notably, from 2022 to 2024, most urban districts have reached their historical peak UTEI values, highlighting that winter thermal regulation in severely cold regions is becoming an increasingly critical challenge for both urban ecological sustainability and energy system resilience.
A comparison of the regression results between summer and winter revealed both commonalities and seasonal differences in the relationship between urban thermal environment and energy consumption (
Table 4 and
Table 5). In terms of model performance, the selected explanatory variables effectively captured the seasonal variations in energy consumption. Regarding the primary variable, a significant nonlinear relationship was observed between the summer UTEI and energy consumption. The spline function coefficients indicated that the UTEI had a positive effect on energy consumption in both seasons, suggesting that higher UTEI values are associated with increased energy demand. This finding aligns with the theoretical framework presented above. Furthermore, the effect of the UTEI varied across different levels of thermal conditions, indicating marginal differences in the energy response under varying environmental stresses. As for the control variables, the standardized coefficients for GDP and population were positive in both summer and winter, implying that both economic scale and population size contributed to rising EC. These variables exerted a significant influence on seasonal variations in energy demand.
4.2. Contributions and Limitations
Table 6 summarizes recent studies that have employed various methods. Most research has focused on the impact of individual factors on surface temperature, the urban heat island effect, and energy consumption, with relatively few studies considering multiple factors simultaneously. However, in practice, changes in one factor often coincide with those in others. This study addressed this gap by using a random forest model to analyze building energy consumption and determine the weights of each influencing factor. By applying spline regression analysis, the key influencing factors were integrated into a comprehensive evaluation index, and a nonlinear regression model was developed to assess the impact of environmental and microclimatic factors on residential energy consumption. This approach accounted for the simultaneous variation in multiple factors, thereby enhancing the rigor of the analysis. These findings provide theoretical support for predicting the energy consumption of urban buildings in cold regions.
This study has certain limitations, including the absence of a continuous annual analysis of changes in vegetation cover, surface temperature, the urban heat island effect, and energy consumption within the study area. The selection of specific years (e.g., 2001, 2006, etc.) was based on the availability of cloud-free satellite imagery to ensure data quality and consistency. This inevitably resulted in temporal discontinuities, which may affect the detection of interannual trends. To address this, the analysis focused on medium- to long-term patterns rather than short-term variations. While interpolation or gap-filling methods were considered, we prioritized the use of high-quality observed data. Another limitation of the study is that, while OOB validation in random forest models provided an efficient means of internal validation for small samples, more advanced tuning techniques such as cross-validation or grid search could be explored in future studies. Additionally, the research focused only on winter and summer, whereas most previous studies have emphasized summer, with relatively few addressing year-round changes. The findings of this study could be specific to the climatic conditions of cold regions, resulting in conclusions that differ significantly from those in other cities. Future research will extend the study period to include spring and autumn and explore advanced interpolation or data fusion techniques to construct more continuous time series. These insights offer valuable guidance for urban planning, design, and strategies to reduce urban energy consumption.
4.3. Urban Scale Energy Saving Strategies
To formulate effective energy-saving strategies at the urban scale, this study employed spline regression analysis and sought to reduce energy consumption by optimizing the energy consumption index. Specifically, the NDVI and MNDWI were identified as positive indicators, whereas the NDBI and SUHI were negative indicators. Therefore, in summer, energy consumption can be reduced by increasing the NDVI and MNDWI and decreasing the NDBI and SUHI to improve the energy consumption index. In winter, reducing the NDBI is a key strategy for lowering the energy consumption of urban buildings. Based on the research results, the following priority response strategies are proposed for Harbin:
- (1)
Reduce winter energy consumption by improving building energy efficiency and controlling building density: Considering the long and harsh winters in Harbin, the most pressing intervention is to decrease energy consumption associated with heating. This can be achieved by enhancing the thermal insulation of buildings, optimizing the efficiency of centralized heating systems, and controlling the building density in cities. In high-density urban areas such as Nangang, it is essential to standardize urban planning and restrict excessive building concentration (high NDBI) to effectively curb the increase in winter energy consumption.
- (2)
Enhance urban greening to alleviate summer energy demand: In summer, the NDVI and NDBI are key factors influencing energy consumption associated with refrigeration. Green infrastructure such as rooftop greening and urban parks should be promoted in high-density built-up areas to alleviate the urban heat island effect and reduce the use of air conditioners. In ecologically rich regions such as Daowai and Songbei, priority should be given to protecting and restoring existing natural ecosystems such as wetlands and water systems.
- (3)
Pay attention to water body construction in urban development: The MNDWI plays a positive role in regulating the local climate of cities. Urban development should prioritize the protection of natural water bodies and incorporate water body landscapes into urban planning to enhance the capacity for microclimate regulation and improve energy utilization efficiency.
5. Conclusions
This study examined the relationships between the NDVI, MNDWI, NDBI, SUHI, and EC in Harbin from 2000 to 2024. Using GIS and RS technologies for image data processing, along with correlation and regression model analyses, this study investigated the impact of the summer and winter NDVI, MNDBI, NDBI, and SUHI on EC. The findings revealed the following.
From 2000 to 2024, the NDVI in Harbin exhibited a fluctuating yet overall increasing trend, whereas both the MNDWI and NDBI showed consistent year-on-year growth. During the same period, the average surface temperature increased slightly, and the intensity of the maximum UHI effect increased.
In summer, the NDVI was significantly negatively correlated with the LST, SUHI, and urban energy consumption, whereas the NDBI showed significant positive correlations with both the SUHI and urban energy consumption.
In contrast, the winter NDVI exhibited no significant correlation with the LST, SUHI, or total energy consumption (including both electricity and heating). However, the NDBI maintained significant positive correlations with both the SUHI and winter energy consumption.
In summer, the SUHI served as a mediating variable between the NDVI, NDBI, and electricity consumption.
A comprehensive evaluation index incorporating the NDVI, MNDWI, NDBI, and UHI was developed, along with a nonlinear regression equation for the energy consumption index. The weights of the NDVI, MNDWI, NDBI, and SUHI in Harbin in summer were 0.28, 0.13, 0.31, and 0.28, respectively. In winter, the corresponding weights were 0.16, 0.24, 0.32, and 0.28, respectively.
There is a strong seasonal contrast in the drivers of urban energy consumption: the NDVI and NDBI are the main factors in summer, while the NDBI dominates in winter.
In summary, mitigating the urban heat island effect and increasing energy consumption may require effective land use planning. Our research findings offer valuable insights for urban planners and decision makers to develop strategies based on optimal land use scales. These strategies can enhance residential thermal environments, reduce building energy demands, and serve as references for urban planning in cold regions.


