Article

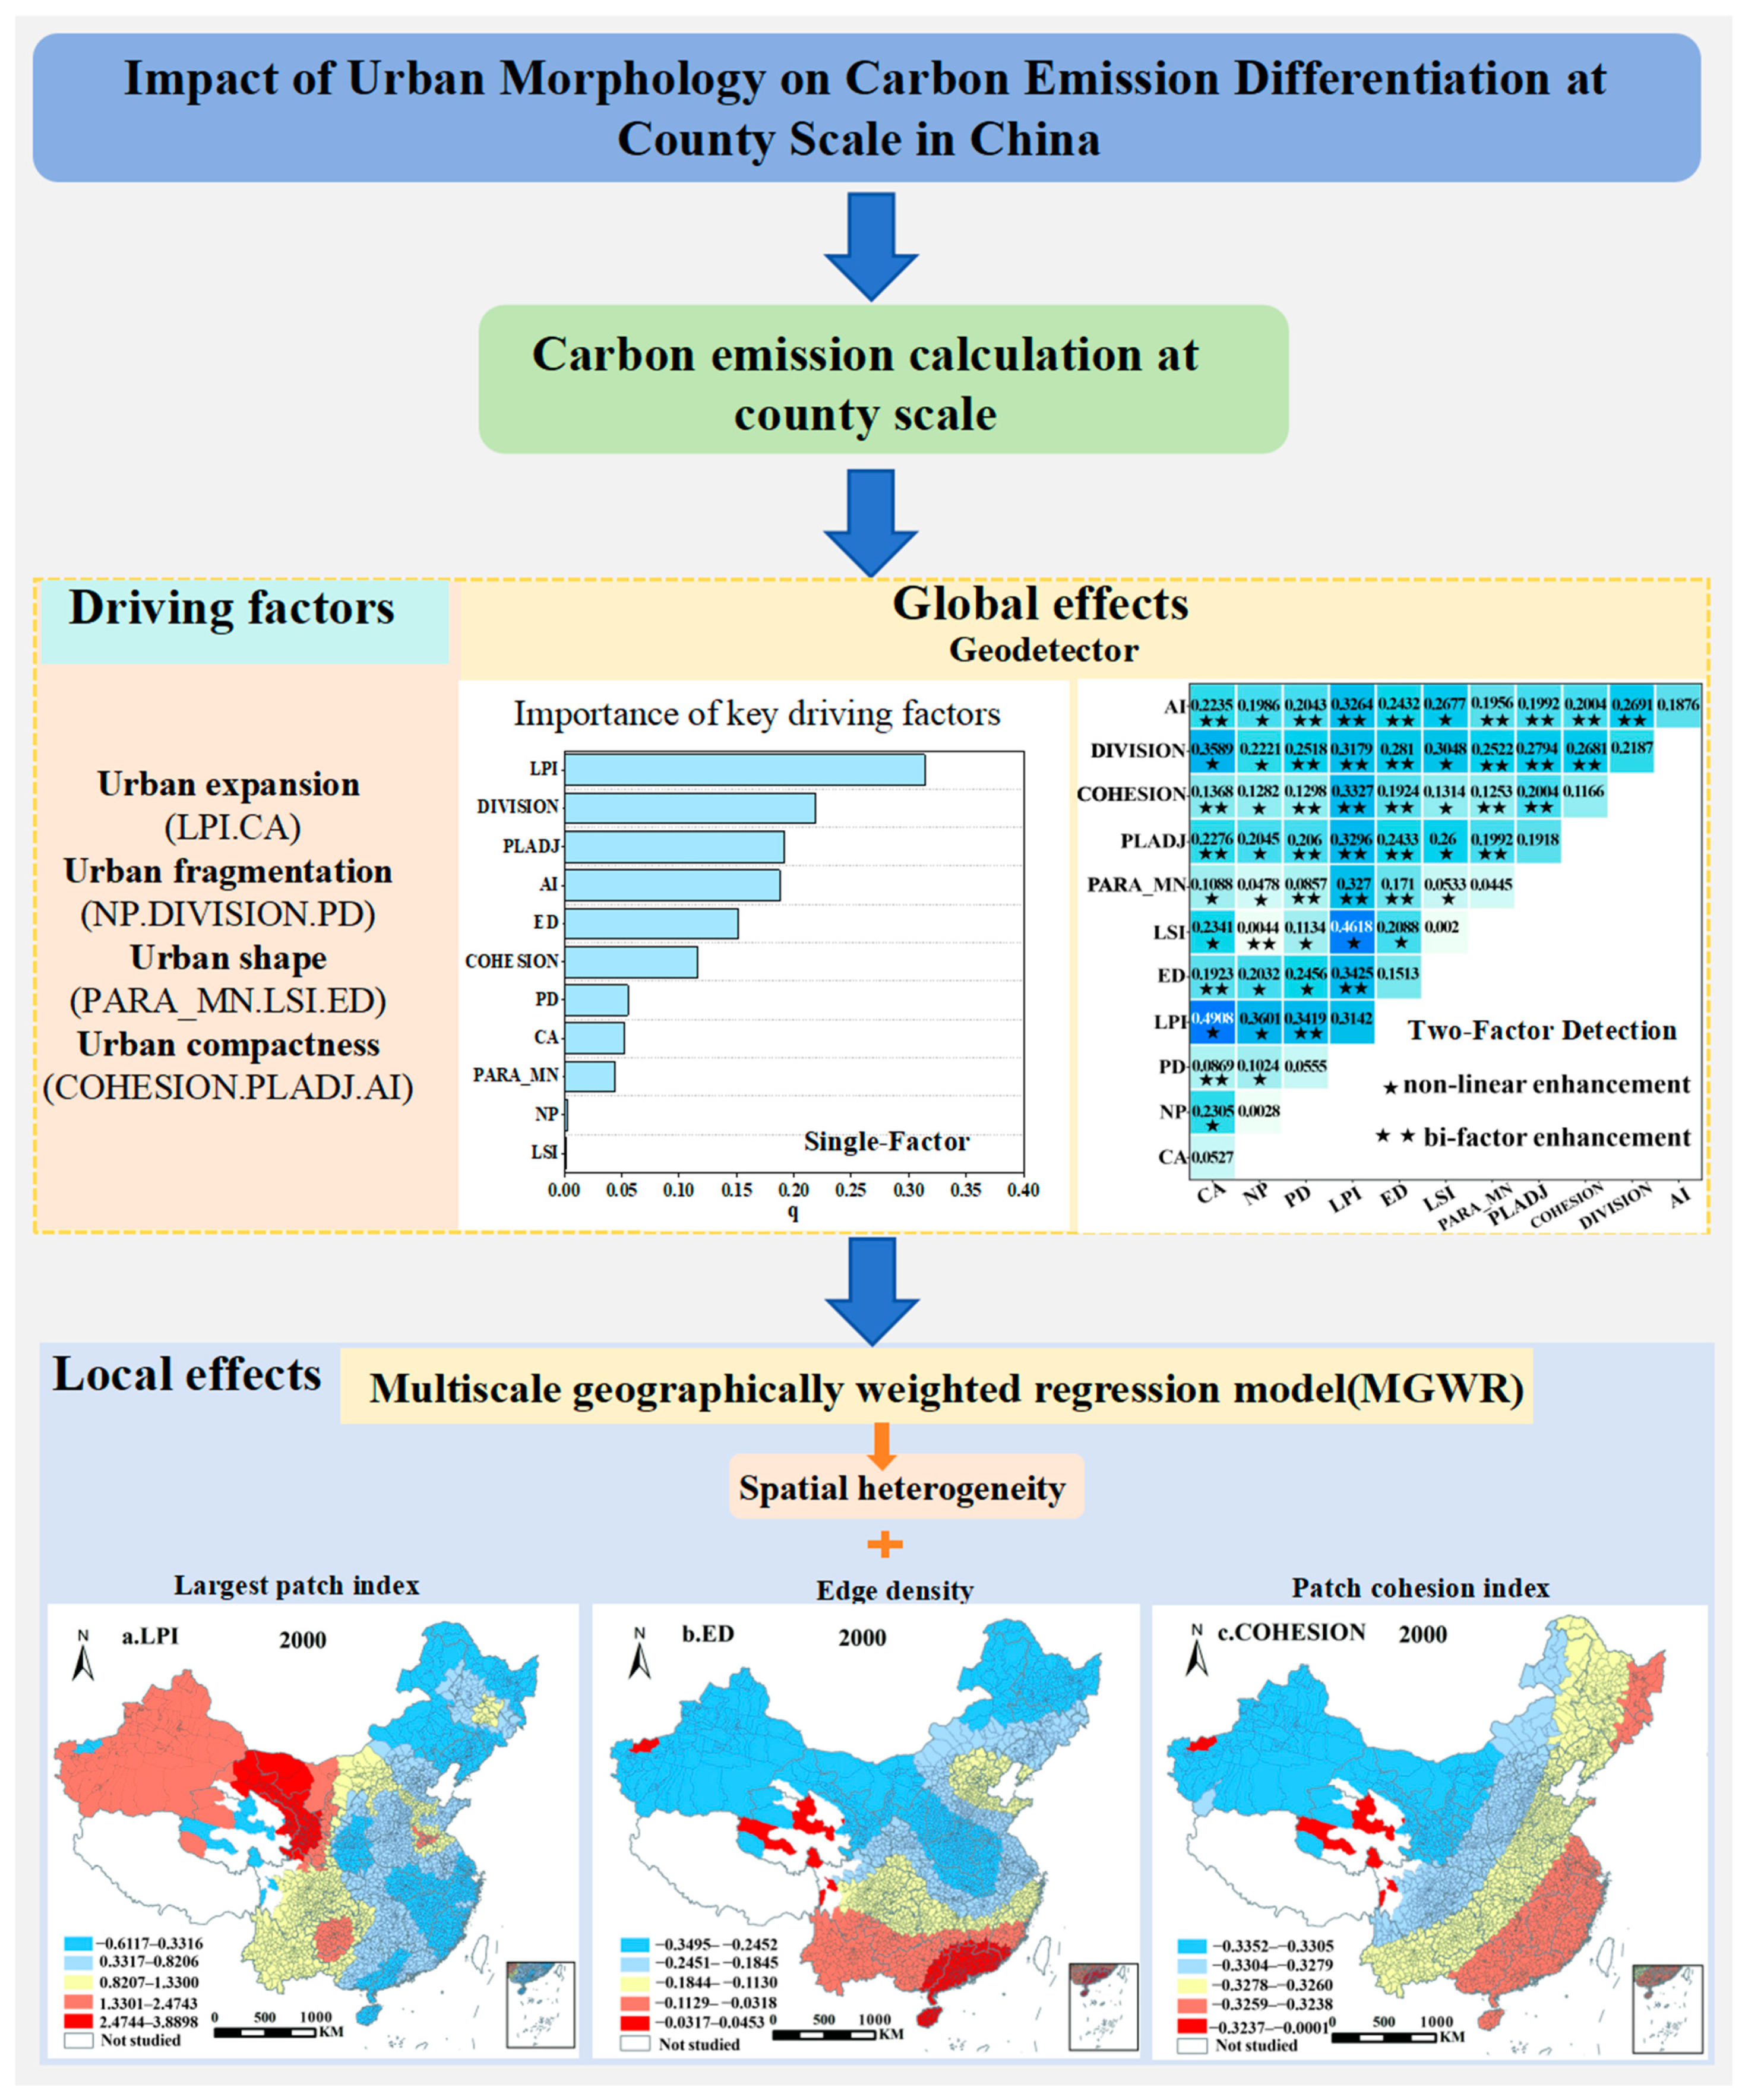
Impact of Urban Morphology on Carbon Emission Differentiation at County Scale in China

1
School of Public Policy & Management, Anhui Jianzhu University, Hefei 230022, China
2
Cultivated Land Protection Innovation Demonstration Center of Anhui Province, Anhui Jianzhu University, Hefei 230601, China
3
School of Public Policy and Management, Tsinghua University, Beijing 100084, China
4
School of Public Administration, China University of Geosciences, Wuhan 430074, China
5
College of Economics and Management, Mianyang Teachers’College, Mianyang 621000, China
*
Author to whom correspondence should be addressed.
Land 2025, 14(6), 1163; https://doi.org/10.3390/land14061163
Submission received: 26 March 2025 / Revised: 24 May 2025 / Accepted: 24 May 2025 / Published: 28 May 2025

Abstract

:
Urban morphology’s effects on carbon dioxide reduction and sustainable development have drawn more attention. The county scale is crucial in influencing urban development and is the central element of China’s recent urbanization. To achieve scientific urban planning and fully explore its potential in carbon emission reduction, local governments need to investigate the impact of urban morphology on carbon emissions (CE). However, previous studies have predominantly focused on provincial capitals and urban clusters. To address this gap, this study quantified four aspects of urban form, combined energy consumption, and nighttime light data to estimate CE in Chinese counties from 2000 to 2020 and analyzed the effects of these factors on CE using multiscale geographically weighted Regression(MGWR) models and geographic detectors. The following are the main findings: (1) Total CE at the county scale in China has consistently increased from 2000 to 2020. (2) The largest patch index (LPI) is the most influential urban morphological factor on CE, while the impact of Class Area (CA) has been increasing. (3) Bi-factor enhancement and nonlinear enhancement are the two primary interaction types of urban morphological factors; the most important interaction is between LSI and CA. (4) The urban morphological factors exhibit varying degrees of spatial heterogeneity, with the influencing factors ranked as CA > LPI > path density (PD) > edge density (ED) > patch cohesion index (COHESION), where LPI and CA consistently show a positive effect on CE. This study’s findings establish a scientific foundation for land spatial planning and tailored emission reduction methods at the county scale in China.

1. Introduction

Climate change presents an important danger to the human habitat [1,2], with carbon dioxide being the principal greenhouse gas and a major contributor to this phenomenon [3,4]. Consequently, the effective reduction of carbon emissions (CE) has emerged as a significant problem that humanity must confront [5]. At an average annual growth rate of 2.3%, worldwide emissions of carbon dioxide rose from 20,511.1 million tons in 1990 to 33,621.5 million tons in 2019 [6,7]. In response to the rapid increase in CE, human society has taken proactive measures. The adoption of the Paris Agreement is of significant importance in curbing the rise in CE [8]. Limiting the global average temperature increase to less than 2 °C by the end of this century and aiming to keep it to 1.5 °C, this accord ushers in a new era of global climate collaboration [9]. To achieve this goal, by September 2024, more than 150 countries had announced their carbon neutrality targets. Being the biggest developing nation in the world and a significant source of CE [10], the Chinese government places great importance on climate change and actively promotes low-carbon economic development. At the 75th United Nations General Assembly in September 2020, China declared its intention to reach carbon neutrality by 2060 and carbon peaking by 2030 [11]. However, as a developing major power, China faces significant challenges in achieving both peak carbon dioxide and zero emissions within less than 40 years.
Urban areas, as the primary centers of human social and economic activities, occupy only about 3% of the global land area. Nonetheless, they are responsible for over 80% of world CE and 75% of global energy consumption [12]. This percentage is significantly greater in China, where it is 85% [13]. Due to China’s fast urbanization and industrialization during the 21st century, the country’s urban morphology has changed significantly, and its urban land has continued to expand. These transformations have notably impacted urban CE and regional carbon balance [14]. In the process of urbanization, urban morphology is an important indicator for measuring urban characteristics [15,16,17]. Urban morphology describes how human activity and urban features are arranged in space. It establishes how effectively infrastructural resources and land usage are allocated, which has a direct impact on production trends and carbon dioxide emissions [18,19]. A rational urban morphology not only helps improve the efficiency of urban economic operations [20] but also promotes development with a reduced carbon footprint, like alleviating traffic jams and achieving efficient resource utilization [12]. Therefore, shaping a rational urban morphology has become a key factor in promoting sustainable urban growth [21]. Urban growth has a long-term effect on carbon dioxide emissions, and conventional emission reduction strategies cannot completely counteract it. The impacts of established urban morphology will last for decades [22]. Therefore, it is crucial to comprehend how urban morphology affects CE and to optimize urban spatial arrangement to reduce CE.
Urban morphology’s effect on CE has been thoroughly studied in the past, and it has been shown that spatially optimized urban morphology is crucial for lowering CE [23,24]. Current research indicates that urban morphology profoundly impacts urban energy usage and emissions of CO2 [25] by influencing urban transportation characteristics [26], residents’ behavior [27], and urban heat island effects [28]. The measurement and quantification of urban spatial morphology have long been a focal point in academia [29], as quantified urban spatial morphology allows for a better understanding of its relationship with CE. Existing studies have widely applied index measurement methods and morphological measurement methods to assess urban morphology [30]. Regarding index measurement methods, researchers have employed a variety of indicators to characterize urban morphology from multiple dimensions, thereby exploring its impact on CE [12,31]. For instance, studies have used landscape metrics and transportation dimensions to analyze the spatial and temporal heterogeneity of urban morphology on CE [32] and the relationship between urban morphology and CE from residential and transportation sectors in China [33]. Additionally, studies have quantitatively analyzed the impact of three-dimensional urban morphology on carbon emissions, focusing on factors such as building height, volume, floor area ratio, coverage, and spatial density [34]. Morphological measurement methods, which are based on two-dimensional urban spatial morphology, often use indicators such as compactness, elongation, shape ratio, circularity, and radiance index to represent urban morphological characteristics [35]. Researchers have measured urban morphology based on these indicators, including compactness and elongation [36]. With the increasing integration of disciplines, scholars have adopted ecological methodologies to quantify urban spatial structures and land use patterns [37], offering new approaches for measuring urban morphology. Consequently, numerous studies utilizing landscape metrics have examined the relationship between urban morphology and CE across various scales, including national [38], urban agglomerations [39], and prefecture-level cities [6]. Previous studies on the spatial relationship between urban morphology and CE predominantly employed regression analysis [40], the STIRPAT model [41], and panel data analysis [42] to develop models.
However, prior research on urban morphology and CE has mainly focused on provincial capitals, large standalone cities, and prefecture-level cities, with limited attention given to county-level units. China’s administrative system is primarily divided into four levels: province, prefecture-level city, county, and township, forming a comprehensive administrative management framework. Among these, the province serves as the highest local administrative unit, responsible for formulating overarching development plans, coordinating resource allocation, and addressing major issues. Prefecture-level cities act as critical intermediaries between provinces and counties, serving as key hubs for regional coordination and the detailed implementation of policies. Counties, as the core units of basic administration, are tasked with implementing policies from higher levels and managing the allocation of township resources. Townships directly serve grassroots communities, focusing on policy execution and ensuring public welfare. Within this framework, county-level administrative units are both the carriers of new urbanization development and essential venues for ecological governance and policy implementation [43], occupying a pivotal position in linking higher and lower administrative levels. Particularly in basic governance, economic development, and social stability, county-level units play an irreplaceable role. Therefore, studying the impact of urban morphology on CE at the county level provides a novel perspective for understanding and addressing carbon emission challenges while offering a scientific basis for achieving China’s “dual carbon” goals. Moreover, existing studies often examine the independent effects of individual urban morphological factors on CE while neglecting the interactions between these factors. CE are influenced by a complex interplay of factors. Hence, comprehensively understanding the impact of urban morphology on CE necessitates considering the interactions among these factors to uncover their combined effects. Additionally, most studies employ traditional econometric methods to decompose influencing factors, overlooking the spatial heterogeneity of urban morphology’s impact on carbon emissions. Although the geographically weighted regression (GWR) model addresses this issue to some extent, its single bandwidth setting results in homogeneous regression characteristics and lacks multi-scale considerations. The multi-scale geographically weighted regression (MGWR) model overcomes these limitations by allowing each influencing factor to have an independent bandwidth, thus reflecting spatial scales and reducing estimation bias. This enhancement provides a more accurate analysis of the impact of urban morphology on CE.
Building on this foundation, this study focuses on county-level units in China. First, it calculates CE for Chinese counties by integrating energy consumption and nighttime light data. Next, it quantifies urban morphology using landscape metrics from four dimensions: urban expansion, fragmentation, shape, and compactness. Finally, it employs geographic detectors and the MGWR model to comprehensively analyze the global and local characteristics of the impact of county-level urban morphology on CE in China from 2000 to 2020 (Figure 1). Based on these findings, this study proposes recommendations for carbon emission reduction through the spatial optimization of urban morphology at the county level in China.

2. Methods and Data Sources

2.1. Theoretical Analysis
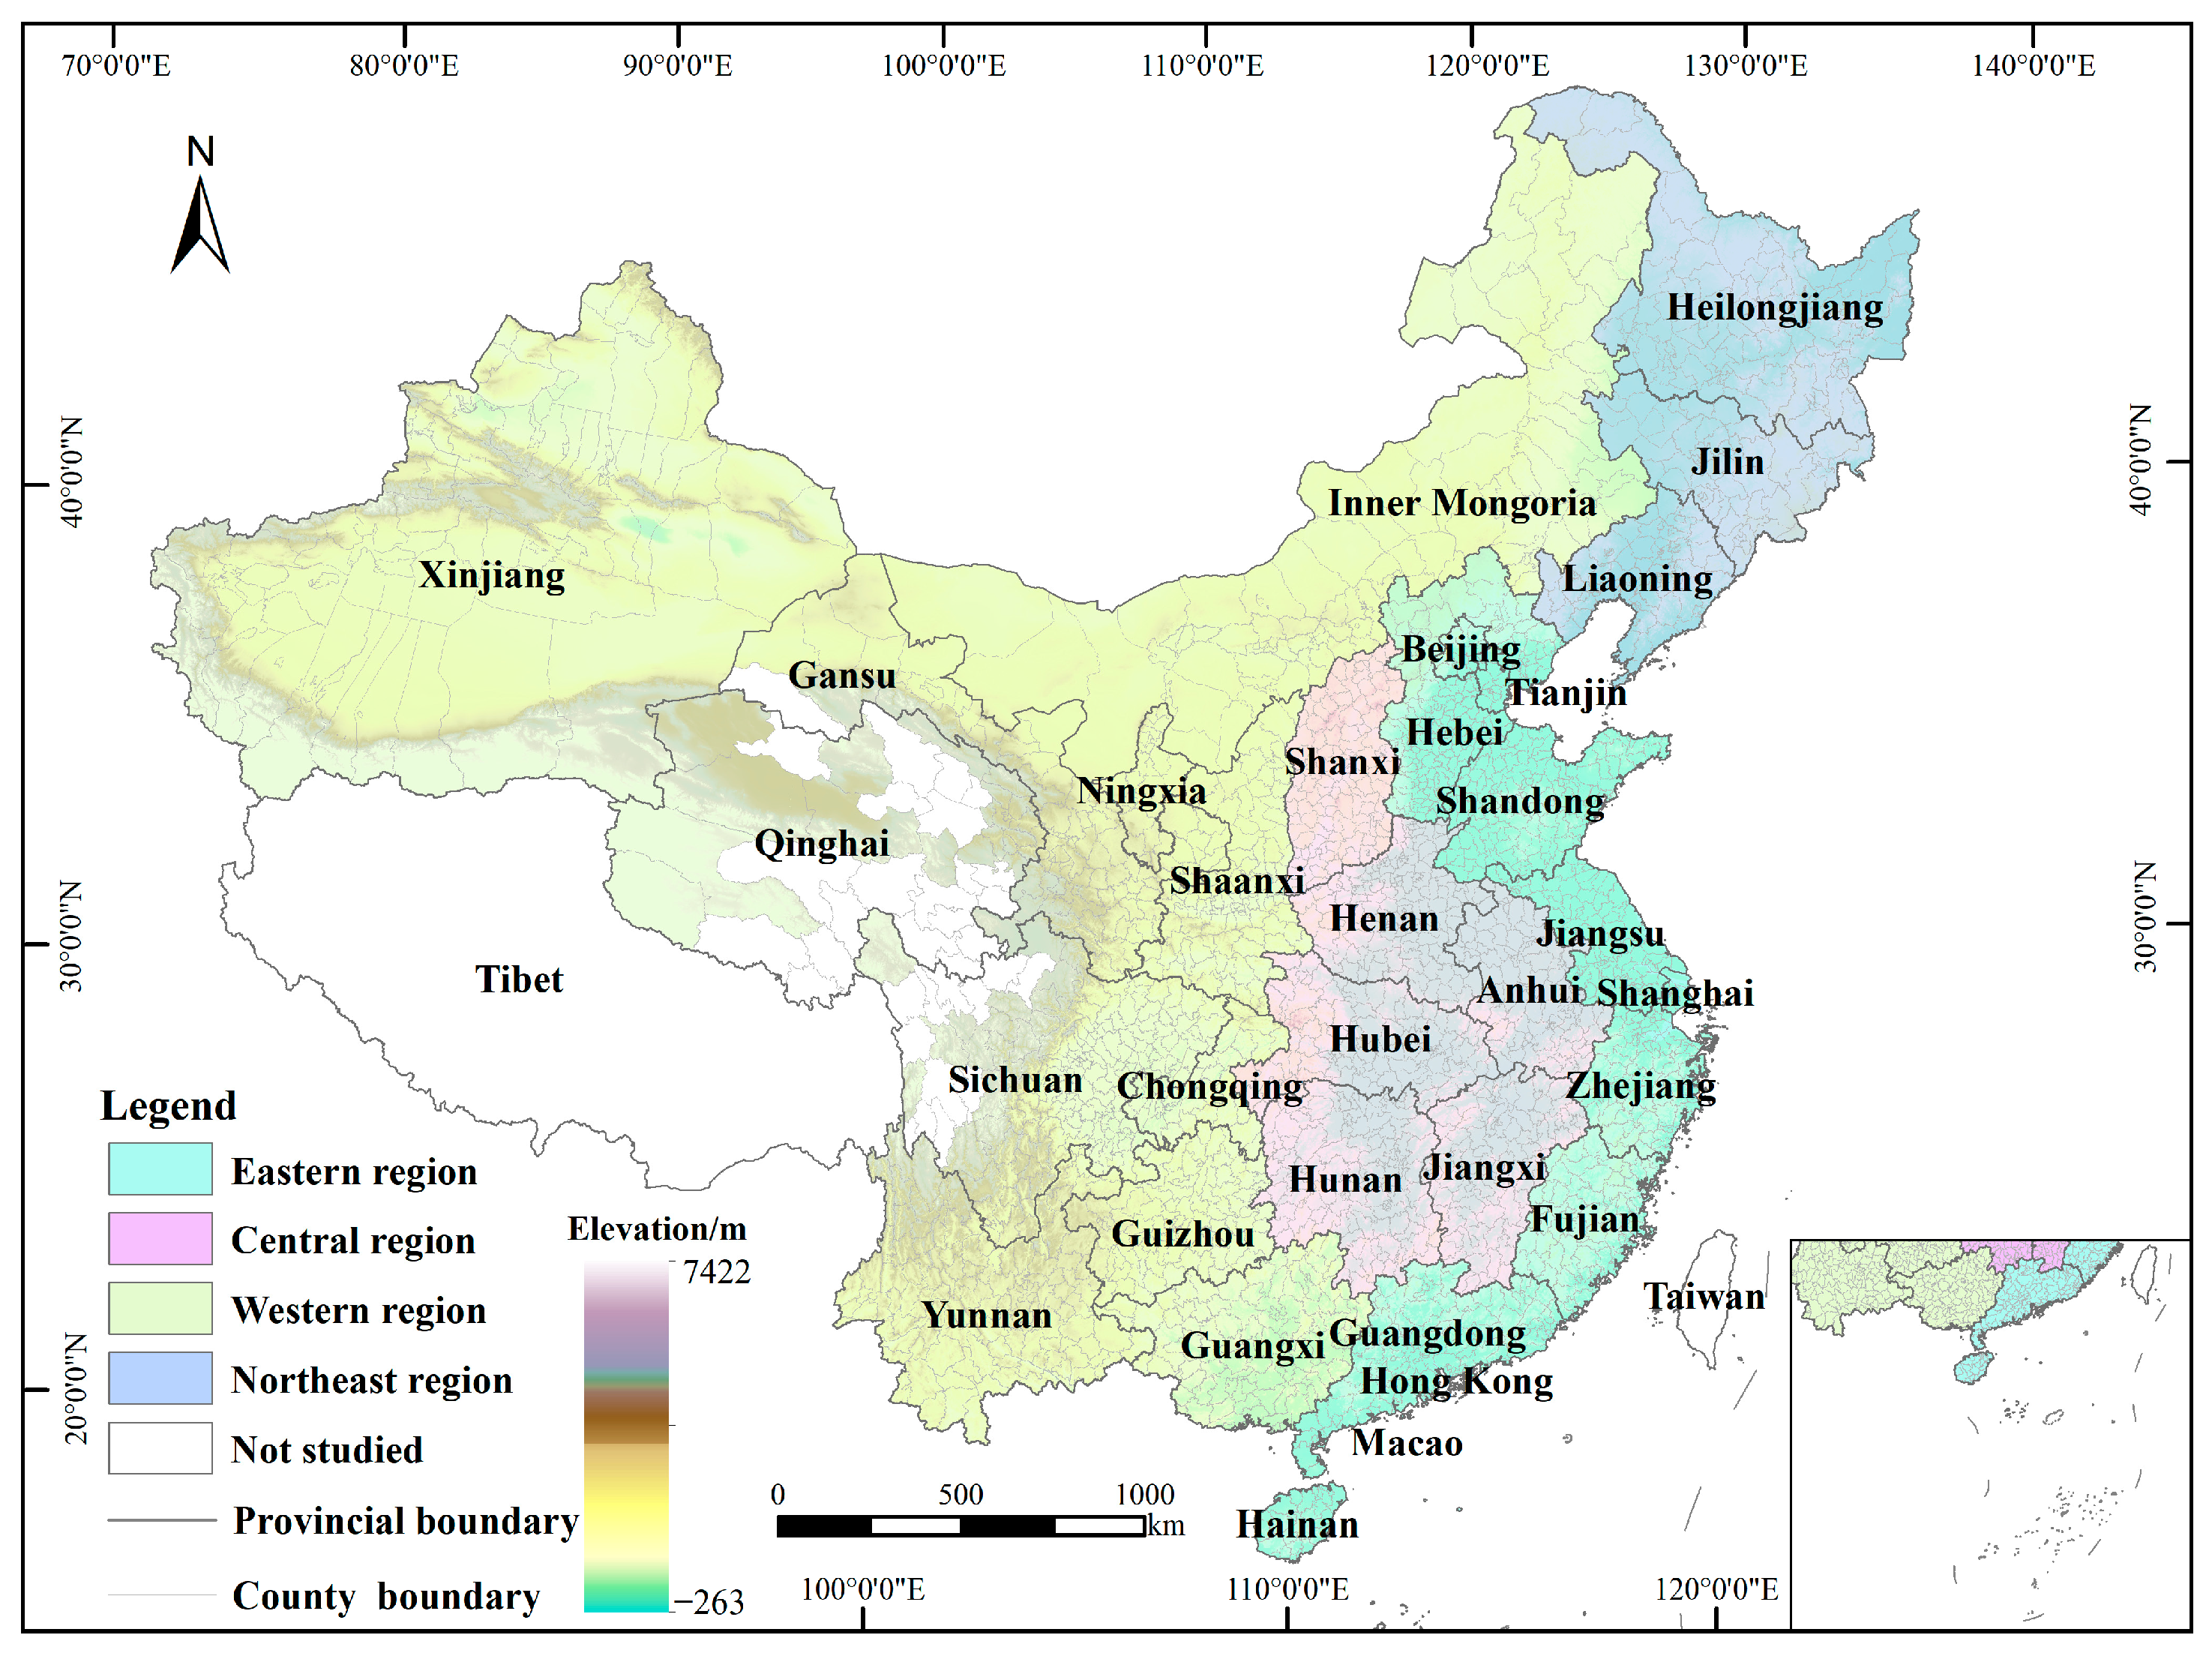
Based on previous studies [6,44], this paper quantitatively analyzes urban morphology across four dimensions: urban expansion, fragmentation, shape, and compactness. Urban expansion, as a prominent feature of urban form, directly leads to significant increases in energy consumption, industrial activities, and traffic flow [45]. Meanwhile, housing pressure from population aggregation prompts cities to undertake frequent construction activities, thereby generating substantial CE [46]. Under this model, cities consume substantial energy to promote economic development, which, in turn, stimulates further energy consumption, forming a cycle of high energy demand [47]. Furthermore, increased population density drives the expansion of infrastructure construction and manufacturing, often accompanied by the growth of energy-intensive industries [48]. This reduces energy efficiency and increases carbon emissions. The impact of urban fragmentation on CE exhibits spatial and temporal variability and is closely linked to the stage of urban development [49]. In economically underdeveloped cities, decreased fragmentation may result from rapid urban expansion, where surrounding agricultural land is annexed for industrial development, leading to increased CE [50]. Conversely, in highly urbanized regions, fragmented urban layouts reduce accessibility to infrastructure and public transportation, increase transportation costs, and encourage private vehicle use, thereby consuming more energy and exacerbating CE [51]. The regularity of urban shape and the connectivity of functional zones are directly related to commuting distances, travel times, and traffic congestion levels, thereby influencing CE from both residential and transportation sectors [52]. Compactness, a critical indicator of urban spatial structure, exhibits a threshold effect on CE. Moderate urban compactness enhances land use efficiency, energy utilization, and industrial agglomeration, thereby reducing energy consumption. However, excessive compactness can result in heightened population pressures, overly dense road networks and buildings, traffic congestion, urban heat island effects, and air pollution, collectively contributing to increased CE.

2.2. Study Area

This study focuses on China as the research area. The research region does not include Tibet, Taiwan, Hong Kong, or Macau due to the availability of data. The study thus encompasses 30 provinces, including four autonomous areas and four municipalities under direct government. The National Bureau of Statistics of China’s regional division technique divides these 30 provinces into four regions: central, western, northeastern, and eastern China (Figure 2).

2.3. Data Sources

The Energy Balance Table of Final Energy Consumption in the China Energy Statistical Yearbook (2001–2021) was the source of the energy data. The worldwide 500 m resolution ‘NPP-VIIRS-like’ dataset was the source of the nighttime light data [53]. The land use data were obtained from Wuhan University [54]. For this study, impervious surfaces were considered urban built-up land.

2.4. Research Methods

2.4.1. CE Accounting Method

Due to the incomplete nature of energy data statistics, energy-related CE are typically only estimated at the provincial scale. There is a significant positive association between CE and nighttime light statistics. This work completely takes into account the dynamic changes in the link between nighttime light data and CE, drawing on earlier studies [55,56]. The objective of this technique is to provide an accurate description of the dynamic change between the two elements while guaranteeing that the predicted CE at the province and county administrative levels correspond to the real CE at the provincial level. Prior to estimating CE at the county level using nighttime light data, the CE from energy consumption is first computed at the province level.
According to the “China Energy Statistical Yearbook’ and the ‘2006 IPCC Guidelines for National Greenhouse Gas Inventories,” CE is calculated by measuring the amount of energy that is used and the carbon emission factors that go along with it. This study selected the following energy sources: coal, coke, crude oil, gasoline, kerosene, diesel, fuel oil, natural gas, and electricity. The detailed calculation formulae are available in earlier research [55,56].

2.4.2. Kernel Density

A non-parametric technique for estimating an unknown density function is kernel density estimation [57], which intuitively describes the evolution pattern and phase distribution characteristics of the target variable based on the frequency distribution graph. In order to assess the evolution trend and temporal features of CE in Chinese counties from 2000 to 2020, this study makes use of the widely utilized Gaussian kernel function in kernel density estimation. The expression is as follows:
f x = 1 / n h i = 1 n K x i x h
K x = 1 2 π exp x 2 2
where n represents the number of county units in China; xi denotes the individual sample observations; x is the mean of the observations; h is the bandwidth; f(x) is the kernel density estimation function; and K(x) is the kernel function.

2.4.3. Geographic Detector

A new statistical technique called the geographic detector is used to investigate the geographical differentiation characteristics of events and the variables that influence them [58]. By using the q-value, factor detection in geographic detectors, as opposed to conventional econometric techniques, may quantify the influence of distinct urban morphological features on the geographical differentiation of regional CE. By detecting interaction variables, one may further determine how various urban morphological elements interact to affect the geographical differentiation of CE. This model offers special benefits for examining driving forces and understanding geographic differences. In light of this, the model is used in this study to examine how urban morphological characteristics affect CE in Chinese nations. The geographic detector’s precise formula is as follows:
q = 1 h = 1 L N h σ h 2 N σ 2
where q represents the explanatory power of the urban morphological factor on the spatial differentiation of CE; h = 1, …, L denotes the classification or partition of the urban morphological factor; Nh and N are the sample sizes for layer h and the entire study area, respectively; σ h 2 and σ 2 are the variances of the values for layer h and the entire study area.

2.4.4. MGWR

The MGWR model is expressed as follows:
y i = β 0 ( u i , v i ) + j = 1 k β b w j ( u i , v i ) x i j + ε i
where yi is the dependent variable for the study area i, (ui,vi) represents the coordinates of the center of location i, xij is the value of the j-th influencing factor for study area i, β0 is the intercept term, εi is the error term, βbwj(ui,vi) is the local regression coefficient for the j-th influencing factor in the study area i, and bwj denotes the bandwidth used for the regression coefficient of the j-th influencing factor.

2.4.5. Urban Morphology Quantification

Urban morphology refers to the differentiated spatial patterns exhibited by various physical elements within a city through diverse combinations [59]. It encompasses characteristics at the micro level, such as streets and buildings [60], as well as macro-level considerations, including the spatial layout of built-up areas, urban land use structure, and urban development models [61]. The urban morphology discussed in this study primarily focuses on the macro level. Regarding quantification techniques, landscape metrics are important indicators that quantify different aspects of the spatial landscape that are associated with ecological and socioeconomic functions. These metrics enhance understanding of the environmental impacts caused by urban development and are widely used to characterize changes in urban spatial patterns. Based on existing research, this study selected 11 landscape metrics from four aspects—urban expansion, fragmentation, shape, and compactness—to quantify urban morphology. The meanings of these metrics are shown in Table 1. All landscape metric calculations were performed using FRAGSTATS 4.2.

3. Results

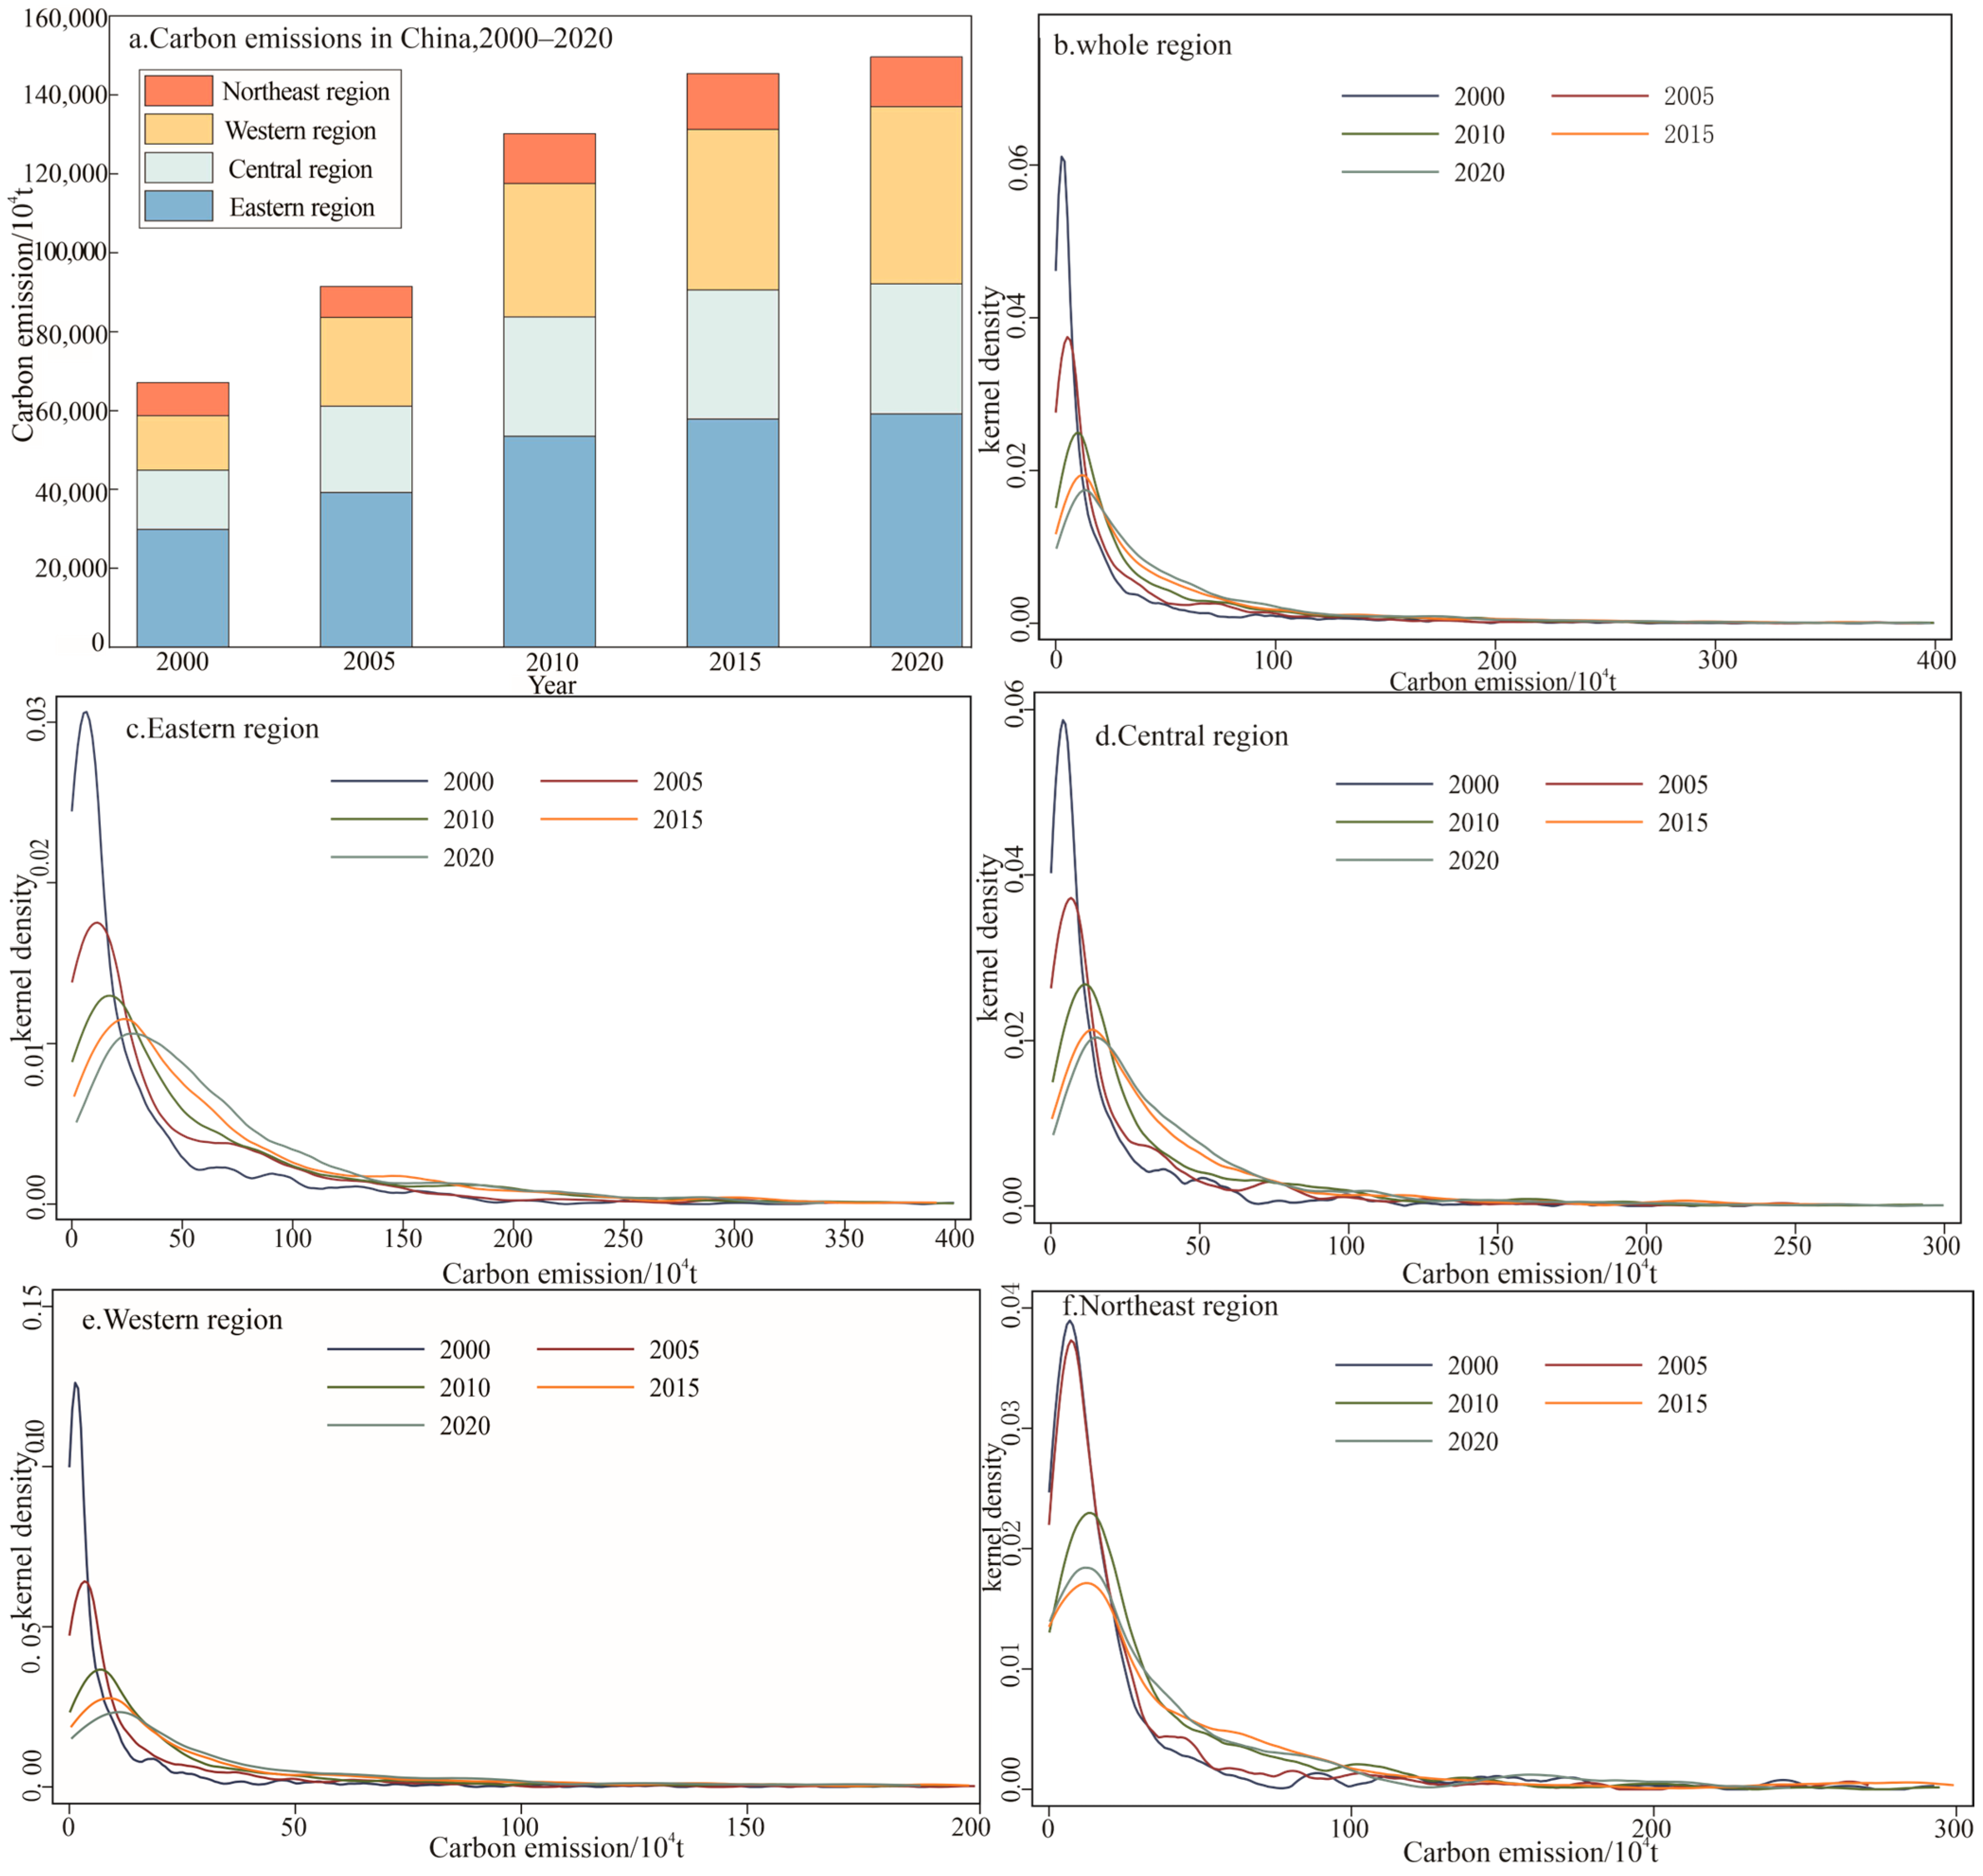
3.1. Spatiotemporal Evolution Characteristics of CE

China’s CE exhibited a steady upward trend from 2000 to 2020, which can be roughly categorized into two phases. From 2000 to 2010, CE grew rapidly, driven primarily by China’s accelerated urbanization and industrialization, with the continuous expansion of built-up areas contributing significantly to emissions. Between 2010 and 2020, however, the growth rate slowed markedly. This deceleration was largely attributed to the introduction of the ecological civilization concept in 2012, which prioritized sustainable and green development. The 2015 issuance of the “Opinions on Accelerating the Advancement of Ecological Civilization Construction” by the Central Committee of the Communist Party of China and the State Council further emphasized ecological protection, encouraged the transformation of economic and industrial structures, and ultimately curbed the rate of carbon emission growth.
Regionally (Figure 3a), the eastern region is the primary contributor to China’s CE, followed by the central, western, and northeastern regions. This phenomenon is mainly due to the eastern region being the economic frontier of China, where rapid economic growth requires a large amount of energy consumption, resulting in a substantial concentration of people and the ongoing growth of populated regions, which in turn causes significant CE. However, CE in the central, western, and northeastern regions has been gradually rising, as has their share of total CE, as a result of the implementation of policies like the revitalization of the northeastern region, the rise of the central region, and the western development strategy. Over the study period, the kernel density curves for the eastern, central, and western regions generally aligned with the kernel density curve of county-scale CE across China. In general, the peaks of the kernel density curves in these regions continuously decreased over the 20-year period, indicating an increasing disparity in CE among county-scale units within these regions. Moreover, throughout the research period, the kernel density curve consistently displayed a single peak, reflecting a polarized state of county-scale CE within the regions. The general distribution in the northeastern area was relatively stable in comparison to the national trend, while the kernel density curve’s peak steadily decreased between 2000 and 2015. However, by 2020, the peak had risen slightly compared to 2015, suggesting a reduction in the disparity of CE among counties in the northeastern region. Furthermore, the northeastern region’s kernel density curve went to the right from 2000 to 2010 but moved left from 2015 to 2020, indicating that after a period of carbon emission growth, the region experienced a decline in emissions. This may be due to the more significant impact of environmental protection policies in the northeastern region.

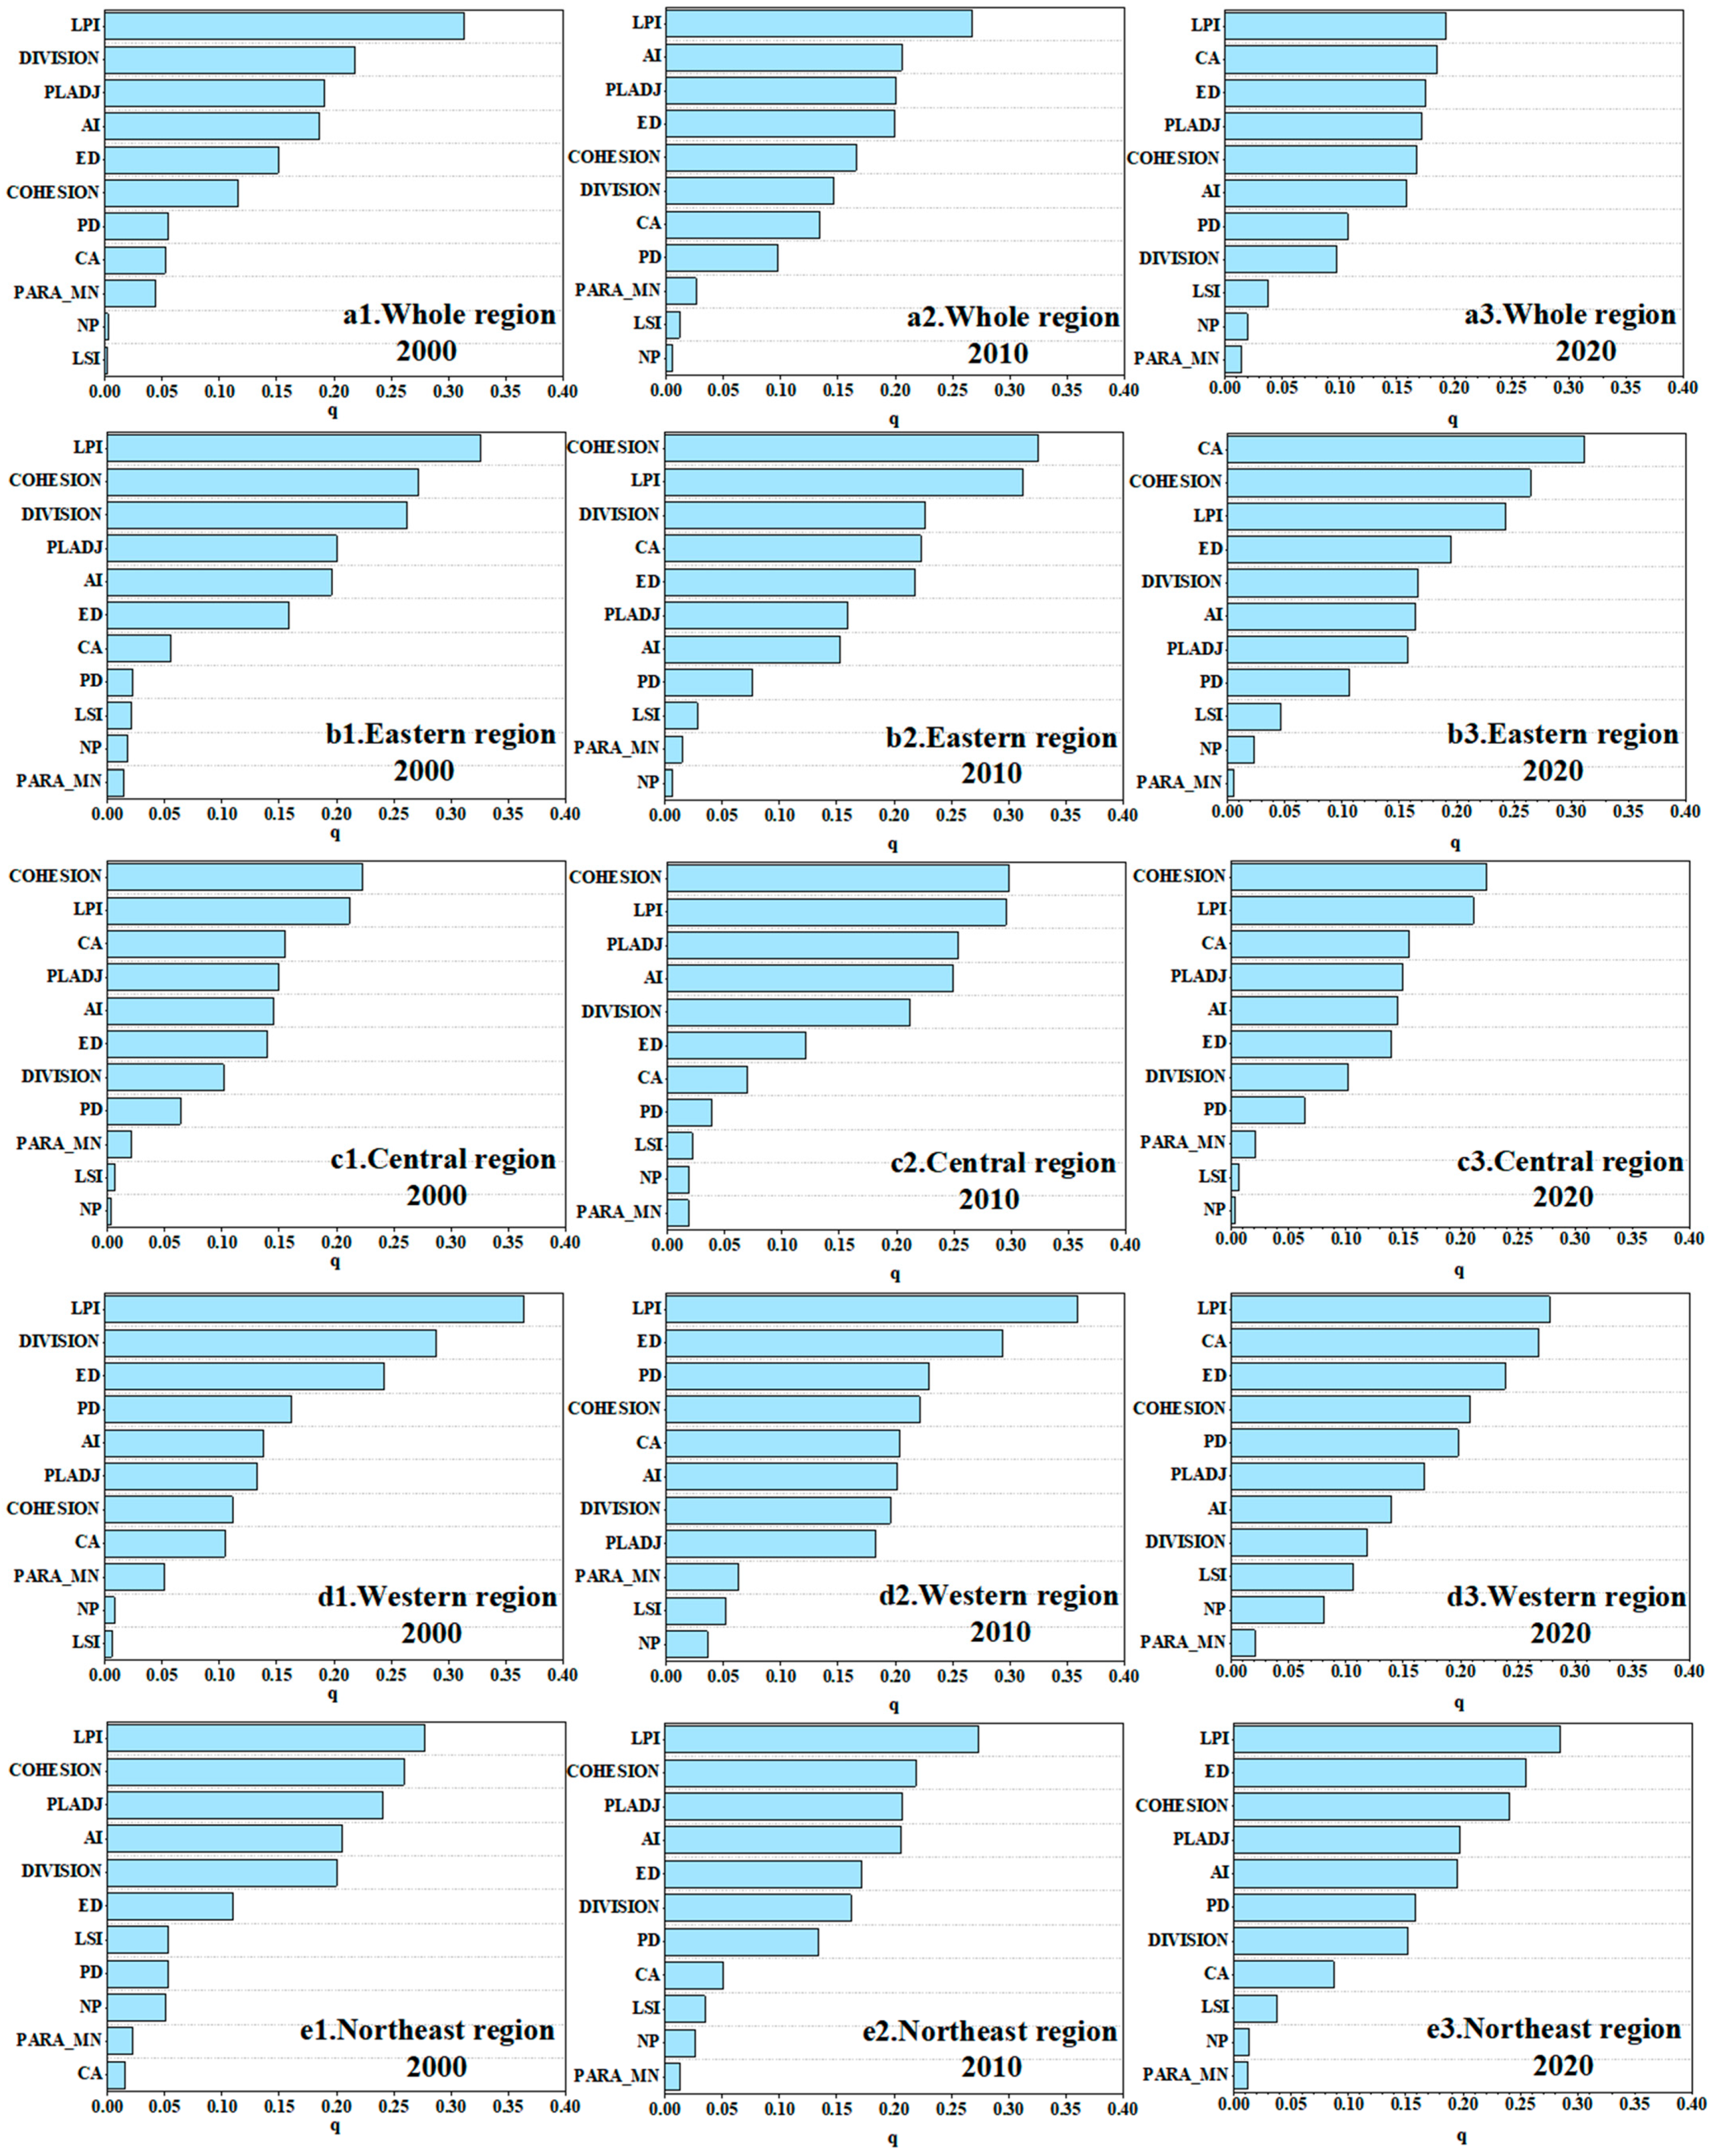
3.2. Global Characteristics of the Impact of Urban Morphology Factors on CE

3.2.1. Single-Factor Detection

Factor detectors were used to analyze the effects of different urban morphology factors on county-scale CE in China (Figure 4). The q value represents the relative strength of the influencing factors; a higher q value indicates a stronger impact on CE. At the one percent significance threshold, every impacting factor passed the test. From the perspective of changes in factor strength, nationwide, LPI, DIVISION, and PARA_MN exhibited a consistent decreasing trend, while COHESION and CA showed a continuously increasing trend. Other factors experienced an increase followed by a decrease. Regionally, in the northeast, PLADJ, AI, DIVISION, NP, and PARA_MN continuously decreased, while CA, LPI, ED, and PD consistently increased. COHESION and LSI initially increased but then decreased. In the eastern region, LPI, DIVISION, and PLADJ consistently decreased, while CA, PD, and LSI increased continuously. COHESION and ED first increased and then decreased. It was discovered that CA grew steadily in every location, indicating that a considerable quantity of CE had resulted from China’s fast urbanization process.
According to the degree of each factor’s effect throughout various time periods, the factors’ relative influence in the national context is as follows: In 2000, the strength of factors was ranked as LPI > DIVISION > PLADJ > AI > ED > COHESION > PD > CA > PARA_MN > NP > LSI. In 2010, the ranking was LPI > AI > PLADJ > ED > COHESION > DIVISION > CA > PD > PARA_MN > LSI > NP. In 2020, the ranking was LPI > CA > ED > PLADJ > COHESION > AI > PD > DIVISION > LSI > NP > PARA_MN. The average influence strength across all periods was LPI > PLADJ > AI > ED > DIVISION > COHESION > CA > PD > PARA_MN > LSI > NP. LPI consistently emerged as the strongest factor, while the influence of CA showed significant growth, moving from eighth position in 2000 to second position in 2020, reflecting the prominent impact of urban expansion on CE. In the northeast region, the factor strengths for 2000 were ranked as LPI > COHESION > PLADJ > AI > DIVISION > ED > LSI > PD > NP > PARA_MN > CA. In 2010, the ranking was LPI > COHESION > PLADJ > AI > ED > DIVISION > PD > CA > LSI > NP > PARA_MN. By 2020, the ranking shifted to LPI > ED > COHESION > PLADJ > AI > PD > DIVISION > CA > LSI > NP > PARA_MN. The average strength over all periods was LPI > COHESION > PLADJ > AI > ED > DIVISION > PD > CA > LSI > NP > PARA_MN. LPI remained the strongest factor, consistent with the national trend, while COHESION was the second strongest factor, and CA’s influence continued to grow. In the eastern region, the factor strengths for 2000 were ranked as LPI > COHESION > DIVISION > PLADJ > AI > ED > CA > PD > LSI > NP > PARA_MN. In 2010, the ranking was COHESION > LPI > DIVISION > CA > ED > PLADJ > AI > PD > LSI > PARA_MN > NP. By 2020, the ranking shifted to CA > COHESION > LPI > ED > DIVISION > AI > PLADJ > PD > LSI > NP > PARA_MN. The average strength for all periods was LPI > COHESION > DIVISION > CA > ED > PLADJ > AI > PD > LSI > NP > PARA_MN. CA showed the most significant growth in influence, moving from seventh position in 2000 to first position in 2020, indicating the substantial impact of urban expansion on CE in the eastern region. Within the central area, the factor strengths for 2000 were ranked as COHESION > LPI > DIVISION > AI > PLADJ > ED > CA > PD > LSI > NP > PARA_MN. In 2010, the ranking was COHESION > LPI > PLADJ > AI > DIVISION > ED > CA > PD > LSI > NP > PARA_MN. By 2020, the ranking shifted to COHESION > LPI > CA > PLADJ > AI > ED > DIVISION > PD > LSI > PARA_MN > NP. The average strength over all periods was COHESION > LPI > PLADJ > AI > DIVISION > ED > CA > PD > LSI > PARA_MN > NP. COHESION remained the strongest factor throughout, indicating its dominant role in the region. In the western region, the factor strengths for 2000 were ranked as LPI > DIVISION > ED > PD > AI > PLADJ > COHESION > CA > PARA_MN > NP > LSI. In 2010, the ranking was LPI > ED > PD > COHESION > CA > AI > DIVISION > PLADJ > PARA_MN > LSI > NP. By 2020, the ranking shifted to LPI > CA > ED > COHESION > PD > PLADJ > AI > DIVISION > LSI > NP > PARA_MN. The average strength over all periods was LPI > ED > DIVISION > PD > CA > COHESION > PLADJ > AI > LSI > PARA_MN > NP. LPI remained the strongest factor, while CA’s influence continued to grow, reflecting the increased impact of urbanization in the western region.

3.2.2. Two-Factor Detection

Interaction detection was applied to investigate the combined effects of various urban morphology factors on county-scale CE in China (Figure 5). A single factor’s independent impact on CE is shown by the values on the diagonal. This study found that the interactions between factors mainly exhibited two types: dual-factor enhancement and nonlinear enhancement, with no instances of nonlinear weakening, single-factor nonlinear weakening, or independent effects. Specifically, the eastern region mainly showed nonlinear enhancement throughout the study period, and the changes were relatively stable (Figure 5(b1–b3)). The central region primarily showed dual-factor enhancement in 2000, while nonlinear enhancement predominated in 2010 and 2020. Throughout the study period, the nonlinear enhancement type increased continuously (Figure 5(c1–c3)). The western region mainly exhibited nonlinear enhancement.
Over the study period, the occurrence of dual-factor enhancement types increased steadily (Figure 5(d1–d3)). The northeast region also showed nonlinear enhancement throughout the study period, with relatively stable changes (Figure 5(e1–e3)). At the national county scale, the interaction effects were mainly dual-factor enhancement, with relatively stable overall changes (Figure 5(a1–a3)). The impact of each urban morphology factor on CE was assessed through the intensity of interactions among the influencing factors. During the study period, in the eastern region (Figure 5(b1–b3)), the interaction strength of LPI, COHESION, and CA with other factors was significantly higher than that of other factors, identifying them as the primary drivers of CE in this region. In the central region (Figure 5(c1–c3)), LPI and COHESION demonstrated stronger interaction effects with other factors, indicating their dominant role in influencing CE. In the northwest (Figure 5(d1–d3)) and northeast regions (Figure 5(e1–e3)), LPI emerged as the primary influencing factor. At the scale of the entire study area (Figure 5(a1–a3)), LPI was consistently identified as the key factor driving CE. Overall (Figure 5), we observed that the interaction between LPI and CA was the strongest, clearly higher than the interaction strength between other influencing factors.

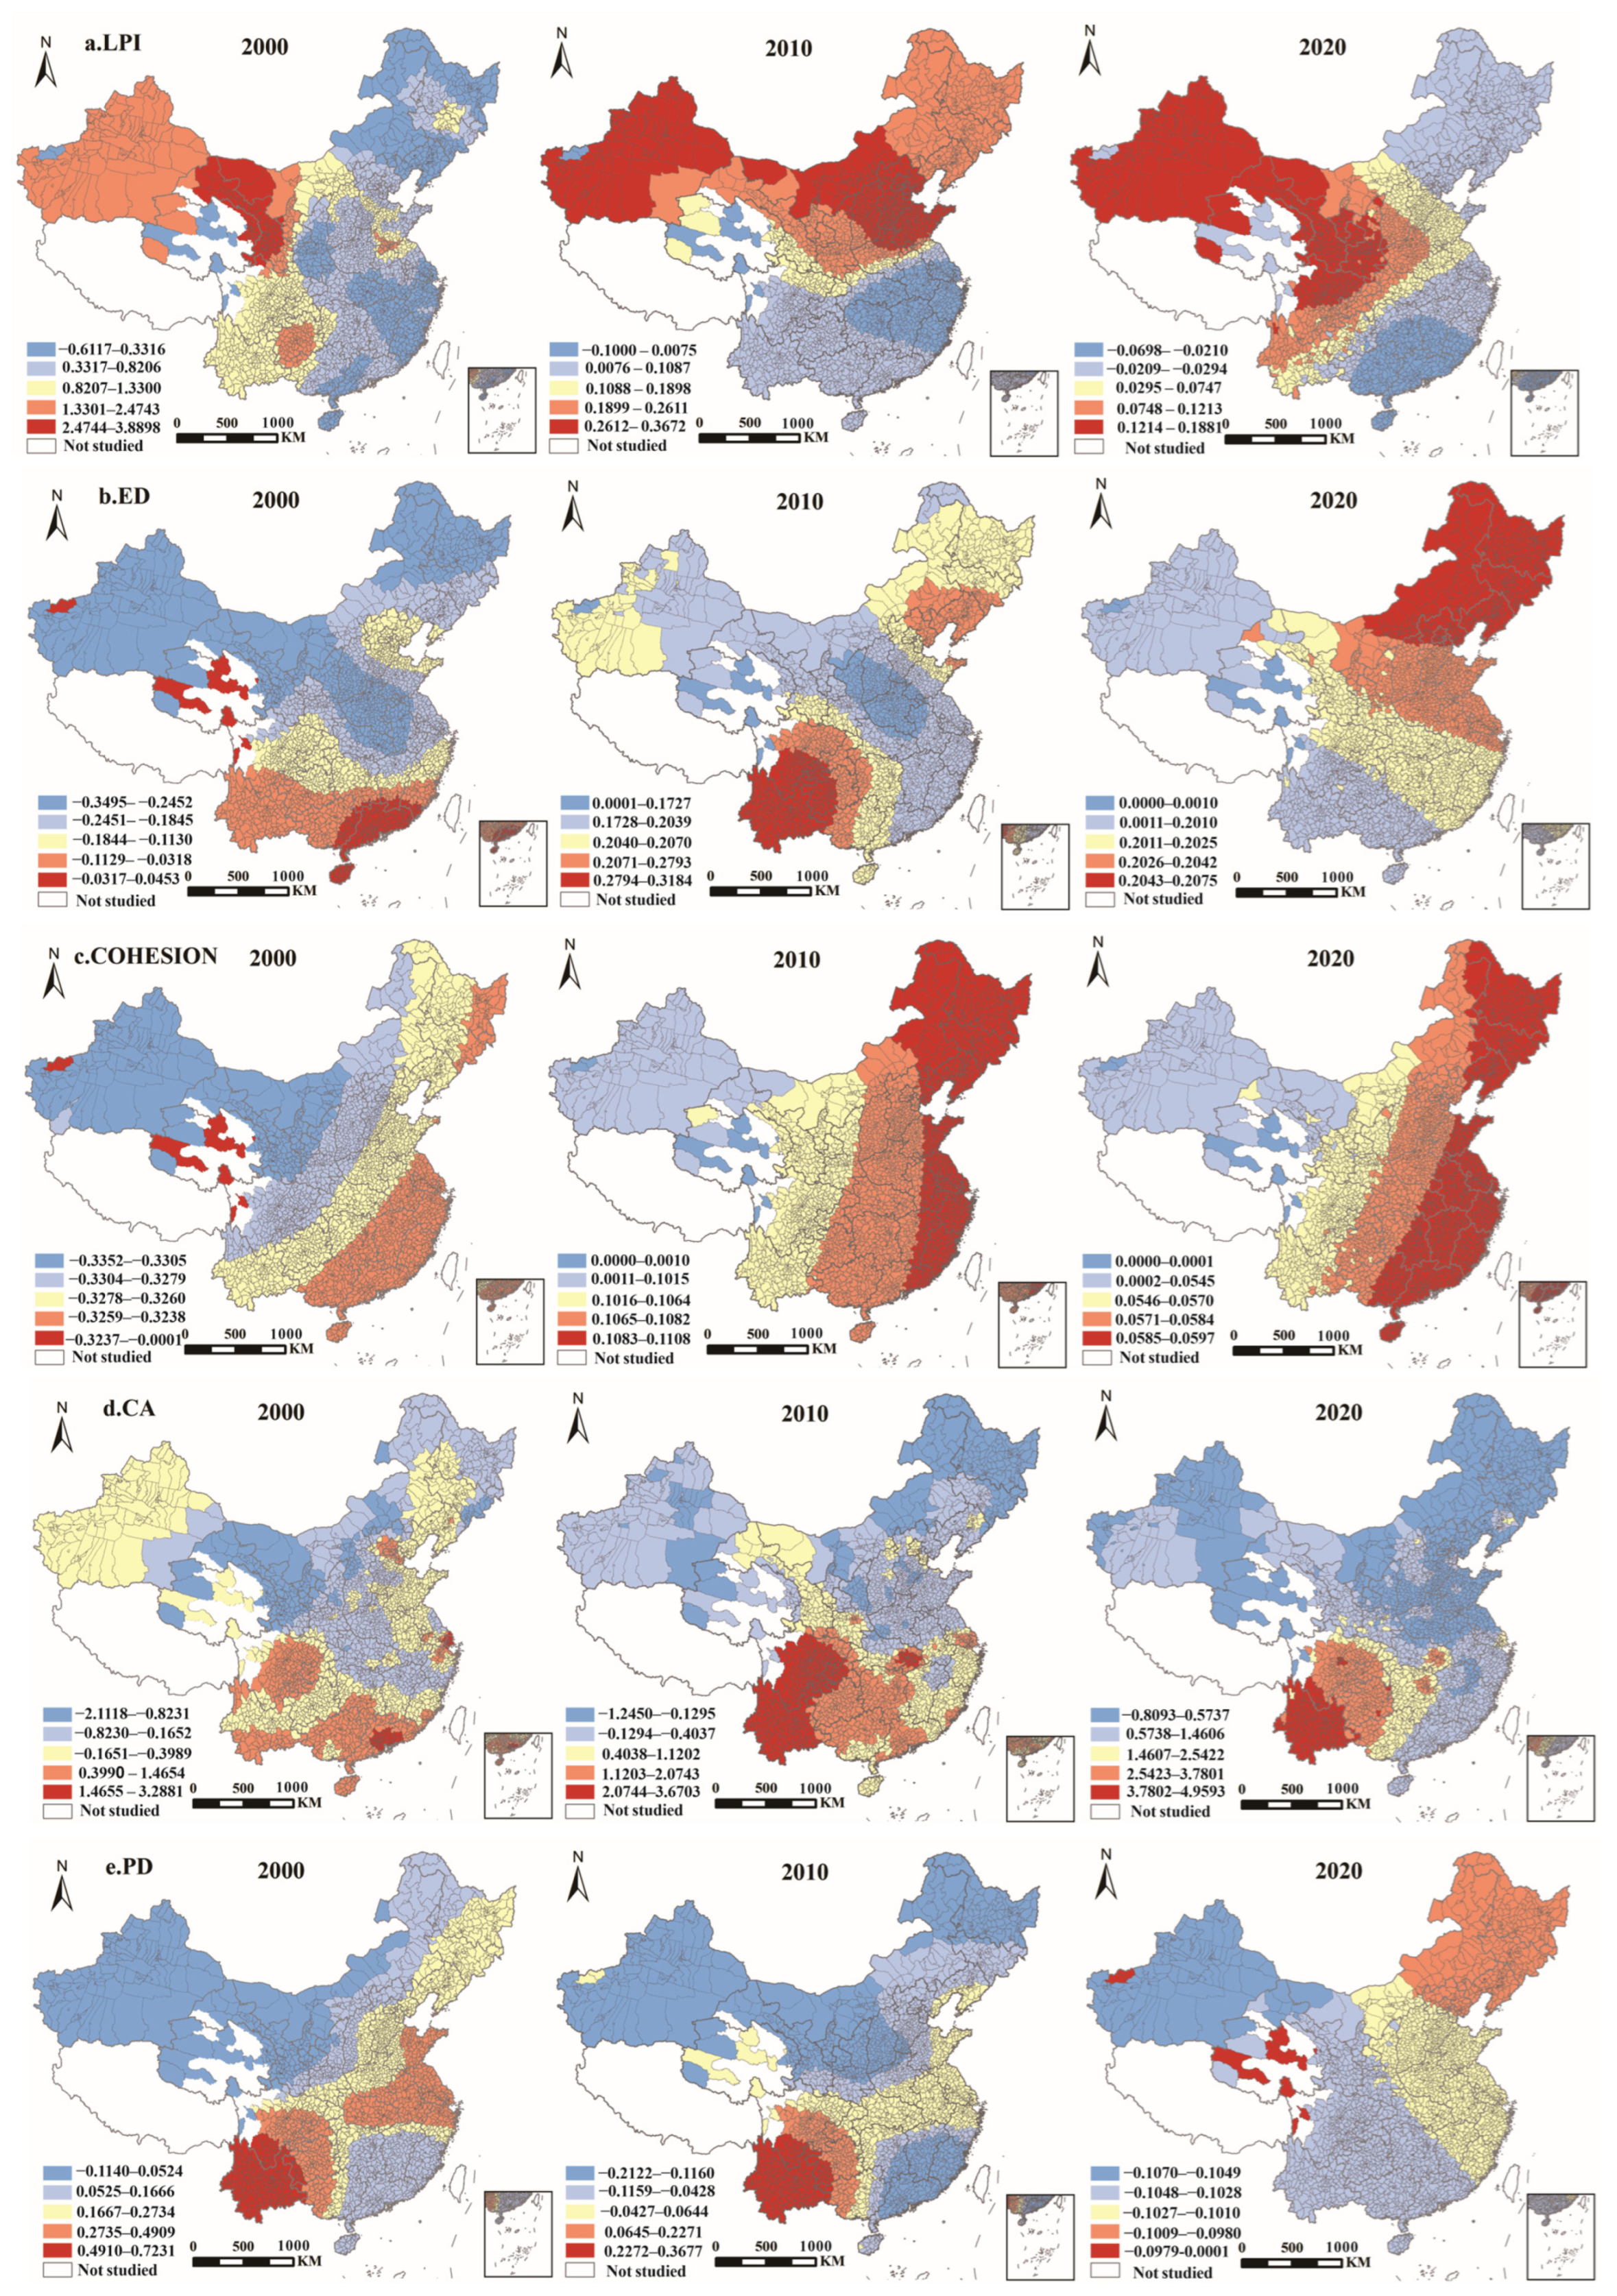
3.3. Localized Impact of Urban Morphology Factors on CE

Although the geographic detector model can identify key urban morphology factors influencing CE, its results only reflect global characteristics, without considering spatial location factors, directional changes in driving forces, spatial heterogeneity, or multi-scale spatial variations. To explore the localized impact of urban morphology factors on CE, this study further incorporated the MGWR model. Explanatory variables that passed significance tests were used to perform local spatial regression analysis on the urban morphology driving factors of CE in Chinese counties for 2000, 2010, and 2020, revealing spatial differences among the driving factors.
Before conducting the analysis, we performed a collinearity test on all relevant urban morphology factors. The results showed that only five factors—LPI, ED, COHESION, CA, and PD—passed the collinearity test for all years. Based on this, we used the MGWR model to further explore the impact of these urban morphology factors on CE. The R2 values for the MGWR model in 2000, 2010, and 2020 were 0.73, 0.76, and 0.75, respectively, and the AIC values were 5098.65, 4631.67, and 4687.39, respectively. These results indicate that the fit of the MGWR met the accuracy requirements. The bandwidth of different urban morphology factors reflects the varying scales of their impact on CE in Chinese counties and measures the spatial heterogeneity of their effects.
As shown in Table 2, the bandwidth of LPI was 86, 618, and 1042, all of which are less than half of the sample size, indicating strong spatial heterogeneity. However, as time progressed, the bandwidth gradually increased, suggesting that the heterogeneity of LPI’s impact on CE in Chinese counties diminished over time. The bandwidths of ED were 492, 823, and 2737, showing a gradual increase. The heterogeneity was strong in 2000 and 2010, but by 2020, it approached a global scale with almost no spatial heterogeneity. This may be related to the uneven development in the early stages of urbanization, and later, the development between regions tended to balance out, reducing spatial heterogeneity. The bandwidth of COHESION remained around 2735 in all years, indicating relative stability and proximity to the global scale, suggesting no significant spatial heterogeneity. The bandwidths of CA were 43, 43, and 45, indicating clear spatial heterogeneity with minimal change. The bandwidths of PD were 331, 400, and 2737, showing a gradual increase. The heterogeneity was strong in 2000 and 2010, but by 2020, it approached the global scale with almost no spatial heterogeneity, possibly reflecting the shift in urban land expansion from concentrated to dispersed and then balanced. Overall, the spatial heterogeneity of the urban morphology factors decreased in the following order: CA > LPI > PD > ED > COHESION.
To further examine the spatial impact scale and heterogeneity of various driving factors on urban energy consumption CE in China, the MGWR model was applied for regression analysis of each variable’s coefficients. The results were visualized using ArcGIS10.7 to reveal spatial distribution characteristics (Figure 6). Findings indicate that LPI (Figure 6a) generally exerted a positive effect on CE across Chinese counties, with this effect diminishing between 2000 and 2020. This change may be closely related to the transformation of urban development models during urbanization, as many cities have shifted from a single-core to a multi-center development model. This shift helps to decentralize urban functions, reduce pressure on single-core areas, and decrease the concentration of CE. Spatially, the positive effect of LPI decreased from west to east, with counties in western regions like Xinjiang, Gansu, and Inner Mongolia showing the most significant positive impact of LPI on CE, while counties in the middle and lower reaches of the Yangtze River had relatively weaker effects. This could be a result of the western provinces’ more trailing urbanization and economic growth model as well as the slower pace of the shift from a single-core to a multi-center development model. In contrast, eastern regions had higher urbanization levels and larger city sizes, making it easier to achieve the shift from a single-core to a multi-center development model. ED (Figure 6b) showed a negative effect on CE in Chinese counties in 2000, but this changed to a positive effect in 2010 and 2020. This change may be related to urban expansion patterns. In the early stages, cities may have rapidly spread outward in a “sprawling” pattern, merging fragmented suburban construction land patches. This process reduced urban fragmentation, thereby decreasing CE to some extent. However, over time, this disorderly expansion pattern led to increased resource consumption, which in turn drove an increase in CE. COHESION (Figure 6c) showed a negative effect on CE in Chinese counties in 2000, but this shifted to a positive effect in 2010 and 2020. CA (Figure 6d) generally had a positive effect on county-scale CE, and its positive effect increased over the study period. PD (Figure 6e) had both positive and negative effects on CE in 2000 and 2010, with the absolute value of the coefficient in 2010 smaller than that in 2000. In terms of spatial distribution, areas with high positive effects were mainly concentrated in Yunnan Province, while regions with negative effects were primarily found in counties in Xinjiang, Inner Mongolia, Guangdong, and Fujian. By 2020, PD had a negative effect across the entire region, with a relatively consistent distribution that aligned with the global effect of PD.

4. Discussion

4.1. The Impact of Urban Morphology on CE

This study found that at the county scale, China’s total CE continuously increased from 2000 to 2020. This trend aligns with previous research at the provincial [67] and prefecture levels [68], indicating that China experienced rapid urbanization during this period, leading to significant changes in urban morphology and the consequent generation of substantial CE. Further analysis using the geographical detector model showed that at the national county-level scale, LPI remained the strongest influencing factor, emphasizing its significant impact on CE, a result also corroborated by studies at the prefecture level [6]. The influence of CA grew most notably in line with the rapid expansion of urban areas in China, further confirming that urban sprawl leads to increased CE [69]. Regionally, LSI emerged as the most important influencing factor in the northeastern, eastern, and central regions. However, COHESION remained a primary influencing factor for CE in the western region throughout the study period. This phenomenon can be attributed to the significant differences in economic structure, development level, and geographic environment between the western region and the eastern, northeastern, and central regions of China. In terms of economic structure, the western region is dominated by resource-based industries [70], characterized by low industrial efficiency and insufficient energy utilization. These factors amplify the impact of urban layout on CE, making COHESION’s role more pronounced. Regarding this stage of development, the western region remained relatively underdeveloped in terms of urbanization and industrialization [71], with smaller and more dispersed urban areas, lagging infrastructure, and underdeveloped transportation networks. These conditions reduced urban connectivity, further intensifying the sensitivity of CE to COHESION. Geographically, the complex terrain of plateaus, mountainous areas, and arid zones restricts compact urban layouts and efficient connectivity, constraining the efficiency of logistics and energy supply, and exacerbating CE. Consequently, COHESION has emerged as a critical determinant of CE.
Meanwhile, the influence of CA on CE has shown a continuous upward trend across different regions of China. Notably, in the eastern region, the impact of CA has risen most significantly, climbing from seventh place in 2000 to first place in 2020. This indicates rapid economic growth and urbanization in the eastern region. With economic expansion, a substantial amount of agricultural land was converted to urban construction land [72], leading to urban expansion at a scale and speed far surpassing those in the central and western regions. During this process, the rapid increase in urban CA drove higher energy consumption and CE. Particularly in economically developed coastal regions such as the Yangtze River Delta and the Pearl River Delta, intensive urbanization and rapid urban expansion significantly strengthened the relationship between CA and CE. Dual-factor interaction analysis revealed two types of interaction effects—bivariate enhancement and nonlinear enhancement. Notably, no interactions of nonlinear weakening, univariate weakening, or independence were observed, indicating that the impact of urban morphology on CE is the result of multiple interacting factors.
Further, we examined the localized effects of urban morphological factors on county-level CE in China using the MGWR model. The analysis highlighted CA as exhibiting the strongest spatial heterogeneity, underscoring the significant variability in urban expansion across counties. In economically developed or highly urbanized regions, the expansion of urban areas (CA) had a pronounced effect on CE, whereas in other regions, this effect was relatively subdued. Thus, the localized impact of CA on CE demonstrates substantial spatial heterogeneity, particularly in regions where the extent of urban expansion varies widely. Overall, CA exerts a positive effect on county-level CE (Figure 6d), consistent with the rapid urban expansion during China’s urbanization process. This finding further corroborates that the expansion of construction land intensifies CE [73]. In southwestern counties such as Yunnan, Sichuan, and Guizhou, the positive impact of CA on CE was especially pronounced. These areas serve as critical ecological corridors in China [74], and the conversion of substantial ecological land to construction land has significantly reduced their carbon sequestration functions [75]. This decline in carbon sink capacity markedly increased CE, creating greater pressure from construction land expansion compared to other regions. COHESION, in contrast, exhibited a global effect, indicating no spatial heterogeneity. However, its impact shifted from a negative effect in 2000 to a positive effect in 2010 and 2020. In 2000, dispersed and fragmented construction land [76] was associated with low-density development and relatively low energy consumption, resulting in reduced CE. Over time, the connectivity and aggregation of construction land increased significantly by 2010 and 2020. This trend was likely linked to accelerated urbanization, denser infrastructure, heightened transportation demands, and advancing industrialization. Aggregated land use is typically accompanied by high-density populations and economic activities [77], significantly elevating energy demands, especially in transportation, construction, and industrial sectors, thereby driving up CE. Moreover, the consistent spatial coefficient of COHESION aligns with its global effect as evidenced by bandwidth results.

4.2. Policy Recommendations

This study offers valuable insights to support carbon reduction policy development at the county scale in China. Based on the findings, the following policy recommendations are proposed: Enhance urban planning and land use management by promoting efficient, compact urban development while preventing uncontrolled expansion, particularly in ecologically sensitive areas. By improving the intensive use of urban construction land, the occupation of ecological land should be minimized, effectively slowing down the growth of CE. Enhance infrastructure planning and promote green transportation networks: The government should strengthen planning for urban infrastructure, promoting the coordinated development of green transportation networks and energy systems between cities. This will alleviate traffic congestion, reduce energy waste, and promote the coordinated development of urban clusters, optimizing resource allocation between regions and reducing energy consumption.
Consider regional differences in policy-making: Given the significant differences in the relationship between urban morphology and CE across regions, policy-making should fully consider regional particularities. In the western regions, priority should be given to protecting the ecological environment and reducing the occupation of ecological function areas by constructing land to maintain carbon sink capacity. In the eastern regions, the speed and mode of urban expansion should be controlled, promoting the intensive development of urban clusters, improving land use efficiency, and reducing CE pressure.

4.3. Research Deficiencies and Prospects

While this study has produced meaningful results, certain limitations remain. Firstly, the calculation of urban CE relies solely on energy consumption data due to data availability constraints, which may introduce some inaccuracies. Future studies should focus on more precise methodologies to improve the accuracy of urban CE measurements. Secondly, the assessment of urban morphology in this study adopts a macro-level approach, lacking detailed micro-level analysis. Future research should integrate both macro and micro perspectives to provide a more comprehensive understanding of urban morphological characteristics. Lastly, the study’s time frame is limited to 20 years. Extending the temporal scope in future studies could yield more nuanced insights.

5. Conclusions

As the most fundamental administrative unit in China and a critical driver of new urbanization, county-level units play an indispensable role in promoting low-carbon development. Investigating the impact of urban morphology on CE at the county scale provides valuable scientific support for local governments to formulate precise low-carbon development policies. However, existing research has predominantly concentrated on provincial capitals, urban clusters, and prefecture-level cities, with relatively limited focus on the county scale. In response to this gap, this study examines China’s county-level units as the research object, offering a comprehensive analysis of the global and local characteristics of urban morphology’s impact on CE across counties from 2000 to 2020. The findings aim to provide theoretical support for the formulation of effective carbon reduction measures in China.
Our findings reveal that county-level CE in China have shown a continuous upward trend from 2000 to 2020. Among the influencing factors, the LSI is identified as the most significant, while the impact of the Urban Patch Area (CA) has been steadily increasing across Chinese counties. At the same time, the interactions between various factors are primarily characterized by bi-factor enhancement and nonlinear enhancement, with the interaction between LSI and CA being the most prominent. The spatial distribution of urban morphological influencing factors demonstrates varying degrees of spatial heterogeneity, ranked in the order of CA > LPI > PD > ED > COHESION. Both LPI and CA consistently exhibit positive effects on CE.

Author Contributions

Conceptualization, C.L. and G.C.; methodology, C.L. and H.L; software, C.L. and J.L.; validation, C.L.; formal analysis, C.L. and G.M.; data curation, C.L. and H.L.; writing—original draft preparation, C.L.; writing—review and editing, C.L; supervision, G.C. All authors have read and agreed to the published version of the manuscript.

Funding

This work was supported by Postdoctoral Special Project of Anhui Jianzhu University (Grant No. XJ2025000103).

Data Availability Statement

The original contributions presented in this study are included in the article. Data will be made available on request.

Conflicts of Interest

The authors declare no conflict of interest.

References

  1. Santosh, M.; Groves, D.I.; Yang, C. Habitable planet to sustainable civilization: Global climate change with related clean energy transition reliant on declining critical metal resources. Gondwana Res. 2024, 130, 220–233. [Google Scholar] [CrossRef]
  2. Saxena, V. Water Quality, Air Pollution, and Climate Change: Investigating the Environmental Impacts of Industrialization and Urbanization. Water Air Soil Pollut. 2025, 236, 73. [Google Scholar] [CrossRef]
  3. Paul Nathaniel, T.; Bhatt, S.; Gokulnath, S.R.; Vasanthakumaran, K.; Jeberson Solomon, J.; Naveen, S.K.; Selvarani, B.; Akhila, S.; Subodh Gupta, S.; Varghese, T. Carbon Credits and Sustainable Aquaculture: Pathway to a Greener Future. In Food Security, Nutrition and Sustainability Through Aquaculture Technologies; Springer Nature: Cham, Switzerland, 2025; pp. 269–287. [Google Scholar]
  4. Li, M.; Pelz, S.; Lamboll, R.; Wang, C.; Rogelj, J. A principle-based framework to determine countries’ fair warming contributions to the Paris Agreement. Nat. Commun. 2025, 16, 1043. [Google Scholar] [CrossRef]
  5. Woon, K.S.; Phuang, Z.X.; Taler, J.; Varbanov, P.S.; Chong, C.T.; Klemeš, J.J.; Lee, C.T. Recent advances in urban green energy development towards carbon emissions neutrality. Energy 2023, 267, 126502. [Google Scholar] [CrossRef]
  6. Li, Z.; Wang, F.; Kang, T.; Wang, C.; Chen, X.; Miao, Z.; Zhang, L.; Ye, Y.; Zhang, H. Exploring differentiated impacts of socioeconomic factors and urban forms on city-level CO2 emissions in China: Spatial heterogeneity and varying importance levels. Sustain. Cities Soc. 2022, 84, 104028. [Google Scholar] [CrossRef]
  7. Chancel, L. Global carbon inequality over 1990–2019. Nat. Sustain. 2022, 5, 931–938. [Google Scholar] [CrossRef]
  8. Adun, H.; Ampah, J.D.; Bamisile, O.; Hu, Y. The synergistic role of carbon dioxide removal and emission reductions in achieving the Paris Agreement goal. Sustain. Prod. Consum. 2024, 45, 386–407. [Google Scholar] [CrossRef]
  9. Michaelowa, A.; Allen, M.; Sha, F. Policy instruments for limiting global temperature rise to 1.5 °C—Can humanity rise to the challenge? Clim. Policy 2018, 18, 275–286. [Google Scholar] [CrossRef]
  10. Dissanayake, S.; Mahadevan, R.; Asafu-Adjaye, J. Evaluating the efficiency of carbon emissions policies in a large emitting developing country. Energy Policy 2020, 136, 111080. [Google Scholar] [CrossRef]
  11. Krishnakumar, D.; Josukutty, C.A. China’s Climate Diplomacy and Global Environment Challenges: The Conflict Between Sustainable Development and National Interests. East Asia 2025, 42, 201–219. [Google Scholar] [CrossRef]
  12. Shi, F.; Liao, X.; Shen, L.; Meng, C.; Lai, Y. Exploring the spatiotemporal impacts of urban form on CO2 emissions: Evidence and implications from 256 Chinese cities. Environ. Impact Assess. Rev. 2022, 96, 106850. [Google Scholar] [CrossRef]
  13. Dhakal, S. GHG emissions from urbanization and opportunities for urban carbon mitigation. Curr. Opin. Environ. Sustain. 2010, 2, 277–283. [Google Scholar] [CrossRef]
  14. Liu, Z.; Deng, Z.; He, G.; Wang, H.; Zhang, X.; Lin, J.; Qi, Y.; Liang, X. Challenges and opportunities for carbon neutrality in China. Nat. Rev. Earth Environ. 2022, 3, 141–155. [Google Scholar] [CrossRef]
  15. Guo, F.; Schlink, U.; Wu, W.; Mohamdeen, A. Differences in Urban Morphology between 77 Cities in China and Europe. Remote Sens. 2022, 14, 5462. [Google Scholar] [CrossRef]
  16. Ronchi, S.; Salata, S.; Arcidiacono, A. An indicator of urban morphology for landscape planning in Lombardy (Italy). Manag. Environ. Qual. Int. J. 2018, 29, 623–642. [Google Scholar] [CrossRef]
  17. Wang, S.; Wang, J.; Fang, C.; Li, S. Estimating the impacts of urban form on CO2 emission efficiency in the Pearl River Delta, China. Cities 2019, 85, 117–129. [Google Scholar] [CrossRef]
  18. Roxon, J.; Ulm, F.J.; Pellenq, R.J.M. Urban heat island impact on state residential energy cost and CO2 emissions in the United States. Urban Clim. 2020, 31, 100546. [Google Scholar] [CrossRef]
  19. Tsai, Y. Quantifying Urban Form: Compactness versus ‘Sprawl’. Urban Stud. 2005, 42, 141–161. [Google Scholar] [CrossRef]
  20. He, S.; Yu, S.; Li, G.; Zhang, J. Exploring the influence of urban form on land-use efficiency from a spatiotemporal heterogeneity perspective: Evidence from 336 Chinese cities. Land Use Policy 2020, 95, 104576. [Google Scholar] [CrossRef]
  21. Jabareen, Y.R. Sustainable Urban Forms: Their Typologies, Models, and Concepts. J. Plan. Educ. Res. 2006, 26, 38–52. [Google Scholar] [CrossRef]
  22. Zhang, H.; Peng, J.; Wang, R.; Zhang, J.; Yu, D. Spatial planning factors that influence CO2 emissions: A systematic literature review. Urban Clim. 2021, 36, 100809. [Google Scholar] [CrossRef]
  23. Bechle, M.J.; Millet, D.B.; Marshall, J.D. Effects of Income and Urban Form on Urban NO2, Global Evidence from Satellites. Environ. Sci. Technol. 2011, 45, 4914–4919. [Google Scholar] [CrossRef] [PubMed]
  24. Fang, C.; Wang, S.; Li, G. Changing urban forms and carbon dioxide emissions in China: A case study of 30 provincial capital cities. Appl. Energy 2015, 158, 519–531. [Google Scholar] [CrossRef]
  25. Zhang, X.; Wang, X.; Du, S.; Tian, S.; Jia, A.; Ye, Y.; Gao, N.; Kuang, X.; Shi, X. A systematic review of urban form generation and optimization for performance-driven urban design. Build. Environ. 2024, 253, 111269. [Google Scholar] [CrossRef]
  26. Yang, W.; Li, T.; Cao, X. Examining the impacts of socio-economic factors, urban form and transportation development on CO2 emissions from transportation in China: A panel data analysis of China’s provinces. Habitat Int. 2015, 49, 212–220. [Google Scholar] [CrossRef]
  27. Muñiz, I.; Rojas, C. Urban form and spatial structure as determinants of per capita greenhouse gas emissions considering possible endogeneity and compensation behaviors. Environ. Impact Assess. Rev. 2019, 76, 79–87. [Google Scholar] [CrossRef]
  28. Elmarakby, E.; Elkadi, H. Impact of urban morphology on Urban Heat Island in Manchester’s transit-oriented development. J. Clean. Prod. 2024, 434, 140009. [Google Scholar] [CrossRef]
  29. Lu, S.; Huang, Y.; Shi, C.; Yang, X. Exploring the Associations Between Urban Form and Neighborhood Vibrancy: A Case Study of Chengdu, China. ISPRS Int. J. Geo-Inf. 2019, 8, 165. [Google Scholar] [CrossRef]
  30. Fleischmann, M.; Romice, O.; Porta, S. Measuring urban form: Overcoming terminological inconsistencies for a quantitative and comprehensive morphologic analysis of cities. Environ. Plan. B 2020, 48, 2133–2150. [Google Scholar] [CrossRef]
  31. Zuo, S.; Dai, S.; Ju, J.; Meng, F.; Ren, Y.; Tian, Y.; Wang, K. The importance of the functional mixed entropy for the explanation of residential and transport CO2 emissions in the urban center of China. J. Clean. Prod. 2022, 380, 134947. [Google Scholar] [CrossRef]
  32. Ou, J.; Liu, X.; Li, X.; Chen, Y. Quantifying the relationship between urban forms and carbon emissions using panel data analysis. Landsc. Ecol. 2013, 28, 1889–1907. [Google Scholar] [CrossRef]
  33. Wang, Y.; Hayashi, Y.; Chen, J.; Li, Q. Changing Urban Form and Transport CO2 Emissions: An Empirical Analysis of Beijing, China. Sustainability 2014, 6, 4558–4579. [Google Scholar] [CrossRef]
  34. Lin, J.; Lu, S.; He, X.; Wang, F. Analyzing the impact of three-dimensional building structure on CO2 emissions based on random forest regression. Energy 2021, 236, 121502. [Google Scholar] [CrossRef]
  35. Xu, Y.; Yang, J.; Zheng, Y.; Li, W. Impacts of two-dimensional and three-dimensional urban morphology on urban thermal environments in high-density cities: A case study of Hong Kong. Build. Environ. 2024, 252, 111249. [Google Scholar] [CrossRef]
  36. Liu, X.; Sweeney, J. Modelling the impact of urban form on household energy demand and related CO2 emissions in the Greater Dublin Region. Energy Policy 2012, 46, 359–369. [Google Scholar] [CrossRef]
  37. Shi, K.; Xu, T.; Li, Y.; Chen, Z.; Gong, W.; Wu, J.; Yu, B. Effects of urban forms on CO2 emissions in China from a multi-perspective analysis. J. Environ. Manag. 2020, 262, 110300. [Google Scholar] [CrossRef]
  38. Zheng, S.; Huang, Y.; Sun, Y. Effects of Urban Form on Carbon Emissions in China: Implications for Low-Carbon Urban Planning. Land 2022, 11, 1343. [Google Scholar] [CrossRef]
  39. Shi, X.; Cheng, Y.; Zhang, J.; Zhang, Y.; Wei, L.; Wang, Y. Impacts of the Urban Form Structure on Carbon Emission Efficiency in China’s Three Major Urban Agglomerations: A Study from an Urban Economic Activities Perspective. Sustainability 2025, 17, 3984. [Google Scholar] [CrossRef]
  40. Wang, Y.; Liu, J.; Wang, J.; Liu, Z. Exploring the effect of city size on carbon emissions: Evidence from 259 prefecture-level cities in China. Environ. Sci. Pollut. Res. 2023, 30, 86165–86177. [Google Scholar] [CrossRef]
  41. Wang, S.; Liu, X.; Zhou, C.; Hu, J.; Ou, J. Examining the impacts of socioeconomic factors, urban form, and transportation networks on CO2 emissions in China’s megacities. Appl. Energy 2017, 185, 189–200. [Google Scholar] [CrossRef]
  42. Cai, M.; Ren, C.; Shi, Y.; Chen, G.; Xie, J.; Ng, E. Modeling spatiotemporal carbon emissions for two mega-urban regions in China using urban form and panel data analysis. Sci. Total Environ. 2023, 857, 159612. [Google Scholar] [CrossRef] [PubMed]
  43. Liu, X.; Wei, Y.; Jin, X.; Luo, X.; Zhou, Y. County-level carbon compensation zoning based on China’s major function-oriented zones. J. Environ. Manag. 2024, 367, 121988. [Google Scholar] [CrossRef] [PubMed]
  44. Fan, C.; Tian, L.; Zhou, L.; Hou, D.; Song, Y.; Qiao, X.; Li, J. Examining the impacts of urban form on air pollutant emissions: Evidence from China. J. Environ. Manag. 2018, 212, 405–414. [Google Scholar] [CrossRef]
  45. Lu, J.; Li, B.; Li, H.; Al-Barakani, A. Expansion of city scale, traffic modes, traffic congestion, and air pollution. Cities 2021, 108, 102974. [Google Scholar] [CrossRef]
  46. Yang, C.; Zhao, S. Scaling of Chinese urban CO2 emissions and multiple dimensions of city size. Sci. Total Environ. 2023, 857, 159502. [Google Scholar] [CrossRef]
  47. Yue, W.; Fan, P.; Wei, Y.D.; Qi, J. Economic development, urban expansion, and sustainable development in Shanghai. Stoch. Environ. Res. Risk Assess. 2014, 28, 783–799. [Google Scholar] [CrossRef]
  48. Avtar, R.; Tripathi, S.; Aggarwal, A.K.; Kumar, P. Population–Urbanization–Energy Nexus: A Review. Resources 2019, 8, 136. [Google Scholar] [CrossRef]
  49. Falahatkar, S.; Rezaei, F. Towards low carbon cities: Spatio-temporal dynamics of urban form and carbon dioxide emissions. Remote Sens. Appl. Soc. Environ. 2020, 18, 100317. [Google Scholar] [CrossRef]
  50. Zuo, S.; Dai, S.; Ren, Y. More fragmentized urban form more CO2 emissions? A comprehensive relationship from the combination analysis across different scales. J. Clean. Prod. 2020, 244, 118659. [Google Scholar] [CrossRef]
  51. Sun, J.; Zhou, T.; Wang, D. Relationships between urban form and air quality: A reconsideration based on evidence from China’s five urban agglomerations during the COVID-19 pandemic. Land Use Policy 2022, 118, 106155. [Google Scholar] [CrossRef]
  52. Wang, J.; Wang, S.; Li, S. Examining the spatially varying effects of factors on PM2.5 concentrations in Chinese cities using geographically weighted regression modeling. Environ. Pollut. 2019, 248, 792–803. [Google Scholar] [CrossRef] [PubMed]
  53. Chen, Z.; Yu, B.; Yang, C.; Zhou, Y.; Yao, S.; Qian, X.; Wang, C.; Wu, B.; Wu, J. An extended time series (2000–2018) of global NPP-VIIRS-like nighttime light data from a cross-sensor calibration. Earth Syst. Sci. Data Discuss. 2021, 13, 889–906. [Google Scholar] [CrossRef]
  54. Yang, J.; Huang, X. 30 m annual land cover and its dynamics in China from 1990 to 2019. Earth Syst. Sci. Data Discuss. 2021, 2021, 1–29. [Google Scholar]
  55. Song, M.; Zhang, L.; Gao, Y.; Li, E. Spatiotemporal evolution and influence mechanism of the carbon footprint of energy consumption at county level in the Yellow River Basin. Sci. Total Environ. 2023, 883, 163710. [Google Scholar] [CrossRef]
  56. Liu, C.; Hu, S.; Wu, S.; Song, J.; Li, H. County-level land use carbon emissions in China: Spatiotemporal patterns and impact factors. Sustain. Cities Soc. 2024, 105, 105304. [Google Scholar] [CrossRef]
  57. Sengupta, K.; Burman, P.; Sharma, R. A non-parametric approach for independent component analysis using kernel density estimation. In Proceedings of the 2004 IEEE Computer Society Conference on Computer Vision and Pattern Recognition, CVPR 2004, Washington, DC, USA, 27 June–2 July 2004; p. II. [Google Scholar]
  58. Jinfeng, W.; Chengdong, X. Geographic Probe: Principles and Prospects. Acta Geogr. Sin. 2017, 72, 116–134. [Google Scholar]
  59. Schwarz, N. Urban form revisited—Selecting indicators for characterising European cities. Landsc. Urban Plan. 2010, 96, 29–47. [Google Scholar] [CrossRef]
  60. Mohamed, A.A.; Ubarevičienė, R.; van Ham, M. Morphological evaluation and regeneration of informal settlements: An experience-based urban design approach. Cities 2022, 128, 103798. [Google Scholar] [CrossRef]
  61. Sharifi, A. Resilient urban forms: A macro-scale analysis. Cities 2019, 85, 1–14. [Google Scholar] [CrossRef]
  62. Fang, C.; Li, G.; Wang, S. Changing and Differentiated Urban Landscape in China: Spatiotemporal Patterns and Driving Forces. Environ. Sci. Technol. 2016, 50, 2217–2227. [Google Scholar] [CrossRef]
  63. Tian, L.; Li, Y.; Yan, Y.; Wang, B. Measuring urban sprawl and exploring the role planning plays: A shanghai case study. Land Use Policy 2017, 67, 426–435. [Google Scholar] [CrossRef]
  64. Yang, Y.; Li, H. Monitoring spatiotemporal characteristics of land-use carbon emissions and their driving mechanisms in the Yellow River Delta: A grid-scale analysis. Environ. Res. 2022, 214, 114151. [Google Scholar] [CrossRef] [PubMed]
  65. Wu, J.; Jenerette, G.D.; Buyantuyev, A.; Redman, C.L. Quantifying spatiotemporal patterns of urbanization: The case of the two fastest growing metropolitan regions in the United States. Ecol. Complex. 2011, 8, 1–8. [Google Scholar] [CrossRef]
  66. Dadashpoor, H.; Shahhossein, G. Defining urban sprawl: A systematic review of 130 definitions. Habitat Int. 2024, 146, 103039. [Google Scholar] [CrossRef]
  67. Li, S.; Yao, L.; Zhang, Y.; Zhao, Y.; Sun, L. China’s provincial carbon emission driving factors analysis and scenario forecasting. Environ. Sustain. Indic. 2024, 22, 100390. [Google Scholar] [CrossRef]
  68. Yang, X.; Jin, K.; Duan, Z.; Gao, Y.; Sun, Y.; Gao, C. Spatial-temporal differentiation and influencing factors of carbon emission trajectory in Chinese cities—A case study of 247 prefecture-level cities. Sci. Total Environ. 2024, 928, 172325. [Google Scholar] [CrossRef]
  69. Monkkonen, P.; Guerra, E.; Escamilla, J.M.; Cos, C.C.; Tapia-McClung, R. A global analysis of land use regulation, urban form, and greenhouse gas emissions. Cities 2024, 147, 104801. [Google Scholar] [CrossRef]
  70. Yu, J.; Li, J.; Zhang, W. Identification and classification of resource-based cities in China. J. Geogr. Sci. 2019, 29, 1300–1314. [Google Scholar] [CrossRef]
  71. Zhou, W.; Zhu, B.; Chen, D.; Griffy-Brown, C.; Ma, Y.; Fei, W. Energy consumption patterns in the process of China’s urbanization. Popul. Environ. 2012, 33, 202–220. [Google Scholar] [CrossRef]
  72. Wei, G.; He, B.-J.; Liu, Y.; Li, R. How does rapid urban construction land expansion affect the spatial inequalities of ecosystem health in China? Evidence from the country, economic regions and urban agglomerations. Environ. Impact Assess. Rev. 2024, 106, 107533. [Google Scholar] [CrossRef]
  73. Deng, C.; Liu, J.; Liu, Y.; Li, Z.; Nie, X.; Hu, X.; Wang, L.; Zhang, Y.; Zhang, G.; Zhu, D.; et al. Spatiotemporal dislocation of urbanization and ecological construction increased the ecosystem service supply and demand imbalance. J. Environ. Manag. 2021, 288, 112478. [Google Scholar] [CrossRef] [PubMed]
  74. Yang, G.; Gong, G.; Luo, Y.; Yang, Y.; Gui, Q. Spatiotemporal Characteristics and Influencing Factors of Tourism–Urbanization–Technology–Ecological Environment on the Yunnan–Guizhou–Sichuan Region: An Uncoordinated Coupling Perspective. Int. J. Environ. Res. Public Health 2022, 19, 8885. [Google Scholar] [CrossRef] [PubMed]
  75. Chen, X.; Yu, L.; Du, Z.; Xu, Y.; Zhao, J.; Zhao, H.; Zhang, G.; Peng, D.; Gong, P. Distribution of ecological restoration projects associated with land use and land cover change in China and their ecological impacts. Sci. Total Environ. 2022, 825, 153938. [Google Scholar] [CrossRef]
  76. Wei, Y.; Zhang, Z. Assessing the fragmentation of construction land in urban areas: An index method and case study in Shunde, China. Land Use Policy 2012, 29, 417–428. [Google Scholar] [CrossRef]
  77. Li, Z.; Jiao, L.; Zhang, B.; Xu, G.; Liu, J. Understanding the pattern and mechanism of spatial concentration of urban land use, population and economic activities: A case study in Wuhan, China. Geo-Spat. Inf. Sci. 2021, 24, 678–694. [Google Scholar] [CrossRef]
Figure 1. Research framework diagram.
Land 14 01163 g001
Figure 2. Location map.
Land 14 01163 g002
Figure 3. Spatiotemporal evolution of CE in different regions of China.
Land 14 01163 g003
Figure 4. q-value chart of carbon emission influencing factors in Chinese counties (2000–2020).
Land 14 01163 g004
Figure 5. The double factor q-value map of carbon emission influencing factors in Chinese counties.
Land 14 01163 g005
Figure 6. Spatial patterns of MGWR coefficients for urban morphology factors (2000–2020).
Land 14 01163 g006
Table 1. Quantification indicators of urban morphology.
Primary IndexSecondary IndexPractical MeaningReference
Urban expansionLargest patch index (LPI)The percentage of the largest urban patches in the total area can reflect the extent to which urban scale expansion has the characteristics of a single-core spatial pattern.[27,62]
Class Area (CA)Represents the total area of urban patches, serving as a core indicator for directly quantifying urban scale expansion.
Urban fragmentationNumber of patches (NP)Describes the fragmentation degree of urban built-up areas. The greater the number of patches, the higher the degree of urban sprawl and fragmentation.[6,63]
Landscape division index (DIVISION)Reflects the degree of landscape fragmentation
Path density (PD)Reflects the connectivity within the urban area.
Urban shapeMean perimeter–area ratio (PARA_MN)Represents the ratio of the average perimeter to the area of urban patches, reflecting the regularity of urban patch shapes. A smaller value indicates a more regular urban spatial shape.[64,65]
Landscape shape index (LSI)Reflects the degree of irregularity within the city. A smaller value indicates a more regular city, while a higher value indicates a more irregular city.
ED (edge density)Represents the sprawl and shape of urban land boundaries and can be used to describe the complexity of urban morphology.
Urban compactnessPatch cohesion index (COHESION)Used to measure the connectivity and aggregation degree of similar patches within the landscape. It reflects the ability of patches to maintain coherence within the landscape, especially in cases where the distribution is more dispersed or fragmented.[17,66]
Percentage of like adjacencies (PLADJ)Represents the percentage of neighboring pixels of urban patches, indicating the degree of aggregation of urban patches. A larger value indicates a higher continuity of urban patches and a more clustered distribution pattern.
AI (aggregation index)The aggregation index (AI) is used to determine the compactness of the landscape. A lower AI value indicates greater dispersion, while a higher AI value indicates greater compactness.
Table 2. Spatial impact scale of driving factors based on MGWR.
VariableBandwidth 2000Bandwidth 2010Bandwidth 2020
Intercept878843
LPI866181042
ED4928232737
COHESION273527362737
CA434345
PD3314002737
Disclaimer/Publisher’s Note: The statements, opinions and data contained in all publications are solely those of the individual author(s) and contributor(s) and not of MDPI and/or the editor(s). MDPI and/or the editor(s) disclaim responsibility for any injury to people or property resulting from any ideas, methods, instructions or products referred to in the content.

