Abstract
This study used randomised controlled trials to test the effectiveness of three behavioural interventions, i.e., focalism, social norm, and visualisation, in changing people’s housing and commuting preferences. The experiment was conducted online via Credamo, one of the largest online panel data providers in China. It included only renters who needed to commute in the city of Xi’an, China, as participants in the study. The results show that behavioural interventions significantly increased respondents’ willingness to adopt more sustainable commute modes, such as walking or cycling, and reduced the tendency to use private cars. Among the three behavioural interventions, the social norm intervention had the largest and most significant impact. The findings shed light on the potential of applying behavioural interventions in sustainable urban transport management. More importantly, the results demonstrate the possibility of using behavioural interventions to incorporate sustainable urban development goals into housing decisions.
1. Introduction
Modern urban development brings with it an array of transportation challenges that significantly affect both the environment and the daily lives of people [1,2]. Issues related to transportation, like traffic congestion and air pollution, contribute to broader societal challenges, including environmental damage and public health concerns. According to the United Nations, the global transportation sector was responsible for about 25% of greenhouse gas emissions in 2021 and over 90% of the world’s transport energy still comes from fossil fuels [3]. Increasing reliance on private vehicles leads to urban sprawl and poor land-use efficiency [4]. Moreover, a trend towards driving and less physical activity is associated with higher rates of obesity and cardiovascular diseases [5,6]. Addressing these transportation issues is thus imperative for society as a whole.
To address these issues, governments employ a combination of supply-side approaches, such as the expansion of bicycle lanes and subway systems, and demand-side strategies that influence individuals’ travel decisions [7]. The transportation demand management (TDM) strategies, often coupled with behavioural interventions, have shown encouraging results in promoting sustainable urban lifestyles [8,9].
TDM tools can be grouped into various categories based on different criteria. For instance, they may be divided into monetary tools, which align with mainstream economic theories and incentivise changes in behaviour through financial rewards like free bus passes or off-peak fare discounts [2,7]. While effective, these tools often involve ongoing costs and may not have lasting effects once the incentives are removed. Behavioural TDM tools, derived from psychological research, utilise non-monetary soft interventions to prompt individual changes at a low cost [8,10].
Behavioural interventions leverage principles of behavioural science to assist individuals in making better decisions while preserving their freedom of choice. The underlying assumption is that unconscious biases often lead to suboptimal decisions. By either utilising these biases or helping individuals to overcome them, behavioural interventions can encourage more favourable outcomes. Although not universally successful, these interventions are still considered cost-effective due to the sheer number of people they can reach and their low deployment costs. These interventions have seen success in a variety of fields. For instance, numerous studies have demonstrated the impact of behavioural interventions on household energy conservation, improving public health, and increasing enrolment in different programmes [11,12].
Encouraged by these successes, researchers are exploring the application of behavioural interventions within TDM to promote sustainable travel behaviours [13,14,15]. These interventions are categorised into several goals: reducing private car usage, promoting public transportation, encouraging active travel such as walking and cycling, and influencing residential choice. The latter is particularly important, as a person’s place of residence and work significantly dictate their daily travel behaviour. Studies [15] have shown that nudges encouraging relocation to areas with better public transportation access can effectively alter travel behaviours and are categorised into short-term and long-term programmes. Short-term programmes directly influence immediate travel choices, whereas long-term programmes aim to indirectly impact travel behaviour by influencing factors such as residential location decisions. While long-term interventions may affect fewer individuals initially, they have the potential for more enduring impacts compared to short-term interventions.
Recently, behavioural interventions aimed at the general populace are gaining increased focus in TDM research due to evidence suggesting their effectiveness in reducing private car use and encouraging the use of public transport [16]. Various interventions, including the dissemination of persuasive information, awareness campaigns, and even simple notifications, have been shown to encourage a shift away from private vehicle usage [17]. Given their low expense and substantial impact, these interventions are being adopted globally in the transportation sector.
Several studies [15,16,18,19] have validated the effectiveness of behavioural interventions in influencing relocation decisions, yet gaps remain in the literature. Notably, existing research predominantly focuses on developed countries, with the efficacy of these interventions in developing countries remaining uncertain. Additionally, while various interventions have proven effective, comparing their relative success is challenging due to varying contexts, environments, and experimental designs across studies.
This study examines the application of behavioural interventions in TDM, specifically testing the efficacy of three distinct interventions on residential location choices and commuting behaviours in China. It seeks to determine whether these interventions are effective in the unique urban context of China and which intervention is superior. The study’s objective is not only to identify effective tools but to discern the most efficient among them. Previous research has often examined one intervention at a time, making direct comparisons difficult. This study addresses this by implementing three interventions concurrently for direct comparison.
While offering promising tools for transport demand management, behavioural approaches are also critical in recognising that transport mode choice extends beyond mere utility maximisation to encompass complex socio-cultural dimensions. Private car ownership in particular represents not simply a mobility solution but a powerful status symbol, shaped significantly by commercial advertising and industry influence. In Western contexts, automotive manufacturers have systematically transformed urban spaces into car-dependent environments through decades of marketing, lobbying, and infrastructure development that have prioritised private vehicles over public alternatives. This transformation created entrenched resistance to reclaiming public space from cars, even when environmental concerns demand such changes. The Chinese urban context presents a notably different trajectory, with substantial governmental investment in public transport infrastructure occurring alongside rapid motorisation. This parallel development creates a distinct opportunity to examine behavioural interventions that might counteract the status-driven appeal of car ownership. By acknowledging these socio-cultural forces, this study recognises that effective transport policy must address both individual decision-making processes and the broader structural factors that shape mobility perceptions.
The paper is organised as follows: Section 2 presents a thorough review of the relevant literature. Section 3 outlines the experimental design and execution. The empirical results are detailed in Section 4. Section 5 includes discussions based on the study results, and the final section provides a conclusion.
2. Literature Review
Following the Cochrane guidelines [20], this paper focuses on studies on behavioural interventions in Transportation Demand Management (TDM) that utilised solely randomised controlled trials (RCTs) and quasi-experiments. An RCT is an experimental study design in which participants are randomly assigned to either a treatment group or a control group, ensuring that each participant has an equal chance of being placed in any group. This randomisation process helps eliminate selection bias and balances both observed and unobserved confounders, making RCTs the gold standard for causal inference. However, RCTs are not always feasible or ethical in many real-world settings, leading researchers to rely on quasi-experimental designs. Quasi-experiments aim to estimate causal effects without random assignment. A total of 43 studies were found from the Web of Science database based on these criteria. These were further categorised using Michie’s behaviour change technique taxonomy [21], as shown in Table 1. The objectives of these behavioural interventions include reducing private car use [22,23], promoting public transportation [24,25], and encouraging active travel such as walking and cycling [13,26].

Table 1.
Classifications of behavioural interventions in the TDM literature.
Among the articles reviewed, dissemination of general information is the most prevalent intervention. Overall, 25 out of the 43 studies fall in this category. This approach represents a straightforward and efficacious method for influencing individuals’ travel decisions. This intervention draws on two behavioural insights. First, individuals’ suboptimal choices are often due to a lack of essential information; providing the necessary information can rectify this issue [27]. For instance, commuters in the Netherlands [24], Iran [14], and Denmark [28] demonstrated a positive shift in their travel behaviours compared to control groups after receiving additional data on the advantages of public transport. Second, unconscious biases influence information processing. Such effects can be ameliorated by bringing these biases to decision-makers’ attention. For example, Bhattacharyya, Jin, Le Floch, Chatman, and Walker [15] introduced “focalism”, the tendency for tangible factors to overshadow more crucial intangible ones in decision-making processes. By informing participants of the “focalism” effect, the study significantly altered travel choices. Information interventions also leveraged other behavioural concepts, such as anchoring and herding effects. The anchoring effect refers to individuals’ tendency to stick with the first option they encounter when making decisions. A common intervention in TDM is to prioritize greener routes among the available choices [19]. The herding effect describes how individuals tend to mimic the actions of a larger group. Scholars leverage this effect by providing information about others’ travel choices to influence participants [29].
Personal travel planning is the second most examined behavioural intervention within TDM, with a total of six applications in the reviewed studies. Its essence lies in “directly contacting individuals with the offer of information, assistance, incentives, and motivation to enable them to voluntarily alter their travel choices” [30]. Personal travel planning involves various behavioural techniques like goal-setting, self-monitoring, and social support. This intervention has proven particularly potent in altering daily commuting habits. Meanwhile, as more field experiments were carried out to verify the initial findings, researchers also noted significant discrepancies between participants’ self-reported behaviours and passively collected data [17,31]. The external reliability of existing findings still needs verification with further field evidence.
Feedback intervention has attracted much scholarly attention over the last five years due to technological advancements. The authors identified six studies using this intervention. Previously deemed impractical due to the high costs of gathering personalised data, the widespread adoption of smartphones has since allowed for the economical collection and provision of personalised feedback. Studies have documented substantial positive impacts in reducing parking demand [31], promoting the use of public transit [28], and encouraging active travel such as walking [32] and cycling [33].
The majority of these studies reported positive effects of behavioural interventions on various aspects of transportation decisions. However, comparing the effectiveness of behavioural interventions among these studies is a challenging undertaking due to the great level of variation among the designs of these experiments. For example, in studies on the effects of personal travel planning interventions, those using generic information were found to be ineffective in shifting commuter behaviour [34], while more participant-specific interventions produced significantly positive results1 [35]. The last decade has also witnessed an increase in insignificant results as the experimental method became more rigorous, see the summaries in [35,36,37,38]. Inevitably, this new development not only poses challenges in interpreting findings in early studies but also calls for more field experiments to verify the ecological validity of existing findings.
In transportation demand management studies, the timing of behavioural interventions is critical. Since travel or commute behaviour is habitual, major life events (e.g., marriage, retirement, and relocation) may provide a “window of opportunity” during which individuals are more self-conscious and sensitive to behaviour change interventions [39]. For example, studies of relocation’s influence on travel choices show that the “window of opportunity” is within three months after relocation [29,40,41]. Since people’s residential choices and workplaces fundamentally determine their travel behaviours in the long term, researchers have been actively exploring behavioural interventions to encourage and support better residential location or relocation decisions. Ideally, once movers receive suitable interventions at the right time, they may move to places with better public transportation facilities and increase the chance of developing environmentally friendly travel habits. Scholars in this field, therefore, are interested in finding effective behavioural interventions and the right time to deliver them. Among the 43 behavioural TDM publications included in this review, eight studies fall into this category, as summarised in Table 2.
Providing information is the most frequently used behavioural intervention. Specifically, six out of the eight studies gave participants in the treatment group additional information. The outcomes of these interventions, however, differed due to the local context, the experimental design, and the exact additional information they used. Specifically, Bamberg [42] found that giving participants free travel cards and personal schedule information about public transportation affected their location choices, although Bamberg did not separate the effect of monetary intervention (free travel card) and the behavioural intervention (personal schedule information). Rodriguez, Levine, Agrawal and Song [18] confirmed that accessibility information could change people’s location choices in a laboratory setting. Rodriguez and Rogers [16] and Taniguchi, Fujii, Azami, and Ishida [19] verified this relationship with university students. However, by separating participants into the ‘mover’ and ‘non-mover’ groups, Ralph and Brown [43] found that the information provision intervention changed students’ travel behaviour, but no significant effect was reported on the location choices. Ralph regarded this outcome as evidence showing that, instead of influencing people’s location choices, the intervention only changed their travel behaviour. In 2020, Guo and Peeta [44] conducted a similar experiment with an interactive online accessibility mapping application. The study showed a 10% decrease in automobile usage and a 10% increase in walking in the treatment group. Overall, the effects of information provision are significant and positive.
There are other behavioural tools used in these studies. Bhattacharyya, Jin, Le Floch, Chatman, and Walker [15] adopted two interventions based on the concepts of focalism and visualisation. In the context of housing search, focalism refers to the tendency for individuals to make suboptimal choices by focusing excessively on tangible features, such as house size, while underestimating intangible factors like neighbourhood safety and travel-related disutility. Their focalism intervention involved a dialogue process designed to help participants reflect on their true preferences and overcome this bias. The visualisation intervention prompted respondents to imagine the changes they wished to see in their future lives and consider how residential choices could help achieve those changes. The result indicated that both interventions significantly improved people’s travel behaviour, but only participants in the focalism group significantly reduced their travel time after relocation. Verplanken and Roy [40] also identified a positive influence of more interactive and tailored information (e.g., personal interviews and newsletters) in promoting environmentally friendly travel habits.
Although the eight experimental studies made considerable progress and provided important empirical evidence on the effectiveness of behavioural interventions, half of the articles [16,18,19,43] used university students in their experiments. Furthermore, all eight studies were carried out in developed countries. The reliability of their conclusions in a broader context requires further exploration. Most importantly, most of these studies considered only one intervention, and when multiple interventions were considered, the net effect of each tool was not effectively separated. This study sets out to address these gaps in the literature by conducting field experiments with a wider range of decision-makers in a developing country and by designing and implementing an RCT that can separate the net effect of multiple behavioural interventions.
Table 2.
Behavioural TDM studies on relocation decisions.
Table 2.
Behavioural TDM studies on relocation decisions.
| Author | Study Area | Interventions | Sample Size | Research Design | Follow-Up Period |
|---|---|---|---|---|---|
| Bamberg 2006 [42] | GER | Bus schedule information | 169 | RCT | 6 weeks |
| Bhattacharyya 2019 [15] | US | 1. Focalism intervention; 2. Visualisation intervention | 184 | RCT | 3 months |
| Guo 2020 [44] | US | Personalized accessibility information | 282 | RCT | 3 months |
| Ralph 2019 [43] | US | Transportation guide | 561 | RCT | 3 months |
| Rodriguez 2011 [18] | US | Accessibility information | 236 | RCT in lab | - |
| Rodriguez 2014 [16] | US | Accessibility information | 292 | Field experiment | 6 months |
| Taniguchi 2014 [19] | Japan | Information brochures; Accessibility information; Persuasive leaflets | 69 | RCT | 5 and 11 months |
| Verplanken 2016 [40] | UK | 1. Personal interviews; 2. Sustainable goodie bags; 3. Green directory information; 4. Newsletters | 521 | Field experiment | 8 weeks |
3. Materials and Methods
3.1. Study Area
As the purpose of this study is to test whether behavioural interventions can affect renters’ commuting decisions, it is important to choose study areas where people have options for green commuting. For example, interventions can nudge people to switch to buses and subways only when such options are available in that city. With this requirement in mind, this study chose Xi’an, the capital city of Shaanxi Province in China, as the study area (see Figure 1).
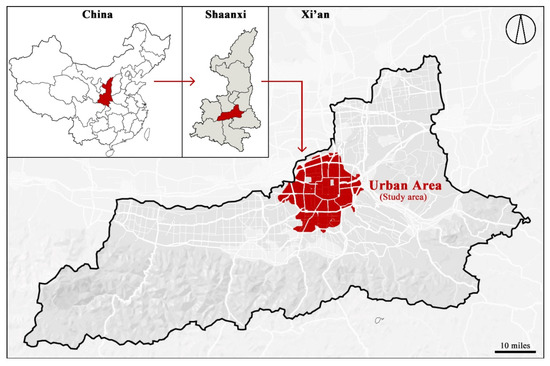
Figure 1.
The location of Xi’an city.
The population of Xi’an was 13 million in 2022. The urban area of Xi’an city is over 700 km2. By contrast, Greater London has a population of 8.9 million living in an urban area of 1595 km2. Xi’an residents enjoy good accessibility to sustainable transportation options. As of June 2021, Xi’an residents enjoy a subway network of eight lines with 159 stations and 250 km of track, radiating out from the city center. Moreover, Xi’an has 495 bus lines with an average ticket price of 2 RMB (0.25 GBP) for a one-way trip. The city’s daily mean temperature ranges from −5 to 30 °C. With footpaths and shared bicycles available throughout the city, walking and cycling are viable commuting options. Finally, Xi’an does not have any congestion charge or other restrictions limiting the use of private cars (e.g., cars may only be driven on alternative days depending on the last digits of the car registration number). Therefore, Xi’an was chosen because of its range of transportation options.
Another aspect to be factored in is rental affordability, which largely determines housing locations that renters could consider given their income and expenses. In general, the higher the rental prices, the fewer housing options that renters have within their budget. This indirectly restricts their choice of preferred commuting modes. The authors used rental expenditure as a proportion of household income as an indicator and found that Xi’an’s value is slightly below the national average for China. The relatively lower rental costs as a proportion of household income also encourage renters to take commuting choices seriously.
3.2. Experiment Design
The authors conducted randomised controlled trials to test the effectiveness of different interventions. Participants in the experiments were recruited from Credamo, an online panel data platform in China. The questionnaire consists of seven sections (see Figure 2) covering four groups of information, i.e., background information, life and housing satisfaction, travel and housing preferences, and behavioural interventions.
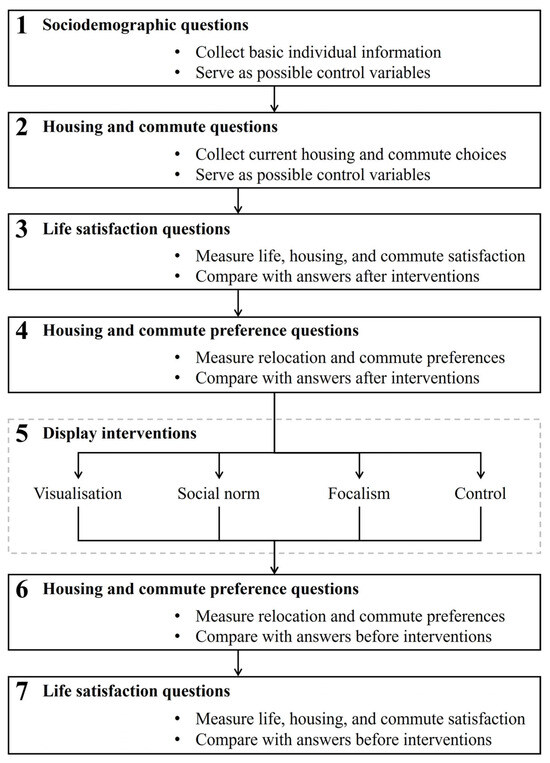
Figure 2.
Questionnaire structure.
The background information section collects sociodemographic information, current housing choices, and commuting habits. These include gender, age, education level, marital status, number of children in the household, annual household income, household size, and whether the household owns a car. The study also included an indicator of whether a respondent is a registered resident in the study area, i.e., the hukou2 variable, according to China’s context. These questions are included in Block 1 in Figure 2.
The questionnaire included ten questions to collect respondents’ current housing and commuting choices. For the housing part, respondents were asked to provide their house location, size, monthly rent, and total number of residents. For the commute part, respondents were required to answer their workplace location, daily commute frequency, monthly travel expenditure, average commuting time, and frequently used commuting methods. These questions form Block 2 in Figure 2.
The third block of the questionnaire consists of satisfaction questions. Although environmental protection is important, researchers should not nudge people towards more sustainable residential choices at the expense of their life satisfaction [15]. Measuring life satisfaction levels before and after interventions verifies whether this balance has been struck. At the same time, the interventions should influence people’s satisfaction with their current housing and commuting choices. In other words, Block 3 questions were asked again in Block 7 after the intervention, and satisfaction scores were compared to verify the effectiveness of the behavioural interventions indirectly.
To measure respondents’ life satisfaction, this study followed the SWLS questions in Pavot and Diener [45]3. Four questions were included in random order in the questionnaire: “Are you satisfied with your current life?”, “Do you agree the following statement: in most circumstances, my current life is similar with my ideal life.”, “Imagine life as a ladder with 1 to 10 levels where 1 represents your worst life condition while 10 represents your best life condition. Which level do you think you are currently in?”, and “In general, how do you think your current life is?”
To measure participants’ satisfaction with their current housing and commuting choices, the authors included five questions on housing satisfaction and one question on commuting satisfaction. The five housing questions asked about respondents’ satisfaction in the four categories mentioned above (housing quality, community services, transportation accessibility, and social network distance) and overall satisfaction. One commuting question directly asked about respondents’ overall satisfaction with their current commuting choices. All questions use a scale from 1 to 5, where 1 represents “not satisfied at all” and 5 represents “very satisfied”.
The questionnaire then proceeded to ask questions about housing and commuting preferences. This paper followed previous studies [15] to subdivide the housing preference questions into four categories: housing quality, community services, transportation accessibility, and social network (see Table 3). Respondents first answered their preferences on the four categories with a 1 to 5 scale, where 1 means “not important at all” and 5 means “very important”. Following the four questions come the preference questions on each factor. All questions in this part use the same 1 to 5 scale as before.
Table 3.
Housing preference factors in the questionnaire.
To test the short-term effect of interventions on respondents’ commuting choices, the questionnaire also included four questions on commuting preferences: “Do you think your daily commuting experience is comfortable?”, “Do you think you have many alternative commute choices?”, “Are you satisfied with your current commute time?”, and “If possible, which commute methods do you prefer—walking, cycling, taking buses, using the subway, driving, or calling a taxi?”
These two groups of preference questions were asked before and after the interventions, i.e., Block 4 and Block 6 questions in Figure 2, respectively. Therefore, they are used to measure the changes in respondents’ housing and commuting preferences before and after interventions.
Finally, in Block 5, the questionnaire introduced three behavioural interventions: visualisation, social norm, and focalism. Visualisation intervention means providing additional graphic information (e.g., tailored subway maps, cycle lane maps, air pollution and noise maps, personalised accessibility maps, etc.) to participants. The rationality of this intervention lies in people’s reliance on heuristics when making location and commute decisions. This phenomenon is prevalent when commuters choose a routine for their workplaces. Therefore, the function of this visualisation intervention is to make participants notice new information that they might have ignored before, thus changing their decision-making process.
The questionnaire provided participants with three maps generated based on the location of their workplaces, which were recorded in their answers to questions in Block 2. An example of these maps is given in Figure 3. These maps show the surrounding bus/subway stations, shopping centers, affordable communities, parks, and hospitals. The purpose of these maps is to make participants aware of useful facilities around their workplaces. Previous studies [44] using similar interventions have shown that once participants become more familiar with the area, they may find living near their workplaces is a good choice, thereby changing their location choices and reducing commute time.
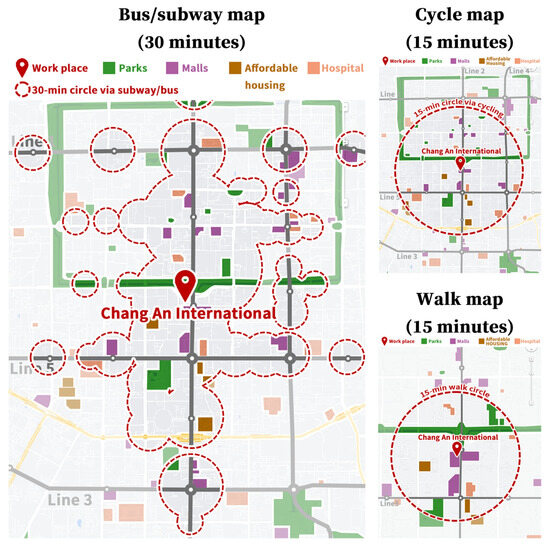
Figure 3.
Example of the maps shown in the visualisation intervention. (Note: The maps used in the questionnaire were in Chinese. The text in this figure has been translated into English for better understanding).
The social norm intervention usually includes certain information describing how reference groups, such as neighbours, friends, or the general public, behave. In the TDM domain, this intervention normally informs people how often other citizens walk and cycle, how many neighbours take public transportation to their workplaces, and other people’s passive attitude towards driving. In this experiment, the authors used a short message introducing the possible benefits of choosing a place with better public transportation (see Appendix A). Participants need to spend at least 60 s reading the message before proceeding to the next question.
The focalism intervention is rarely used in other domains, but it may be a useful tool in TDM studies. The term “focalism” was coined by Wilson, et al. [46] to describe people’s tendency to “focus too much on the focal event and fail to consider the consequences of other events that are likely to occur”. Bhattacharyya, Jin, Le Floch, Chatman, and Walker [15] first introduced this concept into TDM studies and extended its definition to explain people’s residential choices. They stated that people might “make suboptimal decisions because of their tendency to focus on factors that are observable, tangible, or most salient” and overlook the intangible but important ones.
The content of the focalism intervention consists of three parts. In the first part, respondents are asked to state their preferences on different factors when choosing a new home. In the second part, the same factors are presented, with the only difference being that respondents now need to answer the influence of different factors on their life quality. Bhattacharyya, Jin, Le Floch, Chatman, and Walker [15] defined the disparity between people’s preference scores and life-quality scores for each factor as the focalism effect. In the third part, the researcher presents this disparity to respondents and introduces the concept of focalism. Ideally, once respondents notice they have an unconscious bias in choosing the residential location, they will try to avoid that in the future.
This study adopted the general framework of focalism intervention by Bhattacharyya, Jin, Le Floch, Chatman, and Walker [15]. Due to the limitations of the online questionnaire platform, this study could not automatically calculate the average score and give participants feedback right after they finish all questions. Therefore, this experiment simplified the second step by telling all respondents that they suffered from focalism (see the text of this intervention in Appendix B). By assuming that people without a focalism bias would not be significantly influenced by this intervention, the results should be a reasonably good estimate of the effect of this intervention.
All respondents answered questions in all other blocks. Upon reaching Block 5, they will be randomly assigned to one of the three treatment groups or the control group. Respondents in these three treatment groups were required to read the information for at least 60 s before proceeding to the next question. Respondents in the control group were asked to read a message unrelated to the study for the same duration.
3.3. Data Collection
Due to COVID-related travel constraints in China, the authors conducted the experiment online at Credamo.co.4, the largest online panel data platform in China. Two rounds of pilot studies were conducted in May 2022 to test the questionnaire and assess the size of the potential respondent pool. The experimental data were collected between 7 June and 11 July 20225. Filters were set to exclude university students, as they are not representative of the renter population targeted in this study. Mobile phone users were also excluded because the maps used in the visualisation intervention could not be conveniently viewed on mobile devices. These measures significantly reduced the number of eligible respondents, particularly given that the experiment was conducted in a single city. A total of 941 observations were collected within two months. The sample was scrutinised by excluding respondents who answered the questionnaire within 750 s, which is the minimum amount of time to complete the questionnaire determined in the pilot study. Respondents who answered preference questions in less than one second were also excluded. This resulted in a final sample of 360 valid observations, of which 85 were in the control group, 105 in the focalism group, 100 in the social norm group, and 70 in the visualisation group.
4. Results
Table 4 gives descriptive statistics of sociodemographic characteristics for the three treatment groups and the control group. F-tests were conducted to check whether the four groups are comparable. Unfortunately, due to the small sample size, the F-test results indicate that the four groups have different educational backgrounds and Hukou status. This is mainly due to the lack of respondents without a college education in the control group and the large proportion of non-Hukou residents in the visualisation group. The authors address this issue by complementing the t-test with logistic regression, where these sociodemographic variables were included to control for the heterogeneity.
Table 4.
Sociodemographic characteristics of participants among groups.
The authors chose Xi’an as the study area because the city has an extensive public transportation network and ground transportation does not suffer from severe congestion problems as in other major Chinese cities. It is important that respondents in these experiments are actually able to change their commuting modes should they decide to do so. Otherwise, it is not possible for their intention and actions to be aligned. As shown in Figure 4, the respondents have a good range of commute modes to choose from, and most use more than one method. Buses and private cars are the two most commonly used commuting modes. This finding supports the authors’ choice of study area for the experiments.
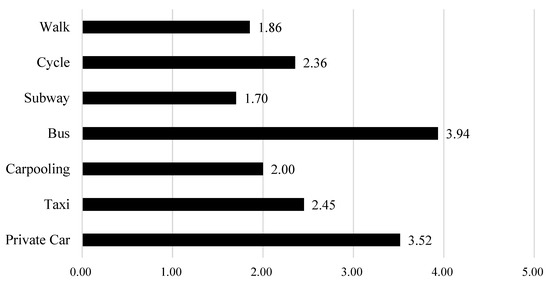
Figure 4.
Average score of respondents’ frequently used commute methods. Note: scores range from 0 (never) to 5 (very often). This is a multiple choices questionnaire where respondents can select more than one commute method.
The questionnaire asked respondents’ preferences for these commute methods before and after the treatment. The control group answered these questions twice as well, with a 60-s break in between. The responses to commuting preference questions were classified into two categories: Car Use and Green Commute (walking, cycling, subway, bus, and taxi6). This study used the Principal Component Analysis (PCA) method to construct the Green Commute preference measurement based on the scores of individual commute modes. The average differences between the control and treatment groups for Car Use and Green Commute scores are presented in Table 5. Positive mean difference values indicate an improvement in preference and vice versa. Therefore, all three behavioural interventions increased respondents’ preference for green commuting modes and reduced their tendency to drive. However, the effect of the focalism intervention is not statistically significant.
Table 5.
T-test results.
As noted in Table 4, the treatment groups and the control group are not homogeneous in some respects, such as education level and Hukou status. To control for these potential confounding effects, the authors estimated linear regression models using Car Use and Green Commute scores as the dependent variables and behavioural intervention dummy variables as the key independent variables. Specifically,
In Equations (1) and (2), , , and are dummy variables that equal one for respondents in the corresponding treatment groups and zero otherwise. The control group is omitted from the regression models as the reference group. s are control variables included in Table 4 and some additional housing attributes variables, such as the size of apartment currently rented by the respondents and whether the property was sublet. Multicollinearity tests show VIF values for all variables in both regressions to be less than 10, with a mean VIF of 2.05 and highest VIF of 3.96. After controlling for personal and housing attributes, the coefficient estimates of the three behavioural interventions are positive in the model for Green Commute and negative in the model for Car Use.
Lastly, following previous studies, this study conducted t-tests to examine changes in satisfaction levels before and after the interventions. Table 6 presents the changes in participants’ satisfaction with their housing choices, commuting methods, and overall life satisfaction. A positive value indicates an increase in satisfaction after the interventions, while a negative value indicates a decrease.
Table 6.
Satisfaction changes before and after interventions.
5. Discussion
Regarding the effectiveness of the three interventions, the OLS regression results in Table 7 show that although all three interventions promote green commuting and reduce private car use, only the social norm intervention significantly lowered car use preference. This suggests that, among the three interventions, the social norm intervention was the most effective, at least in the context of Xi’an. The focalism intervention, however, appears to be the least effective. In both the t-tests and OLS regressions, the dependent variables in the focalism group did not show significant differences compared to the control group. Furthermore, participants in the focalism group reported the smallest changes in satisfaction compared to the other two groups (Table 6). This indicates that the intervention may not have been as effective as anticipated. It is important to note, however, that the focalism intervention used in this study was a simplified version of that used in the literature. This simplification may have reduced its effectiveness, as the information was not participant-specific. Additionally, even after simplification, participants in the focalism group required, on average, two minutes longer to complete the questionnaire, which may have led to impatience.
Table 7.
OLS regression results.
In addition to commuting choices, this study also examined the possible side effects of the interventions. As noted in the previous literature, behavioral interventions should not nudge individuals at the expense of their overall life satisfaction [15,16]. Table 6 presents the t-test results for satisfaction changes under each intervention. None of the three overall life satisfaction coefficients are significant, indicating that the interventions did not have a statistically significant impact on overall satisfaction. However, all coefficients are negative, suggesting that the interventions may have a slight negative effect on overall satisfaction. This highlights the need for caution when applying behavioral interventions in future studies.
Another noteworthy finding is that participants in the visualisation group reported a significantly lower level of housing satisfaction after the intervention. A possible explanation for this result is that the intervention prompted participants to reconsider their housing preferences, leading them to realize that their current housing choice was less ideal than previously perceived, thus lowering their satisfaction scores.
As for the control variables, all three interventions significantly increased participants’ preference for private toilets and kitchens. This may also be the result of reconsideration prompted by the interventions. Given that the experiment was conducted during the COVID-19 pandemic, private kitchens and toilets were associated with better hygiene and a reduced risk of infection. A possible explanation is that the interventions encouraged participants to think more carefully about their needs when renting a property, leading hygiene considerations to become more important than they previously thought.
In addition to the results mentioned above, it is important to emphasise that these conclusions are based on the specific context of Xi’an. Similar outcomes may be observed in other provincial capitals in China, but cities outside China may report different results due to differences in the built environment, transportation policies, and local cultures. For example, compared with most European and American cities, Xi’an and provincial capitals in China, more generally, are more compact and mixed-use. In 2019, Xi’an had an average population density of 6767 people per square kilometre, compared to 5690 for Greater London in 2023. Higher building density and large-scale infrastructure investments make public transportation widely accessible, enabling effective nudges toward greener commuting choices.
The socio-economic factors underlying housing choices in Xi’an also differ significantly from Western contexts. While theoretical concepts such as the rent gap [47] and filtering effect [48]—whereby better-serviced areas command higher prices—exist in Xi’an, their manifestation differs markedly. Residential areas in Xi’an are highly mixed, with diverse housing options available throughout the city. Even in areas with premium subway accessibility and urban villages, older, affordable gated communities exist alongside luxury developments, providing options across different price points. This residential heterogeneity means that renters with average incomes can generally find properties that match their financial situations in most areas of the city, including those with good public transport access.
Regarding price control policies, while state-owned properties in Xi’an are subject to government regulation, these constitute a separate segment from the private rental market examined in this study. The private rental market operates with relatively limited intervention, though increasing government attention to housing affordability has begun to shape policy discussions [49]. This context contrasts with many Western cities where housing choice is more severely constrained by income and affordability, with clear spatial segregation between socio-economic groups and limited affordable housing in well-connected areas [50,51]. The relatively diverse and accessible nature of Xi’an’s housing market creates conditions where behavioural interventions can potentially influence location choices without being overwhelmed by economic constraints.
Another important context is the ongoing energy transition in Xi’an. Due to government promotion, public transportation has undergone rapid electrification. By the time the experiment was conducted, most licensed taxis and private hire vehicles were already electric, and the municipal government aims to fully electrify the public transport system by 2025. This transition further expands the available “green commuting” options, as taxis can now be classified as a low-carbon mode of transport. Finally, unlike in the United States, where private car ownership has driven suburbanisation and become a strong cultural symbol of middle-class identity, residents in Xi’an are still undergoing cultural shifts amid rapid urbanisation. Although owning a car is a sign of social status in Xi’an, the association is weaker than in most European and American cities [52,53]. This cultural difference creates more opportunities for behavioural interventions, as individuals face fewer cultural barriers when switching to public transportation.
6. Conclusions
This research aims to answer two questions: are the three interventions used in previous studies effective in China’s context, and which intervention has a larger influence? The authors conducted randomised control trials with renters in a Chinese city in June and July 2022. Three behavioural interventions, i.e., focalism, social norm, and visualisation, were implemented in the experiments. The results show that all three behavioural interventions encourage the use of green commute modes among the respondents. They were also less likely to drive private cars between home and workplace.
This study contributes novel insights to the body of knowledge on behavioural interventions. It suggests that future research should incorporate a more extensive sample size to mitigate the effects of random error. The experiment involved 360 valid samples, with approximately 90 in each intervention group, a sample size that may impact the study’s analyses if the standard deviation is extensive. Thus, larger sample groups are recommended for future online questionnaires.
Moreover, the study highlights the necessity for meticulously designed interventions to direct participants’ focus effectively. This recommendation stems from the observation that while the study’s interventions aimed to influence housing choice considerations towards public transportation, participants showed no significant change in this preference. Interestingly, there was a notable shift in their preference for private kitchens and toilets. This outcome suggests that interventions may not always yield anticipated results but can have unexpected effects in other areas. Therefore, the design of interventions represents a critical facet for subsequent research.
The inclusion of local context is also pivotal. Most existing studies center on cities in developed countries and account for basic sociodemographic data as control variables [9,10]. However, this study’s results affirm that interventions could manifest divergently across different locales. Influencing factors such as the built environment, housing and commuting policies, and regional culture can shape attitudes and behaviours. For example, whereas car reliance and limited public transport accessibility are prevalent in the US, Chinese cities typically offer the opposite scenario. This disparity affects daily habits, such as commuting preferences. Additionally, in China, where cars symbolize social status, many opt to drive to signify affluence, even when it is not the most practical choice. Therefore, future studies should assimilate more local data to refine the evaluation of interventions’ efficacy.
Lastly, the relationship between people’s satisfaction and behavioural interventions warrants careful consideration. While this study did not find significant evidence linking interventions to satisfaction levels, preliminary results—coefficients and t-statistics—hint that interventions could potentially diminish satisfaction. Further investigation is necessary to ascertain the precise impact of interventions on life satisfaction and other subjective well-being measures. The overarching aim should be to guide behaviour without compromising individual contentment.
Author Contributions
Conceptualisation, Y.L. and H.X.H.B.; methodology, Y.L. and H.X.H.B.; software, Y.L. and H.X.H.B.; validation, H.X.H.B.; formal analysis: Y.L. and H.X.H.B.; data curation, Y.L.; writing—original draft preparation, Y.L.; writing—review and editing, H.X.H.B.; visualisation, Y.L.; supervision, H.X.H.B.; project administration, H.X.H.B.; funding acquisition, H.X.H.B. and J.L. All authors have read and agreed to the published version of the manuscript.
Funding
This research was funded by the Economic and Social Research Council grant number ES/P004296/1, National Natural Science Foundation of China grant number 71661137009, University of Cambridge Career Support Fund, and Research Development Fund, Department of Land Economy, University of Cambridge.
Data Availability Statement
The raw data supporting the conclusions of this article will be made available by the authors on request.
Conflicts of Interest
The authors declare no conflicts of interest.
Appendix A
The social norm intervention consists of a brief text highlighting the potential benefits of selecting a house with better access to public transportation. Participants are required to read the text for a minimum of 60 s. The translated English version of the text is as follows:
When choosing a new house, people are also selecting their future commute options. The location of a home determines access to bus stations, subway stations, and shared bicycles, which in turn largely shape future travel choices.
Public transportation can be a preferred travel option because it benefits individuals, cities, and the environment. For individuals, taking the subway is often faster than driving during peak hours, and active travel modes such as walking and cycling help strengthen the body. For cities, greater use of public transportation reduces urban congestion. For the environment, public transportation effectively lowers carbon emissions and helps prevent air pollution.
Due to these reasons, an increasing number of citizens are placing greater emphasis on public transportation factors when selecting a new home. According to a survey conducted by the city government, renters prioritize the location and transportation conditions of a house.
Therefore, the next time you move, please consider public transportation accessibility. Choosing a home with convenient bus and subway stations can save you time, influence your travel patterns, and allow you to contribute to a more sustainable city.
Appendix B
The translated English version of the text included in the focalism intervention is as follows:
You might feel a bit impatient after answering two sets of similar questions. However, please note that your responses to the two groups of questions were not identical.
The first set asked about your personal preferences when choosing a new home, while the second set examined how each factor influences your overall quality of life. People often believe they have considered all aspects carefully when making decisions, but your answers suggest that the factors emphasized when choosing a house are not necessarily those that most affect life quality in the long term.
Researchers refer to this phenomenon as “focalism.” When making decisions, individuals tend to focus more on tangible factors and underestimate the impact of intangible ones. However, these overlooked factors may have a greater influence over time.
This bias is not irreversible. In fact, by reminding yourself of the existence of focalism during decision-making, you can effectively counteract it. Therefore, please take a moment to reflect on the factors that truly have a significant impact on your future quality of life.
Notes
| 1 | Typical interventions using generic information include letters or emails that inform participants about the potential benefits of active travel, promote low-carbon transport options, or encourage carpooling. This information is city-wide and identical for all participants. In contrast, participant-specific interventions tailor the information based on participants’ location, travel preferences, or habits. |
| 2 | Hukou is a system of household registration used in China. In most cities, only people with a valid hukou have access to certain rights such as education, pension scheme, and homeownership. |
| 3 | The original SWLS questions are in English. This dissertation refers to the simplified Chinese version translated by Andrew Wai on 19 August 2019. |
| 4 | Credamo automatically displays the Chinese version when accessed from within China. Participants interacted with the platform and questionnaire in Chinese throughout the process. |
| 5 | Xi’an experienced a COVID outbreak and was in complete lockdown in December 2021. The city did not return to normal until the 24 January 2022. Since then, the city has had several cases but no more full-scale lockdowns, and people’s daily lives have gone back to normal quickly. Therefore, the data collection process was not influenced by the pandemic. |
| 6 | This study categorised taxis as part of the Green Commute based on the local context. As of 2022, Xi’an had 15,457 licensed taxis and 24,721 private hire vehicles. The government began promoting electric taxis in 2015 and added 6000 more electric taxis in 2019. Since the end of 2021, all newly licensed taxis have been electric. Private hire vehicles are also largely electric due to their lower operating costs. The government aims to fully electrify public transportation, including private hire vehicles, by 2025. Apart from this, a large portion of taxi riders are also choosing carpooling, which further lowers the carbon emissions per person. |
References
- Nieuwenhuijsen, M.J. Urban and transport planning pathways to carbon neutral, liveable and healthy cities; A review of the current evidence. Environ. Int. 2020, 140, 105661. [Google Scholar] [CrossRef] [PubMed]
- Karjalainen, L.E.; Juhola, S. Urban transportation sustainability assessments: A systematic review of literature. Transport. Rev. 2021, 41, 659–684. [Google Scholar] [CrossRef]
- United Nations. Sustainable Transport Conference-General Fact Sheet. Available online: https://www.un.org/en/conferences/transport2021/media (accessed on 27 July 2024).
- Cavoli, C. Accelerating sustainable mobility and land-use transitions in rapidly growing cities: Identifying common patterns and enabling factors. J. Transp. Geogr. 2021, 94, 103093. [Google Scholar] [CrossRef]
- Owen, N.; Healy, G.N.; Dempsey, P.C.; Salmon, J.; Timperio, A.; Clark, B.K.; Goode, A.D.; Koorts, H.; Ridgers, N.D.; Hadgraft, N.T.; et al. Sedentary Behavior and Public Health: Integrating the Evidence and Identifying Potential Solutions. Annu. Rev. Public Health 2020, 41, 265–287. [Google Scholar] [CrossRef] [PubMed]
- Koolhaas, C.M.; Dhana, K.; Schoufour, J.D.; Ikram, M.A.; Kavousi, M.; Franco, O.H. Impact of physical activity on the association of overweight and obesity with cardiovascular disease: The Rotterdam Study. Eur. J. Prev. Cardiol. 2017, 24, 934–941. [Google Scholar] [CrossRef]
- Cheng, G.; Liu, X.; Pei, Y. A review of research on public transport priority based on CiteSpace. J. Traffic Transp. Eng. 2023, 10, 1118–1147. [Google Scholar] [CrossRef]
- Aravind, A.; Mishra, S.; Meservy, M. Nudging towards sustainable urban mobility: Exploring behavioral interventions for promoting public transit. Transp. Res. Part D Transp. Environ. 2024, 129, 104130. [Google Scholar] [CrossRef]
- Li, J.; Xu, C. Evidence-based practices in sustainable travel behavior intervention: A knowledge graph-based systematic review. J. Traffic Transp. Eng. 2024, 11, 293–311. [Google Scholar] [CrossRef]
- Pan, M.Y.; Ryan, A. Promoting Sustainable Transportation Modes: A Systematic Review of Behavior-Change Strategies. Transp. Res. Rec. 2024, 2679, 1993–2012. [Google Scholar] [CrossRef]
- Stern, P.C. A reexamination on how behavioral interventions can promote household action to limit climate change. Nat. Commun. 2020, 11, 918. [Google Scholar] [CrossRef]
- Khanna, T.M.; Danilenko, D.; Andor, M.; Callaghan, M.; Elliott, J.H.; Repke, T.; Smith, L.A.; Sanchez, J.; Bhumika, T.V.; Minx, J.C. PROTOCOL: Behavioral, information and monetary interventions to reduce energy consumption in households: A “living” systematic review. Campbell. Syst. Rev. 2024, 20, e1424. [Google Scholar] [CrossRef] [PubMed]
- Van de Sompel, D.; Hudders, L.; Vandenberghe, L. Cycling for a Sustainable Future. Stimulating Children to Cycle to School via a Synergetic Combination of Informational and Behavioral Interventions. Sustainability 2020, 12, 3224. [Google Scholar] [CrossRef]
- Mir, H.M.; Behrang, K.; Isaai, M.T.; Nejat, P. The impact of outcome framing and psychological distance of air pollution consequences on transportation mode choice. Transp. Res. Part D Transp. Environ. 2016, 46, 328–338. [Google Scholar] [CrossRef]
- Bhattacharyya, A.; Jin, W.; Le Floch, C.; Chatman, D.G.; Walker, J.L. Nudging people towards more sustainable residential choice decisions: An intervention based on focalism and visualization. Transportation 2019, 46, 373–393. [Google Scholar] [CrossRef]
- Rodriguez, D.A.; Rogers, J. Can housing and accessibility information influence residential location choice and travel behavior? An experimental study. Environ. Plann. B 2014, 41, 534–550. [Google Scholar] [CrossRef]
- Semenescu, A.; Gavreliuc, A.; Sarbescu, P. 30 Years of soft interventions to reduce car use-A systematic review and meta-analysis. Transp. Res. Part D Transp. Environ. 2020, 85, 16. [Google Scholar] [CrossRef]
- Rodriguez, D.A.; Levine, J.; Agrawal, A.W.; Song, J. Can information promote transportation-friendly location decisions? A simulation experiment. J. Transp. Geogr. 2011, 19, 304–312. [Google Scholar] [CrossRef]
- Taniguchi, A.; Fujii, S.; Azami, T.; Ishida, H. Persuasive communication aimed at public transportation-oriented residential choice and the promotion of public transport. Transportation 2014, 41, 75–89. [Google Scholar] [CrossRef]
- Higgins, J.P.; Thomas, J.; Chandler, J.; Cumpston, M.; Li, T.; Page, M.J.; Welch, V.A. Cochrane Handbook for Systematic Reviews of Interventions; John Wiley & Sons: Hoboken, NJ, USA, 2019. [Google Scholar]
- Michie, S.; Richardson, M.; Johnston, M.; Abraham, C.; Francis, J.; Hardeman, W.; Eccles, M.P.; Cane, J.; Wood, C.E. The Behavior Change Technique Taxonomy (v1) of 93 Hierarchically Clustered Techniques: Building an International Consensus for the Reporting of Behavior Change Interventions. Ann. Behav. Med. 2013, 46, 81–95. [Google Scholar] [CrossRef]
- Luo, R.; Fan, Y.; Yang, X.; Zhao, J.; Zheng, S. The impact of social externality information on fostering sustainable travel mode choice: A behavioral experiment in Zhengzhou, China. Transp. Res. Part A Policy Pract. 2021, 152, 127–145. [Google Scholar] [CrossRef]
- Asensio, O.I.; Apablaza, C.Z.; Lawson, M.C.; Walsh, S.E. A field experiment on workplace norms and electric vehicle charging etiquette. J. Ind. Ecol. 2021, 26, 183–196. [Google Scholar] [CrossRef]
- Franssens, S.; Botchway, E.; de Swart, W.; Dewitte, S. Nudging Commuters to Increase Public Transport Use: A Field Experiment in Rotterdam. Front. Psychol. 2021, 12, 633865. [Google Scholar] [CrossRef] [PubMed]
- Gravert, C.; Collentine, L.O. When nudges aren’t enough: Norms, incentives and habit formation in public transport usage. J. Econ. Behav. Organ. 2021, 190, 1–14. [Google Scholar] [CrossRef]
- Ahmed, S.; Adnan, M.; Janssens, D.; Wets, G. A route to school informational intervention for air pollution exposure reduction. Sustain. Cities Soc. 2020, 53, 101965. [Google Scholar] [CrossRef]
- Sunstein, C.R. Nudging: A Very Short Guide. In Handbook of Privacy Studies: An Interdisciplinary Introduction; Amsterdam University Press: Amsterdam, The Netherlands, 2018; pp. 173–180. [Google Scholar] [CrossRef]
- Lieberoth, A.; Jensen, N.H.; Bredahl, T. Selective psychological effects of nudging, gamification and rational information in converting commuters from cars to buses: A controlled field experiment. Transp. Res. Part F Traffic Psychol. Behav. 2018, 55, 246–261. [Google Scholar] [CrossRef]
- Walker, I.; Thomas, G.O.; Verplanken, B. Old Habits Die Hard: Travel Habit Formation and Decay During an Office Relocation. Environ. Behav. 2015, 47, 1089–1106. [Google Scholar] [CrossRef]
- Chatterjee, K. A comparative evaluation of large-scale personal travel planning projects in England. Transp. Policy 2009, 16, 293–305. [Google Scholar] [CrossRef]
- Rosenfield, A.; Attanucci, J.P.; Zhao, J. A randomized controlled trial in travel demand management. Transportation 2020, 47, 1907–1932. [Google Scholar] [CrossRef]
- Aittasalo, M.; Rinne, M.; Pasanen, M.; Kukkonen-Harjula, K.; Vasankari, T. Promoting walking among office employees-evaluation of a randomized controlled intervention with pedometers and e-mail messages. BMC Public Health 2012, 12, 403. [Google Scholar] [CrossRef]
- Piwek, L.; Joinson, A.; Morvan, J. The use of self-monitoring solutions amongst cyclists: An online survey and empirical study. Transp. Res. Part A Policy Pract. 2015, 77, 126–136. [Google Scholar] [CrossRef]
- Kristal, A.S.; Whillans, A.V. What we can learn from five naturalistic field experiments that failed to shift commuter behaviour. Nat. Human Behav. 2020, 4, 169–176. [Google Scholar] [CrossRef] [PubMed]
- Bamberg, S.; Rees, J. The impact of voluntary travel behavior change measures-A meta-analytical comparison of quasi-experimental and experimental evidence. Transp. Res. Part A Policy Pract. 2017, 100, 16–26. [Google Scholar] [CrossRef]
- Arnott, B.; Rehackova, L.; Errington, L.; Sniehotta, F.F.; Roberts, J.; Araujo-Soares, V. Efficacy of behavioural interventions for transport behaviour change: Systematic review, meta-analysis and intervention coding. Int. J. Behav. Nutr. Phys. Act. 2014, 11, 133. [Google Scholar] [CrossRef] [PubMed]
- Sussman, R.; Tan, L.Q.; Kormos, C.E. Behavioral Interventions for Sustainable Transportation: An Overview of Programs and Guide for Practitioners; Elsevier: New York, NY, USA, 2020; pp. 315–371. [Google Scholar]
- Villa-Gonzalez, E.; Barranco-Ruiz, Y.; Evenson, K.R.; Chillon, P. Systematic review of interventions for promoting active school transport. Prev. Med. 2018, 111, 115–134. [Google Scholar] [CrossRef]
- Larouche, R.; Charles Rodriguez, U.; Nayakarathna, R.; Scott, D.R. Effect of Major Life Events on Travel Behaviours: A Scoping Review. Sustainability 2020, 12, 10392. [Google Scholar] [CrossRef]
- Verplanken, B.; Roy, D. Empowering interventions to promote sustainable lifestyles: Testing the habit discontinuity hypothesis in a field experiment. J. Environ. Psychol. 2016, 45, 127–134. [Google Scholar] [CrossRef]
- Haggar, P.; Whitmarsh, L.; Skippon, S.M. Habit discontinuity and student travel mode choice. Transp. Res. Part F Traffic Psychol. Behav. 2019, 64, 1–13. [Google Scholar] [CrossRef]
- Bamberg, S. Is a residential relocation a good opportunity to change people’s travel behavior? Results from a theory-driven intervention study. Environ. Behav. 2006, 38, 820–840. [Google Scholar] [CrossRef]
- Ralph, K.M.; Brown, A.E. The role of habit and residential location in travel behavior change programs, a field experiment. Transportation 2019, 46, 719–734. [Google Scholar] [CrossRef]
- Guo, Y.T.; Peeta, S. Impacts of personalized accessibility information on residential location choice and travel behavior. Travel Behav. Soc. 2020, 19, 99–111. [Google Scholar] [CrossRef]
- Pavot, W.; Diener, E. Review of the Satisfaction With Life Scale. Soc. Indic. Res. Ser. 2009, 39, 101–117. [Google Scholar] [CrossRef]
- Wilson, T.D.; Wheatley, T.; Meyers, J.M.; Gilbert, D.T.; Axsom, D. Focalism: A source of durability bias in affective forecasting. J. Pers. Soc. Psychol. 2000, 78, 821–836. [Google Scholar] [CrossRef] [PubMed]
- Smith, N. Toward a Theory of Gentrification-Back to the City Movement by Capital, Not People. J. Am. Plann. Assoc. 1979, 45, 538–548. [Google Scholar] [CrossRef]
- Rosenthal, S.S. Are Private Markets and Filtering a Viable Source of Low-Income Housing? Estimates from a “Repeat Income” Model. Am. Econ. Rev. 2014, 104, 687–706. [Google Scholar] [CrossRef]
- Chen, J.; Hao, Q.; Stephens, M. Assessing Housing Affordability in Post-reform China: A Case Study of Shanghai. Hous. Stud. 2010, 25, 877–901. [Google Scholar] [CrossRef]
- Dwyer, R.E. Expanding homes and increasing inequalities: US housing development and the residential segregation of the affluent. Soc. Probl. 2007, 54, 23–46. [Google Scholar] [CrossRef]
- Quillian, L.; Lagrange, H. Socioeconomic Segregation in Large Cities in France and the United States. Demography 2016, 53, 1051–1084. [Google Scholar] [CrossRef]
- Moody, J.; Zhao, J. Car pride and its bidirectional relations with car ownership: Case studies in New York City and Houston. Transp. Res. A Pol. 2019, 124, 334–353. [Google Scholar] [CrossRef]
- Yao, M.; Wang, D. Mobility and travel behavior in urban China: The role of institutional factors. Transp. Policy 2018, 69, 122–131. [Google Scholar] [CrossRef]
Disclaimer/Publisher’s Note: The statements, opinions and data contained in all publications are solely those of the individual author(s) and contributor(s) and not of MDPI and/or the editor(s). MDPI and/or the editor(s) disclaim responsibility for any injury to people or property resulting from any ideas, methods, instructions or products referred to in the content. |
© 2025 by the authors. Licensee MDPI, Basel, Switzerland. This article is an open access article distributed under the terms and conditions of the Creative Commons Attribution (CC BY) license (https://creativecommons.org/licenses/by/4.0/).