Abstract
Mediterranean wood pastures are the result of traditional silvo-pastoral uses that shaped these ecosystems into a mosaic of trees and open grassland. This ecosystem structure is generally associated with increased soil fertility under tree canopies. However, the response of herbaceous plant functional types (PFTs)—grasses, legumes, and non-legume forbs—to these heterogeneous microenvironments (under the canopy vs. open grassland) remains largely unknown, particularly regarding carbon (C) and nitrogen (N) acquisition and use. Even less is known about how different tree species and environmental conditions influence these responses. In this study, we aim to assess how tree canopies influence carbon and nitrogen cycling by comparing the effects of traditional oak stands and pine plantations on herbaceous PFTs and soil dynamics. For that we use C and N content and natural isotopic abundances (δ13C and δ15N) as proxies for biogeochemical cycling. Our results show that ecosystem C and N patterns depend not only on herbaceous PFTs and the presence or absence of tree canopies but also on tree species identity and environmental conditions, including climate. In particular, pine-dominated plantations exhibited lower nitrogen availability compared to those dominated by oak, suggesting that oak stands may contribute more effectively to enhance soil fertility in Mediterranean wood pastures. Furthermore, the canopy effect was more pronounced under harsher environmental conditions, highlighting the role of trees in buffering environmental stress, particularly in arid regions. This suggests that changes in tree cover and tree species may drive complex changes in ecosystem C and N storage and cycling.
1. Introduction
Mediterranean wood pastures or oak savannahs (called dehesas in Spain and montados in Portugal) are semi-natural savannah-like ecosystems that result from traditional silvo-pastoral uses, in which an herbaceous and an arboreal layer (mostly Quercus species) coexist [1]. They are one of the largest agroforestry systems in Europe [2], covering 3.5–4 million ha, mostly along the southwest of the Iberian Peninsula [3], and are also present in other world regions with Mediterranean climates, mainly in California [4,5,6]. Mediterranean wood pastures have traditionally provided a wide variety of silvo-pastoral goods and services, including the production of forage, acorns, timber, and cork. These uses have shaped the ecosystem into a mosaic of trees and open grassland. However, the tree coverage in Mediterranean wood pastures is changing. Traditional silvo-pastoral uses are declining with more intensive farming, including plantations of fast-growing trees, mostly Eucalyptus and Pinus species. Another threat is the shrub encroachment due to land abandonment, and there is a worrying lack of tree regeneration [7,8,9], with the consequent implications that this may have on ecosystem functioning and specifically on carbon (C) and nitrogen (N) cycling and storage [10].
In this regard, the assessment of the C and N concentration in the different ecosystem compartments in combination with the natural abundance of C and N isotopes (δ13C and δ15N) can be used as a good proxy to assess C and N acquisition and cycling processes [11,12,13,14]. Generally, tree canopies modify the organic matter input and enhance soil C and N content [15,16].
This can leave an imprint in the δ15N plant biomass, via changes in the amount and the type of N sources, N cycling steps, and the microbial community [17,18]. Also, the δ13C level can be taken as being indicative of CO2 and water exchange relationships [19]. Light reduction under the canopy generally increases stomatal conductance, making possible more discrimination against 13C and generating organic matter depleted in 13C [20,21,22,23]. Hence, a “canopy effect”—defined as the ecological influence exerted by tree canopies—on the C and N content and the natural isotopic composition (δ13C and δ15N) of the different ecosystem compartments is expected. However, such effects in Mediterranean wood pastures are still poorly understood, especially as traditional Quercus stands are frequently replaced by other tree species like Pinus pinea L. plantations [8], potentially altering ecosystem dynamics through changes in litter quality and soil dynamics [24,25]. In addition, the herbaceous layer of Mediterranean wood pastures is highly diverse in plant species [26], with presence of grasses and legume (hereafter “legumes”) and non-legume forbs (hereafter “forbs”). These plant functional types (PFTs) differ in their nitrogen (N) and light-use strategies, which also affect CO2 acquisition [27,28,29,30]. Therefore, their responses to tree canopies are expected to vary. However, to our knowledge, no study has separately examined the tree’s influence on grasses, legumes, and forbs.
In this study, we aim to fill these knowledge gaps by assessing how tree canopies influence carbon and nitrogen cycling in Mediterranean wood pastures. Specifically, we investigate (1) whether different PFTs exhibit distinct C and N contents and isotopic signatures (δ13C and δ15N) depending on the microenvironment (under canopy vs. open grassland); (2) whether these canopy influences differ between Quercus species and Pinus pinea L. plantations; and (3) whether the observed patterns are consistent across sites along an altitudinal and climatic gradient. For that purpose, we used C and N content and the isotopic ratios (δ13C and δ15N) in the PFTs, the belowground biomass, and the soil as a proxy of C and N cycling processes.
2. Materials and Methods
2.1. Study Sites and Experimental Design
Field work was carried out in the spring of 2016, coinciding with the most productive period of the system. Study sites were the same as reported in Ibañez et al. (2021), distributed in two locations in the southwest of the Iberian Peninsula [1]: Doñana Natural Park (DN, 37°15′34″ N, 6°19′55″ W, 30 m a. s. l.) and Sierra Morena mountains (SM, 37°39′50″ N, 5°56′20″ W, 296 m a. s. l.). Both locations have a Mediterranean climate regime [31] with warm, dry summers and mild winters. However, SM is slightly cooler and wetter than DN, with a mean annual temperature in SM of 16.8 °C and 18.1 °C in DN and a mean annual precipitation in SM of 648 mm and 543 mm in DN. SM soils have a texture between sandy clay loam and clay. DN soils are sandier than SM, with a sandy loam texture (Table S1). Grasslands in both locations are dominated by herbaceous annual species, including grasses, forbs, and legumes. Both locations are extensively grazed at similar stocking rates by cattle and goats: DN has 0.40 livestock units (LSU) ha−1, and SM has 0.36 LSU ha−1.
At both sites, we conducted a survey focused on Mediterranean wood pastures typical of the region. The surveyed locations included SM-ilex, dominated by Quercus ilex L., and DN-suber, dominated by Quercus suber L., both the most abundant stands in the Iberian Peninsula; DN-mixed, where a mixture of Q. ilex and Q. suber predominates, representing the second most abundant stand type; and DN-pinea, where Pinus pinea dominates, a species frequently planted to replace traditional canopies [8]. Tree densities (trees ha−1) for these systems were on average 34 ± 1 in SM-ilex, 26 ± 1 in DN-mixed, 26 ± 4 in DN-suber, and 48 ± 6 in DN-pinea (MJ. Leiva, personal communication, 2016), consistent with the typical values for these systems in the region [8].
Within each wood pasture, we selected four tree individuals of each species: SM-ilex (Q. ilex), DN-suber (Q. suber), DN-mixed (Q. ilex and Q. suber), and DN-pinea (P. pinea). Trees were of similar size within each species, with the following average diameters at breast height: Q. ilex 43 ± 3 cm, Q. suber 63 ± 3 cm, and P. pinea 57 ± 6 cm. The presence or absence of tree canopies defined two distinct sampling areas: under canopy (UC) and open grassland (OG). Based on in situ field observations, we defined the UC area as a 1 m radius around the selected tree trunk, while the OG area was located at least 3 m away, a distance considered sufficient to be clearly outside the canopy’s influence. Thus, we established four UC and four OG sampling areas in SM-ilex, DN-suber, and DN-pinea, respectively, and eight UC and eight OG sampling areas in DN-mixed (as there was Q. ilex and Q. suber), which resulted in 40 sampling areas (20 UC and 20 OG).
In each sampling area (UC and OG), we surveyed the plant functional types (PFTs) of the herbaceous layer, including forbs, grasses, and legumes. For that, we collected leaves from at least 10 individuals of the dominant species of each plant functional type (PFT). These included grasses (Bromus hordeaceus L. and Hordeum vulgare L.), forbs (Calendula arvensis L., Chamaemelum mixtum L., Crepis capillaris L., Erodium moschatum L., and Geranium molle L.), and legumes (Ornithopus sativus Brot. and Trifolium subterraneum L.). The PFT composition from the same study locations was used to interpret and discuss our results [1].
Also, we extracted two soil cores per sampling area (9 cm2 and 0–10 cm depth) for soil and belowground biomass (BGB) analysis, respectively. In the laboratory, one of the cores was washed and filtered through a 0.2 mm pore size strainer to obtain the BGB. Coarse elements were manually removed from the BGB sample if any. The second soil core was sieved at 2 mm to exclude coarse elements and roots. All the collected samples were oven-dried at 60 °C until reaching a constant weight and ground using a ball mill (MM200, Retsch, Asturias, Spain). Samples were then tin encapsulated (Courtage Analyse Service, Mont Saint-Aignan, France) for carbon (C) and nitrogen (N) content and isotopic natural abundance determination (Section 2.2).
2.2. Determination of Carbon and Nitrogen Content and Isotopic Natural Abundance
Isotopic composition (δ13C and δ15N) was calculated as a deviation of the isotope ratio (R = 13C/12C or R = 15N/14N) of the samples from the ratio of the corresponding international standard (δ = (Rsample/Rstandard) − 1), VPDB for δ13C, and air-N2 for δ15N [32]. For that, we used glutamic acid (δ13C = −28.319‰, δ15N = −3.983‰), acetanilide (δ13C = −27.787‰, δ15N = +1.6‰), and N-1 (δ15N = +0.40‰) as laboratory standards for all the samples except soils. Standards were calibrated against the international reference materials USGS40 for carbon (δ13C = −26.389‰V-PDB) and IAEA-N-1 for nitrogen (δ15N = +0.43‰Air-N2). Sample preparation was carried out at the Institut de Biologie des Plantes at the Université Paris-Saclay. Subsequently, the samples were analysed at the Isolab of the Grassland Sciences group at ETH Zurich using a Flash EA 1112 Series elemental analyser (Finnigan MAT, Bremen, Germany) coupled to a DeltaPlusXP isotope ratio mass spectrometer (Finnigan MAT, Bremen, Germany) via a 6-port valve [33] and a ConFlo III interface [34].
For the soil samples, we used acetanilide (δ13C = −27.22‰, δ15N = −4.43‰), caffeine (δ13C = −42.56‰, δ15N = −5.79‰), and tyrosine (δ13C = −24.00‰, δ15N = +5.16‰) as laboratory standards, which were calibrated using NBS-22 for carbon (δ13C = −30.03‰V-PDB) and IAEA-N-1 for nitrogen (δ15N = +0.43‰Air-N2). Soil samples were both prepared and analysed at the Isolab of the Grassland Sciences group at ETH Zurich. The analytical precision, based on repeated measurements of laboratory standards, was ±0.111‰ for δ13C and ±0.127‰ for δ15N.
2.3. Data Analysis
We ran linear models on the C and N content and the isotopic composition (δ13C, δ15N) of each PFT (forbs, grasses, and legumes), BGB, and soil, as a function of location (SM-ilex, DN-mixed, DN-suber, DN-pinea) and canopy (OG, UC). Final models were selected by a stepwise procedure based on the Akaike information criterion (AIC), using the stepAIC function, MASS package [35]. Linear models were also applied to explore the relationships between C and N dynamics within or between ecosystem compartments when applicable. Only the most explanatory and parsimonious models are presented and discussed. All data analyses were performed using R software [36].
3. Results
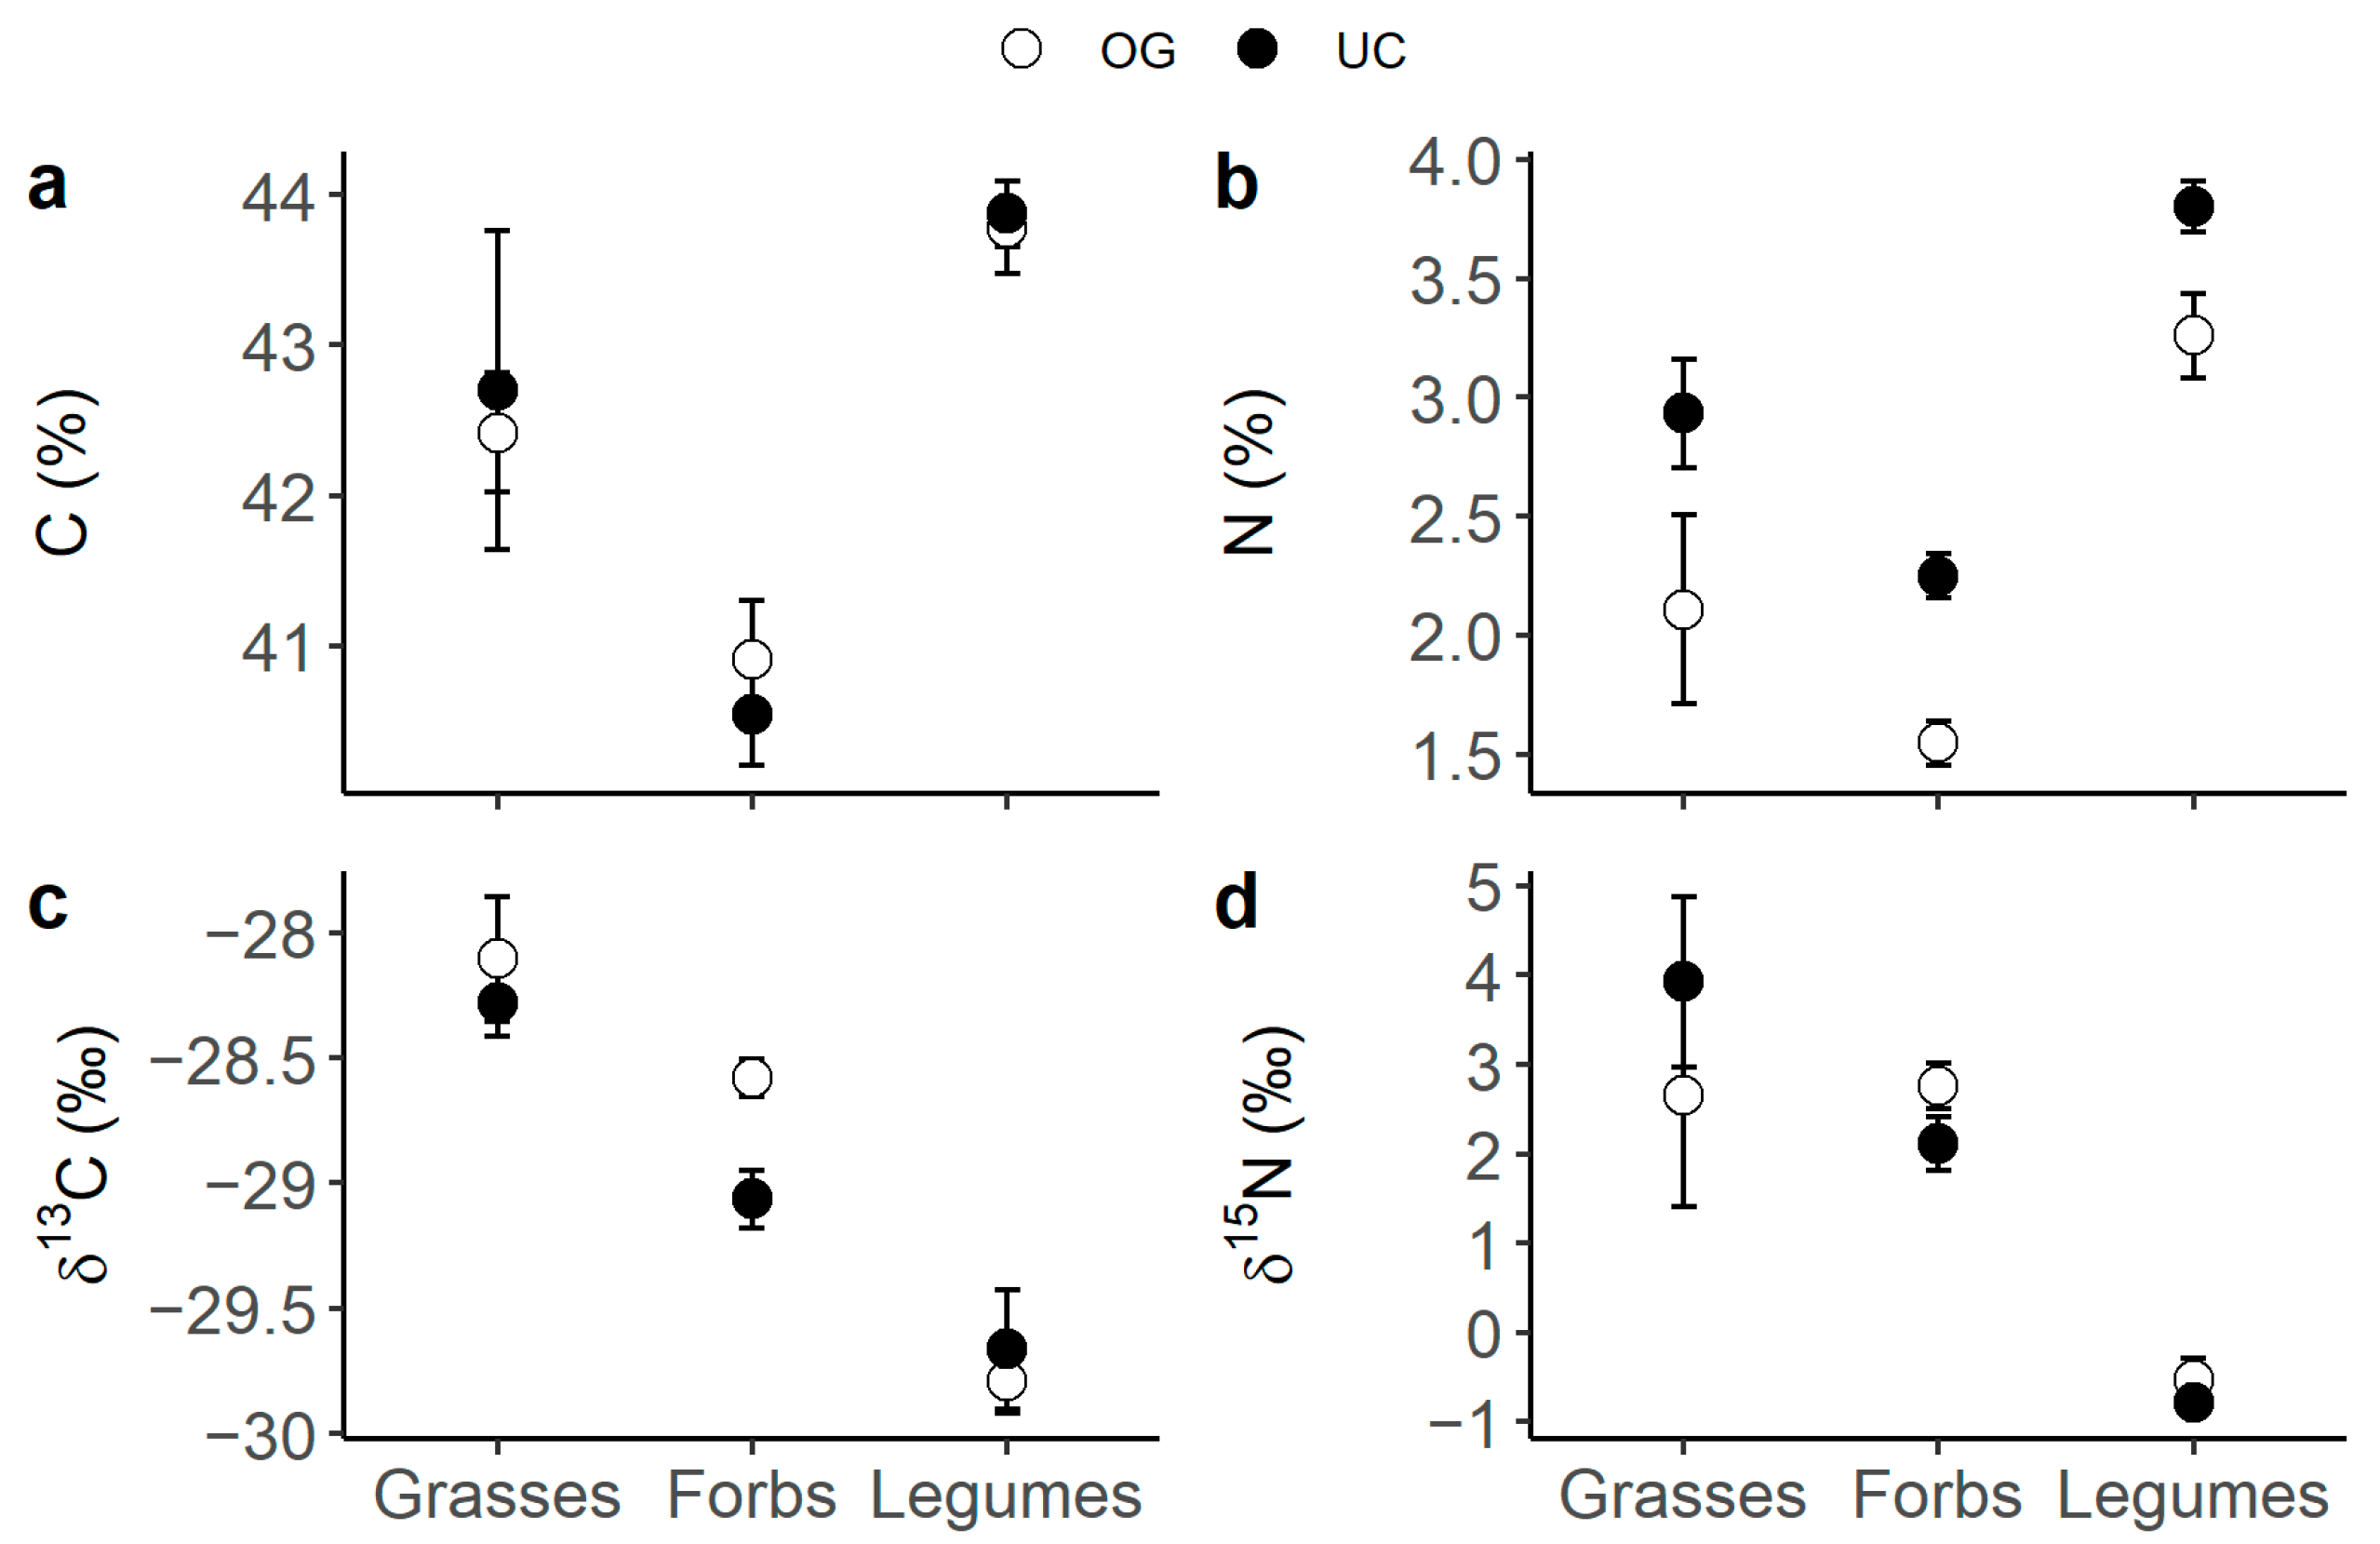
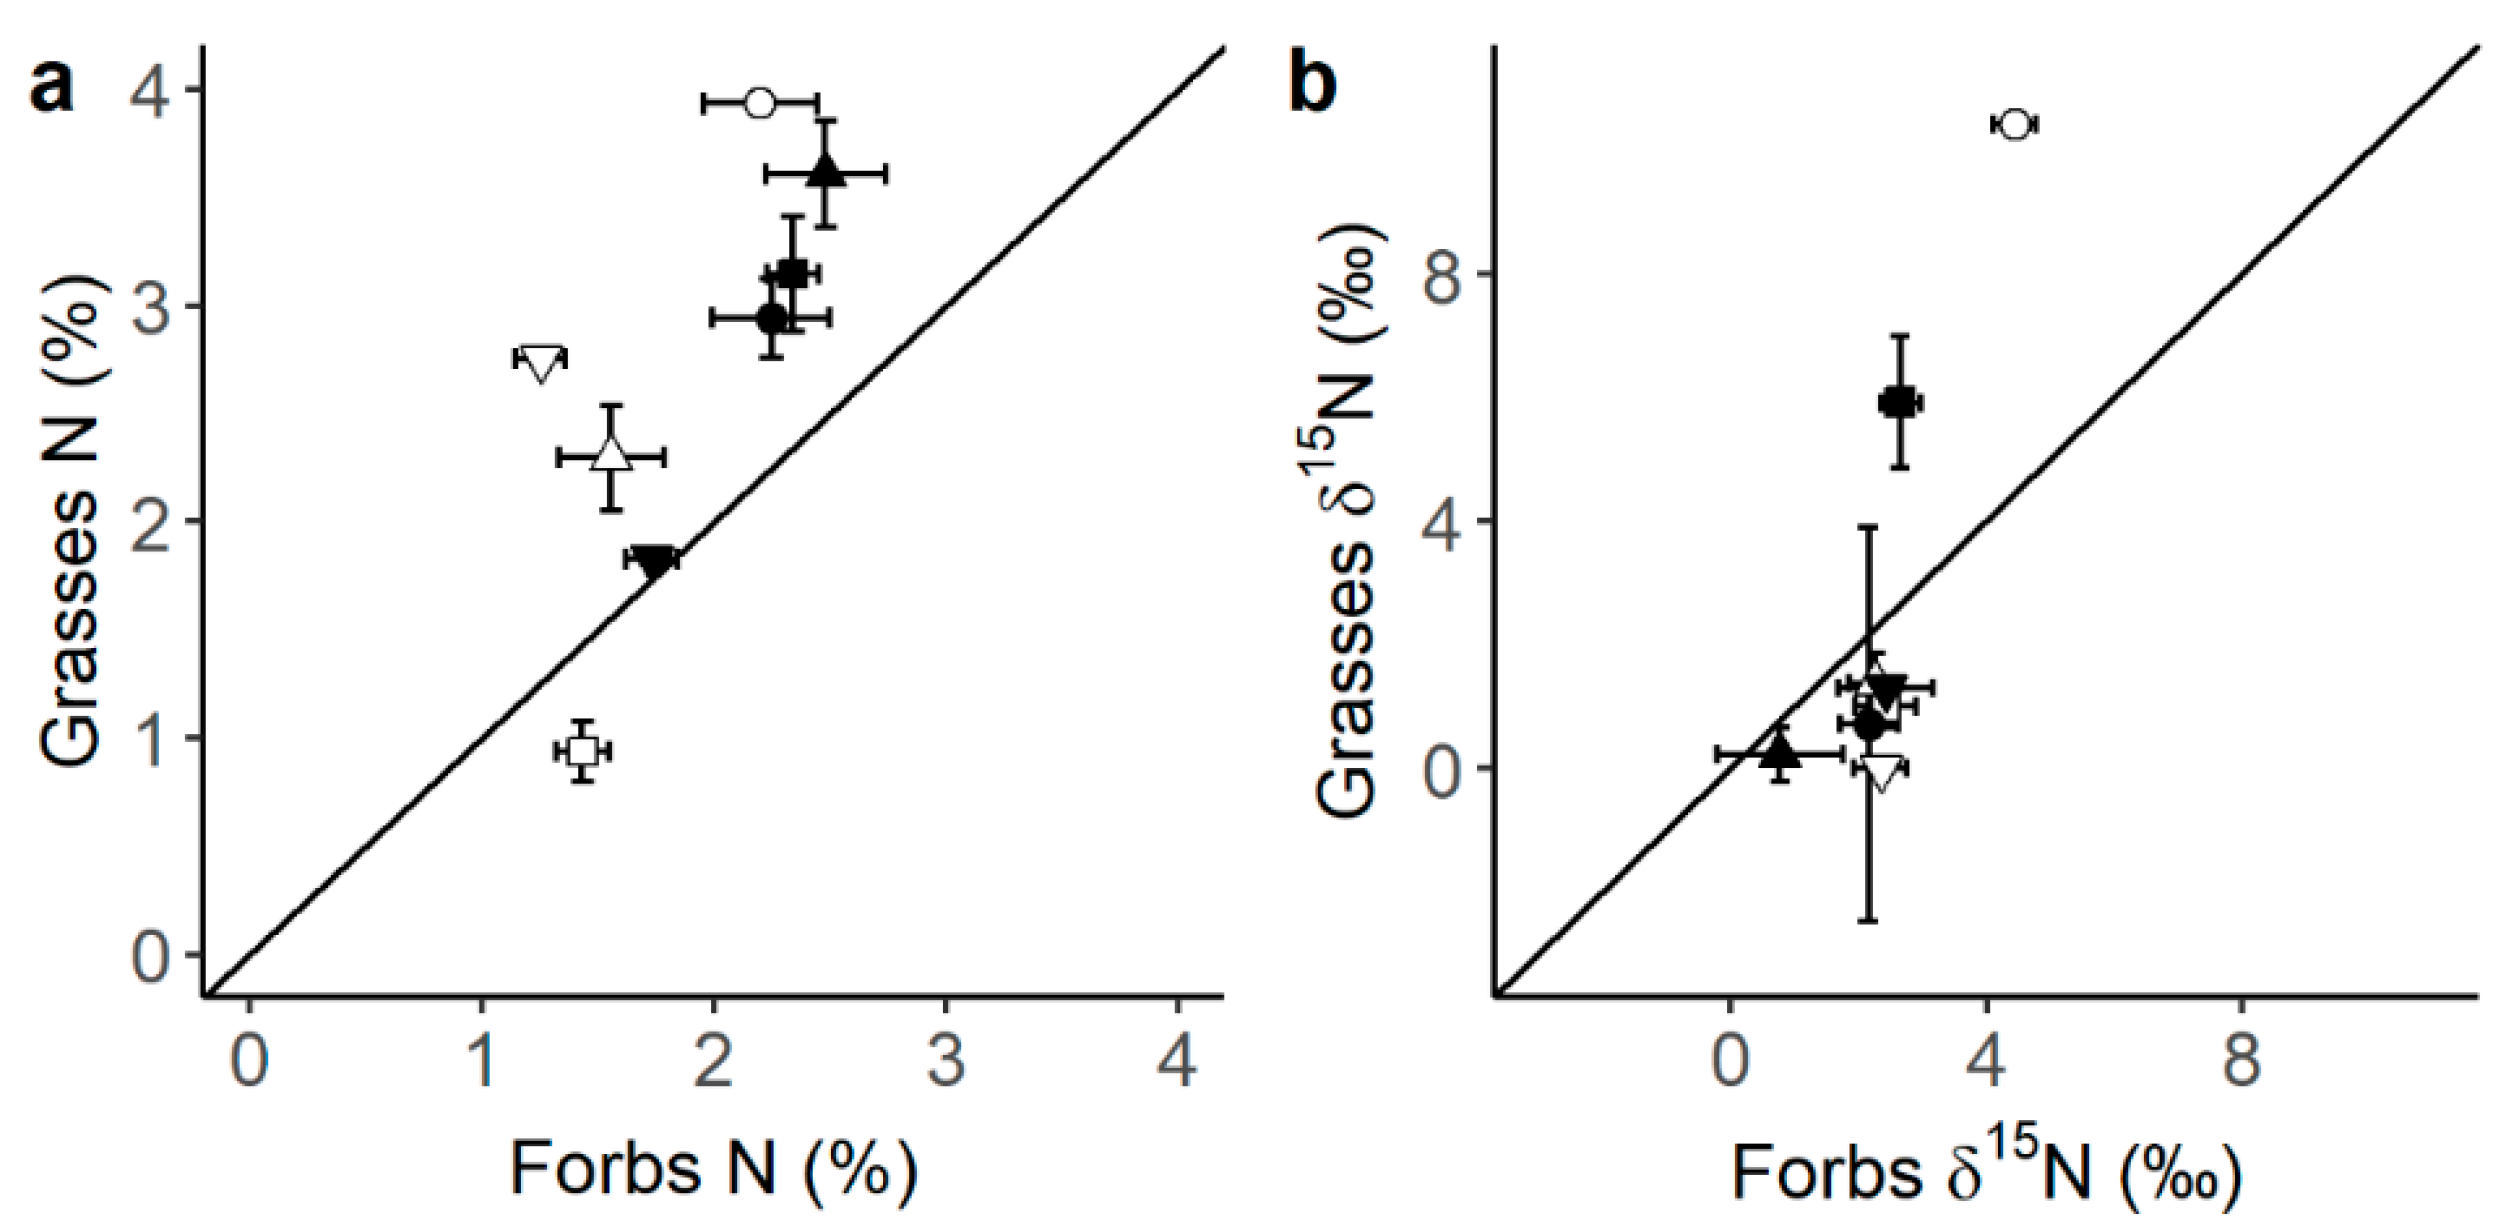
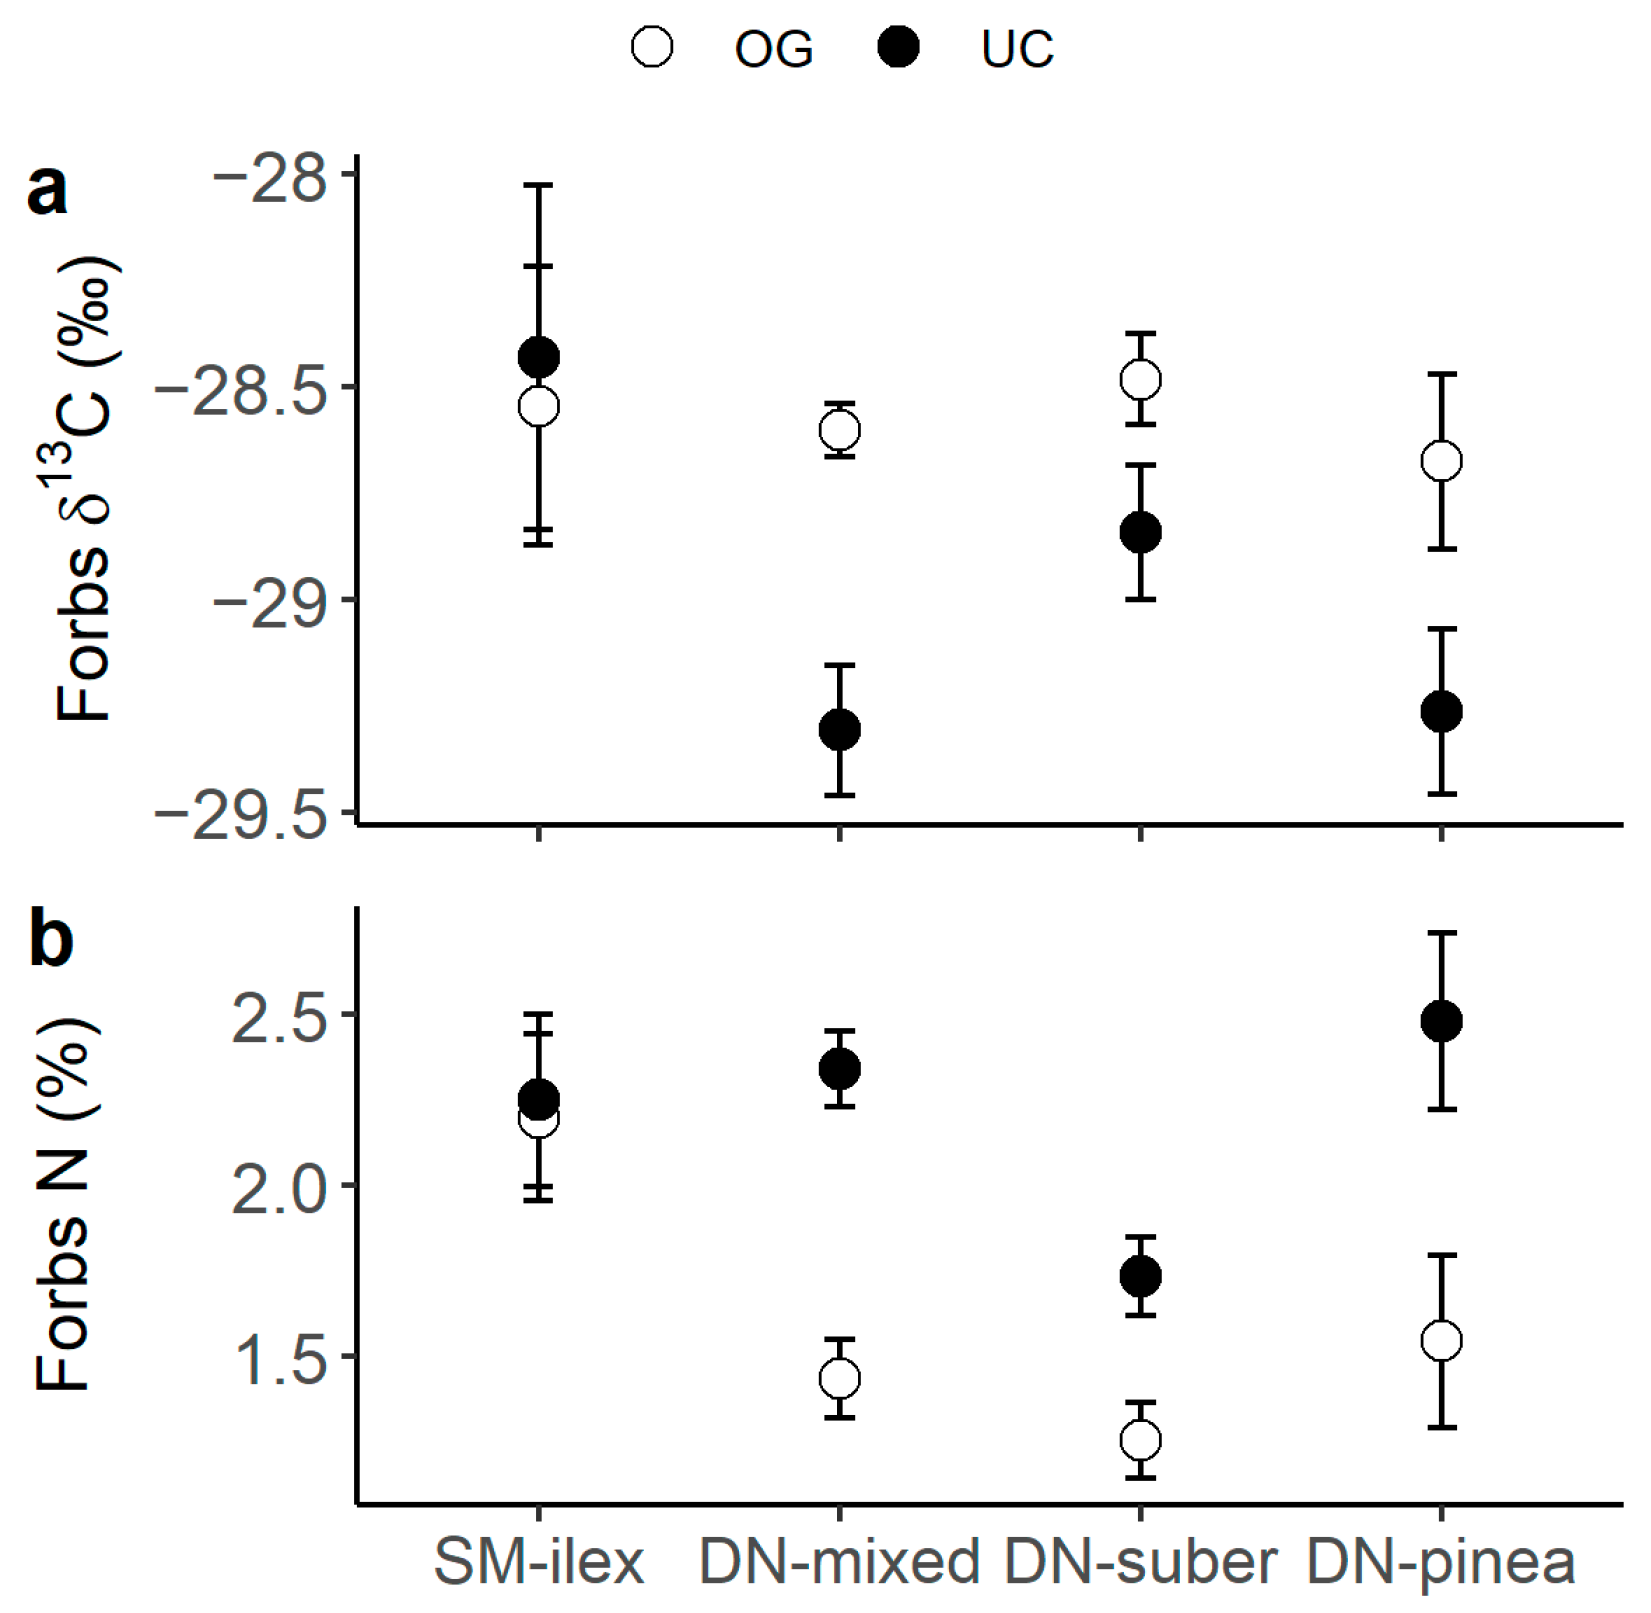
Legumes presented the highest C and N content (Figure 1a,b), as well as the most 13C- (Figure 1b) and 15N- (Figure 1c) depleted tissues compared to forbs and grasses. Also, when comparing grasses to forbs, grasses had generally higher N content than forbs (Figure 2a, p-value t-test < 0.001) and tended to present lower δ15N values (Figure 2b). N content was consistently higher under the canopy than in the open grassland across all three plant functional types (PFTs) (Figure 1b). Moreover, forbs presented a differential canopy effect dependent on location (DN vs. SM) in their δ13C (Figure 3a) and δ15N (Figure 3b). Thus, forbs presented more 13C-depleted tissues under the canopy than in the open grassland in the DN area, especially in DN-mixed and DN-pinea (Table 1), while such a canopy effect was not observed in SM-ilex (Table 1 and Figure 3a). Similarly, the N content in forbs increased under the canopy in DN, especially noticeable in DN-mixed and DN-pinea (Table 1), while the N content in forbs in SM-ilex did not show any difference between under the canopy and the open grassland (Figure 3b and Table 1).
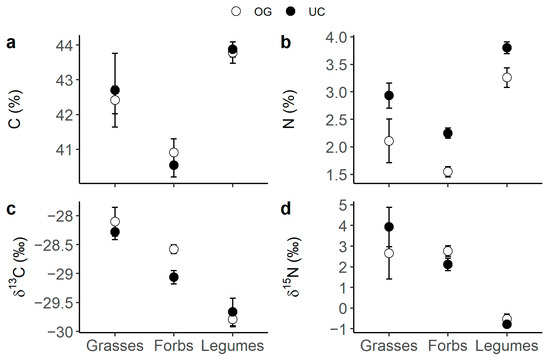
Figure 1.
Means ± 1 standard error per PFT and canopy (open symbols indicate open grassland and solid symbols indicate under the canopy): (a) C content; (b) N content; (c) δ13C; and (d) δ15N.
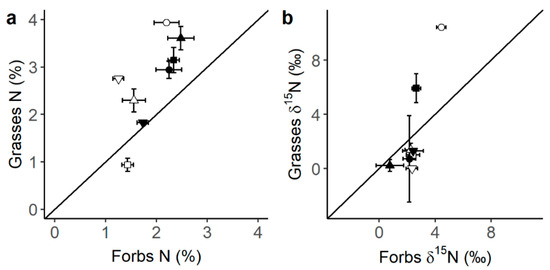
Figure 2.
Relationship between (a) grass N content and forb N content and (b) grass δ15N and forb δ15N (shapes = ○●SM-ilex, □■DN-mixed, ▽▼DN-suber, △▲DN-pinea; open symbols indicate open grassland, and solid symbols indicate under the canopy). Mean ± 1 standard error. The diagonal line indicates a 1:1 relationship.
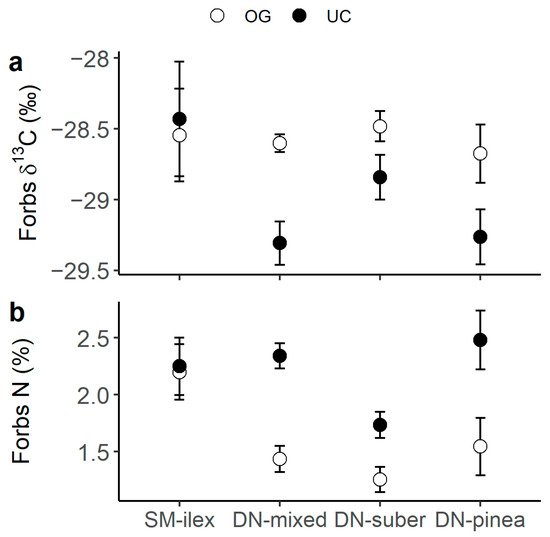
Figure 3.
(a) Forb δ13C and (b) forb N content per location and canopy (open symbols indicate open grassland, and solid symbols indicate under the canopy). Mean ± 1 standard error.

Table 1.
Linear modelling of δ13C (‰) and N content (%) in forbs as a function of location and canopy. Location with SM-ilex as the reference level and canopy with open grassland (OG) as the reference level. Estimates of the explanatory variables (Est.), standard error (SE), t, and p-value. Only significant (p < 0.05) models are shown in the table.
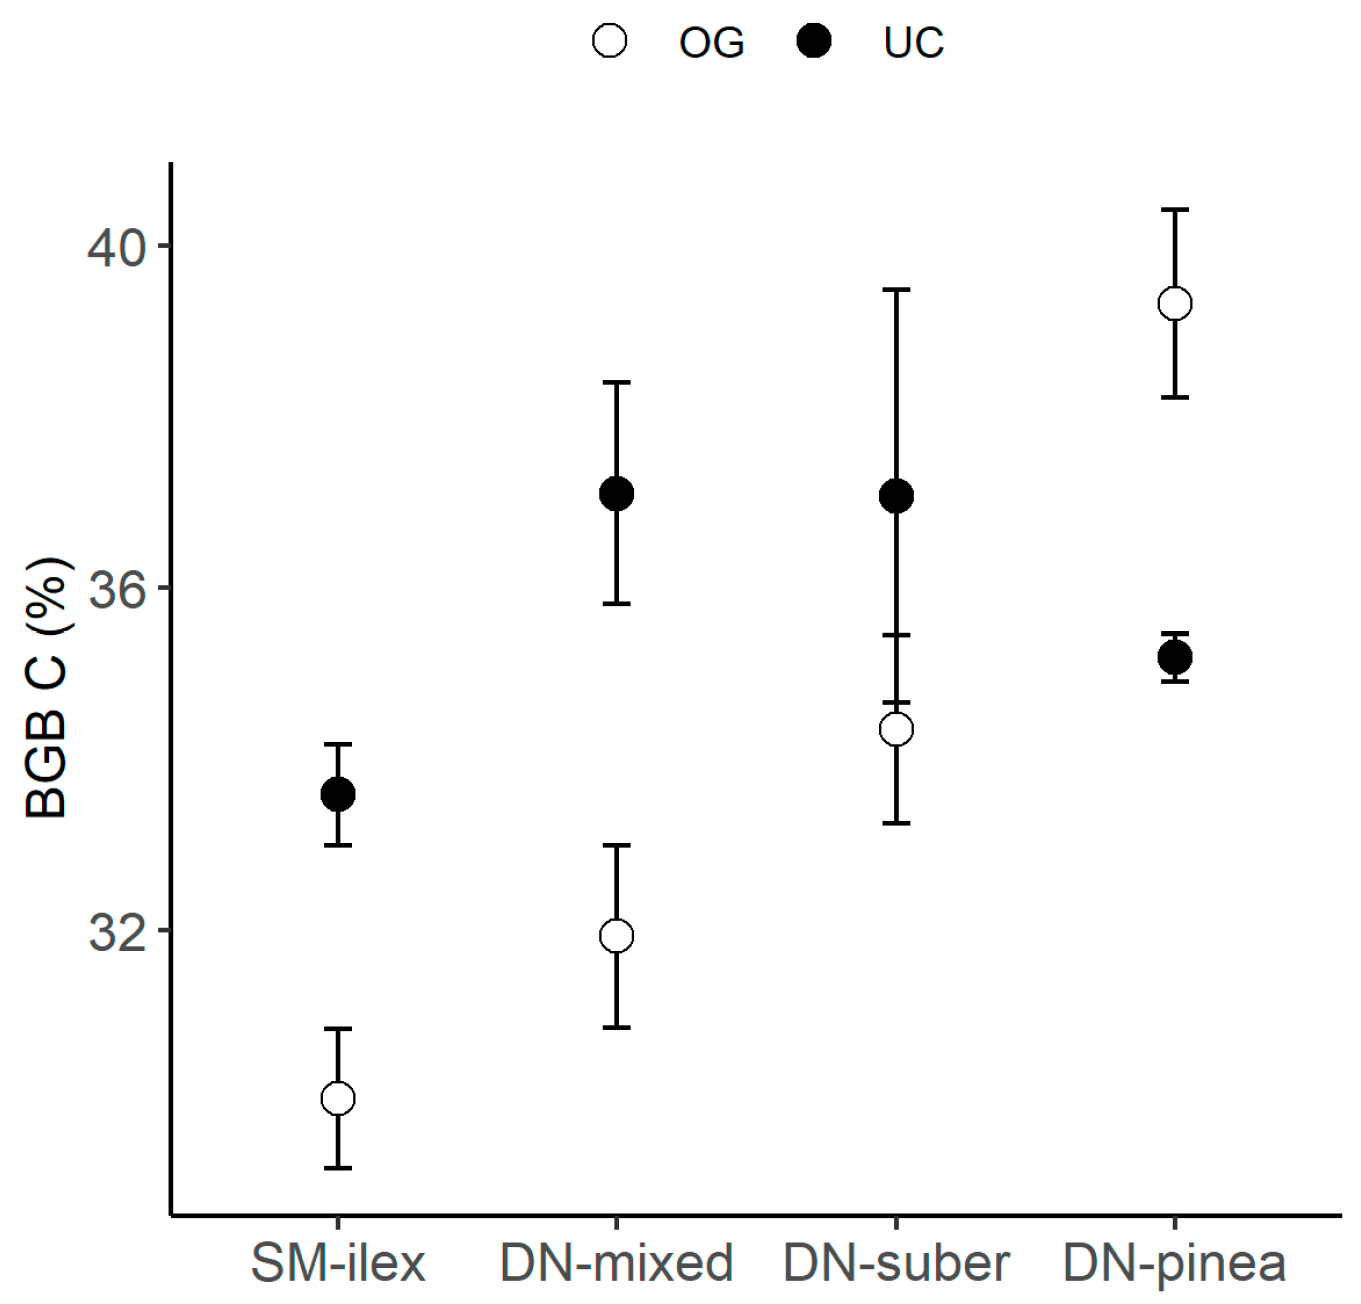
On the other hand, BGB had higher C content under the canopy than in the open grassland in all Quercus-species-dominated locations (SM-ilex, DN-mixed, DN-suber, Figure 4), while in the P. pinea-dominated region, the C content in the BGB decreased under the canopy compared to the open grassland (Table 2 and Figure 4).
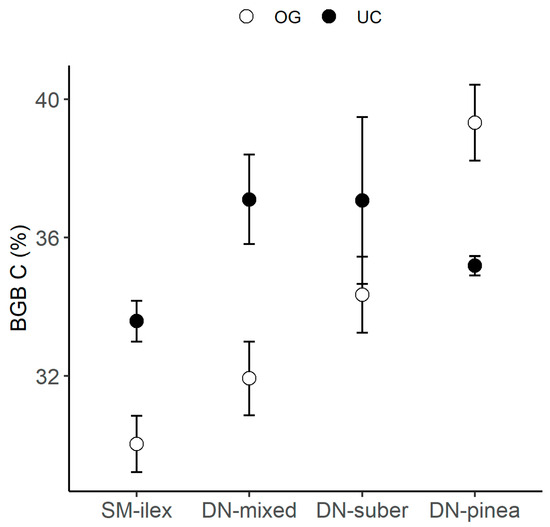
Figure 4.
Mean C content in belowground biomass (BGB) ± 1 standard error, per location and canopy: open grassland (OG) and under the canopy (UC).
Table 2.
Linear modelling of C content (%) in belowground biomass (BGB) as a function of location and canopy. Location with SM-ilex as the reference level and canopy with open grassland (OG) as the reference level. Estimates of the explanatory variables (Est.), standard error (SE), t, and p-value. Only significant (p < 0.05) models are shown in the table.
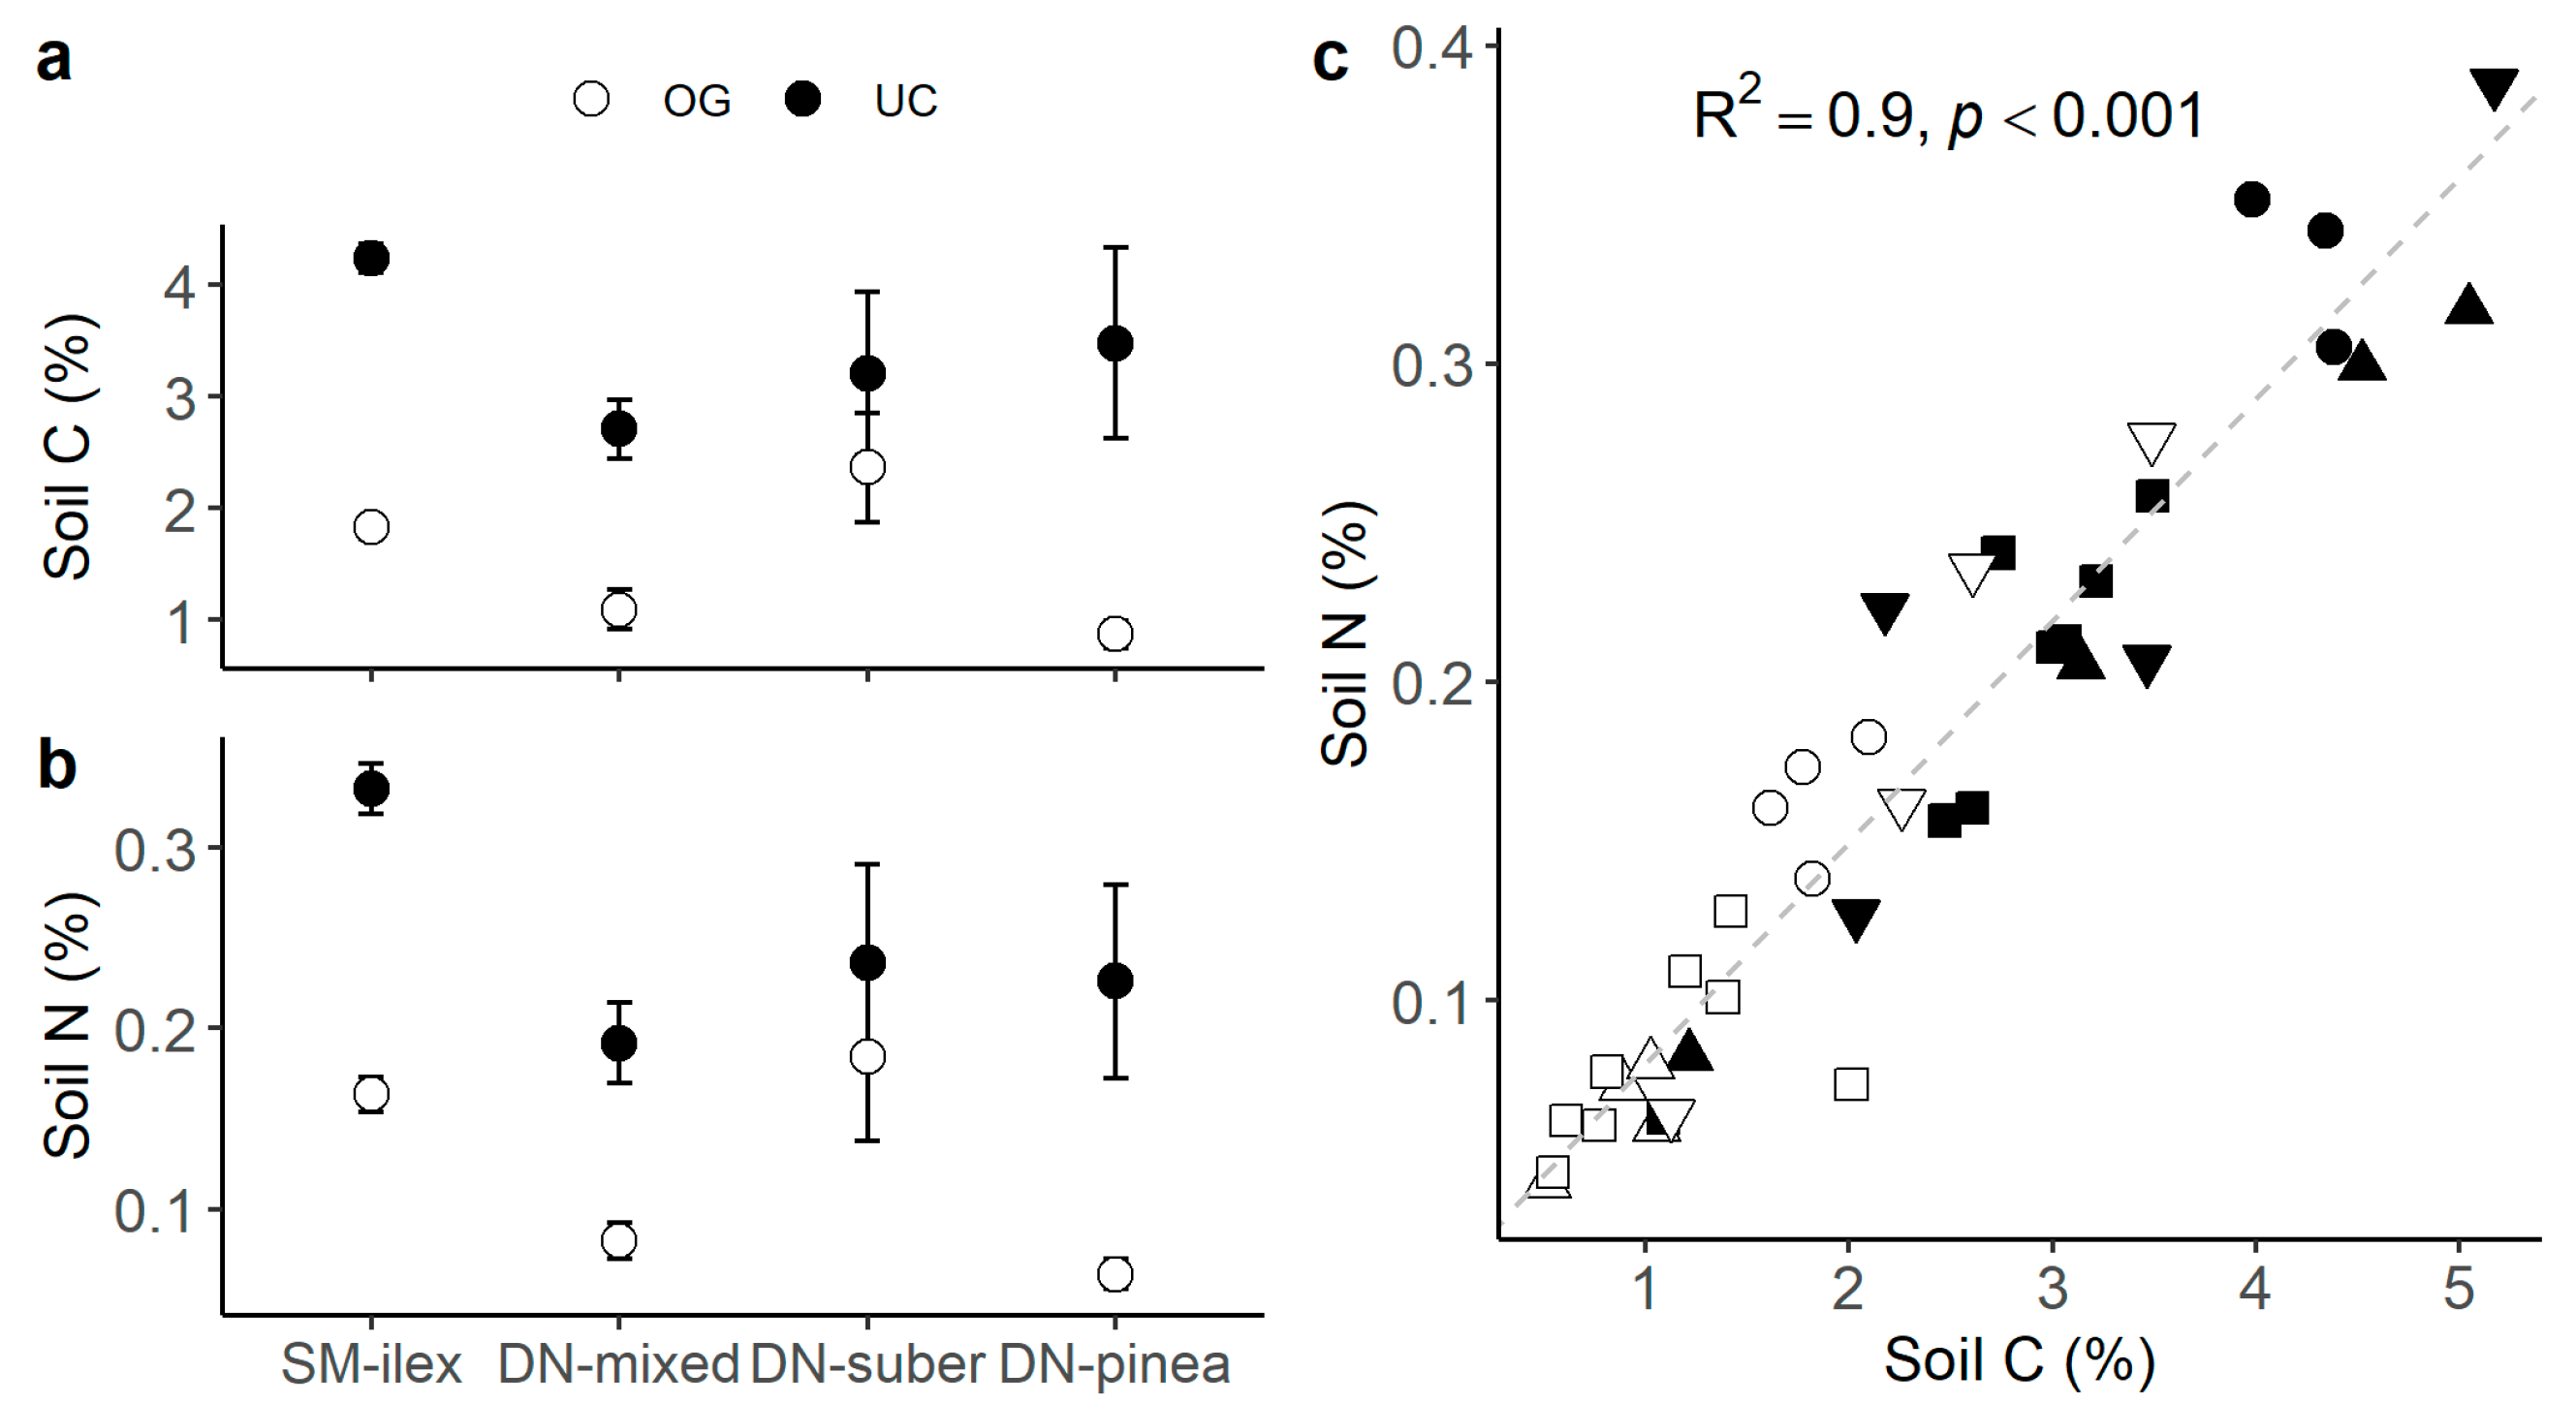
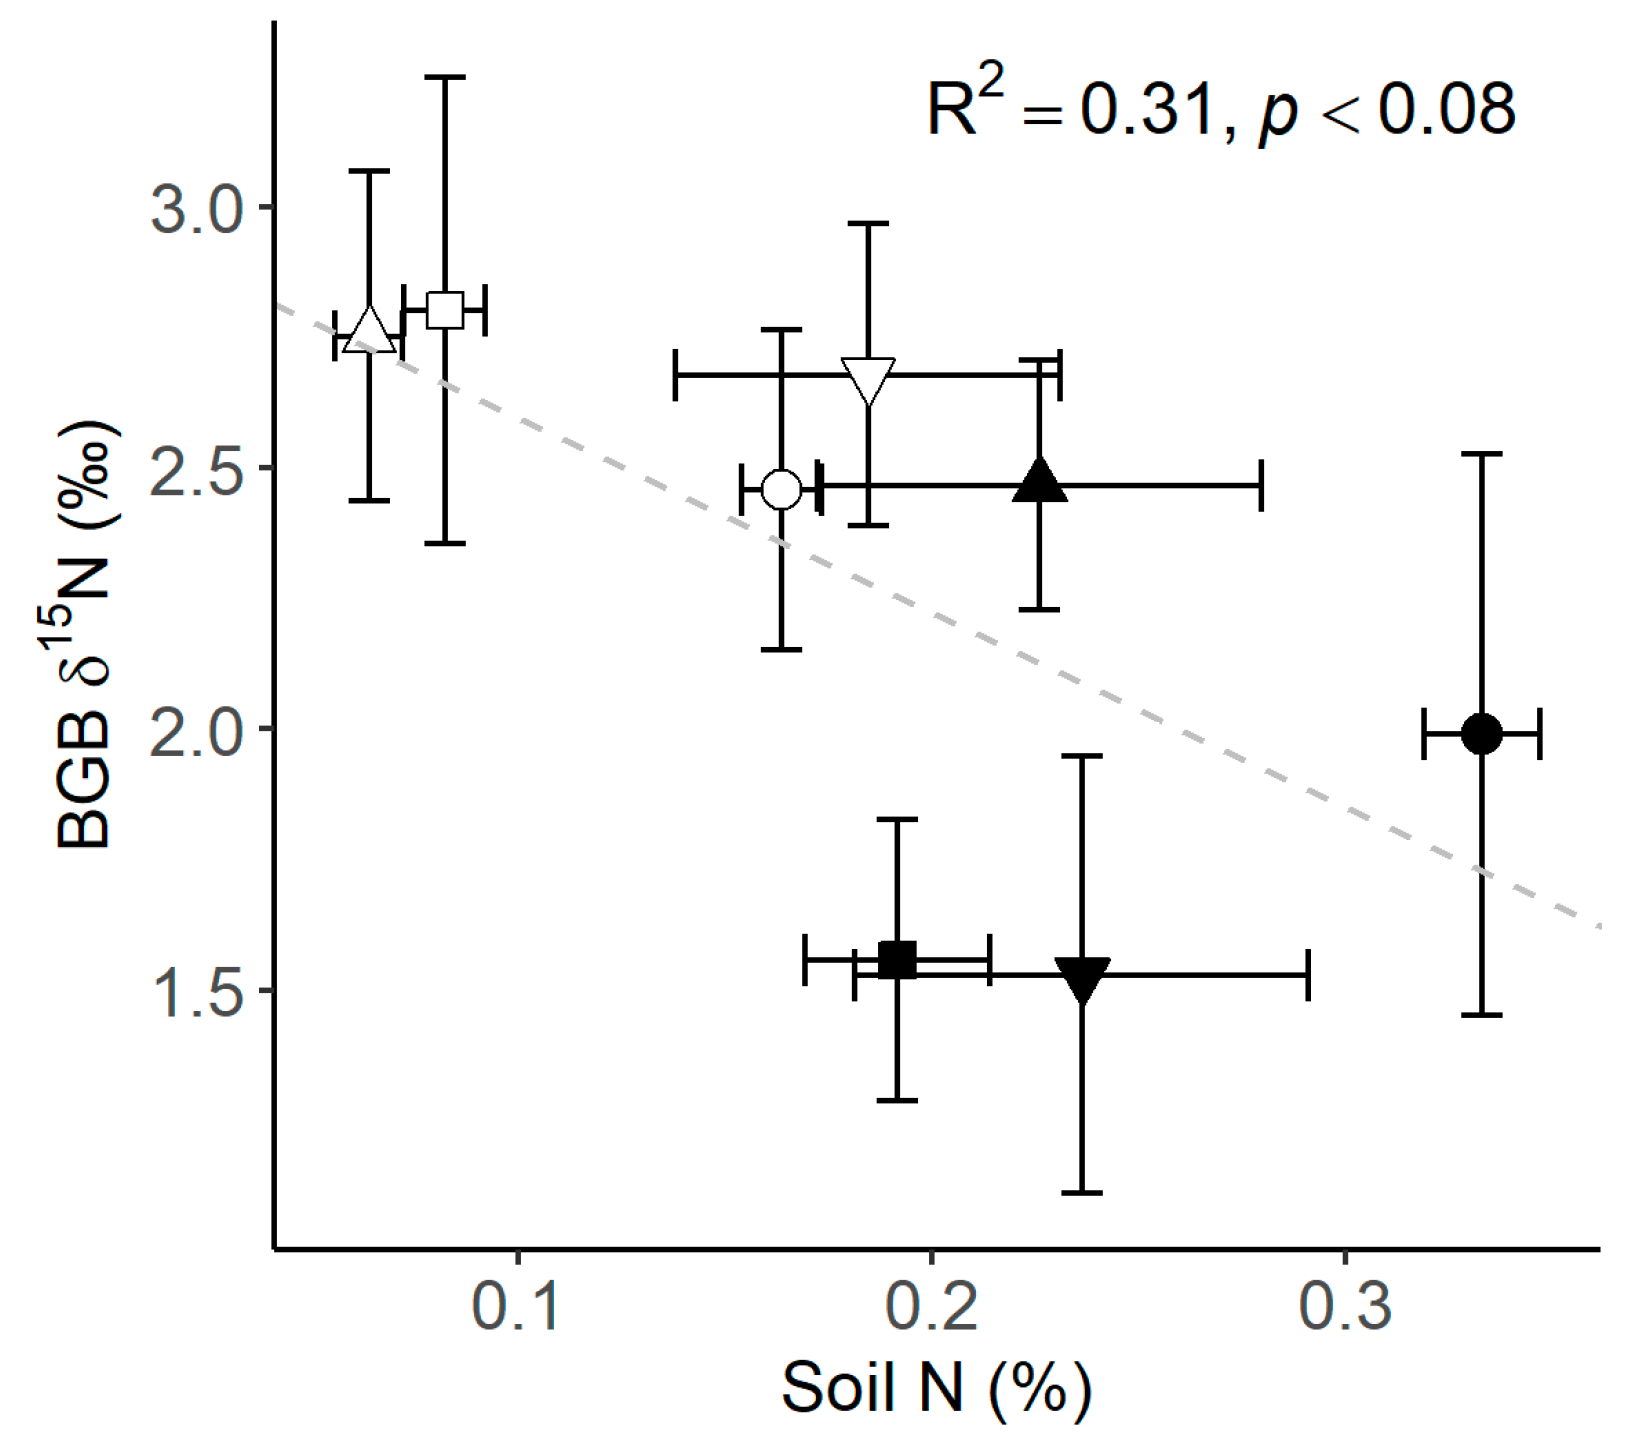
Soil C and N contents were consistently higher under the canopy (Table 3 and Figure 5a,b), and soil C and N were positively correlated (R2 0.9, p < 0.001, Figure 5c). At the same time, BGB δ15N tended to be lower with increasing soil N content (R2 0.31, p < 0.08, Figure 6).
Table 3.
Linear modelling of soil C and N content (%) as a function of location and canopy. Location with SM-ilex as the reference level and canopy with open grassland (OG) as the reference level. Estimates of the explanatory variables (Est.), standard error (SE), t, and p-value. Only significant (p < 0.05) models are shown in the table.
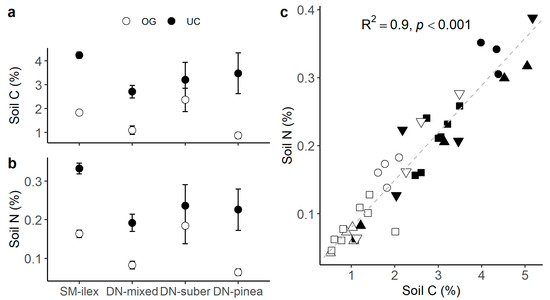
Figure 5.
(a) Mean soil C ± 1 standard error; (b) mean soil N ± 1 standard error; and (c) relationship between soil C and soil N (shapes = ○●SM-ilex, □■DN-mixed, ▽▼DN-suber, △▲DN-pinea; open symbols indicate open grassland, and solid symbols indicate under the canopy). The diagonal slashed line indicates the linear trend.
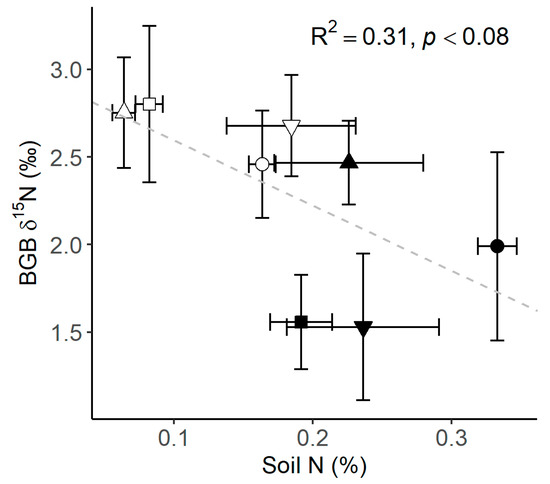
Figure 6.
Relationship between soil N and belowground biomass (BGB) δ15N (shapes = ○●SM-ilex, □■DN-mixed, ▽▼DN-suber, △▲DN-pinea; open symbols indicate open grassland, and solid symbols indicate under the canopy). Mean ± 1 standard error; the diagonal slashed line indicates the linear trend.
4. Discussion
4.1. The Canopy Effect on Plant Functional Types of the Herbaceous Layer
The evaluation of plant functional types (PFTs) of the herbaceous layer (forbs, grasses, and legumes) reveals intricate interactions between tree canopies and C and N acquisition and use. Despite their superior N-fixing abilities and efficient CO2 exchange (Figure 1), legumes were not dominant in the ecosystem, particularly under tree canopies, where the microenvironment did not favour their abundance [1]. The capacity of legumes to fix atmospheric nitrogen has been reported to be not specially favoured under a canopy [37], and also legumes may be constrained by their high light requirements [5,38,39].
Furthermore, we hypothesize that under a canopy, legumes may be outcompeted by species better adapted to N-rich conditions. Thus, our results indicate that grasses, in particular, benefited from the increased soil N availability found under the canopy. This is evident in their higher N content (Figure 2a) and generally lower δ15N values (Figure 2b) compared to forbs, suggesting that grasses are highly efficient at N uptake and/or exploiting symbiotic N sources [18]. Notably, nitrogen transfer between legumes and grasses (a source of symbiotic N; Figure 1d) is more efficient than between legumes and forbs [40,41], which enhances the competitive advantage of grasses. Additionally, grasses’ fibrous root system [41,42,43] likely enhances their ability to absorb N from the upper soil layers, including symbiotically fixed N. In contrast, forbs generally have taproots, which may be less effective in this process [41]. This may make grasses very competitive and able to thrive in high-N environments [44], via increasing their biomass often at the expense of forbs and legumes.
Certainly, such competitive advantages of grasses, especially their high nitrogen-use efficiency, make grasses also strong competitors in N-poor environments. However, in N-poor environments, legumes and forbs are also good competitors, as legumes can enhance their N fixation capacity [45], and forbs may be able to access nutrients in deeper soil layers due to their deeper root system, making legumes and forbs able to maintain or even surpass grasses under limiting N conditions. Overall, this intricate interplay between nutrient availability and plant functional traits is shaping the community composition in Mediterranean wood pastures.
4.2. The Canopy Effect in Representative Mediterranean Wood Pastures: Quercus vs. Pinus pinea Canopies
Our results suggest that the canopy effect may differ when comparing Quercus species stands and P. pinea plantations. This was detected on the canopy effect on the C content in the BGB, with a higher C content under the canopy than in the open grassland in Quercus-species-dominated canopies (SM-ilex, DN-suber and DN-mixed), while P. pinea (DN-pinea) presented the opposite pattern (Figure 4).
This may be explained by the generally higher investment in root biomass that plants present when soil N is low, since plants may invest more in root biomass to explore the soil for nutrients, which can increase root C content [46]. Thus, the lower C content in the BGB detected in DN-pinea under the canopy compared to the open grassland (Table 2 and Figure 4) could be indeed driven by low N availability. The environment under the canopy in DN-pinea had low soil N content, along with BGB tissues showing the highest δ15N (Figure 6). This suggests that N availability for plants was low, leading to restricted 15N discrimination.
Indeed, the litter of P. pinea has low N content, lower than the litter of Quercus species [24,47], and exhibits a strong mulching capacity and allelopathic properties. Specifically, pine litter can inhibit seed germination and hinder seedling establishment through both the physical barrier that it creates by covering the soil and the release of allelochemical compounds [48]. Also, a reduced phosphorus uptake under pine needles has been described [49]. Characteristics that combined may hinder the growth of the herbaceous layer [50] and could be driving these differences in the N availability and eventually drive an increase in the root C content [51] to obtain a limiting resource [52,53]. Moreover, this interestingly suggests that the current change in traditional stands needs further attention because a change in the tree species may imply profound changes in ecosystem C and N storage and cycling [54,55], changes that may go a priori unnoticed.
4.3. The Canopy Effect Along an Altitudinal/Climatic Gradient
Our results also suggest that the canopy effect can be site-dependent when comparing locations along an altitudinal/climatic gradient. This is shown by the almost neutral canopy effect found on the δ13C and N content of forbs in SM-ilex, in contrast to the strong canopy effect detected in DN (DN-suber, DN-mixed, and DN-pinea, Figure 3). Interestingly, this pattern aligns with the canopy effect on the net ecosystem CO2 exchange patterns reported by [1]. The authors reported from the same study locations (i) a strong canopy effect in DN (DN-suber, DN-mixed, and DN-pinea), wherein there was net CO2 uptake in the open grassland but CO2 emissions under the canopy, while (ii) in SM-ilex, the canopy effect was neutral, and there was a net CO2 uptake both under the canopy and in the open grassland. These findings, combined with our δ13C values, suggest that the stomatal conductance is similar between both microenvironments in SM, therefore similar 13C discrimination rates are possible, in contrast to the strong differences found in DN, where more restrictive environmental conditions likely amplify the canopy effect. Furthermore, this suggests that under less restrictive environmental conditions, the microenvironment beneath the canopy is similar to the open grassland. However, as conditions become more restrictive, the canopy effect strengthens. This agrees with other authors that described a more pronounced canopy effect under more restrictive conditions, such as increased aridity [56] on soil fertility [57] and/or productivity [58].
Ultimately, these findings underscore the crucial role of trees in driving ecosystem fertility and buffering extreme conditions. From a management perspective, this highlights the importance of optimizing tree cover based on multiple ecosystem functions in conjunction with local environmental conditions.
5. Conclusions
Changes in tree coverage and tree species may cause profound changes in C and N dynamics in Mediterranean wood pastures mediated by the herbaceous plant functional types (PFTs). PFTs interacted with the tree–open grassland mosaic in particular ways. This is shown, for instance, by the higher N content and generally lower δ15N of grasses compared to forbs, which suggests that grasses were highly competitive in terms of N acquisition, and this was probably one of the causes of their dominance under the canopy, where there was higher soil N content. The canopy effect was dependent on the tree species dominating the wood pasture. N availability in P. pinea appeared lower than in Quercus-dominated locations, which, in turn, influenced the canopy effect on the C content of the BGB. The lower nitrogen availability under Pinus pinea may result from its recalcitrant, nitrogen-poor litter and allelopathic effects, with slow decomposition and nutrient cycling. In addition, the canopy effect was also generally more pronounced with increasing environmental constraints (as is DN vs. SM). These findings suggest that prioritizing Quercus in Mediterranean wood pastures can be a management action to optimize soil fertility and highlight the relevance of trees as buffers of extreme conditions, especially in more arid environments. Our results can be used to better understand the interactions among ecosystem compartments in Mediterranean wood pastures by showing the canopy effect under different tree species, local conditions, and on the PFT of the herbaceous layer.
Supplementary Materials
The following supporting information can be downloaded at: https://www.mdpi.com/article/10.3390/land14061135/s1, Table S1: Texture fractions and USDA texture classification of the study sites. Texture fractions determined by densimetry; Table S2: Main species identified in the field per plant functional type (forbs, grasses and legumes).
Author Contributions
Conceptualization, M.I., S.A., M.J.L. and M.-T.S.; data curation, M.I.; formal analysis, M.I.; funding acquisition, M.J.L. and M.-T.S.; investigation, M.I., S.A., M.J.L., C.C., R.A.W., J.G. and M.-T.S.; methodology, M.I., S.A., C.C., J.G. and R.A.W.; project administration, M.J.L. and M.-T.S.; resources, M.J.L., J.G. and M.-T.S.; supervision, M.J.L., C.C., J.G. and M.-T.S.; writing—original draft, M.I.; writing—review and editing, M.I., S.A., M.J.L., C.C., R.A.W., J.G. and M.-T.S. All authors have read and agreed to the published version of the manuscript.
Funding
This work was funded by the Spanish Science Foundation FECYT-MINECO: BIOGEI (GL2013-49142-C2-1-R) and IMAGINE (CGL2017-85490-R) projects and supported by a FPI fellowship to Mercedes Ibañez (BES-2014-069243).
Data Availability Statement
The original contributions presented in the study are included in the article/Supplementary Materials, further inquiries can be directed to the corresponding author.
Acknowledgments
Thanks to all the colleagues who collaborated in laboratory and fieldwork tasks: Antonio Rodríguez, Miquel Sala, Helena Sarri, and Gianluca Segalina. Our special thanks to Dehesa de Gato S. L. state and Doñana Research Coordination Office for their support and facilities.
Conflicts of Interest
The authors declare no conflicts of interest.
References
- Ibañez, M.; Leiva, M.J.; Chocarro, C.; Aljazairi, S.; Ribas, À.; Sebastià, M.-T. Tree—Open Grassland Structure and Composition Drive Greenhouse Gas Exchange in Holm Oak Meadows of the Iberian Peninsula. Agronomy 2021, 11, 50. [Google Scholar] [CrossRef]
- Eichhorn, M.P.; Paris, P.; Herzog, F.; Incoll, L.D.; Liagre, F.; Mantzanas, K.; Mayus, M.; Moreno, G.; Papanastasis, V.P.; Pilbeam, D.J.; et al. Silvoarable systems in Europe—Past, present and future prospects. Agrofor. Syst. 2006, 67, 29–50. [Google Scholar] [CrossRef]
- Olea, L.; López-Bellido, R.J.; Poblaciones, M. Europe types of silvopastoral systems in the Mediterranean area: Dehesa. In Silvopastoralism and Sustainable Land Management. Proceedings of an International Congress on Silvopastoralism and Sustainable Management Held in Lugo, Spain, April 2004; Mosquera-Losada, M.R., Rigueiro-Rodríguez, A., McAdam, J., Eds.; CABI Publishing: Wallingford, UK, 2005; pp. 30–35. [Google Scholar]
- Huntsinger, L.; Campos, P.; Starrs, P.F.; Oviedo, J.L.; Díaz, M.; Standiford, R.B.; Gregorio, M. Working Landscapes of the Spanish Dehesa and California Oak Woodlands: An Introduction. In Mediterranean Oak Woodland Working Landscapes. Dehesas of Spain and Ranchlands of California; Campos, P., Huntsinger, L., Oviedo, J.L., Starrs, P.F., Diaz, M., Standiford, R.B., Montero, G., Eds.; Springer: New York, NY, USA, 2013; pp. 3–23. ISBN 978-94-007-6706-5. [Google Scholar]
- Marañón, T.; Pugnaire, F.I.; Callaway, R.M. Mediterranean-climate oak savannas: The interplay between abiotic environment and species interactions. Web Ecol. 2009, 9, 30–43. [Google Scholar] [CrossRef]
- Gaman, T.; Firman, J. Oaks 2040. The Status and Future of Oaks in California; California Oak Foundation: Oakland, CA, USA, 2006. [Google Scholar]
- Costa, A.; Madeira, M.; Lima Santos, J.; Oliveira, Â. Change and dynamics in Mediterranean evergreen oak woodlands landscapes of Southwestern Iberian Peninsula. Landsc. Urban Plan. 2011, 102, 164–176. [Google Scholar] [CrossRef]
- Costa Pérez, J.C.; Martín Vicente, Á.; Fernández Alés, R.; Estirado Oliet, M. Dehesas de Andalucía. Caracterización Ambiental; Consejería de Medio Ambiente, Junta de Andalucía: Sevilla, Spain, 2006; ISBN 849632981X. [Google Scholar]
- Rolo, V.; Moreno, G. Shrub encroachment and climate change increase the exposure to drought of Mediterranean wood-pastures. Sci. Total Environ. 2019, 660, 550–558. [Google Scholar] [CrossRef]
- Lobo-do-Vale, R.; Haberstroh, S.; Werner, C.; Nogueira, C.; Bugalho, M.N.; Caldeira, M.C. Effects of Shrub Encroachment on Carbon Assimilation and Growth of Mediterranean Cork Oak Trees Depend on Shrub Cover Density. Forests 2023, 14, 960. [Google Scholar] [CrossRef]
- Aljazairi, S.; Arias, C.; Nogués, S. Carbon and nitrogen allocation and partitioning in traditional and modern wheat genotypes under pre-industrial and future CO2 conditions. Plant Biol. 2015, 17, 647–659. [Google Scholar] [CrossRef]
- Craine, J.M.; Brookshire, E.N.J.; Cramer, M.D.; Hasselquist, N.J.; Koba, K.; Marin-Spiotta, E.; Wang, L. Ecological interpretations of nitrogen isotope ratios of terrestrial plants and soils. Plant Soil 2015, 396, 1–26. [Google Scholar] [CrossRef]
- Hobbie, E.A.; Högberg, P. Nitrogen isotopes link mycorrhizal fungi and plants to nitrogen dynamics. New Phytol. 2012, 196, 367–382. [Google Scholar] [CrossRef]
- Kahmen, A.; Buchmann, N. Addressing the Functional Value of Biodiversity for Ecosystem Functioning Using Stable Isotopes. Terr. Ecol. 2007, 1, 345–359. [Google Scholar]
- Andivia, E.; Fernández, M.; Alejano, R.; Vázquez-Piqué, J. Tree patch distribution drives spatial heterogeneity of soil traits in cork oak woodlands. Ann. For. Sci. 2015, 72, 549–559. [Google Scholar] [CrossRef]
- Gómez-Rey, M.X.; Madeira, M.; Gonzalez-Prieto, S.J.; Coutinho, J. Soil C and N dynamics in a Mediterranean oak woodland with shrub encroachment. Plant Soil 2013, 371, 339–354. [Google Scholar] [CrossRef]
- Kalcsits, L.A.; Buschhaus, H.A.; Guy, R.D. Nitrogen isotope discrimination as an integrated measure of nitrogen fluxes, assimilation and allocation in plants. Physiol. Plant. 2014, 151, 293–304. [Google Scholar] [CrossRef] [PubMed]
- Yoneyama, T.; Matsumaru, T.; Usui, K.; Engelaar, W.M.H.G. Discrimination of nitrogen isotopes during absorption of ammonium and nitrate at different nitrogen concentrations by rice (Oryza sativa L.) plants. Plant Cell Environ. 2001, 24, 133–139. [Google Scholar] [CrossRef]
- Ehleringer, J.; White, J.; Johnson, D.A.; Brick, M. Carbon isotope discrimination, photosynthetic gas exchange, and transpiration efficiency in beans and range grasses. Acta Oecologica 1990, 11, 611–625. [Google Scholar]
- Bonafini, M.; Pellegrini, M.; Ditchfield, P.; Pollard, A.M. Investigation of the “canopy effect” in the isotope ecology of temperate woodlands. J. Archaeol. Sci. 2013, 40, 3926–3935. [Google Scholar] [CrossRef]
- Buchmann, N.; Kao, W.Y.; Ehleringer, J. Influence of stand structure on carbon-13 of vegetation, soils, and canopy air within deciduous and evergreen forests in Utah, United States. Oecologia 1997, 110, 109–119. [Google Scholar] [CrossRef]
- van der Merwe, N.J.; Medina, E. The canopy effect, carbon isotope ratios and foodwebs in amazonia. J. Archaeol. Sci. 1991, 18, 249–259. [Google Scholar] [CrossRef]
- Della Coletta, L.; Bielefeld Nardoto, G.; Ribeiro Latansio-Aidar, S.; Ribeiro da Rocha, H. Isotopic view of vegetation and carbon and nitrogen cycles in a cerrado ecosystem, southeastern Brazil. Sci. Agric. 2009, 66, 467–475. [Google Scholar] [CrossRef]
- Fioretto, A.; Papa, S.; Pellegrino, A.; Fuggi, A. Leaf litter decomposition dynamics in Mediteranean area. In Soil Ecology Research Developements; Liu, T.-X., Ed.; Nova Science Publishers, Inc.: New York, NY, USA, 2008. [Google Scholar]
- Quer, E.; Pereira, S.; Michel, T.; Santonja, M.; Gauquelin, T.; Simioni, G.; Ourcival, J.M.; Joffre, R.; Limousin, J.M.; Aupic-Samain, A.; et al. Amplified Drought Alters Leaf Litter Metabolome, Slows Down Litter Decomposition, and Modifies Home Field (Dis)Advantage in Three Mediterranean Forests. Plants 2022, 11, 2582. [Google Scholar] [CrossRef]
- Marañon, A. Diversidad floristica y heterogenidad ambiental en una dehesa de Sierra Morena. An. Edafol. Agrobiol. 1985, 44, 1183–1197. [Google Scholar]
- Ibañez, M.; Altimir, N.; Ribas, À.; Eugster, W.; Sebastià, M.-T. Phenology and plant functional type dominance drive CO2 exchange in seminatural grasslands in the Pyrenees. J. Agric. Sci. 2020, 1–12. [Google Scholar] [CrossRef]
- Lavorel, S.; Díaz, S.; Cornelissen, J.H.C.; Garnier, E.; Harrison, S.P.; Mcintyre, S.; Pausas, J.G.; Catherine, N.P.; Carlos, R. Plant Functional Types: Are We Getting Any Closer to the Holy Grail? In Terrestrial Ecosystems in a Changing World. Global Change—The IGBP Series; Canadel, J.G., Pataki, D.E., Pitelka, L.F., Eds.; Springer: Berlin/Heidelberg, Germany, 2007; pp. 149–164. [Google Scholar]
- Sebastià, M.T. Plant guilds drive biomass response to global warming and water availability in subalpine grassland. J. Appl. Ecol. 2007, 44, 158–167. [Google Scholar] [CrossRef]
- Symstad, A.J. A Test of the Effects of Functional Group Richness and Composition on Grassland Invasibility. Ecology 2000, 81, 99–109. [Google Scholar] [CrossRef]
- Peel, M.C.; Finlayson, B.L.; McMahon, T.A. Updated world map of the Köppen-Geiger climate classification. Hydrol. Earth Syst. Sci. 2007, 11, 1633–1644. [Google Scholar] [CrossRef]
- Coplen, T.B. Guidelines and recommended terms for expression of stable-isotope-ratio and gas-ratio measurement results. Rapid Commun. Mass Spectrom. 2011, 25, 2538–2560. [Google Scholar] [CrossRef] [PubMed]
- Brooks, P.D.; Geilmann, H.; Werner, R.A.; Brand, W.A. Improved precision of coupled δ13C and δ15N measurements from single samples using an elemental analyzer/isotope ratio mass spectrometer combination with a post-column six-port valve and selective CO2 trapping; improved ha. Rapid Commun. Mass Spectrom. 2003, 17, 1924–1926. [Google Scholar] [CrossRef]
- Werner, R.A.; Bruch, B.A.; Brand, W.A. ConFlo III—An—Interface for High Precision d13C and d15N Analysis with an Extended Dynamic Range. Rapid Commun. Mass Spectrom. 1999, 13, 1237–1241. [Google Scholar] [CrossRef]
- Venables, W.N.; Ripley, B.D. Modern Applied Statistics with S, 4th ed.; Springer: New York, NY, USA, 2002; ISBN 978-0-387-21706-2. [Google Scholar]
- R Core Team. R: A Language and Environment for Statistical Computing; R Foundation for Statistical Computing (Version 4.4.1); R Foundation for Statistical Computing: Vienna, Austria, 2024; Available online: https://www.r-project.org/ (accessed on 14 June 2024).
- Carranca, C.; Castro, I.V.; Figueiredo, N.; Redondo, R.; Rodrigues, A.R.F.; Saraiva, I.; Maricato, R.; Madeira, M.A.V. Influence of tree canopy on N2 fixation by pasture legumes and soil rhizobial abundance in Mediterranean oak woodlands. Sci. Total Environ. 2015, 506–507, 86–94. [Google Scholar] [CrossRef]
- Gea-Izquierdo, G.; Montero, G.; Cañellas, I. Changes in limiting resources determine spatio-temporal variability in tree-grass interactions. Agrofor. Syst. 2009, 76, 375–387. [Google Scholar] [CrossRef]
- Lopez-Carrasco, C.; Lopez-Sanchez, A.; San Miguel, A.; Roig, S. The effect of tree cover on the biomass and diversity of the herbaceous layer in a Mediterranean dehesa. Grass Forage Sci. 2015, 70, 639–650. [Google Scholar] [CrossRef]
- Aljazairi, S.; Ribas, A.; Llurba, R.; Ferrio, J.P.; Voltas, J.; Nogués, S.; Sebastiá, M.T. Sown Diversity Effects on the C and N Cycle and Interactions with Fertilization. Agronomy 2025, 15, 287. [Google Scholar] [CrossRef]
- Pirhofer-Walzl, K.; Rasmussen, J.; Høgh-Jensen, H.; Eriksen, J.; Søegaard, K.; Rasmussen, J. Nitrogen transfer from forage legumes to nine neighbouring plants in a multi-species grassland. Plant Soil 2012, 350, 71–84. [Google Scholar] [CrossRef]
- Schenk, H.J.; Jackson, R.B. Rooting depths, lateral root spreads and below-ground/allometries of plants in water-limited ecosystems. J. Ecol. 2002, 90, 480–494. [Google Scholar] [CrossRef]
- Weaver, J.E. Classification of Root Systems of Forbs of Grassland and a Consideration of Their Significance. Ecology 1958, 39, 393–401. [Google Scholar] [CrossRef]
- Song, L.; Bao, X.; Liu, X.; Zhang, Y.; Christie, P.; Fangmeier, A.; Zhang, F. Nitrogen enrichment enhances the dominance of grasses over forbs in a temperate steppe ecosystem. Biogeosciences 2011, 8, 2341–2350. [Google Scholar] [CrossRef]
- Vázquez, E.; Schleuss, P.M.; Borer, E.T.; Bugalho, M.N.; Caldeira, M.C.; Eisenhauer, N.; Eskelinen, A.; Fay, P.A.; Haider, S.; Jentsch, A.; et al. Nitrogen but not phosphorus addition affects symbiotic N2 fixation by legumes in natural and semi-natural grasslands located on four continents. Plant Soil 2022, 478, 689–707. [Google Scholar] [CrossRef]
- Ledo, A.; Paul, K.I.; Burslem, D.F.R.P.; Ewel, J.J.; Barton, C.; Battaglia, M.; Brooksbank, K.; Carter, J.; Eid, T.H.; England, J.R.; et al. Tree size and climatic water deficit control root to shoot ratio in individual trees globally. New Phytol. 2018, 217, 8–11. [Google Scholar] [CrossRef]
- Sheffer, E.; Canham, C.D.; Kigel, J.; Perevolotsky, A. Countervailing effects on pine and oak leaf litter decomposition in human-altered Mediterranean ecosystems. Oecologia 2015, 177, 1039–1051. [Google Scholar] [CrossRef]
- Valera-Burgos, J.; Díaz-Barradas, M.C.; Zunzunegui, M. Effects of Pinus pinea litter on seed germination and seedling performance of three Mediterranean shrub species. Plant Growth Regul. 2012, 66, 285–292. [Google Scholar] [CrossRef]
- Rai, A.K.; Bhardwaj, R.; Sureja, A.K. Effect of Mixing Pine Needles Litters on Soil Biological Properties and Phosphorus Availability in Soil Amended with Fertilizers and Manures. Commun. Soil Sci. Plant Anal. 2017, 48, 1052–1058. [Google Scholar] [CrossRef]
- Ibañez, M. Vegetation Drives Greenhouse Gas Exchange, and Carbon and Nitrogen Cycling in Grassland Ecosystems. Ph.D. Thesis, Department of Horticulture, Botany and Gardening (HBJ), Universitat de Lleida, Lleida, Spain, 2019; p. 226. [Google Scholar]
- van Diest, A. Plant and soil interface and intreactions. In Proceedings of the International Symposium: Plant and Soil: Interfaces and Interactions, Wageningen, The Netherlands, 6–8 August 1986, 1st ed.; van Diest, A., Houwers, A., Eds.; Springer: Dordrecht, The Netherlands, 1987; ISBN 978-90-247-3535-8. [Google Scholar]
- Ågren, G.I.; Ingestad, T. Root: Shoot ratio as a balance between nitrogen productivity and photosynthesis. Plant Cell Environ. 1987, 10, 579–586. [Google Scholar] [CrossRef]
- Gargallo-Garriga, A.; Sardans, J.; Pérez-Trujillo, M.; Rivas-Ubach, A.; Oravec, M.; Vecerova, K.; Urban, O.; Jentsch, A.; Kreyling, J.; Beierkuhnlein, C.; et al. Opposite metabolic responses of shoots and roots to drought. Sci. Rep. 2014, 4, 6829. [Google Scholar] [CrossRef]
- García-Barrios, L.; González-Espinosa, M. Change in oak to pine dominance in secondary forests may reduce shifting agriculture yields: Experimental evidence from Chiapas, Mexico. Agric. Ecosyst. Environ. 2004, 102, 389–401. [Google Scholar] [CrossRef]
- Ma, S.; Eichelmann, E.; Wolf, S.; Rey-Sanchez, C.; Baldocchi, D.D. Transpiration and evaporation in a Californian oak-grass savanna: Field measurements and partitioning model results. Agric. For. Meteorol. 2020, 295, 108204. [Google Scholar] [CrossRef]
- Ding, J.; Eldridge, D.J. The fertile island effect varies with aridity and plant patch type across an extensive continental gradient. Plant Soil 2021, 459, 173–183. [Google Scholar] [CrossRef]
- Camara, A. Do woody plants create ‘fertile islands’ in dryland New Zealand? N. Z. J. Ecol. 2021, 45, 3419. [Google Scholar] [CrossRef]
- Moustakas, A.; Kunin, W.E.; Cameron, T.C.; Sankaran, M. Facilitation or Competition? Tree Effects on Grass Biomass across a Precipitation Gradient. PLoS ONE 2013, 8, e57025. [Google Scholar] [CrossRef]
Disclaimer/Publisher’s Note: The statements, opinions and data contained in all publications are solely those of the individual author(s) and contributor(s) and not of MDPI and/or the editor(s). MDPI and/or the editor(s) disclaim responsibility for any injury to people or property resulting from any ideas, methods, instructions or products referred to in the content. |
© 2025 by the authors. Licensee MDPI, Basel, Switzerland. This article is an open access article distributed under the terms and conditions of the Creative Commons Attribution (CC BY) license (https://creativecommons.org/licenses/by/4.0/).