Abstract
Policy guidance plays a critical role in urban expansion and development patterns, and the scientific prediction of land use change trends and the assessment of the ecological benefits of future urban development are essential for effective policy-making. Different urban development policies not only shape the evolution of urban spatial patterns but also have a profound impact on the urban heat island effect (UHI) and cooling benefits. This study explores the impact of land use changes in Tianfu New District on the UHI and conducts multi-scenario simulations combined with different policy contexts. Focusing on Tianfu New District, four scenarios were selected: the Natural Development Scenario (ND), Economic Development Scenario (ED), Sustainable Development Scenario (SD), and Cropland Protection Scenario (CLP). To assess the impact of land use changes on the heat island effect, the study also used the InVEST urban cooling model (UCM) to evaluate the heat island mitigation effects under different scenarios. The results show that (1) the land use changes in Tianfu New District primarily went through three major stages: the natural ecological stage dominated by bare land, the rapid urbanization expansion stage, and the ecological restoration stage. (2) Under different scenarios, the land use changes differed significantly in their ability to mitigate the heat island effect. Both the Economic Development Scenario (ED) and Natural Development Scenario (ND) showed a weakening of cooling effects compared to the 2024 baseline, while the Sustainable Development Scenario (SD) and Cropland Protection Scenario (CLP) enhanced the region’s cooling capacity to some extent. Rational land use planning can promote economic development, and it can also play an important role in addressing climate change and mitigating the heat island effect. Future urbanization processes should pay more attention to integrating ecological protection and cooling strategies to ensure the achievement of sustainable development goals. This study provides scientific evidence for land use planning and policy-making in Tianfu New District and similar regions.
1. Introduction
In the 21st century, cities face the dual challenges of rapid urbanization and climate change [1]. Currently, more than half of the global population resides in urban areas [2,3], and this proportion is projected to increase to 66% by 2050 [4]. As urbanization accelerates, extreme weather events induced by climate change have become major concerns, affecting urban environmental quality and residents’ well-being [5,6]. Most cities worldwide are experiencing a trend of rising temperatures, and this phenomenon is particularly evident in rapidly urbanizing countries such as China [7]. Urbanization is often accompanied by extensive land conversion and the expansion of built-up land. This expansion not only alters the natural ecological environment [8,9] but also has significant impacts on the urban microclimate [10]. In rapidly developing cities, balancing economic development with ecological protection, particularly in terms of effectively mitigating the urban heat island (UHI) effect, has become a crucial issue in urban planning and management [11,12]. The implementation of effective cooling measures during urbanization to alleviate the impact of climate change on urban environments has become a central issue in urban planning and management [13,14].
In addressing climate change and the UHI, the role of policies is crucial [15]. The Chinese government has developed a comprehensive policy framework to guide urban development [16,17]. Relevant case studies demonstrate that different policies have significantly affected land cover and ecosystem services [18]. Policy guidance initially influences the direction and pace of land use, which in turn directly impacts the urban ecological environment and quality of life [19]. For example, Europe will experience significant land use changes in the coming decades, driven by shifts in agricultural policies and other factors. These changes will affect land requirements for agricultural, forestry, residential, industrial, and recreational uses, impacting landscape diversity, natural areas, and ecosystem service (ES) supply [20,21,22,23]. Policies can have both positive and negative effects on urban areas. For instance, a series of policies in China has driven rapid urban development, leading to the loss of natural habitats and the weakening of ecosystem services [24]. Unplanned urbanization has led to events such as the 2003 European heat wave, which, combined with the additional higher temperatures associated with the UHI, caused significant impacts on Paris and other French cities [25,26]. In the United Kingdom, UHI intensities of over 7 °C in central London [27], up to 5 °C in Manchester [28], and nearly 5 °C in Birmingham [29] were recorded during summer periods. Timely macroeconomic regulation by policies can also bring about corresponding positive impacts. China’s national conservation policies have fostered the development of green infrastructure, enhanced the city’s cooling capacity [15], and mitigated the UHI through effective planning and land protection measures [30]. Oregon’s pioneering Urban Growth Boundaries (UGBs) policy effectively curbs urban sprawl, enhances land use efficiency, and protects natural resources outside the boundaries [31,32]. The NYC Green Infrastructure Plan has been heralded globally as an innovative example for cities to incorporate ecosystem services into urban decision-making [33]. Moreover, the Intergovernmental Panel on Climate Change (IPCC) suggests that land use change is closely related to future climate change as a significant factor in increasing greenhouse gases in the atmosphere [34,35]. It is crucial to understand the associated impacts resulting from future land use changes, as land use can be regulated through legislation [22]. In summary, effectively regulating land use through policy, while balancing economic development with ecological protection to mitigate the impacts of climate change, remains an urgent challenge [36].
To effectively address these challenges, cities must anticipate and mitigate various climate risks through strategic planning. Forecasting and simulation serve as essential tools for evaluating land use changes under different policy scenarios, aiding in climate change adaptation. For example, Maya et al. projected land conditions in New York for 2100 using scenario simulations and proposed forward-looking planning strategies to mitigate extreme heat events [37]. Liu et al. employed the CA–Markov model to simulate land use changes and their ecological impacts on Hainan Island, China [38]. These studies primarily utilize high-precision and widely applicable models, including CA–Markov [39], CLUE-S [40], and FLUS [16]. The patch-generating land use simulation model (PLUS), developed by Liang Xun et al., simulates the spatiotemporal dynamics of land use changes. By integrating the land expansion analysis strategy (LEAS) and the patch-generating model (CARS) modules [41], the model generates land use patterns under diverse scenarios [42,43]. Empirical studies have found that PLUS achieves higher simulation accuracy and landscape pattern similarity to reality than earlier models [44]. By leveraging a data-driven LEAS framework powered by random forest, PLUS effectively captures complex transition dynamics, mitigating the risk of the uncontrolled exponential growth commonly observed in conventional CA models [45]. Additionally, its patch-based CARS mechanism, which utilizes random “seed” points and neighborhood expansion, enables the generation of realistic, contiguous land use patterns. This approach addresses the limitations of CLUE-S, which relies on top-down demand and suitability rules without explicitly simulating patch formation. Furthermore, PLUS refines the FLUS model’s patch-based CA approach by improving spatial coherence and dynamically modeling land expansion, ultimately delivering more accurate and naturalistic simulations. Utilizing this model enables the evaluation of policy impacts across different scenarios, offering data-driven insights for urban planning and mitigating potential adverse effects of existing policies [46].
There are three primary approaches to quantifying or modeling the UHI: field measurements, remote sensing inversion and analysis, and model simulations [47,48]. Field measurements offer high spatial accuracy in localized areas but are challenging to scale due to labor-intensive processes and environmental constraints [49]. Remote sensing inversion methods, which utilize satellite imagery to acquire large-scale surface temperature data, are extensively applied in medium-scale urban heat studies [50], particularly in analyzing the relationship between urban blue–green spaces and the UHI, with GIS platforms facilitating this approach [51]. Model simulations, including computational fluid dynamics (CFD) models and microclimate simulations (e.g., ENVI-met), incorporate multiple variables to analyze heat mitigation effects [52]. These models can accurately simulate the UHI and analyze the role of different variables in urban cooling. This study employs the InVEST urban cooling model (UCM) to assess urban cooling effects under various land use scenarios. As a GIS-based tool, the UCM offers high adaptability and practical applicability [53]. It calculates key biophysical factors, such as evapotranspiration, shading effects, and the albedo of land types, and generates the cooling capacity index (CC) and heat mitigation index (HMI) [54,55], which makes the model particularly effective in evaluating cooling effects across various land use patterns. Zhao et al. applied UCM to simulate green space optimization in high-density built-up areas in Xi’an [56]. Chung et al. employed UCM to analyze the heat mitigation capacity of coastal cities, assessing the model’s suitability for coastal regions [57]. Zawadzka et al. employed UCM to analyze the heat mitigation capacity of coastal cities, assessing the model’s suitability for coastal regions [58].
As a key strategic region in western China, Tianfu New District exemplifies the role of policy in regulating land use throughout its development [59]. In recent years, under the guidance of national-level new area policies, Tianfu New District has swiftly transformed from a predominantly agricultural and ecological region to a modern urban district. While fostering rapid urbanization, it has also encountered pressures from climate change, particularly the intensification of the UHI. In response to climate change and the UHI, Tianfu New District has actively adopted the “Park City” concept, integrating ecological priority into policy measures and enhancing ecological infrastructure in urban planning. Tianfu New District has substantially improved its urban microclimate, resulting in notable cooling effects. The protection of cropland has played a pivotal role in this process. In 2022, Chengdu issued the “Implementation Plan for Establishing a Higher-Level ‘Tianfu Granary’ in the Chengdu Area” [60]. This policy not only guarantees the food supply for Tianfu New District but also alleviates the pressure on cropland from urban expansion while preserving its ecological function. However, as urbanization continues, Tianfu New District still faces the challenge of balancing economic development with ecological protection, given limited land resources. The implementation of effective land use planning under policy guidance to achieve urban cooling and climate adaptation has become the central issue of this study.
The primary objective of this study is to integrate the PLUS model and the InVEST UCM to simulate land use changes in Tianfu New District under various policy scenarios and to assess their impact on the UHI. Specifically, this study aims to explore how to achieve multiple objectives—economic development, ecological protection, and social equity—within the context of climate change and environmental justice. The specific research objectives are as follows: (1) To evaluate land use changes under various policy scenarios and their effects on the UHI in the city. (2) To analyze the impact of each policy scenario on regional cooling benefits and quantify the mitigation effects of the heat island under different land use patterns. (3) To provide scientific evidence for policymakers, specifically regarding how to achieve the dual goals of ecological protection and urban cooling through effective land use planning during the urbanization process.
2. Materials and Methods
2.1. Study Area: Tianfu New District
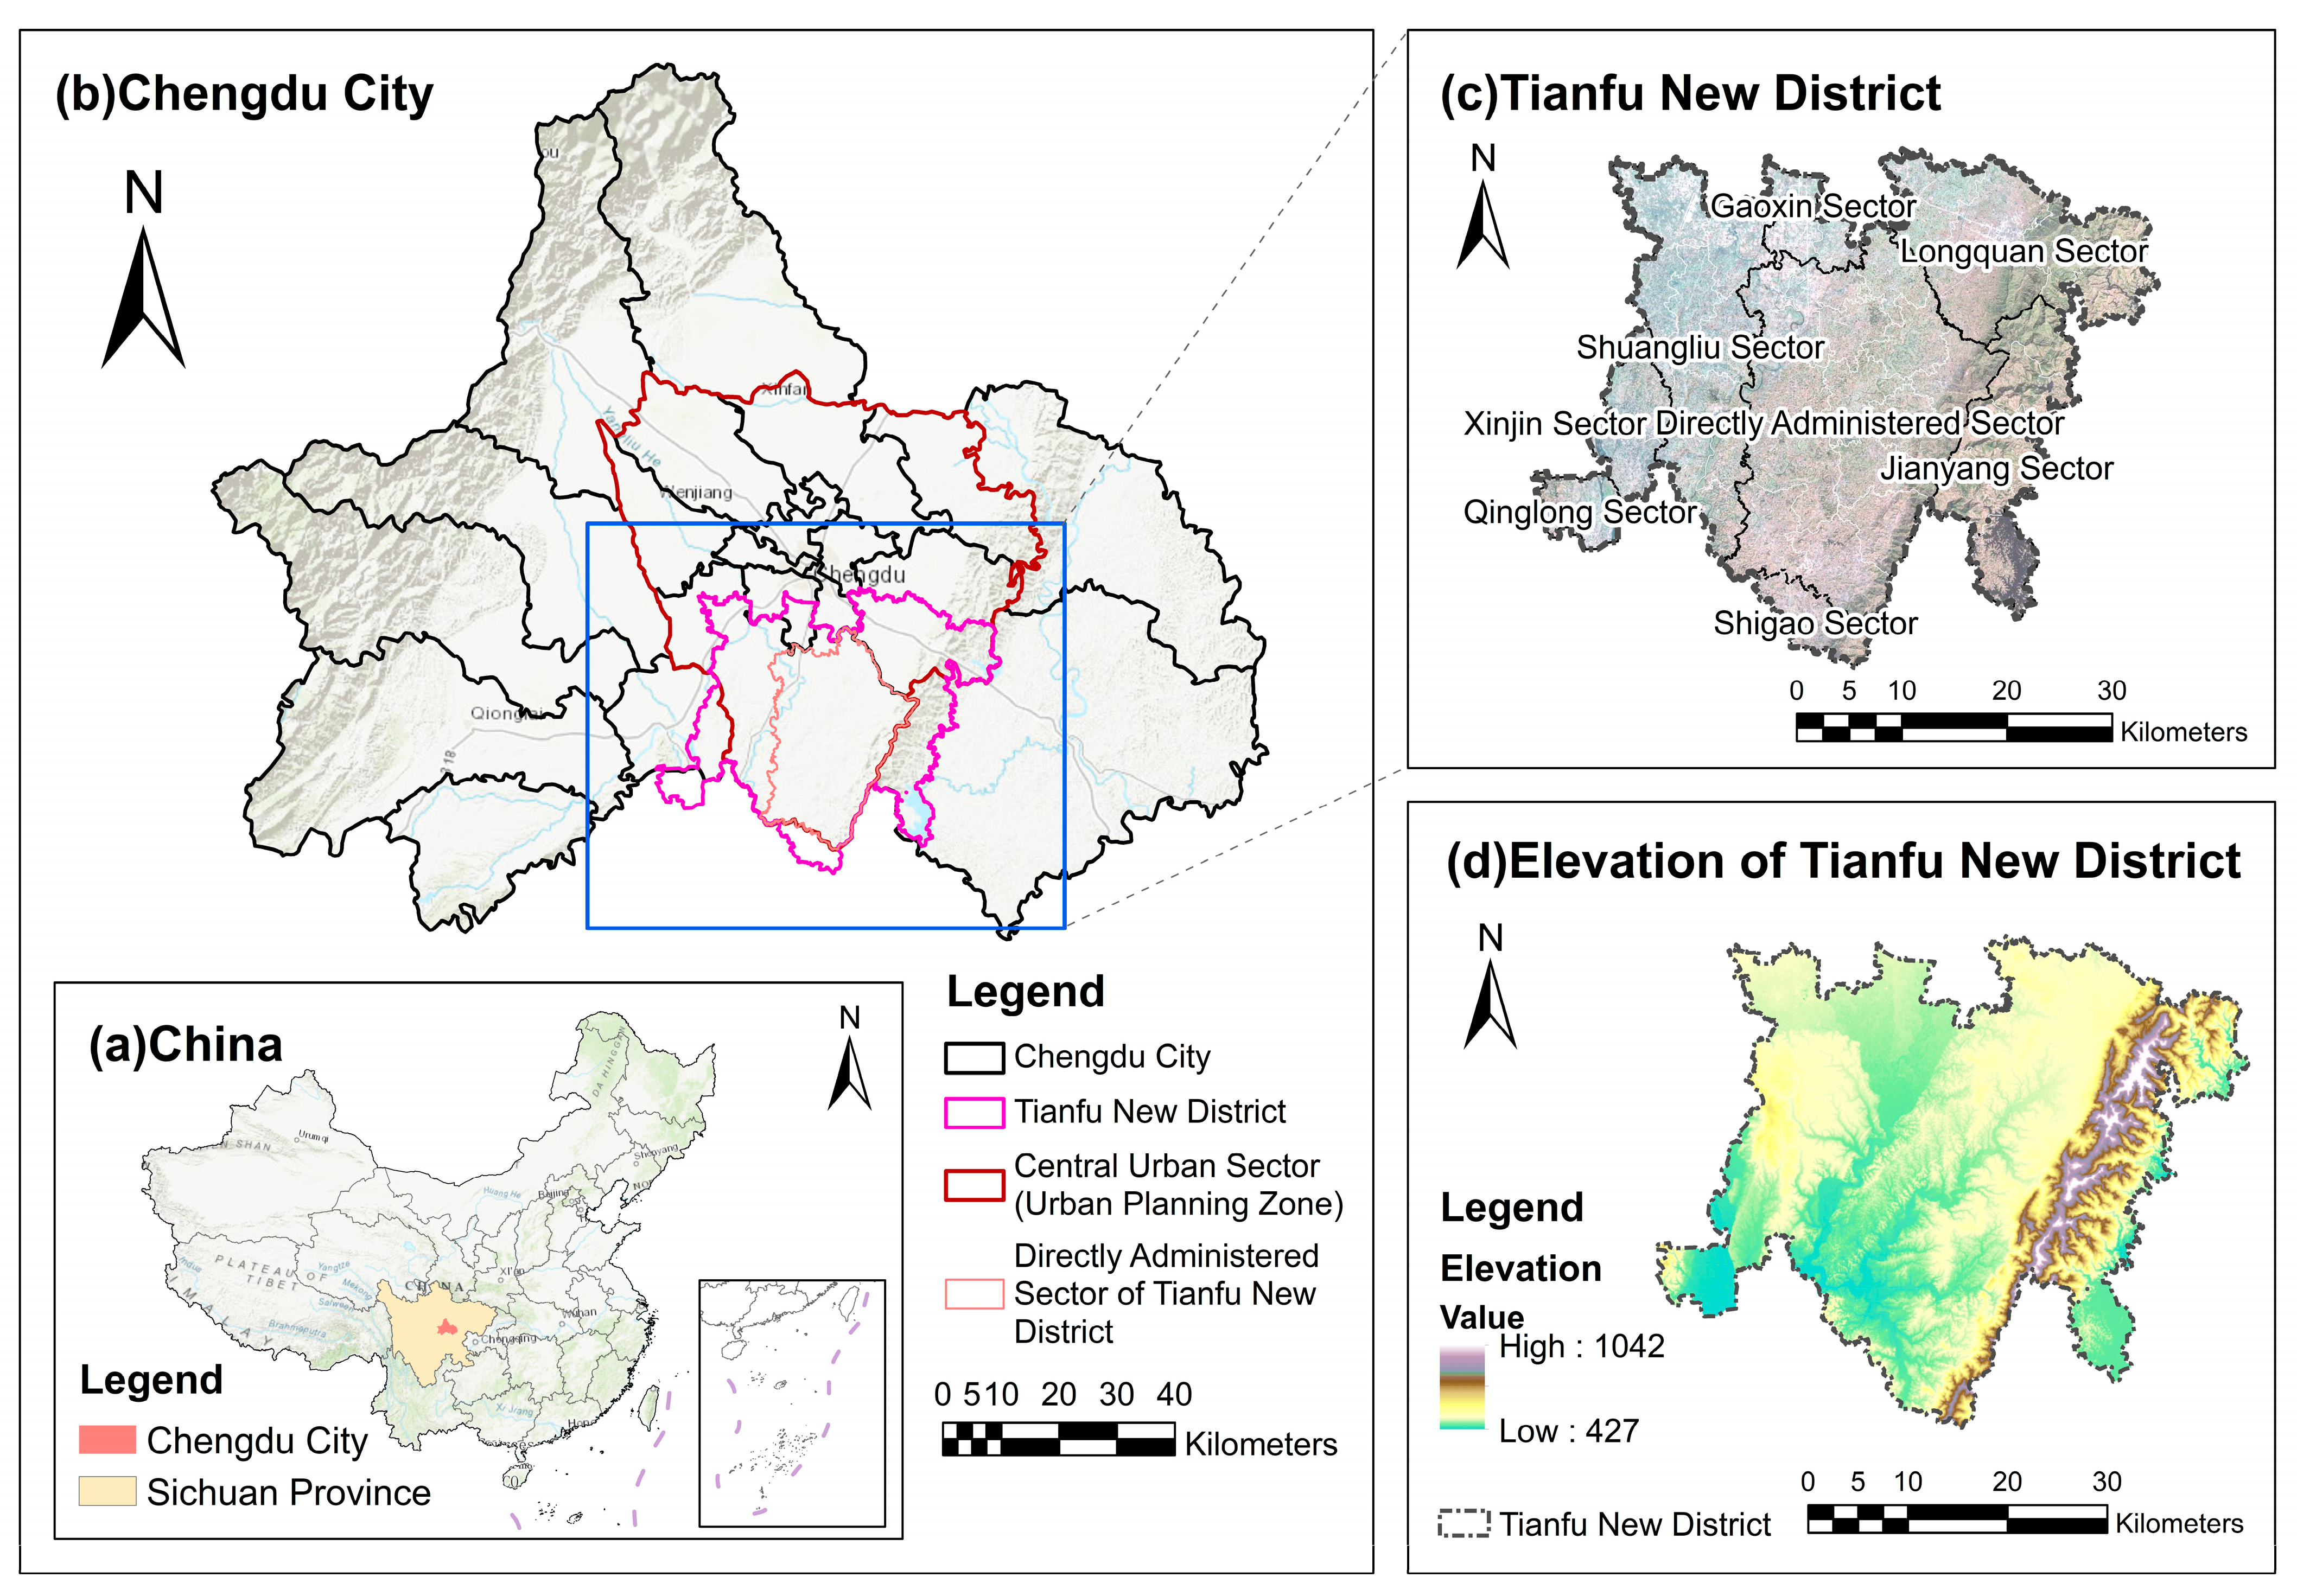
Tianfu New District, located in Chengdu, Sichuan Province, southwestern China (Figure 1a), serves as a model for policy-driven urban development. It is located between 103°47′59″ E to 104°15′34″ E and 30°13′38″ N to 30°40′23″ N. Officially approved in 2014 as China’s 11th national-level new district, Tianfu New District quickly became a key node in national strategies, including the Belt and Road Initiative and the Yangtze River Economic Belt. In just a few years, Tianfu New District has transformed from an area primarily focused on agriculture and ecology into a modern urban center marked by rapid industrialization, urbanization, and ecological innovation. The district spans a planned area of 1578 km2 [61], of which 564 km2 are directly administered by Chengdu (Figure 1b). The entire new district is expected to reach a population of 5 million by 2035.
Tianfu New District lies in the southern part of the Chengdu Plain, at the heart of Sichuan Province, and is often referred to as the “Land of Abundance”. The region boasts exceptional natural conditions and a highly livable environment [62]. The district is characterized by flat terrain, dominated by plains and hills [63]. The Jinjiang River flows through the district from north to south, stretching 49 km and forming a dense network of waterways that provide vital ecological support (Figure 1c,d). Tianfu New District is classified under the subtropical humid monsoon climate zone, featuring four distinct seasons. The district has an average annual temperature of 16.4 °C and receives annual precipitation of up to 1300 mm [64], with especially abundant rainfall during the summer and autumn months. The mild and humid climate renders the region highly suitable for human habitation and development. In 2019, Tianfu New District was designated as the first pilot area for China’s “Park City” initiative, pioneering a sustainable development model that balances rapid economic growth with ecological conservation [59]. The district’s master plan integrates natural features—such as mountains, rivers, farmland, forests, and lakes—into urban spaces, forming a “blue-green intertwined” ecological network. Key projects include Xinglong Lake, Tianfu Park, and the Tianfu New District section of Longquan Urban Forest Park. These projects not only drive ecological restoration but also facilitate a deeper integration of urban functions with the natural environment. Since 2017, forest cover in Tianfu New District has increased by 233 hectares. By 2035, the district aims to reach a 35% forest coverage rate, setting a benchmark for sustainable urban development.

Figure 1.
Location of the study area. (a) China; (b) Chengdu City; (c) Tianfu New District; (d) elevation of Tianfu New District.
Figure 1.
Location of the study area. (a) China; (b) Chengdu City; (c) Tianfu New District; (d) elevation of Tianfu New District.
2.2. Data and Methods
2.2.1. A General Overview of the Study
The framework of this study (Figure 2) includes several key steps used to assess the impact of land use changes on the heat island effect in Tianfu New District under different policy scenarios. First, Landsat satellite remote sensing data from 2000, 2009, 2014, 2019, and 2024 were collected and preprocessed. Using a supervised classification method combined with the support vector machine (SVM) algorithm, the remote sensing images were classified into land use types. The land was divided into six categories: bare land, built-up land, cropland, forest land, grassland, and water bodies. Subsequently, the PLUS model was used to simulate land use changes. Four different policy scenarios were chosen for the simulation: the Natural Development Scenario (ND), Economic Development Scenario (ED), Sustainable Development Scenario (SD), and Cropland Protection Scenario (CLP). Finally, the InVEST UCM model was used to assess the heat island mitigation effects under the four different scenarios. Based on the simulation results, the relationship between land use changes and the heat island effect was analyzed under each scenario. By calculating the HMI values for each scenario, the cooling effects of each scenario were compared. Through these steps, the article presents a detailed analysis of the impact of land use changes on the heat island effect, emphasizes the importance of policy guidance, and provides scientific evidence for urban cooling strategies based on the simulation results.
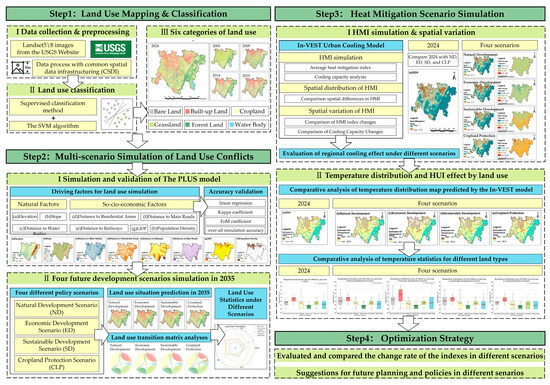
Figure 2.
Framework of the research.
2.2.2. Land Use Mapping and Classification
This study uses remote sensing data as the basis to classify and analyze land use changes in Tianfu New District during the years 2000, 2009, 2014, 2019, and 2024. The remote sensing imagery was obtained from the United States Geological Survey (USGS) Landsat series satellites (https://earthexplorer.usgs.gov/, accessed on 11 September 2024). The images were selected between April and August of each year, with cloud cover of less than 10% (Table 1). The data were preprocessed using ENVI software (version 5.3; Harris Geospatial Solutions, Boulder, CO, USA), including radiometric calibration and atmospheric correction. Land use classification was performed using a supervised classification method with a support vector machine (SVM) algorithm.

Table 1.
Statistical information of remote sensing image data from the USGS Landsat satellite in the United States.
The classification results (Table 2) divide land use into six categories: bare land, built-up land, cropland, forest land, grassland, and water bodies. During the classification process, the spectral characteristics of the land features combined with the spatial characteristics of the remote sensing imagery were utilized to accurately extract the land use types in the study area.
Table 2.
Land use categories.
2.2.3. Multi-Scenario Simulation of Land Use Conflicts
This study uses the land use mapping of Tianfu New District for the years 2000, 2009, 2014, and 2019 as the basis to simulate the land use status in 2024. The simulation results are compared with the actual land use data of 2024 to validate the accuracy of the PLUS model. The driving factors used for land use simulation are divided into natural and socio-economic factors (Table 3). Natural factors include elevation, slope, and distance to water bodies (Figure 3a–c). Socio-economic factors include distance to residential areas, distance to railways, distance to main roads, GDP, and population density (Figure 3d–g). The selection of research indicators is based on existing studies, aiming to provide clear data support for planning and policy-making [65]. We have considered multiple dimensions to effectively identify potential conflict areas and accurately quantify land competition under different scenarios [66]. The expansion coefficient is set to 0.3, and the percentage of seeds is set to 0.1, aligning with previous applications of the PLUS model [67]. A moderate expansion coefficient of 0.3 facilitates the emergence of new development patches in accordance with observed trends, ensuring a realistic landscape pattern while preventing excessive fragmentation. Meanwhile, the seed percentage (ranging from 0 to 1) determines the maximum proportion of new growth initiated as independent “seed” patches. A lower seed percentage promotes more compact growth, where fewer initial patches expand over time, whereas a higher percentage results in more scattered and fragmented development. By setting this parameter to 0.1 (10%), we allow up to 10% of land conversions to originate as independent patches, striking a balance between spatial continuity and organic urban expansion. During the accuracy validation phase, the demand for each land use type in 2024 is predicted using linear regression. The comparison between the simulated land use in 2024 and the actual land use in 2024 shows that the accuracy validation results yield a kappa coefficient of 0.967, a FoM coefficient of 0.963, and an overall simulation accuracy of 0.976. A kappa of 0.967 indicates an almost perfect agreement between simulated and observed land use patterns. The FoM of 0.963 (96.3%) is especially noteworthy, as FoM measures the overlap of predicted change with actual change—this high value means the model accurately captured the locations of land use transitions with minimal error. An overall accuracy of 97.6% further confirms the reliability of the simulation in reproducing the land allocation of all categories. These metrics demonstrate that the PLUS model performed extremely well in our study area’s calibration, lending confidence to its scenario forecasts.
Table 3.
Data resources of the natural and socio-economic factors.

Figure 3.
The natural and socio-economic factors in Tianfu New District: (a) elevation; (b) slope; (c) distance to water bodies; (d) distance to residential areas; (e) distance to railways; (f) distance to main roads; (g) GDP; (h) population density.
This study is based on the regional characteristics and development context of Tianfu New District, as well as land use data from 2000, 2009, 2014, 2019, and 2024, to establish four future development scenarios and simulate land use conditions in Tianfu New District in 2035.
- (1)
- Natural Development Scenario (ND): This scenario is based on land use changes from 2000 to 2024, considering both natural and socio-economic factors. This scenario does not consider constraints such as policies, regulations, land use planning, or urban development plans. The future land demand for 2035 is projected using linear regression and used as the land demand parameter in the PLUS model. This scenario assumes that the spatial pattern of land use in Tianfu New District will evolve linearly based on its historical trajectory, representing a theoretical development model. This scenario serves as the foundation for the other scenarios.
- (2)
- Economic Development Scenario (ED): In 2014, Tianfu New District was designated as a national-level district. As a key node in the “Belt and Road” initiative and economic development, urbanization and industrialization have progressed rapidly. With a solid industrial base, key development zones, such as Tianfu Headquarters Business District, Chengdu Science City, and Tianfu Digital Cultural City, have attracted numerous enterprises. Prioritizing economic development amid rapid urbanization and industrialization necessitates extensive built-up land to support large-scale spatial development and industrial construction. In this scenario, based on the ND, the likelihood of built-up land transitioning to cropland, water bodies, forest land, grassland, and bare land decreases by 40%, while the probability of cropland, forest land, grassland, water bodies, and bare land transitioning to built-up land increases by 40%, 10%, 20%, 10%, and 50%, respectively.
- (3)
- Sustainable Development Scenario (SD): In 2019, Tianfu New District’s ecological network became a key component of Chengdu’s ecological network. According to the “Chengdu Master Plan (2016–2035)”, ecological corridors and biodiversity protection networks based on the Longquan Mountain Ecological Zone must be established, and ecological conservation and restoration efforts in the Ring Ecological Zone and Xinglong Lake areas must be strengthened. This scenario builds upon the ND by incorporating nature reserves from the regional ecological security map as restricted conversion zones. The probability of forest land and grassland converting to built-up land decreases by 20%, and the probability of water bodies converting to built-up land decreases by 40%, while the probability of water bodies transitioning to cropland increases by 30%. Additionally, the probability of cropland converting to built-up land decreases by 30%, and the probability of bare land transitioning to built-up land increases by 40%. The likelihood of built-up land transitioning to grassland increases by 10%, simulating a land use pattern that balances ecological protection and economic development.
- (4)
- Cropland Protection Scenario (CLP): Tianfu New District is one of Chengdu’s primary grain production bases, and protecting cropland in this area is essential for ensuring food security. According to the “Implementation Plan for Establishing a Higher-Level Tianfu Granary in the Chengdu Area” issued in August 2022, the plan aims to establish high-standard cropland. In this scenario, the focus is on stabilizing and protecting high-quality cropland in Tianfu New District. The cropland data from 2014, 2019, and 2024 were overlaid, and the areas consistently classified as cropland in all three years were designated as long-term stable cropland. Additionally, cropland with a slope of less than 6° was designated as high-quality cropland, and the stable and high-quality cropland areas were combined as restricted conversion zones [65]. Based on the SD, the linear regression transition probability matrix was adjusted. The probability of cropland converting to built-up land decreases by 70% [68,69], and the probability of cropland transitioning to grassland and water bodies decreases by 40%. Meanwhile, the probability of bare land transitioning to cropland increases by 50%, strictly enforcing cropland protection policies.
In the multi-scenario simulation phase, the parameters of the PLUS model’s CARS module, including the patch generation threshold, expansion coefficient, percentage of seed, and neighborhood weights, remain consistent with those in the accuracy validation phase. Only land demand and the land use transition matrix are adjusted to achieve simulations for different scenarios.
2.2.4. Quantification of Cooling Capacity
The UCM in the InVEST framework performs well in measuring cooling capacity and can be used to estimate and analyze the spatial distribution and the changes in the heat mitigation index (HMI) in Tianfu New District in 2024 under different scenarios [38]. The model calculates cooling capacity (CC) at the raster scale based on multiple factors, including shade, evapotranspiration, and albedo, and generates HMI based on CC.
The evapotranspiration index (ETI) is calculated using reference evapotranspiration and the crop coefficient. The reference evapotranspiration data, measured in millimeters (mm), is derived from the average evapotranspiration data of Tianfu New District in 2020 (https://esa-worldcover.org/, accessed on 19 December 2024). The crop coefficient (), ranging between 0 and 1, is calculated based on the spreadsheet provided in the official InVEST manual and adjusted for the study area (Table 4). The formula for calculating ETI is as follows:
where refers to the evapotranspiration index; is the reference evapotranspiration; is the crop coefficient; and is the maximum value of evapotranspiration in the study area. Cooling capacity (CC) represents the local cooling potential. The calculation of CC differs between daytime and nighttime. During the day, CC is derived from the weighted sum of evapotranspiration, shade, and albedo. The weights assigned to shade, albedo, and evapotranspiration (0.6, 0.2, and 0.2, respectively) are based on empirical data, as recommended by the model. The albedo values are estimated according to reference values provided by Taha et al. [52]. Shade represents the shading ability provided by trees and is calculated as the ratio of the area covered by trees taller than 2 m to the total area of the corresponding land use type (Table 4). The CC index is calculated as follows:
where is the cooling capacity index ranging from 0 to 1; represents the proportion of tree canopy shadow (trees ≥ 2 m tall), ranging from 0 to 1; refers to the proportion of solar radiation reflected by the land use type, also ranging from 0 to 1, with 1 representing the maximum solar radiation reflectivity.
The heat mitigation index (HMI) is determined based on the cooling capacity of a community or its surrounding environment. If a pixel is not influenced by large green areas, the HMI equals the CC index. However, if a pixel is surrounded by parks or green spaces equal to or greater than 2 hectares, these areas provide additional cooling effects. In such cases, the HMI is calculated as a distance-weighted average of the cooling capacity of the green spaces and the surrounding pixels. The HMI is the primary output of the InVEST UCM, with values ranging from 0 to 1. An HMI of 0 indicates no heat mitigation in the pixel, while an HMI of 1 signifies complete mitigation of the UHI. Green space values (Table 4) are designated as either 0 or 1, where 0 indicates that the land use type does not qualify as green space, and 1 indicates that the type is eligible as green space (area > 2 hectares) and contributes to additional cooling. In this study, both green and blue spaces are assigned a value of 1 to account for the cooling effects of evaporation from blue spaces. Specifically, the HMI is calculated as follows:
Table 4.
Key parameters assigned to each land use class within the study area submitted to the InVEST UCM as the biophysical table.
Table 4.
Key parameters assigned to each land use class within the study area submitted to the InVEST UCM as the biophysical table.
| Land Use Type | Shade | Kc | Albedo | Green Space |
|---|---|---|---|---|
| Bare Land | 0 | 0.7 | 0.25 | 0 |
| Built-up Land | 0.18 | 0.1 | 0.2 | 0 |
| Cropland | 1 | 0.75 | 0.18 | 1 |
| Forest Land | 1 | 1 | 0.2 | 1 |
| Grassland | 1 | 0.95 | 0.16 | 1 |
3. Results
3.1. Land Use Change Analysis (2000–2024)
The land use changes in Tianfu New District from 2000 to 2024 reflect its dynamic development trajectory at various time points as a rapidly developing region (Figure 4). It primarily underwent three significant phases: a green ecology-dominated phase in 2000, a mid-phase characterized by rapid urban land expansion from 2009 to 2019, and an ecological restoration phase driven by the “Park City” concept after 2019.
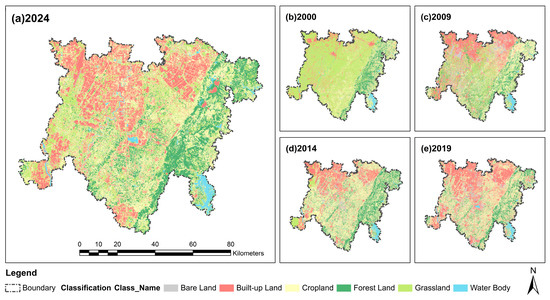
Figure 4.
Land use in Tianfu New District from 2000 to 2024.
From 2000 to 2009, land use in Tianfu New District was primarily dominated by natural ecosystems, with a high proportion of forest land and grassland. Particularly in the eastern and southern regions, large and continuous green spaces were well-preserved. During this period, cropland and forest land were the predominant land use types in the region. The urbanization level was low, and the proportion of built-up land was minimal, reflecting the traditional characteristics of an agriculture-based region.
From 2009 to 2019, with the advancement of national policies and the acceleration of urbanization, Tianfu New District gradually displayed a trend of built-up land expansion. This trend was particularly evident in the northwestern and northeastern regions near Chengdu’s urban core, where built-up land increased rapidly. During this period, forest land and grassland areas began to decrease, and some cropland was converted into built-up land, leading to the initial disruption of the ecological pattern. After 2014, with policy support as a national-level new district, industrial, commercial, and residential land expanded rapidly. Built-up land displayed a “center-periphery expansion” pattern, with high-density development near the city center, while ecological land such as grassland and cropland further decreased. However, certain areas, such as the Longquan Mountain region in the eastern mountainous area, retained ecological systems, forming localized ecological barriers.
From 2019 to 2024, the “Park City” concept was incorporated into urban planning during this phase. Tianfu New District transitioned to an eco-prioritized development model, showing early results in ecological protection and restoration. The expansion of built-up land slowed, and several ecological restoration projects, such as Xinglong Lake and Tianfu Park, were launched. Forest land area increased slightly, while the connectivity of grassland and green spaces was partially restored. The overall ecological pattern began to optimize towards a “blue-green interwoven” structure. By 2024, the proportion of green spaces increased, gradually forming a composite ecological system with blue and green spaces as the foundation and built-up land as the core.
The land use transition matrix from 2000 to 2024 (Figure 5) indicates that Tianfu New District has undergone significant land use changes over the past two decades.
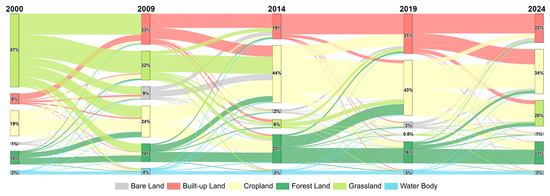
Figure 5.
Sankey diagram of land use type transition data in Tianfu New District from 2000 to 2024.
The built-up land has demonstrated a significant expansion trend overall. Between 2000 and 2014, the area of built-up land expanded rapidly, reaching 497.1 km2 by 2019, accounting for approximately 31% of the total area. This expansion was primarily driven by the large-scale conversion of cropland and grassland into built-up land. From 2000 to 2009, approximately 9% of the cropland and 28% of the grassland were converted into built-up land. However, between 2019 and 2024, the area of built-up land in Tianfu New District decreased, as some built-up land reverted to cropland and grassland.
From 2000 to 2024, cropland in Tianfu New District underwent significant dynamic changes. Between 2000 and 2014, the cropland area increased annually, with large areas of grassland and forest land converted into cropland due to urban expansion. After 2014, the cropland primarily underwent mutual conversions with built-up land. As one of the main land use types during urbanization, the cropland was subjected to dual competition from both built-up land and other ecological land.
The ecological land has generally exhibited a trend of initial decline, followed by recovery. Between 2000 and 2014, the forest land and grassland areas decreased rapidly, with this trend peaking in 2019, particularly as grassland was extensively converted into cropland and built-up land. Since 2014, the rate of grassland reduction has slowed. From 2019 to 2024, the total area of grassland increased by 313.4 km2, reversing years of consistent decline. During this period, approximately 6.12 km2 of built-up land was restored to forest land, and an additional 48.3 km2 was converted back to grassland. This trend indicated that, with the implementation of the “Park City” policy, ecological restoration projects have been gradually advancing in Tianfu New District.
From 2000 to 2024, water bodies and bare land occupied relatively small proportions of the area in Tianfu New District. The water body areas have demonstrated high stability in land use, with no large-scale loss or conversion. Some water body areas increased under the ecological optimization policies implemented after 2019. With urbanization and the expansion of built-up land, bare land was extensively developed, occupying a notable area in 2009. However, after 2009, bare land exhibited a general trend of reduction, and by 2024, it accounted for only a negligible proportion (less than 1% of the total area).
3.2. Land Use Patterns Under Multi-Scenario Simulation
This study designed four types of land use conversion scenarios to predict the land use situation in Tianfu New District by 2035 and conducted land use transition analyses (Figure 6 and Figure 7), including the Natural Development Scenario (ND), Economic Development Scenario (ED), Sustainable Development Scenario (SD), and Cropland Protection Scenario (CLP).
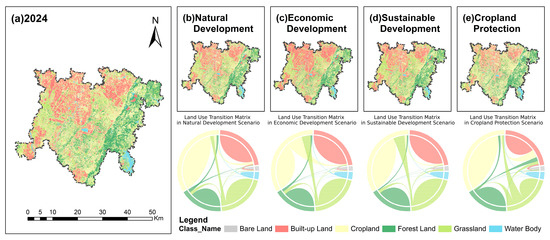
Figure 6.
(a) Land use type in 2024; (b) land use simulation and land use transition matrix Sankey diagram for the 2035 Natural Development Scenario; (c) land use simulation and land use transition matrix Sankey diagram for the 2035 Economic Development Scenario; (d) land use simulation and land use transition matrix Sankey diagram for the 2035 Sustainable Development Scenario; (e) land use simulation and land use transition matrix Sankey diagram for the 2035 Cropland Protection Scenario.
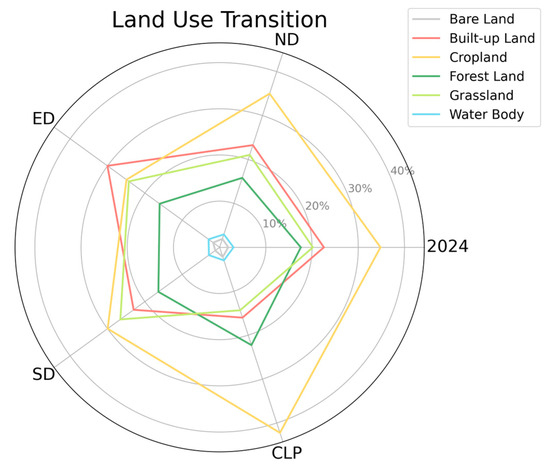
Figure 7.
Land use statistics under different scenarios (area ratio, %).
- 1.
- Natural Development Scenario (ND)
Under the Natural Development Scenario, cropland and grassland are significantly converted into built-up land, especially in areas near the urban core. In this scenario, ecological land slightly decreases, with grassland and cropland being transformed into built-up land, leading to reduced ecological connectivity and the gradual degradation of green spaces. Water bodies exhibit minimal change and maintain high stability. This scenario reflects the potential degradation of ecosystems and resource imbalances that could result from land use development without policy intervention.
- 2.
- Economic Development Scenario (ED)
In the Economic Development Scenario, the simulation results show that the proportion of built-up land increases significantly, becoming the dominant type of land use change. The expansion speed and scale of built-up land far exceed those in other scenarios. Policy goals drive rapid urbanization and industrialization, with large areas developed into industrial, commercial, and residential land. In this scenario, cropland, grassland, and forest, as ecological land types, further decrease. In particular, cropland near urban cores is largely occupied, leading to significant impacts on the ecological environment. The trend of ecological land converting to built-up land is most prominent, with grassland and forest experiencing substantial reductions. Cropland is also significantly compressed, and is largely converted into industrial, commercial, and residential land. Water bodies remain relatively stable, although a small portion are converted to built-up land.
- 3.
- Sustainable Development Scenario (SD)
Under the Sustainable Development Scenario, the expansion of built-up land is significantly restrained. Compared to the Natural Development and Economic Development Scenarios, the scale of new built-up land is substantially reduced. The area of ecological land increases significantly, with notable increases in the proportions of forest and grassland. The decreasing trend of grassland slows, and some built-up land is converted back to grassland. Cropland remains relatively stable, with only minor increases. Ecological connectivity improves, forming a development pattern characterized by intertwined blue and green spaces and a relatively stable ecological structure.
- 4.
- Cropland Protection Scenario (CLP)
In the Cropland Protection Scenario, the area of cropland is maximally protected, with minimal conversion to other land types. The likelihood of bare land being developed into cropland increases, further enhancing cropland stability. The scale of built-up land expansion is the smallest, as both ecological protection and cropland protection jointly constrain the expansion of built-up land. The conversion of ecological land (grassland and forest land) is relatively minimal, with forest land seeing an increase compared to 2024. This scenario fully demonstrates the strict implementation of cropland protection policies, with results highlighting the significant impact of these policies on farmland stability and food security assurance.
3.3. Heat Mitigation Scenario Simulation
The 2024 land use and the four land use scenarios were input into the InVEST UCM for the HMI simulation. The results showed that the average heat mitigation value for 2024 was 0.803, while the average values for the Natural Development Scenario (ND), Economic Development Scenario (ED), Sustainable Development Scenario (SD), and Cropland Protection Scenario (CLP) were 0.797, 0.735, 0.804, and 0.854, respectively. Overall, the cooling capacity is relatively strong, with the SD and CLP scenarios showing an increase in heat mitigation compared to 2024. In contrast, the ND and ED scenarios exhibited a decrease in heat mitigation compared to 2024. Among the four scenarios, the CLP scenario demonstrated the best cooling capacity, while the ED scenario showed the weakest. The heat mitigation averages of the ND and SD scenarios were almost the same as in 2024.
As shown in Figure 8, significant spatial differences in the HMI were observed across the four scenarios for Tianfu New District. In 2024, high HMI values were mainly distributed in areas surrounding the dense urban construction zone in the central region, especially near forest and grassland areas, such as Longquan Mountain and the southern grassland. Low HMI values were concentrated in the urban core areas with dense built-up land. Under the ND scenario, the cooling capacity was similar to that of 2024; however, due to the lack of policy interventions, the expansion of built-up land has encroached on some peripheral ecological land, leading to a slight decline in cooling capacity. The ED scenario demonstrated a significant reduction in the HMI due to the large-scale expansion of built-up land, with high-value regions further shrinking and limited to a few undeveloped areas and well-protected ecological zones. The SD scenario showed a slight improvement in cooling capacity compared to 2024, mainly due to the enhanced connectivity of blue and green spaces, resulting in a more uniform distribution of cooling effects. The CLP scenario exhibited the best cooling capacity, with an expansion of high HMI areas, particularly in regions where farmland and grassland had been restored under the cropland protection policy.
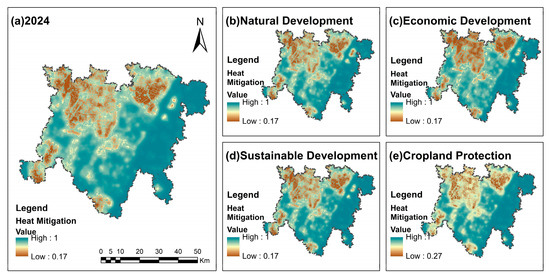
Figure 8.
HMI simulation results for Tianfu New District in 2024 and four scenarios, with (a) HMI in 2024 as the reference; (b) Natural Development Scenario (ND); (c) Economic Development Scenario (ED); (d) Sustainable Development Scenario (SD); (e) Cropland Protection Scenario (CLP).
To further explore the spatial distribution of the HMI in Tianfu New District, the study classified the results of the InVEST model into five levels using an equal interval method in ArcGIS software (version 10.8; Esri, Redlands, CA, USA). In 2024, the area with HMI values between 0.8 and 1.0 accounted for the highest proportion at 64.15% (1027.95 km2), while low-value areas (<0.4) accounted for only 6.75% (Table 5). The ND scenario was similar to 2024, with the proportion of high-value areas (0.8–1.0) slightly decreasing to 62.92%. In the ED scenario, high-value areas decreased to 60.59% (970.94 km2), while low-value areas increased to 18.24%, with the 0.2–0.4 range increasing to 4.65%. The SD scenario was close to 2024, showing a slight overall improvement in cooling capacity, with high-value areas accounting for 66.22% and a slight increase in low-value areas. In the CLP scenario, high-value areas (0.8–1.0) significantly increased to 70.50%, and low-value areas nearly disappeared (<0.4 accounted for only 1.32%).
Table 5.
HMI Values in 2024 and four scenarios.
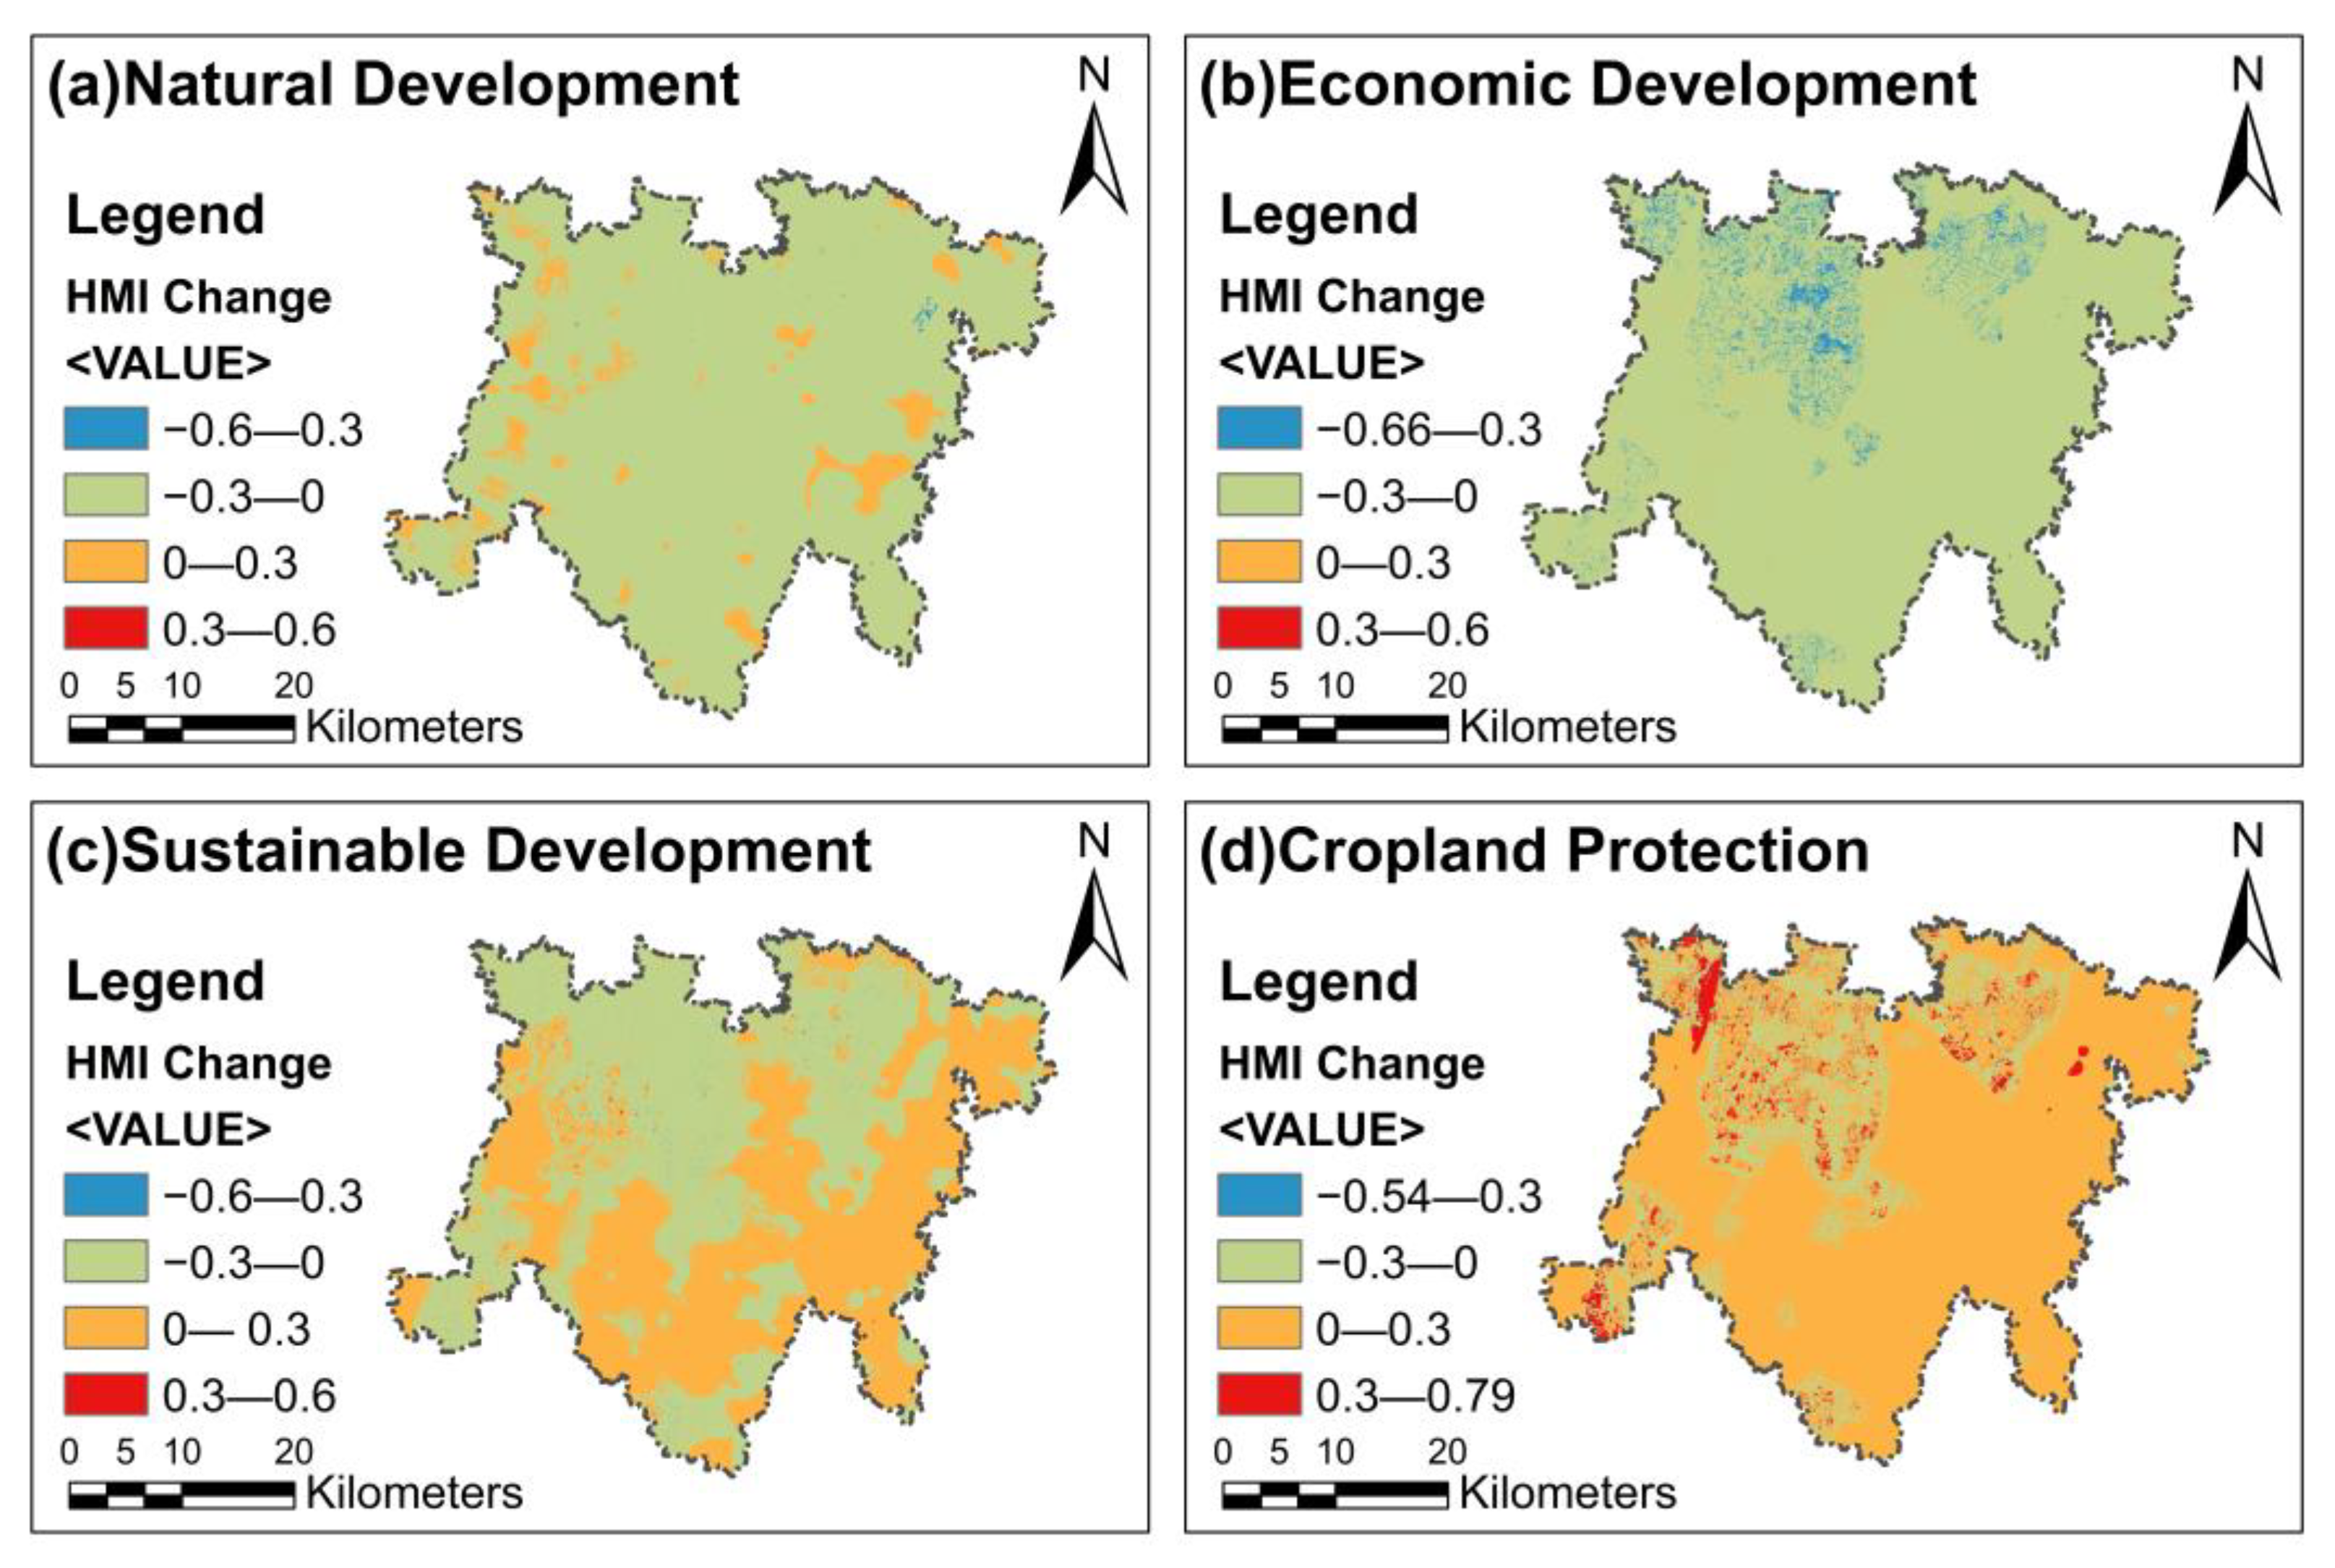
To further explore the spatial variation in the HMI, the changes in the HMI for each scenario compared to 2024 were calculated (Figure 9). An HMI change index with positive values indicates an improvement in cooling capacity, while negative values represent a decline in cooling capacity. Under the ND scenario, the cooling capacity showed minimal changes in most areas, with more than 80% of the region experiencing a slight decrease (−0.3 to 0), indicating that the Natural Development Scenario offers limited protection for cooling effects. In the ED scenario, the HMI decreased significantly, with low-value changes (−0.66 to −0.3) primarily concentrated in areas of built-up land expansion. Some ecological land around the city was converted to built-up land, further weakening the cooling capacity.
Under the SD scenario, the cooling capacity slightly improved (0 to 0.3), mainly in areas with newly added grasslands and forests, particularly around ecological corridors and parks. The CLP scenario showed the most significant improvement in cooling capacity. The cooling effects in some built-up areas of the central urban region were the strongest (0.3 to 0.79). Additionally, a large portion of farmland in the southern region was protected and restored, forming a broad high-value area (0 to 0.3) centered on cropland, further enhancing the region’s overall cooling effect.

Figure 9.
HMI changes of four scenarios compared to 2024. (a) Natural Development Scenario (ND); (b) Economic Development Scenario (ED); (c) Sustainable Development Scenario (SD); (d) Cropland Protection Scenario (CLP).
Figure 9.
HMI changes of four scenarios compared to 2024. (a) Natural Development Scenario (ND); (b) Economic Development Scenario (ED); (c) Sustainable Development Scenario (SD); (d) Cropland Protection Scenario (CLP).
Based on the temperature distribution map predicted by the InVEST model and the temperature statistics for different land types (Figure 10), the following observations were made: In 2024, the average temperature of built-up land in Tianfu New District was the highest at 31.69 °C, while water bodies and forest land had the lowest average temperatures at 29.99 °C and 29.47 °C, respectively. This indicates that water bodies and forest land have strong cooling effects in mitigating regional heat. The average temperatures of grassland and cropland were 30.34 °C and 30.37 °C, respectively, showing that their cooling capacities are inferior to those of water bodies and forest land. Under the Natural Development Scenario (ND), the temperature of built-up land showed minimal changes, with the average temperature remaining high at approximately 31.68 °C. The cooling effects of water bodies and forest land were still evident, with average temperatures of 30.02 °C and 29.48 °C, respectively. Overall, the average temperature distribution in the ND scenario was similar to that of 2024, showing no significant improvement. This suggests that under natural development, if there is no policy intervention, the regional heat island effect may persist. In the Economic Development Scenario (ED), due to the large-scale expansion of built-up Land, the average temperature of built-up land further increased to 32.52 °C, the highest among all the scenarios. While the cooling effects of water bodies and forest land remained significant, their areas may have decreased, weakening their cooling impact. Overall, the ED scenario exacerbated the regional heat island effect, with built-up land having the most detrimental impact on the regional thermal environment. In the Sustainable Development Scenario (SD), the cooling effects of forest land, grassland, and water bodies became more pronounced, with the average temperature of forest land at 29.41 °C, which was close to that of water bodies at 29.96 °C. The Cropland Protection Scenario (CLP) exhibited the most balanced temperature distribution. The average temperature of built-up land was 31.11 °C, which was significantly lower than that of 2024. The cooling effects of cropland, grassland, and water bodies were the most evident, with cropland having an average temperature of 30.00 °C, grassland having 29.44 °C, and water bodies having 29.72 °C.
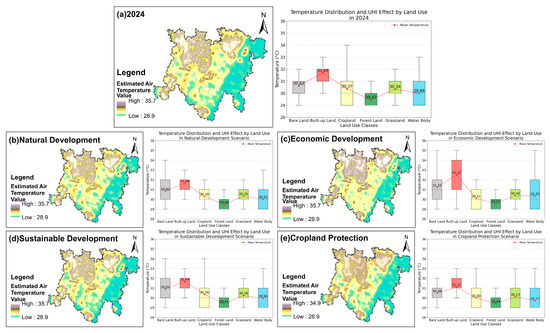
Figure 10.
Total estimated air temperature and temperature for each land use type in 2024 and four scenarios. (a) 2024; (b) Natural Development Scenario (ND); (c) Economic Development Scenario (ED); (d) Sustainable Development Scenario (SD); (e) Cropland Protection Scenario (CLP).
4. Discussion
4.1. Policy-Driven Land Use Changes and Cooling Benefits
As a national-level new area and the birthplace of the “Park City” concept, Tianfu New District’s land use policies have profoundly influenced its ecological patterns and urban cooling effects. Through multi-scenario simulations, this study reveals how land use changes under different policy frameworks impact urban heat environments, emphasizing the critical role of policy guidance in regulating land use and ecosystem services.
Urban expansion is a global phenomenon, and policies play a decisive role in steering land use directions [70]. The results (Table 6) show that the policy-supported Sustainable Development Scenario (SD) and Cropland Protection Scenario (CLP) effectively controlled the expansion of built-up land. These scenarios increased the proportion of ecological land (e.g., forest land and grassland), significantly improving regional cooling effects. For instance, the SD scenario introduced restrictions such as ecological corridors and nature reserves, which not only curbed unreasonable land conversion but also partially restored ecological connectivity, enhancing the cooling efficiency of blue–green space networks. Additionally, the CLP scenario strictly limited the conversion of cropland and protected high-quality farmland, which not only ensured regional food security but also indirectly boosted the cooling contributions of cropland.
Table 6.
Causal relationship between policy scenarios, land use changes, and UHI effects.
In contrast, the Economic Development Scenario (ED) promoted rapid urbanization and industrialization but caused large-scale expansion of built-up land. This significantly reduced ecological land, exacerbating the UHI. This is consistent with experiences in cities like Shanghai, China [71], and Bangladesh [72,73]. Particularly in urban core areas, large amounts of cropland and grassland were converted into built-up land, leading to a significant decline in local cooling capacity [74]. This scenario demonstrates that policies favoring economic growth at the expense of ecological preservation can have irreversible negative impacts on the regional thermal environment [75].
The “Park City” policy emphasizes ecological priority and the deep integration of urban functions, driving the construction of blue–green spaces in Tianfu New District. A high green coverage rate has significantly mitigated localized urban heat islands [76]. Ecological projects such as Xinglong Lake and Tianfu Park have notably increased the coverage of green spaces and water bodies, providing critical support for urban cooling [77]. However, the study also found that these measures were concentrated in specific areas, limiting their impact on overall regional cooling. Under the Park City scenario, although the cooling effect in certain areas was significant, the overall cooling capacity did not surpass that of the Natural Development Scenario (ND). This result suggests that policy implementation still requires a more balanced consideration of ecological resource distribution within the region to achieve comprehensive cooling benefits.
4.2. Challenges in Policy Implementation and Optimization Directions
The rapid urbanization of Tianfu New District presents significant challenges for policy implementation. On one hand, the conflict between the high demand for built-up land and ecological protection needs to be balanced through stricter planning measures. On the other hand, implementing ecological protection policies within the framework of rapid economic development remains a major challenge. The multi-scenario simulations in this study indicate that policy formulation should strike a balance between regional development goals and ecological protection needs.
In future planning, policies should further promote the extension of ecological corridors from the core to surrounding areas, improve green space connectivity, and ensure the balanced distribution of cooling benefits. Policy coordination should strengthen inter-departmental coordination, combining urban planning, ecological protection, and industrial development policies to achieve synergistic development of the economy and ecology.
The experience of Tianfu New District provides valuable insights for other rapidly developing cities. The United Nations Sustainable Development Goals emphasize promoting afforestation and restoring degraded forests [78]. The comparison between the Economic Development Scenario and the Sustainable Development Scenario indicates that policies focused solely on economic growth may lead to irreversible ecological degradation, while policies that balance economic development and ecological protection offer more long-term benefits. Traditionally, agriculture has been seen as having a negative impact on ecosystem services [79,80]. For example, in the Guinea Savanna of northern Ghana, related policies [81] were introduced to promote global sustainability. However, due to the large-scale cultivation of economic crops, the region has seen rising temperatures and land degradation [82]. Unlike previous studies, this research considers the Cropland Protection Scenario, which collaboratively takes into account both ecological conservation and cropland restoration. The results show that the Cropland Protection Scenario (CLP) provides the best cooling benefits among the four scenarios. This scenario highlights the synergy between food security and cooling benefits, which could be an appropriate model for future development in Tianfu New District. As was concluded in other studies, the correct planning direction involves reallocating and optimizing the current cropland model and coordinating the role of cropland and forest land [83,84,85]. Planners need to consider the multifunctionality of agricultural land in future planning.
The core role of policy guidance in land use regulation cannot be overlooked. Through scientific policy design and implementation, Tianfu New District can further optimize its land use structure and achieve more significant cooling benefits. This approach also provides a reference model for other cities in China to achieve a win–win situation for ecology and economy during rapid urbanization.
5. Conclusions
This study analyzes land use changes in Tianfu New District under different policy scenarios and their impact on the UHI through multiple scenario simulations. The results show that: (1) In the Economic Development and Natural Development Scenarios, the expansion of built-up land has led to the compression of ecological land, thereby exacerbating the heat island effect. In contrast, the Sustainable Development and Cropland Protection Scenarios (CLP) effectively curbed the expansion of built-up land, reducing the intensification of the heat island effect. Furthermore, the Cropland Protection Scenario (CLP) demonstrated the best performance in enhancing cooling benefits. By increasing green spaces and restoring ecological environments, this scenario significantly improved the mitigation of the heat island effect. (2) In the process of implementing the “Park City” policy in Tianfu New District, although significant ecological benefits were achieved in certain areas, the overall cooling effect still needs further optimization due to the localized nature of the policy implementation.
Although this study has made significant progress in revealing the impact of policy-driven land use changes on urban cooling effects, there are still limitations in terms of time span, variable selection, and model accuracy. In terms of time span, the long-term effects of ecological restoration (such as forest ecosystem maturity and water body regulation effects) may require decades of observation. This study is mainly based on remote sensing data from 2000 to 2024, which, while covering a relatively long period, may still be insufficient to reflect the long-term impact of policy implementation. In terms of spatial resolution, Landsat data with 30 m resolution is advantageous for large-scale analysis, but there may be insufficient detail for local variations, such as cooling effects in high-density buildings or green roofs. In terms of socio-economic variables, this study simplifies socio-economic factors as static drivers and fails to capture their temporal evolution and dynamic changes driven by policies.
These limitations highlight critical pathways for enhancing urban cooling strategies. Future research should prioritize regional ecological coordination and green space connectivity, supported by higher-resolution data sources (e.g., Sentinel-2, UAV imagery) for precise monitoring of localized cooling effects. Long-term (multi-decadal) ecological monitoring systems should be established to capture delayed policy impacts. Additionally, future studies could incorporate more dynamic variables. For example, in the Economic Development Scenario, dynamic market demand and industrial transfer mechanisms could be considered, and their effects fully reflected in scenario simulations.
This study provides scientific evidence for policymakers, particularly on how to achieve the dual goals of ecological protection and urban cooling through reasonable land use planning during the urbanization process. The findings emphasize the crucial role of policy interventions in land use and urban cooling, especially in balancing the conflict between economic development and ecological protection to achieve sustainable urban development. Future urban planning should pay more attention to balancing ecological protection and land use, promoting the restoration of green space systems, and providing rational planning of built-up land to address the challenges of heat island effects and climate change during the urbanization process.
Author Contributions
Conceptualization, R.L.; methodology, R.L.; software, R.L.; validation, R.L., Y.W. (Yujing Wu), R.W. and J.Y.; formal analysis, R.L.; investigation, R.L. and Y.W. (Yujing Wu); resources, R.L. and Y.W. (Yujing Wu); data curation, R.L.; writing—original draft, R.L.; writing—review and editing, R.L., Y.W. (Yujing Wu), Y.W. (Yuqiu Wu) and J.Y.; visualization, R.L. and Y.W. (Yujing Wu); supervision, R.L., Y.W. (Yujing Wu), R.W. and J.Y.; project administration, Y.W. (Yujing Wu), R.W. and J.Y.; funding acquisition, J.Y. All authors have read and agreed to the published version of the manuscript.
Funding
This research was funded by the Central Universities Science and Technology Innovation Project (Grant Number: 2682024CX069) and the Sichuan Science and Technology Program Key Research and Development Project (Grant Number: 2024YFFK0441).
Data Availability Statement
The data that support the findings of this study are available from the corresponding author upon reasonable request. The data are not publicly available due to privacy and anonymity.
Acknowledgments
We would like to express our respect and gratitude to the anonymous reviewers and editors for their professional comments and suggestions.
Conflicts of Interest
The authors declare no conflicts of interest.
References
- Simonds, J.O. Landscape Architecture: A Manual of Site Planning and Design; McGraw-Hill Professional: New York, NY, USA, 2007. [Google Scholar]
- Almulhim, A.I.; Bibri, S.E.; Sharifi, A.; Ahmad, S.; Almatar, K.M. Emerging Trends and Knowledge Structures of Urbanization and Environmental Sustainability: A Regional Perspective. Sustainability 2022, 14, 13195. [Google Scholar] [CrossRef]
- United Nations. World Urbanization Prospects—Population Division—United Nations. Available online: https://population.un.org/wup/ (accessed on 4 December 2024).
- United Nations. World Urbanization Prospects: The 2014 Revision; Department of Economic and Social Affairs, Population Division: New York, NY, USA, 2015; p. 1. [Google Scholar]
- Dodman, D.; Hayward, B.; Pelling, M.; Broto, V.C.; Chow, W.; Chu, E.; Dawson, R.; Khirfan, L.; McPhearson, T.; Prakash, A.; et al. IPCC AR6 WGII Chapter 6: Cities, Settlements and Key Infrastructure. In Climate Change 2022: Impacts, Adaptation, and Vulnerability. Contribution of Working Group II to the Sixth Assessment Report of the Intergovernmental Panel on Climate Change; Cambridge University Press: Cambridge, UK, 2022. [Google Scholar]
- Pelling, M.; Garschagen, M. Put equity first in climate adaptation. Nature 2019, 569, 327–329. [Google Scholar] [CrossRef] [PubMed]
- Zhou, X.F.; Chen, H. Impact of Urbanization-Related Land Use Land Cover Changes and Urban Morphology Changes on the Urban Heat Island Phenomenon. Sci. Total Environ. 2018, 635, 1467–1476. [Google Scholar] [CrossRef] [PubMed]
- Ventriglio, A.; Torales, J.; Castaldelli-Maia, J.M.; Berardis, D.D.; Bhugra, D. Urbanization and Emerging Mental Health Issues. CNS Spectr. 2021, 26, 43–50. [Google Scholar] [CrossRef]
- Wu, J.; Xiang, W.-N.; Zhao, J. Urban Ecology in China: Historical Developments and Future Directions. Landsc. Urban Plan. 2014, 125, 222–233. [Google Scholar] [CrossRef]
- Li, G.; Zhang, X.; Mirzaei, P.A.; Zhang, J.; Zhao, Z. Urban Heat Island Effect of a Typical Valley City in China: Responds to the Global Warming and Rapid Urbanization. Sustain. Cities Soc. 2018, 38, 736–745. [Google Scholar] [CrossRef]
- Amani-Beni, M.; Zhang, B.; Xie, G.; Xu, J. Impact of urban park’s tree, grass and waterbody on microclimate in hot summer days: A case study of Olympic Park in Beijing, China. Urban For. Urban Green. 2018, 32, 1–6. [Google Scholar] [CrossRef]
- Bowler, D.E.; Buyung-Ali, L.; Knight, T.M.; Pullin, A.S. Urban greening to cool towns and cities: A systematic review of the empirical evidence. Landsc. Urban Plan. 2010, 97, 147–155. [Google Scholar] [CrossRef]
- Hu, Y.; Wang, C.; Li, J. Assessment of Heat Mitigation Services Provided by Blue and Green Spaces: An Application of the InVEST Urban Cooling Model with Scenario Analysis in Wuhan, China. Land 2023, 12, 963. [Google Scholar] [CrossRef]
- Zhao, C.; Fu, G.; Liu, X.; Fu, F. Urban planning indicators, morphology and climate indicators: A case study for a north-south transect of Beijing, China. Build. Environ. 2011, 46, 1174–1183. [Google Scholar] [CrossRef]
- Ouyang, Z.; Zheng, H.; Xiao, Y.; Polasky, S.; Liu, J.; Xu, W.; Wang, Q.; Zhang, Y.; Rao, E.; Jiang, L.; et al. Improvements in ecosystem services from investments in natural capital. Science 2016, 352, 1455–1459. [Google Scholar] [CrossRef]
- Peng, X.; Liao, L.; Tan, X.; Yu, R.; Zhang, K. City Health Assessment: Urbanization and Eco-Environment Dynamics Using Coupling Coordination Analysis and FLUS Model—A Case Study of the Pearl River Delta Urban Agglomeration. Land 2025, 14, 46. [Google Scholar] [CrossRef]
- Tao, Y.; Li, F.; Crittenden, J.; Lu, Z.; Ou, W.; Song, Y. Measuring urban environmental sustainability performance in China: A multi-scale comparison among different cities, urban clusters, and geographic regions. Cities 2019, 94, 200–210. [Google Scholar] [CrossRef]
- Mao, D.; He, X.; Wang, Z.; Tian, Y.; Xiang, H.; Yu, H.; Man, W.; Jia, M.; Ren, C.; Zheng, H. Diverse policies leading to contrasting impacts on land cover and ecosystem services in Northeast China. J. Clean. Prod. 2019, 240, 117961. [Google Scholar] [CrossRef]
- Chen, K.; Luo, Y.; Zhuo, L. The Spatial and Temporal Variation of Land Use in Dianchi Basin Under the Policy Driven by Urban Establishment Up at Mountain. In Proceedings of the 2018 26th International Conference on Geoinformatics, Kunming, China, 28–30 June 2018. [Google Scholar]
- Four Perspectives for Rural Areas in the European Community. Available online: https://english.wrr.nl/publications/reports/1992/06/09/ground-for-choices (accessed on 4 December 2024).
- Rounsevell, M.; Ewert, F.; Reginster, I.; Leemans, R.; Carter, T. Future scenarios of European agricultural land use: II. Projecting changes in cropland and grassland. Agric. Ecosyst. Environ. 2005, 107, 117–135. [Google Scholar] [CrossRef]
- Schulp, C.; Nabuurs, G.; Verburg, P. Future carbon sequestration in Europe—Effects of land use change. Agric. Ecosyst. Environ. 2008, 127, 251–264. [Google Scholar] [CrossRef]
- Metzger, M.; Schröter, D.; Leemans, R.; Cramer, W. A spatially explicit and quantitative vulnerability assessment of ecosystem service change in Europe. Reg. Environ. Chang. 2008, 8, 91–107. [Google Scholar] [CrossRef]
- He, C.; Liu, Z.; Tian, J.; Ma, Q. Urban expansion dynamics and natural habitat loss in China: A multiscale landscape perspective. Glob. Chang. Biol. 2014, 20, 2886–2902. [Google Scholar] [CrossRef]
- Tertre, A.; Lefranc, A.; Eilstein, D.; Declercq, C.; Medina, S.; Blanchard, M.; Chardon, B.; Fabre, P.; Filleul, L.; Jusot, J.; et al. Impact of the 2003 heatwave on all-cause mortality in 9 French cities. Epidemiology 2005, 17, 75–79. [Google Scholar] [CrossRef]
- Mitchell, D.; Heaviside, C.; Vardoulakis, S.; Huntingford, C.; Masato, G.; Guillod, B.; Frumhoff, P.; Bowery, A.; Wallom, D.; Allen, M. Attributing human mortality during extreme heat waves to anthropogenic climate change. Environ. Res. Lett. 2016, 11, 74006. [Google Scholar] [CrossRef]
- Wilby, R.L. Past and projected trends in London’s urban heat island. Weather 2003, 58, 251–260. [Google Scholar] [CrossRef]
- Smith, C.; Webb, A.; Levermore, G.; Lindley, S.; Beswick, K. Fine-scale spatial temperature patterns across a UK conurbation. Clim. Chang. 2011, 109, 269–286. [Google Scholar] [CrossRef]
- Heaviside, C.; Cai, X.; Vardoulakis, S. The effects of horizontal advection on the urban heat island in Birmingham and the West Midlands, United Kingdom during a heatwave. Q. J. R. Meteorol. Soc. 2015, 141, 1429–1441. [Google Scholar] [CrossRef]
- Sarfo, I.; Bi, S.; Xu, X.; Yeboah, E.; Kwang, C.; Batame, M.; Addai, F.K.; Adamu, U.W.; Appea, E.A.; Djan, M.A.; et al. Planning for cooler cities in Ghana: Contribution of green infrastructure to urban heat mitigation in Kumasi Metropolis. Land Use Policy 2023, 133, 106842. [Google Scholar] [CrossRef]
- Yang, Y. A Tale of Two Cities: Physical Form and Neighborhood Satisfaction in Metropolitan Portland and Charlotte. J. Am. Plan. Assoc. 2008, 74, 307–323. [Google Scholar] [CrossRef]
- Laidley, T. Measuring Sprawl: A New Index, Recent Trends, and Future Research. Urban Aff. Rev. 2016, 52, 66–97. [Google Scholar] [CrossRef]
- Kremer, P.; Hamstead, Z.; McPhearson, T. The value of urban ecosystem services in New York City: A spatially explicit multicriteria analysis of landscape scale valuation scenarios. Environ. Sci. Policy 2016, 62, 57–68. [Google Scholar] [CrossRef]
- Nj, N.; Alcamo, J.; Davis, G.; Vries, B.; Fenhann, J.; Gaffin, S.; Gregory, K.; Grubler, A.; Jung, T.Y.; Kram, T.; et al. IPCC Special Report on Emissions Scenarios; Cambridge University Press: Cambridge, UK, 2000. [Google Scholar]
- Sung, H. Land use change prediction of Cheongju using SLEUTH Model. J. Environ. Impact Assess. 2013, 22, 109–116. [Google Scholar]
- Arshad, S.; Ahmad, S.; Abbas, S.; Asharf, A.; Siddiqui, N.; Islam, Z. Quantifying the contribution of diminishing green spaces and urban sprawl to urban heat island effect in a rapidly urbanizing metropolitan city of Pakistan. Land Use Policy 2022, 113, 105874. [Google Scholar] [CrossRef]
- Dutta, M.; Herreros-Cantis, P.; McPhearson, T.; Mustafa, A.; Palmer, M.; Tosca, M.; Ventrella, J.; Cook, E. New York City 2100, Environmental justice implications of future scenarios for addressing extreme heat. Landsc. Urban Plan. 2025, 254, 105249. [Google Scholar] [CrossRef]
- Liu, Q.; Yang, Z.; Chen, Y.; Lei, J.; Chen, Z.; Chen, X. Multi-scenario Simulation of Land Use Change and Its Eco-environmental Effect in Hainan Island Based on CA-Markov Model. Ecol. Environ. Sci. 2021, 30, 1522–1531. [Google Scholar]
- Yu, Y.; Mu, Z.; Peng, L.; He, Y. Prediction of land use change in the western mountainous area of Tianshan Mountains. China Rural Water Resour. Hydropower 2016, 2016, 58–61, 65. [Google Scholar]
- Luo, G.; Yin, C.; Chen, X.; Xu, W.; Lu, L. Combining system dynamic model and CLUE-S model to improve land use scenario analyses at regional scale: A case study of Sangong watershed in Xinjiang, China. Ecol. Complex. 2010, 7, 198–207. [Google Scholar] [CrossRef]
- Liang, X.; Guan, Q.; Clarke, K.C. Understanding the drivers of sustainable land expansion using a patch-generating land use simulation (PLUS) model: A case study in Wuhan, China. Comput. Environ. Urban Syst. 2021, 85, 101569. [Google Scholar] [CrossRef]
- Zou, N.; Wang, C.; Wang, S.; Li, Y. Impact of ecological conservation policies on land use and carbon stock in megacities at different stages of development. Heliyon 2023, 9, e18814. [Google Scholar] [CrossRef]
- Yang, S.; Li, L.; Zhu, R.; Luo, C.; Lu, X.; Sun, M.; Xu, B. Assessing land-use changes and carbon storage: A case study of the Jialing River Basin, China. Sci. Rep. 2024, 14, 15984. [Google Scholar] [CrossRef]
- Liao, J.; Tang, L.; Shao, G. Multi-Scenario Simulation to Predict Ecological Risk Posed by Urban Sprawl with Spontaneous Growth: A Case Study of Quanzhou. Int. J. Environ. Res. Public Health 2022, 19, 15358. [Google Scholar] [CrossRef]
- Wang, J.; Zhang, J.; Xiong, N.; Liang, B.; Wang, Z.; Cressey, E. Spatial and Temporal Variation, Simulation and Prediction of Land Use in Ecological Conservation Area of Western Beijing. Remote Sens. 2022, 14, 1452. [Google Scholar] [CrossRef]
- Lin, Z.; Peng, S. Comparison of multimodel simulations of land use and land cover change considering integrated constraints—A case study of the Fuxian Lake basin. Ecol. Indic. 2022, 142, 109254. [Google Scholar] [CrossRef]
- Liang, S.; Chen, C.Y.; Hu, X.J.; Zhang, W.; Liu, L.Y. Scenario Simulation of the Influence of Lakeside Buildings Spatial Forms on Lake Thermal Release Effect in High-Density Built-Up Area. Acta Ecol. Sin. 2022, 42, 3759–3770. [Google Scholar]
- Jiang, Y.F.; Huang, J.; Shi, T.M.; Wang, H.X. Interaction of Urban Rivers and Green Space Morphology to Mitigate the Urban Heat Island Effect: Case-Based Comparative Analysis. Int. J. Environ. Res. Public Health 2021, 18, 11404. [Google Scholar] [CrossRef] [PubMed]
- Hathway, E.A.; Sharples, S. The Interaction of Rivers and Urban Form in Mitigating the Urban Heat Island Effect: A UK Case Study. Build. Environ. 2012, 58, 14–22. [Google Scholar] [CrossRef]
- Hua, L.Z.; Sun, F.Q.; Chen, J.N.; Tang, L.N. Quantifying the Cool-Island Effects of Urban Parks Using Landsat-8 Imagery in a Coastal City, Xiamen, China. Acta Ecol. Sin. 2020, 40, 8147–8157. [Google Scholar]
- Cai, Y.B.; Chen, Y.H.; Tong, C. Spatiotemporal Evolution of Urban Green Space and Its Impact on the Urban Thermal Environment Based on Remote Sensing Data: A Case Study of Fuzhou City, China. Urban For. Urban Green. 2019, 41, 333–343. [Google Scholar] [CrossRef]
- Zheng, T.; Qu, K.; Darkwa, J.; Calautit, J. Evaluating urban heat island mitigation strategies for a subtropical city centre (a case study in Osaka, Japan). Energy 2022, 250, 123721. [Google Scholar] [CrossRef]
- Sharp, R.; Douglass, J.; Wolny, S.; Arkema, K.; Bernhardt, J.; Bierbower, W.; Chaumont, N.; Denu, D.; Fisher, D.; Glowinski, K. InVEST 3.10.2.post28+ug.ga4e401c.d20220324 User’s Guide; The Natural Capital Project: Washington, DC, USA; Stanford University: Stanford, CA, USA; University of Minnesota: Minneapolis, MN, USA; The Nature Conservancy: Arlington, VA, USA; World Wildlife Fund: Washington, DC, USA, 2020; Available online: https://naturalcapitalproject.stanford.edu/software/invest (accessed on 19 December 2024).
- Vujovic, S.; Haddad, B.; Karaky, H.; Sebaibi, N.; Boutouil, M. Urban Heat Island: Causes, Consequences, and Mitigation Measures with Emphasis on Reflective and Permeable Pavements. CivilEng 2021, 2, 459–484. [Google Scholar] [CrossRef]
- Zardo, L.; Geneletti, D.; Pérez-Soba, M.; Van Eupen, M. Estimating the Cooling Capacity of Green Infrastructures to Support Urban Planning. Ecosyst. Serv. 2017, 26, 225–235. [Google Scholar] [CrossRef]
- Zhao, S.; Dong, J.; Guo, F.; Zhang, H.; Zhu, P. Optimization of green space in high-density built-up areas based on cooling simulations: A case study in Xi’an, China. Urban Clim. 2024, 58, 102225. [Google Scholar] [CrossRef]
- Chung, J.; Kim, J.; Sung, K. Analysis of Heat Mitigation Capacity in a Coastal City using InVEST Urban Cooling Model. Sustain. Cities Soc. 2024, 113, 105669. [Google Scholar] [CrossRef]
- Zawadzka, J.E.; Harris, J.A.; Corstanje, R. Assessment of heat mitigation capacity of urban greenspaces with the use of InVEST urban cooling model, verified with day-time land surface temperature data. Landsc. Urban Plan. 2021, 214, 104163. [Google Scholar] [CrossRef]
- Sichuan Tianfu New District Management Committee. Available online: https://www.cdtf.gov.cn/ (accessed on 10 January 2025).
- The Implementation Plan for Building a Higher-Level “Tianfu Granary” in Chengdu Area Issued to Enhance the Construction of the “One Belt, Ten Parks, and Hundred Zones” Grain and Oil Industrial Parks. Chengdu Agricultural and Rural Bureau. Available online: https://cdagri.chengdu.gov.cn/nyxx/c109513/2022-08/17/content_ff764556901c43b5966326e8bf18e72c.shtml (accessed on 21 December 2024).
- People’s Government of Sichuan Province. Reply on the Master Planning of Chengdu Tianfu New District of Sichuan Province (Sichuan Government Letter (2011) No. 240) [Z]. 2015. Available online: https://www.sc.gov.cn/10462/10464/13298/13301/2015/11/18/10359113.shtml (accessed on 26 August 2024).
- Qiu, J. Main Concepts of Tianfu New District Planning in Sichuan Province. China City Plan. Rev. 2014, 2014, 1002–1329. [Google Scholar]
- Ding, Y.; Lu, Q.F. Research on the Construction of Urban Ecological Security: The Development of New-type Urbanization in Tianfu New District, Chengdu City. J. Southwest Minzu Univ. (Humanit. Soc. Sci.) 2014, 35, 156–159. [Google Scholar]
- Chengdu Municipal Bureau of Ecological Environment, 2023. Biodiversity Survey Report of Chengdu-Plant Diversity. Available online: https://sthj.chengdu.gov.cn/cdhbj/c110996/2023-12/14/content_971decaf7fdf47ef876c9c188504e315.shtml (accessed on 30 August 2024).
- Dong, G.; Ge, Y.; Jia, H.; Sun, C.; Pan, S. Land Use Multi-Suitability, Land Resource Scarcity and Diversity of Human Needs: A New Framework for Land Use Conflict Identification. Land 2021, 10, 1003. [Google Scholar] [CrossRef]
- Dong, G.; Sun, Z.; Li, W.; Wang, K.; Yuan, C. Identification of Potential Land Use Conflicts in Shandong Province: A New Framework. Land 2024, 13, 1203. [Google Scholar] [CrossRef]
- Sun, J.; Zhang, Y.; Qin, W.; Chai, G. Estimation and Simulation of Forest Carbon Stock in Northeast China Forestry Based on Future Climate Change and LUCC. Remote Sens. 2022, 14, 3653. [Google Scholar] [CrossRef]
- Chen, L.; Cai, H.; Zhang, T.; Zhang, X.; Zeng, H. Land use multi-scenario simulation analysis of Rao River Basin based on Markov-FLUS model. Acta Ecol. Sin. 2022, 42, 3947–3958. [Google Scholar]
- Taha, H.; Akbari, H.; Rosenfeld, A.; Huang, J. Residential Cooling Loads and the Urban Heat Island—The Effects of Albedo. Build. Environ. 1988, 23, 271–283. [Google Scholar] [CrossRef]
- Appiah, D.O.; Forkuo, E.K.; Bugri, J.T.; Apreku, T.O. Geospatial Analysis of Land Use and Land Cover Transitions from 1986–2014 in a Peri-Urban Ghana. Geosciences 2017, 7, 125. [Google Scholar] [CrossRef]
- Huang, W.; Li, J.; Guo, Q.; Mansaray, L.R.; Li, X.; Huang, J. A Satellite-Derived Climatological Analysis of Urban Heat Island over Shanghai during 2000–2013. Remote Sens. 2017, 9, 641. [Google Scholar] [CrossRef]
- Kant, Y.; Azim, S.; Mitra, D. Analyzing the Influence of Urban Growth on Thermal Environment Through Demographic, Environmental, and Physical Parameters in Bangladesh. In Land-Atmospheric Research Applications in South and Southeast Asia; Springer: Cham, Switzerland, 2018; pp. 613–639. [Google Scholar]
- Al Kafy, A.; Al-Faisal, A.; Hasan, M.M.; Sikdar, M.S.; Hasan Khan, M.; Rahman, M.; Islam, R. Impact of LULC Changes on LST in rajshahi district of bangladesh: A remote sensing approach. Environ. Sci. Geogr. 2020, 3, 213730221. [Google Scholar] [CrossRef]
- An, H.; Cai, H.; Xu, X.; Qiao, Z.; Han, D. Impacts of Urban Green Space on Land Surface Temperature from Urban Block Perspectives. Remote Sens. 2022, 14, 4580. [Google Scholar] [CrossRef]
- Amani-Beni, M.; Zhang, B.; Xie, G.; Shi, Y. Impacts of Urban Green Landscape Patterns on Land Surface Temperature: Evidence from the Adjacent Area of Olympic Forest Park of Beijing, China. Sustainability 2019, 11, 513. [Google Scholar] [CrossRef]
- Zaitunah, A.; Samsuri; Silitonga, A.F.; Syaufina, L. Urban Greening Effect on Land Surface Temperature. Sensors 2022, 22, 4168. [Google Scholar] [CrossRef]
- Van Vliet, E.; Dane, G.; Weijs-Perrée, M.; Van Leeuwen, E.; Van Dinter, M.; van den Berg, P.; Borgers, A.; Chamilothori, K. The Influence of Urban Park Attributes on User Preferences: Evaluation of Virtual Parks in an Online Stated-Choice Experiment. Int. J. Environ. Res. Public Health 2020, 18, 212. [Google Scholar] [CrossRef]
- The SDGs in Action United Nations Development Programme. Available online: https://www.undp.org/publications/sdgs-action (accessed on 30 December 2024).
- Melchior, I.C.; Newig, J. Governing Transitions towards Sustainable Agriculture—Taking Stock of an Emerging Field of Research. Sustainability 2021, 13, 528. [Google Scholar] [CrossRef]
- Boon, A.; Sandström, C.; Rose, D.C. Governing agricultural innovation: A comprehensive framework to underpin sustainable transitions. J. Rural Stud. 2022, 89, 407–422. [Google Scholar] [CrossRef]
- Ministry of Energy. National Energy Policy Energy Sector, an Engine for Economic Growth and Sustainable Development. 2021. Available online: https://www.energymin.gov.gh/policies (accessed on 30 December 2024).
- Liwur, S.B.; Adam, A.R.; Tagnan, J.N.; Sadique, A.; Asibey, M.O.; Takyi, S.A.; Amponsah, O. For or against sustainable development? A geospatial analysis of the state of green space ecosystems in West Gonja, Ghana. Land Use Policy 2025, 151, 107480. [Google Scholar] [CrossRef]
- Liu, Z. Rural land sustainability development planning and use by considering land multifunction values: A case study of analysis and simulation. Land Use Policy 2025, 150, 107455. [Google Scholar] [CrossRef]
- Zhong, H.; Liu, Z.; Wang, J. Understanding impacts of cropland pattern dynamics on grain production in China: An integrated analysis by fusing statistical data and satellite-observed data. J. Environ. Manag. 2022, 313, 114988. [Google Scholar] [CrossRef]
- Dobrynin, D.; Vorbrugg, A.; Hujala, T. Forestry on abandoned agricultural land: Future options for Russia. Land Use Policy 2025, 150, 107435. [Google Scholar] [CrossRef]
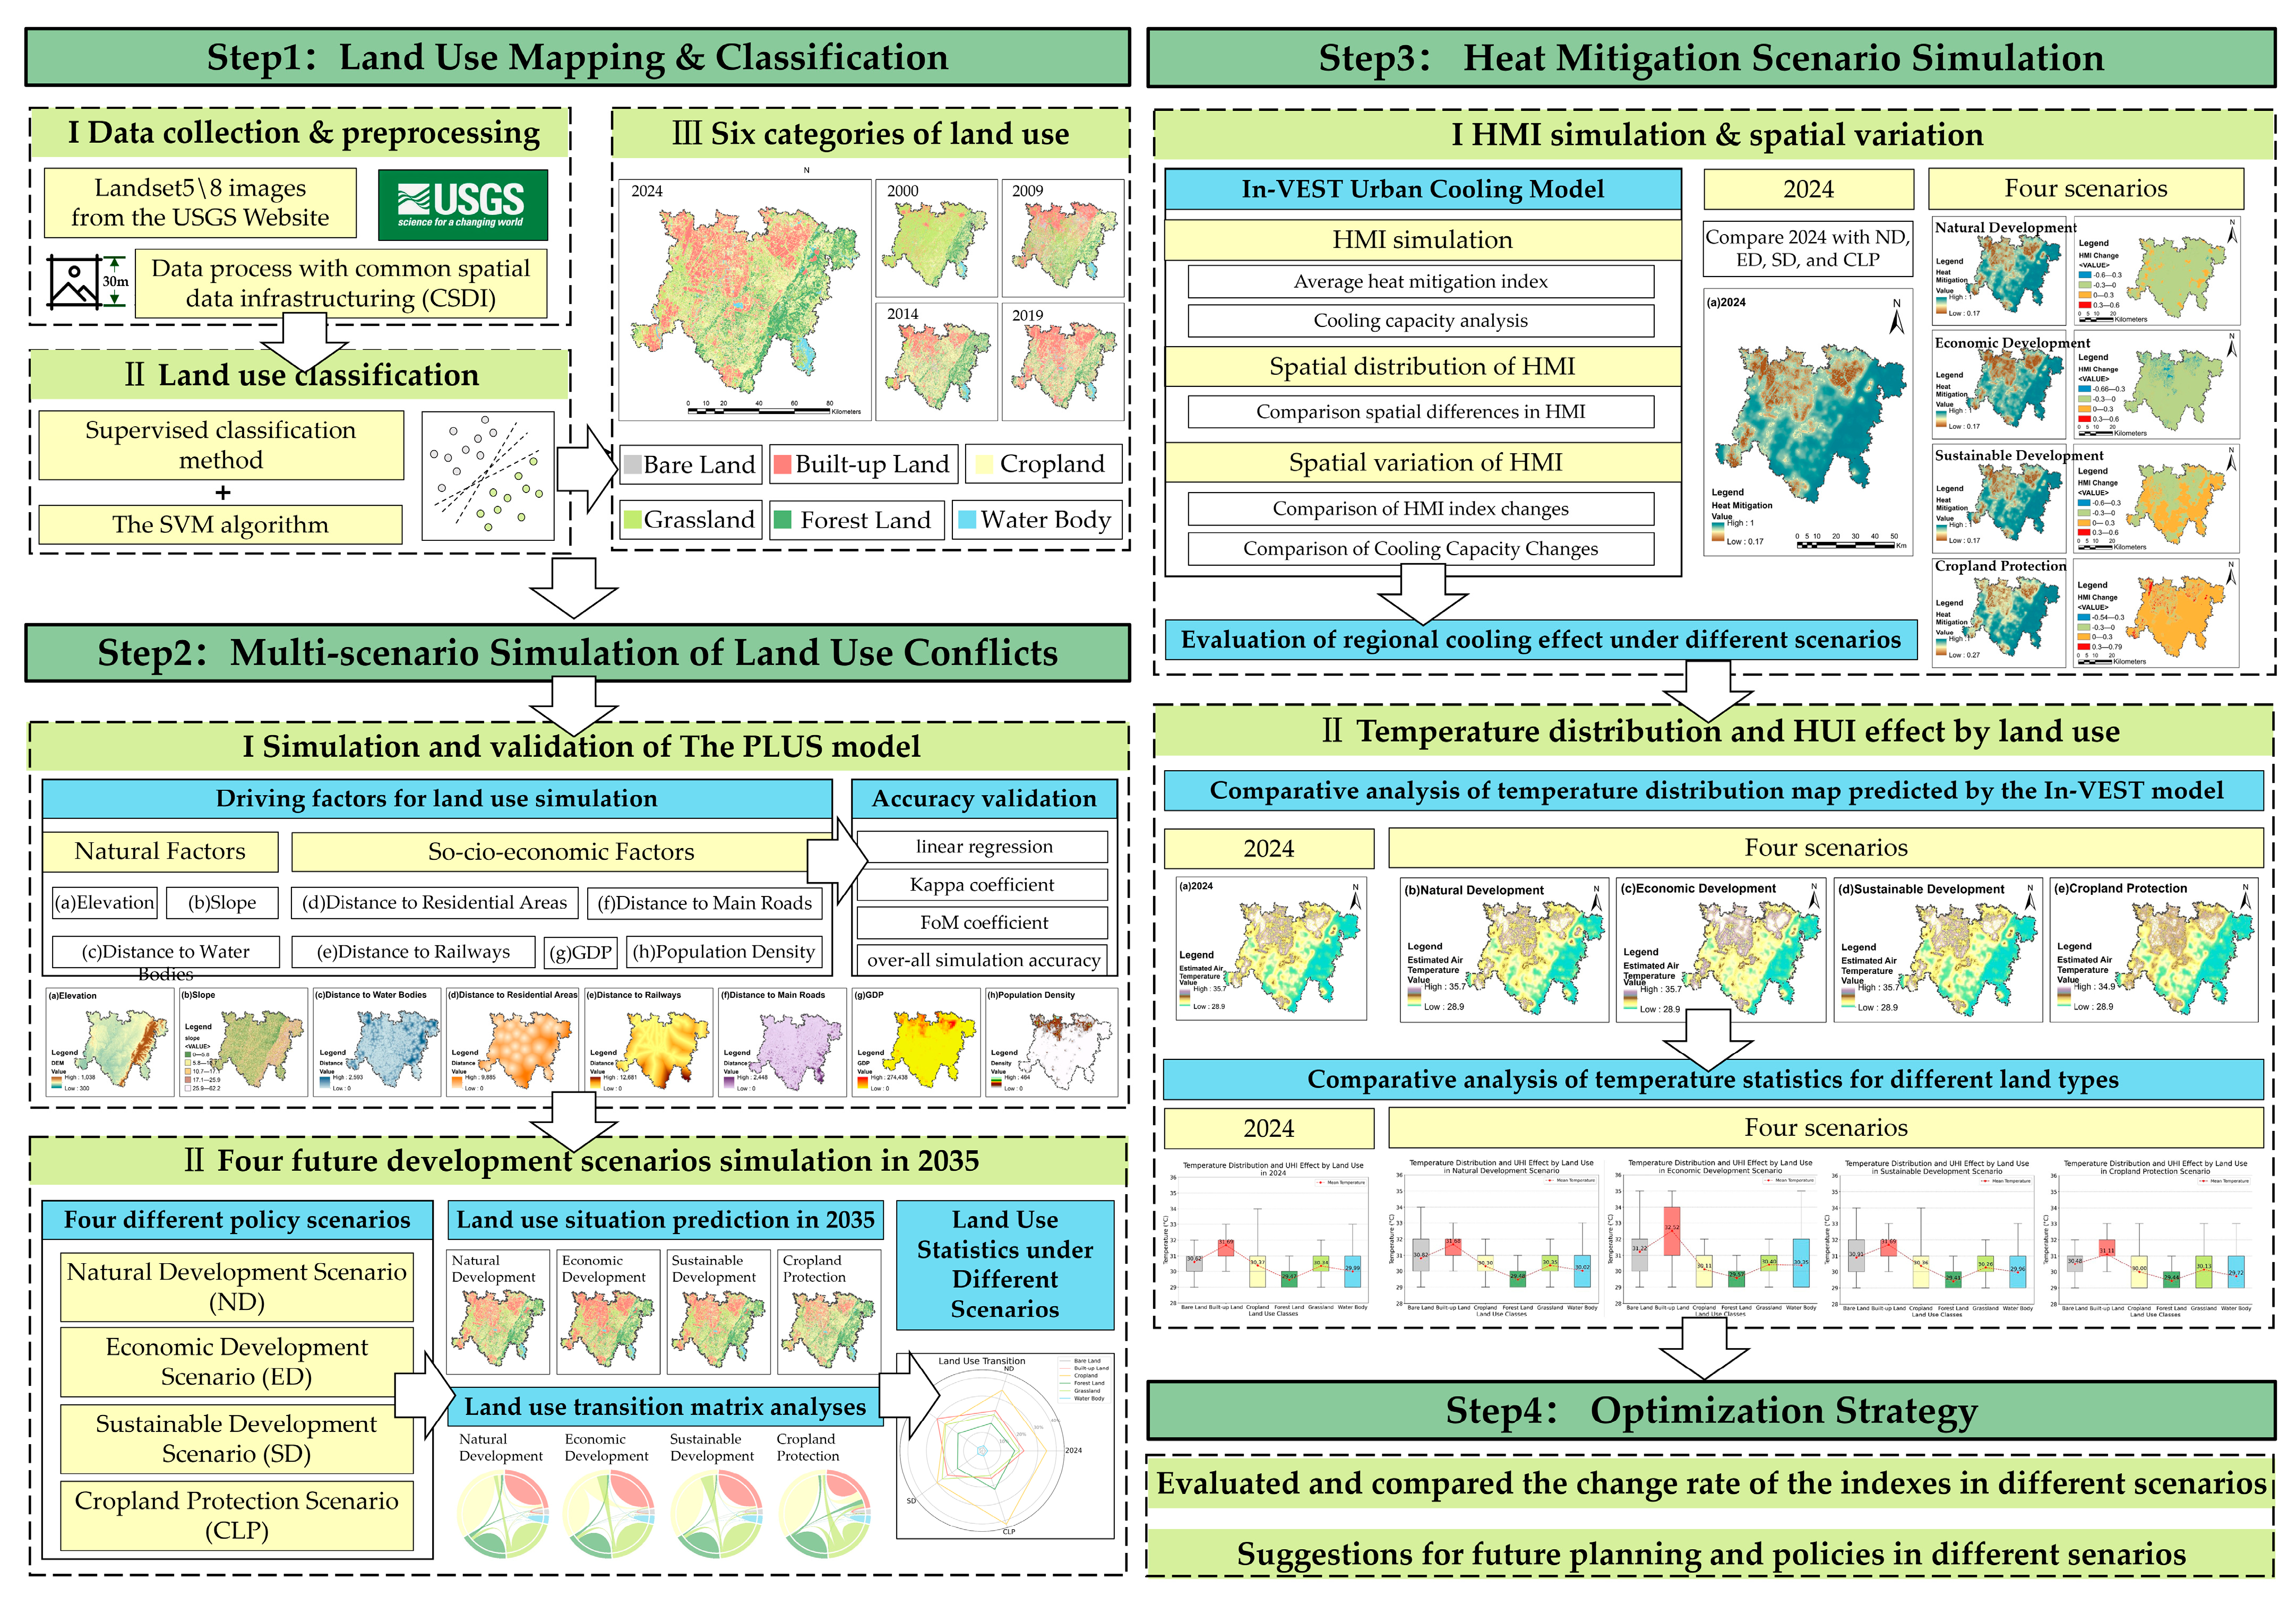
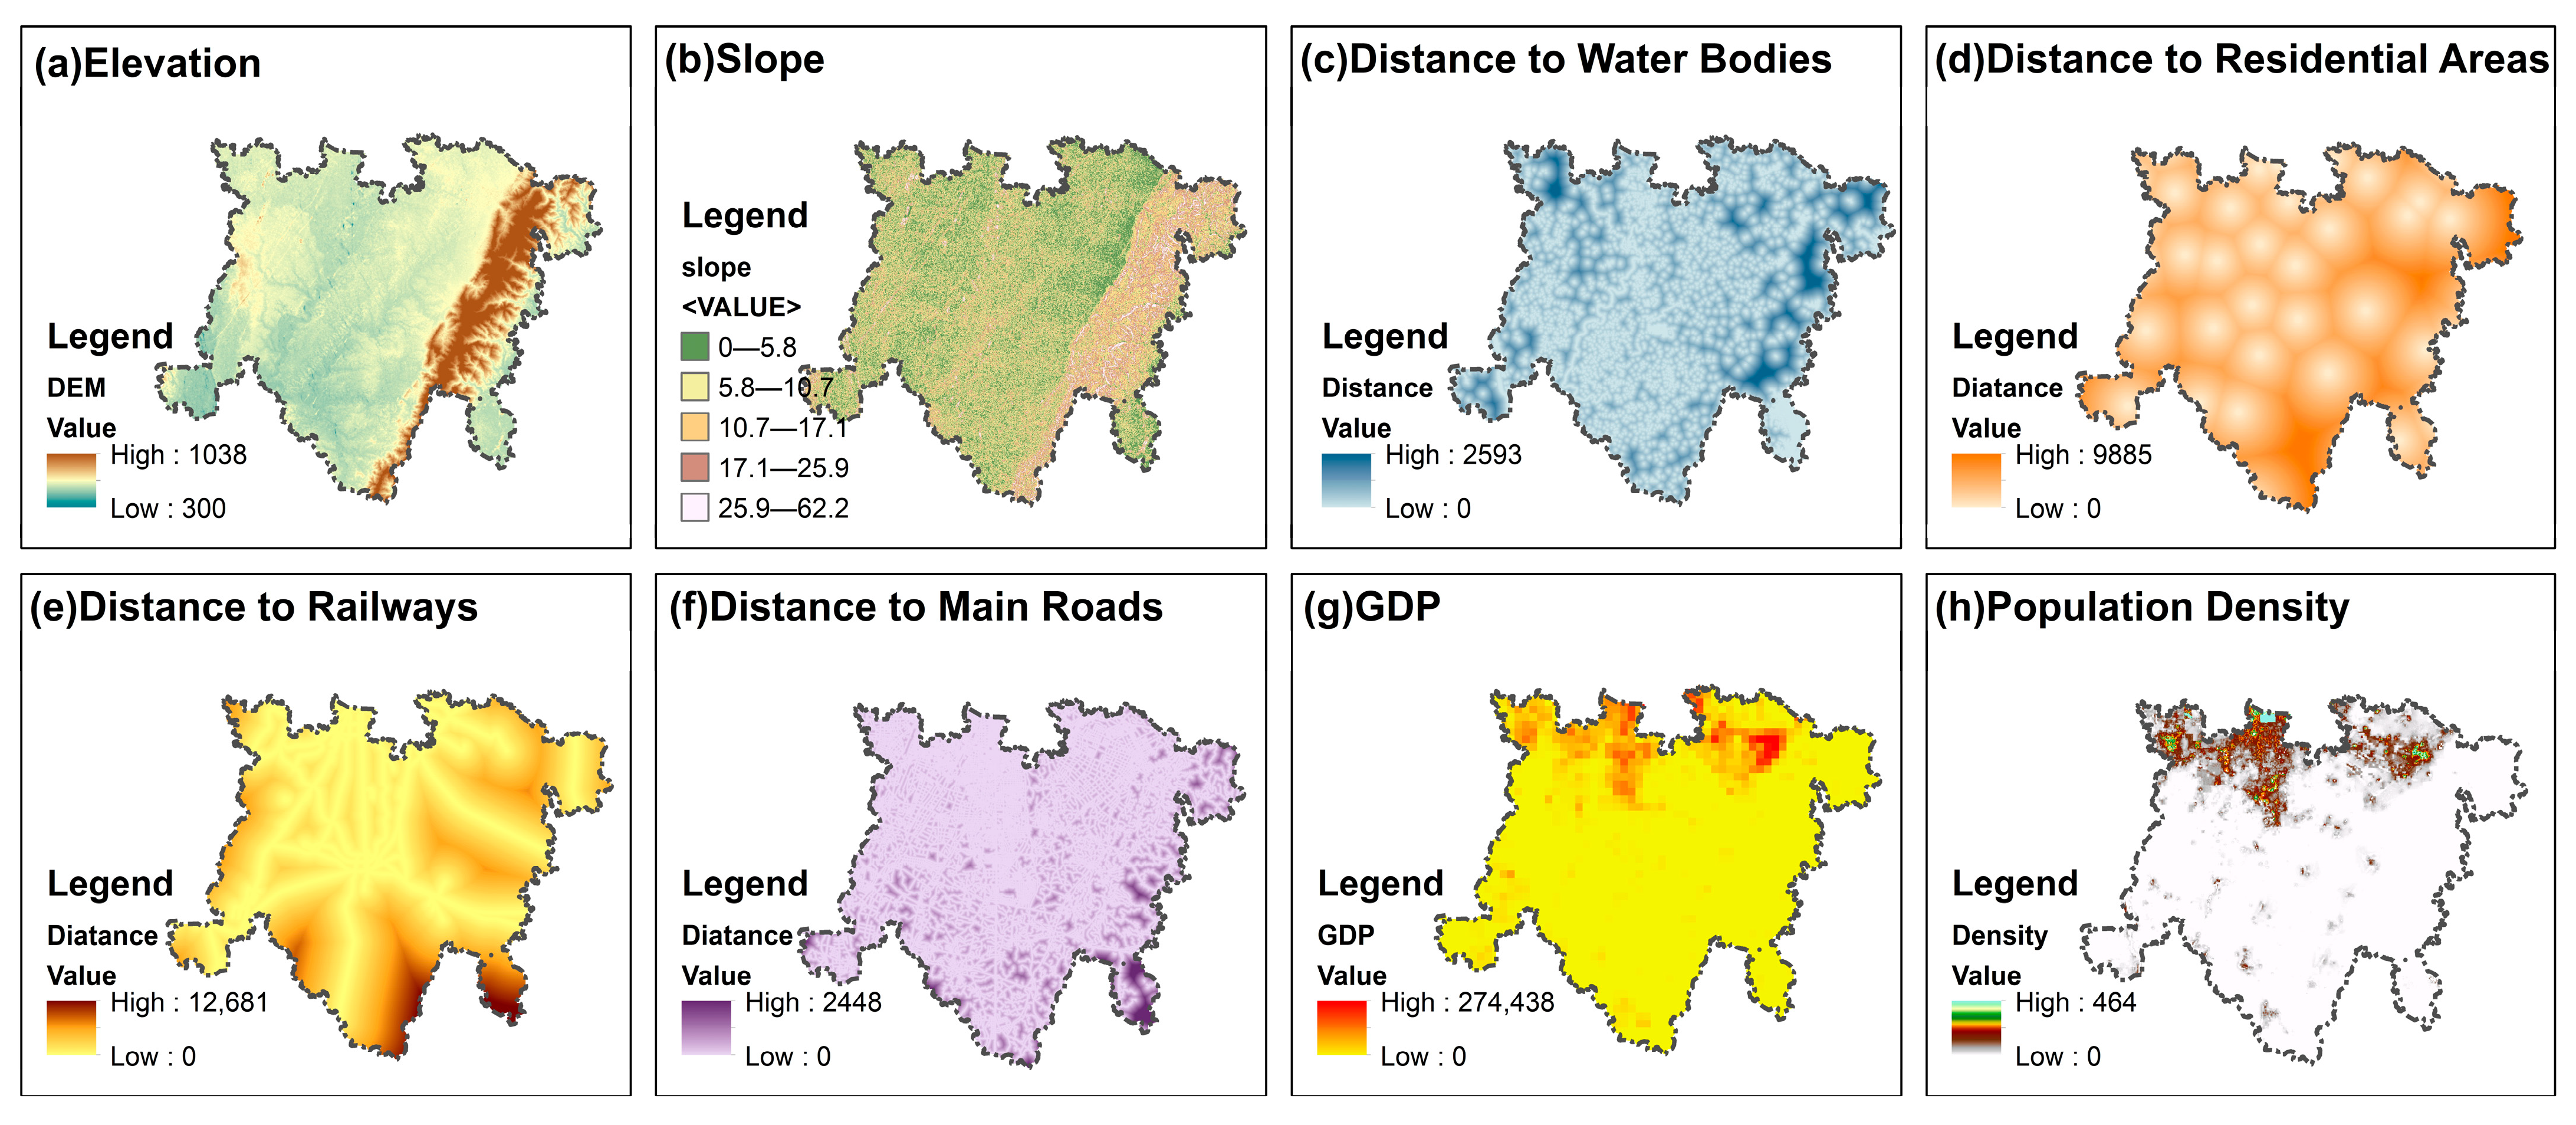
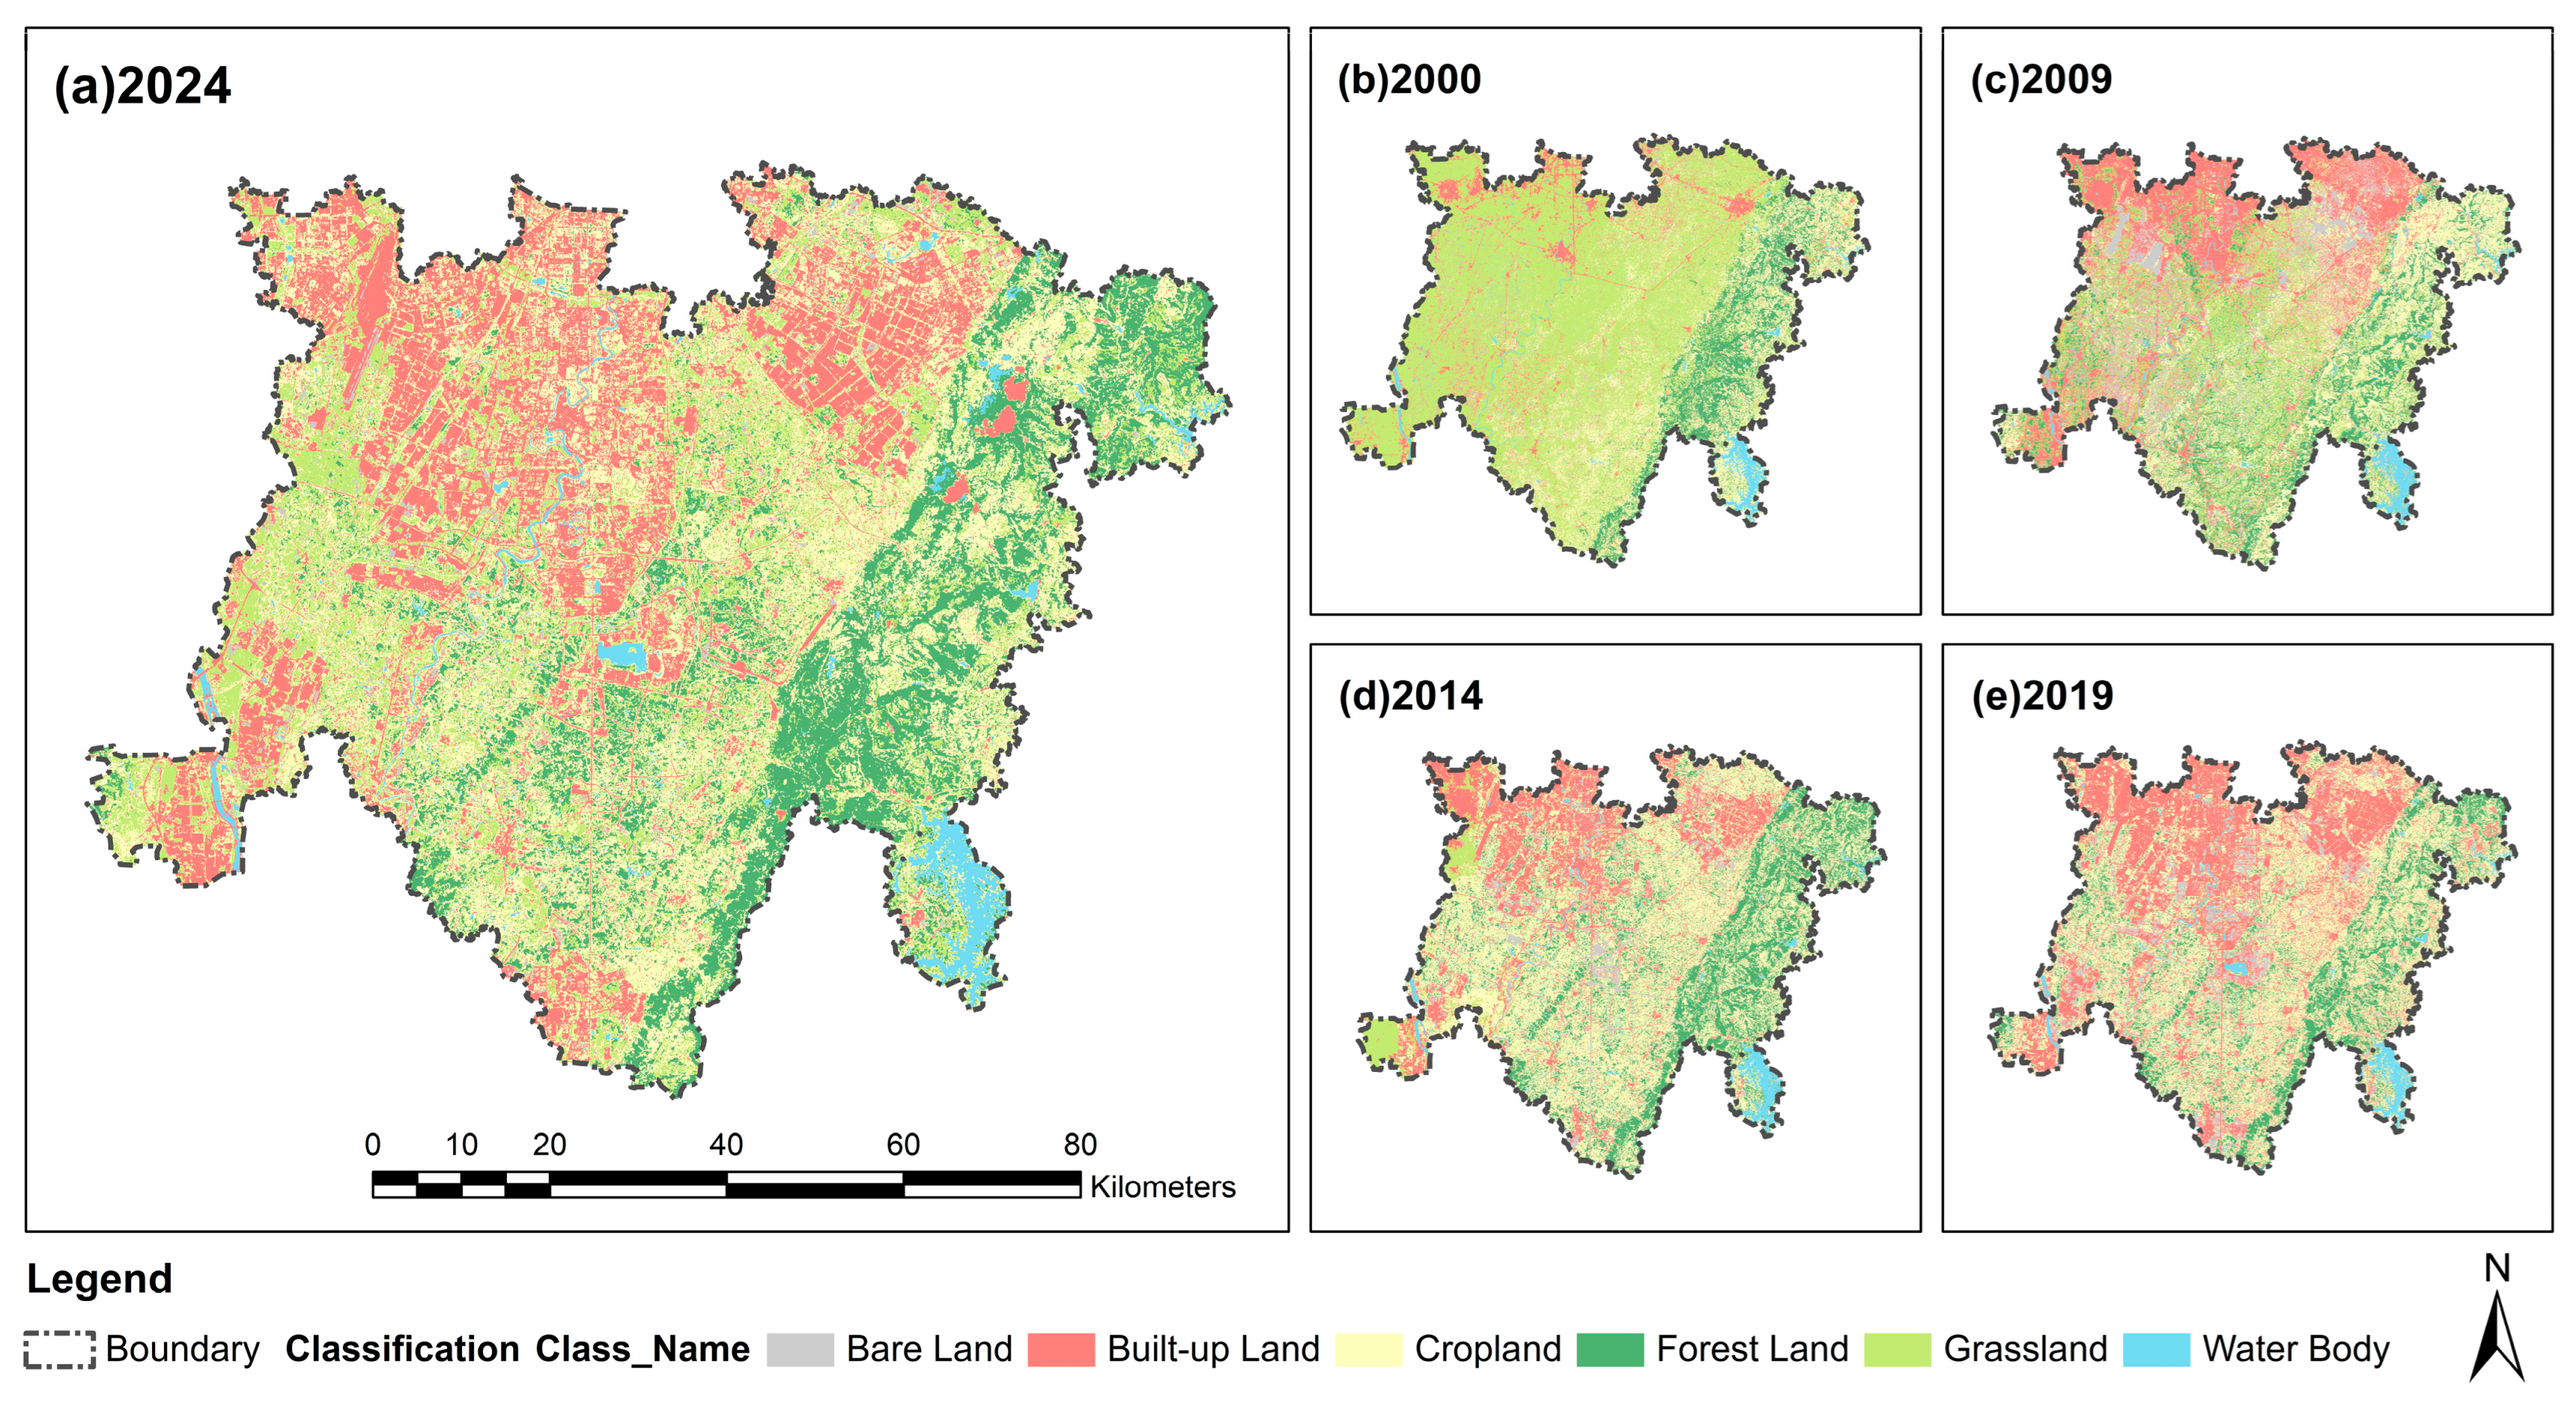
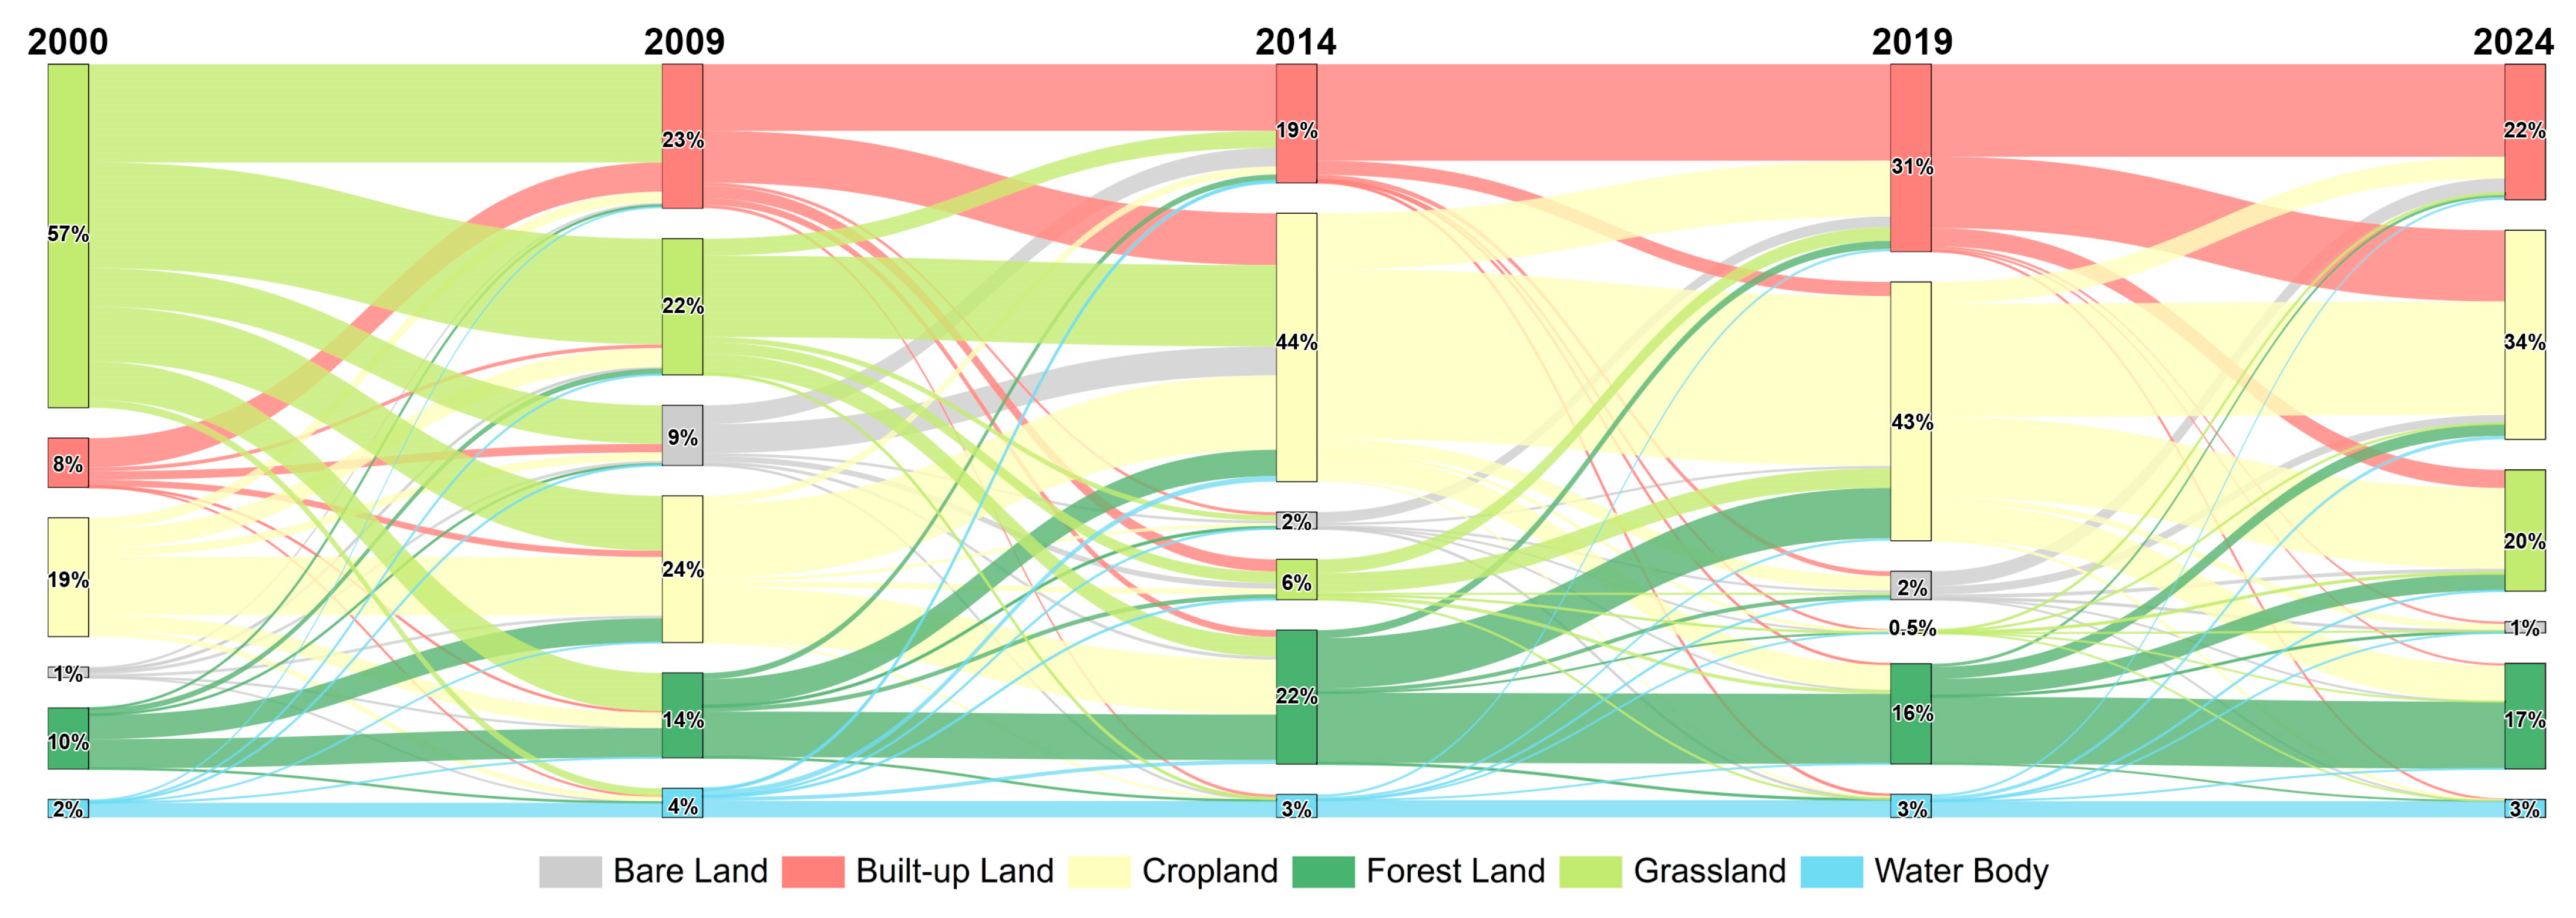
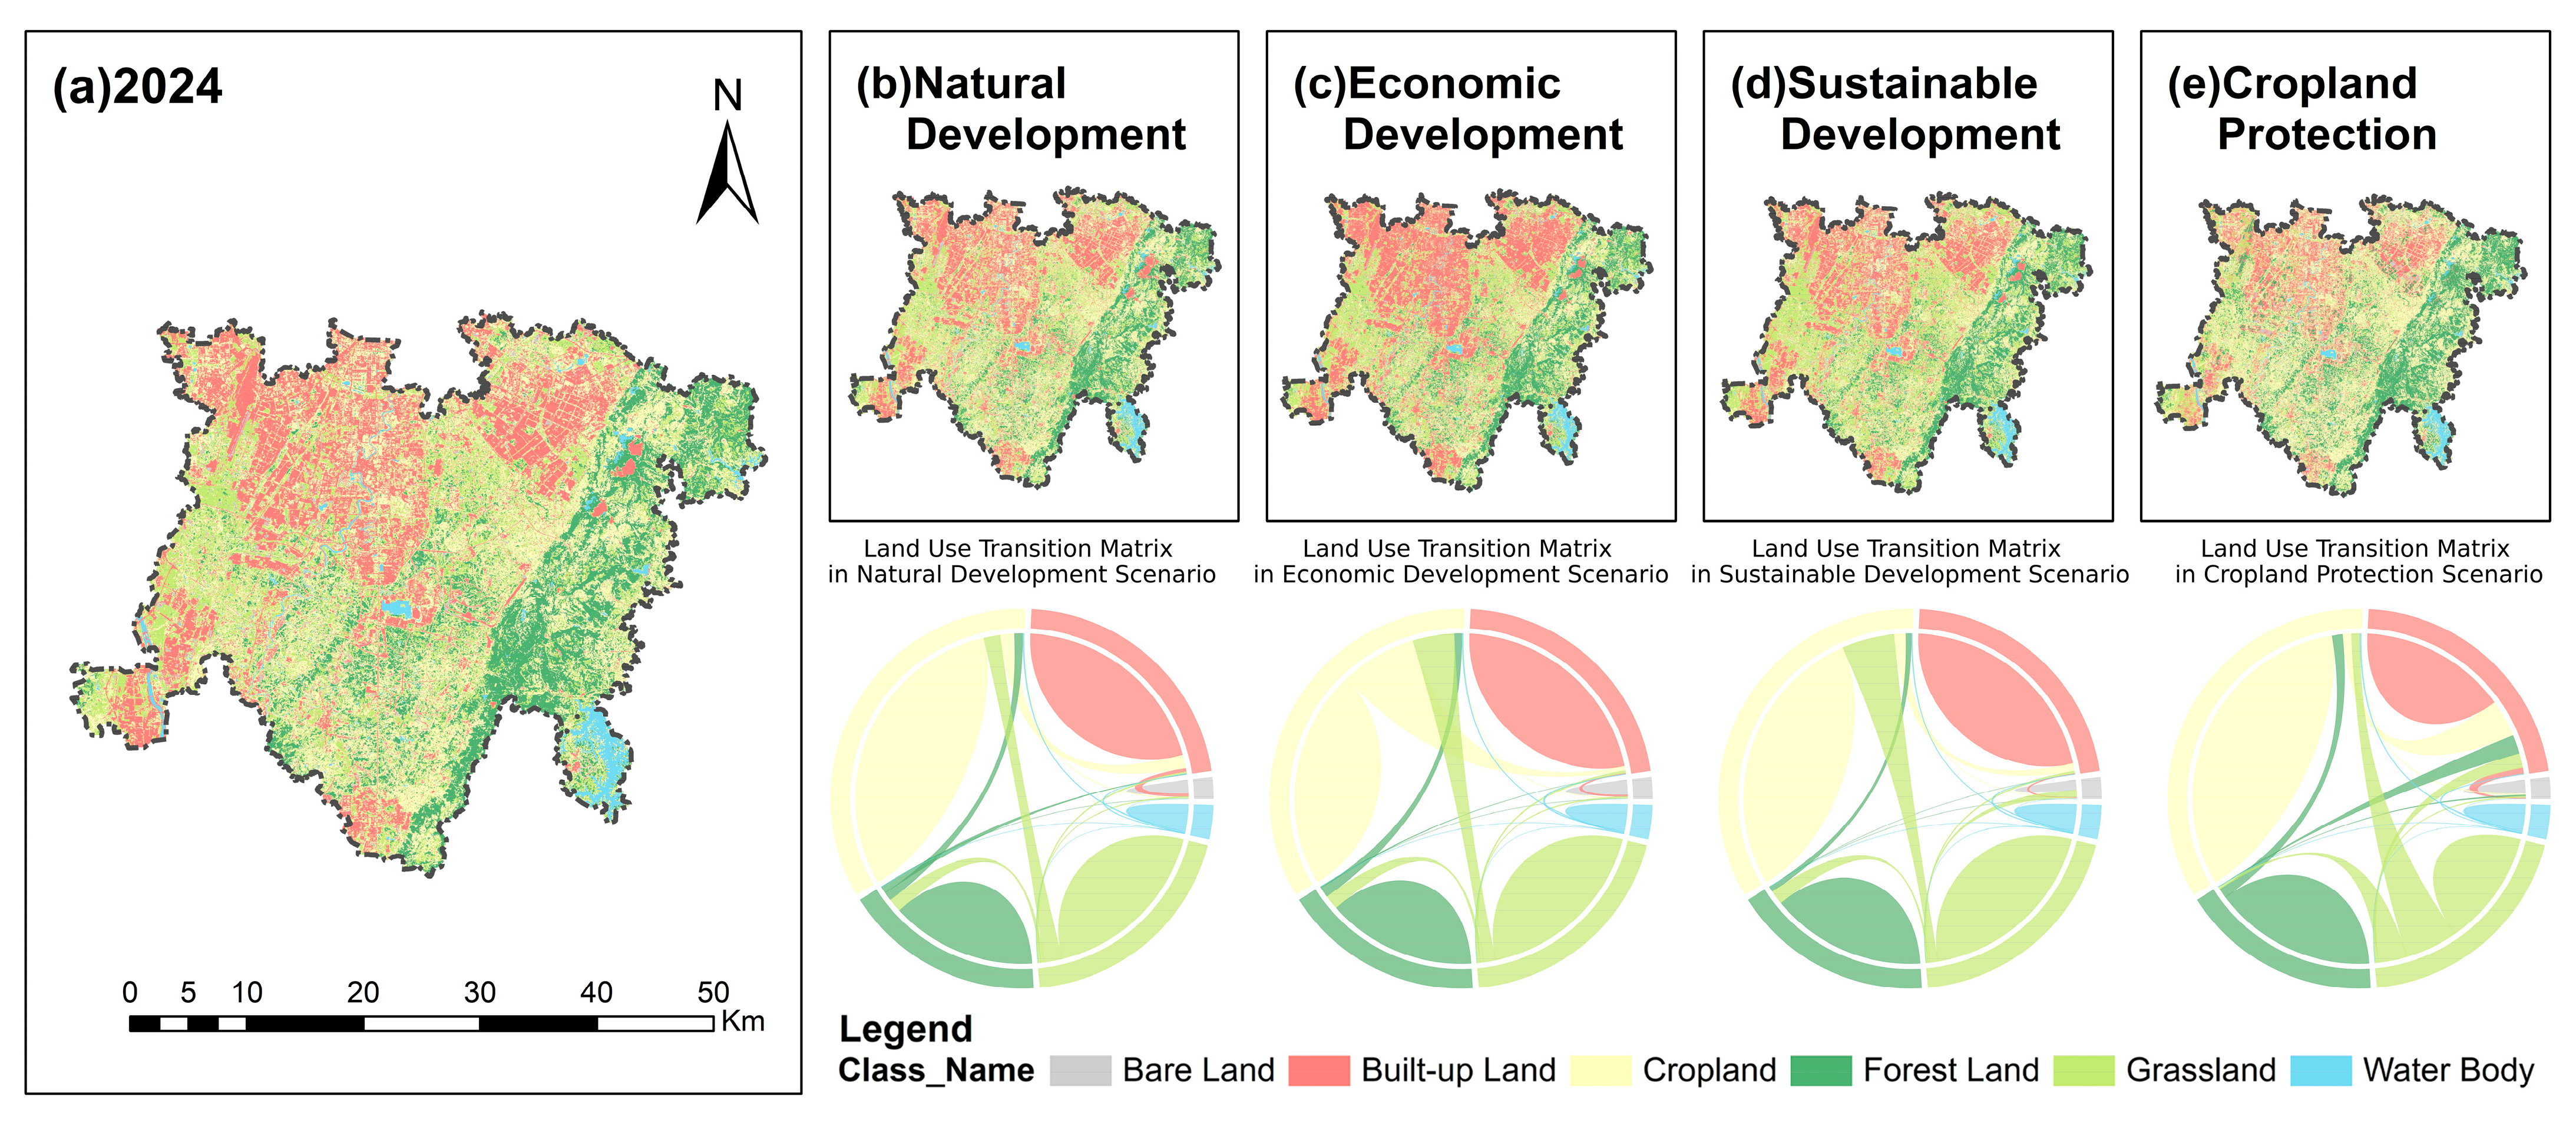
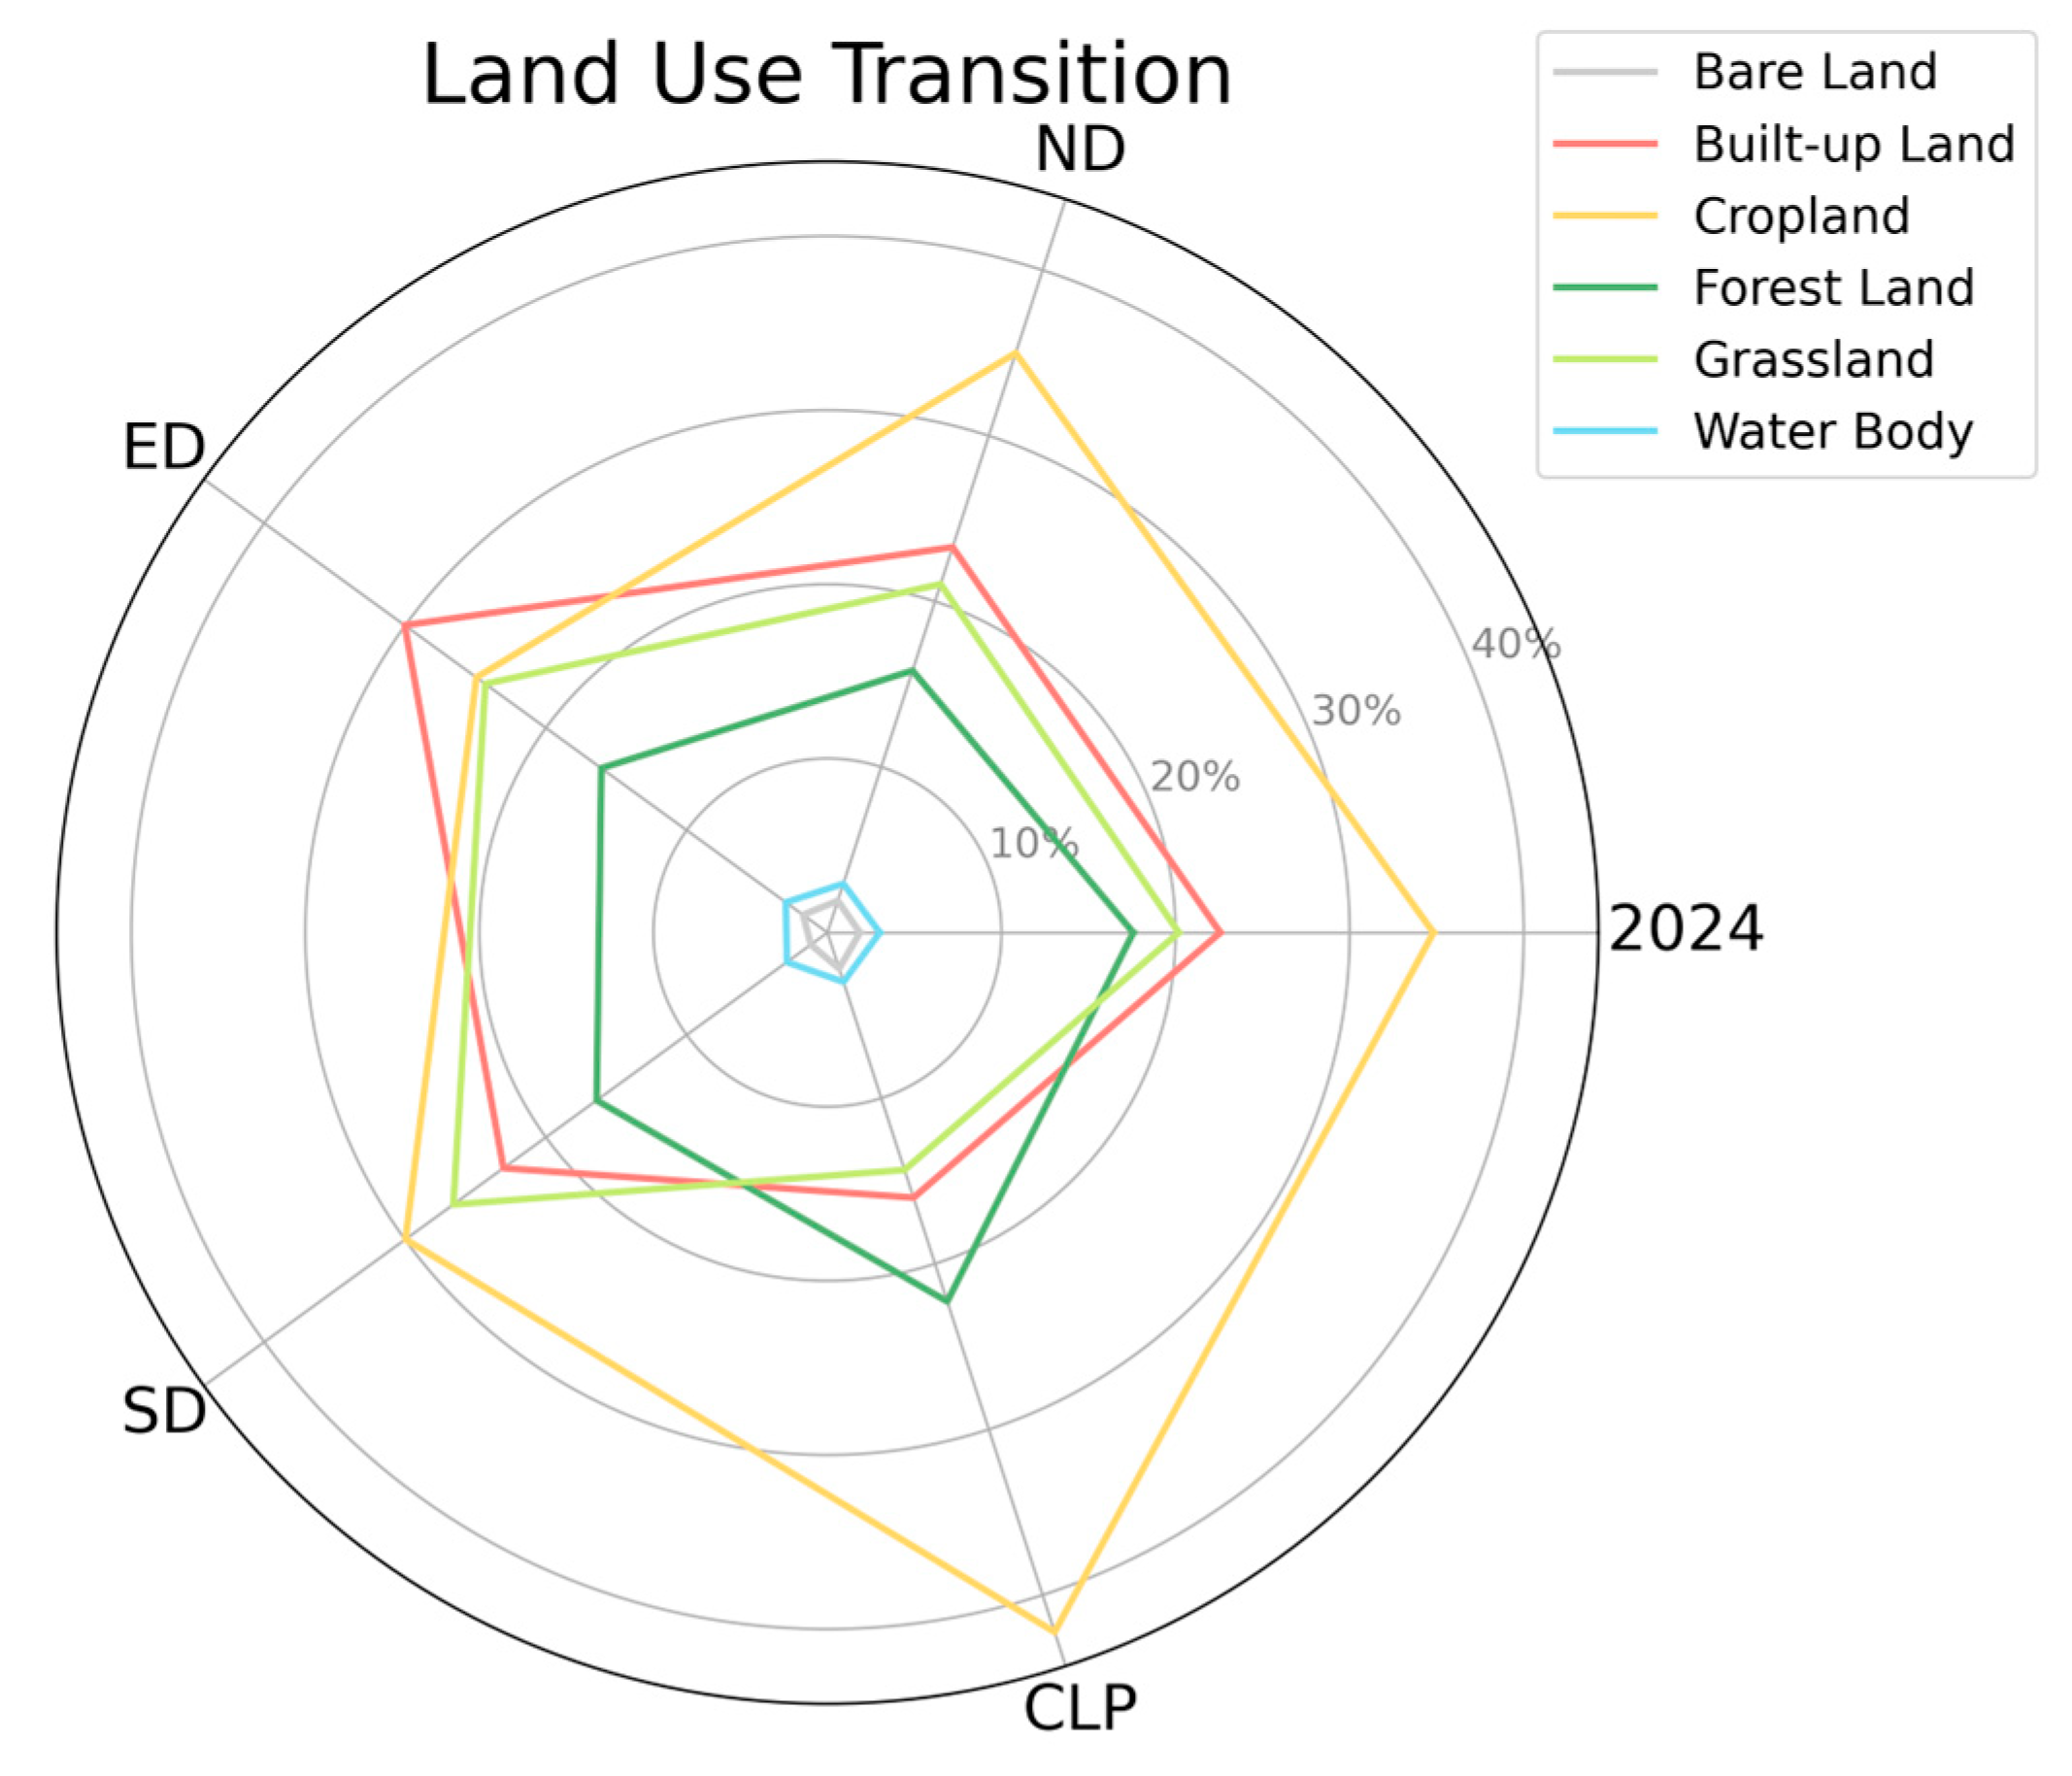

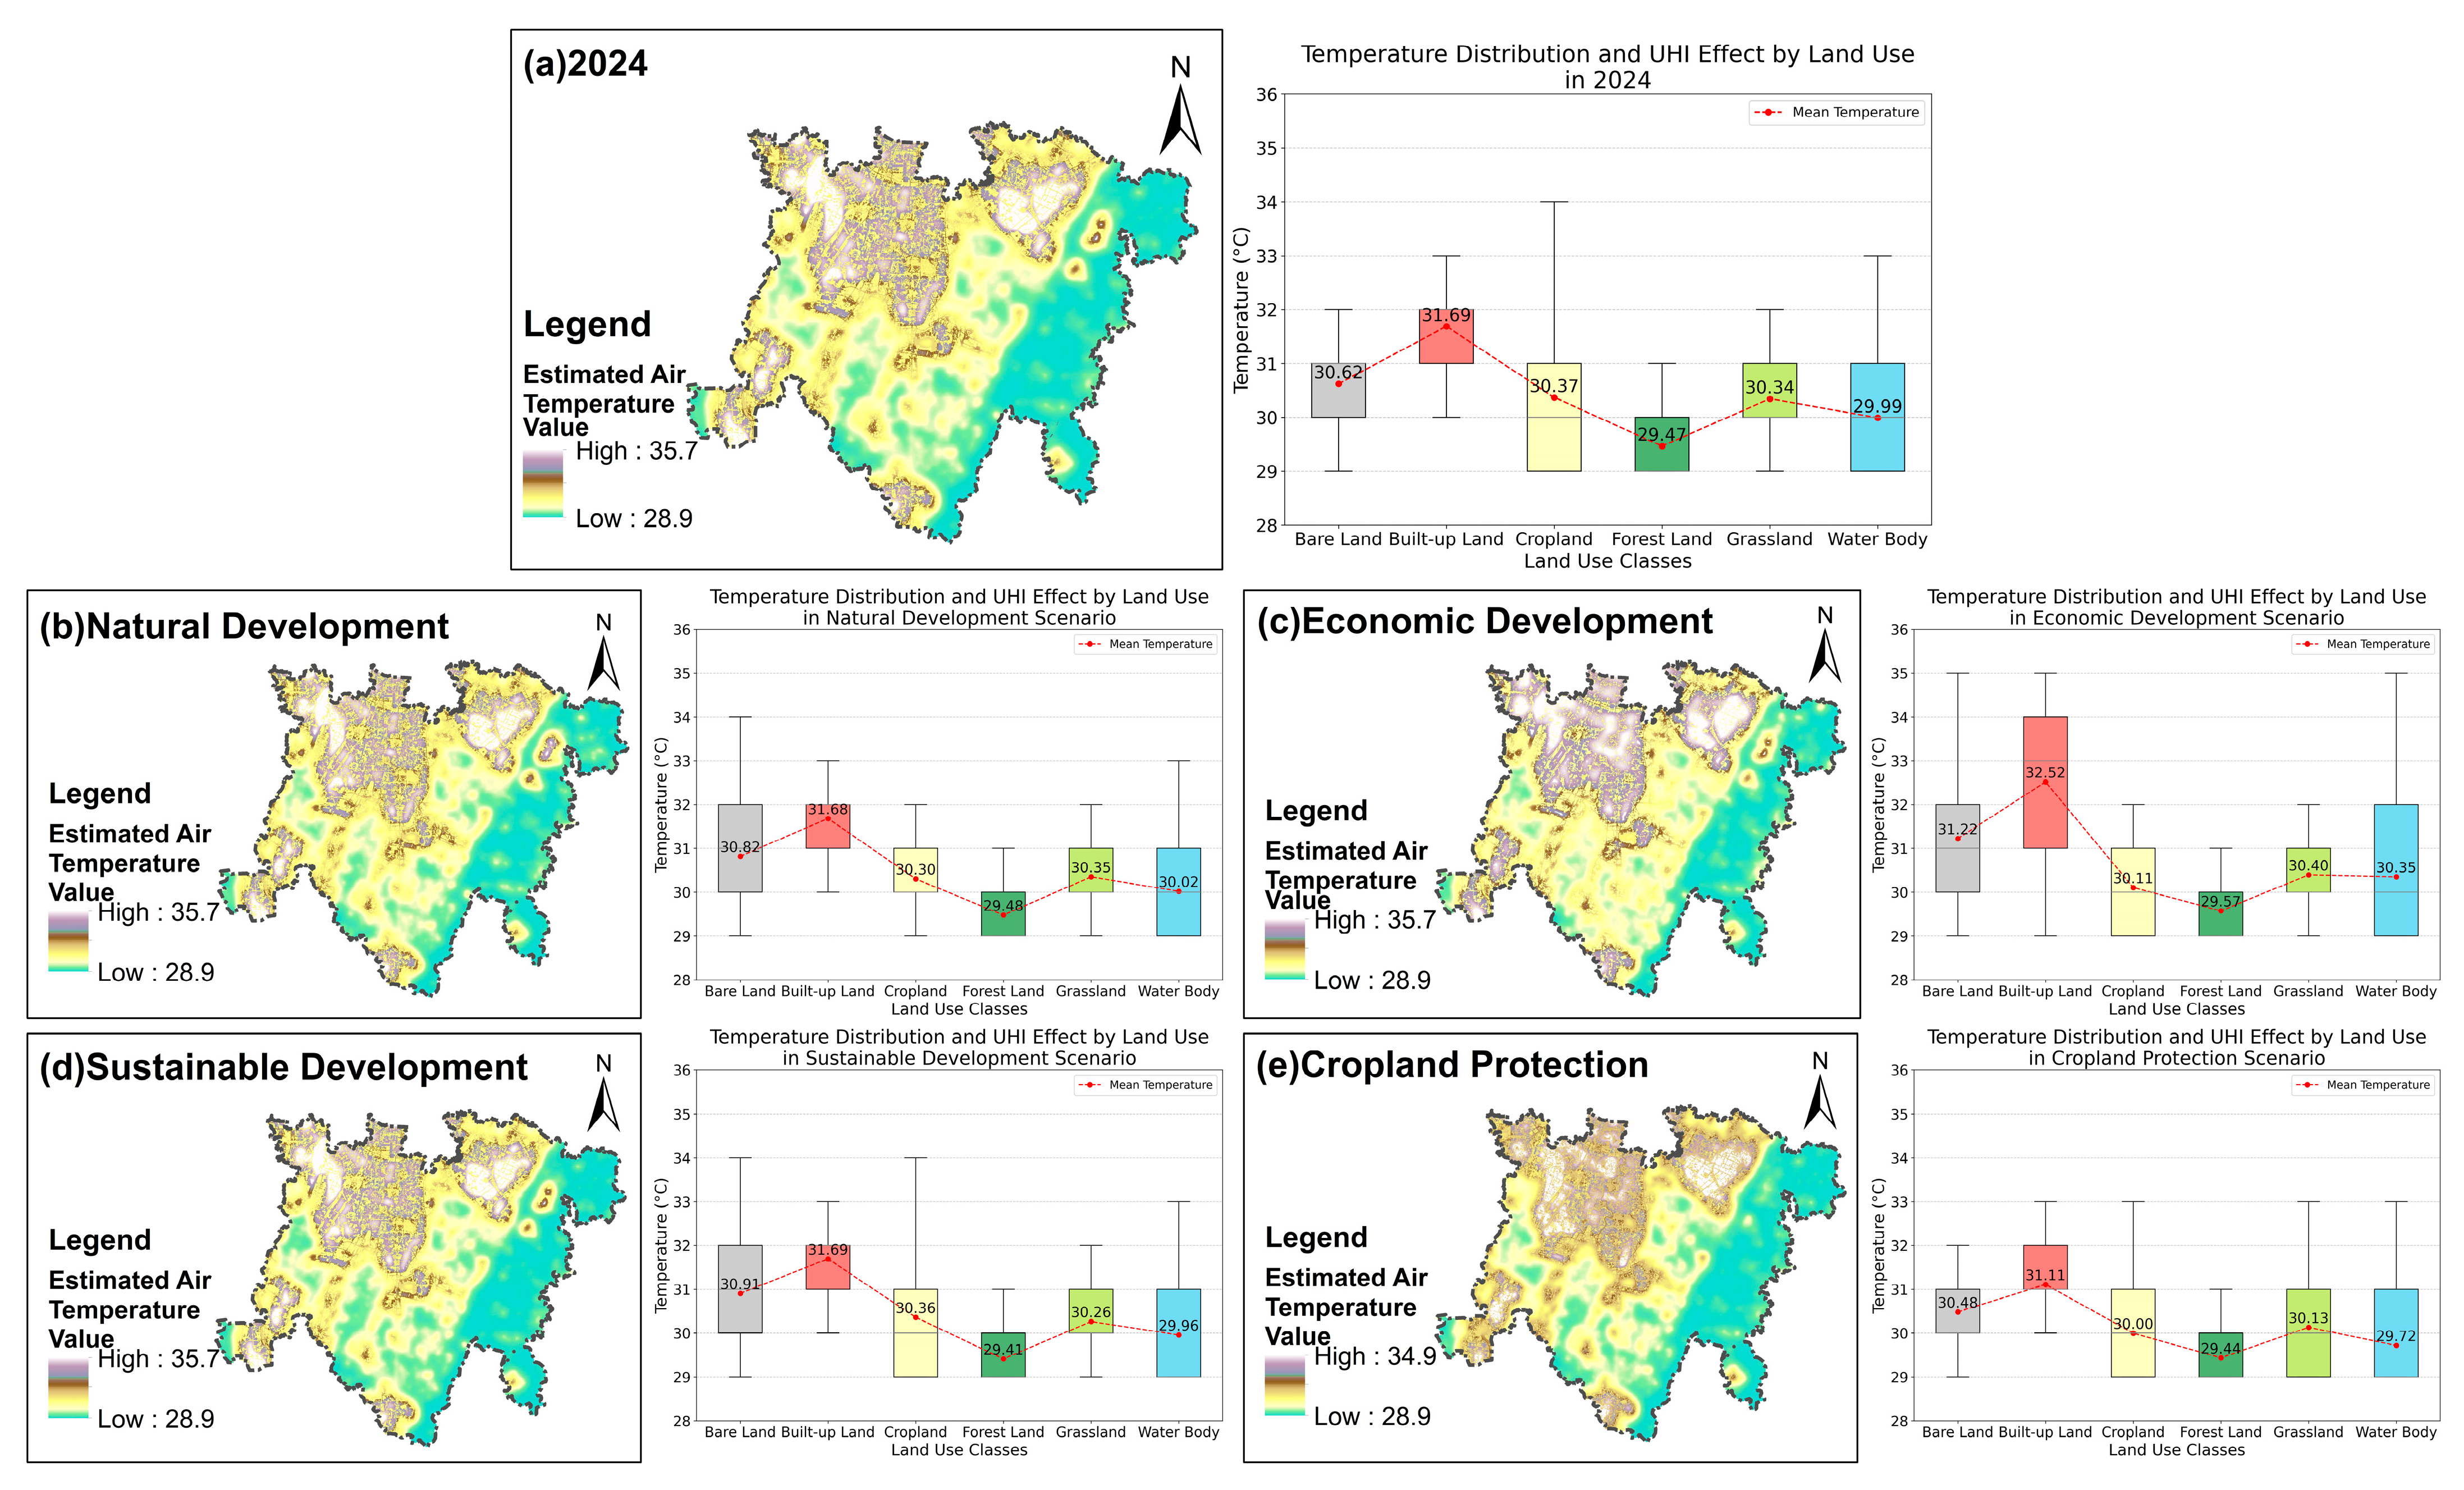
Disclaimer/Publisher’s Note: The statements, opinions and data contained in all publications are solely those of the individual author(s) and contributor(s) and not of MDPI and/or the editor(s). MDPI and/or the editor(s) disclaim responsibility for any injury to people or property resulting from any ideas, methods, instructions or products referred to in the content. |
© 2025 by the authors. Licensee MDPI, Basel, Switzerland. This article is an open access article distributed under the terms and conditions of the Creative Commons Attribution (CC BY) license (https://creativecommons.org/licenses/by/4.0/).