Article

Spatiotemporal Characteristics and Decoupling Effects of Urban Construction Land Expansion in Plateau Basins

1
School of Earth Sciences, Yunnan University, Kunming 650500, China
2
School of Architecture and Urban Planning, Yunnan University, Kunming 650500, China
3
Southwest United Graduate School, Kunming 650092, China
*
Author to whom correspondence should be addressed.
These authors contributed equally to this work.
Land 2025, 14(4), 685; https://doi.org/10.3390/land14040685
Submission received: 27 December 2024 / Revised: 3 March 2025 / Accepted: 17 March 2025 / Published: 24 March 2025
(This article belongs to the Special Issue Local and Regional Planning for Sustainable Development)

Abstract

:
The expansion of construction land is a key feature of urbanization. Understanding its spatiotemporal evolution in Yunnan’s plateau basins is crucial for minimizing resource waste and promoting coordinated regional development. This study employs land use and nighttime light data to analyze the spatiotemporal dynamics of construction land expansion and its decoupling from economic growth, using various indices and the Tapio decoupling model. The results reveal a steady rise in urban construction land from 1990 to 2020, characterized by significant spatial variations in expansion speed and intensity. Edge expansion predominated throughout all periods, accounting for over 50% in most regions. After 2010, expansion spread into smaller basins, markedly increasing the number of areas experiencing new expansion. The decoupling between construction land expansion and economic growth in these basins remains primarily weak and unstable, indicating a strong reliance on land for economic development. Factors such as socioeconomic conditions, geography, ecology, and policy influence both land expansion and economic growth, highlighting the interdependence between the two. These findings provide a foundation for sustainable basin development and offer valuable insights for planning and policy-making.

1. Introduction

Since the initiation of economic reforms in 1978, China has undergone rapid urbanization. By the end of 2024, within the framework of new-type urbanization, China’s permanent urban population reached 943.5 million, with the urbanization rate of permanent residents reaching 67.00%. The continuous migration of rural populations to urban areas, coupled with unprecedented rates of urban expansion, has led to a growing demand for land resources [1]. This rapid urbanization process has exacerbated the imbalance between the supply and demand for land resources [2], resulting in issues such as encroachment on arable land [3], resource shortages, and ecosystem destruction [4], which significantly affect healthy urban development and risk repeating the mistakes of disorderly sprawl observed in developed countries. Construction land is a vital foundation for socioeconomic activities, playing a pivotal role in supporting urbanization. Therefore, systematically analyzing the urbanization process and thoroughly investigating the development of urban construction land are essential for achieving intensive land use, which is crucial for regional sustainable economic development, ecosystem stability, and food security [5].
Current academic research on the expansion of urban construction land primarily addresses four key aspects: (1) describing the fundamental phenomena of construction land expansion and analyzing its spatiotemporal variation; (2) investigating the driving mechanisms of construction land expansion through causal relationships with various social, economic, and ecological factors; (3) measuring the decoupling relationship between construction land expansion and indicators such as economic development, population changes, and carbon emissions; and (4) predicting future expansion scenarios based on the current state of construction land expansion. Some scholars suggest that construction land expansion follows a trajectory of “slow growth → rapid growth → stable growth” [6], influenced by factors such as economic development levels, urban population size, land policies, and natural environmental conditions [7]. Studies also indicate that construction land expansion consumes large areas of land, alters urban landscape structures, and exerts pressure on urban food security and ecosystem stability [8]. Furthermore, research indicates that both urban population growth and GDP increases contribute to the continuous expansion of construction land, while urban expansion, in turn, fosters population agglomeration and stimulates GDP growth. The lack of coordination between these factors causes unhealthy urbanization development, prompting numerous scholars to investigate and discuss the relationship between the two [9,10]. Researchers have utilized models like gravity center models and Tapio decoupling indices to measure the spatial coupling and decoupling states between construction land expansion and economic growth, exploring the spatial–temporal evolution characteristics and coupling–decoupling trends. During the “12th Five-Year Plan” period, there was primarily a “weak decoupling” state between construction land and economic development [11]. Subsequently, researchers have used advanced simulation techniques, including Markov chains, cellular automata [12], and PLUS models [13], to project future scenarios of construction land expansion, providing evidence-based recommendations for sustainable development based on these simulations.
With the rapid socioeconomic development and improvements in transportation infrastructure, construction land expansion has increasingly transcended administrative boundaries. Recent studies have examined the spatial–temporal characteristics and influencing factors of this cross-boundary expansion, revealing urban spatial development patterns and regional variations. These studies aim to optimize territorial spatial configurations across administrative regions and promote coordinated regional development [14]. Other scholars have focused on the expansion of construction land around high-speed rail stations in Hainan Province, analyzing factors related to station attributes, locational conditions, socioeconomic environments, and natural landscapes [15]. Notably, these studies use nighttime light imagery in conjunction with population and GDP data, employing remote sensing inversion and econometric regression analysis to estimate population density and GDP density as indicators of socioeconomic development. Estimating provincial economic development is a complex task. Traditional statistical data may be prone to human bias at various stages. In contrast, nighttime light brightness values offer a more objective measurement [16]. In addition to using statistical data to measure economic growth, some scholars have employed nighttime light intensity as a proxy for economic development levels [17,18]. Nighttime light remote sensing data, which reflects urban prosperity through light intensity and transcends administrative boundaries, has significantly advanced theoretical research in regional economics as well as spatial and urban economics [19]. This approach provides more effective methods for evaluating economic development in geographically distinct areas that span administrative entities.
Previous studies have frequently concentrated on individual administrative units, neglecting unique geographical areas that span multiple administrative boundaries. As typical unique geographical units, the basins in Yunnan face challenges related to urban expansion and inefficient land use patterns. Located in a mountainous plateau where mountains cover 93.29% of the area, only 6.71% of the region’s basins are suitable for urbanization. The basins of the Yunnan–Guizhou Plateau, characterized as small mountain basins or relatively flat areas [20], compensate for the absence of large plains in the plateau and serve as political, economic, and cultural hubs. While existing research primarily focuses on classification methods, causes, and types of basins in southwestern regions [21], the processes and driving mechanisms behind urban construction land expansion in Yunnan’s plateau basins remain underexplored.
Therefore, this study introduces innovations in both the research focus and methodology: (1) it selects unique geographical units that transcend administrative boundaries as the study area, calculating indicators such as expansion speed, expansion intensity, and landscape expansion index (LEI) to characterize the spatiotemporal dynamics and patterns of construction land expansion in Yunnan’s basins; and (2) by adopting carbon sink allocation methods, this study integrates nighttime light data with Yunnan’s GDP to jointly assess the economic development level of basins irrespective of administrative divisions. It also employs the Tapio decoupling model to calculate elastic decoupling coefficients, thereby examining the correlation between construction land expansion and economic development while analyzing decoupling states at both basin and regional scales. The research findings will offer empirical evidence for studying unique geographical spaces that span administrative boundaries, providing a theoretical foundation for optimizing territorial spatial patterns across administrative regions as well as advancing coordinated and sustainable regional development.

2. Data Sources and Research Methods

2.1. Study Area

Yunnan Province (abbreviated as “Dian”) is situated in Southwestern China, with a predominantly mountainous and plateau terrain (Figure 1). The highlands and mountains are oriented in an east–west parallel pattern, forming a geomorphological layout that can be described as “mountains in the west and plains in the east”. Plateau mountainous areas cover approximately 93.29% of Yunnan’s total area, with rugged terrain featuring high mountains, valleys, and widely distributed basins and lakes. Basins alone account for 6.71% of the province’s total area. Due to their higher development potential compared with mountainous and plateau terrains, basins have emerged as a unique geomorphological feature with specific research significance in Yunnan. According to the third national land survey, 22% of Yunnan’s cultivated land is located in basins, and approximately 85% of urban construction land is situated within these basins, highlighting the growing scarcity of land resources in these areas. Based on data availability, 352 basins were selected for this study after screening. Yunnan was then divided into six regions—Central Yunnan, Western Yunnan, Northwestern Yunnan, Southwestern Yunnan, Northeastern Yunnan, and Southeastern Yunnan—considering both natural and human factors, followed by regional-scale analyses.

2.2. Data Sources and Processing

The data utilized in this study, as detailed in Table 1, spans the period from 1990 to 2020. This study employs long-term land use data sourced from the Resources and Environmental Science Data Center of the Chinese Academy of Sciences. The dataset’s classification system follows a three-level structure, with the first level categorizing land based on its resources and utilization attributes, including cultivated land, forest land, grassland, water bodies, construction land, and unused land. Urban construction land was delineated using the land use classification table and clipped to the boundaries of the study basins. All spatial data were standardized to the WGS_1984_UTM_47N coordinate system. For consistency in research accuracy during the impact factor analysis, all datasets were resampled to a uniform 500 m × 500 m resolution. GDP data were obtained from the Yunnan Province Statistical Yearbook. The economic development level within the basins was quantified by multiplying the ratio of total nighttime light intensity within the basins relative to that of Yunnan Province by the provincial GDP. This method helps to minimize annual variations in statistical quality and precision.

2.3. Research Method

2.3.1. Definition and Identification of Basins

The term “basin” refers to a specific type of small geomorphological feature in Yunnan Province, characterized by relatively low-lying areas surrounded by higher elevations. These features encompass medium and small mountain basins, river terrace plains, alluvial plains, wide valleys, and low hills, with slopes typically ranging from 8° to 12° [22]. The rapid socioeconomic development in Yunnan Province has led to intensive exploitation and utilization of these basins, impacting both their internal and peripheral regions. Building on this definition and considering the implementation of Yunnan Province’s “mountain towns” policy [23], this study defines basins as areas with slopes of less than 12° and an area exceeding 1 km2 [24]. ArcGIS (version 10.8) was used to extract slope data from a 30 m resolution DEM, identifying contiguous areas with slopes of less than 12° and an area no smaller than 1 km2 across Yunnan Province. The boundaries of these basins were subsequently refined using high-resolution imagery maps of Yunnan Province to ensure accuracy. This method enables the precise delineation of basins suitable for urban development under the unique topographical conditions of Yunnan, incorporating both natural and policy-driven criteria.

2.3.2. Measurement of Economic Development Levels in Basins

Obtaining regional GDP data for non-administrative basins poses significant challenges. Previous studies have demonstrated a strong correlation between nighttime light intensity and regional GDP. By employing methods analogous to those used in carbon sink allocation calculations [25], this study utilizes nighttime light data and Yunnan Province’s GDP to assess economic development at the basin level. Specifically, the proportion of nighttime light intensity within each basin relative to the total provincial value is used to allocate GDP, thereby capturing regional differences. This method minimizes inconsistencies arising from annual variations in statistical standards, ensuring a more accurate and consistent portrayal of economic activity. The calculation equation is as follows:
E C i = d i D N j · G D P j
where ECi denotes the economic development level of the basin, DNj represents the total nighttime light intensity of the province, d indicates the light value of the basin, and i and j refer to the basin and the province, respectively.

2.3.3. Expansion Speed

The rate of urban construction land expansion denotes the average annual increment in construction land area during the study period, serving as a direct indicator of changes in urban land use. The equation for calculating this rate is as follows:
U i = S i t 2 S i t 1 Δ T
where Uj represents the expansion rate of basin i over a certain period; S i t 1 and S i t 2 denote the construction land area at times t1 and t2 for basin i, respectively; and ∆T represents the number of years between t1 and t2.

2.3.4. Expansion Intensity

The intensity of urban construction land expansion is defined as the proportional change in the expanded construction land area relative to the total urban land area over the study period. The calculation equation is as follows:
U j = S j t 2 S j t 1 S × 1 Δ T
where Uj represents the expansion intensity of basin j during a certain period; S j t 1 and S j t 2 denote the construction land area of basin j at the time t1 and t2, respectively; S represents the area of the study region; and ∆T is the number of years between t1 and t2.

2.3.5. Landscape Expansion Index

The landscape expansion index (LEI) determines the type of expansion of new urban land patches by evaluating their spatial proximity to existing urban land patches [26]. Unlike methods such as land use transition matrices and spatial analysis, which focus on broader patterns, the LEI specifically identifies expansion patterns within individual basins and describes dynamic changes in land patches across multiple basins. The calculation equation is as follows:
L E I i = A i A 0 × 100
where LEI represents the expansion index of basin i, Ai denotes the overlapping area between the buffer zone of newly added construction land i in the basin and the original construction land, and A0 denotes the area of the buffer zone of newly added construction land in the basin.
The sensitivity analysis of the model’s parameters with respect to the buffer radius shows that the buffer radius exhibits greater stability in calculating the LEI. Based on the resolution of land use and elevation data, the buffer radius is set at 30 m. LEI values range from 0 to 100, where values from 0 to 50 signify marginal expansion, and values above 50 denote infilled expansion. A value of 0 specifically signifies newborn expansion.

2.3.6. Tapio Decoupling Model

“Decoupling” refers to the relationship between changes in interconnected systems. Common methods for decoupling analysis include the Kuznets curve, OECD indicators, and Tapio elasticity models. The Tapio decoupling model, which is widely used for analyzing “speed”-based decoupling, is favored because it considers both absolute and relative changes, as well as offers flexibility in defining the time period [27]. The equation is as follows:
β = % Δ C L % Δ E C = ( C L e n d C L s t a r t ) / C L s t a r t ( E C e n d E C s t a r t ) / E C s t a r t
where β represents the decoupling elasticity coefficient between construction land and economic development; CLstart and CLend represent the areas of construction land at the beginning and end of the period, respectively; and ECstart and ECend indicate the levels of regional economic development at the beginning and end of the period, respectively.
In empirical research, to prevent misinterpreting minor fluctuations in random variables as significant changes, the decoupling elasticity value is typically considered to be in a stable state when it falls within a ±20% range around 1.0 [28]. Using 0.8 and 1.2 as threshold values for the elasticity coefficient, decoupling can be categorized into eight distinct states. The specific classifications are outlined below (Table 2).

3. Result

3.1. Spatiotemporal Patterns, Mode Characteristics, and Influencing Factors of Construction Land Expansion in Basins

3.1.1. Analysis of Spatiotemporal Patterns of Construction Land Expansion in Basins

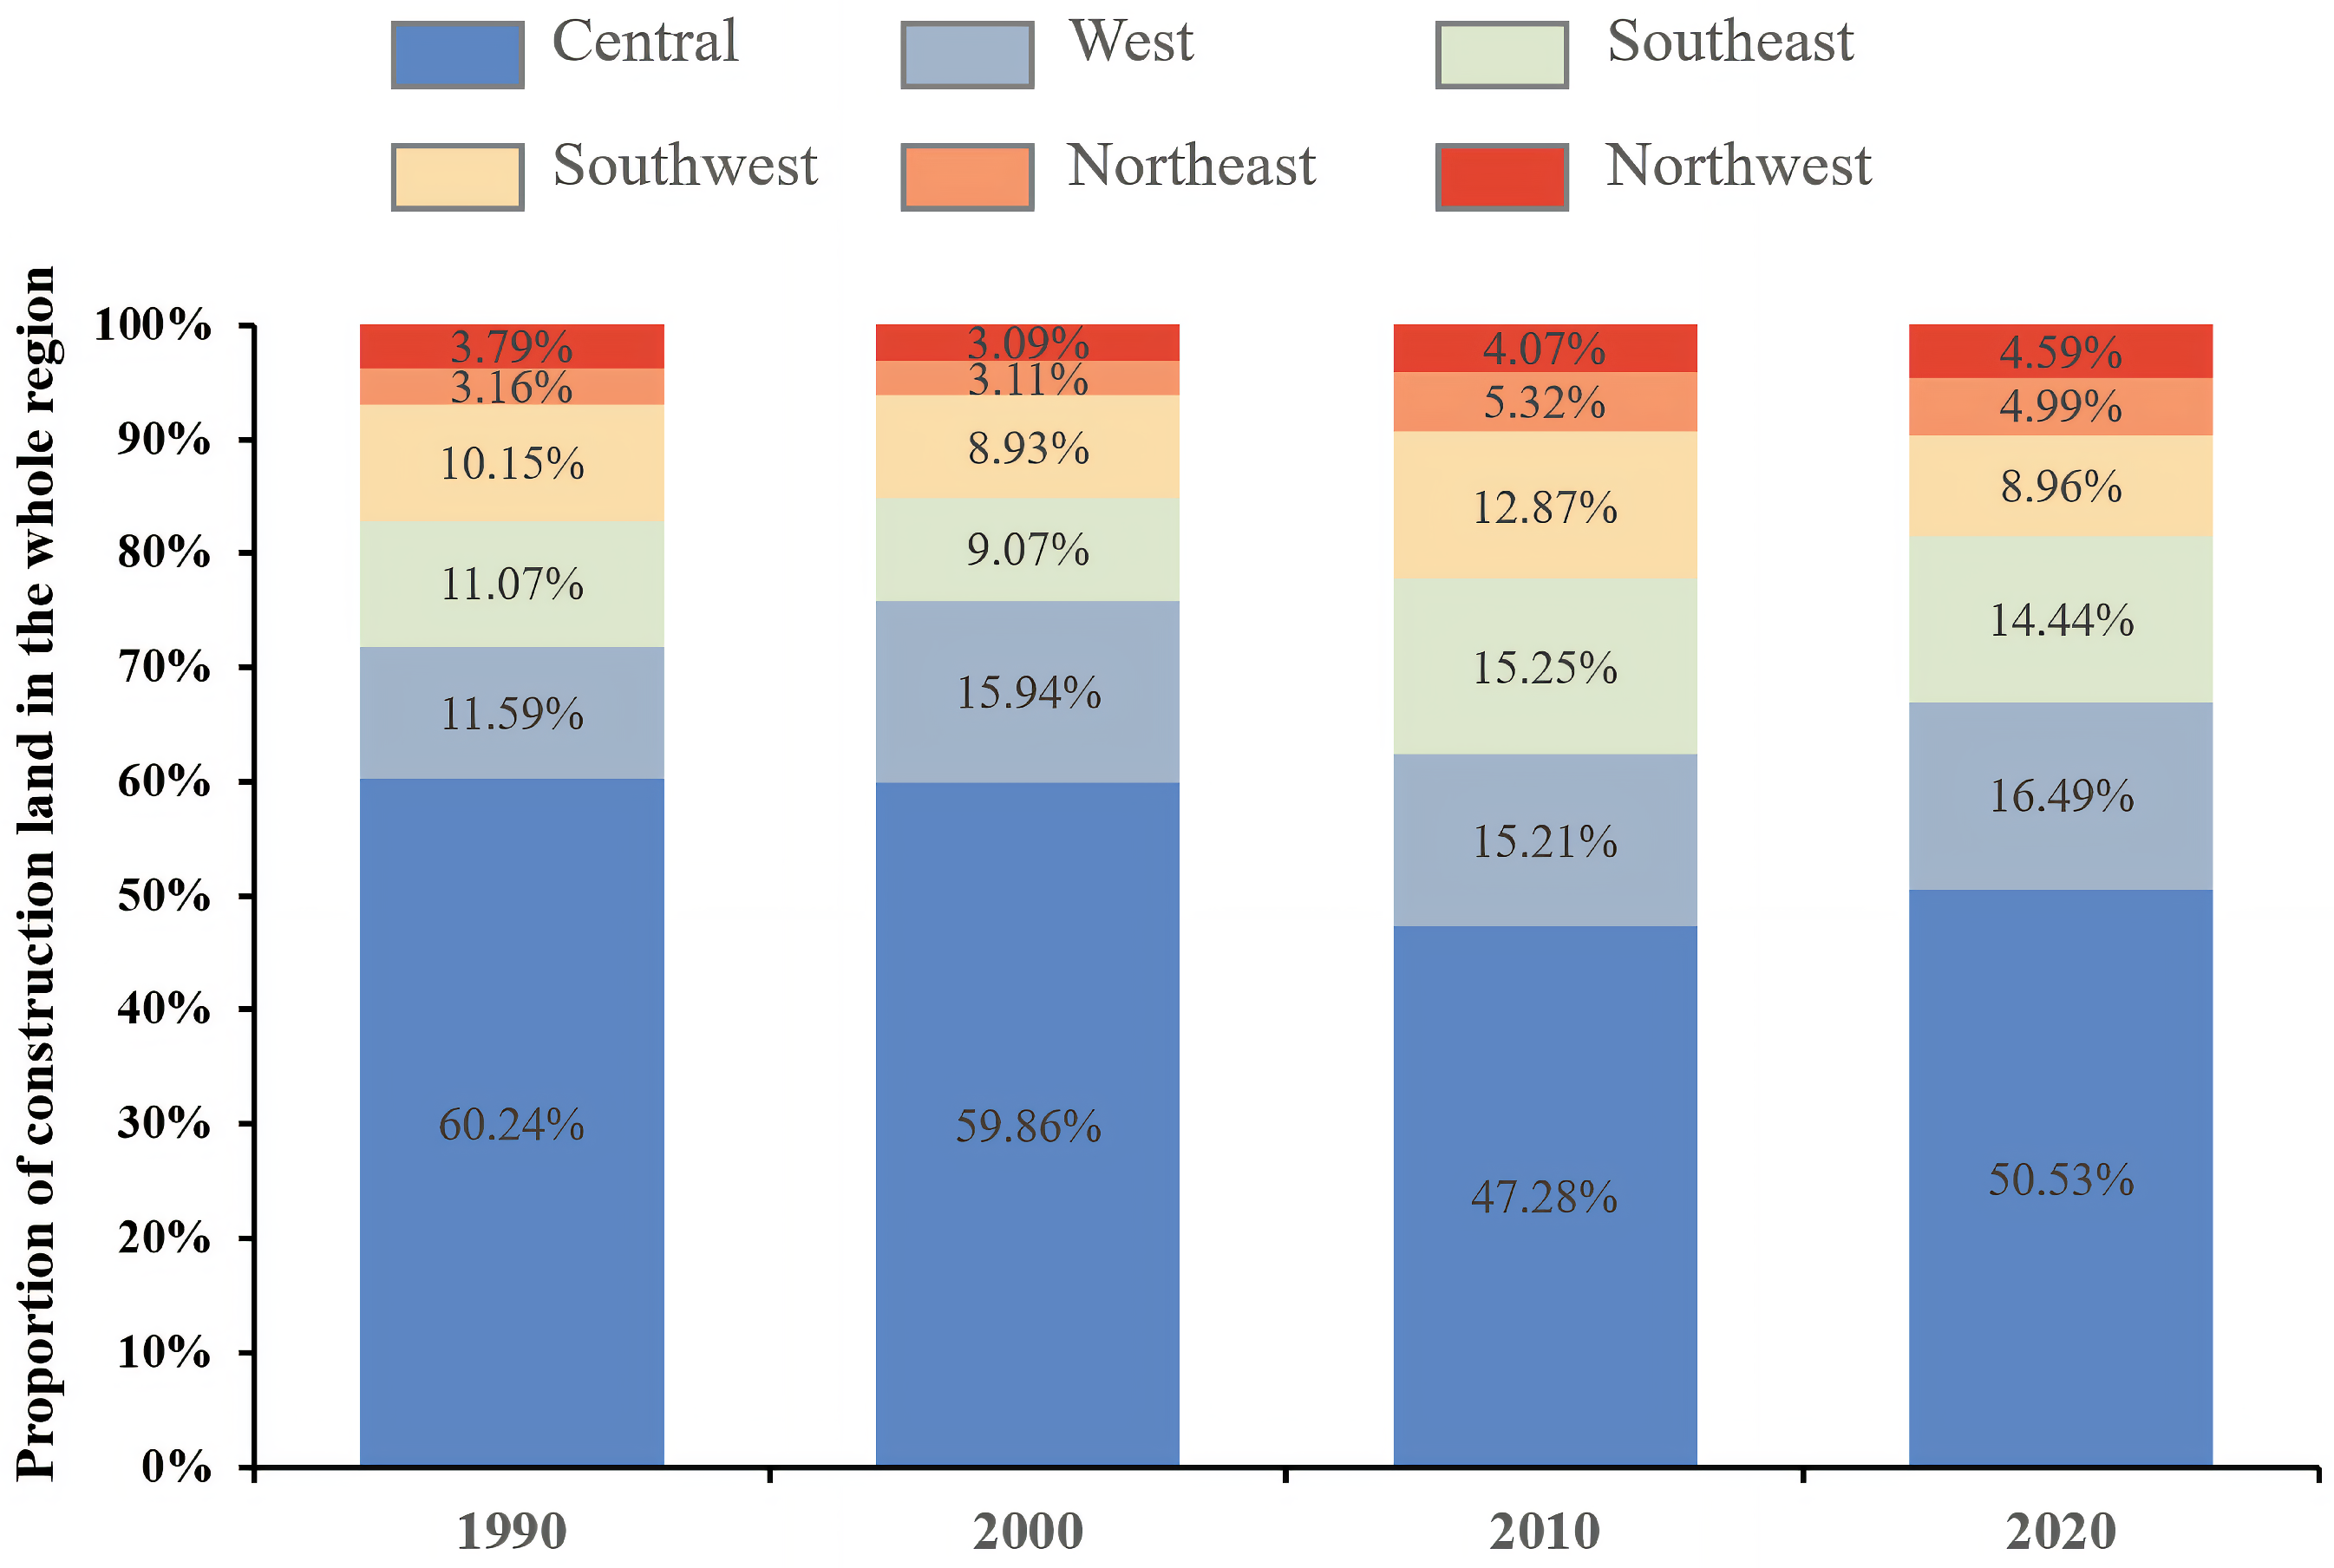
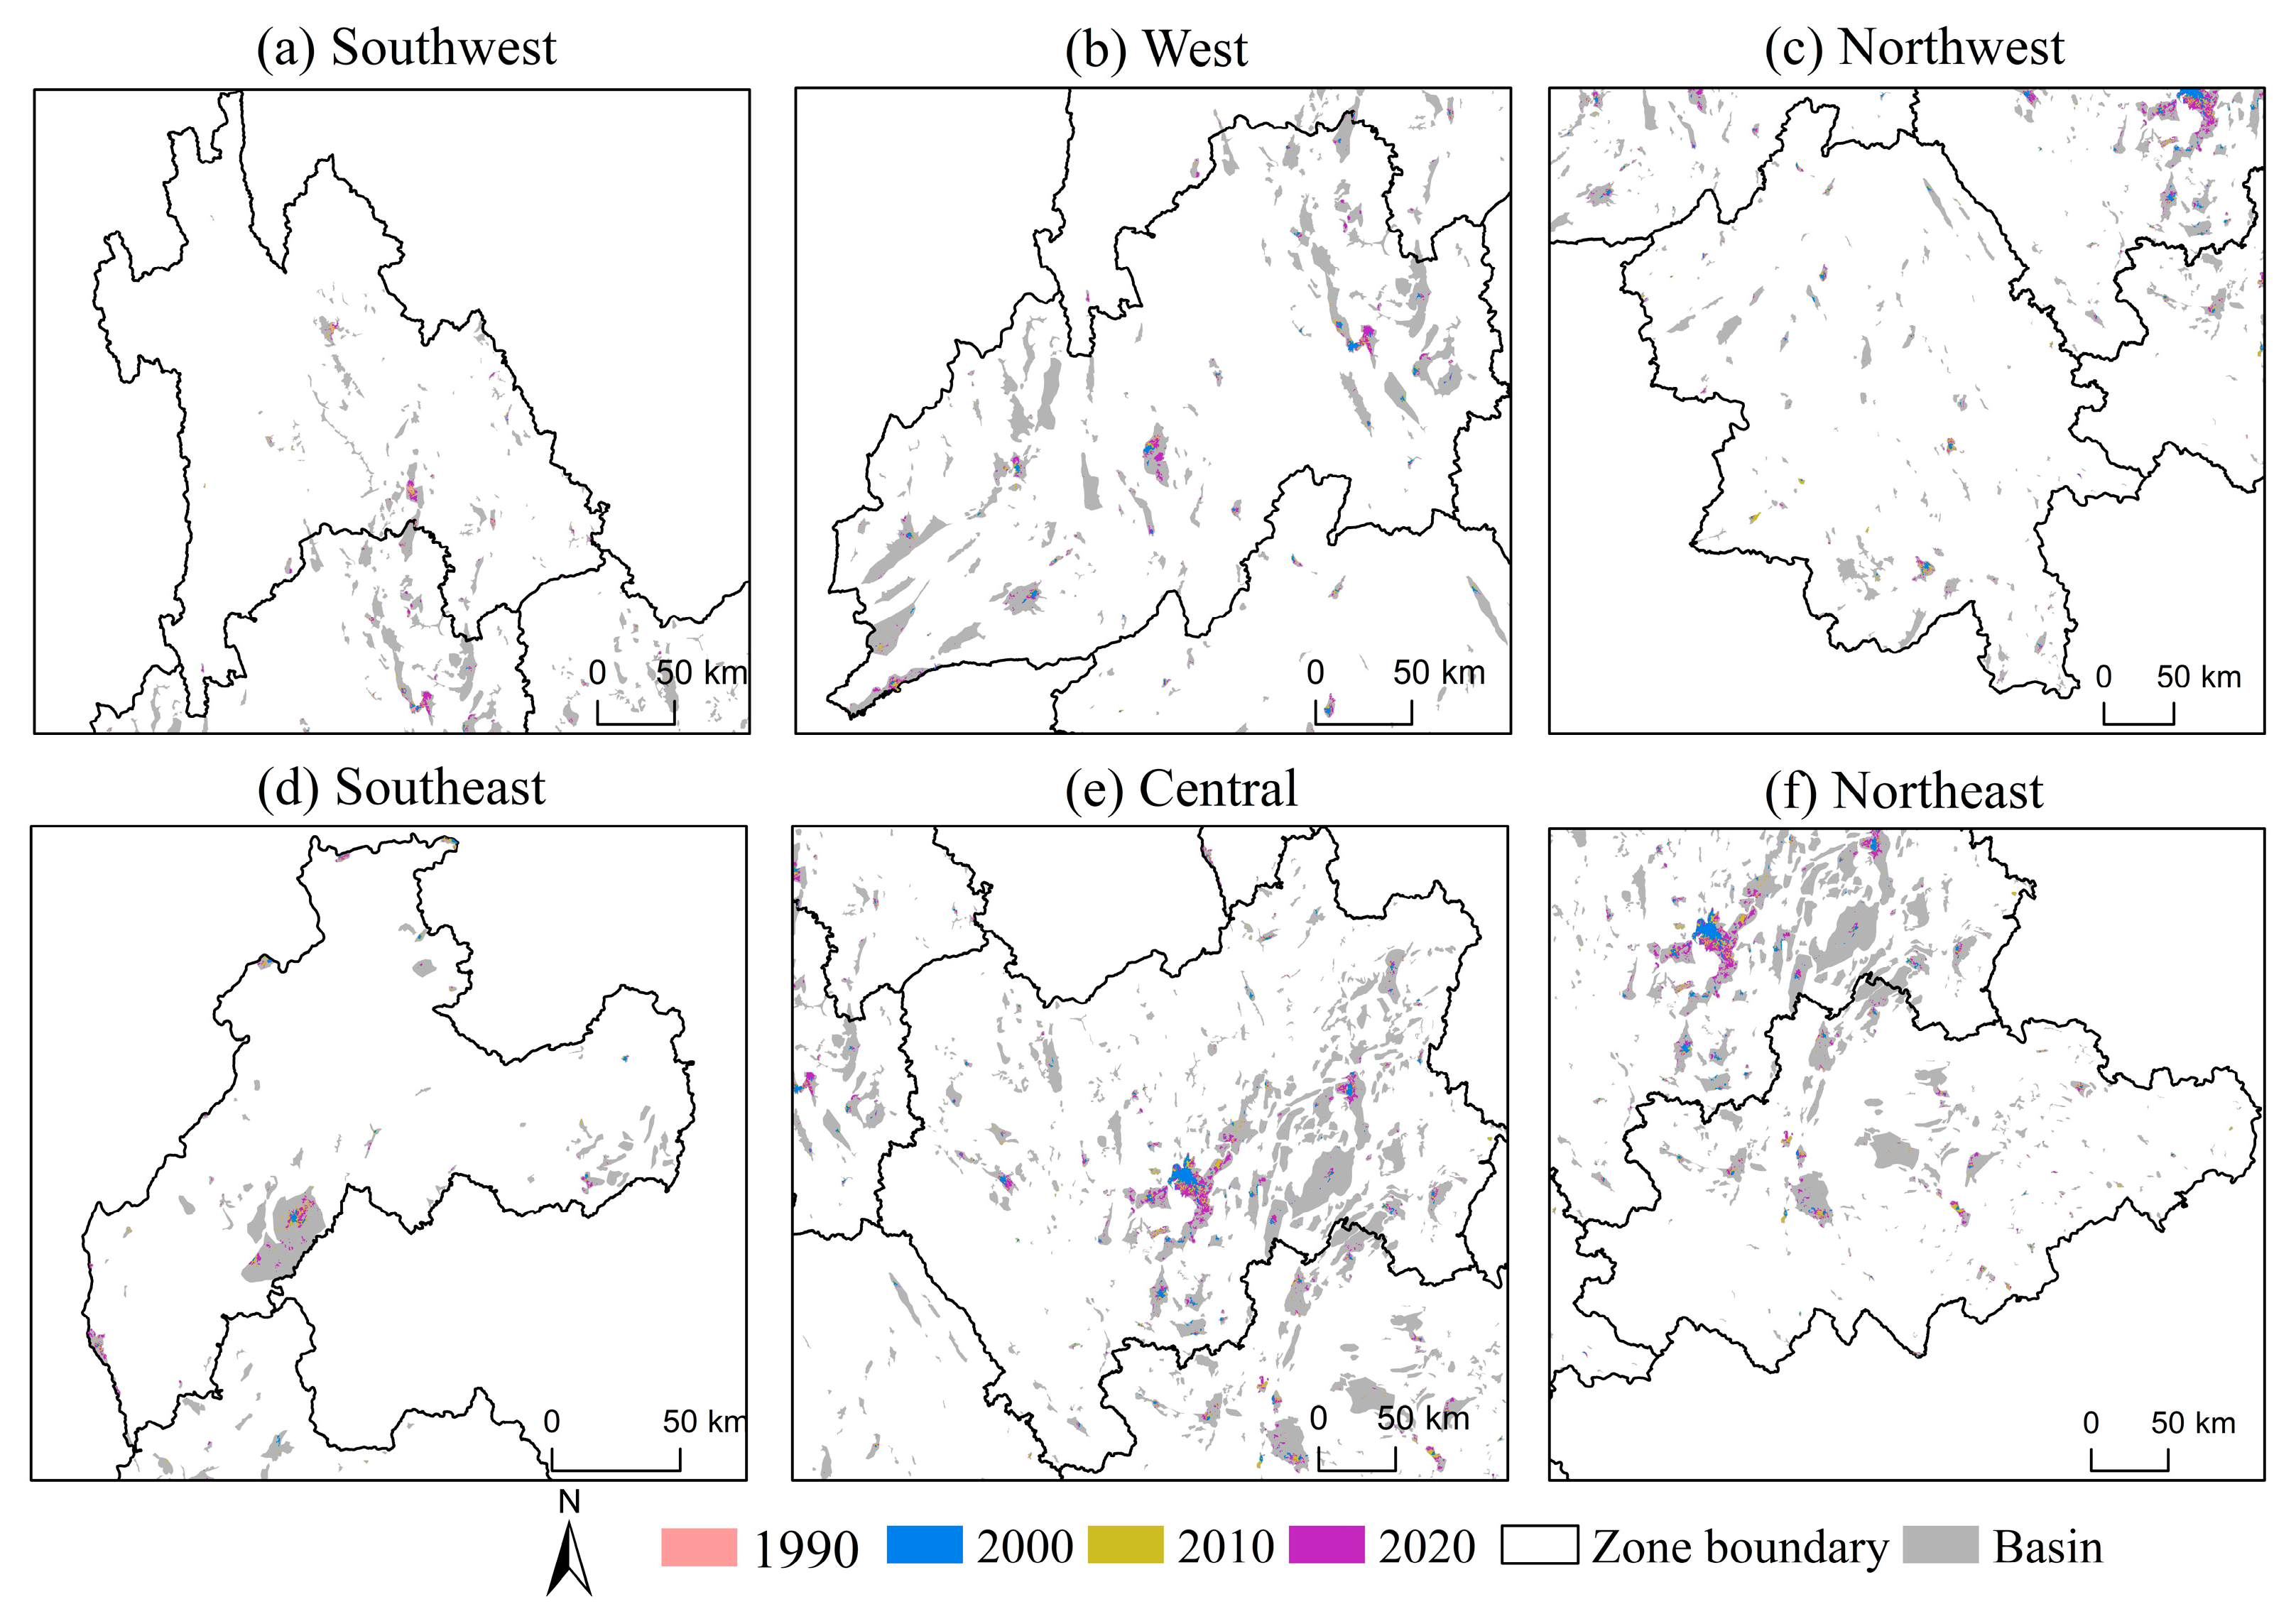
The urban construction land area in Yunnan Province has experienced continuous growth, from 424.49 km2 in 1990 to 3017.68 km2 in 2020, indicative of rapid urbanization. Notably, 85% of this expansion occurred within basins. Overall, the amount of urban construction land in basins has increased, with distinct regional variations in expansion patterns (Figure 2). In terms of proportional growth, Central Yunnan displays a decreasing trend, whereas Western, Northwestern, Southeastern, and Northeastern Yunnan exhibit increasing trends. Initially, in 1990, urban construction land was primarily concentrated in basins hosting city centers. From 1990 to 2000, new urban construction land mainly emerged in the Dianchi, Dali, Lijiang, and Zhaolu basins, with sporadic expansions in other basins. Between 2000 and 2010, urban construction land expanded rapidly across multiple basins, particularly in the Zhaolu, Mengzi, Wenshan, Zhongdian, Baoshan, Ruili, Dali, Simao, Jinghong, Dianchi, and Chuxiong basins. From 2010 to 2020, the direction and scope of urban construction land expansion became more dispersed, with an increase in scattered land patches across smaller basins (Figure 3).
Expansion intensity and expansion speed are important indicators of the “activity level” of urban expansion (Figure 4). From 1990 to 2000, the expansion intensity across the six major regions was generally low, with the Zhaolu Basin in Northeastern Yunnan exhibiting the highest intensity. Between 2000 and 2010, all regions except Western Yunnan experienced a high-intensity expansion of construction land in basins, marked by a significant rise in intensity. From 2010 to 2020, the expansion intensity and expansion speed in the Dali, Ruili, and Lijiang basins in Western and Northeastern Yunnan continued to increase. In contrast, in Southwestern Yunnan, including the Mengzi, Kaiyuan, and Gejiu basins, insufficient economic growth led to a decline in expansion intensity. In other regions, the rate of increase in expansion intensity decelerated.

3.1.2. Analysis of Mode Characteristics of Construction Land Expansion in Basins

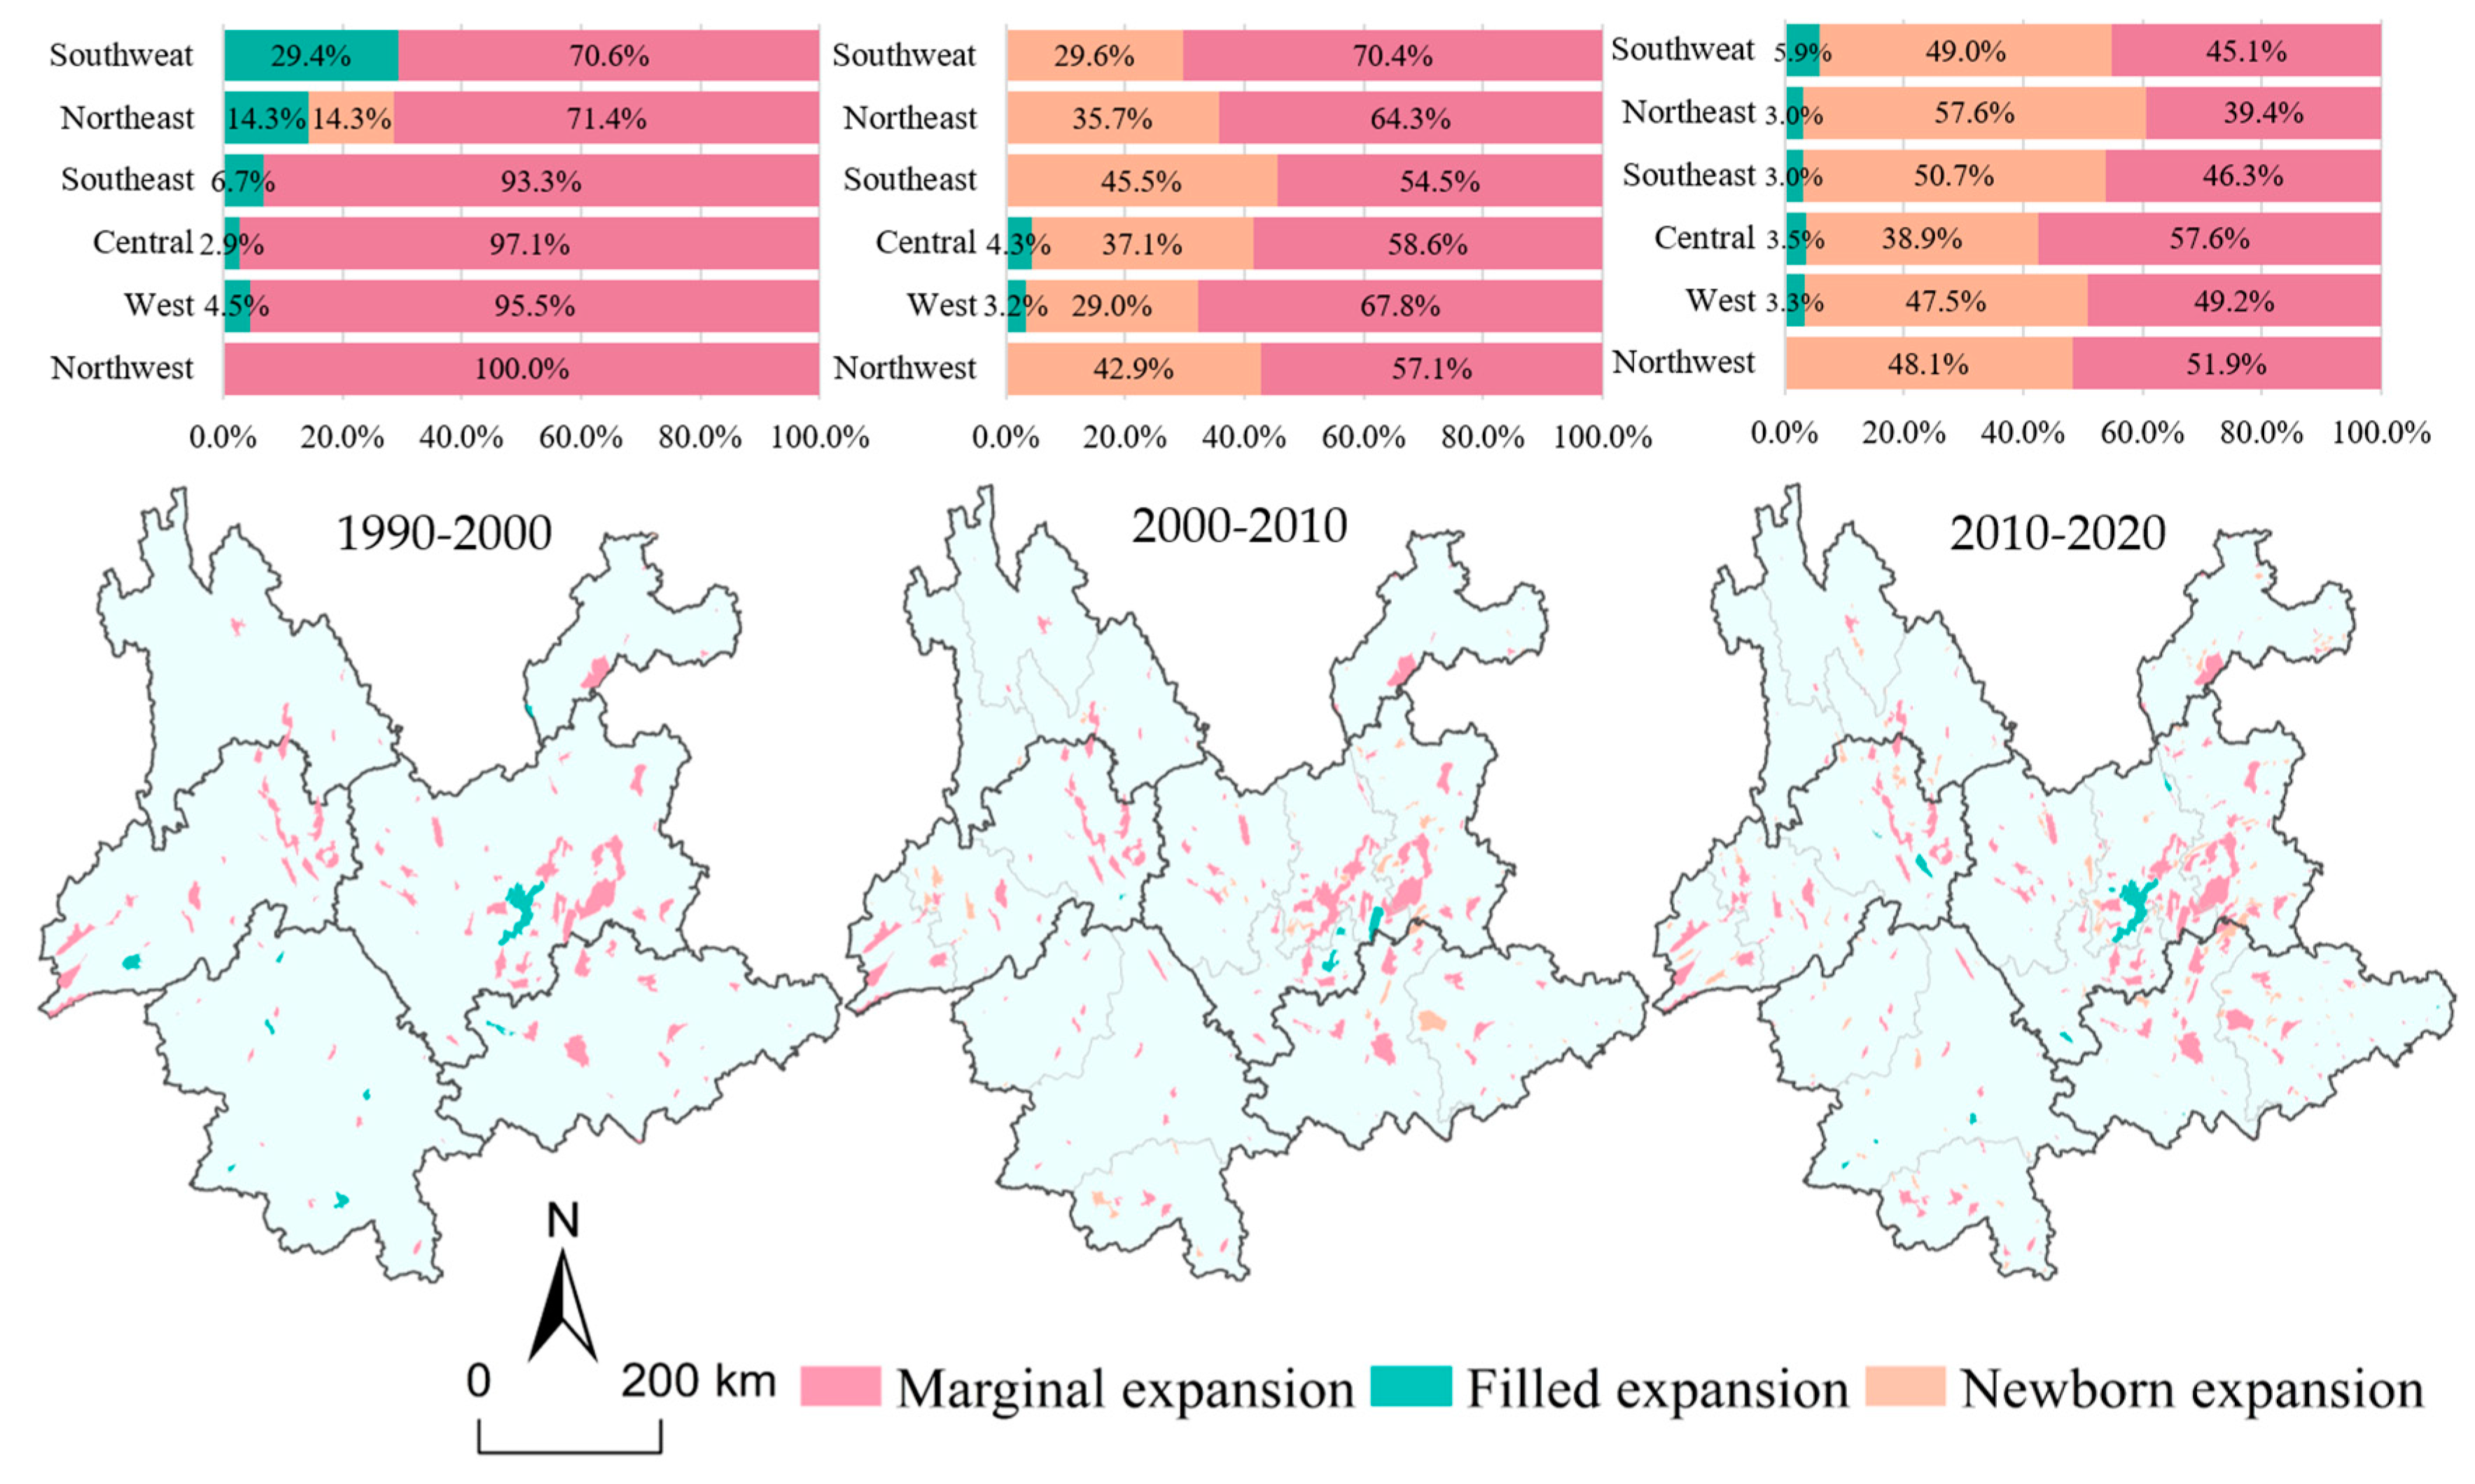
The primary modes of construction land expansion across basins in the region were analyzed to quantify expansion patterns (Figure 5). In certain instances, construction land was nonexistent in 1990 and only emerged subsequently, resulting in LEI values of 0. This phenomenon is similar to enclaved expansion but carries a distinct meaning. To accurately describe such scenarios, the term “newborn expansion” was introduced. Overall, edge expansion dominated, accounting for over 50% in most cases, followed by newborn expansion, which began to rise after 2000 and approached levels comparable with edge expansion by 2010. Infill expansion remained consistently low, reflecting insufficient compactness in basin development. From 1990 to 2000, edge expansion was predominant, with minimal infill expansion observed. The Zhaolu Basin in Northeastern Yunnan exhibited all three expansion patterns, while basins in Southwestern Yunnan, such as Lincang, Simao, and Jinghong, showed mainly edge expansion with some infill. From 2000 to 2010, improvements in transportation infrastructure significantly spurred newborn expansion across all regions. From 2010 to 2020, newborn expansion became the dominant mode in Northeastern, Southeastern, and Southwestern Yunnan, with all regions except Northwestern Yunnan displaying all three types of expansion.

3.1.3. Analysis of Influencing Factors of Construction Land Expansion in Basins

Construction land acts as a crucial indicator of socioeconomic activities, and its expansion is driven by the interplay of multiple factors, including natural geography and socioeconomic conditions [29]. This study, drawing on relevant literature [30,31] and adhering to the principles of systematic analysis and data availability, selects population, GDP, road density, DEM, NPP, and NDVI as the key influencing factors. These factors encompass socioeconomic, natural geographic, and ecological environmental dimensions. Before model estimation, the variance inflation factor (VIF) was used to evaluate multicollinearity among the variables. All VIF values were below 10, indicating that multicollinearity was not a significant issue. The coefficients were estimated through multiple linear regression and tested for significance, with the results being presented in Table 3.
Regression coefficients reflect the impact of explanatory variables on the dependent variable while controlling for other factors. In this study, regression analysis reveals that the factors influencing the expansion of construction land, in order of significance, are population density, GDP, road density, NPP, DEM, and NDVI.
The results indicate that all factors, except for DEM and NPP, passed the significance test, showing that socioeconomic, geographic, and ecological elements influence construction land changes. Socioeconomic factors are positively correlated with land expansion, especially with population density playing a key role. Areas characterized by higher population densities, advanced economic development, and efficient transportation networks tend to experience pronounced urban expansion, bringing about larger proportions of construction land. For example, regions like Dianchi, Yuxi, Chuxiong, Luliang, Dali, Xiangyun, and Zhaolu basins in Yunnan, which feature high population concentrations and rapid economic growth, have witnessed significant construction land expansion. Population migration and improvements in transportation infrastructure have further facilitated the emergence of new expansion patterns in these basins. Major infrastructure projects, including the Trans-Asian Railway (2006), the “One River, Two Wings, Three Oceans” corridor (2009), and the “Belt and Road” Initiative (2015), have spurred population growth in provincial capitals, border areas, and ethnic regions, such as Kunming, Yuxi, Menglian, Ruili, Hekou, and Mengzi. The expansion of highway networks has also supported this growth and facilitated nascent land expansion. During this period, the formation of major urban agglomerations contributed to a surge in new expansion patterns after 2010.
In contrast, natural geographic factors negatively correlate with construction land area due to Yunnan’s mountainous terrain. Even relatively flat basins possess undulating topography, which limits land expansion. Basins with simpler and flatter terrain, such as Dianchi, Luliang, Chuxiong, Qujing, Dali, Baoshan, Wenshan, and Mengzi, have undergone substantial growth in construction land, especially the Dianchi Basin, which boasts the largest construction land area within its watershed. However, basins in Northwestern Yunnan, such as Lashi, Weixi, and Zhongdian, located at altitudes over 4000 m, have constrained construction land availability owing to their smaller areas and rugged terrain. Ecological environmental factors also demonstrate a negative correlation with construction land expansion. Yunnan’s ecologically sensitive areas, including the alpine zones of Northwestern Yunnan, the border mountainous areas of Western Yunnan, the Wumeng Mountains, and the rocky desertification areas of Southeastern Yunnan, impose restrictions on construction land growth in these basins. Additionally, the implementation of ecological protection policies has curtailed the expansion rate and intensity in these areas.
At the same time, the interaction effects between variables are examined, and the interaction term is introduced into the regression model. It is worth noting that the interaction term between population density and road density has a coefficient of 0.83 with a p-value of 0.03, indicating a substantial impact on the intensity of urban expansion. This suggests that regions with both higher population and road densities experience accelerated urban development, particularly in areas where these two factors are concurrently high, leading to more rapid or intensive urban development. Moreover, the interaction term between GDP and road density yields a coefficient of 0.13 and a p-value of 0.043, suggesting that this interaction also significantly influences urban expansion. Increased GDP leads to greater investment in infrastructure such as roads, which in turn promotes urban expansion more effectively. The p-values of other interaction terms exceed 0.1, indicating no significant interactive effects.

3.2. Analysis of the Decoupling Relationship Between Construction Land Expansion and Economic Development in Basins

3.2.1. Spatiotemporal Variations in the Decoupling State Between Construction Land Expansion and Economic Growth

The analysis reveals a significant positive correlation between GDP and construction land expansion, underscoring the strong linkage between economic development and urban growth. By employing preprocessed data, the elasticity coefficients of economic development were calculated for different phases of land expansion in Yunnan’s basins using the Tapio decoupling model. The period from 1990 to 2020 was divided into six five-year phases, with the decoupling statuses and proportions being detailed in Table 4 and Figure 6.
1990–1995: During this period, many basins lacked sufficient construction land, while those that did experienced rapid expansion. Weak decoupling was the dominant state during this time.
1995–2000: The number of basins in a state of weak decoupling increased. Notably, many basins in Western Yunnan transitioned from weak decoupling to expansion negative decoupling.
2000–2005: The proportion of basins in expansion negative decoupling decreased by 12.3%, whereas the number of basins in weak decoupling continued to rise.
2005–2010: During this period, the proportions of expansion negative decoupling and weak decoupling were roughly equivalent. The expansion of negative decoupling increased by 30%, while the proportion of weak decoupling decreased by 23%.
2010–2015: There was a notable increase in the number of basins in weak decoupling and a gradual rise in the number of basins in absolute decoupling.
2015–2020: Compared with the previous period, significant changes in decoupling states occurred. The number of basins in weak decoupling decreased, while the number of basins in expansion negative decoupling increased markedly. Additionally, the number of basins in strong decoupling also rose.

3.2.2. Analysis of Characteristics of Different Types of Decoupling Basins

Decoupling states signify the optimal condition for economic growth, while negative decoupling and coupling states indicate inefficiency in the consumption of urban construction land for economic development. The coupling state serves as a transitional phase between decoupling and negative decoupling [32]. To assess the rationality of urban construction land expansion in basins, this study adopts classification methods from relevant literature [33] and combines data from Table 4 and Figure 6 to comprehensively evaluate the decoupling states in the basins. Linear regression is used to model the temporal trends of each basin’s state, while an augmented Dickey–Fuller (ADF) test is applied to examine the stationarity of the time series. Based on the slope of the trend and the ADF test results, basins are classified as “Stable Decoupling”, “Trend Decoupling”, or “Reverse Decoupling” for stationary sequences. Non-stationary sequences are categorized as “Fluctuating Decoupling”.
(1)
Stable Decoupling Basins
These basins demonstrate stable weak decoupling over time, with construction land expansion being closely aligned with economic growth, although at a slower or comparable rate. The Jinghong Basin is a prime example. To enhance development, these basins should optimize land policies, capitalize on industrial strengths, and foster high-quality economic growth.
(2)
Trend Decoupling Basins
While not yet fully decoupled, these basins show a clear trend toward stronger decoupling. The data suggest rational and sustainable expansion. The Midu Basin exemplifies this category. To support this trend, these basins should invest in scientific innovation, intensify efficient land use, and optimize land planning.
(3)
Reverse Decoupling Basins
These basins show deteriorating decoupling, increasingly relying on resource consumption for economic growth, which suggests an over-reliance on land finance. The Zhenxiong Basin is a typical case. To address this issue, these basins need to optimize land use, upgrade industrial structures, and promote innovation-driven industrial transformation.
(4)
Fluctuating Decoupling Basins
These basins experience fluctuating decoupling, alternating between strong, weak, and negative decoupling. The Dianchi Basin is a prime example. In order to stabilize development, such basins should prioritize land-saving measures, develop the headquarters economy and digital economy, integrate modern services with manufacturing, and reduce dependence on land.

3.2.3. Analysis of Influencing Factors of Decoupling States Between Construction Land Expansion and Economic Development in Basins

Policy changes have been instrumental in shaping construction land expansion and economic development in Yunnan Province, transforming it from a remote border region to an open frontier. The Western Development Strategy, launched in 1999, provided substantial policy support that spurred industrial growth. This led to continuous increases in industrial output and production capacity, thereby raising GDP per unit area. During this period, regions such as Dianchi, Luliang, and Chuxiong in Central Yunnan and Mengzi and Gejiu in Southeastern Yunnan experienced rapid development. The “Belt and Road” Initiative, initiated in 2013, established land-based border ports, reducing Yunnan’s reliance on overland transportation for economic growth. In this phase, basins in Central Yunnan and along the borders predominantly exhibited weak decoupling states, with stable decoupling basins being notably influenced by these policies. The fluctuating decoupling state of basins is primarily driven by socioeconomic and policy factors. The Western Development Strategy of 1999 created opportunities for Yunnan, increasing the amount of expansion and connection of basins. Infrastructure projects like the Yunnan–Vietnam Railway and policies promoting population concentration in Central Yunnan and border areas contributed to weak decoupling. The 2008 global financial crisis impacted Yunnan’s foreign trade, prompting policies like the 12th Five-Year Plan and the Yunnan Bridgehead initiative, which caused some frontier basins to experience negative decoupling by 2010. However, most returned to weak decoupling after 2010, supported by these policies. By 2015, the “Belt and Road” Initiative accelerated infrastructure construction, leading to construction land expanding faster than economic growth.
The development of transportation networks is a crucial determinant influencing both construction land expansion and economic growth. Since the initiation of the 13th Five-Year Plan, Yunnan has strengthened its transportation infrastructure, thereby enhancing network structures and establishing a comprehensive transportation system centered on Kunming, with the Central Yunnan urban agglomeration serving as a key node [34]. This expansion of transportation facilitated the growth of smaller basins surrounding major basins such as Dianchi, Luliang, and Zhaolu. As a result, the rate of construction land expansion accelerated, with instances of negative decoupling in some basins. Nonetheless, sustained economic growth and the outward dispersion of construction land enabled basins with more developed industrial systems to transition toward strong decoupling. Fluctuating decoupling states were often observed in regions with well-established transportation networks.
Ecological environments not only impose constraints on construction land expansion and economic development but also provide essential support for economic activities. In Yunnan, characterized by its highland mountainous terrain, numerous ecologically fragile areas limit the pace of construction land expansion and economic growth [35]. However, the implementation of ecological protection and restoration projects in plateau lakes, ecological barriers, and arid-hot river valleys [36] has facilitated the development of agriculture and tourism in regions such as Ludian, Wenshan, Weixi, and Yuanyang. These initiatives have contributed significantly to poverty alleviation and improvements in decoupling states. Nevertheless, certain areas still face developmental constraints, resulting in suboptimal decoupling states. Changes in the ecological environment often influence trend decoupling and reverse decoupling-type basins.

4. Discussion

4.1. Analysis of Major Conclusions

The expansion of construction land demonstrates temporal variability, with different patterns emerging over time. According to Sun et al. (2020), urban and rural construction land in Yunnan Province has consistently expanded, albeit with notable changes. Prior to 2000, the expansion was relatively stable and primarily concentrated in basins housing central cities. After 2000, the pace of expansion accelerated, becoming more dynamic and widely distributed [37]. This study corroborates these findings, confirming that before 2000, construction land changes in Yunnan’s basins were indeed stable and focused on central city areas. Post-2000, newly developed construction land showed pronounced changes and broader distribution. Li et al. (2024) proposed that the expansion of construction land typically follows a pattern of “slow growth → rapid growth → stable growth” [6]. In this study, the intensity and speed of construction land expansion vary across regions. In Central Yunnan, with its strong economic base, population concentration, and extensive new construction areas, the trend is upward. Other regions exhibit fluctuating trends due to factors such as resource depletion, population contraction, or improvements in transportation and tourism. The expansion patterns reveal a lack of compactness, with infill development being rare throughout all periods. The significant increase in new expansions after 2010 can be attributed to improvements in transportation networks and population movement in response to policy directions, leading to more dispersed construction land layouts across the basins.
From the perspective of urban development studies in China, the expansion of construction land has been historically intertwined with economic development levels. As industries and technologies advance, the reliance on construction land expansion to support economic growth is expected to gradually diminish [38]. He et al. (2024) analyzed the decoupling between construction land and economic development in the Chengdu–Chongqing region, revealing significant regional variations in decoupling statuses, with weak decoupling being the predominant condition [39]. Consistent with these findings, this study also observes similar trends, aligning with existing research. Based on previous studies and the calculations of this study, it is evident that there are substantial differences in the decoupling status of basins within each region of Yunnan Province, with weak decoupling being the most prevalent condition across all regions and periods. The number of stabilized, trending, and reverse decoupled basins remains relatively small, while the majority of basins belong to the fluctuating decoupled category. Changes in the state of these basins are mainly influenced by socioeconomic factors and policy interventions.
In studies on basins, Chen (2020) observed that land use functions in these areas are evolving from single-purpose to multifunctional. The expansion of composite functions within basins has mitigated over-reliance on construction land for economic development [40]. This observation aligns with this study’s findings. Our research indicates that rapid urbanization and industrialization have caused most basins to experience a strong decoupling between construction land expansion and economic growth. However, due to the unique characteristics of basin units, some small basins display a reversal from strong decoupling to reconnection with land expansion, which contrasts with the general trend observed in related studies. The underlying causes of this phenomenon warrant further investigation. Construction land expansion is influenced by a range of factors, including socioeconomic, natural geographic, ecological, and policy-related elements. Our study reveals that socioeconomic factors exert the most significant influence on changes in construction land area, followed by economic development, consistent with Li (2019) [41]. Socioeconomic factors are the primary drivers of construction land expansion, while policy factors significantly influence the relationship between land expansion and economic development. Natural geography and ecological conditions, such as diverse geomorphology and fragile ecosystems, also affect land use expansion. The complex terrain and ecological barriers in Yunnan Province impose limitations on both land expansion and economic growth. Since 2006, the significant development of highways, railroads, and airports has facilitated construction land expansion and driven economic development. Analyzing these factors helps uncover the driving mechanisms behind land expansion and decoupling effects in the basin.
Previous studies on geographically unique areas [14,30] spanning administrative boundaries have predominantly focused on county-level units, thus neglecting the distinct characteristics of specific geographic spaces. Conversely, this research adopts basins as the primary research units and uses spatial data to quantify economic development levels and influencing factors. This approach offers a valuable reference for examining special geographic areas that transcend administrative borders. Despite not being administrative units, basins play a crucial role in the economic development of the Yunnan–Guizhou Plateau. However, because of the scarcity of statistical data, conducting research based on these regions is challenging. Future governmental efforts should prioritize data collection and analysis in such areas. In summary, this study provides insights into the patterns of construction land expansion and economic development in geographically distinctive areas that cross administrative boundaries, thereby supporting regional integration and promoting sustainable development in basins.

4.2. Limitations and Future Directions

This study advances the literature on construction land expansion and decoupling effects in three aspects. First, it delineates the magnitude and spatiotemporal patterns of land expansion within the plateau basins of Yunnan Province, along with an analysis of the driving forces behind this phenomenon. Second, it quantifies economic development in these basins by integrating nighttime light data with official statistical sources. Lastly, it investigates the decoupling relationship between land expansion and economic growth using the Tapio decoupling model, complemented by a comprehensive qualitative analysis of the underlying factors.
However, this study is subject to several limitations stemming from constraints in data acquisition and accuracy challenges. For instance, when estimating economic development levels in basins, the lack of non-administrative statistical data necessitated reliance on nighttime light data and GDP figures. This reliance may introduce inaccuracies due to the lower resolution of nighttime light data and the relatively simplistic calculation methods employed.
Furthermore, the relationship between construction land expansion and economic development is complex, influenced by factors such as resource environmental endowments, national macroeconomic policies, and technological conditions. Analyzing this intricate relationship solely through the Tapio decoupling model inevitably oversimplifies the underlying complexity.
In addition, the research unit of this study was confined to the basin within Yunnan Province, which limits the study area to this province. This narrow scope poses challenges in incorporating broader regions into the analysis. For example, extending the study to the entire Yunnan–Guizhou Plateau region would be difficult. In future studies, researchers should consider expanding the geographical scope to facilitate inter-regional comparisons.
Future research could also delve into the relationship between different types of construction land and economic development for a more nuanced analysis. While this study primarily focuses on historical changes, future work could utilize models such as cellular automata or PLUS to predict future trends, thereby providing a more comprehensive understanding.

5. Conclusions

This study explores the expansion of urban construction land in Yunnan’s basins and its decoupling from economic development, drawing the following key conclusions:
(1)
Urban construction land in large basins with central cities is expanding significantly, while smaller basins show more uneven distribution patterns with varying intensities and rates of expansion.
(2)
Edge expansion has been the dominant mode throughout all periods, constituting over 50% in most regions. Since 2000, new expansion has become particularly prominent in Northeastern, Southeastern, and Southwestern Yunnan.
(3)
Weak decoupling remains prevalent, with proportions across six phases being 51.96%, 61.00%, 61.82%, 38.69%, 66.32%, and 39.57%. Many basins display unstable decoupling, relying heavily on land for economic growth.
(4)
Socioeconomic factors drive construction land expansion, whereas natural geography and ecological constraints hinder it. GDP shows the strongest correlation with land expansion, emphasizing the link between economic development and land use.
The findings have significant implications: (1) Differences in construction land expansion: Large basins experience more pronounced land expansion compared with small basins. While prioritizing the development of large basins, the government should also allocate resources and customize policies to support the development of small basins, taking into account their unique resource endowments to achieve balanced regional development. (2) Impact of human and natural factors: Both human activities and natural factors play crucial roles in affecting construction land expansion. Policies should be context-specific, adapting to the unique conditions of each basin. In particular, for high-altitude and rocky desertification areas, it is essential to promote economic growth in tandem with ecological protection to ensure sustainable development.

Author Contributions

Conceptualization, T.L., X.Z. and Y.Z.; methodology, T.L. and Y.Z.; software, Y.Z. and X.L.; validation, T.L., Y.Z. and X.Z.; formal analysis, Y.Z.; investigation, Y.Z., X.L., Z.Z. and H.Y.; resources, T.L. and Y.Z.; data curation, T.L.; writing—original draft preparation, T.L. and Y.Z.; writing—review and editing, T.L., Y.Z., X.Z., X.L., Z.Z. and H.Y.; visualization, Y.Z., X.L. and Z.Z.; supervision, T.L. and X.Z.; project administration, T.L. and X.Z.; funding acquisition, T.L. and X.Z. All authors have read and agreed to the published version of the manuscript.

Funding

This research was funded by the Yunnan Provincial Science and Technology Project at Southwest United Graduate School, grant number 202302AO370007; the Yunnan Provincial Science and Technology Department Science and Technology Project, grant number 202201AU070025; the “Xingdian Talent Support Program” Project, grant number 20210605; the Project of Joint Training Base for Postgraduate Integration Between Industry and Education in Yunnan Province, grant number CZ22622203-2022-29; and the Postgraduate Innovative Research Project of Yunnan University, grant number TM-23237064.

Data Availability Statement

The data used in this study are available by contacting the first author.

Acknowledgments

The authors thank the reviewers and editors for their valuable comments and suggestions.

Conflicts of Interest

The authors declare no conflicts of interest.

References

  1. Zhang, M.; Yang, L.Y.; Hu, Z.W.; Yang, Z.Q. Spatiotemporal differentiation and influencing mechanism of urban expansion in the Yangtze River Economic Belt, China. Acta Geogr. Sin. 2024, 79, 439–461. [Google Scholar] [CrossRef]
  2. Liu, Y.; Huang, C.; Zhang, L. The spatio-temporal patterns and driving forces of land use in the context of urbanization in China: Evidence from Nanchang City. Int. J. Environ. Res. Public Health 2023, 20, 2330. [Google Scholar] [CrossRef] [PubMed]
  3. Miao, Y.; Liu, J.; Wang, R.Y. Occupation of cultivated land for urban-rural expansion in China: Evidence from national land survey 1996–2006. Land 2021, 10, 1378. [Google Scholar] [CrossRef]
  4. Shi, K.; Cui, Y.; Liu, S.; Wu, Y. Global urban land expansion tends to be slope climbing: A remotely sensed nighttime light approach. Earth’s Future 2023, 11, e2022EF003384. [Google Scholar] [CrossRef]
  5. Zhang, X.; Liu, Y.; Wang, Y.; Yuan, X. Interactive relationship and zoning management between county urbanization and ecosystem services in the Loess Plateau. Ecol. Indic. 2023, 156, 111021. [Google Scholar] [CrossRef]
  6. Li, X.; Zhu, G.; Liu, Z. Spatiotemporal evolution and influencing factors of urban construction land in resource-exhausted cities: An empirical study of Puyang, China. Land 2024, 13, 2007. [Google Scholar] [CrossRef]
  7. Mou, J.; Chen, Z.; Huang, J. Predicting urban expansion to assess the change of landscape character types and its driving factors in the mountain city. Land 2023, 12, 928. [Google Scholar] [CrossRef]
  8. Yang, D.; Zhang, P.; Jiang, L.; Zhang, Y.; Liu, Z.; Rong, T. Spatial change and scale dependence of built-up land expansion and landscape pattern evolution—Case study of the affected area of the lower Yellow River. Ecol. Indic. 2022, 141, 109123. [Google Scholar] [CrossRef]
  9. Li, Z.; Luan, W.; Zhang, Z.; Su, M. Relationship between urban construction land expansion and population/economic growth in Liaoning Province, China. Land Use Policy 2020, 99, 105022. [Google Scholar] [CrossRef]
  10. Liu, S.C.; Ye, Y.M.; Zhong, S.Q. Research on the relationship between the expansion of urban construction land and the relocation and decoupling of economic growth in China. Resour. Environ. Yangtze Basin 2020, 29, 9. [Google Scholar]
  11. Wang, H.Y.; Hu, S.G.; Lu, J. Decoupling relationship between construction land expansion and economic growth in China and its control strategy. China Land Sci. 2019, 33, 68–76. [Google Scholar] [CrossRef]
  12. Tian, Y.D.; Zhao, X.C. Simulation of construction land expansion and carbon emission response analysis of Changsha-Zhuzhou-Xiangtan Urban Agglomeration based on Markov-PLUS model. Acta Ecol. Sin. 2024, 44, 129–142. [Google Scholar] [CrossRef]
  13. Zhi, J.J.; Han, C.X.; Wang, X.T.; Zhang, L.K.; Chu, C.Q. Future construction land expansion under multiple simulation development scenarios and its impacts on landscape pattern evolution in China. Geog. Res. 2024, 43, 843–860. [Google Scholar] [CrossRef]
  14. Jin, D.; Dai, L.L. Spatial and temporal characteristics and driving factors of construction land expansion in the inter-provincial border areas of Beijing-Tianjin-Hebei. Geogr. Geogr. Inf. Sci. 2023, 39, 48–57. [Google Scholar] [CrossRef]
  15. Xiong, C.S.; Hu, Y.Y.; Zhou, B.; Liu, X.; Luan, Q.L. Construction land expansion and the influence mechanism around Hainan roundabout railway stations. Trop. Geogr. 2024, 44, 938–950. [Google Scholar] [CrossRef]
  16. Lin, C.; Wu, Q.Z. Enterprise digital transformation and urban economic vitality: Mixed frequency regression based on night-time light data. J. Yunnan Univ. Financ. Econ. 2024, 40, 81–101. [Google Scholar] [CrossRef]
  17. Kuang, K.J.; Zheng, K.Y.; Chen, R.; Chen, B.; Hong, Y.; Liu, J.F. Spatio-temporal evolution of county economic development in Fujian Province based on NPP-VIIRS nighttime lighting data. Areal Res. Dev. 2023, 42, 29–35. [Google Scholar] [CrossRef]
  18. Chen, H.Z.; Zeng, B.; Guo, H. Spatial-temporal pattern evolution and driving factors of county economy in the Yellow River Basin: Based on the analysis of night light data. Econ. Geogr. 2022, 42, 37–44. [Google Scholar] [CrossRef]
  19. Donaldson, D.; Storeygard, A. The view from above: Applications of satellite data in economics. J. Econ. Perspect. 2016, 30, 171–198. [Google Scholar] [CrossRef]
  20. Li, Y.B.; Chen, H.; Luo, G.J. Spatial distribution of different scale flatland in Guizhou Province, China. Sci. Geogr. Sin. 2019, 39, 1830–1840. [Google Scholar] [CrossRef]
  21. Yang, Z.S.; Zhao, Q.G. Based on the second national land survey, the division of Basan County, Banshan Banba County, and Mountain County in Yunnan Province. J. Nat. Resour. 2014, 29, 564–574. [Google Scholar] [CrossRef]
  22. Tong, S.Y.; Chen, Y.S.; Wang, X.L. A study on the cause of formation for flatland in Yunnan and research into their features. Yunnan Geogr. Environ. Res. 2007, 19, 129–133+122. [Google Scholar] [CrossRef]
  23. Ming, Q.Z.; Wang, J.X.; Zhang, W.X. A geographical interpretation of mountain exploitation and construction of mountainous towns: A case study of Yunnan. J. Yunan Norm. Univ. 2012, 44, 48–53. [Google Scholar] [CrossRef]
  24. Wu, D.N. Analysis of Landscape Pattern Evolution and Restrictive Factors of Urbanization in Mountainous Basins of Yunnan Province. Master’s Thesis, Yunnan University, Kunming, China, 2021. [Google Scholar]
  25. Ma, L.; Xiang, L.; Wang, C.; Chen, N.; Wang, W. Spatiotemporal evolution of urban carbon balance and its response to new-type urbanization: A case of the middle reaches of the Yangtze River Urban Agglomerations, China. J. Clean. Prod. 2022, 380, 135122. [Google Scholar] [CrossRef]
  26. Jin, Y.K.; Zhang, H.; Lu, Z.P. Spatiotemporal Differentiation and Influencing Factors of Urban Expansion in India from 2000 to 2020. World Reg. Stud. 2025, 33, 1–15. Available online: http://kns.cnki.net/kcms/detail/31.1626.P.20241224.1635.002.html (accessed on 18 February 2025).
  27. Kong, X.S.; Jiang, X.J.; Cheng, P. Correlation analysis between multi-dimensional poverty reduction and construction land expansion in eleven concentrated and contiguous poverty-stricken areas in China. China Land Sci. 2023, 37, 125–136. [Google Scholar]
  28. Zhang, X.R.; Rao, L.L.; Jiang, X. Decoupling research of construction land sprawl between economic growth in the inland open area: A case study of Chongqing City. J. Chongqing Norm. Univ. (Nat. Sci. Ed.) 2016, 33, 201–210. [Google Scholar] [CrossRef]
  29. Huang, B.R.; Zhang, H.Z.; Song, D.J.; Ma, Y.H. Analysis on the driving force of construction land expansion in China from 2000 to 2010. Acta Ecol. Sin. 2017, 37, 4149–4158. [Google Scholar] [CrossRef]
  30. Cong, J.M.; Sun, C.J.; Chen, W.; Gao, C.X.; Meng, S.T. Unrevealing the process and driving factors of urban construction land expansion in the middle reaches of the Yellow River, 2000–2020. Geogr. Res. 2024, 43, 2121–2140. [Google Scholar] [CrossRef]
  31. Wang, X.X.; Peng, L.; Liu, S.J.; Wei, Y.Y. Characteristics and driving mechanism of urban construction land expansion in mountainous areas of southwest China. Chin. J. Ecol. 2021, 40, 2895–2903. [Google Scholar] [CrossRef]
  32. Liu, B.T. The decoupling relationship between the expansion of urban construction land and economic growth in Jilin Province. J. Resour. Ecol. 2019, 10, 275–281. [Google Scholar] [CrossRef]
  33. Zhang, Y.; Gao, Y.J. Study on decoupling relationship between urban land expansion and economic growth in Huaihe River eco-economic belt. Resour. Environ. Yangtze Basin 2023, 32, 1573–1582. [Google Scholar]
  34. Hou, S.B. The impact of transportation infrastructure construction on regional economy under the background of New Normal economy: A case study of Yunnan Province. Econ. Res. Guide 2024, 11, 43–46. [Google Scholar]
  35. Zhang, Y.; Mao, P.; Feng, L.; Hu, X.Z. Research on spatial differences and driving factors of economic efficiency from the perspective of development poverty based on the data of 40 eco-environment vulnerable counties in Yunnan Province. Ecol. Econ. 2024, 40, 94–104. [Google Scholar]
  36. Zhu, K.; Yang, Z.S. Analysis on the coupling and coordination relationship between economic development and ecological environment in ecologically fragile areas—Taking Wenshan Zhuang and Miao Autonomous Prefecture of Yunnan Province as an example. J. Anhui Agric. Sci. 2020, 48, 69–73. [Google Scholar] [CrossRef]
  37. Sun, Q.J.; Li, C.M. Spatial-temporal characteristics of land use change in Yunnan Province from 1980 to 2020. China South. Agric. Mach. 2025, 56, 128–131, 156. [Google Scholar]
  38. Zhao, J.; Chen, W.; Liu, Z.; Liu, W.; Li, K.; Zhang, B.; Zhang, Y.; Yu, L.; Sakai, T. Urban expansion, economic development, and carbon emissions: Trends, patterns, and decoupling in mainland China’s provincial capitals (1985–2020). Ecol. Indic. 2024, 169, 112777. [Google Scholar] [CrossRef]
  39. He, Y.L.; Tang, J.Y.; Zhou, J.Y.; Li, L.R.; Zhou, Y.H.; Liu, H.W. Decoupling relationship between economic development and urban construction land expansion in Shuangcheng economic circle in Chengdu-Chongqing area. J. China West Norm. Univ. (Nat. Sci.) 2025, 45, 1–10. Available online: http://kns.cnki.net/kcms/detail/51.1699.N.20240614.1651.002.html (accessed on 20 February 2025).
  40. Chen, H. Research on the Evolution of Land Use Function in Bazi County, Guizhou Province. Master’s Thesis, Guizhou Normal University, Guiyang, China, 2020. [Google Scholar]
  41. Li, R. Study on the Characteristics and Influencing Factors of Urban Construction Land Change in Yunnan Province. Master’s Thesis, Yunnan Normal University, Kunming, China, 2019. [Google Scholar]
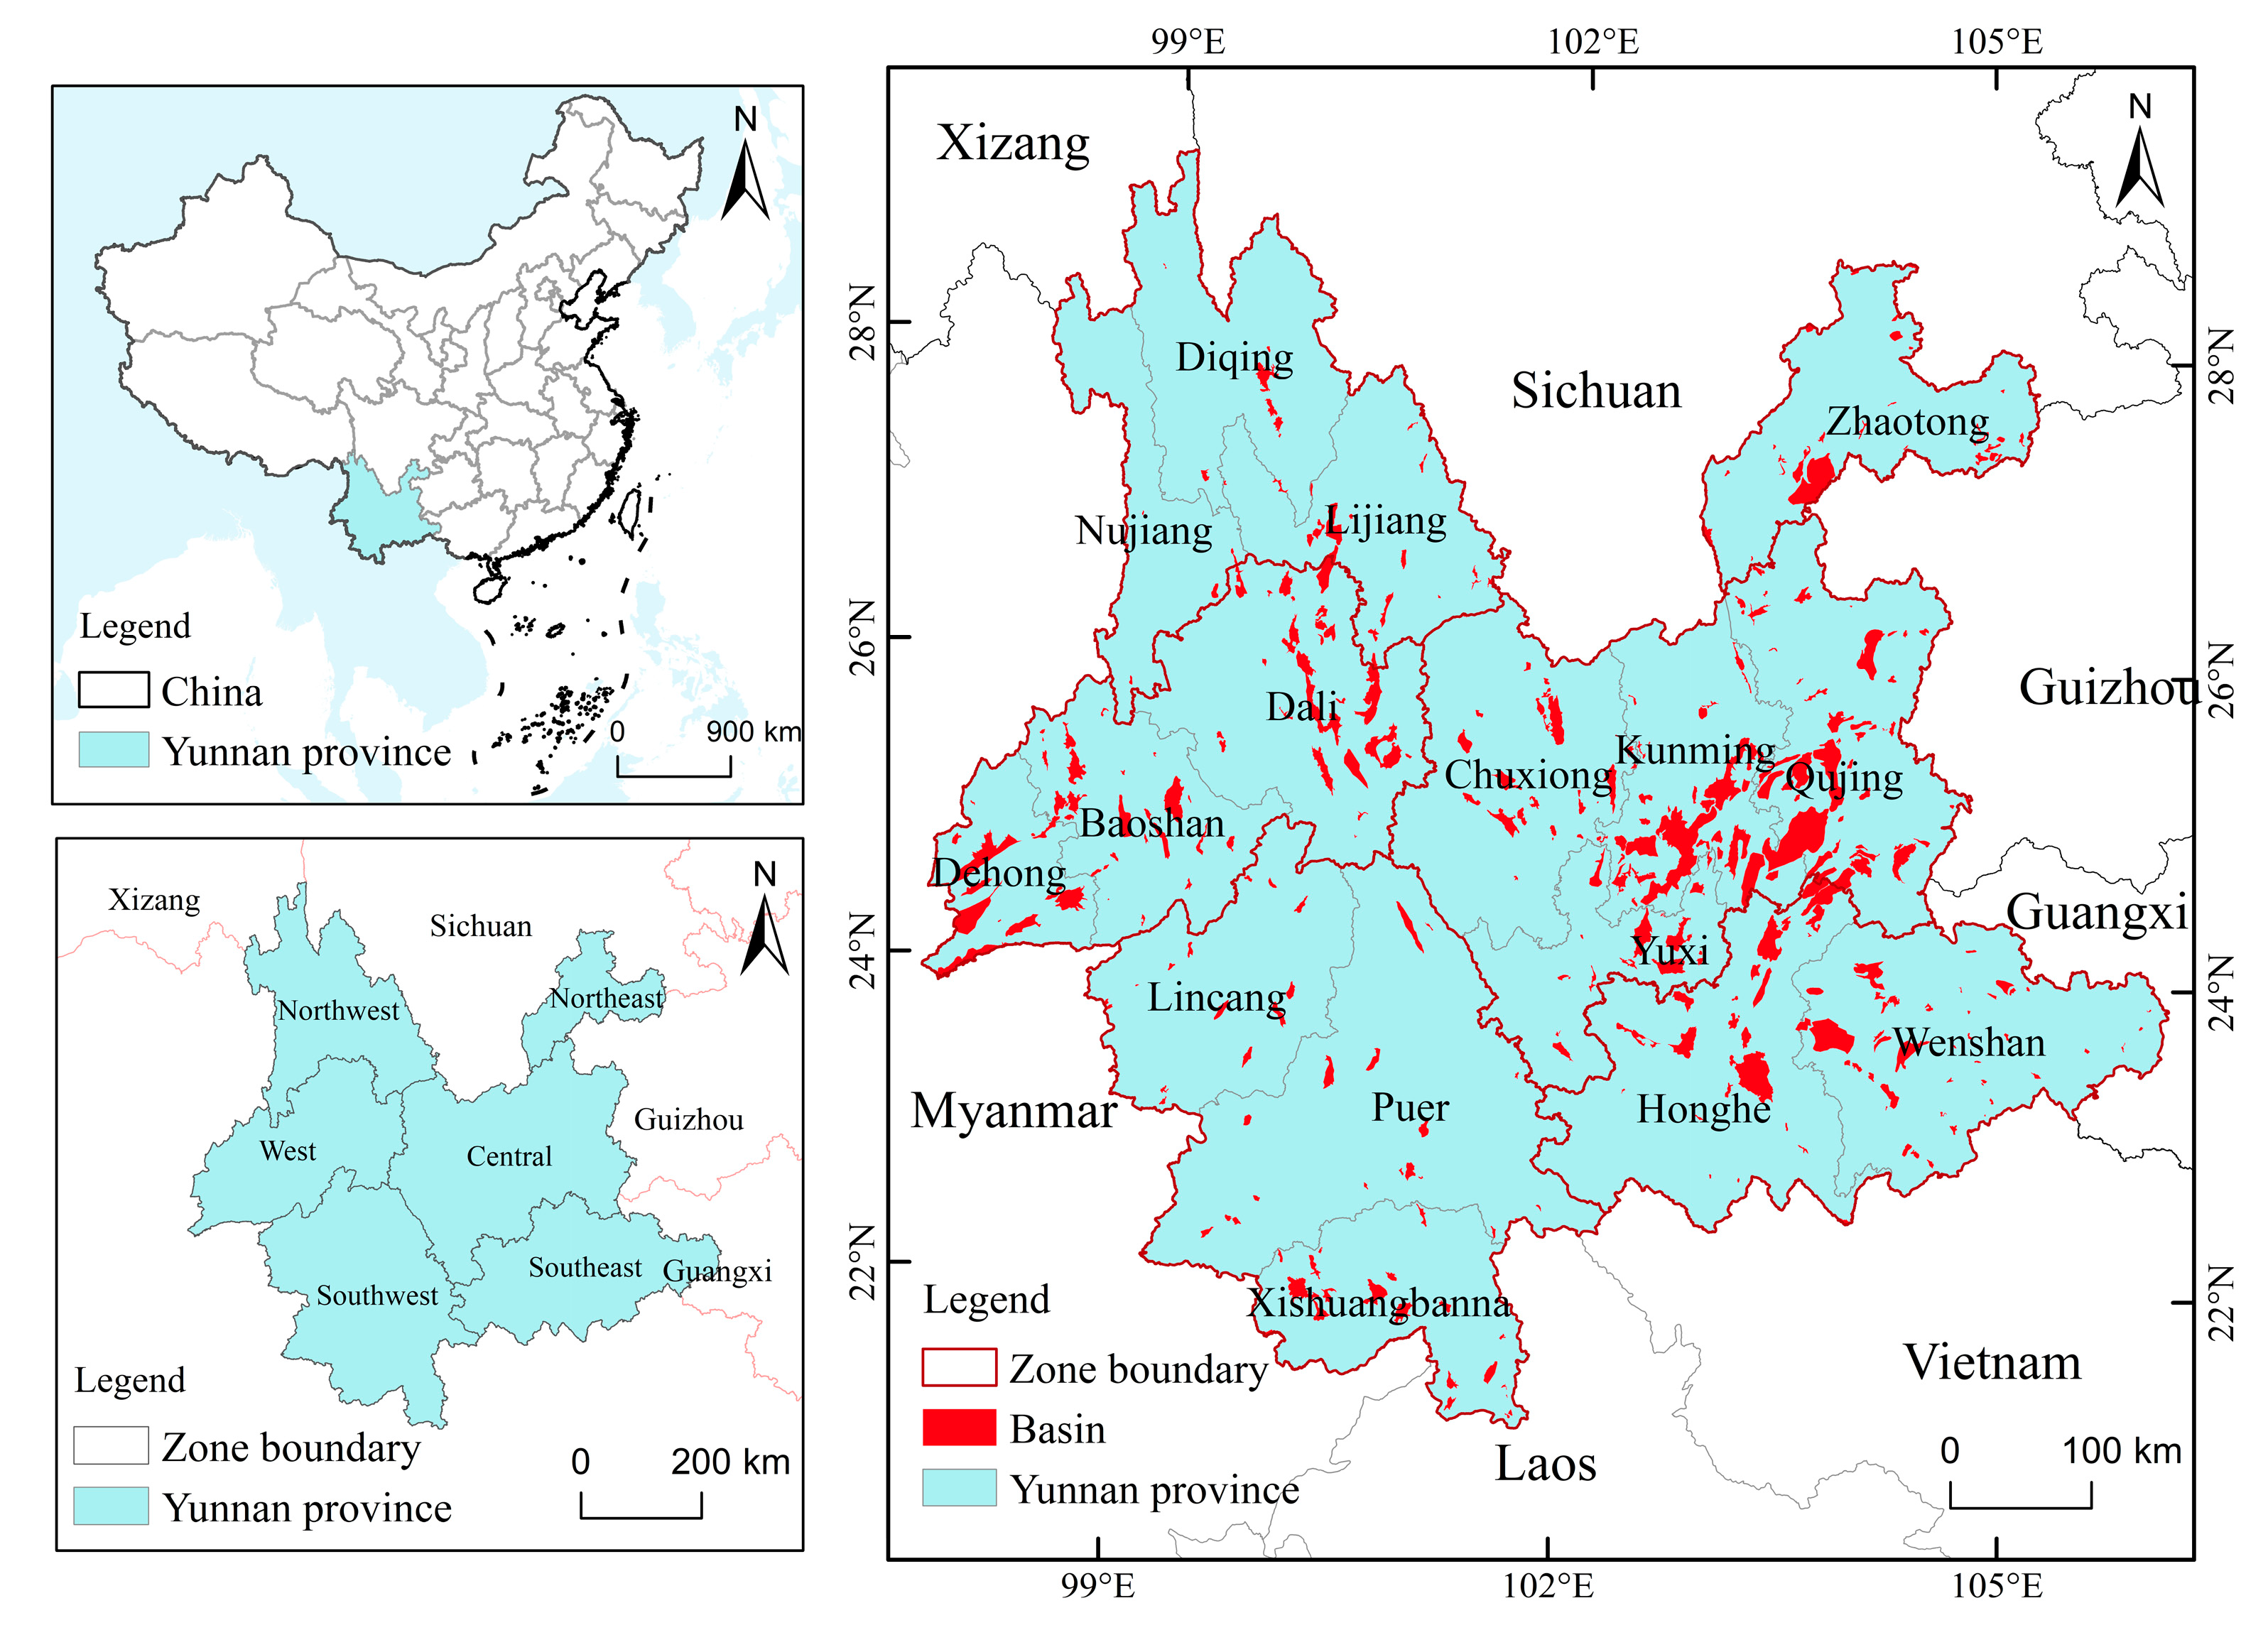
Figure 1. Location of the research area.
Land 14 00685 g001
Figure 2. Proportion of construction land in regional basins.
Land 14 00685 g002
Figure 3. Spatial distribution and evolution of construction land in basins.
Land 14 00685 g003
Figure 4. Expansion intensity and speed of construction land in basins.
Land 14 00685 g004
Figure 5. Changes and proportions of expansion patterns in basins.
Land 14 00685 g005
Figure 6. Spatial distribution patterns and evolution of decoupling states in basins.
Land 14 00685 g006
Table 1. Data sources and classification.
Data CategoriesData DescriptionData Sources
Land Use DatasetLong-term Land Use Raster Data at 30 m Spatial ResolutionResource and Environmental Science Data Center of the Chinese Academy of Sciences (http://www.resdc.cn (accessed on 14 January 2024))
Digital Elevation Model (DEM) DataDEM Data at 30 m Spatial ResolutionGeospatial Data Cloud Platform
(http://www.gscloud.cn (accessed on 22 January 2025))
Nighttime Light DataNighttime Light Data at 1 km Spatial ResolutionNational Tibetan Plateau Data Center
(https://data.tpdc.ac.cn (accessed on 23 April 2024))
Normalized Difference Vegetation Index (NDVI) Raster DataNDVI Raster Data at 30 m Spatial ResolutionNational Science and Technology Resource Sharing Service Platform
(http://www.nesdc.org.cn (accessed on 11 February 2025))
Net Primary Productivity (NPP) DataNPP Data at 500 m Spatial ResolutionNASA Earth Science Data Website
(https://lpdaac.usgs.gov (accessed on 22 January 2025))
Road Network DataRoad Network Data within ChinaOpenStreetMap
(https://www.openstreetmap.org (accessed on 24 January 2025))
Population Raster DataPopulation Distribution Raster Data at 1 km Spatial ResolutionLandScan Platform
(https://landscan.ornl.gov(accessed on 22 January 2025))
GDP DataGDP Data of Yunnan ProvinceYunnan Province Statistical Yearbook
Table 2. Definitions and classification of decoupling types.
t-Values∆CL∆ECDecoupling StateMeaning
t < 0>0<0Strong negative decouplingIncrease in construction land area and decrease in economic development level.
<0>0Absolute decouplingReduced construction land area and increased economic development level.
0 < t < 0.8<0<0Weak negative decouplingThe reduction rate of construction land area exceeds the reduction rate of economic development level.
>0>0Weak decouplingThe growth rate of the construction land area is slower than that of the economic development level.
0.8 < t < 1.2<0<0Fading connectionThe construction land area is relatively correlated with the reduction rate of the economic development level.
>0>0Expansion connectionThe construction land area is relatively consistent with the growth rate of the economic development level.
t > 1.2<0<0Recession decouplingThe reduction rate of construction land area is slower than the reduction rate of economic development level.
>0>0Expansion negative decouplingThe growth rate of the construction land area exceeds the growth rate of the economic development level.
Table 3. Regression results of the econometric model.
VariableCoefficientVariableCoefficient
DEM–0.09NPP–0.05
POP21.36 ***RD0.22 **
GDP11.74 ***NDVI–0.24 **
Note: *** p < 0.01 and ** p < 0.05 denote significance levels of 1% and 5% respectively.
Table 4. Statistics on the decoupling status between construction land expansion and economic development level in basins.
Decoupling State1990~19951995~20002000~20052005~20102010~20152015~2020
Expansion negative decoupling10 (9.80%)19 (19.00%)7 (6.36%)50 (36.50%)8 (4.21%)61 (25.96%)
Expansion connection7 (6.86%)8 (8.00%)7 (6.36%)13 (9.49%)5 (2.63%)25 (10.64%)
Strong negative decoupling2 (1.96%)4 (4.00%)2 (1.82%)2 (1.46%)7 (3.68%)6 (2.55%)
Absolute decoupling27 (6.47%)6 (6.00%)25 (22.73%)16 (11.68%)40 (21.05%)43 (18.30%)
Weak negative decoupling2 (1.96%)2 (2.00%)1 (0.91%)3 (2.19%)4 (2.11%)5 (2.13%)
Weak decoupling53 (51.96%)61 (61.00%)68 (61.82%)53 (38.69%)126 (66.32%)93 (39.57%)
Fading connection1 (0.43%)
Recession decoupling1 (0.98%)1 (0.43%)
Disclaimer/Publisher’s Note: The statements, opinions and data contained in all publications are solely those of the individual author(s) and contributor(s) and not of MDPI and/or the editor(s). MDPI and/or the editor(s) disclaim responsibility for any injury to people or property resulting from any ideas, methods, instructions or products referred to in the content.