
Cropping and Transformation Features of Non-Grain Cropland in Mainland China and Policy Implications


Abstract
1. Introduction
2. Study Area
3. Technical Contents
3.1. Benchmark
3.2. Definition of NGP
3.3. Technical Routine
3.4. Data Acquisition and Preprocessing
3.4.1. Spatial Datasets of Grain and Cropland
3.4.2. Land Use Map
3.4.3. Ancillaries
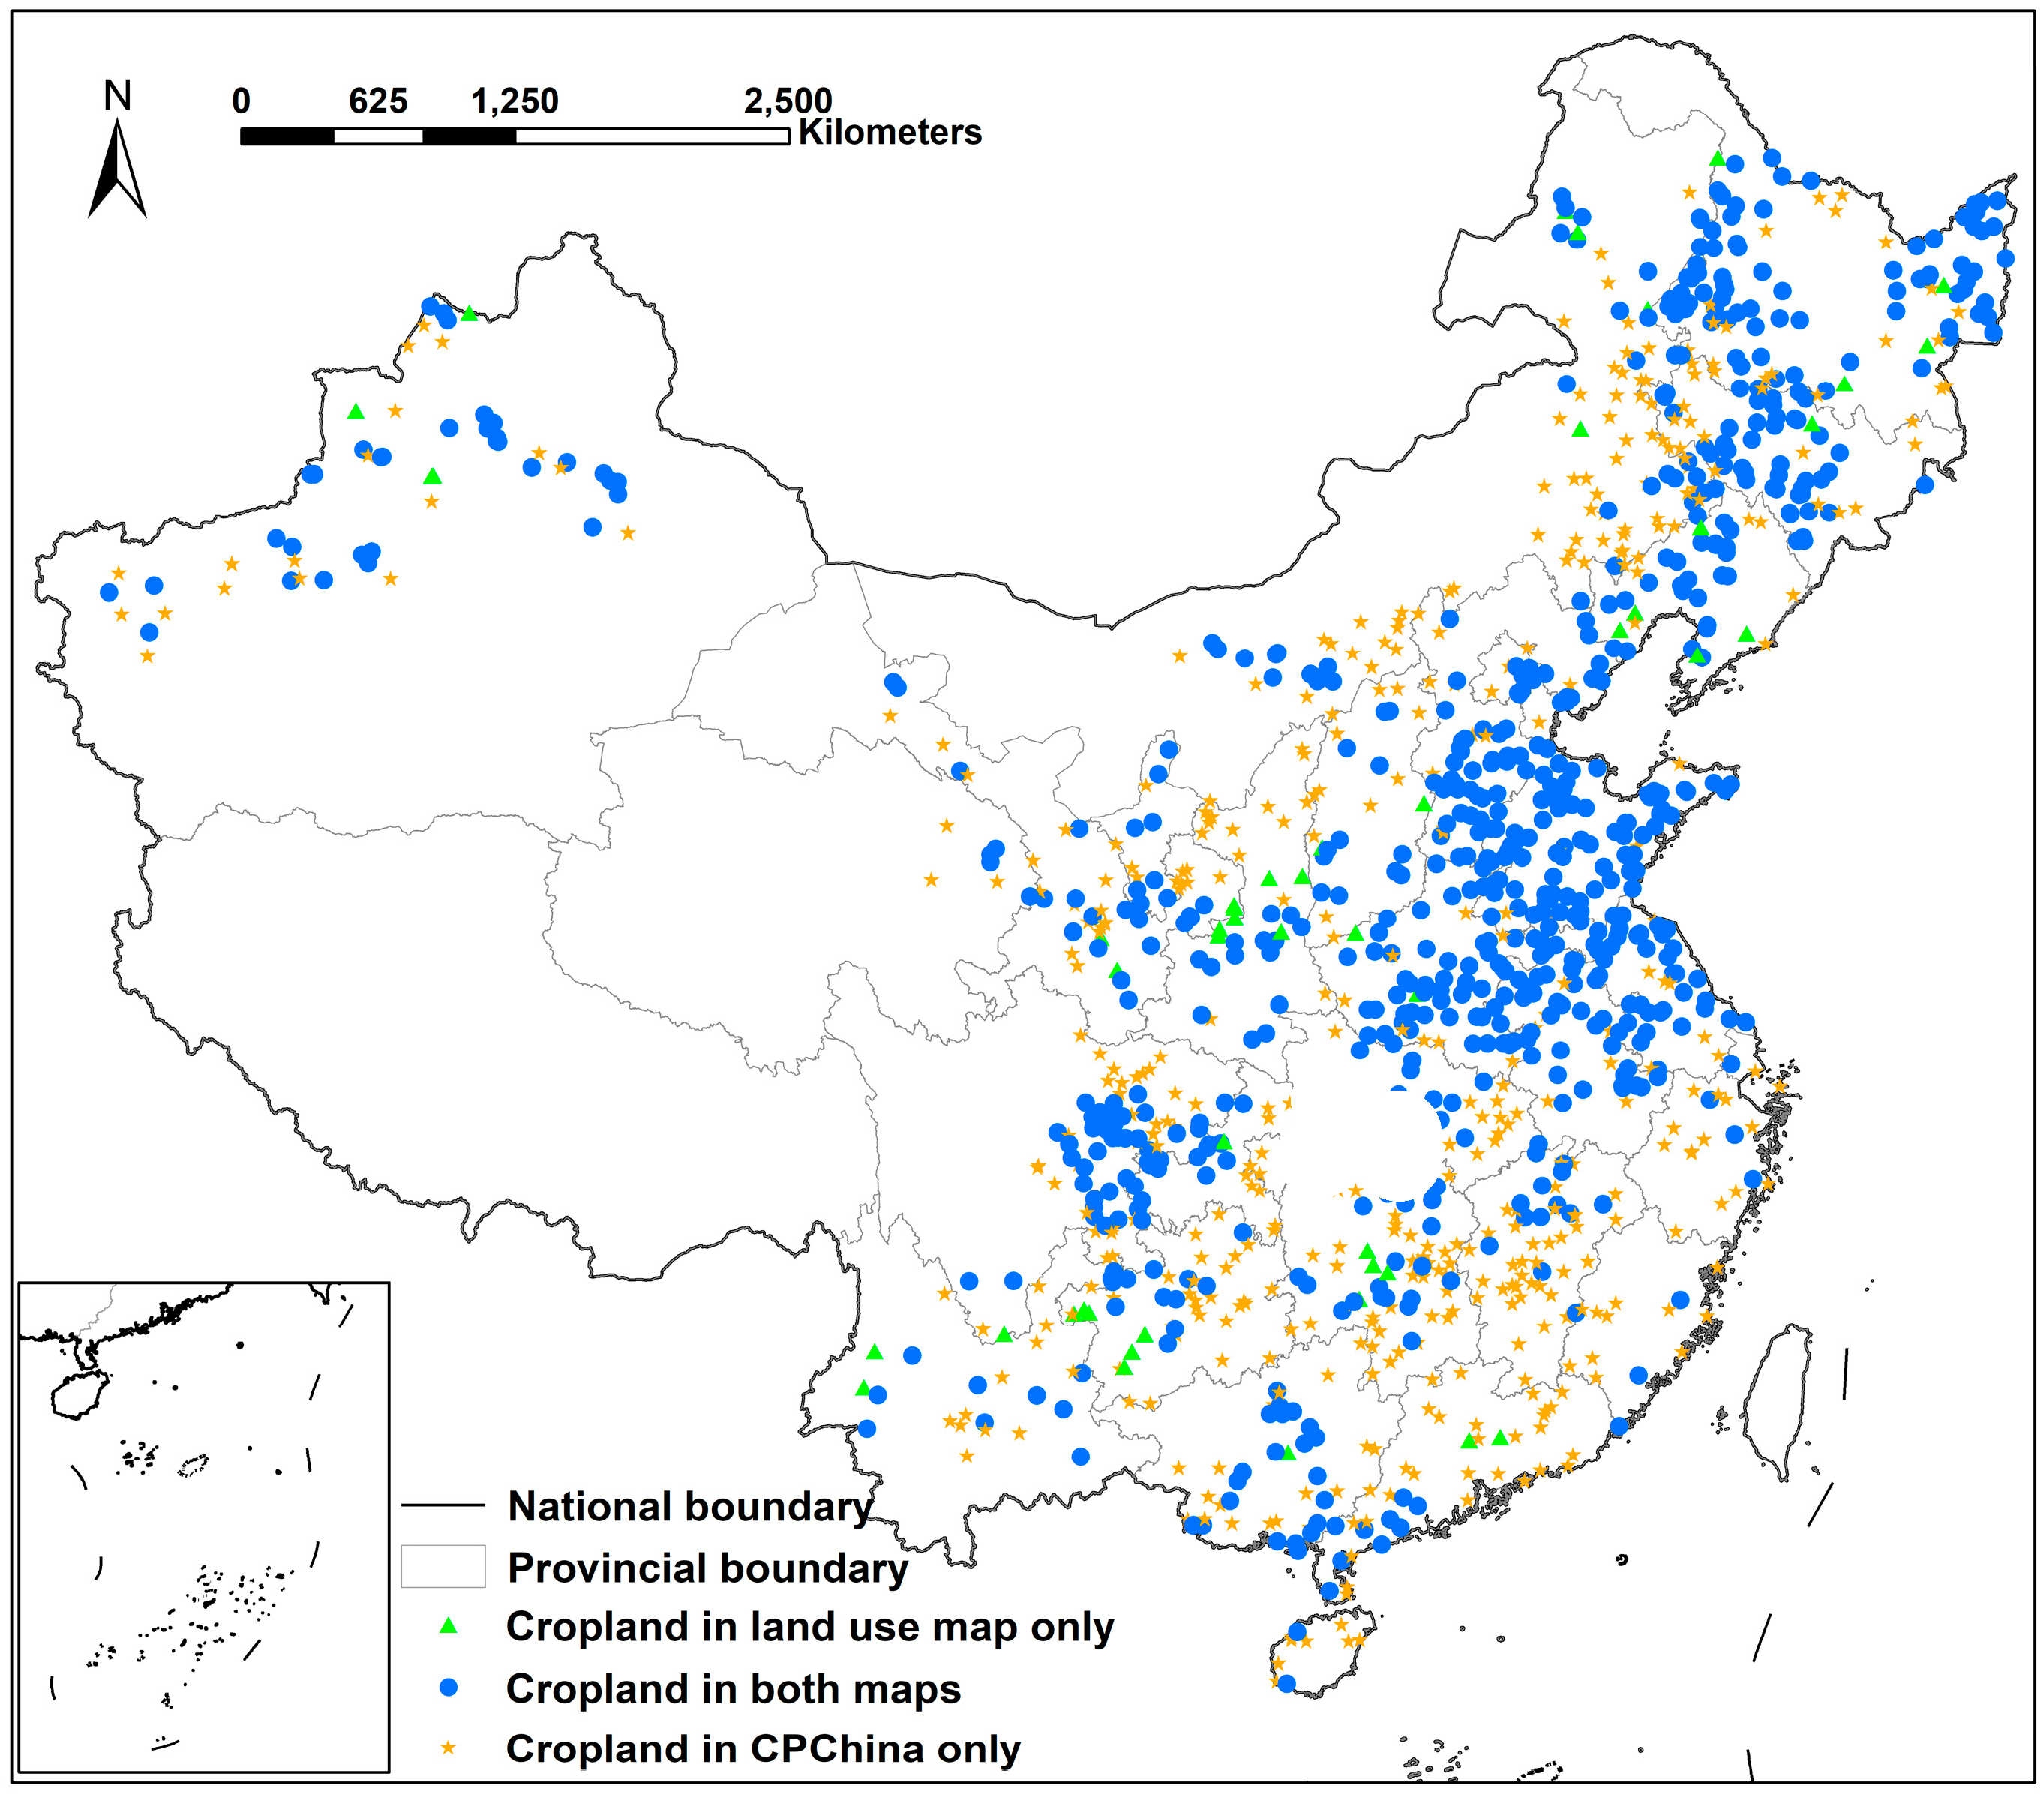
3.4.4. Verification of Spatial Dataset
4. Results
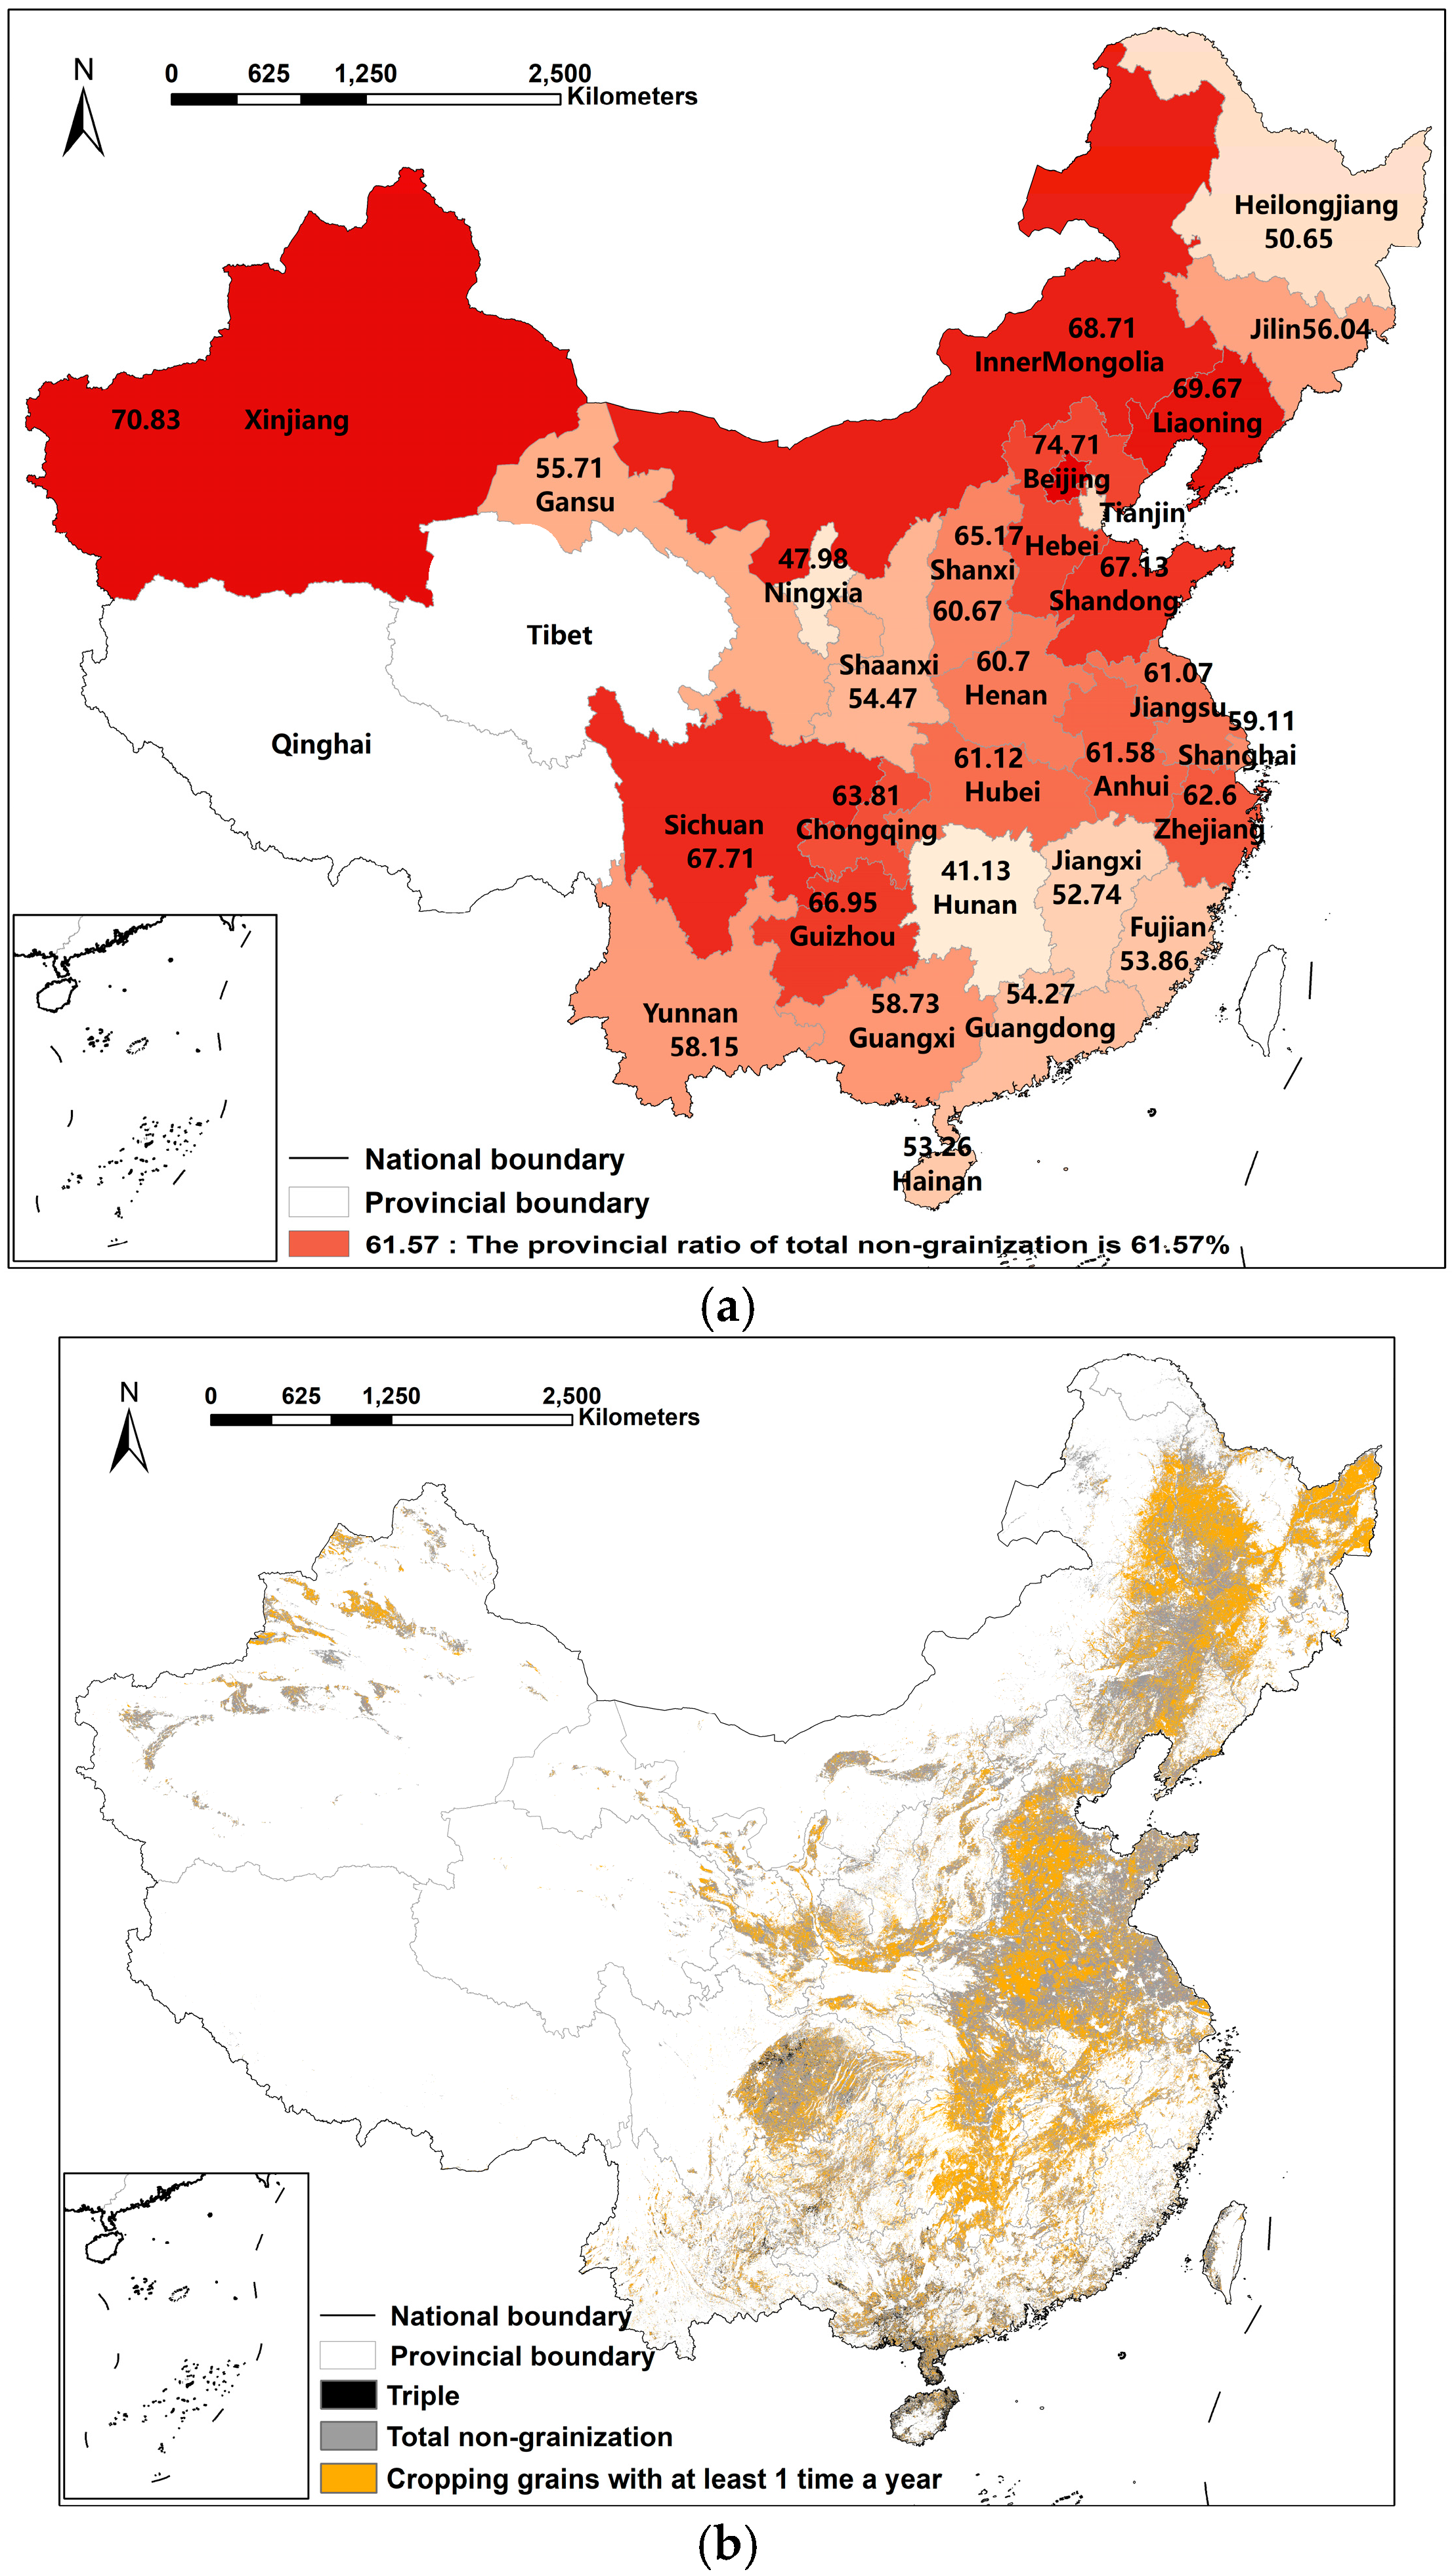
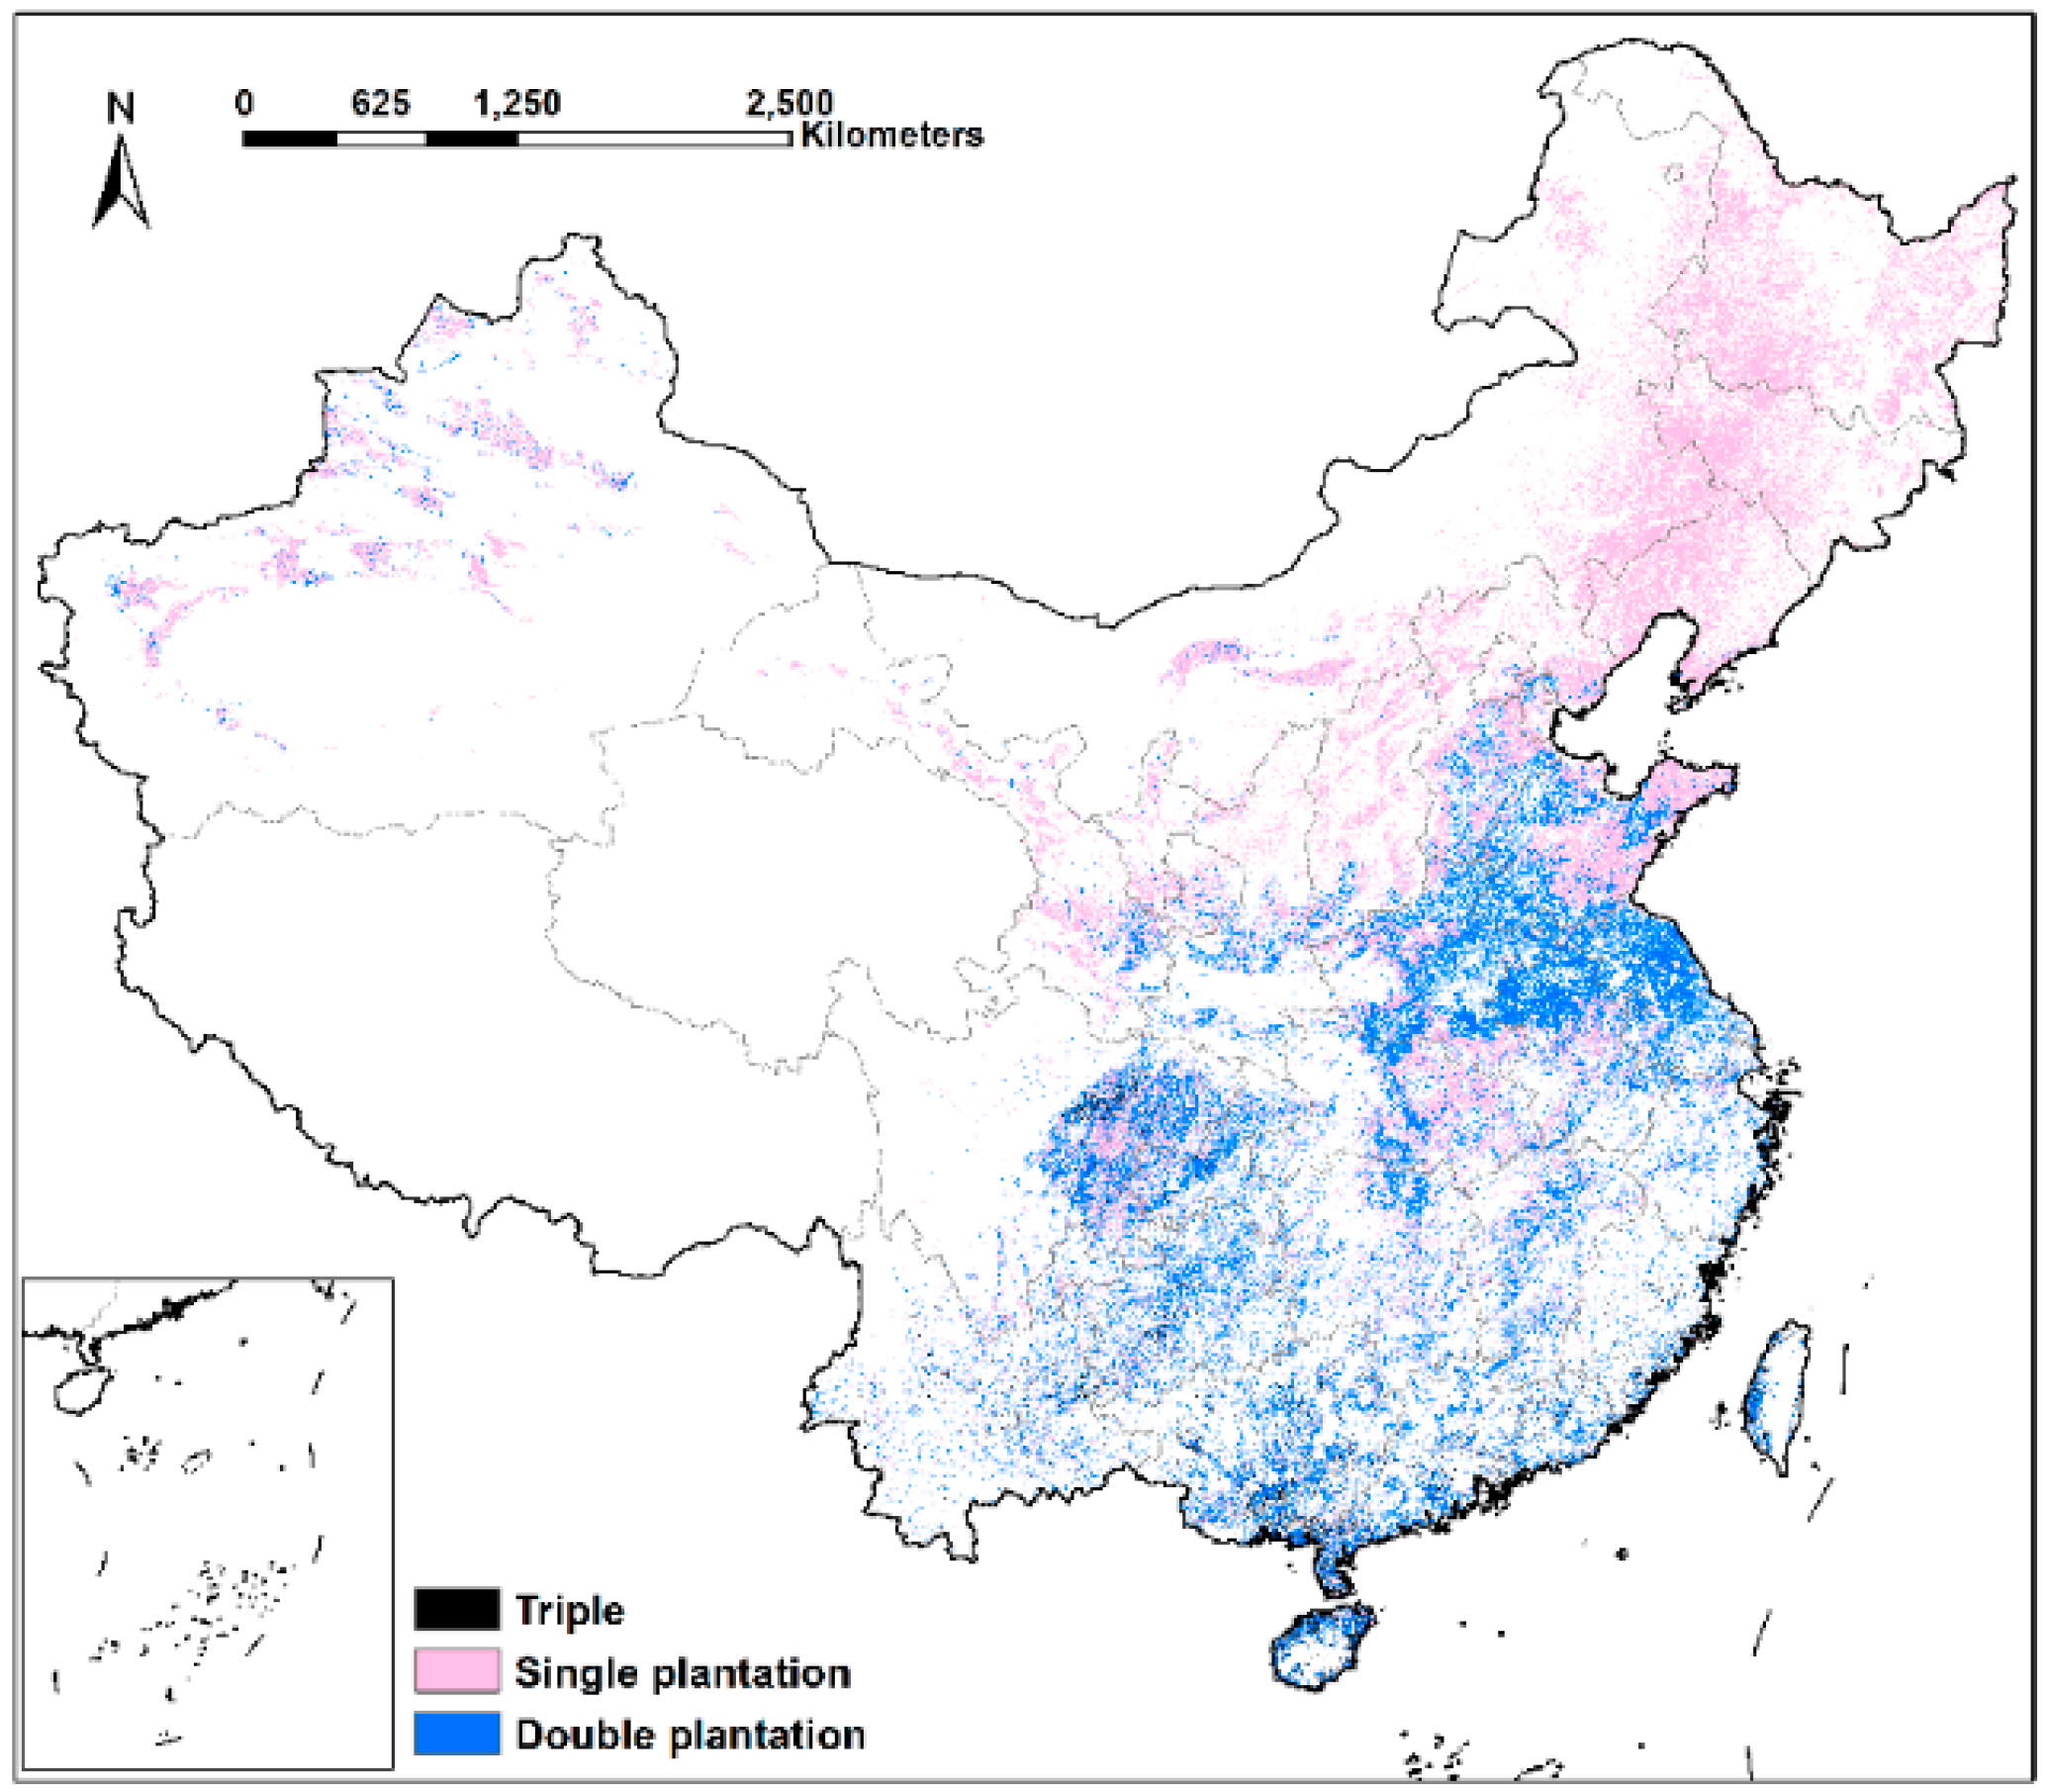
4.1. Quantitative, Spatial, and Structural Features of NGP in Benchmark
4.2. The Potential Space for Regaining Grains
4.3. Quantifying the Potentiality of Expanding Grain Plantation
5. Discussion
5.1. Possible Suggestions for NGP Governance
5.2. Uncertainties and Future Work
6. Conclusions
Author Contributions
Funding
Data Availability Statement
Conflicts of Interest
References
- Wang, Y.; Chen, Y.J.; Yi, X.Y.; Xiao, B.L. The non-grain problem in the process of land transfer and the countermeasures. Chin. J. Agric. Resour. Reg. Plan. 2011, 32, 13–16. [Google Scholar]
- Prăvălie, R.; Patriche, C.; Borrelli, P.; Panagos, P.; Roșca, B.; Dumitraşcu, M.; Nita, I.-A.; Săvulescu, I.; Birsan, M.-V.; Bandoc, G. Arable lands under the pressure of multiple land degradation processes: A global perspective. Environ. Res. 2021, 194, 110697. [Google Scholar] [CrossRef]
- Sheng, Y.; Song, L. Agricultural production and food consumption in China: A long-term projection. China Econ. Rev. 2019, 53, 15–29. [Google Scholar] [CrossRef]
- The Release of the Third National Land Resource Survey. Available online: https://www.gov.cn/xinwen/2021-08/26/content_5633497.htm (accessed on 12 December 2024).
- Cheng, X.B.; Liu, Q.; Tao, T.; Liu, J.J.; Wang, F.; Tao, Q.; Ou, W.X. Non-grain production characteristics of cultivated land in rapidly urbanized regions and their mechanisms. China Popul. Resour. Environ. 2022, 32, 172–182. [Google Scholar]
- Opinions of the General Office of the State Council on Preventing “Non-Grain” of Cultivated Land and Stabilizing Grain Production. Available online: https://www.gov.cn/zhengce/content/2020-11/17/content_5562053.htm (accessed on 12 December 2024).
- Xiao, R.; Su, S.L.; Mai, G.C.; Zhang, Z.Y.; Yang, C.X. Quantifying determinants of cash crop expansion and their relative effects using logistic regression modeling and variance partitioning. Int. J. Appl. Erath Obs. Geoinf. 2015, 34, 258–263. [Google Scholar] [CrossRef]
- Yang, Y.; Yang, G.J.; Long, H.L.; Zhang, J.; Chen, W.N.; Gao, M.L.; Yang, Y. Multi-modal recognition method for non-grain cropland using remote sensing time series. Trans. Chin. Soc. Agric. Eng. 2024, 40, 283–294. [Google Scholar]
- He, T.T.; Jiang, S.Q.; Xiao, W.; Zhang, M.X.; Tang, T.; Zhang, H.Y. A non-grain production on cropland spatiotemporal change detection method based on Landsat time-series data. Land Degrad. Dev. 2024, 35, 3031–3047. [Google Scholar] [CrossRef]
- Qiu, B.W.; Jian, Z.Y.; Yang, P.; Tang, Z.H.; Zhu, X.L.; Duan, M.J.; Yu, Q.Y.; Chen, X.H.; Zhang, M.; Tu, P.; et al. Unveiling grain production patterns in China (2005–2020) towards targeted sustainable intensification. Agric. Syst. 2024, 216, 103878. [Google Scholar] [CrossRef]
- Pu, M.Z.; Zhou, L.; Zhong, Y.; Chen, M.S. Setting bottom lines for grain self-sufficiency in the grain production and consuming balancing areas and major grain consuming areas in China. Issues Agric. Econ. 2022, 7, 113–123. [Google Scholar]
- Feng, Y.B.; Ke, M.Y.; Zhou, T. Spatio-temporal dynamics of non-grain production of cultivated land in China. Sustainability 2022, 14, 14286. [Google Scholar] [CrossRef]
- Chen, F.; Liu, J.N.; Chang, Y.Y.; Zhang, Q.; Yu, H.C.; Zhang, S.L. Spatial pattern differentiation of non-grain cultivated land and its driving factors in China. China Land Sci. 2021, 35, 33–43. [Google Scholar]
- Zhang, D.; Yang, W.; Kang, D.; Zhang, H. Spatio-temporal charateristics and policy implication for non-grain production of cultivated land in Guanzhong Region. Land Use Policy 2023, 125, 106466. [Google Scholar] [CrossRef]
- Chang, Y.Y.; Liu, J.N.; Ma, J.; Yu, H.C.; Chen, F. Spatial pattern and driving factors of non-grain conversion on cultivated land in arid and semi-arid regions. J. Agric. Resour. Environ. 2023, 40, 333–344. [Google Scholar]
- Liang, X.; Jin, X.; Liu, J.; Yin, Y.; Gu, Z.; Zhang, J.; Zhou, Y. Formation mechanism and sustainable productivity impacts of non-grain croplands: Evidence from Sichuan Province, China. Land Degrad. Dev. 2023, 34, 1120–1132. [Google Scholar] [CrossRef]
- Hu, J.D.; Wang, H.; Song, Y. Spatio-temporal evolution and driving factors of non-grain production in Hubei Province based on a non-grain index. Sustainability 2024, 15, 9042. [Google Scholar] [CrossRef]
- Chen, X.B.; Tao, Y.; Huang, C.H.; Yi, J.L.; Yi, D.; Wang, F.; Tao, Q.; Xi, H.H.; Ou, W.X. Unraveling the Causal Mechanisms for Non-Grain Production of Cultivated Land: An Analysis Framework Applied in Liyang, China. Land 2022, 11, 1888. [Google Scholar] [CrossRef]
- FAO, World Food and Agriculture–Statistic Yearbook 2022. Available online: https://www.fao.org/statistics/en/ (accessed on 7 October 2024).
- Su, H.; Liu, F.; Zhang, H.; Ma, X.; Sun, A. Progress and prospects of non-grain production of cultivated land in China. Sustainability 2024, 16, 3537. [Google Scholar] [CrossRef]
- Chen, F.; Hua, Z.Y.; Ma, J.; Jiang, F.F.; Zhi, X.J.; Zhu, X.H. The influence of non-grain conversion of cultivated land on soil health and mechanism. Resour. Sci. 2023, 45, 2210–2221. [Google Scholar]
- Hao, S.H.; Wu, K.N.; Dong, X.R.; Yang, Q.J.; Gao, X.H. Identification criteria of cultivated horizon damage for non-grain cultivated land. Chin. J. Soil Sci. 2021, 52, 1028–1033. [Google Scholar]
- Yuan, C.C.; Zhang, D.X.; Liu, L.M.; Ye, J.W. Regional characteristics and spatial-temporal distribution of cultivated land change in China during 2009–2018. Trans. Chin. Soc. Agric. Eng. 2021, 37, 267–278. [Google Scholar]
- Ye, S.J.; Song, C.Q.; Cheng, C.X.; Gao, P.C.; Shen, S.; Mu, W.S. Five issues and countermeasures of China cropland resource use. Bull. Chin. Acad. Sci. 2023, 38, 1962–1976. [Google Scholar]
- Su, Y.; Li, C.L.; Wang, K.; Deng, J.S.; Shahtahmassebi, A.R.; Zhang, L.P.; Ao, W.J.; Guan, T.; Gan, M.Y. Quantifying the spatiotemporal dynamics and multi-aspect performance of non-grain production during 2000–2015 at a fine scale. Ecol. Indic. 2019, 101, 410–419. [Google Scholar] [CrossRef]
- Qiu, B.W.; Hu, X.; Chen, C.C.; Tang, Z.H.; Yang, P.; Zhu, X.L.; Yan, C.; Jian, Z.Y. Maps of cropping patterns in China during 2015–2021. Sci. Data 2022, 9, 479. [Google Scholar] [CrossRef] [PubMed]
- National Standardization Administration. Cultivated Land Quality Grade GB/T 33469-2016. 2016. Available online: https://www.sac.gov.cn/xw/bzhyw/art/2017/art_0d446a0b7faa4f92ae99bf724cc2187a.html (accessed on 12 December 2024).
- Yang, J.X.; Huang, X. The 30m annual land cover dataset and its dynamics in China from 1990 to 2019. Earth Syst. Sci. Data 2021, 13, 3907–3925. [Google Scholar] [CrossRef]
- Ning, J.; Liu, J.Y.; Kuang, W.H.; Xu, X.L.; Zhang, S.W.; Yan, C.Z.; Li, R.D.; Wu, S.X.; Hu, Y.F.; Du, G.M.; et al. Spatio-temporal patterns and characteristics of land-use change in China during 2010–2015. J. Geogr. Sci. 2018, 28, 547–562. [Google Scholar] [CrossRef]
- Lu, M.; Wu, W.B.; Zhang, L.; Liao, A.P.; Peng, S.; Tang, H.J. A comparative analysis of five global cropland datasets in China. Sci. China Earth Sci. 2016, 59, 2307–2317. [Google Scholar] [CrossRef]
- Yang, Y.K.; Xiao, P.F.; Feng, X.Z.; Li, H.X.; Chang, X.; Feng, W.D. Comparison and assessment of large-scale land cover datasets in China and adjacent regions. J. Remote Sens. 2014, 18, 464–475. [Google Scholar]
- Liu, Y.Z.; Wu, W.B.; Li, H.L.; Imtiaz, M.; Li, Z.L.; Zhou, Q.B. Intercomparison on four irrigated cropland maps in Mainland China. Sensors 2018, 18, 1197. [Google Scholar] [CrossRef]
- Kuang, W.H.; Zhang, S.W.; Du, G.M.; Yan, C.Z.; Wu, S.X.; Li, R.D.; Lu, D.S.; Pan, T.; Ning, J.; Guo, C.Q.; et al. Remotely sensed mapping and analysis of spatio-temporal patterns of land use change across China in 2015-2020. Acta Geogr. Sin. 2022, 77, 1056–1071. [Google Scholar]
- Chen, S.C.; Zhang, Y.N.; Zhu, Y.L.; Ma, L.; Zhao, J.H. The battle of crops: Unveiling the shift from grain to non-grain use of farmland in China? Int. J. Agric. Sustain. 2023, 21, 2262752. [Google Scholar] [CrossRef]
- Yan, H.M.; Ji, Y.Z.; Liu, f.; Hu, Y.F.; Kuang, W.H. Potential prompted productivity and spatial patterns of medium and low–yield cropland in China. J. Geogr. Sci. 2016, 26, 259–271. [Google Scholar] [CrossRef]
- Gao, Y.K.; Zhao, H.F.; Zhao, C.; Hu, G.H.; Zhang, H.; Liu, X.; Li, N.; Hou, H.Y.; Li, X. Spatial and temporal variations of maize and wheat yield gaps and their relationships with climate in China. Agric. Water Manag. 2022, 270, 107714. [Google Scholar] [CrossRef]
- Tan, G.W.; Wang, X.D.; Wang, J.M.; Mei, X.R.; Liu, X. National food security strategy in the new situation. China Eng. Sci. 2023, 25, 1–13. [Google Scholar] [CrossRef]
- Zhang, M.; Wu, B.; Zeng, H.; He, G.; Liu, C.; Tao, S.; Zhang, Q.; Nabil, M.; Tian, F.; Bofana, J.; et al. GCI30: A global dataset of 30 m cropping intensity using multisource remote sensing imagery. Earth Syst. Sci. Data 2021, 13, 4799–4817. [Google Scholar] [CrossRef]
- Tao, J.B.; Zhang, X.Y.; Liu, Y.Q.; Jiang, Q.Y.; Zhou, Y. Estimating agricultural cropping intensity using a new temporal mixture analysis method from time series MODIS. Remote Sens. 2023, 15, 4712. [Google Scholar] [CrossRef]
- Wang, L.Y.; Zhang, S.Y.; Xiong, Q.Q.; Liu, Y.; Liu, Y.F.; Liu, Y.L. Spatiotemporal dynamics of cropland expansion and its driving factors in the Yangtze River Economic Belt: A nuanced analysis at the county scale. Land Use Policy 2022, 119, 106168. [Google Scholar] [CrossRef]
- Ma, J.K.; Li, G.S.; Li, N. Non-grain or grain0oriented: The influence of farmland management scale on planting structure. Chin. J. Agric. Resour. Reg. Plan. 2023, 44, 90–100. [Google Scholar]
- Wang, S.L.; Jin, X.B.; Zhang, X.X.; Shi, S.; Shi, Y.C.; Liu, J.; Zhou, Y.K. Potential and differentiated control of non-grain cultivated land consolidation in major grain producing areas: A case study of the Chengdu Plain. Prog. Geogr. 2023, 42, 2172–2185. [Google Scholar] [CrossRef]
- Chen, F.; Liu, J.N.; Guo, W.H.; Ma, J.; Yang, B.; Zhu, X.H. Spatio-temporal pattern changes and interfering factors of transferred farmland in China in the past 20 years. Resour. Environ. Yangze Basin 2024, 33, 1793–1804. [Google Scholar]
- Zuo, L.J.; Zhang, Z.X.; Carlson, K.M. Progress towards sustainable intensification in China challenged by land-use change. Nat. Sustain. 2018, 1, 304–313. [Google Scholar] [CrossRef]
- Zhang, B.L.; Sun, P.L.; Jiang, G.H.; Zhang, R.J.; Gao, J.B. Rural land use transition of mountainous areas and policy implications for land consolidation in China. J. Geogr. Sci. 2019, 29, 1713–1730. [Google Scholar] [CrossRef]
- Zhang, B.L.; Gao, J.B.; Gao, Y.; Cai, W.B.; Zhang, F.R. Land use transition of mountainous rural areas in China. Acta Geographic Sinica 2018, 73, 503–517. [Google Scholar]
- Zhang, Y.S.; Feng, Y.F.; Wang, F.; Chen, Z.L.; Li, X.H. Spatiotemporal differentiation and driving mechanism of cultivated land non-grain conversion in Guangdong Province. Resour. Sci. 2022, 44, 480–493. [Google Scholar] [CrossRef]
- Xie, H.L.; Ouyang, Z.Y.; Chen, J.R. Does Cultivated Land Fragmentation Promote “Non-grain” Utilization of Cultivated Land: Based on a Micro Survey of Farmers in the Hilly and Mountainous Areas of Fujian. China Land Sci. 2022, 36, 47–56. [Google Scholar]
- Xu, C.; Guo, J.; Yi, J.L.; Ou, M.H. Analysis on the evolution of spatiotemporal pattern and driving factors of non-grain cultivated land in Jiangsu Province from 1996–2020. Resour. Environ. Yangze Basin 2024, 33, 436–447. [Google Scholar]
- Cai, Z.; Hu, Q.; Zhang, X.; Yang, J.; Wei, H.; Wang, J.; Zeng, Y.; Yin, G.; Li, W.; You, L.; et al. Improving agricultural field parcel delineation with a dual branch spatiotemporal fusion network by integrating multimodal satellite data. ISPRS J. Photogramm. 2023, 205, 34–49. [Google Scholar] [CrossRef]
- Pan, B.H.; Zheng, Y.; Shen, R.Q.; Ye, T.; Zhao, W.Z.; Jie, D.; Ma, H.Q.; Yuan, W.P. High Resolution Distribution Dataset of Double-Season Paddy Rice in China. Remote Sens. 2021, 13, 4609. [Google Scholar] [CrossRef]
- Qiu, B.W.; Lu, B.L.; Tang, Z.H.; Dong, J.W.; Xu, W.M.; Liang, J.Z.; Chen, N.; Chen, J.P.; Wang, L.G.; Zhang, C.M.; et al. National-scale 10m maps of cropland use intensity in China during 2018–2023. Nat. Sci. Data 2024, 11, 691. [Google Scholar] [CrossRef]


| Cropping Systems | NGP | |
|---|---|---|
| Single | Grains | No |
| Non-grains | Yes | |
| Double | Grains + non-grains | No |
| Grains + grains | No | |
| Non-grains + non-grains | Yes | |
| Province | Devotion (%) | Province | Devotion (%) | ||
|---|---|---|---|---|---|
| Other Double | Other Single | Other Double | Other Single | ||
| Jiangsu | 89.03 | 10.97 | Shandong | 43.97 | 56.03 |
| Hainan | 83.58 | 16.42 | Hubei | 43.63 | 56.37 |
| Guandong | 82.22 | 17.78 | Shaanxi | 42.73 | 57.27 |
| Guangxi | 80.88 | 19.12 | Tianjin | 27.33 | 72.67 |
| Fujian | 80.76 | 19.24 | Hebei | 23.56 | 76.44 |
| Guizhou | 74.05 | 25.95 | Gansu | 21.51 | 78.49 |
| Zhejiang | 72.31 | 27.69 | Xinjiang | 17.71 | 82.29 |
| Anhui | 71.47 | 28.53 | Beijing | 15.90 | 84.10 |
| Chongqing | 69.07 | 30.93 | Shanxi | 12.19 | 87.81 |
| Yunnan | 67.45 | 32.55 | Ningxia | 9.14 | 90.86 |
| Henan | 65.14 | 34.86 | Inner Mongolia | 1.76 | 98.24 |
| Hunan | 62.18 | 37.82 | Liaoning | 0.93 | 99.07 |
| Jiangxi | 60.70 | 39.30 | Jilin | 0.00 | 100.00 |
| Sichuan | 57.83 | 42.17 | Heilongjiang | 0.00 | 100.00 |
| Shanghai | 55.12 | 44.88 | |||
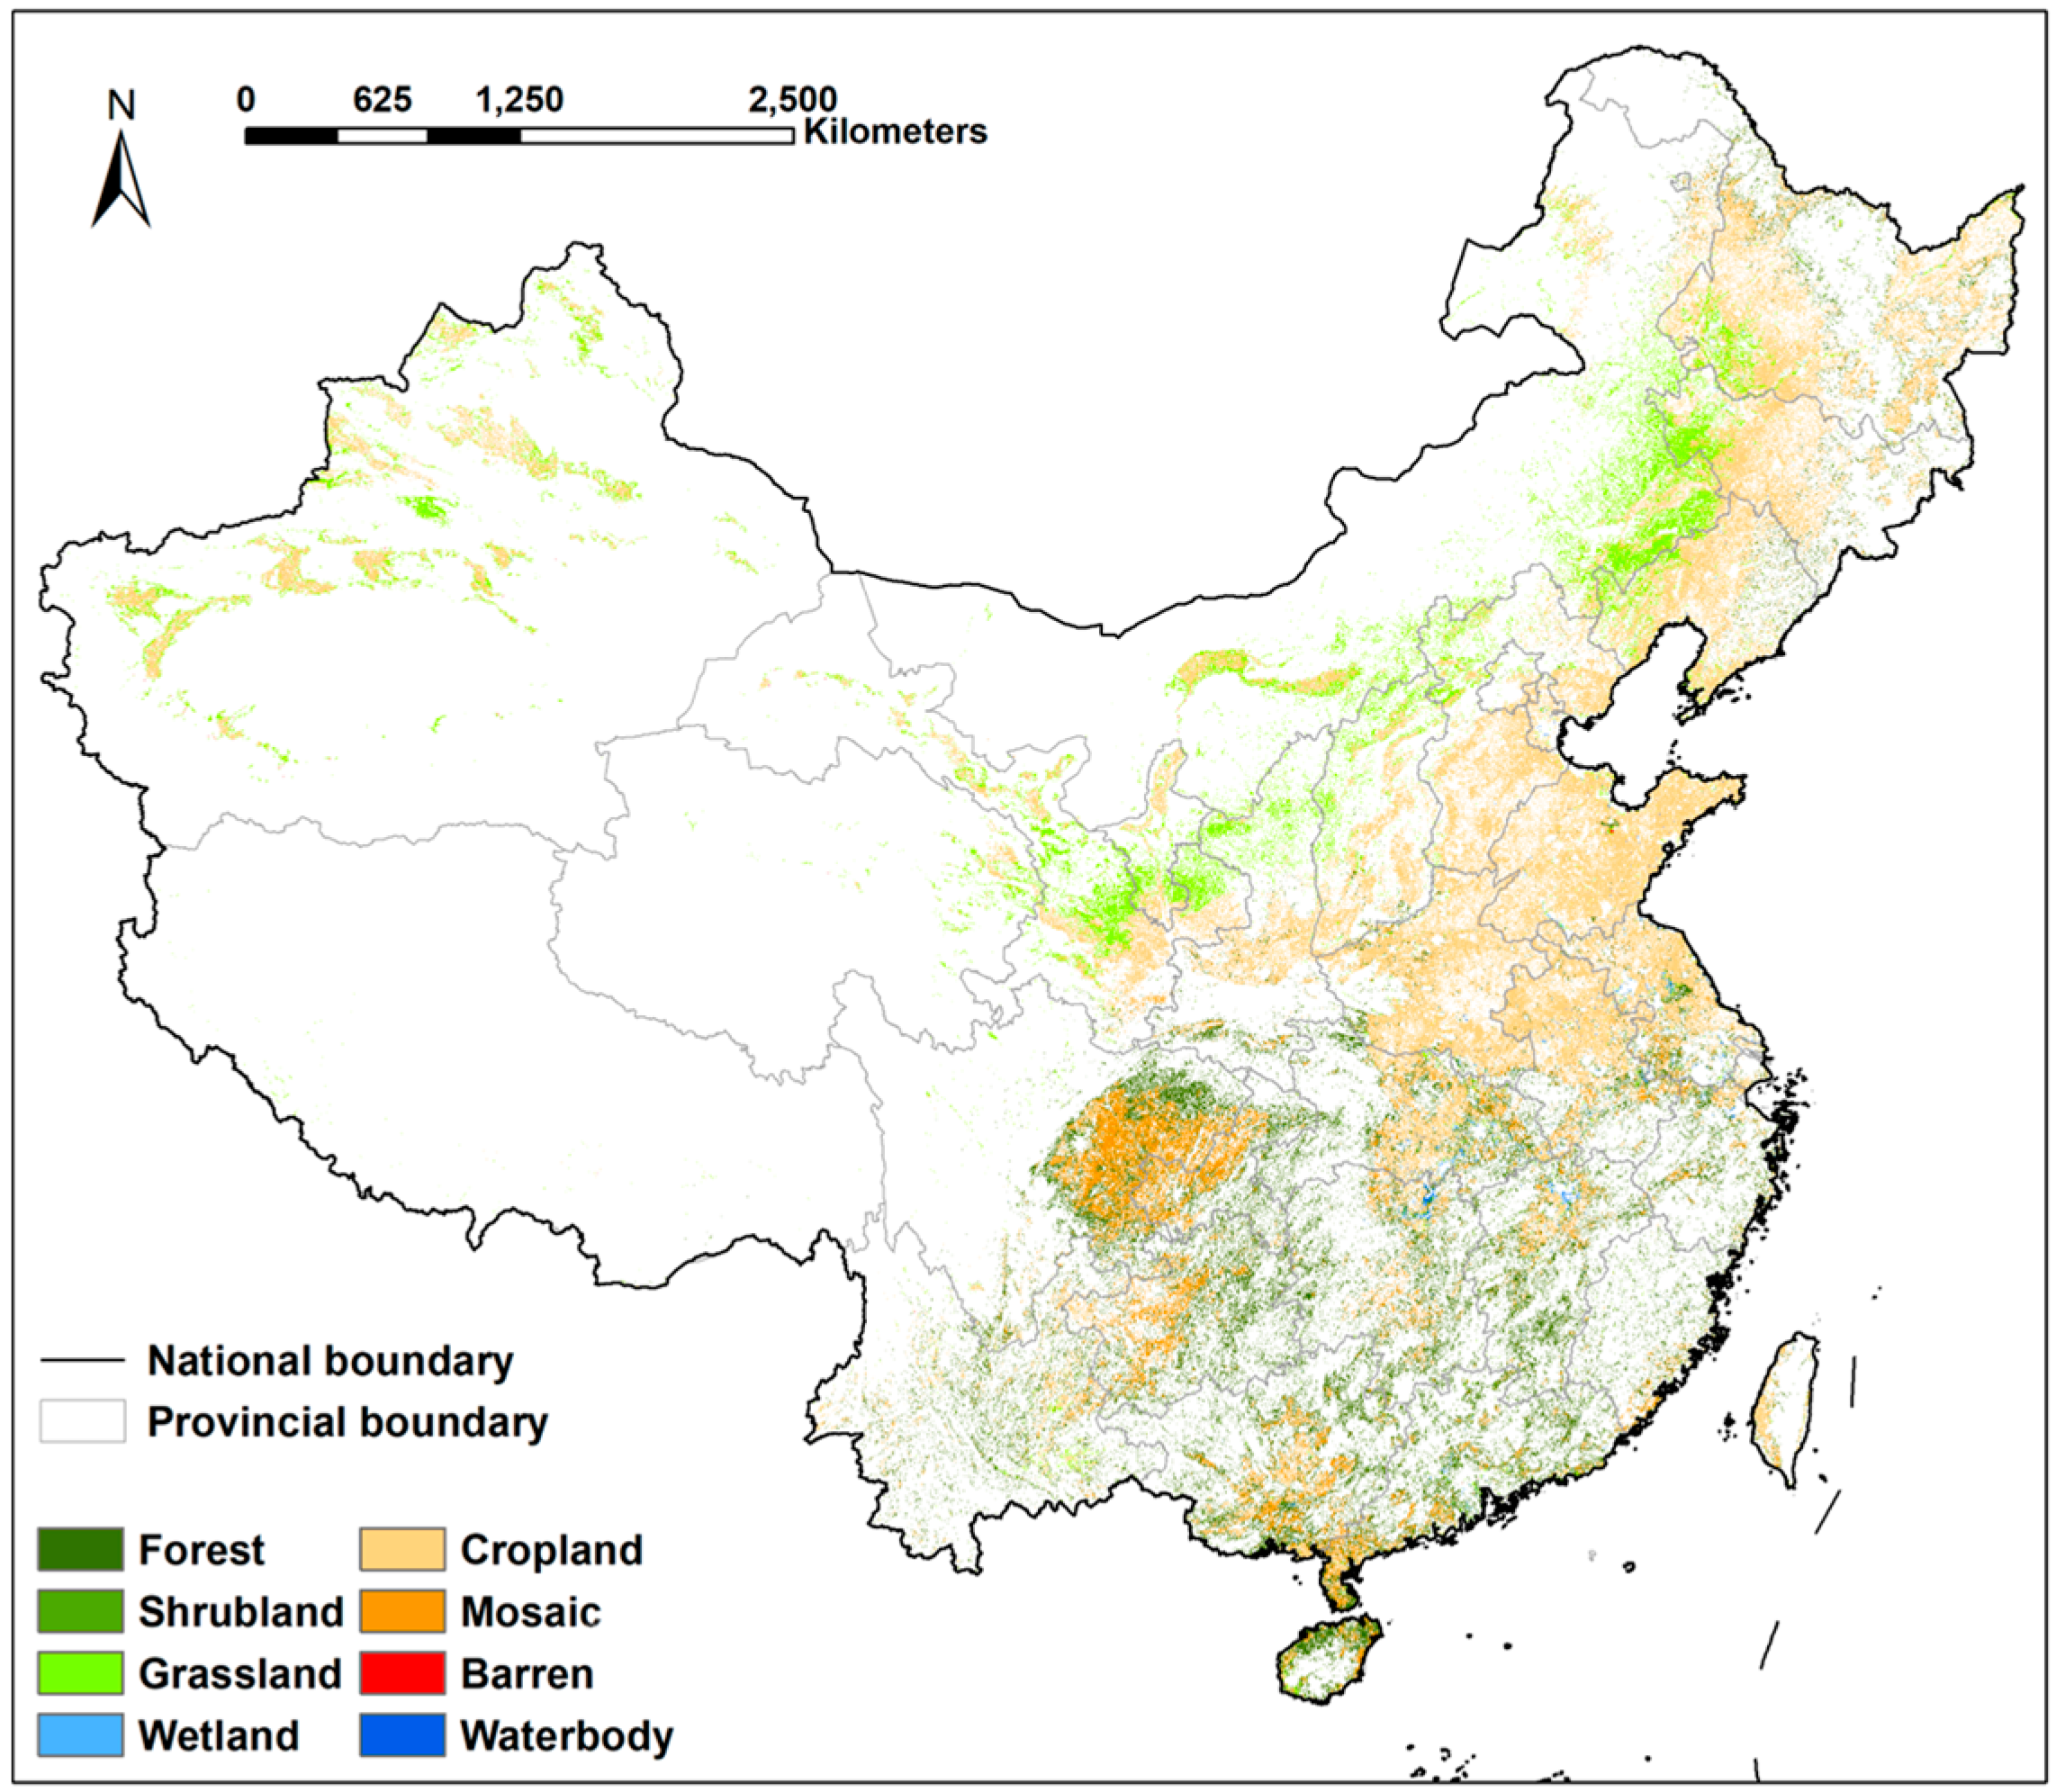
| Province | Forest | Grassland | Wetland | Cropland | Mosaic | Barren | Waterbody | Shrubland |
|---|---|---|---|---|---|---|---|---|
| Shandong | 0.53 | 2.09 | 0.24 | 96.82 | 0.01 | 0.01 | 0.30 | 0.00 |
| Tianjing | 0.28 | 7.27 | 0.57 | 89.70 | 0.00 | 0.00 | 2.19 | 0.00 |
| Henan | 6.70 | 1.43 | 0.17 | 89.77 | 1.73 | 0.00 | 0.20 | 0.00 |
| Hebei | 0.61 | 15.44 | 0.05 | 83.85 | 0.00 | 0.00 | 0.04 | 0.00 |
| Liaoning | 5.92 | 18.28 | 0.11 | 75.37 | 0.14 | 0.00 | 0.18 | 0.00 |
| Anhui | 14.10 | 1.16 | 0.83 | 75.33 | 7.74 | 0.00 | 0.85 | 0.00 |
| Jiangsu | 14.47 | 2.53 | 1.73 | 74.63 | 5.27 | 0.00 | 1.36 | 0.00 |
| Beijing | 3.01 | 25.71 | 0.12 | 71.06 | 0.00 | 0.01 | 0.06 | 0.03 |
| Shanxi | 2.29 | 31.56 | 0.01 | 65.95 | 0.18 | 0.00 | 0.00 | 0.00 |
| Heilongjiang | 13.49 | 12.35 | 0.22 | 71.29 | 2.50 | 0.01 | 0.14 | 0.00 |
| Jilin | 7.87 | 21.48 | 0.14 | 68.35 | 2.13 | 0.01 | 0.02 | 0.00 |
| Ningxia | 0.02 | 34.23 | 0.01 | 65.74 | 0.00 | 0.00 | 0.00 | 0.00 |
| Shanghai | 18.28 | 5.37 | 3.75 | 60.05 | 3.31 | 0.02 | 9.22 | 0.00 |
| Gansu | 1.31 | 38.93 | 0.01 | 58.14 | 1.53 | 0.08 | 0.00 | 0.00 |
| Xinjiang | 0.04 | 43.22 | 0.03 | 56.46 | 0.02 | 0.20 | 0.00 | 0.02 |
| Shaanxi | 19.21 | 24.68 | 0.05 | 50.40 | 5.64 | 0.00 | 0.00 | 0.02 |
| Hubei | 40.03 | 2.50 | 1.82 | 43.01 | 11.64 | 0.00 | 1.00 | 0.00 |
| Inner Mongolia | 1.91 | 65.46 | 0.02 | 31.93 | 0.66 | 0.02 | 0.00 | 0.00 |
| Fujian | 72.55 | 4.22 | 1.01 | 4.54 | 17.30 | 0.01 | 0.37 | 0.00 |
| Hainan | 69.31 | 5.11 | 0.30 | 7.71 | 17.34 | 0.00 | 0.22 | 0.00 |
| Hunan | 67.32 | 1.55 | 0.94 | 10.48 | 17.96 | 0.00 | 1.76 | 0.00 |
| Jiangxi | 67.09 | 2.59 | 0.93 | 17.12 | 10.76 | 0.00 | 1.50 | 0.00 |
| Guangdong | 65.20 | 3.67 | 0.77 | 9.38 | 20.67 | 0.00 | 0.30 | 0.00 |
| Zhejiang | 63.15 | 2.02 | 1.44 | 16.94 | 15.03 | 0.01 | 1.42 | 0.00 |
| Guangxi | 58.49 | 1.09 | 0.20 | 15.81 | 24.30 | 0.00 | 0.11 | 0.00 |
| Yunnan | 57.49 | 7.98 | 0.06 | 27.09 | 7.38 | 0.00 | 0.00 | 0.00 |
| Guizhou | 64.22 | 0.34 | 0.03 | 4.05 | 31.37 | 0.00 | 0.00 | 0.00 |
| Chongqing | 44.64 | 0.28 | 0.30 | 0.93 | 53.84 | 0.00 | 0.01 | 0.00 |
| Sichuan | 44.24 | 1.88 | 0.11 | 4.38 | 49.39 | 0.00 | 0.00 | 0.00 |
| Total | 23.24 | 15.55 | 0.38 | 50.53 | 9.94 | 0.02 | 0.34 | 0.00 |
| Region | Provincial | Contribution to the Nation | ||
|---|---|---|---|---|
| Space Extension (%) | Extreme Production Extension (%) | Space Extension (%) | Extreme Production Extension (%) | |
| Beijing | 9.98 | 12.14 | 0.05 | 0.04 |
| Shanghai | 8.85 | 13.69 | 0.07 | 0.08 |
| Hainan | 1.03 | 1.89 | 0.11 | 0.14 |
| Tianjin | 8.37 | 11.78 | 0.18 | 0.18 |
| Ningxia | 3.4 | 3.67 | 0.2 | 0.15 |
| Fujian | 6.07 | 10.85 | 0.52 | 0.66 |
| Guangdong | 3.52 | 6.39 | 0.99 | 1.26 |
| Zhejiang | 20.52 | 34.6 | 1.23 | 1.46 |
| Guangxi | 4.02 | 7.07 | 1.31 | 1.62 |
| Shanxi | 11.55 | 14.01 | 1.58 | 1.35 |
| Yunnan | 8.18 | 13.45 | 1.58 | 1.83 |
| Xinjiang | 9.46 | 12.27 | 1.66 | 1.52 |
| Guizhou | 11.74 | 20.25 | 1.89 | 2.3 |
| Gansu | 10.55 | 13.35 | 2.29 | 2.04 |
| Shaanxi | 14.55 | 24.22 | 2.5 | 2.93 |
| Chongqing | 25.37 | 41.16 | 2.58 | 2.94 |
| Inner Mongolia | 12.07 | 12.13 | 3.25 | 2.3 |
| Hebei | 11.2 | 17.6 | 3.3 | 3.65 |
| Shandong | 10.55 | 19.96 | 4.16 | 5.54 |
| Hubei | 22.06 | 28.92 | 5.05 | 4.66 |
| Jiangsu | 19.19 | 37.17 | 5.35 | 7.3 |
| Jiangxi | 22.39 | 34.56 | 5.45 | 5.93 |
| Sichuan | 19.54 | 30.21 | 5.48 | 5.96 |
| Liaoning | 37.27 | 37.53 | 5.53 | 3.92 |
| Hunan | 16.98 | 25.5 | 6.16 | 6.5 |
| Henan | 14.2 | 24.92 | 6.73 | 8.31 |
| Anhui | 29.2 | 48.53 | 8.11 | 9.48 |
| Jilin | 35.02 | 35.02 | 9.23 | 6.5 |
| Heilongjiang | 21.39 | 21.39 | 13.51 | 9.51 |
| SUM | 15.99 | 22.72 | 100 | 100 |
Disclaimer/Publisher’s Note: The statements, opinions and data contained in all publications are solely those of the individual author(s) and contributor(s) and not of MDPI and/or the editor(s). MDPI and/or the editor(s) disclaim responsibility for any injury to people or property resulting from any ideas, methods, instructions or products referred to in the content. |
© 2025 by the authors. Licensee MDPI, Basel, Switzerland. This article is an open access article distributed under the terms and conditions of the Creative Commons Attribution (CC BY) license (https://creativecommons.org/licenses/by/4.0/).
Share and Cite
Liu, Y.; Shen, G.; He, T. Cropping and Transformation Features of Non-Grain Cropland in Mainland China and Policy Implications. Land 2025, 14, 561. https://doi.org/10.3390/land14030561
Liu Y, Shen G, He T. Cropping and Transformation Features of Non-Grain Cropland in Mainland China and Policy Implications. Land. 2025; 14(3):561. https://doi.org/10.3390/land14030561
Chicago/Turabian StyleLiu, Yizhu, Ge Shen, and Tingting He. 2025. "Cropping and Transformation Features of Non-Grain Cropland in Mainland China and Policy Implications" Land 14, no. 3: 561. https://doi.org/10.3390/land14030561
APA StyleLiu, Y., Shen, G., & He, T. (2025). Cropping and Transformation Features of Non-Grain Cropland in Mainland China and Policy Implications. Land, 14(3), 561. https://doi.org/10.3390/land14030561