Article

Assessing Service Accessibility and Optimizing the Spatial Layout of Elderly Canteens: A Case Study of Nanjing, China

College of Public Administration, Nanjing Agricultural University, Nanjing 210095, China
*
Author to whom correspondence should be addressed.
Land 2025, 14(11), 2272; https://doi.org/10.3390/land14112272
Submission received: 2 September 2025 / Revised: 17 October 2025 / Accepted: 14 November 2025 / Published: 17 November 2025

Abstract

Equitable accessibility to elderly canteens is critical for addressing the challenges of an aging population. Using Nanjing as a case study, this paper constructed an integrated framework that fuses GIS spatial analysis with interpretable machine learning to diagnose, evaluate, and optimize the service network’s spatial layout. The study found that the existing design is a direct manifestation of the conflict between “market logic” and “social demand.” First, Nanjing’s elderly canteen service suffers from a severe spatial mismatch and inequality of opportunity. Approximately 80% of the elderly population resides in areas that share less than 15% of the canteen resources. Second, a multi-modal accessibility analysis revealed the phenomenon of “false equity.” The high service coverage under the car accessibility model masks the systemic service deprivation faced by the majority of seniors who rely on walking and micromobility. Third, this study proposed and validated a data-driven “stock activation” strategy. An XGBoost model, guided by a “demand-oriented and spatially efficient” decision-making logic, identified 161 high-potential optimization sites. At the same time, the framework also diagnosed its own strategic boundaries by identifying “resource vacuums” where a lack of convertible stock necessitates alternative solutions, such as new builds.

1. Introduction

Population aging is one of the most significant global social transformations of the 21st century. According to the United Nations’ 2024 World Population Prospects, the global population aged 65 and over accounts for approximately 10% in 2024 and is projected to reach around 14% by 2054 [1]. As one of the countries with the largest and fastest-growing elderly population, China’s population aged 65 and over reached 220 million by the end of 2024, accounting for 15.6% of the total population [2]. Similar to many highly industrialized and urbanized nations, China has experienced increased population mobility and a decline in the proportion of intergenerational co-residence during its rapid urbanization process. This trend has weakened the traditional elder care functions of the family, leading to a sharp increase in the demand for social senior care services. However, influenced by factors such as emotional connections and established daily routines, most elderly individuals prefer to ‘age in place’ within their familiar environments [3]. Against this backdrop, China has placed increasing emphasis on the development of home- and community-based elderly care. Governments at various levels have proposed the ‘9073’ or ‘9064’ elderly care framework—whereby 90% of seniors age at home, 6% to 7% receive community-based support, and 3% to 4% reside in institutional care facilities [4,5]. However, despite increasing government attention and investment in home- and community-based services, the actual effectiveness of aging at home is often less than ideal due to issues such as uneven resource allocation and supply–demand imbalances [6].
Within the community-based elderly care system, elderly meal services play a vital role. They are designed to address the dining challenges faced by seniors due to physical decline or living alone, serving as a foundational service for ensuring their nutritional health and quality of life [7]. The physical sites that provide these services, often referred to by various names in the Chinese context, such as “elderly meal service points” or “elderly canteen,” are the core subject of this study. Compared to long-term residential care facilities like nursing homes, elderly canteen services involve a much higher frequency of daily round trips, and the effectiveness of their service delivery is consequently more dependent on their geographical location. In practice, these canteens do not take a single form; the network comprises diverse types, including community-run canteens and designated partner restaurants. While different types of service points may have their own differentiated social functions and unique appeal, it is the overall layout of this entire network that determines the equality of opportunity for all seniors in the city to access these services. Therefore, under the condition of limited data, conducting a foundational, macro-level diagnosis of the overall accessibility and equity of this entire network is a critical first step. This approach is key to identifying systemic resource mismatches and providing strategic guidance for urban planning. In this context, how to plan and configure this network efficiently and equitably has also become a core issue for improving the quality of “Aging in Place” for the elderly population.
Although the importance of elderly meal services has been recognized [8,9,10], existing research primarily focuses on analyzing their operational models [11,12] and service issues [13,14], while systematic spatial analysis remains relatively scarce. Existing spatial research on elderly care facilities often lumps elderly canteens together with institutions like nursing homes [15,16], overlooking the unique usage demands and spatial sensitivity of these canteens. Moreover, few studies have employed the binary conflict between “social demand” and “market logic” as an explicit analytical framework to systematically interpret the formation mechanisms and real-world consequences of a city’s canteen layout, and subsequently propose theory-guided optimization paths to reconcile this conflict.
Accordingly, using the Chinese megacity of Nanjing as a case study, this paper constructed a comprehensive analytical framework for diagnosis, evaluation, and optimization. This study first reveals the current spatial layout of elderly canteens in Nanjing and their underlying driving logic, then evaluates the service accessibility for seniors under different transportation modes, and finally explores a data-driven, low-cost optimization solution based on the activation of stock resources.
This study’s marginal contributions are primarily theoretical, methodological, and practical. Theoretically, this paper transforms the conflict between “social demand” and “market logic” from an abstract dichotomy into an operational and testable analytical framework for interpreting the formation of urban spatial patterns. The study demonstrates this framework’s strong explanatory power in revealing the formation mechanisms of spatial mismatch for quasi-public service facilities. Methodologically, the paper proposes a comprehensive technical pathway that integrates GIS spatial analysis with machine learning. Practically, this study provides an evidence-based foundation for decision-making, enabling urban managers to enhance the well-being of seniors under resource constraints.

2. Literature Review

2.1. The Dilemma of Elderly Canteen Services: The Conflict Between “Market” and “Society”

Elderly canteen services are public services that provide daily meal support for seniors, typically offered in two forms: centralized dining at designated locations and home delivery. This study focuses on the physical sites that provide these services, namely, elderly canteens. By nature, elderly canteen services are quasi-public goods, embodying both public welfare and market efficiency. On the one hand, they generate significant positive social externalities, such as improving the health of seniors [17,18] and alleviating caregiving burdens on families and society [19,20], which defines their public welfare attribute. On the other hand, their provision involves costs and efficiency, and market entities have an advantage in meeting the diverse needs of seniors [21], which gives them attributes of a market product. Therefore, co-provision by the government and the market is the primary supply mechanism for elderly canteen services globally at present.
The ideological roots of the “social demand logic” are deeply embedded in normative theories such as spatial justice and welfare economics. These theories assert that spatial accessibility is, in itself, a critical social resource and a fundamental civic right [22]. For seniors with limited mobility and weaker social capital, the geographical proximity of daily service facilities is not merely a matter of convenience but a “lifeline” directly linked to their nutritional health, social participation, and dignity [23]. Therefore, this logic demands that spatial planning must proactively intervene in the market to ensure the equitable coverage of public services. However, existing research shows that this equity-oriented logic often proves fragile in practice when it conflicts with powerful economic development agendas [24,25]. This directly points to its structural conflict with market logic.
The dual nature of the service itself also dictates that its spatial layout is inevitably pulled by two distinctly different driving mechanisms. The social demand logic, led by the government, pursues equity, whereas the economic logic, guided by the market, pursues costs and benefits. Preliminary findings from existing research have already indicated that the conflict between these two logics in practice often leads to severe spatial mismatch and inequitable resource allocation [15,26].

2.2. Research on the Spatial Layout of Elderly Care Services

In recent years, as the importance of elderly care facilities has grown, the academic community has begun to explore their spatial layout issues from various scales and perspectives. However, systematic research in this area remains in its nascent stages.
Regarding the diagnosis of macro-level equity, existing research has primarily focused on revealing the overall fairness of resource allocation. For example, Wang et al. used the Lorenz curve and Gini coefficient to analyze the distributional equity of meal service facilities across all provinces in mainland China, finding a moderate level of inequality in resource allocation at the national level [27]. A study by Cheng et al. in Tianjin, China, showed that this inequity is equally striking within cities. Although their research subject was broader community elderly care facilities, their finding that “approximately 60% of the elderly population shares only 25% of the service resources” provides strong quantitative evidence for the significant equity gap within urban public services [15]. The contribution of such studies lies in revealing the universality and severity of the problem from a top-down perspective. Their shortcoming, however, is that the macro scale of a nation or an entire city cannot delve into the street and community levels to finely assess the individual accessibility experiences of seniors.
At the micro-level of intra-urban accessibility, scholars have begun to apply more refined spatial analysis models for evaluation. Among them, Zhang et al., focusing on community service centers in Nanjing, applied the Gaussian Two-Step Floating Catchment Area (G2SFCA) method to assess the accessibility levels for seniors under different transportation modes [28]. Similarly, in their research on Chengdu, Li et al. also explored the accessibility of elderly care institutions by improving the potential model [29]. These articles provided crucial methodological inspiration for this paper. However, their subjects of study were the broader categories of “community service centers” or “elderly care institutions,” and they failed to conduct targeted parameter setting, analysis, and optimization specifically for elderly canteens—a type of high-frequency, short-distance, and high-demand daily care facility.
Even within the current research focusing specifically on elderly canteens, there is still room for further in-depth study. For example, a study by Zheng et al. [26] in Beijing creatively classified canteens into three types: institution-affiliated, community-based meal tables, and enterprise-contracted, and found that their spatial distribution logics were distinctly different. The institution-affiliated and community-based types were primarily driven by elderly population density (the “social demand logic”), while the enterprise-contracted type was significantly correlated with GDP and commercial vitality (the “market logic”). This research provided direct empirical evidence for the conflict between the two logics. Meanwhile, a study by Zhou et al. on a single community in Beijing revealed the economic drivers of supply–demand mismatch at the micro-scale through questionnaire surveys and GIS buffer analysis [30]. These studies have confirmed the severe inequity in the spatial layout of elderly care facilities and have begun to explore the underlying driving mechanisms. However, they have mostly stopped at diagnosis and explanation without proposing a systematic, integrated solution that moves from diagnosis to optimization.

2.3. From Diagnosis to Optimization: The Evolution of Spatial Analysis Methods

For the diagnosis of spatial equity, the academic community has developed two complementary technical pathways: macro and micro. In macro-level diagnosis, the Lorenz curve and the Gini coefficient are classic tools for measuring the overall equity of resource allocation. Their fundamental principle is to generate an intuitive and highly interpretable inequality metric by comparing the cumulative distributional differences between service resources and population across spatial units [15,31].
At the micro-diagnostic level, models based on spatial interaction theory have become mainstream for more finely assessing individual accessibility. Among these, the Potential Model is a classic paradigm. It borrows the concept of gravity from physics, positing that the service level a demand point receives is the sum of the service capacities of all supply points in the region, inversely proportional to the distance to reach them. Wang et al. applied this model to evaluate the accessibility of elderly care institutions in Shanghai [32]. Building on the Potential Model, the Two-Step Floating Catchment Area (2SFCA) method and its variants are widely considered state-of-the-art methods for assessing public service accessibility, as they can simultaneously account for the service capacity of supply points, competition among demand points, and distance decay. The method itself has also been constantly evolving to better reflect reality. For instance, when evaluating the accessibility of elderly care facilities in Xi’an, Liu et al. improved the model by integrating institutional capacity, service quality, and real road network distance [33]. An article by Shao et al. attempted to incorporate more granular socioeconomic factors, such as insurance type and demand differences by age and gender, proposing the SDA-2SFCA model [34].
After a precise diagnosis of the problem, the next critical question is how to explore feasible optimization paths. Methodologically, the layout optimization of elderly canteens is essentially a classic Location-Allocation problem, which requires simultaneously determining the optimal locations for facilities and the allocation scheme of users to those facilities [35]. To solve such complex planning problems, Multi-Objective Optimization models have emerged as an important approach. The goal of these models is to seek Pareto optimal solutions among multiple conflicting objectives, such as equity, efficiency, and cost, through algorithms. For example, in their study on the layout optimization of elderly care institutions in Shanghai, Zhou et al. successfully applied a multi-objective genetic algorithm (NSGA-II) to balance equity, efficiency, and construction costs [36]. However, these classic operations research models are limited by their reliance on preset mathematical rules and weights.
In recent years, machine learning, as an emerging algorithmic modeling paradigm, has been increasingly introduced into spatial planning research. Unlike traditional statistical models that rely on a priori assumptions, the core advantage of machine learning is its ability to learn autonomously from data and reveal complex, non-linear relationships and threshold effects between built environment variables and spatial phenomena [37,38]. In terms of specific applications, clustering algorithms, such as K-means and DBSCAN, have been widely used to identify urban functional zones or discover low-service “depressions” due to their effectiveness in identifying spatial units with similar characteristics [39,40]. For screening potential sites, ensemble learning models, represented by XGBoost, are widely used for their high predictive accuracy. Concurrently, the academic community has also been actively addressing the potential “black-box” problem of these complex models. For example, research by Jun points out that models like Gradient Boosting Decision Trees (of which XGBoost is an efficient implementation) inherently possess better interpretability compared to Artificial Neural Networks (ANN) [41]. Sun et al., in their study on photovoltaic power station siting, used methods such as feature importance and SHAP to clearly reveal which factors were driving the model’s decisions, thereby providing a more transparent and credible basis for planning practice [42].
In summary, the existing literature has provided profound insights into the inherent conflicts and evaluation methods concerning the spatial layout of elderly canteens. However, when focusing on the deep integration of theory and practice, current research reveals limitations in the following three areas. First is the ambiguity of the research subject. Existing studies often conflate high-frequency, time-sensitive facilities like elderly canteens with long-term residential care institutions. This “one-size-fits-all” approach can lead to a systematic misjudgment of the unique spatial demands of elderly canteens. Second, this misjudgment of the subject hinders its effective integration with profound theoretical insights. Although scholars have revealed that the conflict between “social” and “market” logic is central to understanding the spatial layout of quasi-public goods, few studies have precisely targeted this theoretical framework at the typical case of elderly canteens to systematically reveal the underlying mechanisms of their spatial mismatch. Most research stops at describing phenomena, failing to achieve a theoretical breakthrough from “what” to “why.” Third, the comprehensiveness and practicality of optimization methods need to be strengthened. Current research either focuses on diagnosing the status quo or conducts rather idealized multi-objective optimization. There is a lack of a comprehensive analytical framework that seamlessly integrates macro supply–demand mismatch diagnosis, micro-accessibility evaluation, and intelligent site selection via machine learning. Critically, most optimization studies fail to adequately address real-world resource constraints, lacking a pragmatic optimization strategy oriented toward activating existing stock for low-cost expansion.

3. Materials and Methods

3.1. Study Area

This study selects the megacity of Nanjing in eastern China as its case study area (Figure 1). Nanjing is the capital of Jiangsu Province and one of the core cities in the Yangtze River Delta. In 2023, Nanjing’s per capita Gross Domestic Product (GDP) reached RMB 182,480 (approximately USD 25,600), placing it among the top-ranking cities in mainland China [43]. As one of the first cities in China to enter an aging society, Nanjing has continuously faced significant pressure from population aging since the 1990s. By the end of 2023, the city’s resident population aged 60 and over had reached 2.0972 million (21.97% of the total), with the population aged 65 and over being 1.5287 million (16.01%). The city’s elderly population is characterized by a large base, rapid growth, advanced age, and an unbalanced urban-suburban distribution [44].
Nanjing covers a total area of 6587.31 km2 and is divided into 11 administrative districts, which include the six main urban districts (Xuanwu, Gulou, Qinhuai, Jianye, Qixia, and Yuhuatai), two inner suburbs (Jiangning and Pukou), and three outer suburbs (Liuhe, Lishui, and Gaochun). As of January 2025, 1218 elderly canteens had been established, providing basic coverage across the entire city. The selection of Nanjing as the study area is therefore highly representative. On the one hand, Nanjing has a high degree of aging, strong financial capacity, and relatively mature experience in developing its elderly care service system. On the other hand, the city’s significant spatial differentiation into a “central city–inner suburbs–outer suburbs” structure, combined with the uneven distribution of its elderly population, provides an excellent empirical case for this study to explore the conflict between equity and efficiency in the spatial configuration of elderly canteens.

3.2. Policy and Market Context

To cope with the severe challenges of population aging, the city of Nanjing has constructed a diversified supply system for elderly canteen services centered on the principle of being “government-led, with social participation.” The top-level design of this system clarifies the distinct roles of the government and the market in service provision. The government is responsible for strengthening top-level design, coordinating resources, and providing financial support to ensure the universality and equity of the service. At the same time, the policy explicitly states the need to “fully leverage the decisive role of the market in resource allocation,” guiding diverse market entities and social forces to participate widely as the actual service operators.
Under this policy framework, the government’s “social demand logic” is primarily manifested through a set of sophisticated financial subsidy tools. According to an official plan for enhancing elderly canteen services released by Nanjing in 2024, the subsidy system is mainly divided into two levels: one for operators and one for seniors [45]. For operators, the policy provides an annual basic subsidy ranging from RMB 20,000 to 50,000 based on the canteen’s area (from 50 m2 to 100 m2), along with a performance-based reward of RMB 2 per person-meal served. For seniors, the government offers meal subsidies ranging from RMB 1 to 5 per meal depending on age. For disabled seniors who opt for home delivery, an additional delivery subsidy of RMB 3 per meal is provided. This complex subsidy design clearly reflects the government’s policy intent to use economic levers to guarantee the needs of key populations and to guide the spatial coverage of service resources.
However, in practice, the “economic efficiency logic” of market entities exhibits a behavioral pattern not entirely aligned with the policy’s guidance. Despite the policy’s requirement to achieve a dual enhancement of social and economic benefits, operators find it difficult to generate direct profits from the canteen service itself. The meal fees, which are far below market rates, combined with government subsidies, can hardly cover the high operational costs of maintaining a dedicated elderly canteen, including expenses for staff, ingredients, and utilities. Under these circumstances, the primary motivation for market entities to participate is to treat the elderly canteen as a low-cost “customer acquisition funnel” and a “brand showcase.” Their true commercial objective is to gain large-scale access to the senior customer base through the high-frequency, essential meal service, thereby generating customer leads and subsequent conversions for their high-value-added core businesses, such as in-home care, rehabilitation services, and institutional elder care.
This “customer acquisition logic” fundamentally determines the locational preferences of market entities. They inevitably prioritize areas that maximize “customer acquisition value,” which are typically densely populated, have high consumer spending power, and offer significant brand exposure. Consequently, central urban areas are their primary focus. Ultimately, a structural conflict arises between the government’s “social demand logic,” which aims to promote equity, and the “economic efficiency logic” of market entities, which pursues profitability. This institutional context and real-world conflict are key to understanding the spatial layout characteristics of elderly canteens in Nanjing. To quantitatively measure the degree of this spatial mismatch and explore optimization paths, this study adopted the following data and methods.

3.3. Research Data

The data used in this study comprised four main categories: elderly canteen data, elderly population data, urban road network data, and other Point of Interest (POI) data related to meal services, as detailed in Table 1.
First, the elderly canteen data were sourced from the official directory released by the Nanjing Civil Affairs Bureau in February 2025, which contained the names and addresses of 1218 canteens across the city (https://mzj.nanjing.gov.cn/njsmzj/ztzl/njylfw/ (accessed on 10 May 2025)). To verify the accuracy of this data, we designed and executed a multi-source data validation process: The initial step involved spatial positioning and preliminary screening were conducted. This study initially reverse-geocoded the addresses of the 1218 canteens from the official directory using the A Maps API (AutoNavi Software Co., Ltd., Beijing, China) to obtain their latitude and longitude coordinates. A Python (Version 3.13.1, Python Software Foundation, Wilmington, DE, USA) tool was then used to convert these coordinates from GCJ-02 to the internationally standard WGS-84. Next, we performed a dual-platform POI cross-validation. We cross-referenced the address and name of each canteen with Point of Interest (POI) information from two major platforms, A Maps and Baidu Maps (Baidu, Inc., Beijing, China) (data as of October 2025). Considering the recent publication of the official list and the asynchronous updates of commercial map platforms, our verification standard was as follows: a site was confirmed as an active operational point if its existence and “in business” status could be verified on at least one of the two map platforms. The final step was manual verification. For the few points that could not be found on either map platform, we conducted a final manual verification by making telephone inquiries to the corresponding district Civil Affairs Bureaus. After this comprehensive validation process, the results showed that all 1218 canteens on the initial list were in actual operation. Therefore, this study ultimately used these 1218 verified canteens as the supply data. It should be noted that the “elderly canteen” concept adopted in this study is a comprehensive one, covering various officially recognized service formats such as community-run canteens, institution-affiliated meal points, and partner restaurant enterprises. Due to the lack of type differentiation in the public data, this study analyzed these 1218 points as homogeneous supply units.
Second, the elderly population data were sourced from the 2020 China Population Census by County. This dataset provided statistical information on the population aged 65 and above for 101 subdistricts (towns) in Nanjing. To enhance the precision of the spatial analysis, this study constructed a 2 km × 2 km fishnet grid covering the entire city and allocated the subdistrict-level population data to the grid cells proportionally, based on an area-weighted method. The choice of a spatial analysis unit is critical due to the “Modifiable Areal Unit Problem” (MAUP), as different scales can lead to significant variations in analytical results [46]. This study selected a 2 km × 2 km grid scale primarily because extensive research has proven it to be an ideal and meaningful unit for macro-level analysis in Chinese megacities. In a Chinese megacity like Shenzhen, 2 km is the “inflection point” where statistical indicators tend to stabilize, and it also aligns with reasonable walking and cycling distances for residents [47]. Furthermore, this scale has been shown to balance analytical granularity with data validity by ensuring a sufficient number of data sample points within each unit [48]. Ultimately, a total of 1646 population grids were generated for the city. It must be emphasized that, due to data acquisition constraints, this study uses the total population aged 65 and over as a proxy variable for the “potential demand” for elderly canteen services. Therefore, the core of this research is to evaluate “potential spatial accessibility,” not to precisely measure the “actualized demand” of individuals.
Third, the urban road network data were sourced from the OpenStreetMap platform (https://www.openstreetmap.org, accessed on 20 May 2025). The urban public transportation network data were sourced from AMAP (https://lbs.amap.com, accessed on 22 May 2025). Following the method of Wang et al. [49], we called the map API’s bus line ID query interface to obtain information for each line, including its name, trajectory coordinates, and station locations. This information was then used to construct the bus network map in ArcGIS (ArcGIS Pro 3.4.2, Esri, Redlands, CA, USA). Elevation data were sourced from the Geospatial Data Cloud platform (https://www.gscloud.cn, accessed on 22 May 2025), with a spatial resolution of 30 m.
Finally, to enhance the real-world precision of the optimization site selection for elderly canteens, this study introduced other relevant Point of Interest (POI) data (collected as of May 2025). These data primarily included urban functional elements such as restaurants, government agencies, and social organizations.

3.4. Research Methods

To systematically assess and optimize the spatial layout of elderly canteens in Nanjing, this study constructed a research workflow consisting of macro-level diagnosis, micro-level assessment, and smart optimization, aiming to create a complete analytical chain from problem identification to solution formulation.

3.4.1. Lorenz Curve and Gini Coefficient: Macro Diagnosis of Supply–Demand Equity

The Lorenz curve and the Gini coefficient were used to measure the degree of inequality in the spatial distribution between elderly canteens and the elderly population at the macro level. Operationally, we first constructed a 2 km × 2 km fishnet grid covering the entire city to serve as the spatial unit for analysis. The elderly population data and the elderly canteen data were then aggregated into each grid cell. The Lorenz curve was used to visualize the deviation between the cumulative distribution of the elderly population and that of the canteen services, while the Gini coefficient numerically quantified this deviation. The formula for the calculation is as follows [50]:
G = 1 i = 1 n ( X i X i 1 ) ( Y i + Y i 1 )
In Equation (1), X i represents the cumulative proportion of the population aged 65 and over in the i grid cell, Y i represents the cumulative proportion of the corresponding number of elderly canteens, and n is the total number of grid cells. A Gini coefficient value approaching 0 indicates a more equitable resource distribution, whereas a value approaching 1 signifies a more inequitable distribution.

3.4.2. G2SFCA: Micro-Level Accessibility Assessment

Building on the macro-level diagnosis, this study further employed the Gaussian Two-Step Floating Catchment Area (G2SFCA) method to assess the real-world impact of the spatial configuration of elderly canteens on the daily lives of seniors at the micro level. The core advantage of this method is its ability to simulate the travel willingness of the elderly more realistically. It achieves this by incorporating a Gaussian distance decay function. This function effectively models a key real-world behavior—as travel distance increases, the attractiveness of a service declines in a non-linear, smooth manner. For neighborhood-type services such as elderly canteens, which are characterized by high-frequency, short-distance trips, G2SFCA can more accurately reflect their spatial accessibility and service equity.
To apply the G2SFCA model more precisely to this study’s specific context, we implemented a series of reality-based, localized settings for its key parameters, guided by three core principles:
First, we adopted time cost instead of geometric distance as the core travel impedance. This choice acknowledges that real-world factors, including road hierarchy and traffic conditions, decisively influence travel; therefore, time costs more accurately reflect the actual barriers seniors face when accessing services.
Second, we constructed a multi-modal scenario that reflects the independent and daily travel of seniors. Previous spatial accessibility studies on elderly care facilities, such as nursing homes, often assumed that seniors were accompanied by family members, and thus the simulated travel modes were mostly walking, public transportation, and driving a car [29,33,51]. However, for a high-frequency, short-distance daily care service like elderly canteens, which relies on seniors’ independent travel, these conventional travel modes are incomplete. This study adds the category of micromobility to these travel modes. Existing research has shown that in China, micromobility options such as electric bikes and tricycles have become a crucial mode of short-distance travel for seniors due to their economy, convenience, and low physical demand, significantly expanding their living radius [52]. A study in Zhongshan, China, indicated that seniors complete an average of 10% of their daily trips via micromobility [53]. Considering the high prevalence of micromobility, incorporating it into the accessibility assessment can more accurately reflect social reality. Therefore, this paper uses four travel modes—walking, micromobility, public transportation, and car—to simulate the behavior of seniors traveling to elderly canteens.
Third, we introduced terrain factors to correct for human-powered travel modes. Existing research has seldom addressed the impact of terrain slope on travel modes [29,33,51]. The primary reason is that the power of modern motor vehicles is sufficient to overcome most slope changes on urban roads, leaving their speed almost unaffected. However, for seniors traveling independently, the speeds of walking and micromobility are directly limited by physical exertion and are thus highly sensitive to slope changes. Therefore, this study applied a slope correction to both the walking and micromobility travel modes.
Putting the above principles into practice required assigning values to a series of key travel parameters. A significant challenge is the current lack of publicly available, large-scale empirical survey data on the specific travel behaviors of Nanjing’s elderly population in community service scenarios (such as actual walking speeds, cycling speeds, and travel willingness thresholds). Therefore, the parameter settings in this study were not based on first-hand localized data but instead followed a “best approximation” strategy. This strategy involved synthesizing general conclusions from authoritative academic research, official national standards, and public policy orientations relevant to local practice to construct a set of reasonable and representative baseline parameters. This approach aims to establish a robust baseline model for objectively evaluating the spatial performance of the current service network.
Based on the above principles, the study’s parameters were operationalized as follows: First, for the time thresholds, this study set 15 min as the parameter for the Gaussian decay function and 30 min as the maximum search threshold. This decision was based on two main considerations. On the one hand, relevant research indicates that a journey exceeding 15 min significantly reduces the travel willingness of seniors [29]. On the other hand, this threshold aligns with the goals of China’s actively promoted “15 min convenient living circle” initiative [54]. This policy aims to ensure that basic public services, including elderly care and dining, are accessible to residents within a 15 min travel time. Therefore, adopting 15 min as the decay parameter is not merely a behavioral assumption but also a measurement benchmark with clear policy implications; it helps to evaluate the gap between the current layout of Nanjing’s elderly canteen services and the national goals for livable city construction. Although the actual travel willingness of seniors may vary across different socioeconomic backgrounds or health statuses, the 15 min threshold, as a policy-oriented and general baseline, provides a solid logical starting point for this study’s equity assessment.
Second, for Travel Speeds, this study primarily referenced existing research and the national standard document, “Code for Urban Road Traffic Engineering Projects” (GB55011-2021) [55].
  • Walking Mode: Existing research shows that the habitual walking speed of seniors (ranging from 4.54–4.79 km/h) is generally lower than that of average adults [56]. This study adopted the average value of 4.67 km/h to represent the average speed of seniors in normal health under favorable walking conditions. We introduced Tobler’s hiking function to correct for the impact of terrain slope on walking speed.
  • Micromobility Mode: Considering the diversity of vehicle types (e.g., electric bikes, tricycles), this study set the average riding speed at 17.5 km/h. This was based on China’s national road safety regulations regarding the maximum design speed for electric bikes, combined with general urban road operating conditions. This speed represents an ideal state of travel on compliant and unobstructed micromobility lanes. An exponential decay penalty model was introduced to correct for slope.
  • Bus and Car Modes: No slope correction was applied to these modes. The average speed for bus was set at 22.5 km/h. For car, speeds were assigned according to the road hierarchy—80 km/h for highways, 60 km/h for primary roads, 40 km/h for secondary roads, and 20 km/h for local roads.
  • The model calculation involved the following two steps:
Step one, for each elderly canteen j , we first calculated the supply-to-demand ratio, R j , by summing the weighted elderly population of all fishnet grid cells k within a predefined service time radius t 0 .
R j = S j k d k j d 0 D k G ( d k j )
In Equation (2), S j represents the service capacity of canteen j . Unlike institutional facilities, elderly canteens operate on a come-and-go basis and can serve all visiting seniors within a specific period. Therefore, this study did not consider capacity constraints, and the service capacity for all canteens was uniformly set to 1. This approach allowed the calculation to focus specifically on spatial accessibility itself. D k represents the elderly population in fishnet grid cell k ; d k j is the travel time cost from demand cell k to canteen j ; and d 0 is the maximum travel time threshold. G ( d k j ) represents the Gaussian distance decay function, as expressed in Equation (3). In this function, d is the time cost, and β is the decay coefficient that controls the rate of service decay with increasing travel time; it was set to half of the maximum travel time.
G ( d ) = e d β 2
Step two, for each demand cell i , we summed the supply-to-demand ratios of all elderly canteens j within its accessibility radius to obtain the cell’s final accessibility value, A i .
A i = j d i j d 0 R j G ( d i j )
To ensure comparability across the different travel modes, these accessibility values were then normalized. In the normalization formula, A ˜ i represents the normalized accessibility of demand cell i , and n is the total number of demand cells.
A ˜ i = A i i = 1 n A i

3.4.3. Three-Dimensional Supply–Demand and Accessibility Classification: Identifying Potential Optimization Areas

After completing the macro-level diagnosis of the city-wide supply–demand pattern and the micro-level evaluation of accessibility, the next step of this study was to precisely identify the weakest areas within the elderly canteen service network that were most in need of optimization. Theoretically, this identification process is not an open-ended data exploration but rather a goal-oriented diagnostic task. Therefore, this study constructed a goal-driven, three-dimensional quadrant classification model. Compared to exploratory analysis methods such as unsupervised clustering algorithms, this classification strategy, which is based on clear theories (i.e., supply–demand relationships and accessibility) and possesses high transparency and interpretability, can more scientifically and directly answer the core question of “where are the service depressions?” The model uses 2 km × 2 km fishnet grid cells as the basic spatial unit and classifies them according to the following three core dimensions:
  • Demand Dimension: This is measured by the number of seniors aged 65 and above within a grid cell. A value higher than the city-wide average is classified as “high demand,” and vice versa for “low demand.”
  • Supply Dimension: This is measured by the number of existing elderly canteens within a grid cell. A value higher than the city-wide average is classified as “high supply,” and vice versa for “low supply.”
  • Accessibility Dimension: This is measured by the accessibility index under the micromobility mode, as calculated in this study. A value higher than the city-wide average is classified as “high accessibility,” and vice versa for “low accessibility.”
Through the combination of these three dimensions, we defined the areas most in need of optimization as the grid cells that simultaneously meet the three characteristics of “high demand, low supply, and low accessibility.”

3.4.4. XGBoost Model: Screening for High-Potential Candidate Sites

XGBoost is an ensemble learning algorithm that utilizes gradient boosting trees. The primary concept behind XGBoost is to iteratively create new decision trees that fit the residuals from the predictions of the previous model. Doing so combines multiple weak classifiers to create a strong classifier. XGBoost excels in predictive modeling tasks due to its robust ability to handle non-linear relationships and its incorporation of regularization terms, which help prevent overfitting. The objective function for XGBoost is as follows [57]:
L ( ϕ ) = i = 1 n l ( y i , y ^ i ( t ) ) + k = 1 t Ω ( f k )
In this objective function, l ( y i , y ^ i ( t ) ) represents the loss function, which captures the difference between the true class label of the i candidate canteen and the predicted value t from the previous iteration. This helps assess how well the model fits the data. The term Ω ( f k ) refers to the regularization component, which serves to penalize the model’s complexity and thus prevents overfitting. Within the regularization Formula (7), T denotes the number of leaves in the k tree, and w j is the score assigned to the j leaf. The parameters γ and λ are the tunable regularization coefficients that control the strength of the penalty.
Ω ( f k ) = γ T + 1 2 λ j = 1 T w j 2
Within the potential optimization areas identified by the classification model, this study further employed an XGBoost classification model to explore a low-cost and pragmatic optimization strategy that reconciles “market logic” with “social demand.” This strategy did not rely on constructing new sites but instead used a data-driven approach to identify the most effective gap-filling sites from existing stock resources. Specifically, several restaurants and government and public institution canteens exist in the suburban areas. These establishments possess basic kitchen facilities and service capabilities, giving them strong potential for conversion. Supporting these locations with subsidies to open to nearby seniors during specific time periods can effectively reduce operational costs while improving the reuse efficiency of existing resources and the accessibility of social services. Therefore, the stock resources utilized in this study were divided into two main categories: existing market Restaurants, representing market forces that can be incentivized, and Institutional Canteens (from government and social organizations), representing public or semi-public resources that can be activated.
The specific construction and implementation of the model were divided into four main steps:
The first step was feature engineering to quantify the potential of each candidate point to meet social demand. For this, the study initially constructed five spatial feature indicators: spatial gap-filling capability (the straight-line distance from a candidate point to the center of the nearest high-demand area), population coverage potential (the total elderly population within a 2 km buffer), demand density (the number of high-demand grid cells within the buffer), spatial redundancy (the minimum distance to the nearest existing elderly canteen), and marginal benefit (the number of established elderly canteens within a 2 km service radius).
Before formal modeling, we conducted a multicollinearity test on these five initially constructed feature variables to ensure the model’s stability and interpretability. The initial test revealed high multicollinearity between the “demand density” and “population coverage potential” variables. Given that both variables were designed to measure the magnitude of demand around a candidate point, “population coverage potential” was retained as it is more informative and its metric is more direct, directly reflecting the total covered population rather than merely counting grid cells like “demand density.” Therefore, to eliminate multicollinearity, we removed the “demand density” variable from the feature set. A re-test on the final four feature variables showed that all Variance Inflation Factor (VIF) values dropped below 2.0 (with a maximum of 1.83), indicating that no significant multicollinearity problem existed in the final feature set used for modeling.
The second step involved label definition and model training. To identify the most promising sites, we trained an XGBoost model where candidate points covering the top 15% of the high-demand elderly population were defined as positive samples (label = 1), and all others were described as negative samples (label = 0). The sample was divided into training and testing sets at an 80:20 ratio to ensure reliability and reproducibility, with a random seed of 42. The model was trained with key hyperparameters, including a learning rate of 0.1, 100 trees, and a maximum depth of 4.
The third step is model interpretability analysis. To open the “black box” of the XGBoost model and understand its internal decision-making logic, this study employed the SHAP method for model interpretation. SHAP is a game theory-based approach that can precisely attribute the model’s prediction for an instance to each input feature, thereby quantifying the contribution of each feature to the prediction value for a single sample [58]. By generating SHAP analysis plots, we can not only identify which features are globally most important but also reveal how high or low feature values influence the direction of the model’s prediction, thus providing deeper insights for site selection decisions.
Finally, the third step was a multi-filter process for the final site selection. To ensure the practical feasibility of the model’s recommendations, we applied three geographic and demographic filters to the high-probability candidates: a model prediction probability of at least 0.85, a distance of no more than 8.75 km (approximately a 30 min micromobility trip) from a high-demand area center, and a service coverage of at least 5000 high-demand seniors. This filtering process ultimately yielded the recommended high-potential sites for elderly canteens.
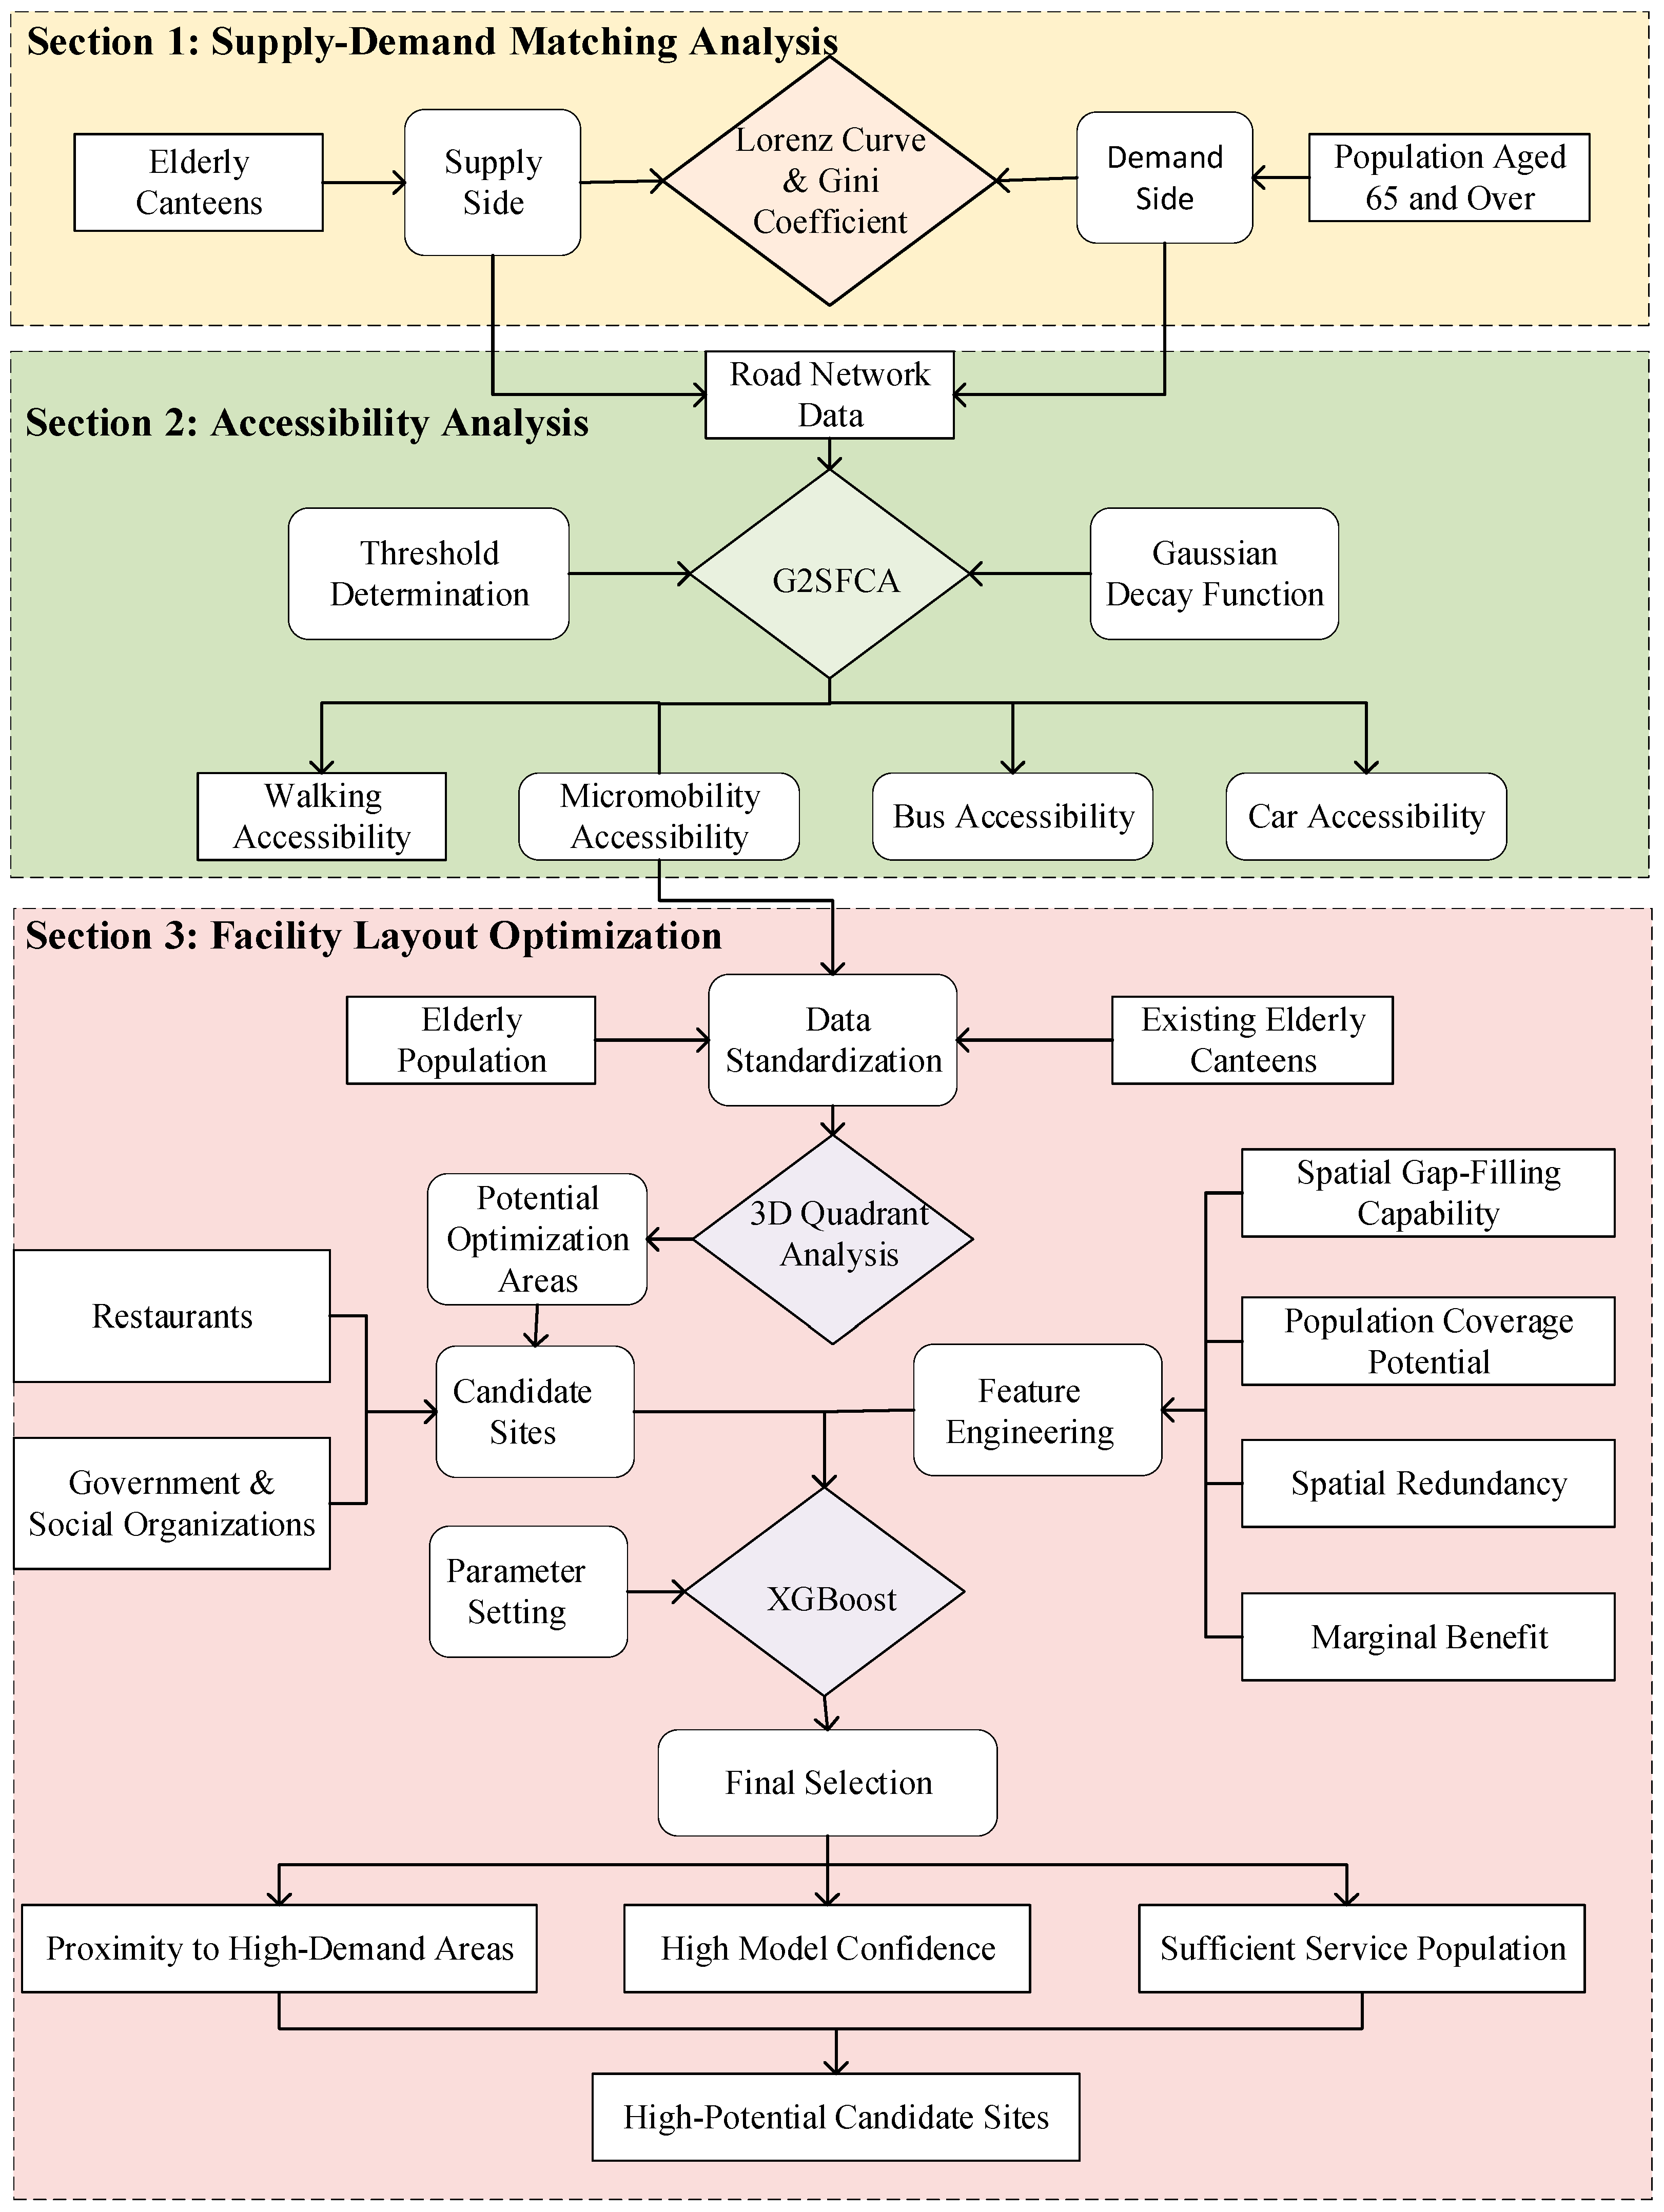
The specific idea of this study is shown in Figure 2.

4. Results

4.1. Spatial Imbalance and Resource Inequity: Diagnosing the Supply–Demand Conflict

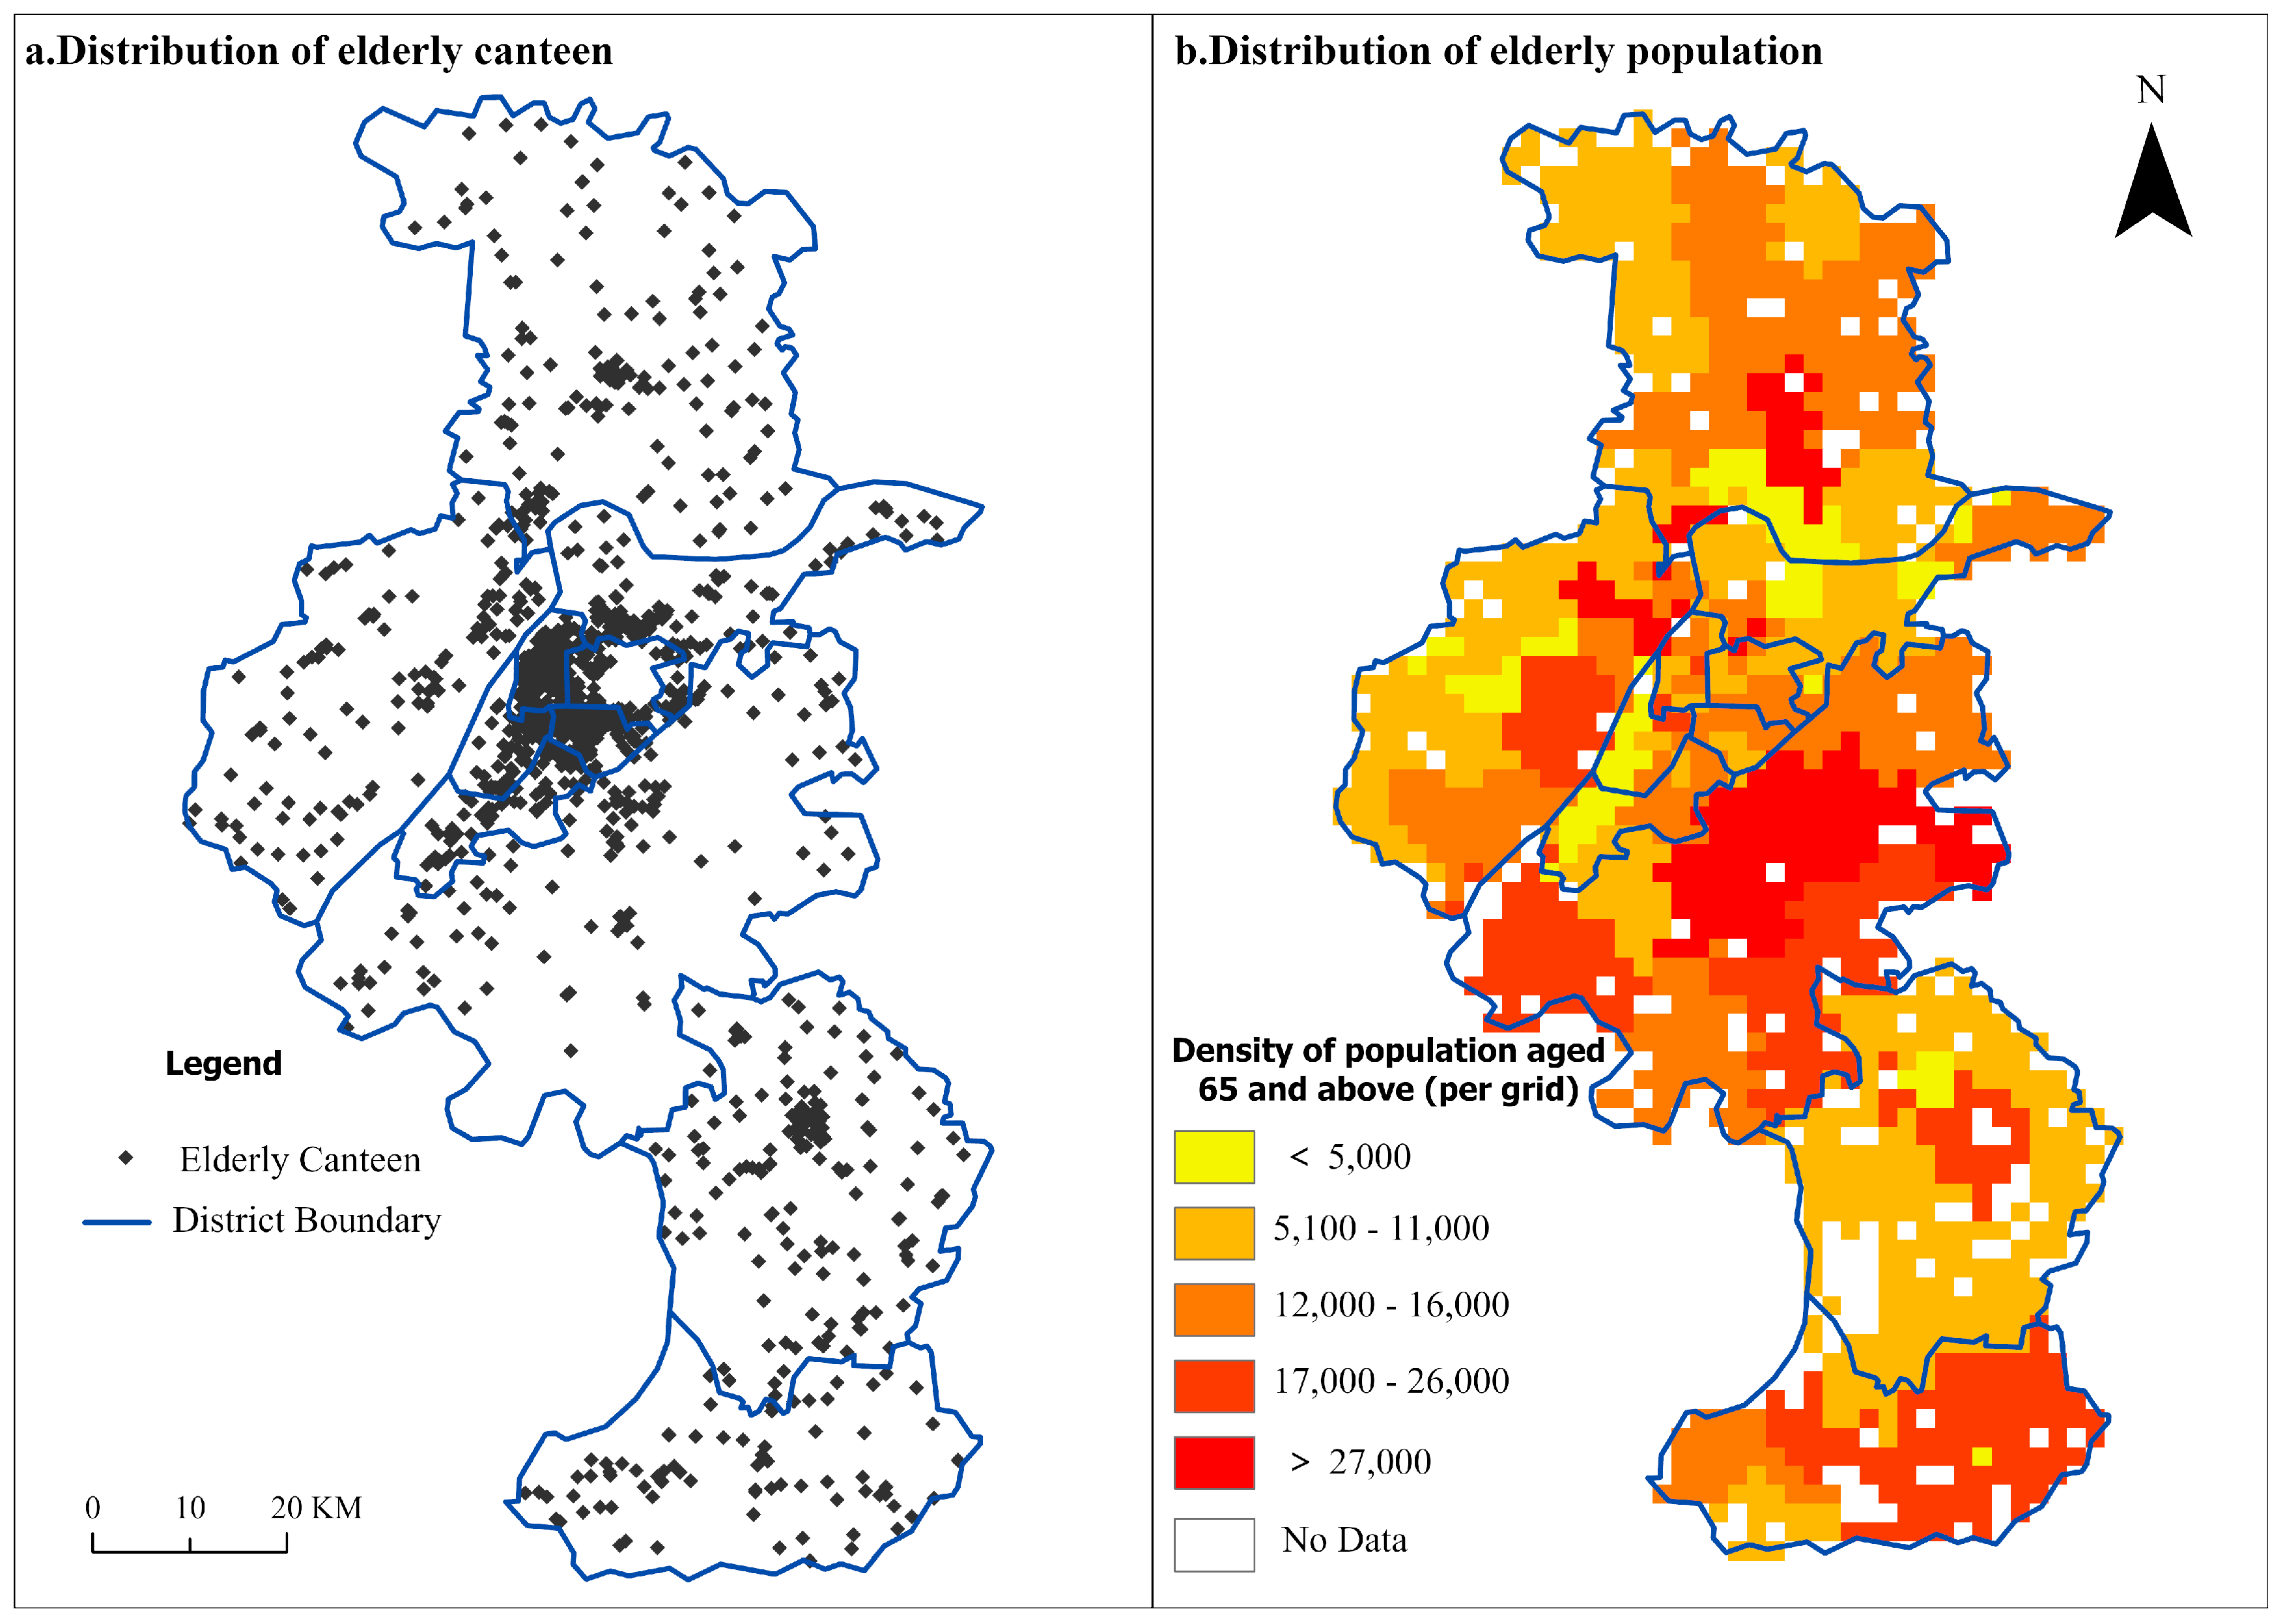
The study’s primary finding was that a severe structural imbalance and inequitable resource allocation existed between the spatial supply of elderly canteens and the potential demand from the elderly population in Nanjing. This imbalance was first visually manifested in a fundamental spatial mismatch. As shown in Figure 3, the layout of the canteens followed a “center-periphery” commercial logic, with service facilities highly concentrated in core urban districts such as Gulou and Jianye (Figure 3a). In contrast, the potential demand, represented by the elderly population, exhibited a “multi-centric and widely dispersed” pattern. While central urban areas remained a major concentration of seniors, the southern part of Liuhe District, the southeastern part of Pukou District, most of Jiangning District, the central part of Lishui District, and the eastern part of Gaochun District also formed large-scale concentrations of the elderly population (Figure 3b). This conflict between a “centralized supply” and a “dispersed potential demand” directly led to the formation of “service depressions” in the vast peripheral urban areas, offering a preliminary revelation of potential service inequity.
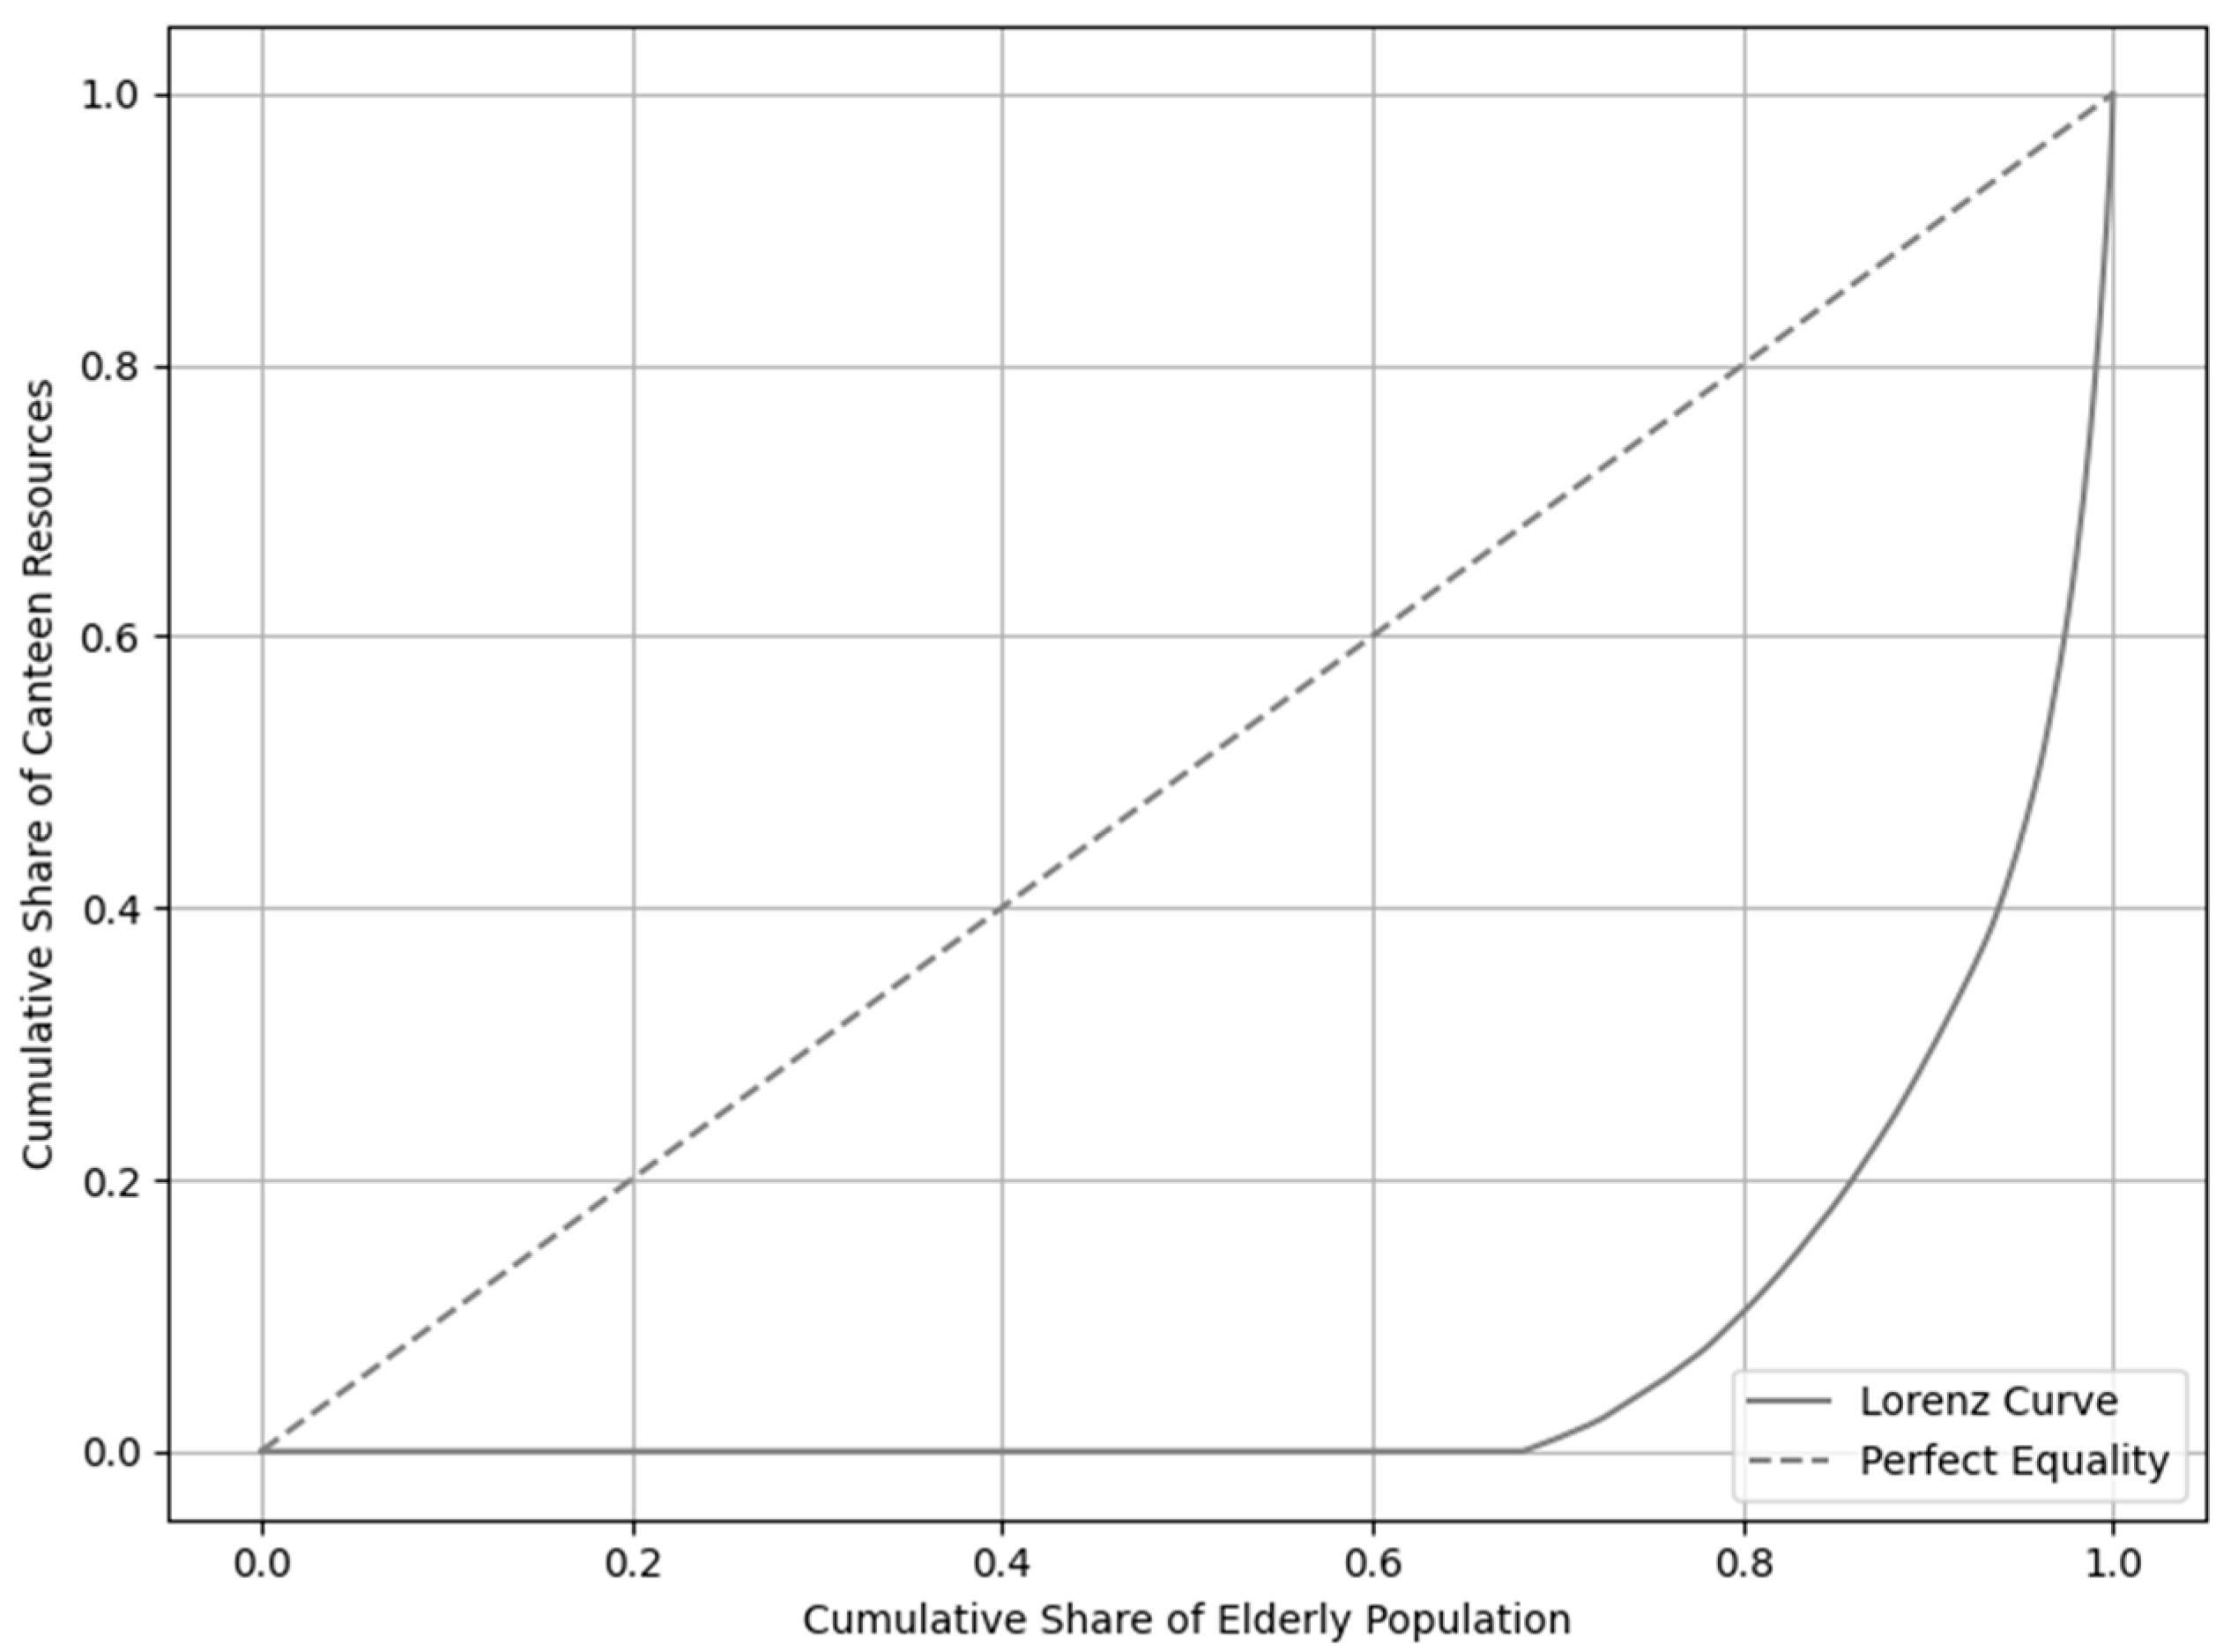
To more precisely validate and quantify the inequity caused by this spatial mismatch, this study further introduced the Lorenz curve and Gini coefficient analysis. The results (Figure 4) showed that the curve was extremely close to the lower boundary, rising sharply only at the very end. This indicated that elderly canteen resources were extremely limited in most areas where the elderly population was concentrated, with only a few areas possessing highly concentrated service resources. A further calculation yielded a Gini coefficient as high as 0.85, a result indicating that approximately 80% of the elderly population resided in areas with less than 15% of the canteen resources.
From the visual mismatch of the spatial layout (Figure 3) to the quantitative inequity of total resources (Figure 4), the dual findings jointly revealed that, under the existing model of market-driven and spontaneous construction, the supply of elderly canteens failed to effectively respond to the demand for universal elderly care services. This profound supply–demand conflict was not only the practical foundation that the accessibility analysis had to confront but also provided a clear problem orientation for the subsequent optimization strategy.

4.2. False Equity and Service Deprivation: A Multi-Dimensional Analysis of Spatial Accessibility

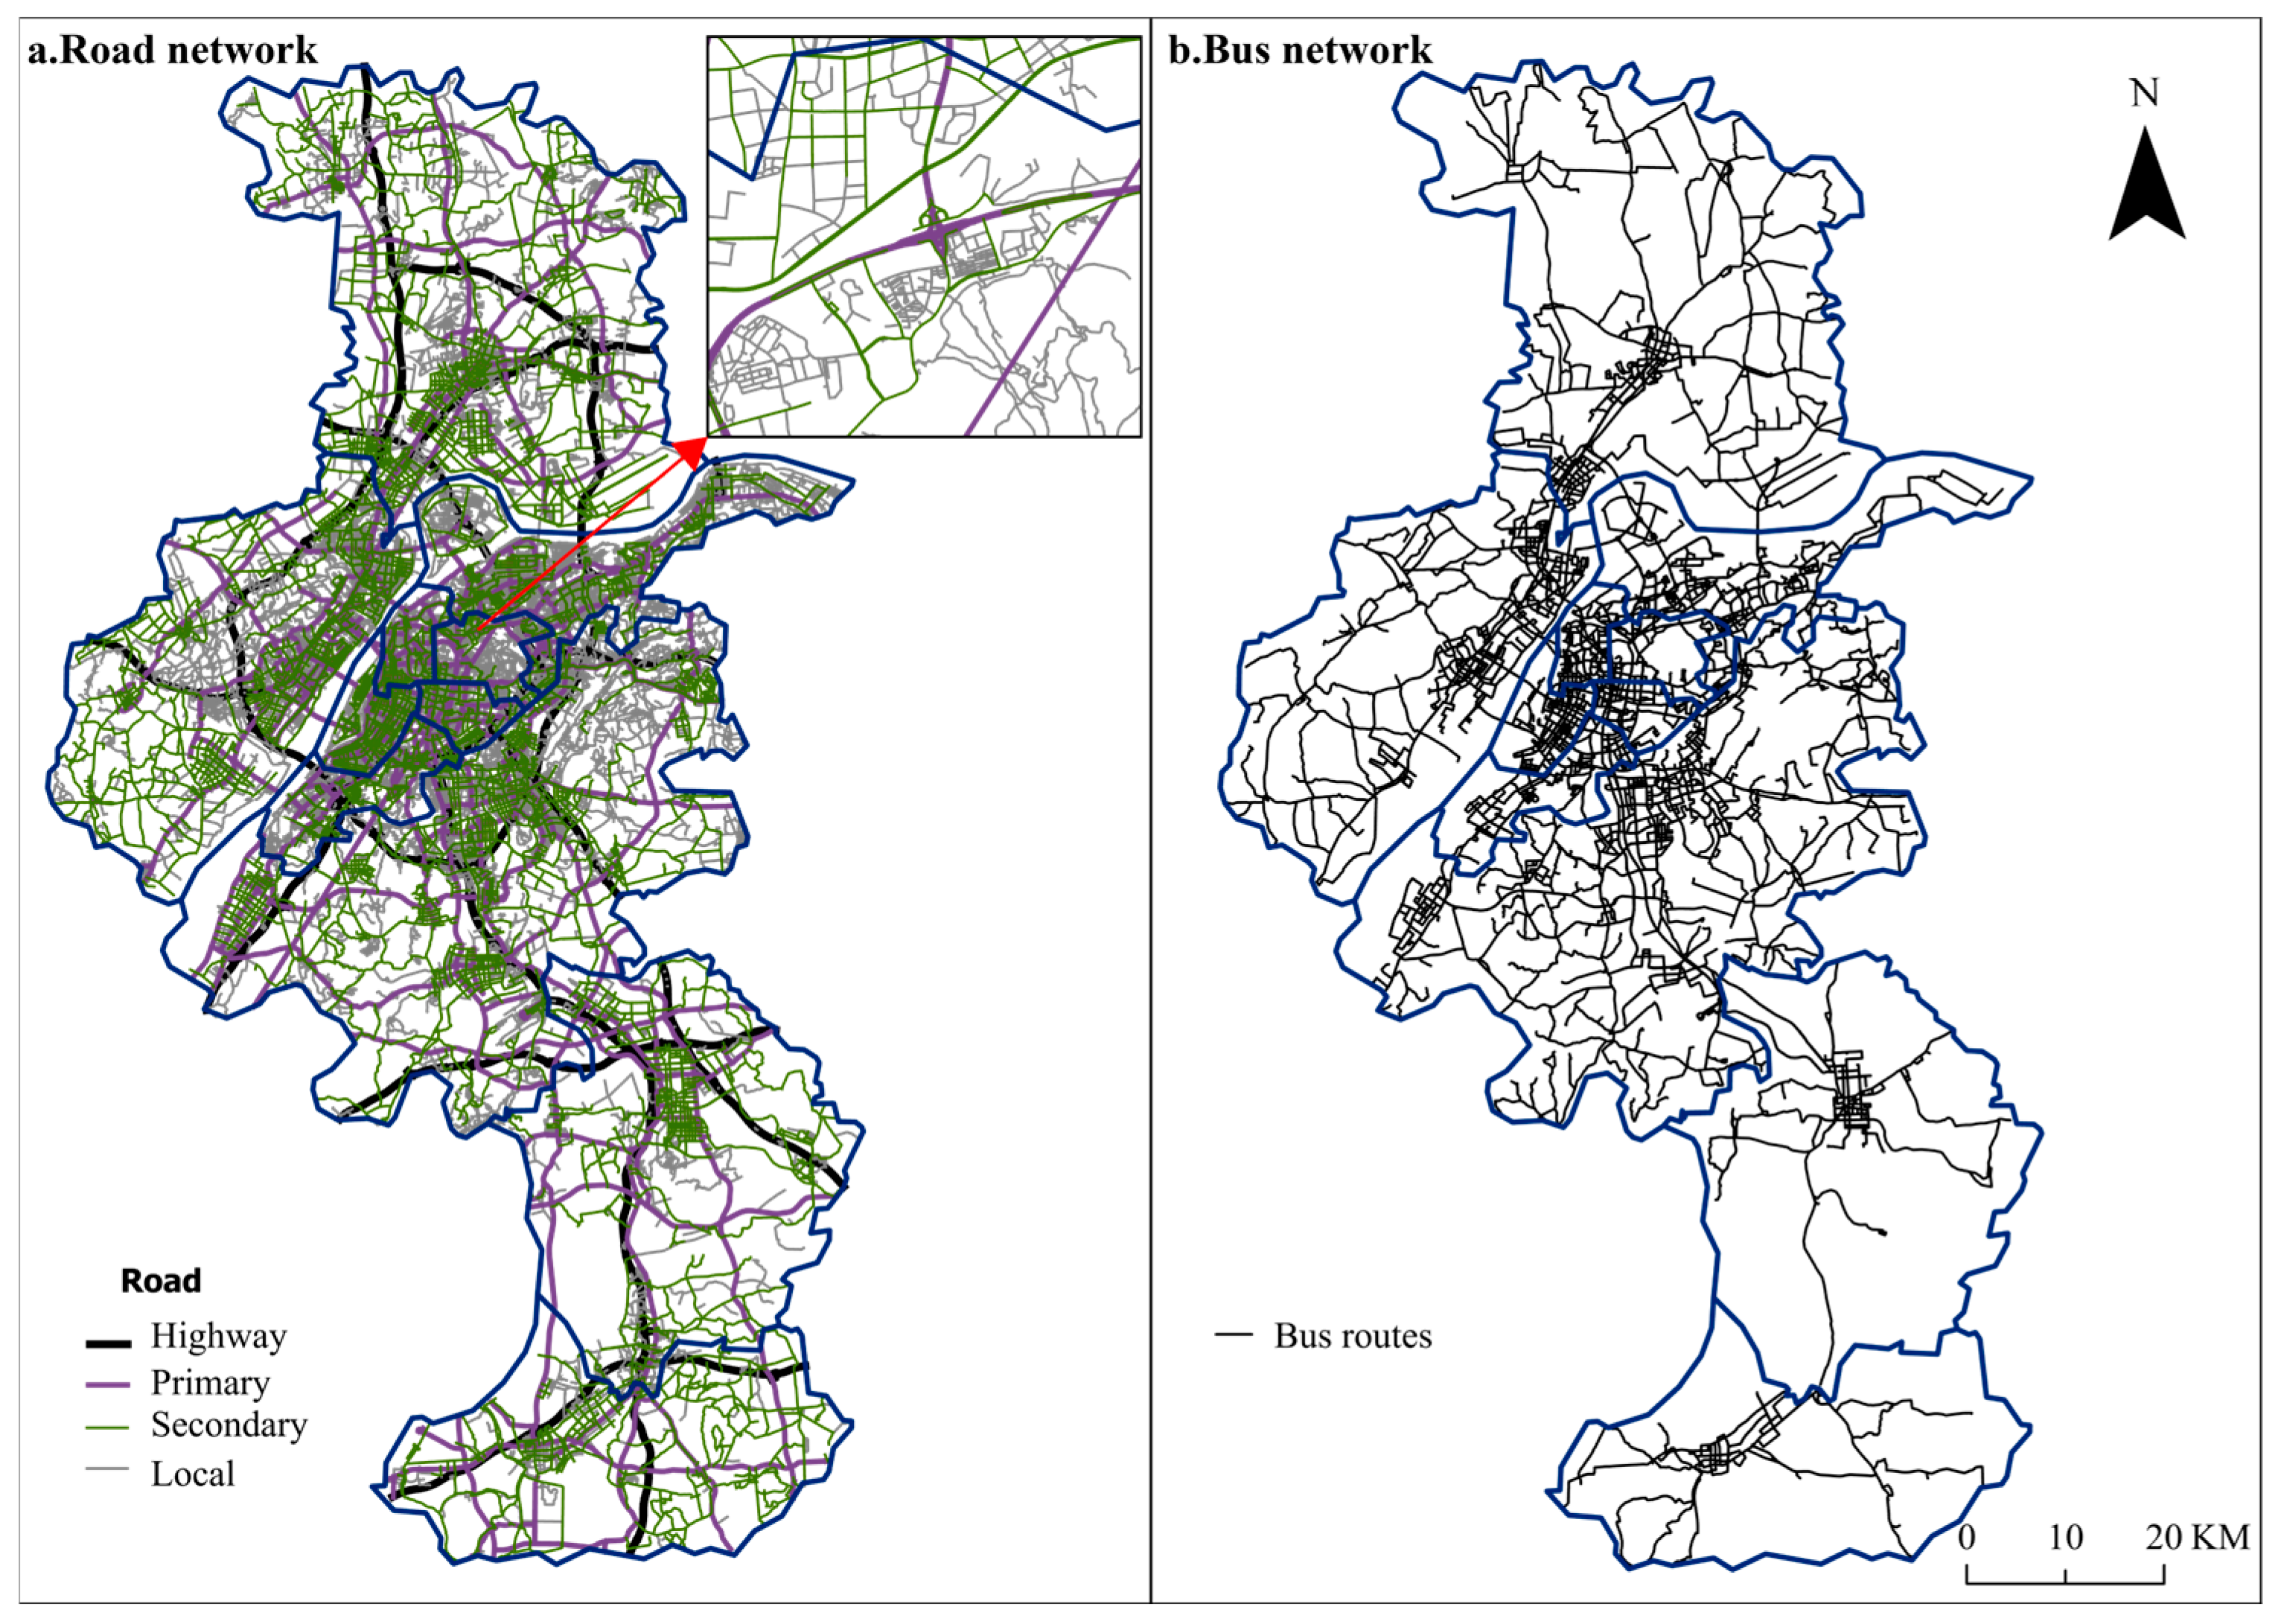
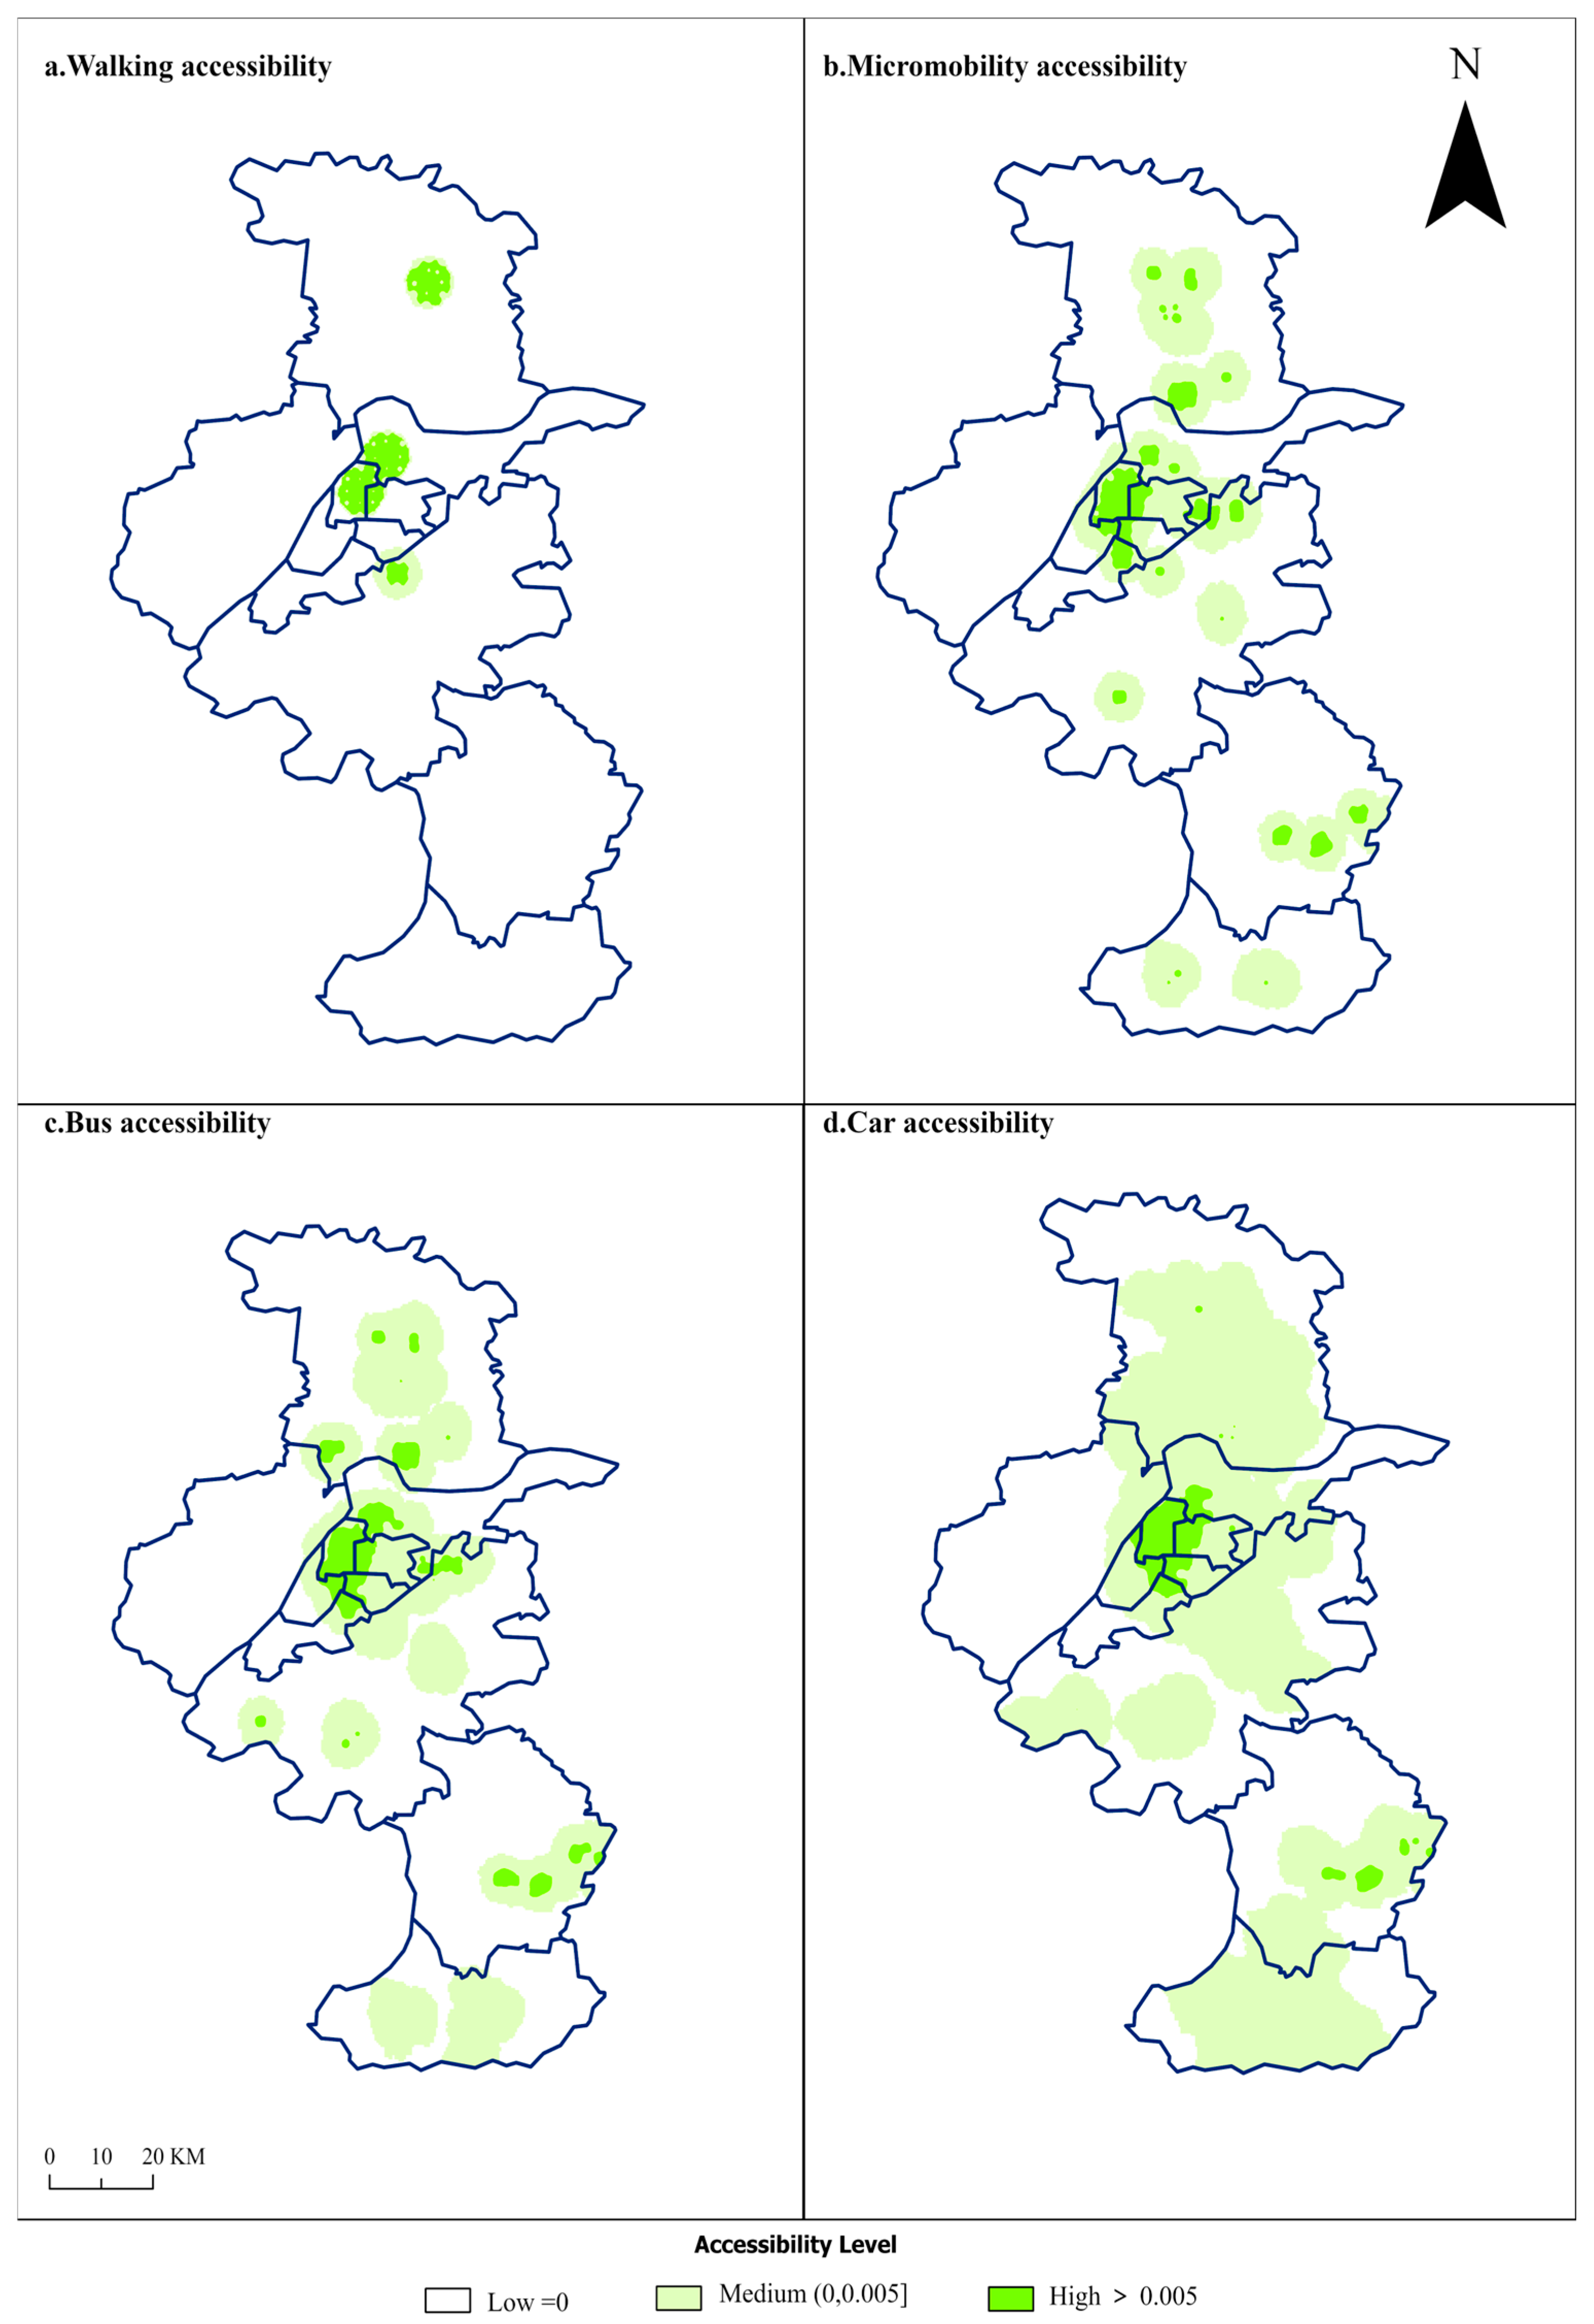
How did the macro-level supply–demand mismatch translate into differences in resource accessibility in the daily micro-level lives of individuals? This section delves into the social consequences arising from the conflict between “market logic” and “social demand” through a spatial accessibility analysis based on the city’s transportation networks (Figure 5) under multiple travel modes (Figure 6).
First, car accessibility (Figure 6d) presented a phenomenon of “false equity” dominated by “market logic.” In this most idealized travel scenario, thanks to Nanjing’s well-developed road network (Figure 5a), the canteen service covered central urban areas, near suburbs, and even parts of the far suburbs, demonstrating the broadest service range among the four modes. However, this equity was built on the unrealistic assumption that all seniors can use motor vehicles without barriers. A study based on the 2012 resident travel survey revealed that in Nanjing at that time, only 4% of the surveyed seniors held a car driver’s license [59]. This data exposed an insurmountable gap between seniors and the convenience of motor vehicles, which is personal driving ability. Furthermore, the travel pattern dominated by non-motorized transport remains mainstream today. This view was also corroborated by a recent study on the travel intentions of seniors in Beijing. The study showed that even in a sample with higher education levels and income expectations, more than half (55.85%) of the respondents still used walking, cycling, and the bus as their primary modes of travel [60]. This further illustrates that a service network reliant on car accessibility is fundamentally disconnected from the real-life circumstances of the majority of the elderly population.
When we shifted the focus from a select few to the broader elderly population, the harsh reality of this service system was fully exposed. In this more realistic picture, the bus (Figure 5b), as a key public service for bridging inequity, exhibited both regulatory effects and limitations. On the one hand, the bus network effectively extended service coverage from the central urban areas to major residential points in the near suburbs. On the other hand, its coverage was heavily dependent on route settings, and in areas with weak bus services, such as the southern part of Lishui and the western part of Pukou, accessibility levels remained low (Figure 6c). This exposed the inherent shortcomings of public services in achieving “last-mile” equity.
In the micromobility accessibility mode (Figure 6b), which is more flexible but relatively slower, the spatial heterogeneity of service coverage became more pronounced. The high-accessibility areas no longer exhibited a linear distribution along bus routes but instead shrank into point-like or small-scale clusters centered around the elderly canteens. Although several secondary service nodes were formed in suburban districts like Jiangning, the overall coverage showed a high degree of fragmentation. A lack of effective connectivity between different service areas resulted in the formation of large service interruption zones.
Finally, walking accessibility (Figure 6a), serving as the baseline for assessing fundamental welfare provision, revealed the most severe problem of service supply imbalance. Under this mode, high-accessibility areas shrank dramatically, showing only a discrete distribution in a few locations within the central urban area where canteens were highly concentrated. For the most vulnerable seniors with limited mobility who rely entirely on walking, this meant that in the vast majority of Nanjing, elderly canteen services were physically inaccessible. This phenomenon clearly pointed to a form of spatial exclusion, where the groups most in need of public service support faced fundamental spatial constraints on their right to access these services under the existing facility layout.

4.3. Facility Layout Optimization

4.3.1. Identification of Potential Optimization Areas

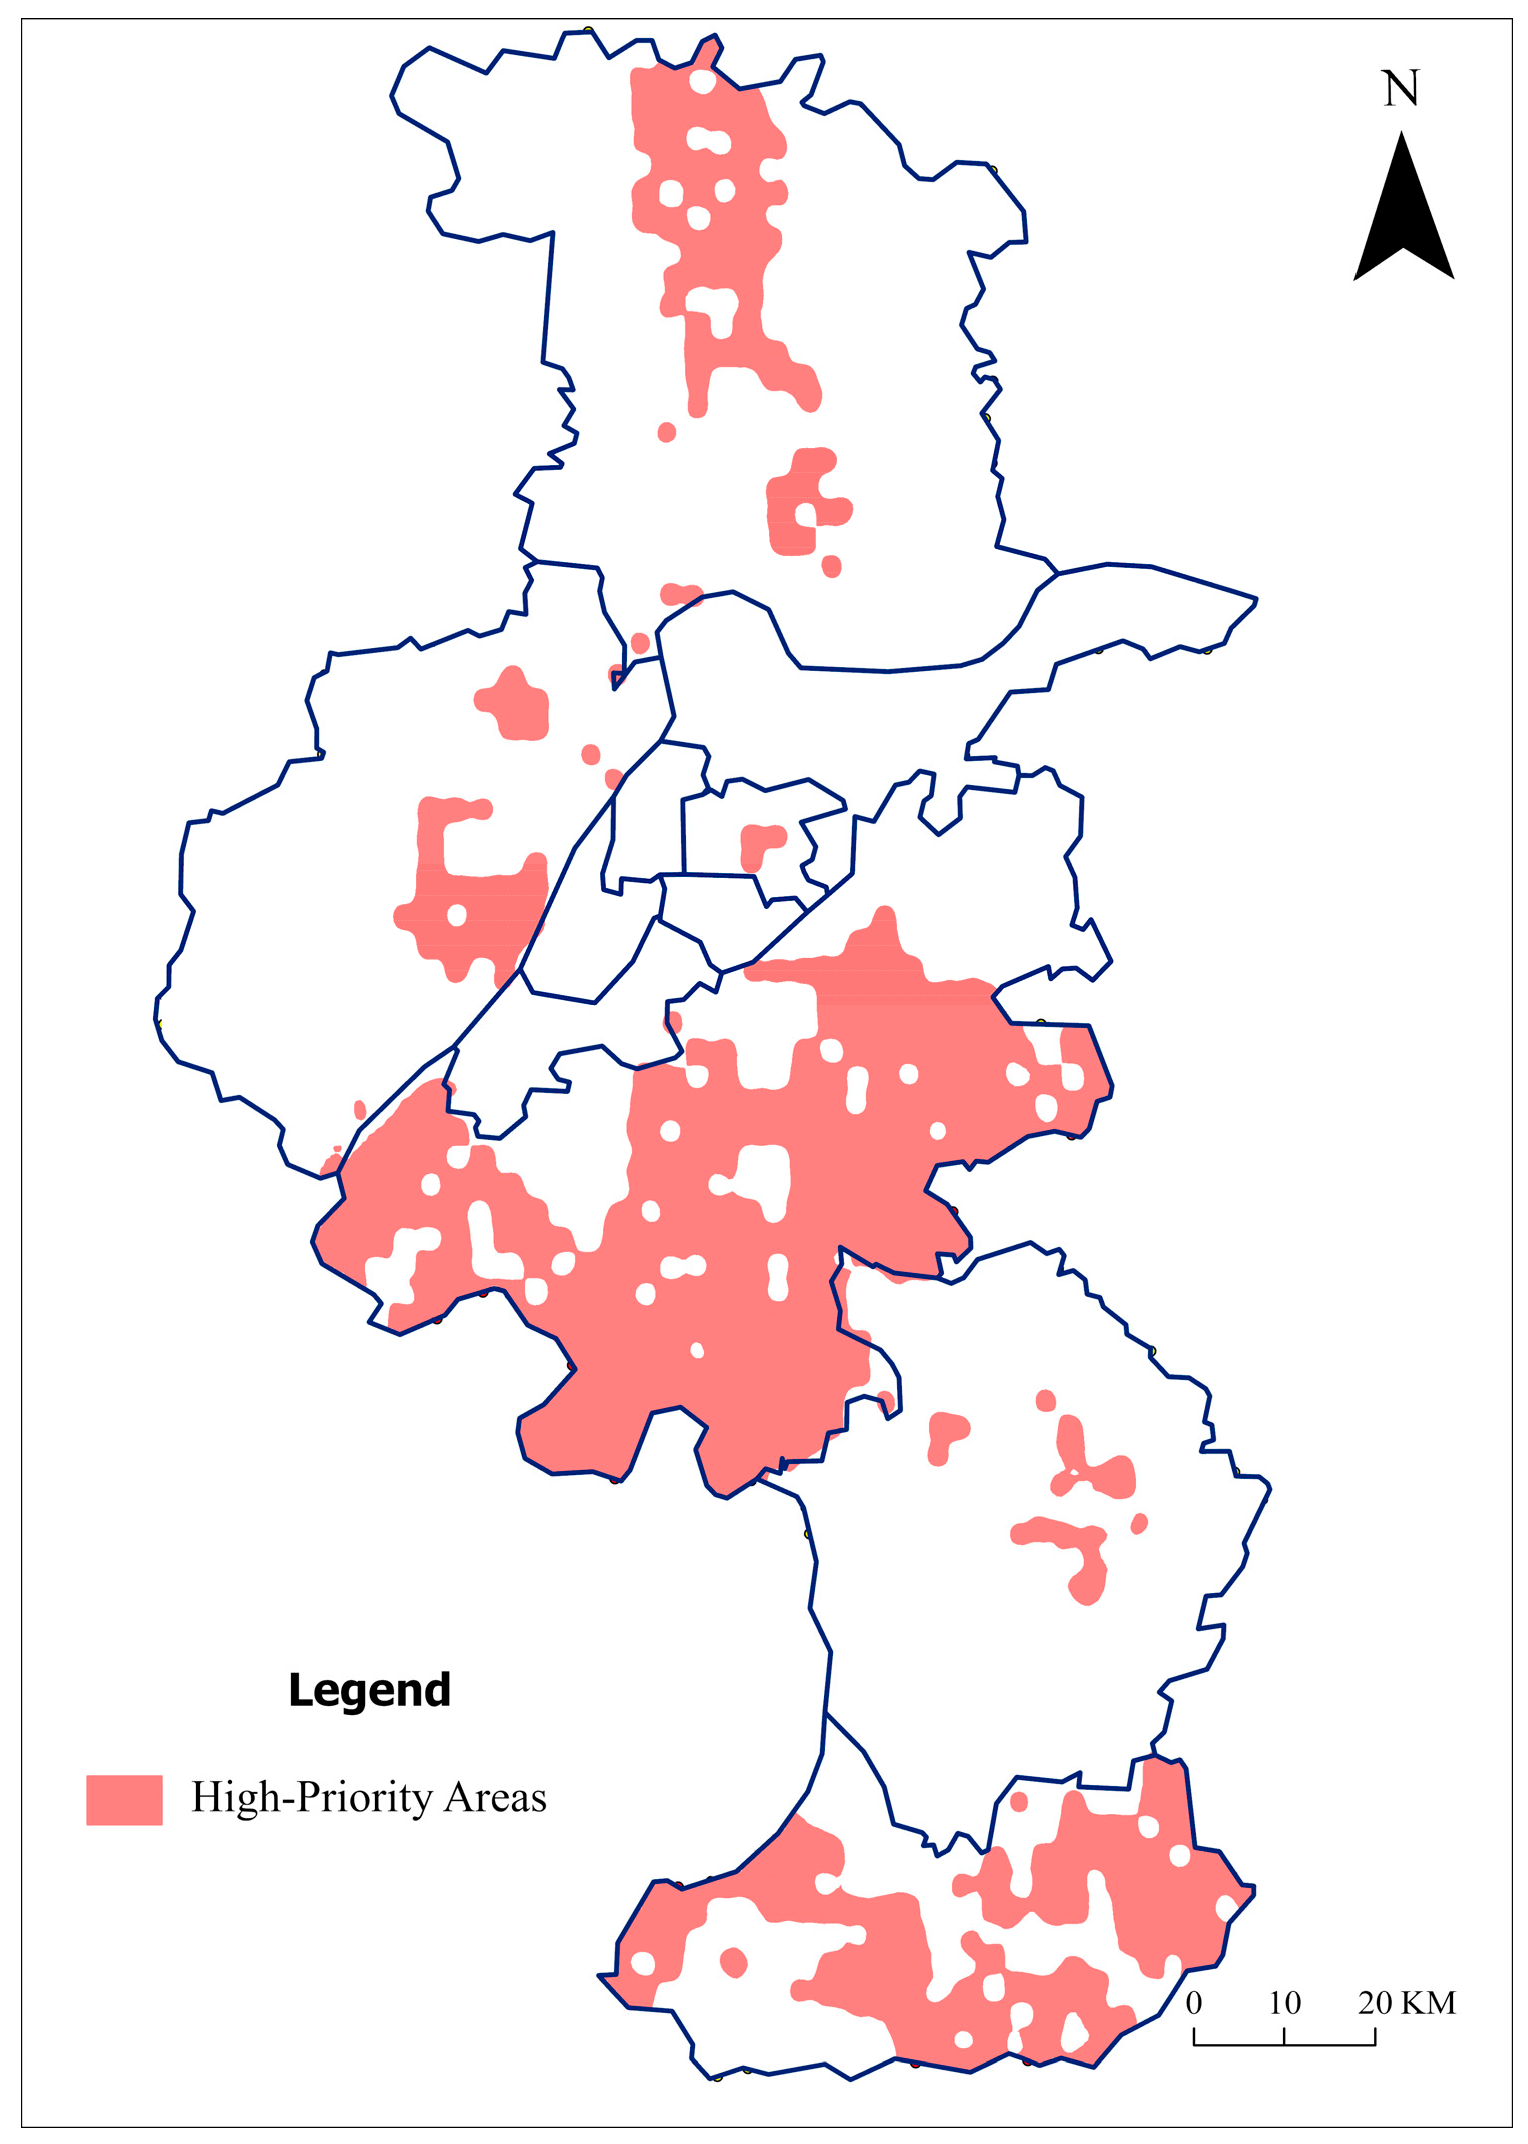
The primary goal of this section was to precisely locate the weak spots in the service network. Based on the aforementioned three-dimensional quadrant classification model, we identified a set of spatial units that simultaneously met the characteristics of a triple dilemma: “high demand, low supply, and low accessibility.”
The spatial distribution of these identified potential optimization areas (Figure 7) revealed the geographical boundaries where “market failure” and “lagging public services” coincided. As the figure shows, these service depressions were not randomly distributed but instead exhibited distinct spatial clustering, located almost entirely in the suburban areas of the city. They were mainly concentrated in the south-central part of Jiangning District, Pukou District, the southern part of Liuhe District, and large portions of Lishui and Gaochun. This map represents typical areas where social demand was strong, but market supply, driven by profit orientation, was insufficient. It provided clear spatial targets for the subsequent optimization.

4.3.2. Results of the Site Selection Optimization

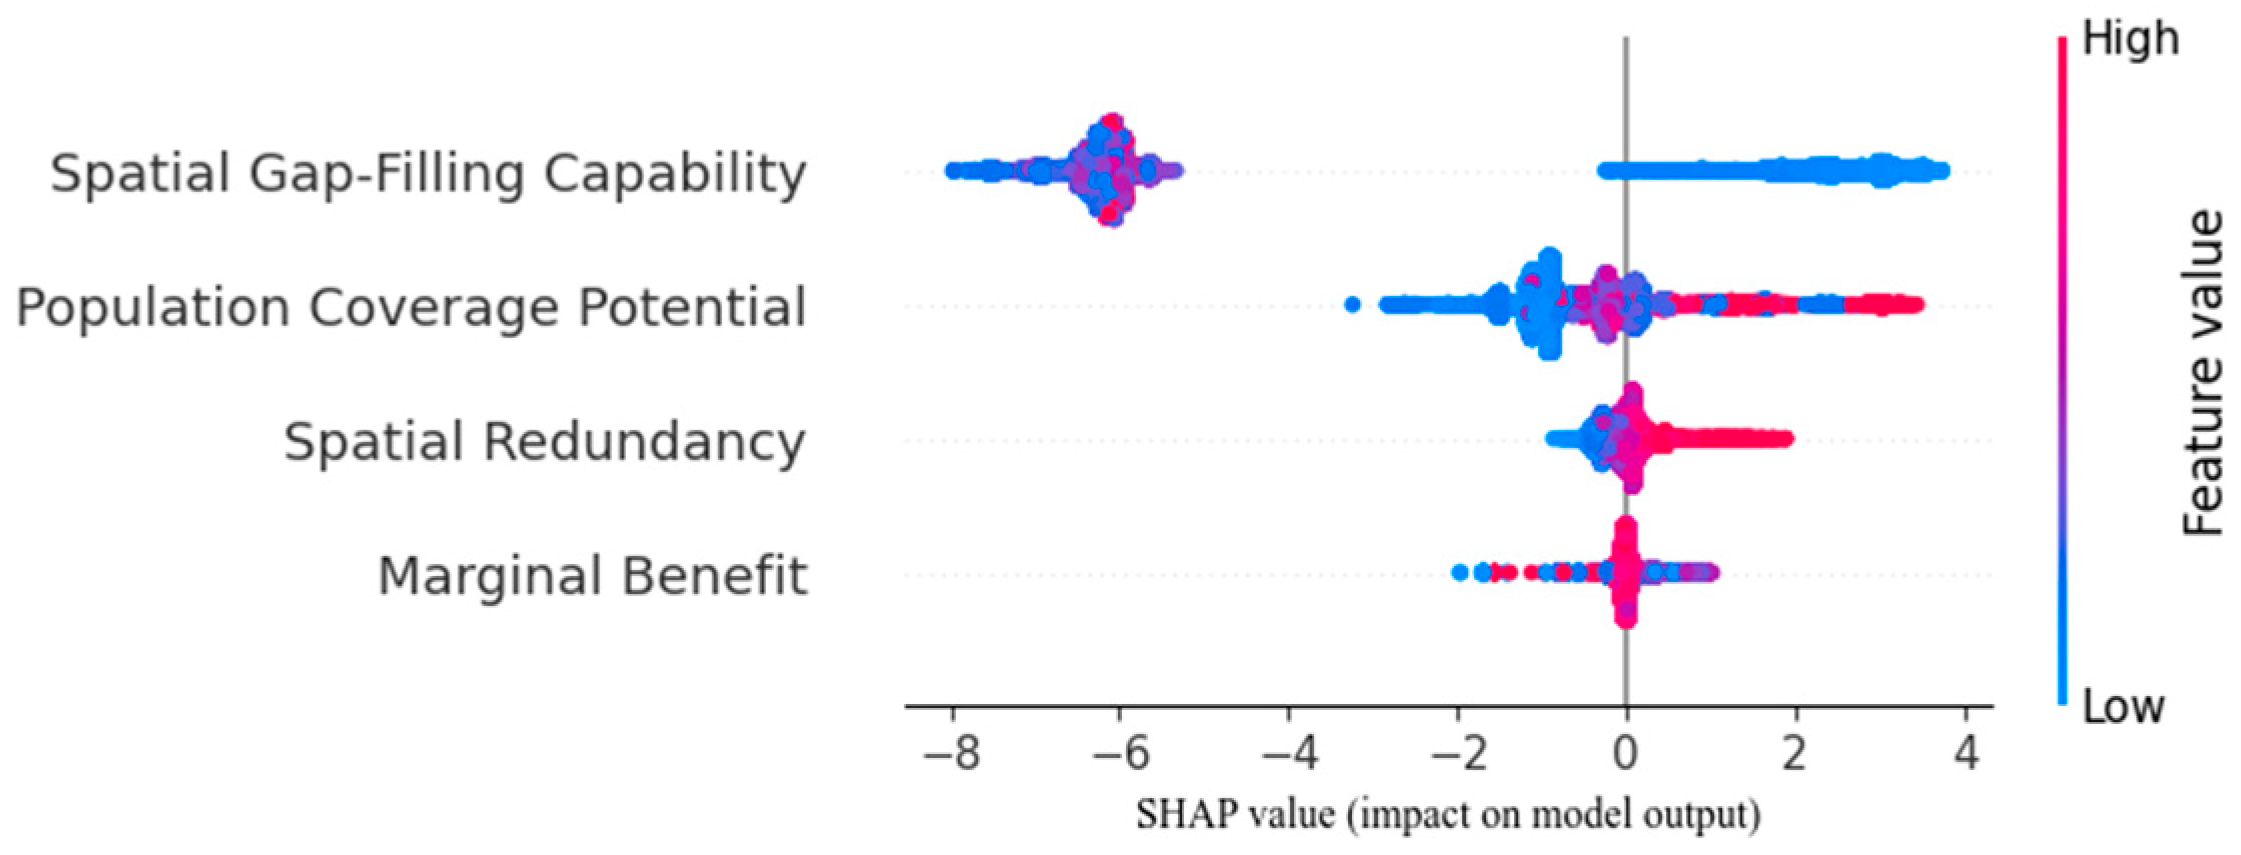
The trained XGBoost model exhibited excellent predictive performance, achieving an accuracy of 95.68% and an AUC value as high as 0.99 on the test set. These metrics provided strong evidence that the feature system constructed in this study could effectively identify high-potential canteen sites. At the same time, to transform the model from a predictive tool into an insightful decision-support system, this study employed the SHAP method to deeply analyze and quantify the contribution of each feature to the model’s final predictions. In this way, we can not only know “which sites are optimal” but also clearly understand “why these sites are optimal.” The results of the SHAP analysis (Figure 8) indicated that the model had successfully learned a site selection strategy that was demand-oriented while also considering stock optimization.
First, the absolute dominance of demand was clear. In the model, the two features with the highest decision-making weight were spatial gap-filling capability and population coverage potential, both of which are demand-side objectives. The impact of spatial gap-filling capability was the most critical. The SHAP plot showed a strong negative correlation pattern: the closer a candidate point was to a high-demand area (indicated by lower feature values, represented in blue on the plot), the greater the likelihood and magnitude of its positive contribution to the model’s prediction. This indicated that the model’s primary decision rule was to fill service gaps. Building on this, population coverage potential was the second most important feature, exhibiting a clear positive correlation. This means that while satisfying proximity to demand areas, the model prioritized potential sites that could serve a larger number of seniors. Together, these two features ensured that new facilities would be precisely directed toward the areas and populations most in need of service.
Second, while satisfying the demand-oriented prerequisite, the model adhered to a principle of spatial efficiency based on existing stock supply. The third and fourth most important features were spatial redundancy and marginal benefit, respectively. The analysis of spatial redundancy showed that the farther a candidate point was from an existing elderly canteen (indicated by higher feature values, represented in red), the more likely it was to be judged as an optimal site by the model. This represented an avoidance strategy to prevent the over-concentration of resources. The marginal benefit feature, in turn, indicated that the fewer existing canteens there were within the service radius (indicated by lower feature values, represented in blue), the higher the potential of a candidate point. These two secondary decision rules of the model demonstrated that, in the layout of new facilities, the model pursued the maximization of marginal benefit and avoided redundant construction in areas where services were already saturated.
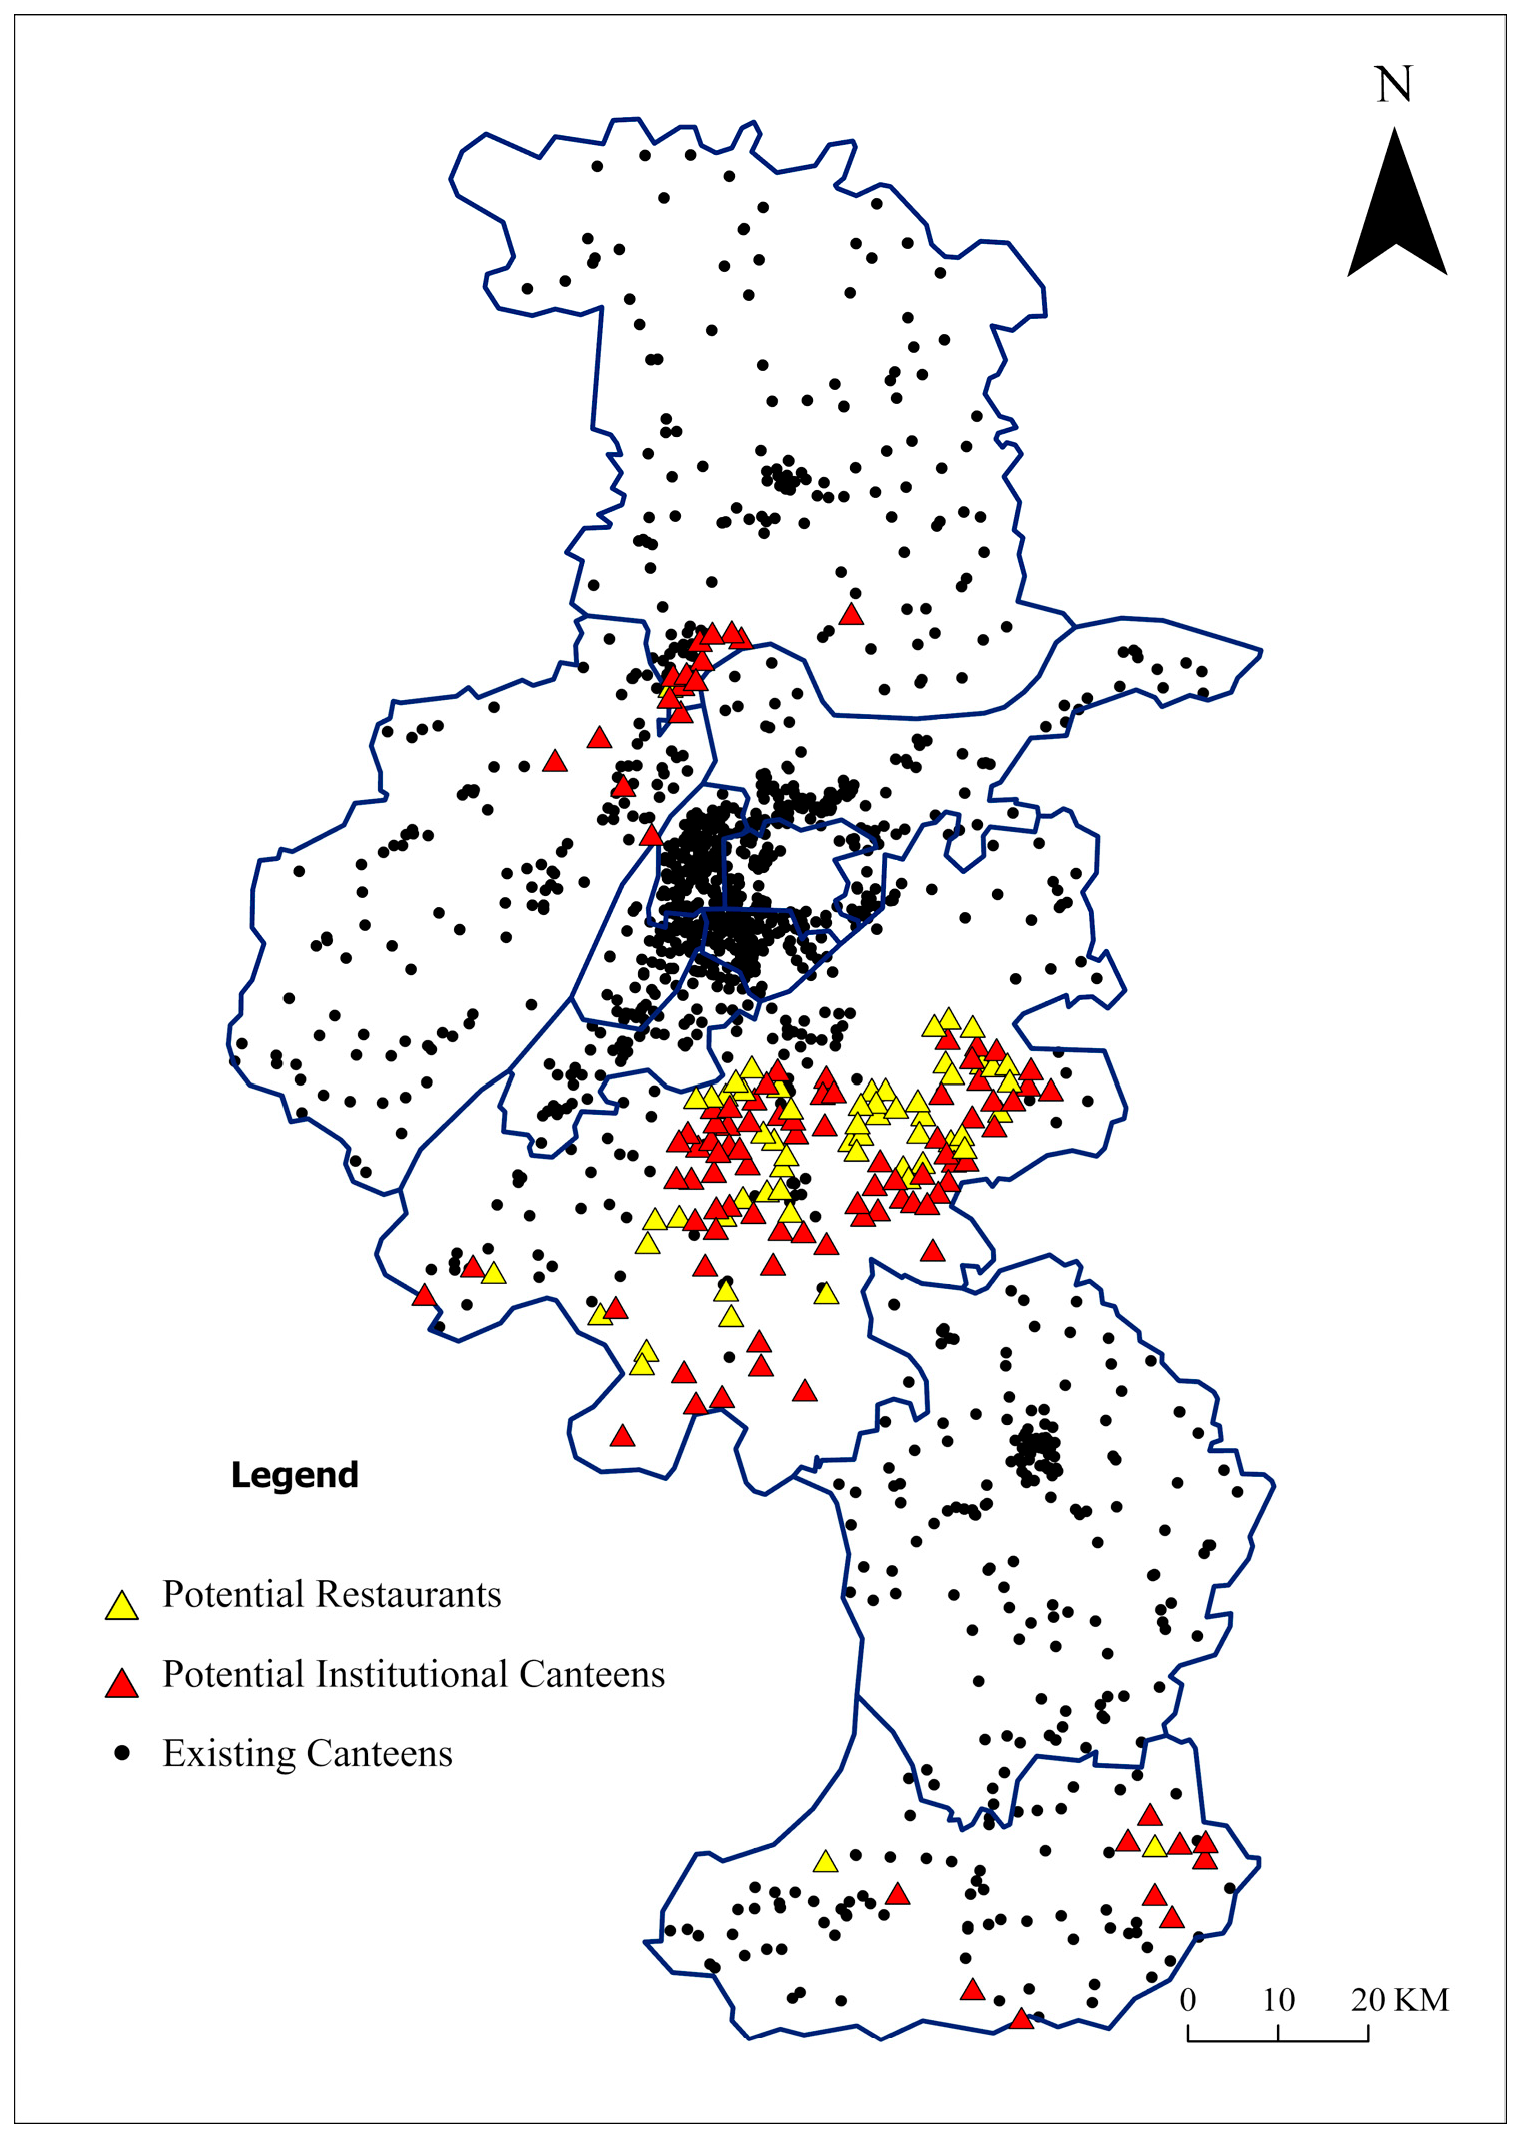
This clear decision-making logic provided a solid foundation for the final site selection optimization. After a multi-step filtering process, this study ultimately identified 161 high-priority recommended sites with dispersed layouts and outstanding service potential across the city. It can be visually observed from Figure 9 that, in stark contrast to the existing pattern where elderly canteens are highly concentrated in central urban areas, almost all of the 161 new recommended sites were precisely placed in the peripheral “service depressions,” forming new service clusters in districts such as Jiangning, Gaochun, and Liuhe. Table 2 quantitatively presents this site selection result. Jiangning District, as the administrative district with the largest potential optimization area, received the most recommended sites (132), accounting for 82% of the total. Following behind were Gaochun and Liuhe districts, each receiving 12 recommended sites. Meanwhile, the number of recommended sites in the six central urban districts was zero, which quantitatively validated that services in these areas are already saturated and that optimization efforts should be focused elsewhere.
Moreover, this model not only suggested ‘where’ to optimize but also revealed differentiated paths on ‘how to optimize.’ In Jiangning District, the model recommended a large number of potential institutional canteens (76) and potential restaurants (56). This indicated that a dual-track strategy combining the “activation of public resources” with the “incentivization of market forces” was feasible. However, in Liuhe and Gaochun districts, the number of recommended institutional canteens far exceeded that of restaurants (with ratios of 11:1 and 10:2, respectively), suggesting that in these areas, the task of meeting basic service needs relied almost entirely on the activation of existing public and social stock resources.
Finally, and most critically, the optimization model also played the role of a diagnostic tool, revealing the hard constraints of a strategy that relies solely on stock activation. The results for Pukou and Lishui districts were a stark case in point. Although these two districts were identified with large potential optimization areas (111.59 km2 and 63.34 km2, respectively), the number of recommended sites they ultimately received was minimal (5 and 0, respectively). This was not a model failure; rather, it was a deeper structural problem that the model identified for us. These areas are typical “resource vacuums” where, on the one hand, there is high potential demand from seniors, while on the other hand, convertible stock facilities are extremely scarce. In such areas, this study’s stock activation strategy was inapplicable. The findings suggest that in these regions, it is necessary to consider direct investment in new community canteens, the introduction of mobile meal vehicles, or the development of other innovative service models to address the severe public welfare needs.

5. Discussion and Conclusions

5.1. Key Findings and Theoretical Contributions

Through a comprehensive analysis of Nanjing’s elderly canteen service network, this study revealed the spatial consequences arising from the conflict between “market logic” and “social demand” in the context of rapid urbanization. The core finding of this research is that a structural mismatch exists between the supply of elderly canteen services and the potential demand from the elderly population. Service provision is highly concentrated in the city center, while the elderly population is widely dispersed across multiple centers. This mismatch provides a vivid case study for understanding the spatial inequality of quasi-public service facilities in urban China. To fully unpack the deeper significance of this structural mismatch, it is necessary to critically examine the two foundational concepts that support this paper’s entire analytical framework: “demand” and “supply.”
First, through a macro-level analysis of “potential spatial demand,” this study revealed the problem of “inequality of opportunity” in basic public services within the city. We fully agree that the “actualized demand” for elderly canteen services is a highly heterogeneous concept, deeply influenced by micro-level factors such as individual health, economic status, and family support networks [9,61]. However, in a city-level spatial analysis, precisely modeling and predicting the “actualized demand” of every individual is extremely difficult and constitutes a significant research problem in its own right. This paper focuses its analysis on the macro-level assessment of “potential demand.” We argue that for a quasi-public service led by the government and aimed at ensuring basic public welfare, the primary prerequisite for its planning is the equity of spatial opportunity. Even if a city cannot guarantee that every senior will actually use the canteen service, it has a responsibility to ensure that no senior is systematically deprived of the right to conveniently access this service simply because they happen to reside in a certain corner of the city. The extreme spatial inequality revealed by this study’s Gini coefficient of 0.85 is a powerful quantification of this “inequality of opportunity.” It demonstrates that the current market-logic-dominated layout is systematically failing to provide this foundational service opportunity.
Second, on the supply side, this study provides a solution to break the path dependency of the current supply model by redefining the concept of “supply,” with stock activation at its core. The analysis above has shown that the current service network cannot meet the demand for “equality of opportunity” that is widely dispersed. The root of this problem lies not only in flawed site selection but, more fundamentally, in a narrow understanding of the concept of “supply” itself. Currently, the construction of public service facilities for the elderly in most Chinese cities heavily relies on a path of government financial investment in building new, dedicated sites [62]. Although this model can ensure complete infrastructure, uniform service standards, and ease of management, it also entails high construction costs and long cycles. Constrained by land availability, it struggles to respond flexibly and quickly to decentralized community needs, which objectively exacerbates the imbalance in service coverage. Therefore, this paper argues that the source of supply should not be limited to newly built, dedicated facilities but should also include the vast stock of existing resources in the city that have not been fully utilized. Our optimization model proves that when “supply” is redefined, a service network that is lower in cost, higher in efficiency, and more conducive to promoting spatial opportunity equity is entirely achievable. This provides urban managers with a more flexible policy toolkit that moves beyond the dependency on “new builds.”

5.2. Policy Implications

Based on the findings above, this study offers a multi-level set of policy recommendations, ranging from macro-level strategy to specific implementation mechanisms, for Nanjing and other cities facing similar challenges.
First, construct a data-driven, spatially targeted incentive mechanism to refine the existing universal subsidy system. The city of Nanjing has already established a classified subsidy policy framework covering both construction and operation [45]. Currently, incentives for canteens primarily consist of a basic subsidy based on construction area and a performance-based reward for the number of person-meals served. However, the incentive mechanism within this framework is spatially neutral and does not reflect regional differences. This spatially undifferentiated subsidy model is one of the institutional roots that perpetuates and exacerbates the “inequality of opportunity” identified in this study. It provides identical construction and operational incentives to both the already saturated central urban areas and the peripheral suburbs that are in urgent need of service expansion, thus objectively failing to guide market and social forces toward the most underserved areas. Based on this, this paper recommends introducing a data-driven “Spatial Adjustment Coefficient” to the existing performance-based incentive system. This would allow the city to be divided into core incentive zones, general areas, and saturated service zones based on dimensions such as supply, demand, and accessibility. By applying different adjustment coefficients to the performance subsidies for each zone, the utility of the fiscal lever can be maximized without significantly increasing administrative costs, thereby achieving precise guidance for market and social forces.
Second, adopt a place-based, hybrid supply strategy, abandoning a “one-size-fits-all” management approach. The optimization results of this study indicated that the resource endowments of different areas affect the optimal path for their service provision. Therefore, urban managers should adopt differentiated service supply strategies based on the resource foundations of their respective areas. For near-suburban districts rich in resources, such as Jiangning, the policy focus should be on “stock activation.” The government in these areas should act as an enabler and facilitator, using targeted incentive mechanisms to guide both market-oriented restaurants and social institutional canteens to jointly participate in providing elderly canteen services. For far-suburban districts with poor foundational resources, such as Pukou and Lishui, the “stock activation” strategy is ineffective. Here, the government must assume the responsibility for direct service provision. This can be achieved by adopting models such as a “central kitchen + distribution network” to efficiently cover dispersed residential points through intensive production and logistics. At the same time, in the planning approvals for new residential areas in these districts, the construction of community elderly care facilities should be made a mandatory public amenity requirement, thereby filling the service gap at its source.
Third, integrate transportation safety planning into the layout of elderly canteens, leap from “theoretical accessibility” to “safe accessibility.” Nanjing’s current policy demonstrates meticulous consideration for food safety in transportation, with clear regulations for delivery vehicles concerning insulation, licensing, and insurance [45]. However, the policy’s focus is primarily on how to safely deliver meals to seniors, while overlooking the question of how seniors can safely get to the canteens. Our accessibility model showed that micromobility, represented by electric bikes and tricycles, significantly expands the accessibility radius for seniors. We must, however, confront the fact that this model-calculated “theoretical accessibility” may translate to “high-risk accessibility” in reality. On urban roads lacking dedicated micromobility lanes and with heavy mixed traffic, a canteen that appears close on a map could mean a perilous journey for an independently traveling senior. Therefore, this paper recommends that departments such as Civil Affairs, Transportation, and Urban Construction should break down their silos and engage in coordinated governance. Policy should prioritize road construction in the potential optimization areas characterized by “high demand, low supply, and low accessibility.” This includes building physically separated micromobility lanes, closely linking the layout of elderly canteens with the development of an elderly-friendly slow-traffic network, and ensuring that the “last mile” for seniors is both safe and convenient.

5.3. Limitations and Future Research

Every study has its boundaries, and clearly articulating them is crucial for accurately interpreting this study’s conclusions and for guiding future academic exploration. As an exploratory study aimed at the macro-level diagnosis and optimization of an urban elderly canteen network, its main limitations and directions for future research are primarily threefold.
First, regarding conceptual definition and demand measurement, the analytical scale of this study is suited for macro-level diagnosis rather than micro-level prediction. The meal service demand of seniors is a highly heterogeneous concept influenced by individual factors such as health, economic status, and family structure. At the same time, elderly canteens also encompass functionally diverse service types, including community-run canteens and chain restaurants. Due to data accessibility constraints, this study used the total elderly population as a proxy variable for potential spatial demand and analyzed all officially listed canteens as a comprehensive supply network. Consequently, this study can only evaluate the foundational equality of opportunity of the entire service system and cannot precisely simulate individual-level usage behavior. Future research urgently needs to build upon the foundation of this macro-level layout assessment by conducting large-scale urban micro-surveys to acquire data on the socioeconomic attributes and service-type preferences of seniors in different areas, thereby constructing a refined “actualized demand” prediction model.
Second, regarding the parameter setting for the accessibility model, this study adopted a “baseline model” rather than a “localized model.” The key parameters of this study’s accessibility model, such as walking speed, the 15 min travel willingness threshold, and micromobility speed, were primarily based on national standards and existing literature, rather than on large-scale empirical research of Nanjing’s local elderly population. Therefore, the accessibility maps calculated in this study are a measure of structural accessibility; they reveal the universal problems determined by the urban spatial structure and facility layout itself, rather than a precise replication of the real travel experiences of Nanjing’s seniors. Consequently, future research should continue to conduct micro-level empirical studies based on GPS tracking, wearable devices, and travel diaries to deeply analyze the real travel behaviors of seniors. This would allow for the construction of a behavioral model calibrated with local data, capable of reflecting the habits of seniors with different health conditions and travel customs.
Third, regarding the design of the optimization strategy, this study focuses on “stock activation,” and its applicability has clear boundaries. The strategy can only indicate which resources can be activated in areas where existing stock is abundant. However, for areas with poor foundational resources, this strategy is fundamentally inapplicable. Beyond this, the site selection in this study was a purely quantitative spatial analysis and failed to include important qualitative factors such as community safety, environmental pleasantness, and the quality of interior facilities. Therefore, the optimization results of this study should only be considered a first-stage, macro-level screening tool; actual site selection must be combined with on-site investigations and qualitative assessments. Future research should explore the adoption of mixed-methods approaches, attempting to integrate multiple data sources such as street-view imagery and community safety scores into the site selection model.

5.4. Conclusions

Using Nanjing’s elderly canteen service as a case study, this study systematically revealed the spatial mismatch problem of service facilities in Chinese megacities, which is caused by the conflict between “market logic” and “social demand.” The core conclusion of this paper is that the current service layout suffers from a severe structural imbalance, leading to significant “inequality of opportunity.” This has systematically deprived a large number of seniors residing in peripheral urban areas of their fundamental right to conveniently access the service. To address this challenge, this study proposed and validated a low-cost, high-efficiency optimization strategy centered on “stock activation.” Our interpretable machine learning model proved that an intelligent site selection framework that is “demand-oriented while considering spatial efficiency” is entirely feasible, capable of generating a more spatially balanced and equitable service network. At the same time, the analytical framework also diagnosed the applicability boundaries of the strategy itself by identifying “resource vacuums” where the “stock activation” strategy fails due to a lack of convertible resources. In summary, the contribution of this study lies not only in providing a specific site optimization plan for Nanjing but also in offering an analytical perspective for urban public service planning that shifts from “site selection” to “governance.” Through this analytical path—which integrates diagnosis, evaluation, optimization, and reflection—this study provides data-driven decision support for how to achieve a place-based, hybrid supply strategy.

Author Contributions

Conceptualization, Y.X. and X.W.; methodology, X.W.; software, X.W.; validation, X.W., X.Y. and Y.X.; formal analysis, X.W.; investigation, X.W.; resources, Y.X.; data curation, X.W.; writing—original draft preparation, X.W.; writing—review and editing, X.W. and Y.X.; visualization, X.W.; supervision, Y.X.; project administration, Y.X.; funding acquisition, Y.X. All authors have read and agreed to the published version of the manuscript.

Funding

This research was funded by the National Social Science Fund of China (Grant No. 24BGL270) and the Jiangsu Provincial Education Science Fund (Grant No. B/2021/03/46).

Data Availability Statement

The data presented in this study are openly available in Zenodo at https://doi.org/10.5281/zenodo.17617954.

Acknowledgments

We thank Shugao Lin from the College of Public Administration, Nanjing Agricultural University, for his valuable suggestions on this manuscript. In preparing this manuscript, Google’s Gemini was utilized to assist with grammar refinement, phrasing, and overall clarity of expression. All errors and omissions are our own.

Conflicts of Interest

The authors declare no conflicts of interest.

References

  1. United Nations Department for Economic and Social Affairs. World Population Prospects 2024: Summary of Results; United Nations: New York, NY, USA, 2024; ISBN 978-92-1-003169-1. [Google Scholar]
  2. Central People’s Government of the People’s Republic of China China’s Economy Is Running Steadily with Progress. Available online: https://www.gov.cn/lianbo/bumen/202501/content_6999754.htm (accessed on 24 May 2025).
  3. Wiles, J.L.; Leibing, A.; Guberman, N.; Reeve, J.; Allen, R.E.S. The Meaning of “Aging in Place” to Older People. Gerontologist 2012, 52, 357–366. [Google Scholar] [CrossRef] [PubMed]
  4. Beijing Municipal Committee on Aging Notice on the Issuance of the “14th Five-Year Plan for the Development of Aging Services in Beijing”. Available online: https://www.beijing.gov.cn/zhengce/gfxwj/sj/202111/t20211126_2545746.html (accessed on 28 June 2025).
  5. Shanghai Municipal People’s Government Notice on the Issuance of the “11th Five-Year Development Plan for Civil Affairs in Shanghai”. Available online: https://www.shanghai.gov.cn/nw16920/20200820/0001-16920_10052.html (accessed on 28 June 2025).
  6. Yan, S. Unmet Community Care Needs and the Well-Being of Older Adults in China. Innov. Aging 2024, 8, 6. [Google Scholar] [CrossRef]
  7. Juckett, L.A.; Hariharan, G.; Dodonova, D.C.; Klaus, J.; Rowe, M.; Burak, E.; Mason, B.; Bunck, L. Implementing a Community-Based Initiative to Improve Nutritional Intake Among Home-Delivered Meal Recipients. Nutrients 2022, 14, 944. [Google Scholar] [CrossRef]
  8. Fleury, S.; Tronchon, P.; Rota, J.; Meunier, C.; Mardiros, O.; Van Wymelbeke-Delannoy, V.; Sulmont-Rossé, C. The Nutritional Issue of Older People Receiving Home-Delivered Meals: A Systematic Review. Front. Nutr. 2021, 8, 629580. [Google Scholar] [CrossRef]
  9. Middleton, G.; Patterson, K.A.; Muir-Cochrane, E.; Velardo, S.; McCorry, F.; Coveney, J. The Health and Well-Being Impacts of Community Shared Meal Programs for Older Populations: A Scoping Review. Innov. Aging 2022, 6, igac068. [Google Scholar] [CrossRef] [PubMed]
  10. Wang, X.; Liu, M.; Li, Y.; Guo, C.; Yeh, C.H. Community Canteen Services for the Rural Elderly: Determining Impacts on General Mental Health, Nutritional Status, Satisfaction with Life, and Social Capital. BMC Public Health 2020, 20, 230. [Google Scholar] [CrossRef]
  11. Lloyd, J.L.; Wellman, N.S. Older Americans Act Nutrition Programs: A Community-Based Nutrition Program Helping Older Adults Remain at Home. J. Nutr. Gerontol. Geriatr. 2015, 34, 90–109. [Google Scholar] [CrossRef]
  12. Selvamani, Y.; Arokiasamy, P.; Chaudhary, M. Association between Food Insecurity and Quality of Life Among Older Adults (60+) in Six Low and Middle-Income Countries. Arch. Gerontol. Geriatr. 2023, 114, 105079. [Google Scholar] [CrossRef]
  13. Ren, Y.; Lai, Y.; Shen, L.; Liu, Y. Towards an Elderly-Friendly Society: How Much Has the Elderly’s Well-Being Been Taken into Account in the Provision of Urban Public Services? J. Urban Manag. 2025, 14, 896–912. [Google Scholar] [CrossRef]
  14. Walton, K.; Charlton, K.E.; Manning, F.; McMahon, A.T.; Galea, S.; Evans, K. The Nutritional Status and Energy and Protein Intakes of MOW Clients and the Need for Further Targeted Strategies to Enhance intakes. Appetite 2015, 95, 528–532. [Google Scholar] [CrossRef]
  15. Cheng, T.; Liu, C.; Yang, H.; Wang, N.; Liu, Y. From Service Capacity to Spatial Equity: Exploring a Multi-Stage Decision-Making Approach for Optimizing Elderly-Care Facility Distribution in the City Centre of Tianjin, China. Sustain. Cities Soc. 2022, 85, 104076. [Google Scholar] [CrossRef]
  16. Feng, H.; Tang, X.; Zou, C. Optimizing the Layout of Service Facilities for Older People Based on POI Data and Machine Learning: Guangzhou City as an Example. Land 2024, 13, 700. [Google Scholar] [CrossRef]
  17. Juckett, L.A.; Nikahd, M.; Hyer, J.M.; Klaus, J.N.; Rowe, M.L.; Bunck, L.E.; Hariharan, G. Preliminary Evaluation of Home-Delivered Meals for Reducing Frailty in Older Adults at Risk for Mal-Nutrition. J. Nutr. Health Aging 2024, 28, 100283. [Google Scholar] [CrossRef] [PubMed]
  18. Seo, S.; Kim, O.Y.; Ahn, J. Healthy Eating Exploratory Program for the Elderly: Low Salt Intake in Congregate Meal Service. J. Nutr. Health Aging 2016, 20, 316–324. [Google Scholar] [CrossRef]
  19. Marnfeldt, K.; Estenson, L.; Rowan, J.; Wilber, K. Caregiving and COVID-19: Perspectives from a Care Coach. Innov. Aging 2021, 5, 930. [Google Scholar] [CrossRef]
  20. Kvæl, L.A.H. Ageing in Place or Stuck in Place: A Critical Qualitative Study on Older Adults’ Independence Across Six Municipalities in Norway. Soc. Sci. Med. 2025, 375, 118098. [Google Scholar] [CrossRef]
  21. Zou, X.; Zhou, Y.; Lu, Y. Addressing ‘Difficulty in Dining’ Among Older Adults: Optimizing Community Senior Dining Halls from External and Internal Built Environments. Humanit. Soc. Sci. Commun. 2024, 11, 1361. [Google Scholar] [CrossRef]
  22. Jian, I.Y.; Chan, E.H.; Xu, Y.; Owusu, E.K. Inclusive Public Open Space for All: Spatial Justice with Health Considerations. Habitat. Int. 2021, 118, 102457. [Google Scholar] [CrossRef]
  23. Ning, W.; Yang, Y.; Lu, M.; Han, X. Equity in Walking Access to Community Home Care Facility Resources for Elderly with Different Mobility: A Case Study of Lianhu District, Xi’an. PLoS ONE 2022, 17, e0277310. [Google Scholar] [CrossRef]
  24. Rémillard-Boilard, S.; Buffel, T.; Phillipson, C. Developing Age-Friendly Cities and Communities: Eleven Case Studies from around the World. Int. J. Environ. Res. Public Health 2020, 18, 133. [Google Scholar] [CrossRef]
  25. Świąder, M.; Aslanoğlu, R.; Chrobak, G.J.; Ivan, L.; Perek-Białas, J.M.; Dikken, J.; van Hoof, J.; Kazak, J.K. Shaping Age-Friendly Cities and Communities: A Geospatial Approach to the Assessment of Four Cities in Europe. Cities 2025, 166, 106247. [Google Scholar] [CrossRef]
  26. Zheng, T.; Ma, X.; Cheng, X. Spatial Pattern and Influencing Factors of Urban Elderly Meal Assistance Facilities: A Case Study from Beijing, China, Based on Multi-Source Data. J. Asian Archit. Build. Eng. 2025, 2536778. [Google Scholar] [CrossRef]
  27. Wang, F.; Zhou, H.; Lv, C.; Song, X. Analysis of Distribution Equilibrium and Influencing Factors for Older Adult Meal Service Facilities in Mainland China. Front. Public Health 2025, 13, 1578827. [Google Scholar] [CrossRef] [PubMed]
  28. Zhang, F.; Li, D.; Ahrentzen, S.; Zhang, J. Assessing Spatial Disparities of Accessibility to Community-Based Service Resources for Chinese Older Adults Based on Travel Behavior: A City-Wide Study of Nanjing, China. Habitat. Int. 2019, 88, 101984. [Google Scholar] [CrossRef]
  29. Li, M.; Peng, P.; Zhu, H.; Ao, Y.; Zhou, Z. Exploring the Equitable Spatial Planning on the Accessibility of Institutional Elderly Care in Megacity: A Study Based on Chengdu, China. Sustain. Cities Soc. 2024, 117, 105998. [Google Scholar] [CrossRef]
  30. Zhou, S.; Shen, X.; Jiang, W. Spatial Accessibility and Supply–Demand Analysis of Elderly Dining Services in Beijing. Prof. Geogr. 2016, 68, 674–685. [Google Scholar] [CrossRef]
  31. Dai, G.; Li, R.; Ma, S. Research on the Equity of Health Resource Allocation in TCM Hospitals in China Based on the Gini Coefficient and Agglomeration Degree: 2009–2018. Int. J. Equity Health 2022, 21, 145. [Google Scholar] [CrossRef]
  32. Wang, C.; Geng, X. Assessing the Spatial Equity of the Aged Care Institutions Based on the Improved Potential Model: A Case Study in Shanghai, China. Front. Public Health 2024, 12, 1428424. [Google Scholar] [CrossRef]
  33. Liu, L.; Lyu, H.; Zhao, Y.; Zhou, D. An Improved Two-Step Floating Catchment Area (2SFCA) Method for Measuring Spatial Accessibility to Elderly Care Facilities in Xi’an, China. Int. J. Environ. Res. Public Health 2022, 19, 11465. [Google Scholar] [CrossRef]
  34. Shao, Y.; Luo, W. Supply-Demand Adjusted Two-Steps Floating Catchment Area (SDA-2SFCA) Model for Measuring Spatial Access to Health Care. Soc. Sci. Med. 2022, 296, 114727. [Google Scholar] [CrossRef]
  35. Beaumont, J.R. Location-Allocation Problems in a Plane a Review of Some Models. Socio-Econ. Plan. Sci. 1981, 15, 217–229. [Google Scholar] [CrossRef]
  36. Zhou, X.; Cao, K. Spatial Multi-Objective Optimization of Institutional Elderly-Care Facilities: A Case Study in Shanghai. Int. J. Appl. Earth Obs. Geoinf. 2023, 122, 103436. [Google Scholar] [CrossRef]
  37. Dorosan, M.; Dailisan, D.; Valenzuela, J.F.; Monterola, C. Use of Machine Learning in Understanding Transport Dynamics of Land Use and Public Transportation in a Developing City. Cities 2024, 144, 104587. [Google Scholar] [CrossRef]
  38. Cao, J.; Tao, T. Using Machine-Learning Models to Understand Nonlinear Relationships between Land Use and Travel. Transp. Res. Part D Transp. Environ. 2023, 123, 103930. [Google Scholar] [CrossRef]
  39. Liu, B.; Deng, Y.; Li, M.; Yang, J.; Liu, T. Classification Schemes and Identification Methods for Urban Functional Zone: A Review of Recent Papers. Appl. Sci. 2021, 11, 9968. [Google Scholar] [CrossRef]
  40. Tu, X.; Fu, C.; Huang, A.; Chen, H.; Ding, X. DBSCAN Spatial Clustering Analysis of Urban “Production–Living–Ecological” Space Based on POI Data: A Case Study of Central Urban Wuhan, China. Int. J. Environ. Res. Public Health 2022, 19, 5153. [Google Scholar] [CrossRef]
  41. Jun, M.-J. A Comparison of a Gradient Boosting Decision Tree, Random Forests, and Artificial Neural Networks to Model Urban Land Use Changes: The Case of the Seoul Metropolitan Area. Int. J. Geogr. Inf. Sci. 2021, 35, 2149–2167. [Google Scholar] [CrossRef]
  42. Sun, Y.; Zhu, D.; Li, Y.; Wang, R.; Ma, R. Spatial Modelling the Location Choice of Large-Scale Solar Photovoltaic Power Plants: Application of Interpretable Machine Learning Techniques and the National Inventory. Energy Convers. Manag. 2023, 289, 117198. [Google Scholar] [CrossRef]
  43. Nanjing Municipal Statistics Bureau Statistical Communiqué on the 2023 National Economic and Social Development of Nanjing. Available online: https://tjj.nanjing.gov.cn/bmfw/njsj/202405/t20240511_4663449.html (accessed on 21 August 2025).
  44. Nanjing Civil Affairs Bureau “2023 Nanjing Elderly Population Information and Aging-Related Development Report” Released. Available online: https://mzj.nanjing.gov.cn/njsmzj/mzdt/202406/t20240613_4690010.html (accessed on 10 June 2025).
  45. Nanjing Civil Affairs Bureau Notice on the Implementation Plan for the Nanjing “Ningxiang Meal Assistance” Enhancement Action. Available online: https://www.nanjing.gov.cn/xxgkn/zfgb/202409/t20240927_4775291.html (accessed on 11 October 2025).
  46. Fotheringham, A.S.; Wong, D.W.S. The Modifiable Areal Unit Problem in Multivariate Statistical Analysis. Environ. Plan. A 1991, 23, 1025–1044. [Google Scholar] [CrossRef]
  47. Zhou, X.; Yeh, A.G.O. Understanding the Modifiable Areal Unit Problem and Identifying Appropriate Spatial Unit in Jobs–Housing Balance and Employment Self-Containment Using Big Data. Transportation 2021, 48, 1267–1283. [Google Scholar] [CrossRef]
  48. Chen, Z.; Huang, B. Achieving Urban Vibrancy Through Effective City Planning: A Spatial and Temporal Perspective. Cities 2024, 152, 105230. [Google Scholar] [CrossRef]
  49. Wang, S.; He, J.; Ma, R.; Cheng, Z.; Ding, H. A Comprehensive Vector Dataset of Bus Networks Across China for the Year 2024. Sci. Data 2025, 12, 524. [Google Scholar] [CrossRef]
  50. Delbosc, A.; Currie, G. Using Lorenz Curves to Assess Public Transport Equity. J. Transp. Geogr. 2011, 19, 1252–1259. [Google Scholar] [CrossRef]
  51. Gu, M.; Li, S.; Zheng, G. Optimizing Spatial Accessibility and Equity of Hierarchical Older Adult Care Facilities Using a Multi-Modal Two-Step Floating Catchment Area Method: A Case Study of Lin’an District, Hangzhou. Front. Public Health 2025, 13, 1559463. [Google Scholar] [CrossRef]
  52. Sun, H.; Jing, P.; Liu, Y.; Wang, D.; Wang, B.; Xu, M. The Causal Effect of Private Transport on Life Satisfaction among Older Adults and the Mediation Effect of Social Participation in China. Cities 2024, 148, 104865. [Google Scholar] [CrossRef]
  53. Zhang, Y.; Li, C.; Ding, C.; Zhao, C.; Huang, J. The Built Environment and the Frequency of Cycling Trips by Urban Elderly: Insights from Zhongshan, China. J. Asian Archit. Build. Eng. 2016, 15, 511–518. [Google Scholar] [CrossRef]
  54. Ministry of Commerce and Other 8 Departments Notice on Strengthening Efforts to Promote the Expansion and Upgrading of the Construction of Urban 15-Minute Convenient Living Circles. Available online: https://www.gov.cn/lianbo/bumen/202509/content_7041324.htm (accessed on 13 October 2025).
  55. GB 55011-2021; Code for Urban Road Traffic Engineering Projects. Ministry of Housing and Urban-Rural Development: Beijing, China, 2021. Available online: https://www.chinesestandard.net/PDF/English.aspx/GB55011-2021 (accessed on 22 May 2025).
  56. Kawai, H.; Obuchi, S.; Hirayama, R.; Watanabe, Y.; Hirano, H.; Fujiwara, Y.; Ihara, K.; Kim, H.; Kobayashi, Y.; Mochimaru, M.; et al. Intra-Day Variation in Daily Outdoor Walking Speed Among Community-Dwelling Older Adults. BMC Geriatr. 2021, 21, 417. [Google Scholar] [CrossRef]
  57. Chen, T.; Guestrin, C. XGBoost: A Scalable Tree Boosting System. In Proceedings of the 22nd ACM SIGKDD International Conference on Knowledge Discovery and Data Mining; Association for Computing Machinery, New York, NY, USA, 13 August 2016; pp. 785–794. [Google Scholar]
  58. Lundberg, S.M.; Lee, S.-I. A Unified Approach to Interpreting Model Predictions. In Proceedings of the Advances in Neural Information Processing Systems, Long Beach, CA, USA, 4–9 December 2017; Curran Associates, Inc.: La Jolla, CA, USA, 2017; Volume 30, p. 10. [Google Scholar]
  59. Feng, J.; Yang, Z. Nanjing shi chengshi laonianren chuxing xingwei de yingxiang yinsu [Factors influencing travel behavior of urban elderly people in Nanjing]. Dili Kexue Jinzhan [Prog. Geogr.] 2015, 34, 1598–1608. (In Chinese) [Google Scholar]
  60. Hao, M.; Wang, X.; Hou, S.; Zhang, Q.; Xue, T. The Elderly Acceptance of Autonomous Vehicle Services in Beijing, China. Int. Rev. Spat. Plan. Sustain. Dev. 2023, 11, 64–84. [Google Scholar] [CrossRef]
  61. Tsai, W.-C.; Chen, X. Understanding the Key Factors of Older Adults’ Continuance Intention in Congregate Meal Halls. Foods 2021, 10, 2638. [Google Scholar] [CrossRef] [PubMed]
  62. Song, H.; Ji, K.; Sun, T. Subsidy Policy Selection of Elderly Care Service Projects under Uncertain Actual Demand: A Real Options Analysis Based on China’s Experience. BMC Geriatr. 2022, 22, 49. [Google Scholar] [CrossRef] [PubMed]
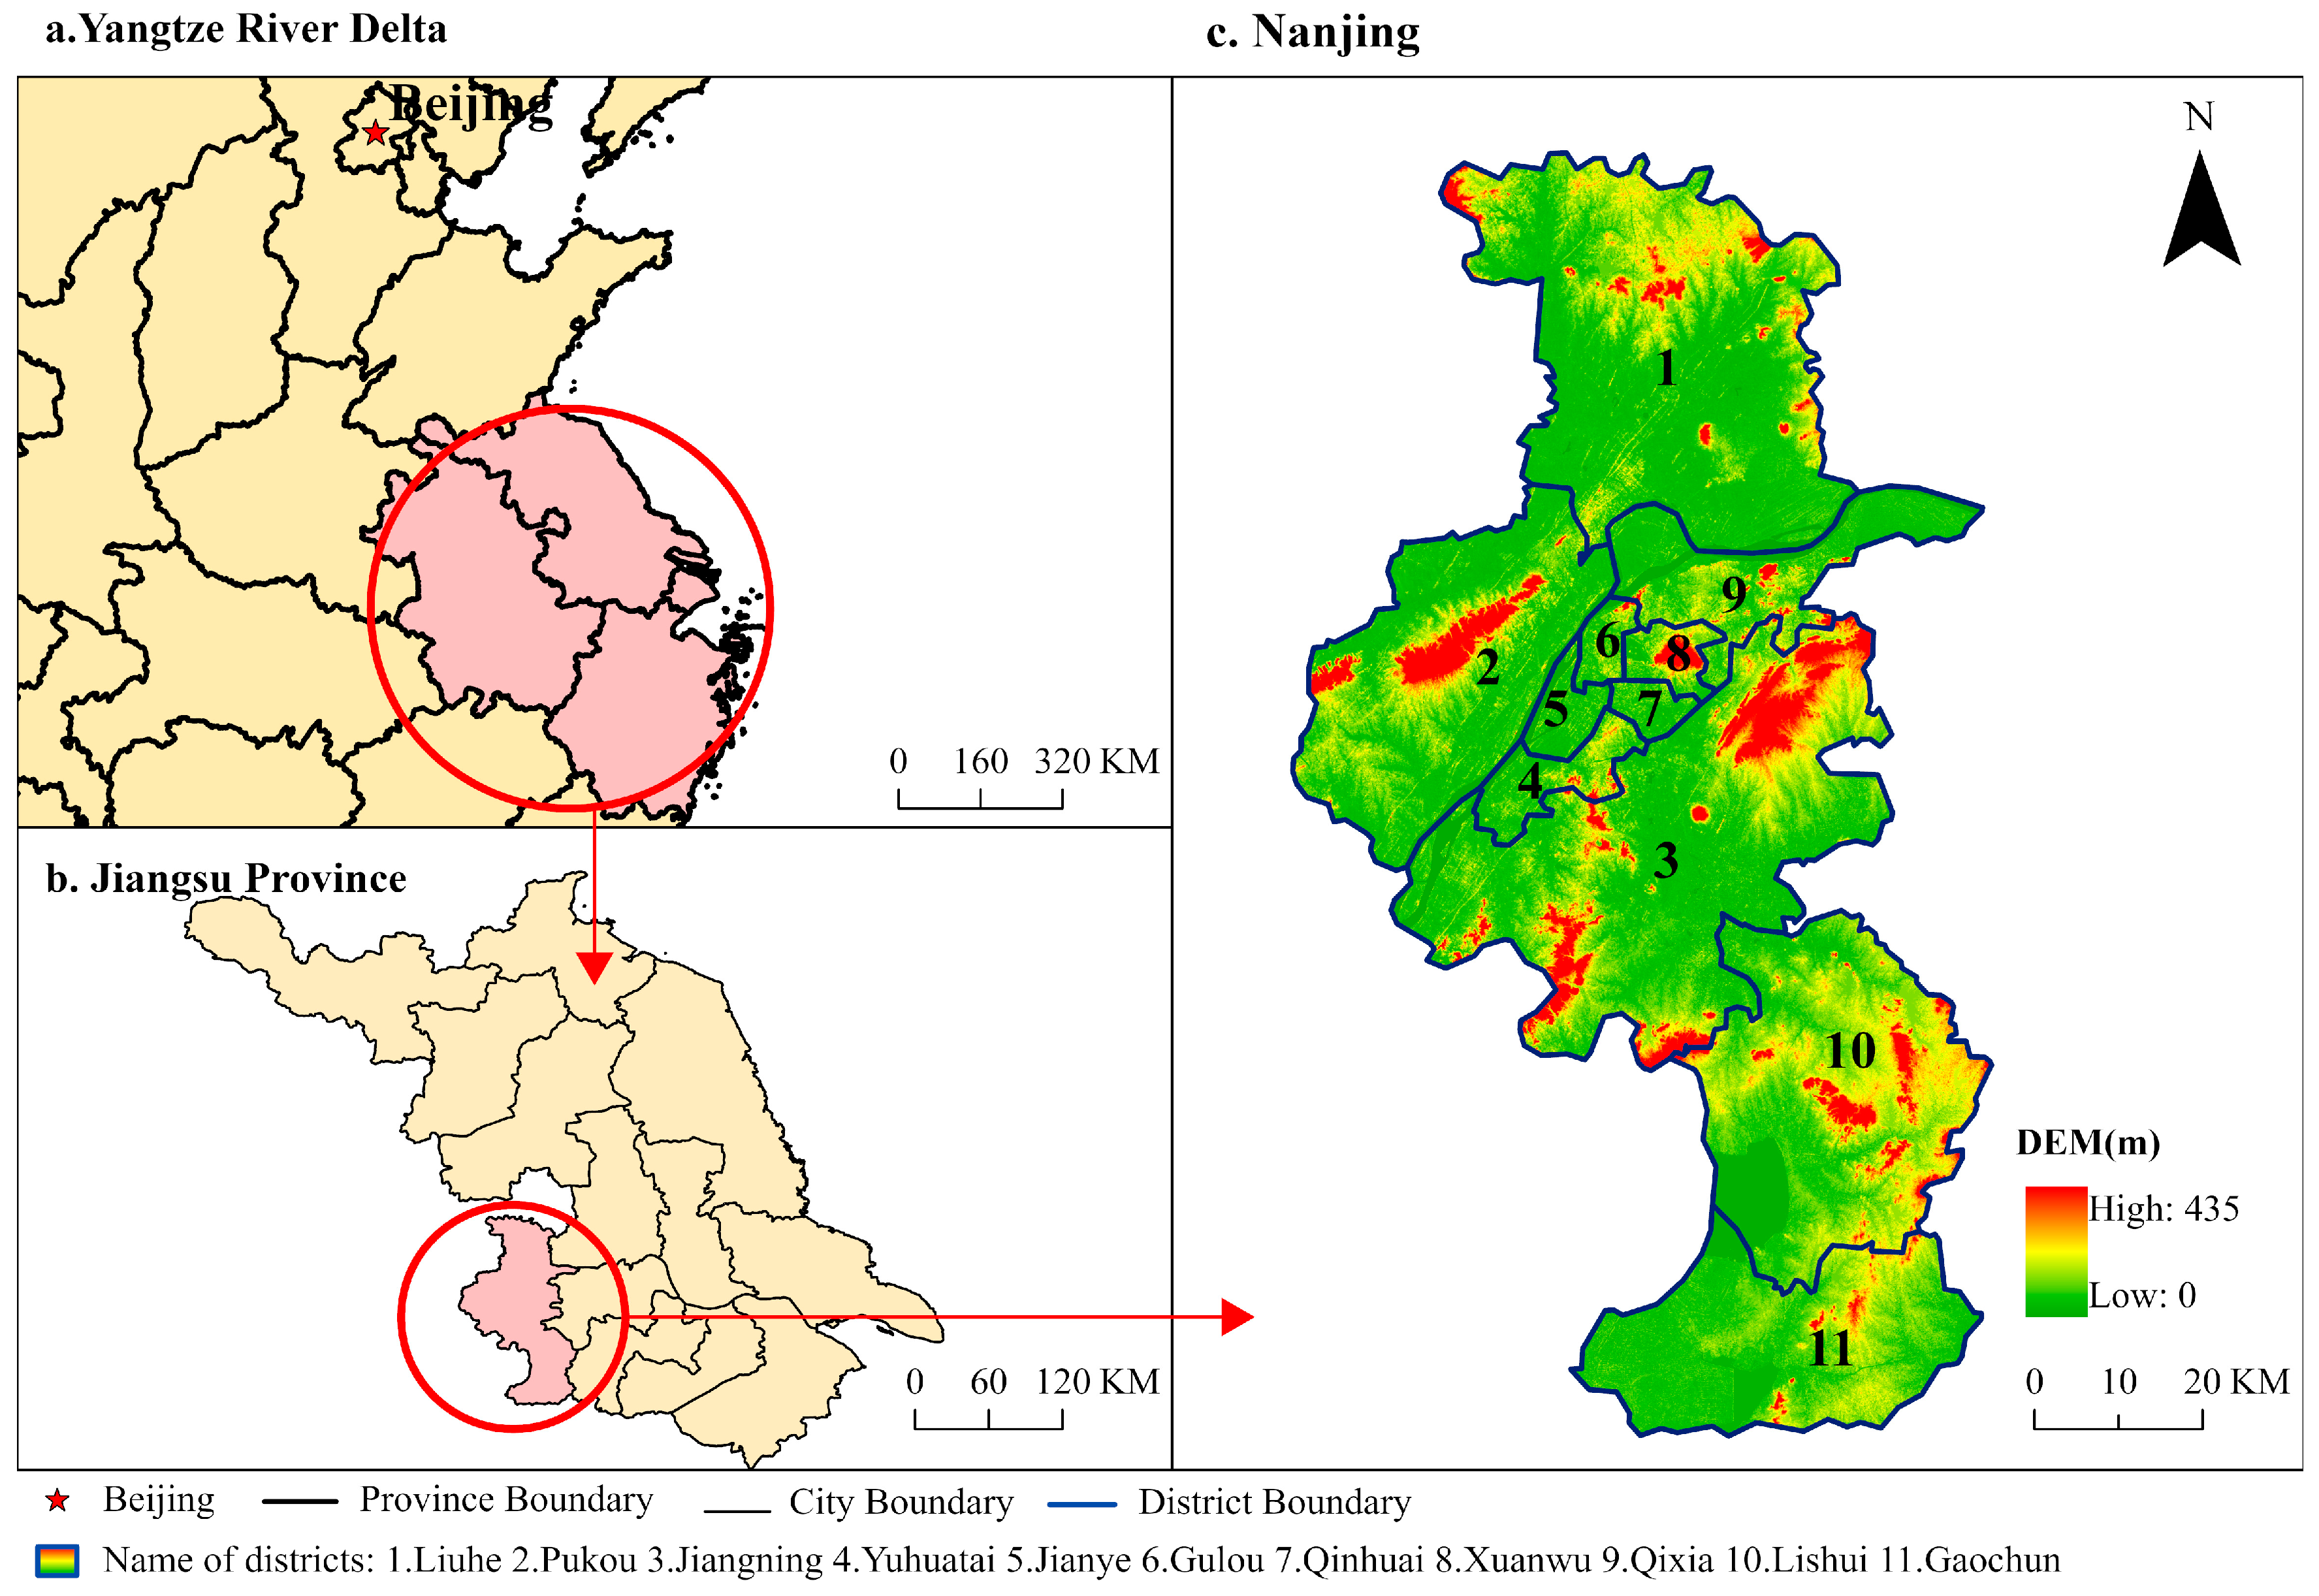
Figure 1. Study area.
Land 14 02272 g001
Figure 2. Research ideas map.
Land 14 02272 g002
Figure 3. Supply–demand distribution for elderly canteens in Nanjing.
Land 14 02272 g003
Figure 4. Lorenz curve for the supply–demand configuration of elderly canteens in Nanjing.
Land 14 02272 g004
Figure 5. Transportation networks in Nanjing.
Land 14 02272 g005
Figure 6. Accessibility analysis results for elderly canteens.
Land 14 02272 g006
Figure 7. Priority areas for optimization.
Land 14 02272 g007
Figure 8. SHAP analysis.
Land 14 02272 g008
Figure 9. Results of the canteen layout optimization.
Land 14 02272 g009
Table 1. Summary of data sources.
Data NameData SourceQuantity
Elderly CanteensNanjing Civil Affairs Bureau, A Map, Baidu Maps1218
Population Aged 65 and Over2020 China Population Census by County1646 grid cells
Urban Road NetworkOpenStreetMapN/A
Urban Bus RoutesA MapN/A
Digital Elevation Model (DEM)Geospatial Data CloudN/A
RestaurantsA Map11,910
Government Agencies and Social OrganizationsA Map9030
Note: N/A, Not Applicable.
Table 2. Distribution of priority areas and recommended sites by district.
Administrative
District
Area of Priority
Zones (km2)
Recommended
Restaurants
Recommended
Institutional
Canteens
Total
Recommended
Sites
Liuhe230.6511112
Pukou111.59055
Jiangning1005.9425676132
Yuhuatai0000
Jianye0000
Gulou0000
Qinhuai0000
Xuanwu0000
Qixia0000
Lishui63.34000
Gaochun422.0921012
Total1833.6159102161
Disclaimer/Publisher’s Note: The statements, opinions and data contained in all publications are solely those of the individual author(s) and contributor(s) and not of MDPI and/or the editor(s). MDPI and/or the editor(s) disclaim responsibility for any injury to people or property resulting from any ideas, methods, instructions or products referred to in the content.