Article

Dynamics of Meteorological and Agricultural Drought in the Karnali River Basin, Nepal

1
Central Department of Hydrology and Meteorology, Tribhuvan University, Kathmandu 44600, Nepal
2
Department of Meteorology, Tri-Chandra Multiple Campus, Tribhuvan University, Ghantaghar, Kathmandu 44600, Nepal
3
The Small Earth Nepal, Kathmandu 44600, Nepal
4
Department of Civil Engineering, City College of New York, New York, NY 10031, USA
5
Institute of Forestry, Hetauda Campus, Tribhuvan University, Hetauda 44200, Nepal
*
Author to whom correspondence should be addressed.
Land 2025, 14(11), 2271; https://doi.org/10.3390/land14112271
Submission received: 29 October 2025 / Revised: 12 November 2025 / Accepted: 13 November 2025 / Published: 17 November 2025
(This article belongs to the Section Land–Climate Interactions)

Abstract

Drought poses significant threats to the Himalayan region, but comprehensive assessments incorporating meteorological, agricultural, and ecological dimensions are scarce. This work uses 30 years of observational and satellite data to provide a multidimensional drought analysis for the Karnali River Basin in western Nepal based on ground station precipitation records, reanalysis data, and satellite vegetation index (NDVI). Principal component analysis was used to develop composite meteorological and agricultural drought indices for an assessment of drought propagation across domains. Averaged over the basin, results reveal a persistent long-term greening trend (+12% in NDVI over 25 years), which contrasts with a slight but significant increase (0.031/yr) in long-term meteorological drought severity (SPI12) and a non-significant declining tendency in soil moisture (−0.0024/yr). Mountainous regions were hotspots, with drought frequency surpassing 12%, whereas the Terai lowlands were more resilient. Vegetation responses lagged soil moisture anomalies by about a month. The composite indices were moderately correlated (r = 0.55). They revealed that meteorological droughts were very volatile (52% normal conditions), while agricultural drought evolved more slowly with greater permanence (64% normal conditions). These results highlight dimensions of growing drought threats in this basin and suggest that the development of integrated drought surveillance frameworks is a key to early warning systems, agricultural planning, and adaptive water resource management of mountain regions in the world under a changing climate.

1. Introduction

One of the most widespread and damaging natural hazards worldwide is drought, which has extensive impacts on ecosystems, agricultural activities, water resources, and socioeconomic well-being [1,2,3]. Unlike disasters such as floods and landslides, drought develops gradually, and in most cases, it is hard to identify it early and take appropriate measures to prevent severe consequences [4,5]. These issues are intensified in mountainous areas, where the topography and steep climatic gradients lead to high localization of drought symptoms [6,7]. Under such conditions, drought can have disastrous consequences on communities, in terms of agriculture, water supply, and ecosystem services [8,9], leading to severe economic losses [10,11,12]. Drought has the potential to impact health, food security, energy systems, and environmental sustainability.
The Himalayan region, with its extreme topographic relief and dependence on monsoon rainfall, is particularly vulnerable to drought-related stress. Mountain communities rely heavily on rain-fed agriculture and ecosystem services, making them highly sensitive to even minor precipitation anomalies [13,14,15]. Within this regional context, Nepal provides a representative case of climate vulnerability in the central Himalayas. The country experiences strong spatial and temporal variability in precipitation due to complex orography and a monsoon-dominated climate system [14]. The Karnali River Basin (KRB), located in western Nepal, is the largest river basin in the country and among the least developed. It is characterized by pronounced elevation gradients, limited irrigation infrastructure, and a high dependence on rain-fed agriculture, making it particularly susceptible to drought impacts [16].
The necessity to comprehend the long-term dynamics of droughts is especially acute due to the high climate sensitivity of the KRB and the significant role of rain-fed agriculture in Nepal [17,18,19,20,21,22]. The span 1995–2024 is an opportunity period that captures the historic variability of drought and recent aggravation of climate change, such as the major extended droughts of the 2010s [23]. It is necessary to examine drought conditions on a monthly, seasonal, and annual basis to differentiate between short-term fluctuations and long-term, multi-year deficits. A spatially explicit approach allows for the identification of localized hotspots that may be overlooked in basin-wide averages. The analysis of both temporal and spatial variables at monthly, seasonal, and annual scales, mixed with frequency and categorical analysis, makes the methods of this study unique in the area and a model for studying drought in other topographically and environmentally complex basins.
Past studies in Nepal, and particularly in the KRB region, have largely relied on individual indicators, such as precipitation-based drought indices or vegetation metrics, which capture only one facet of drought [14,22,24,25,26,27]. However, drought is a multi-dimensional phenomenon that unfolds across meteorological, hydrological, ecological, and agricultural domains [28,29,30]. Similarly, ref. [31] emphasized the need for multivariate frameworks that jointly analyze rainfall, runoff, and soil moisture to depict drought dynamics more accurately. The Multi-Indicator Drought Index (MIDI) developed by the United States National Oceanic and Atmospheric Administration (NOAA) also exemplifies how combining multiple indices enhances drought detection and early warning capabilities [32]. These global frameworks exemplify that integrating diverse drought dimensions produces more accurate, comprehensive, and actionable drought assessments.
By integrating multi-source datasets and employing a multi-indicator approach based on principal components, this study offers a transferable template for assessing drought propagation. As such, it contributes to the global discourse on drought resilience by demonstrating how regionally tailored yet methodologically generalizable frameworks can enhance early warning systems and inform adaptive water and land management strategies.
To address the gap in multi-dimensional drought analysis in the region, this study uses a multi-index drought evaluation methodology. Standardized Precipitation Index (SPI) is used to describe meteorological drought at multiple timescales (3, 6, and 12 months). The Soil Moisture Index (SMI) is used based on reanalysis volumetric soil moisture to help define hydrological and agricultural drought. The Normalized Difference Vegetation Index (NDVI) is used to determine ecological and vegetation stress. Combining these indices gives a holistic understanding of drought and points to various aspects of water and vegetation feedback that cannot be described using any one of these individually.
The overall objectives of the study are to compute and standardize the SPI, SMI, and NDVI to gain a general statement of drought; to determine inter-annual and seasonal variability and location of spatial drought hotspots; to determine frequency, intensity, and category distributions of drought using standard thresholds; and to create decision-supportive visual products of drought monitoring in the Karnali River Basin. This spatially explicit drought assessment introduces a multi-index approach that is novel within the KRB context and can also be applied more broadly, both globally and in other regions. It provides integrated insights and a multi-dimensional evaluation of drought, offering a more refined understanding of drought characteristics. This assessment yields actionable data that can enhance disaster preparedness, water resource planning, and climate adaptation efforts.

2. Study Area

Karnali River Basin (KRB) is located between 28.33° to 30.45° N, and 80.55° to 83.68° E (Figure 1) in a wide ecological zone between the high-altitude Himalayan areas and the mid-hills and plains in western Nepal. The basin covers a total of approximately 42,457 square kilometers in Nepal and is the largest in the country, centered on the Karnali River, which originates on the Tibetan Plateau. The altitude ranges from 142 m in the southern lowlands to 7497 m in the high mountains to the north. Snow/glaciers and grasslands dominate the highlands of the KRB, and forests and agricultural lands dominate the lowlands.
Streamflow in the KRB is mostly rain-fed [33]. The KRB climate is affected by the South Asian Summer Monsoon, the physiography of the area, and cold-season westerlies [34,35]. The mean annual precipitation in the basin is about 1479 mm, with high spatial, seasonal, and inter-annual fluctuations [16]. Stations in the region receive approximately 55 percent to 80 percent of annual precipitation in the summer season (June to September) [34]. The high valleys of the basin are the driest (with less than 300 mm precipitation per year), but some pockets in mountainous regions receive over 2400 mm per year [36]. Precipitation events in summer dominate the river discharge, on top of the coupling of the baseflow with snow and glacier melt in spring and summer.

3. Materials and Methods

3.1. Data Sources

Daily precipitation data at 28 stations of the Nepal Department of Hydrology and Meteorology (DHM) for the study area were collected. From the total of 102 stations in the region, only 28 were selected, based on requiring stations to have sufficiently long coverage (30 years) without large gaps (>20% missing data) or obvious quality problems. After quality control, linear and spline interpolation, and the normal ratio method were used to fill gaps [37,38,39,40,41]. The daily data were summed to monthly totals covering the period 1995–2024, and spatial interpolation was done using the Inverse Distance Weighting (IDW) method to a grid of 5 km resolution [42,43]. IDW was selected for its robustness in data-scarce mountainous regions and its ability to preserve local variability in precipitation. Several studies have demonstrated the suitability of geostatistical approaches for SPI and other drought mapping [44,45]. The interpolated precipitation grids were then used to compute the SPI at multiple accumulation scales.
For soil moisture, ERA5 reanalysis data of volumetric water content (0–7 cm depth) were obtained for 30 years from 1995 to 2024 [46]. The Normalized Difference Vegetation Index (NDVI) was obtained from the MODIS satellite instruments (MOD13Q1 product, 250 m resolution, 16-day composites), available from February 2000 onward [47]. This NDVI product uses a “maximum value composite” approach over 16 days, which reduces cloud contamination compared to raw daily data. These 16-day composite values were averaged to a monthly timescale.

3.2. Drought Indices

This study employs three complementary drought indices, Normalized Difference Vegetation Index (NDVI), Standardized Precipitation Index (SPI), and Soil Moisture Index (SMI), to characterize ecological, meteorological, and agricultural drought conditions across the Karnali River Basin (KRB). These indices offer different perspectives on drought manifestation and, when combined, support a robust composite drought assessment framework.

3.2.1. NDVI (Ecological Drought Index)

The NDVI serves as a widely used indicator of vegetation health, derived from the differential reflectance of near-infrared (NIR) and red light. It is calculated as:
N D V I = N I R R e d N I R + R e d
where NIR is near-infrared reflectance and Red is red light reflectance. NDVI values range between −1 and +1, with higher values indicating denser and healthier vegetation [47,48]. Where vegetation is sensitive to drought, NDVI can serve as an ecological drought index, although other factors also affect it [49,50,51]. In order to address anomalies relative to the long-term distribution, NDVI was standardized into a z-score. The Z score was calculated as:
Z N D V I = N D V I t μ σ
where NDVIt is the value at time t, μ is the long-term mean for the given month or season, and σ is the standard deviation of the NDVI time series. This normalization allows comparison across regions and time by expressing deviations from the climatological average in units of standard deviation.
NDVI trends were analyzed across monthly, seasonal, and annual time scales to assess ecological drought conditions and vegetation response across spatial and temporal dimensions. The drought category, as defined by NDVI [52,53], is presented in Table 1.

3.2.2. SPI Calculation (Meteorological Drought Index)

The SPI quantifies precipitation anomalies over various temporal scales. Its self-calibrating and multi-timescale nature is suited for drought monitoring in climatically variable regions such as the Himalayas [54]. In this study, SPI was computed at 3-month, 6-month, and 12-month accumulation periods (SPI3, SPI6, and SPI12), capturing short-term, mid-term, and long-term drought events, respectively.
Monthly precipitation data were used to compute the SPI by fitting a gamma distribution to the cumulative precipitation values, which were then transformed into standardized z-scores (mean = 0, standard deviation = 1), following the method of [54]. The computations were performed using the climate-indices package in Python, version 3.12. SPI values were classified into drought categories using widely accepted thresholds [12,27,54], the same as those used for NDVI (Table 1).

3.2.3. SMI Calculation (Hydrological Drought Index)

The SMI offers insight into agricultural and hydrological drought by measuring water availability in the root zone. It was derived from volumetric soil moisture data and standardized using the empirical cumulative distribution method to reflect drought severity based on percentiles. The SMI was calculated as:
S M I = S M P 5 P 95 P 5
where SM is the observed soil moisture at a given time, P 5 is the 5th percentile (representing dry conditions), and P 95 is the 95th percentile (wet conditions) of the long-term soil moisture distribution [55,56]. SMI values range from near 0 (often approximating the wilting point) to near 1 (often approximating field capacity). Both SMI values and their standardized anomalies were utilized to assess drought severity and contribute to the formation of the Agricultural Drought Indicator. SMI percentile scores were considered to correspond to drought severity categories as shown in Table 2.

3.2.4. Composite Agricultural and Meteorological Indices

A two-stage Principal Component Analysis (PCA) approach was used to develop composite drought indices [57,58]. For the meteorological part, PCA was applied to derive a single composite representing precipitation variability from the standardized precipitation indices at different timescales (SPI3, SPI6, SPI12). For the agricultural domain, the optimal lag period was first identified by evaluating the temporal lag between soil moisture anomalies (SMI) and vegetation response (NDVI) through correlation. The lag-adjusted SMI and NDVI anomalies were then subjected to PCA to generate an agricultural composite. This process not only minimized the dimensionality but also represented the lagged soil-vegetation interactions and gave representative indices to be used in further drought analysis [59].
While most of the other studies about drought use a single index and capture either meteorological or agricultural drought conditions [12,14,22,23,24,60,61,62,63], this study calculates meteorological and agricultural composites using different indices.

3.3. Trend Analysis and Visualization

Trend analysis of SPI, SMI, NDVI, and the derived composite indices was conducted using the non-parametric Mann–Kendall test [64,65], with Sen’s slope estimator [66], both widely applied for detecting monotonic changes in hydroclimatic quantities that may not be normally distributed. Seasonal and monthly patterns were analyzed by grouping data into the four meteorological seasons of Nepal: winter (December–February), pre-monsoon (March–May), monsoon (June–September), and post-monsoon (October–November). Statistical significance for all trend analyses was determined at a 95% confidence level.
To analyze temporal trends, the NDVI was examined on annual, seasonal, and monthly scales. For the SMI, only the annual trend was displayed, as the seasonal and monthly trends did not show significant variations. Instead, box plots were created to illustrate the distribution patterns and variability in SMI values. In the case of the SPI, annual trends were analyzed separately for dry periods (indicated by negative SPI values), wet periods (indicated by positive SPI values), and the overall average. This disaggregated approach was adopted because analyzing wet and dry extremes separately avoids obscuring critical trends in precipitation and drought extremes.
For the spatial analysis of NDVI, the average difference in values between 2000 and 2024 was calculated for each grid cell. A difference map was produced to visualize these changes, along with spatially averaged NDVI plots at annual, seasonal, and monthly timescales across the KRB. For the SMI, spatial trends were computed for each grid cell over the entire study period, leading to the creation of an average spatial trend map for the KRB. Additionally, spatial distribution plots for SMI were developed at annual, seasonal, and monthly intervals to capture variations in time and space. For SPI, spatial anomaly frequency was calculated to see how often each grid cell experiences drought or wet anomalies at annual, seasonal, and monthly timescales. This method gives a clearer picture of extreme weather events by showing how frequently significant dry or wet conditions occur in each area.

3.4. Correlation Analysis

Correlation analysis was carried out among SPI, SMI, NDVI, and the composite indices to evaluate their degree of consistency and complementarity. Pearson correlation coefficients were computed at both grid and basin scales, and statistical significance of the correlations was assessed at the 95% confidence level (p < 0.05). Moreover, correlation was examined with lag adjustment to highlight the temporal relationships between vegetation stress and soil moisture anomalies.
All the computations and analysis were performed in Python (v3.x) using climate-indices for SPI computation, xarray and rioxarray for NetCDF and geospatial processing, numpy, pandas, and scipy for numerical and statistical analysis, geopandas for spatial operations, pymannkendall for trend detection, scikit-learn for normalization and PCA, and matplotlib with seaborn for visualization.

4. Results

4.1. Long-Term Trends in Drought Indicators

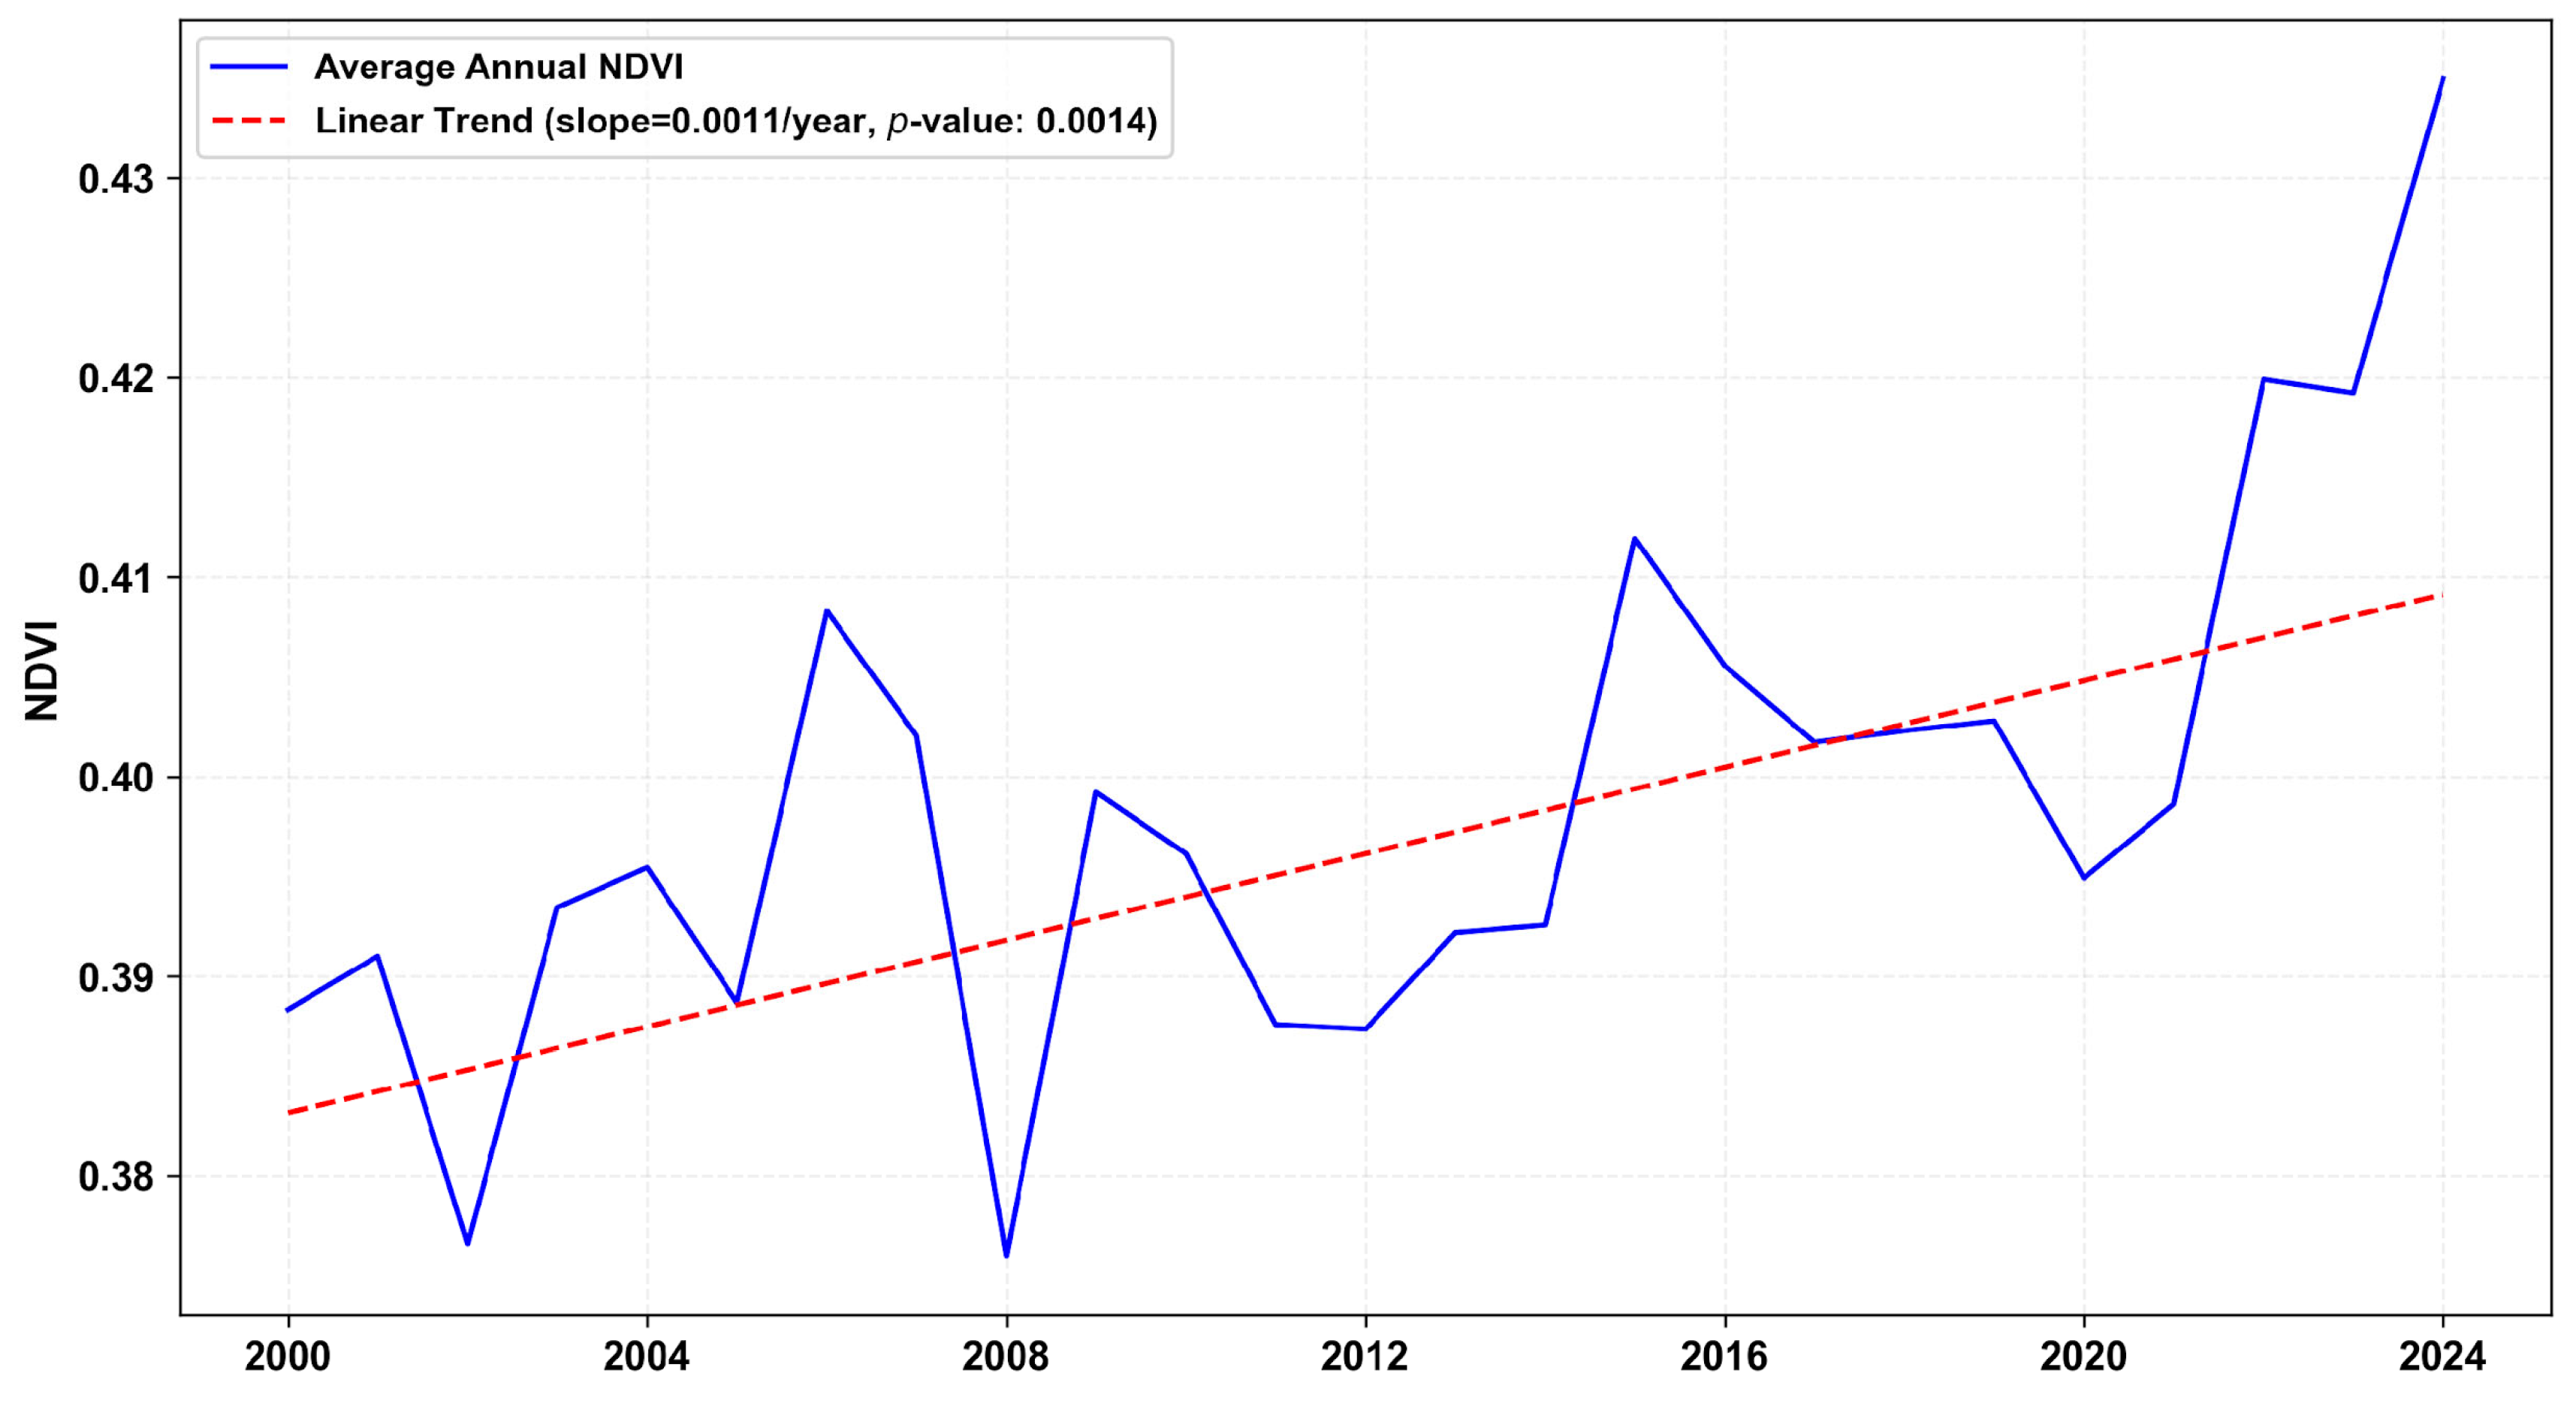
The ecological drought indicator, NDVI, calculated per year in the KRB over 2000–2024 (Figure 2), reveals a consistent upward trend in greenness of the vegetation. The average NDVI increased to a high of 0.435 in 2024, which is about 12 percent higher than the 2000 level of 0.388. This long-term greening signal suggests an overall improvement in vegetation condition, which may be linked to factors such as favorable climatic conditions, increased atmospheric CO2 concentrations (fertilization effect), land-use and land-cover changes, agricultural expansion, or enhanced irrigation practices, particularly at lower elevations. Consequently, although the trend of greening indicates improved vegetation health, it may also be influenced by human land management practices and increased agricultural intensity, rather than solely being a sign of ecological recovery.
The NDVI shows a significant rise after 2014, with the values consistently above 0.40 in the years that followed. 2024 was the year when the mean NDVI was the highest (0.435), followed by 2022 (0.420) and 2023 (0.419). Conversely, the lowest annual averages were recorded in 2002 (0.376) and 2008 (0.376). The greening pattern is confirmed by the fact that Mann–Kendall trend analysis shows a statistically significant positive trend (p < 0.05) with a positive Sen slope (0.0011/year), which is an estimate of the rate of increase. However, interannual variations can be noted, which reflect ecological sensitivity to the seasonal droughts, especially in the pre- and post-monsoon seasons.
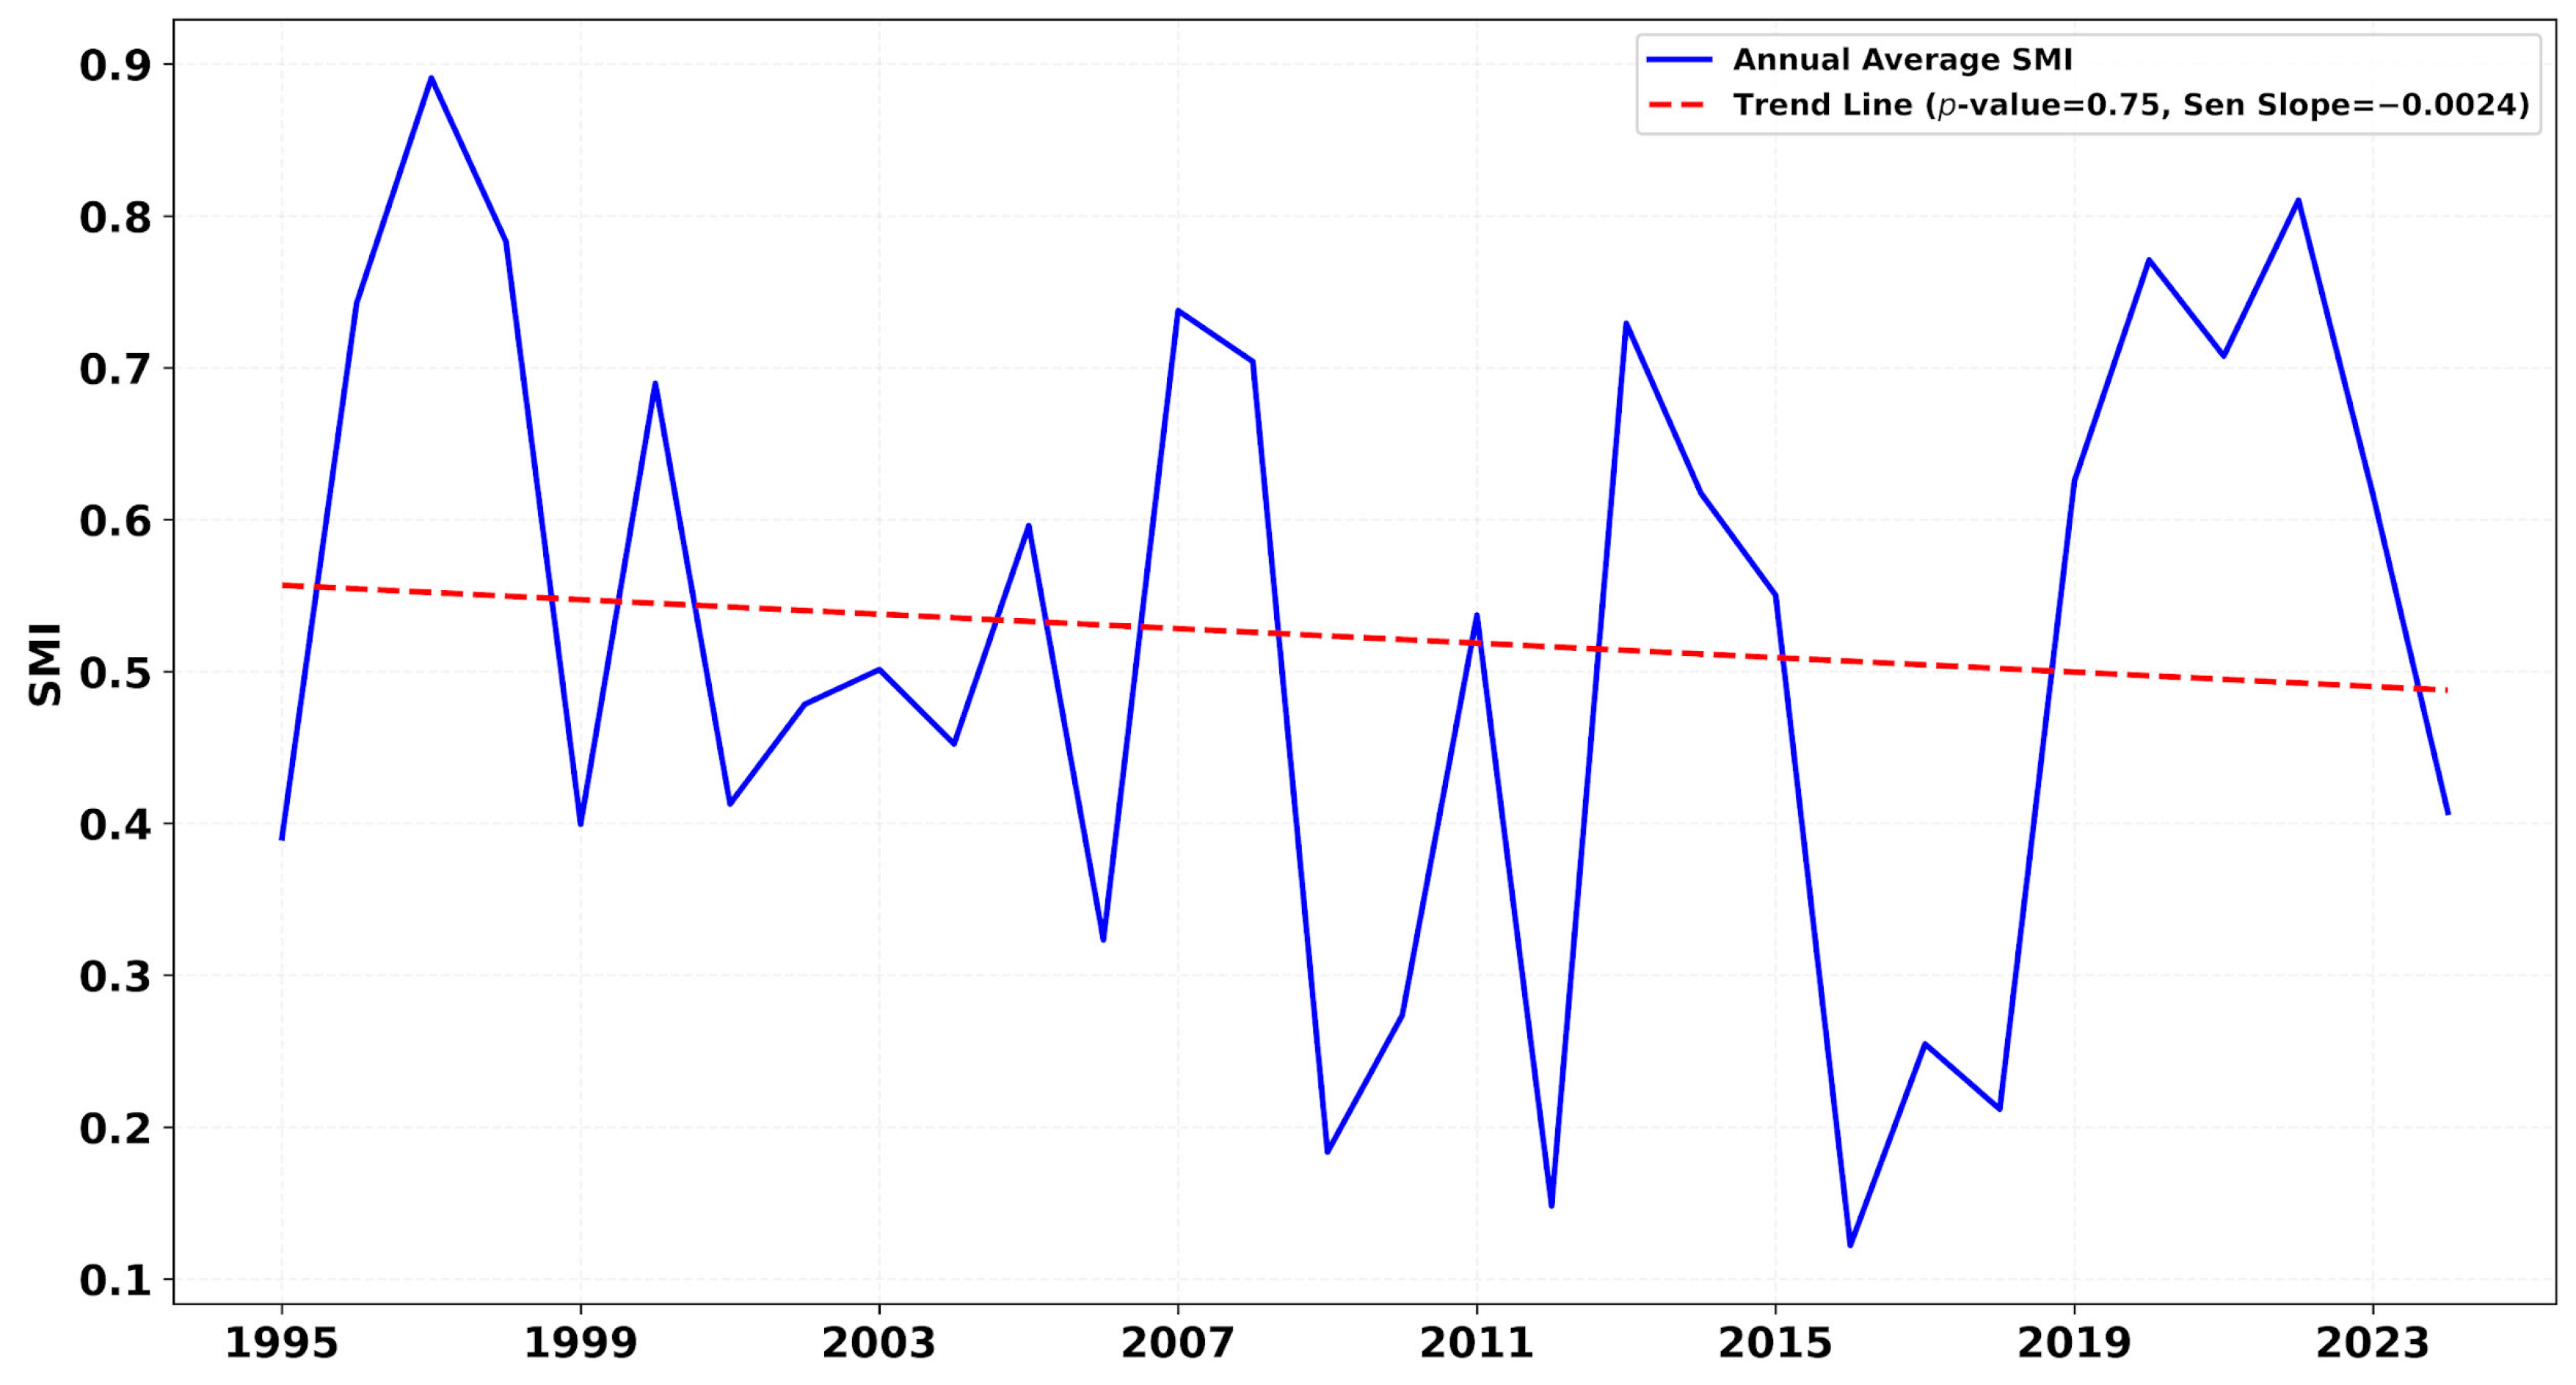
In the case of the hydrological drought indicator, the annual average SMI of 1995 to 2024 shows a dynamic pattern within the KRB (Figure 3). The basin-average SMI shows an annual mean of 0.52, with high interannual fluctuation (standard deviation = 0.21). The basin exhibits a slight declining tendency in soil moisture, with a Sen slope of −0.0024 per year, although this trend is not statistically significant (p = 0.75). The temporal SMI, in general, indicates that the KRB has had a stable medium-soil moisture condition during the last three decades, with some drier years.
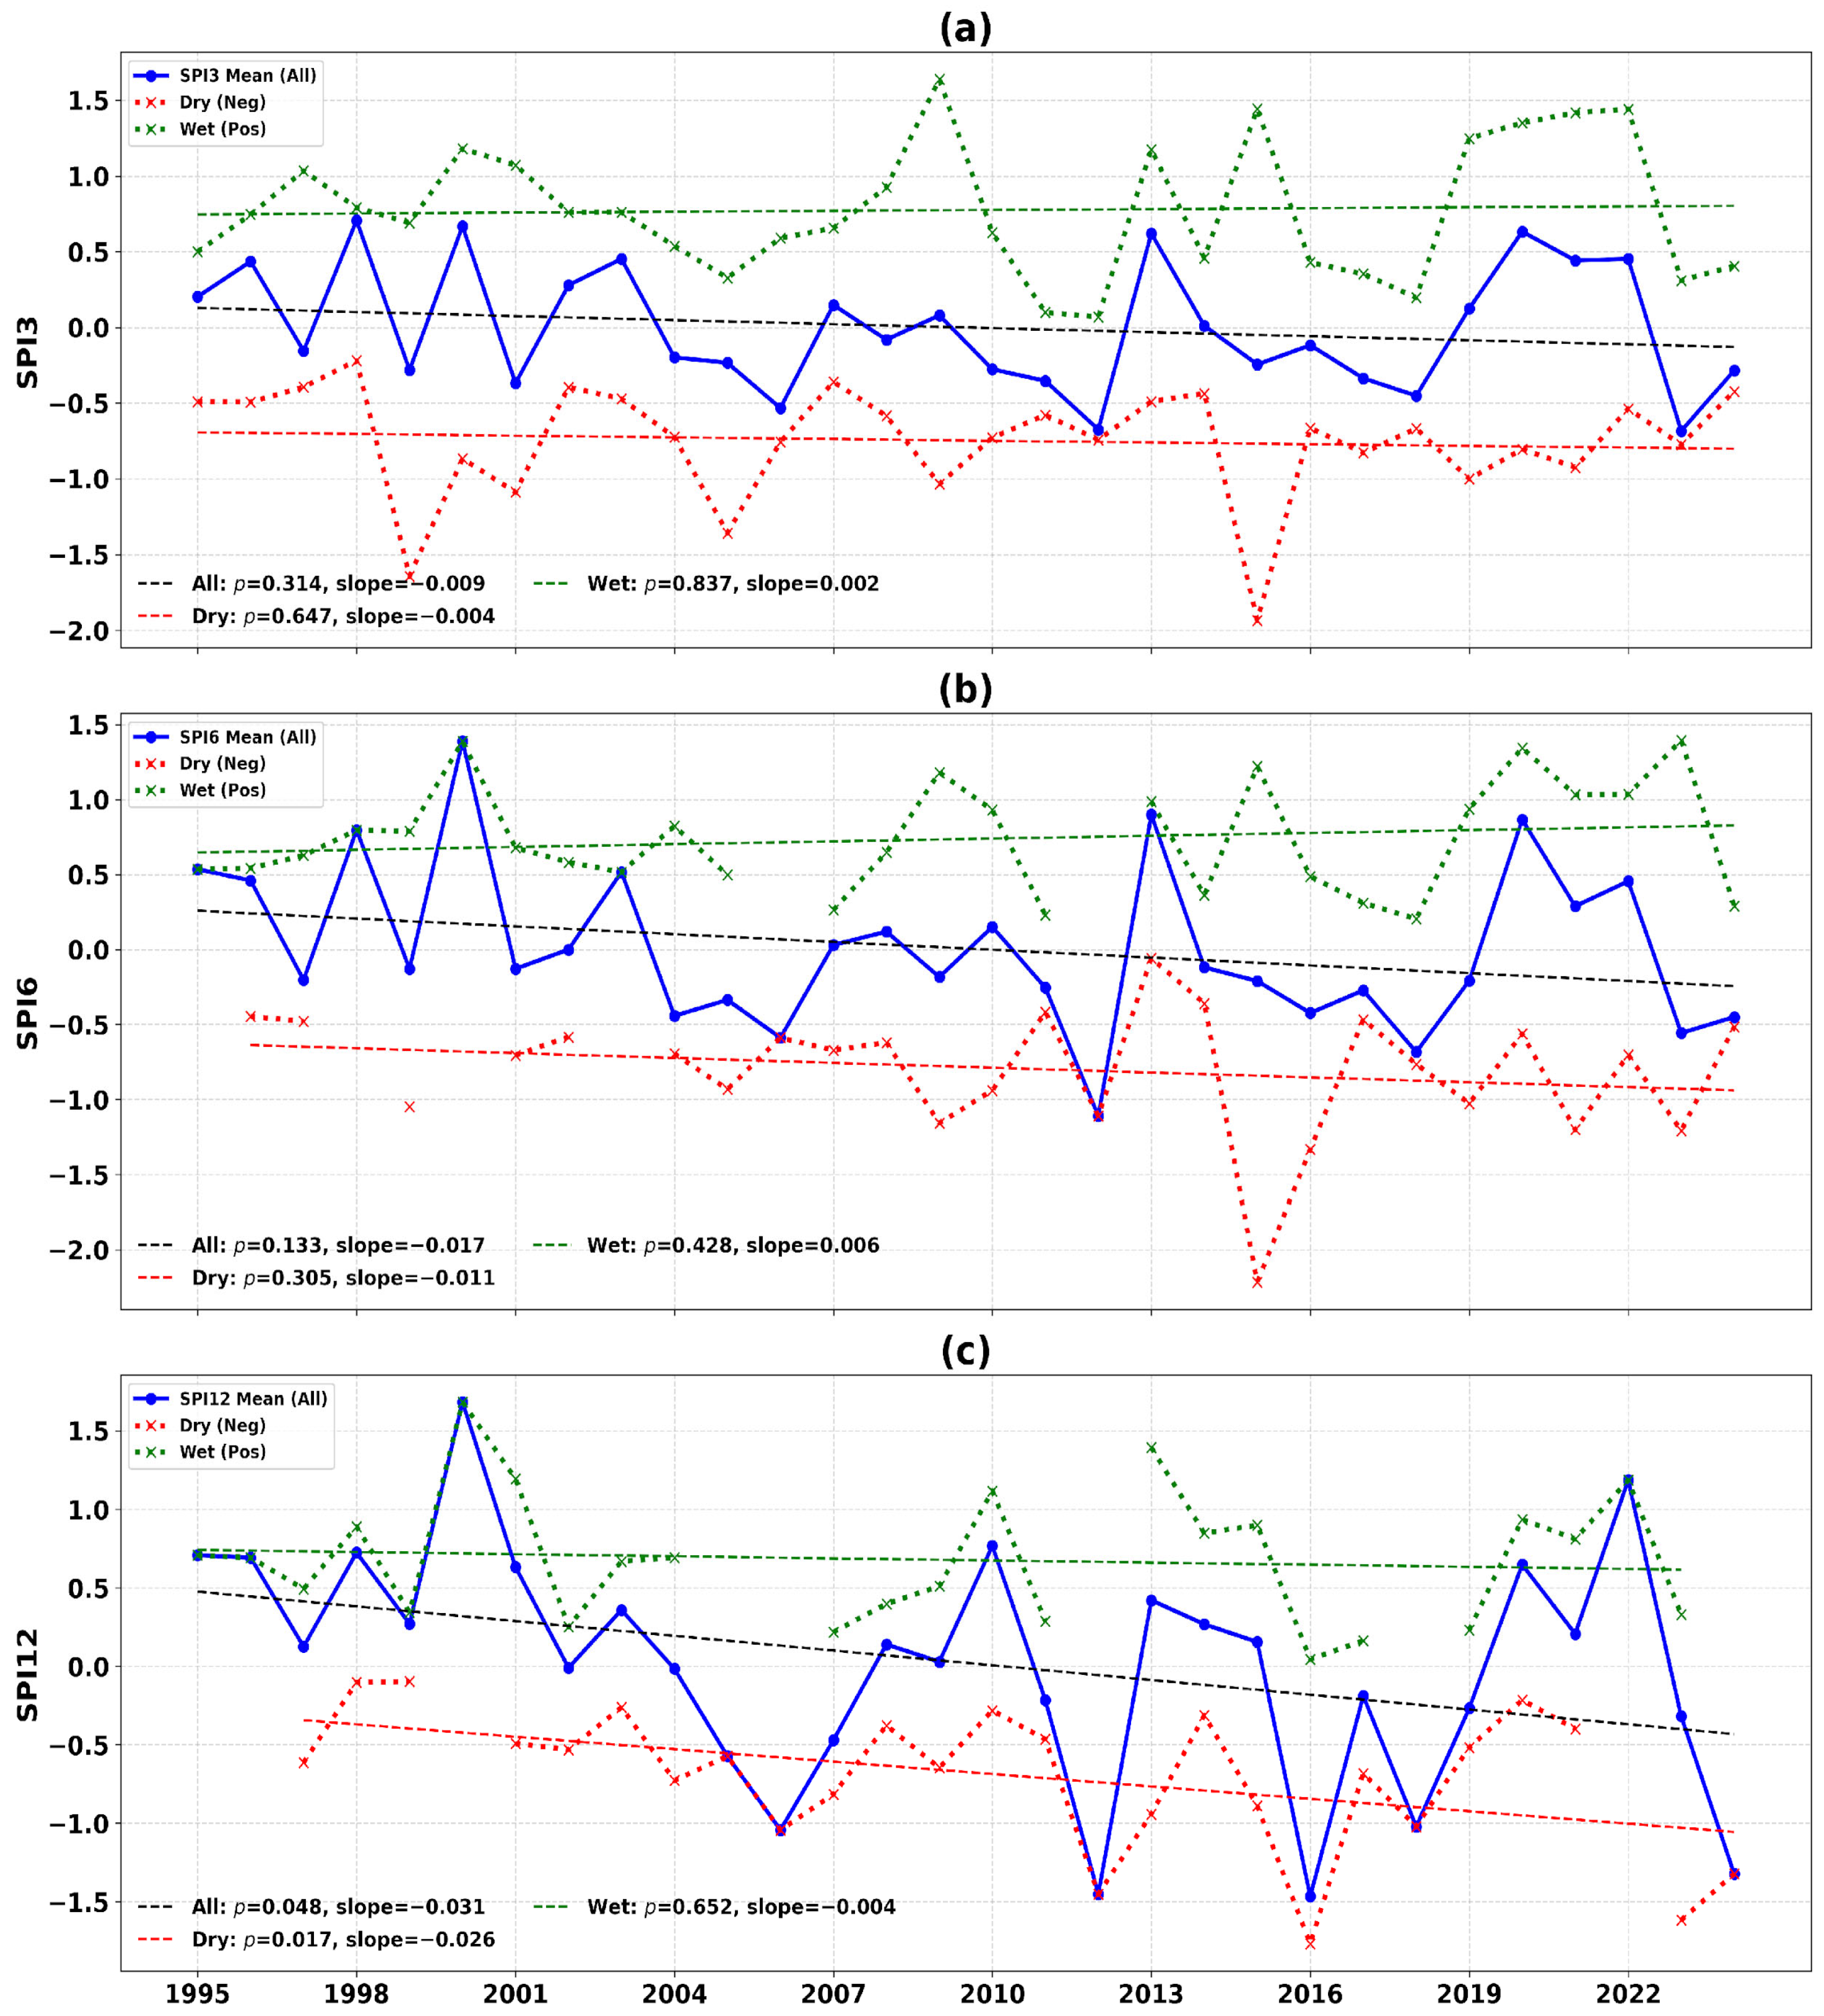
Figure 4a–c indicate that the annual means of the meteorological drought indicator SPI at 3, 6, and 12-month time scales from 1995 to 2024 show a minor overall decrease. Mean annual SPI was found to have negative slopes of all timescales (−0.009 with SPI3, −0.017 with SPI6, and −0.031 with SPI12), though only SPI12 had statistical significance (p < 0.05). Separate wet and dry analyses showed a significant negative trend in the SPI12 dry series (slope = −0.026, p = 0.017), which is a strengthening of the severity of drought. In SPI3 and SPI6, the tendencies of dry periods and wet periods were decreasing and increasing, respectively, but not significantly.
Examination of the dry and wet series further highlights important structural differences across timescales. The disaggregated SPI3 remains continuous, confirming that every year contains both positive and negative values. Conversely, SPI6 showed gaps in multiple years to either a lack of dry conditions (1995, 1998, 2000, 2003) or moist conditions (2006, 2012). The SPI12 record showed even more discontinuities, with years dominated entirely by persistent wetness (1995, 1996, 2000, 2022) or dryness (2005, 2006, 2012, 2018, 2024). As we might expect, shorter accumulation periods capture short-term dry-wet variability, whereas longer periods, which smooth short-term fluctuations, can mask one regime entirely when anomalies persist over one or more years.

4.2. Seasonal Drought Dynamics

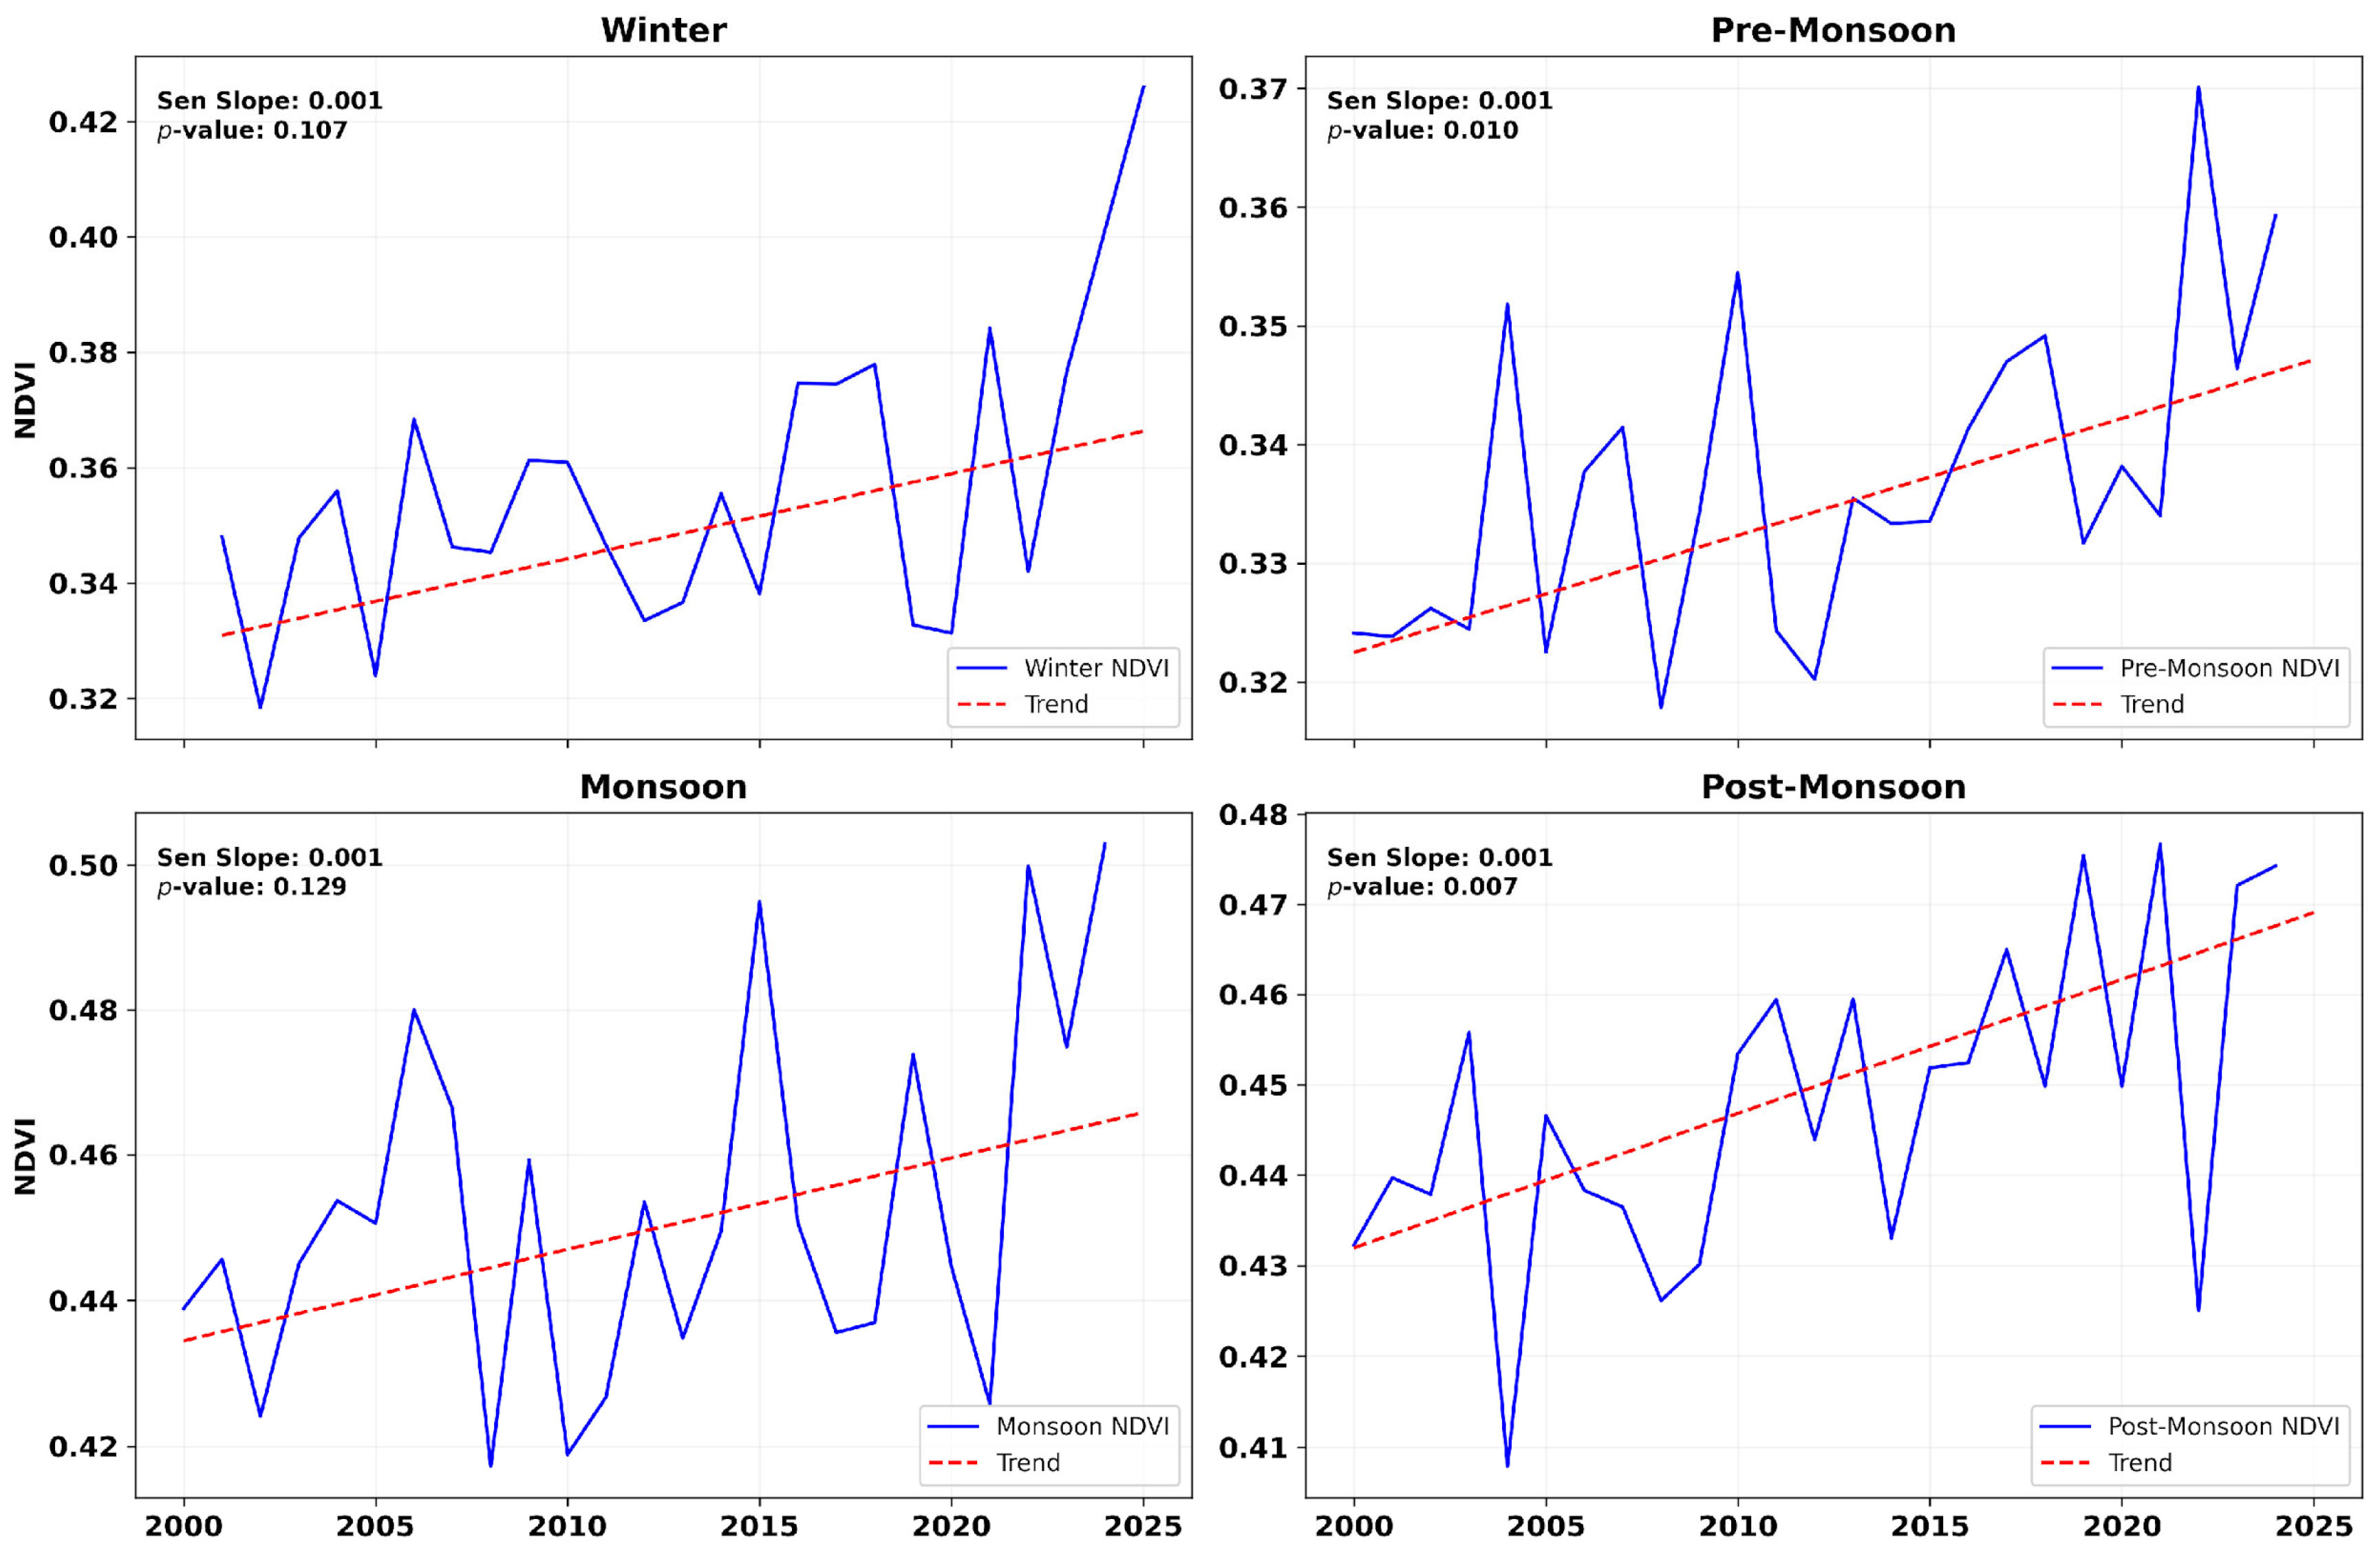
Seasonal analyses were conducted for pre-monsoon (March–May), monsoon (June–September), post-monsoon (October–November), and winter (December–February) seasons. The seasonal trends (Figure 5) indicated that NDVI is increasing in all seasons. Pre-monsoon and post-monsoon periods showed a significant increasing trend (p < 0.05), whereas the trends in other seasons are not significant at 95% CI. NDVI peaks during the monsoon season, with gradual declines in post-monsoon and winter, but the lowest values are in the pre-monsoon period. A steep upward trend in the post-monsoon season suggests extended greening periods, likely due to delayed moisture availability or agricultural expansion.
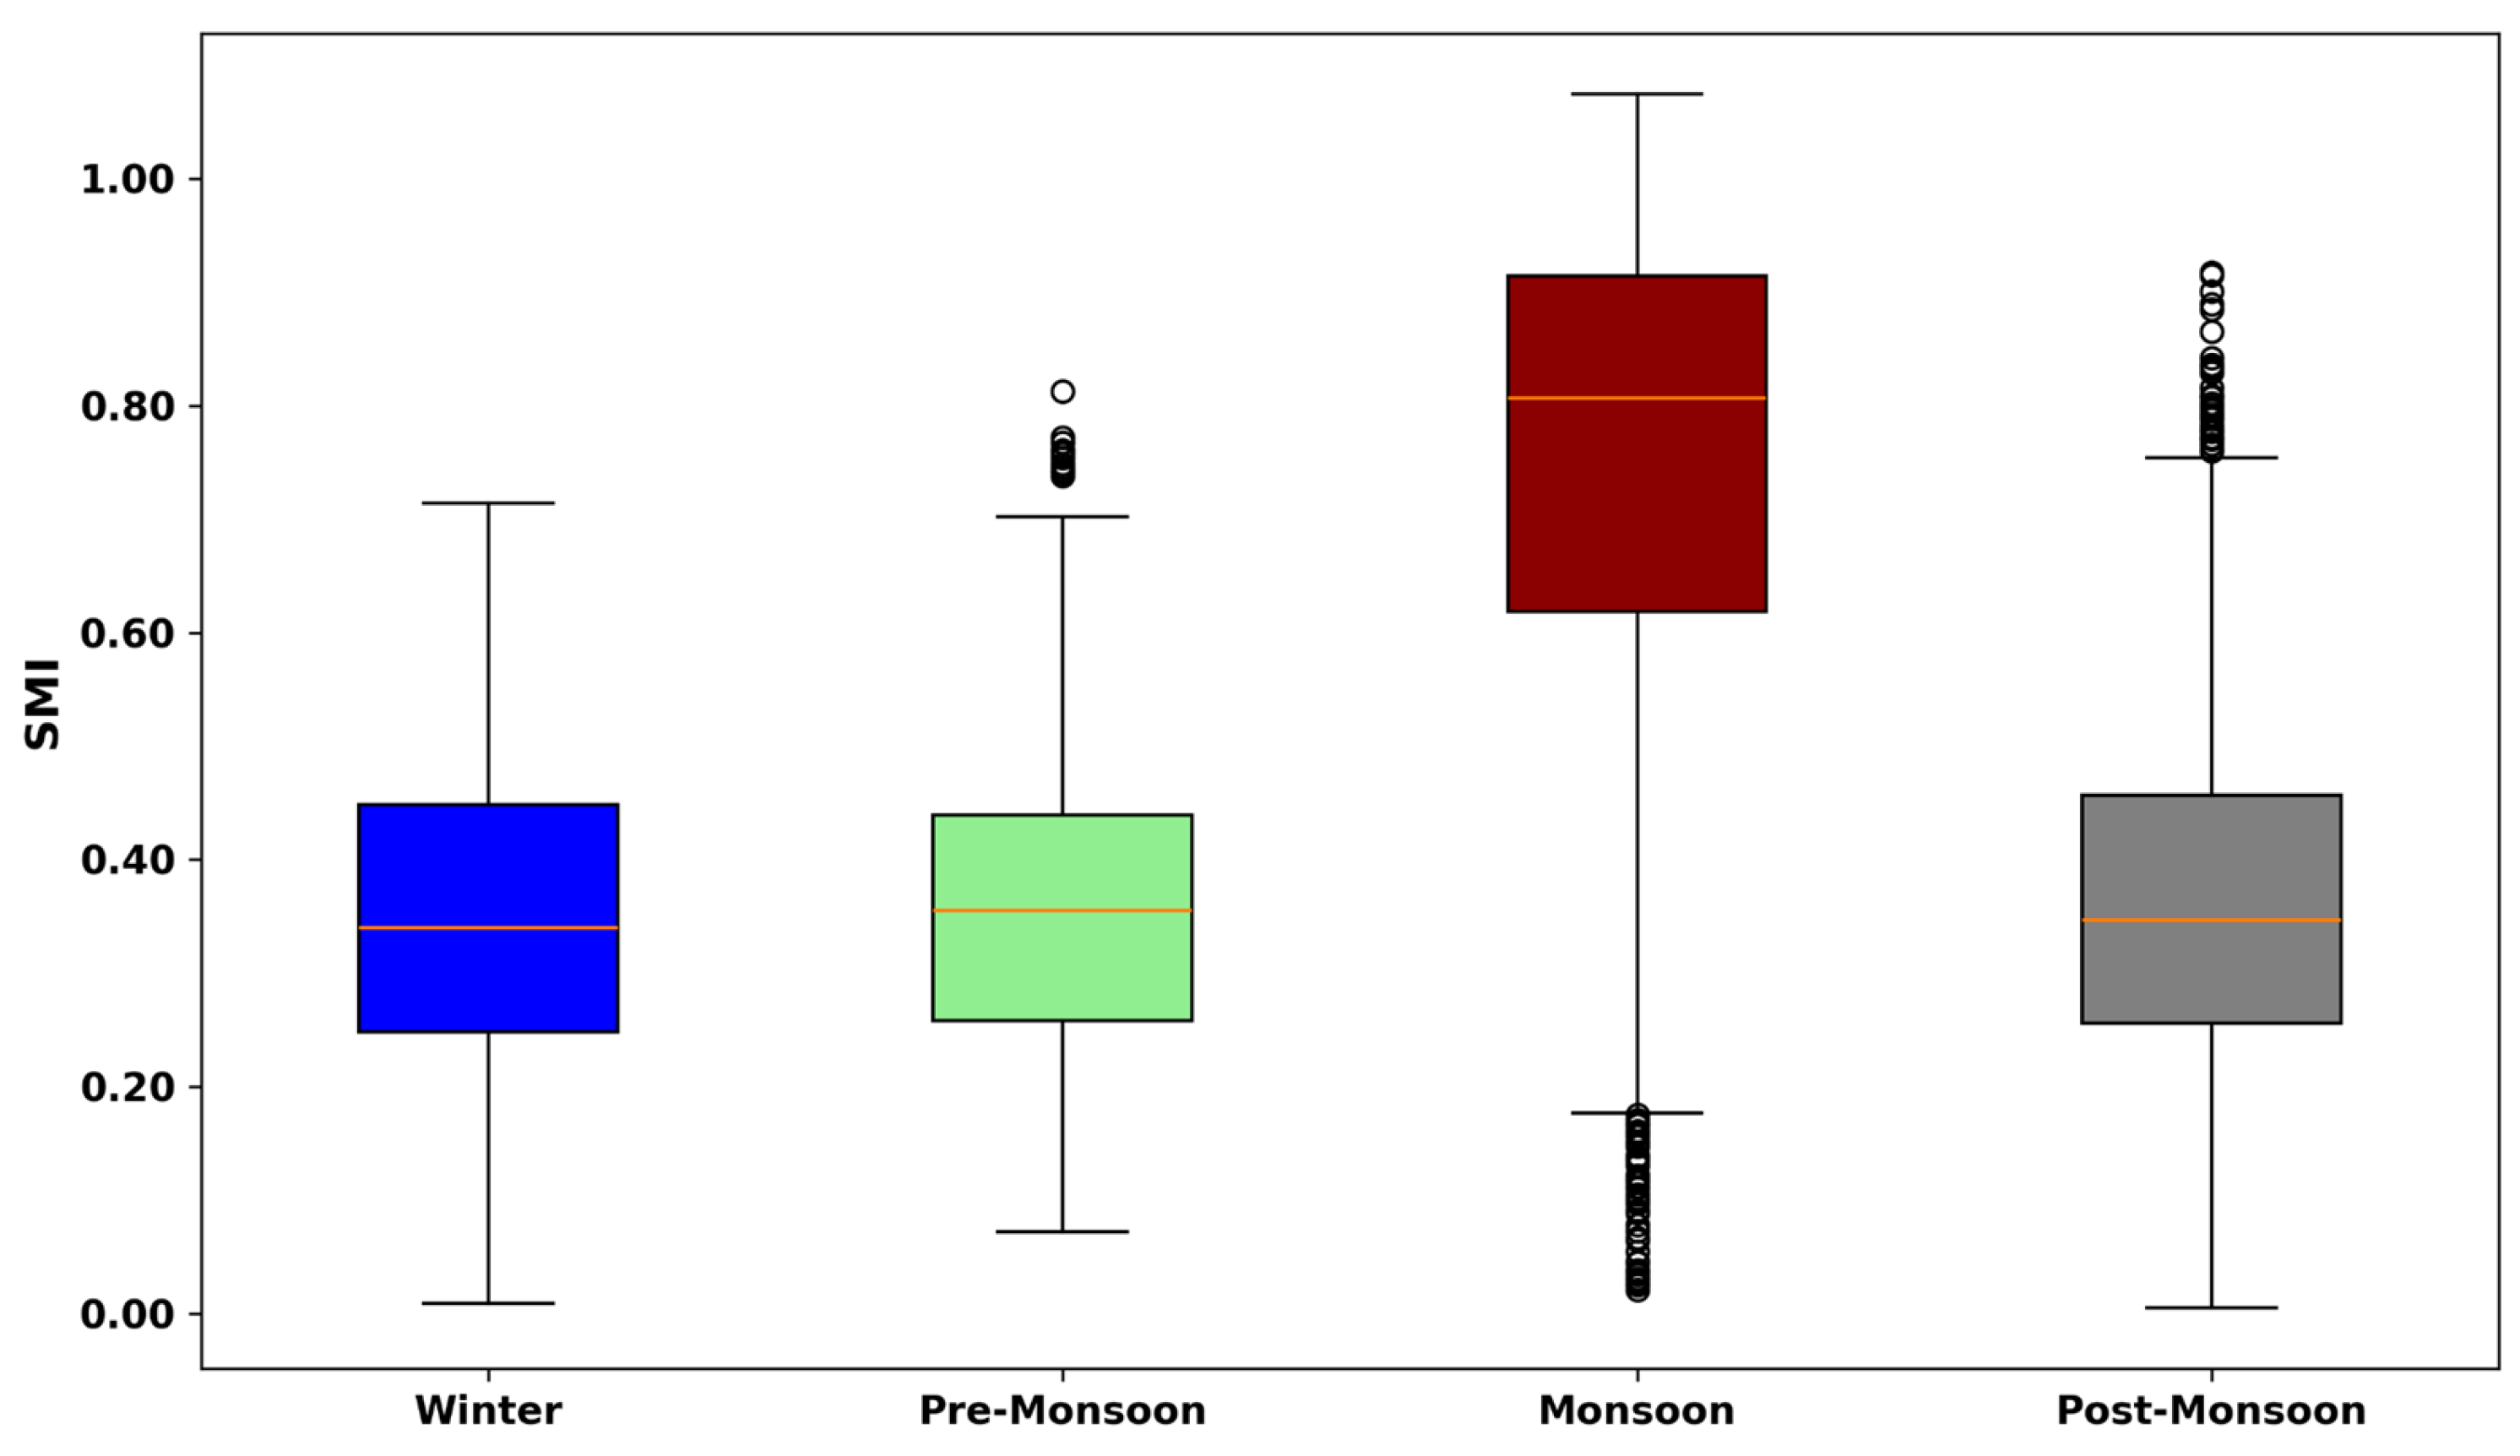
In the SMI analysis, the seasonal trends did not indicate any significant changes. However, the seasonal distribution of SMI reveals clear differences in both magnitude and variability across the four seasons (Figure 6). The monsoon season exhibits the highest mean SMI value of 0.744 with the large variation (standard deviation 0.216), reflecting substantial moisture accumulation and variability during this period. Winter, pre-monsoon, and post-monsoon seasons show relatively lower mean SMI values of 0.346, 0.356, and 0.366, respectively, and correspondingly lower variability. A few statistical outliers were observed, particularly during the monsoon and post-monsoon seasons, indicating occasional extreme wet or dry events. Overall, the seasonal boxplot effectively captured the seasonal variability in SMI, with the monsoon standing out as the most dynamic and moisture-rich period.

4.3. Monthly Drought Variability

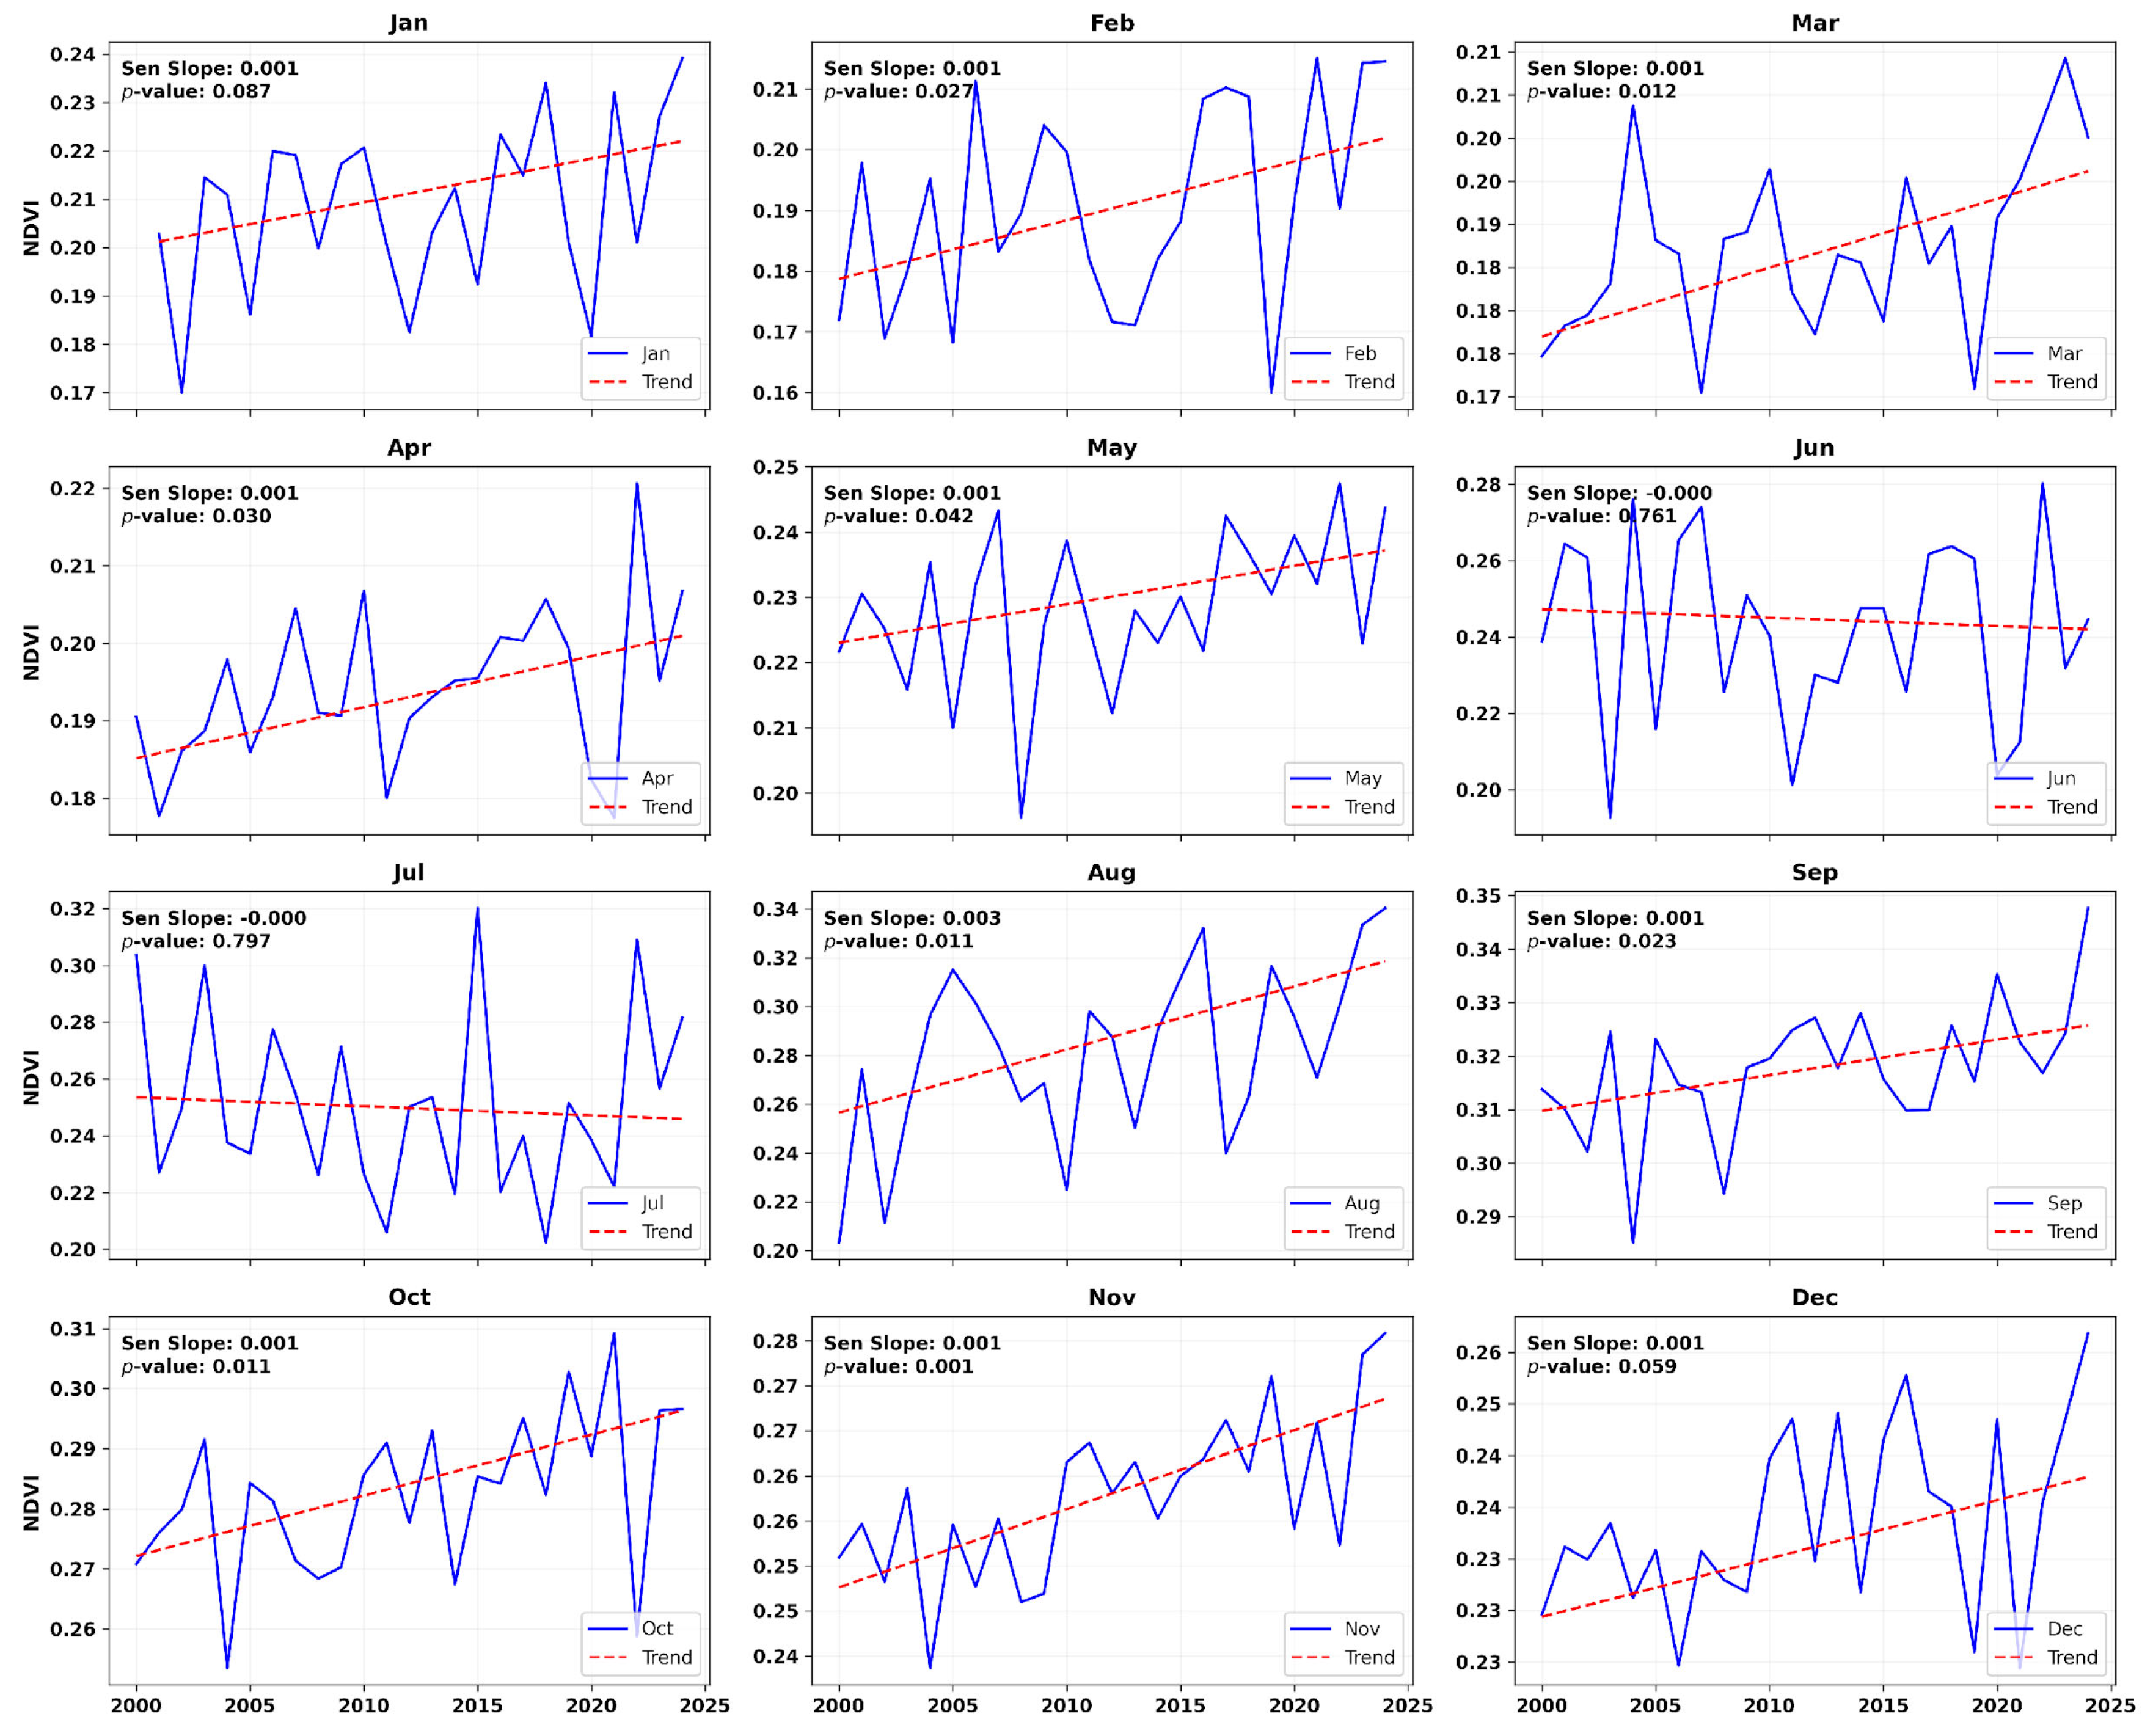
The monthly analysis of the indices reveals more in-depth variations in the drought assessment. These indices are used for the temporal and spatial study of drought in the KRB. The analysis of NDVI (Figure 7) shows distinct intra-annual variations that align closely with the region’s monsoonal climate cycle. NDVI values are lowest during the winter and early spring months (January to April), gradually increase through the pre-monsoon and monsoon periods, and peak during the late monsoon and early post-monsoon months.
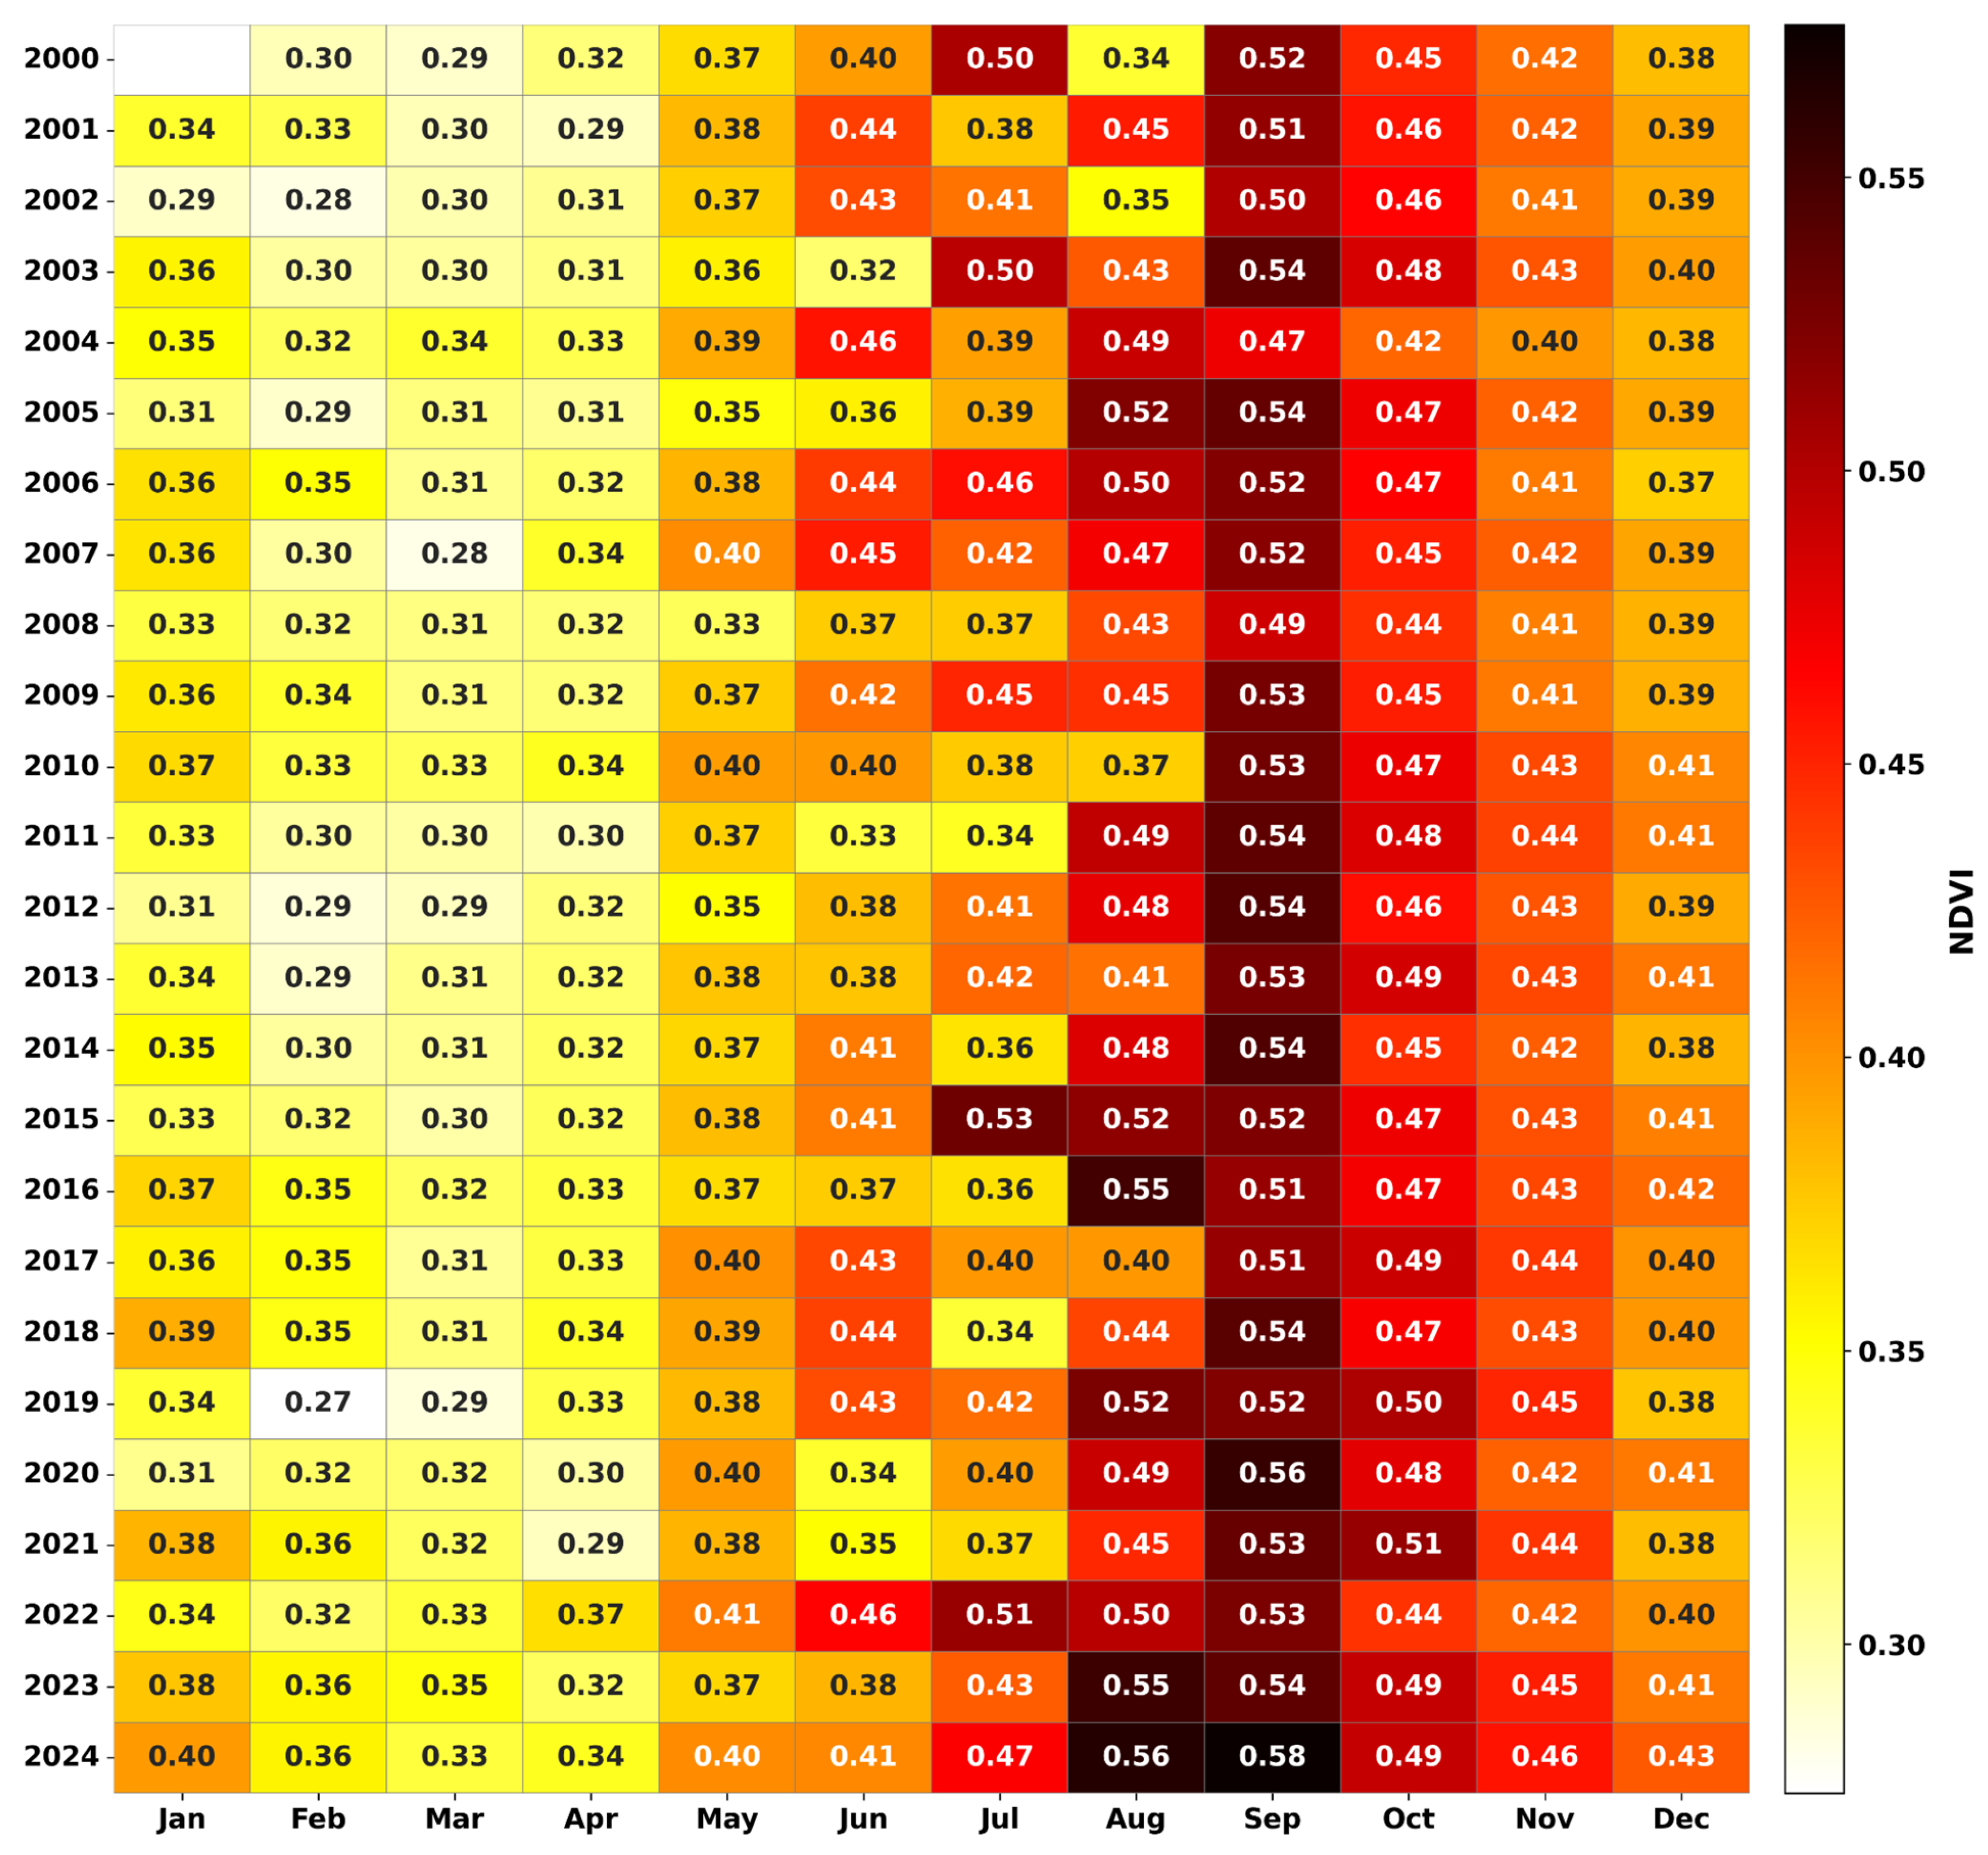
The lowest vegetation activity is observed in March (mean NDVI of 0.312) and February (0.320), reflecting dry conditions and minimal canopy cover before the onset of pre-monsoon rains, which may also be influenced by low temperatures and snow cover at higher elevations. A sharp rise begins in May (0.378) and continues through June (0.400) and July (0.416), culminating in the highest average NDVI in September (0.526). This peak corresponds to the climax of the monsoon season, when vegetation is lush and soil moisture availability is at its maximum. After reaching its maximum, NDVI slowly decreases throughout October (0.469) and November (0.428), reflecting the aging of crops and vegetation as precipitation decreases. The mean NDVI in December (0.396) remains moderately high compared to the early dry months due to residual moisture and vegetation cover in the lowlands.
A heatmap representing the NDVI values across all months and years (Figure 8) further illustrates seasonal cycles and interannual drought signals. Years such as 2002, 2004, and 2008 show reduced greenness during key growing months (June–September), aligning with reported drought episodes. Conversely, the post-2011 years tend to have particularly high NDVI.
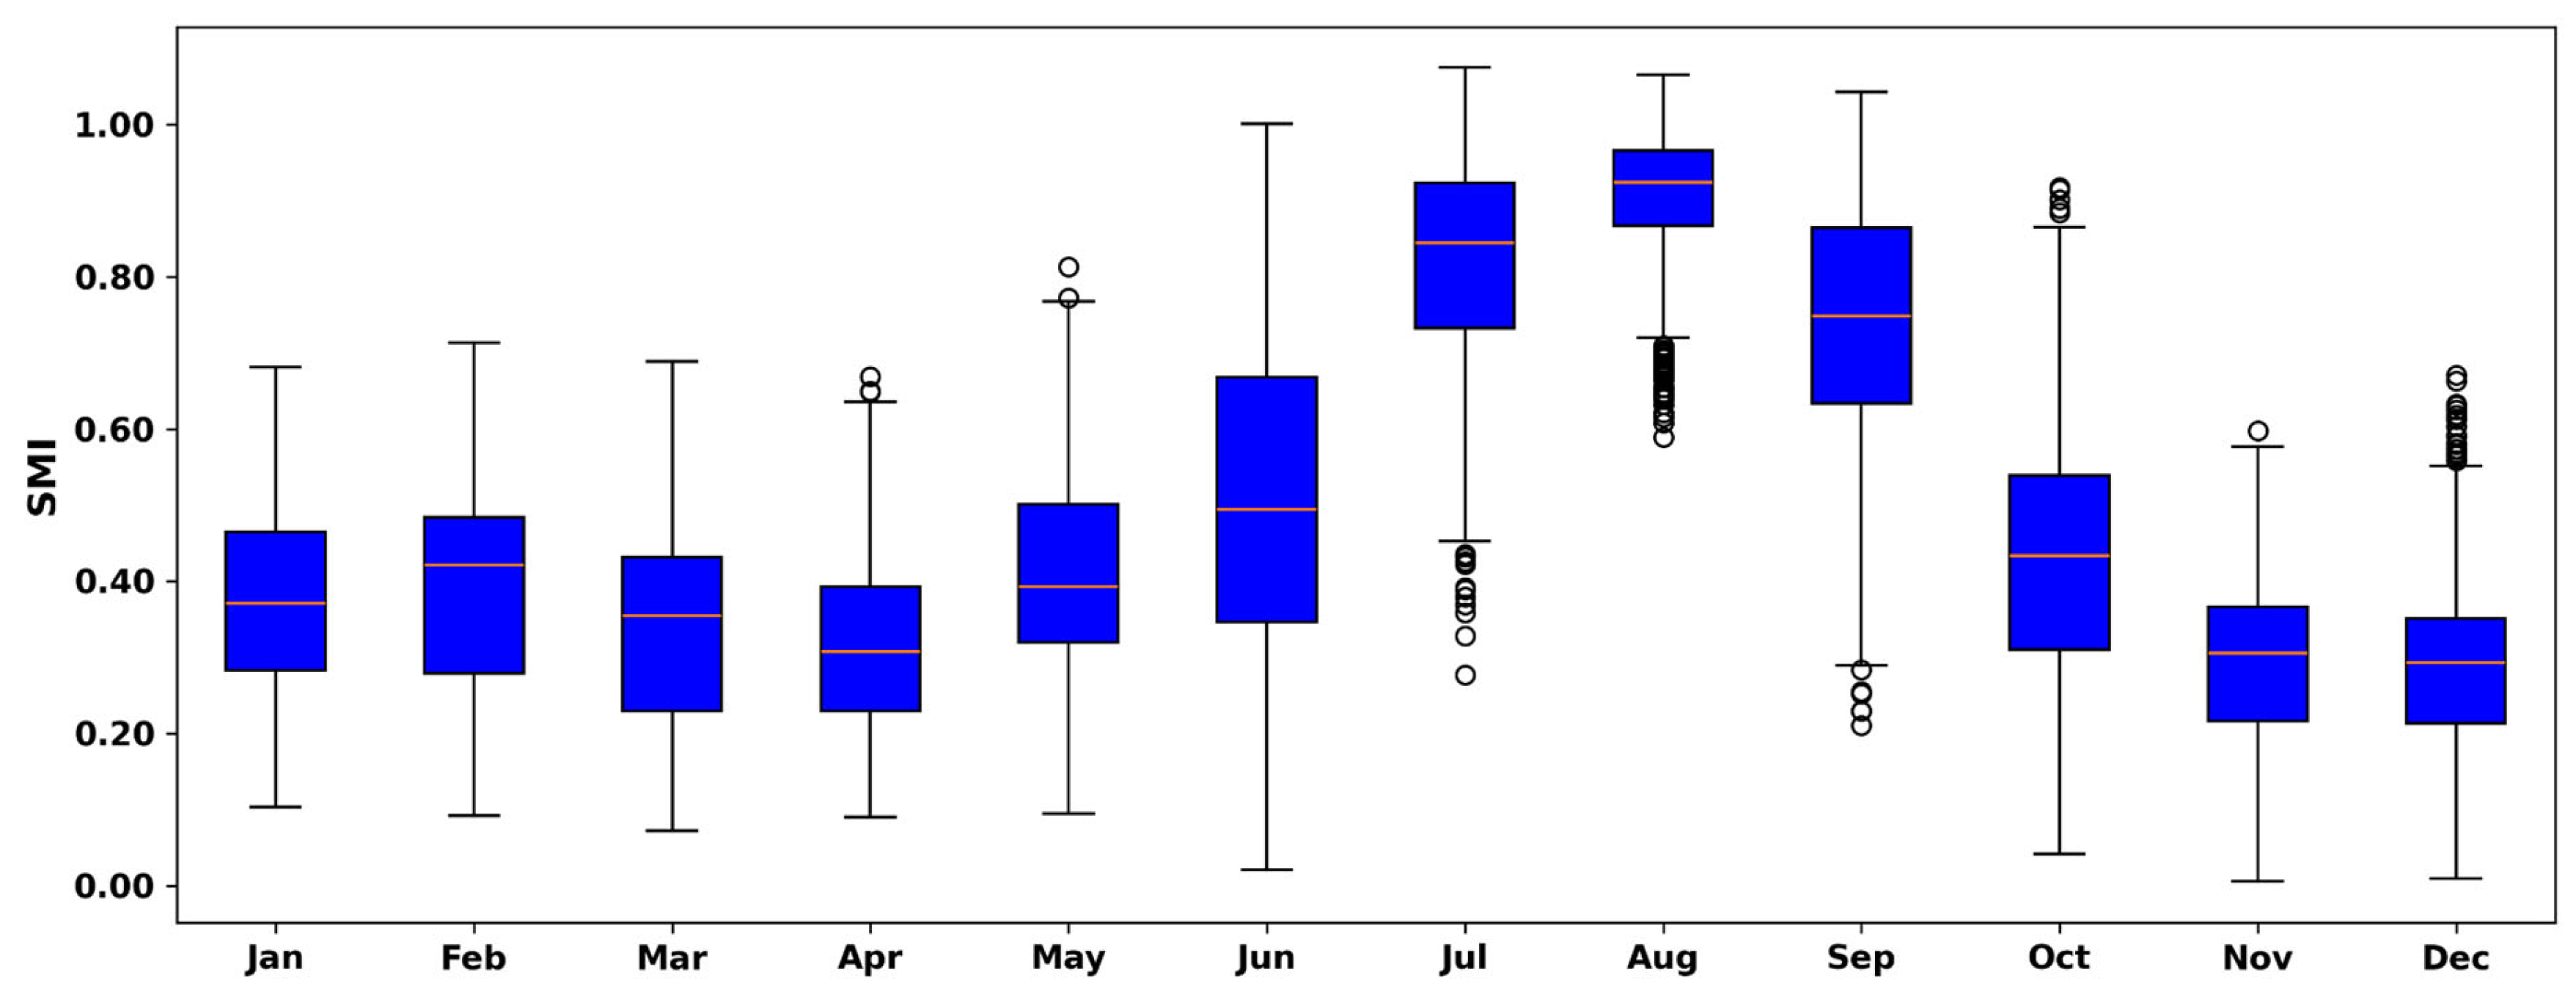
The monthly distribution of SMI (Figure 9) reveals a pronounced seasonal pattern, with peak values occurring during the core monsoon months of July (0.817) and August (0.909), succeeded by a gradual decline in the following months. The lowest mean SMI values are observed in November (0.296) and December (0.292), reflecting the dry conditions typical of the post-monsoon and early winter periods. Additionally, the standard deviation peaks in June (0.219), indicating substantial variability in the onset of early monsoon rainfall. While some individual months display outliers in the boxplots, these variations are consistent with known climatic variability patterns. This monthly analysis emphasizes the distinct hydrological seasonality of the region, clearly distinguishing monsoon-driven moisture surpluses from pre- and post-monsoon deficits.

4.4. Spatial Patterns of Drought

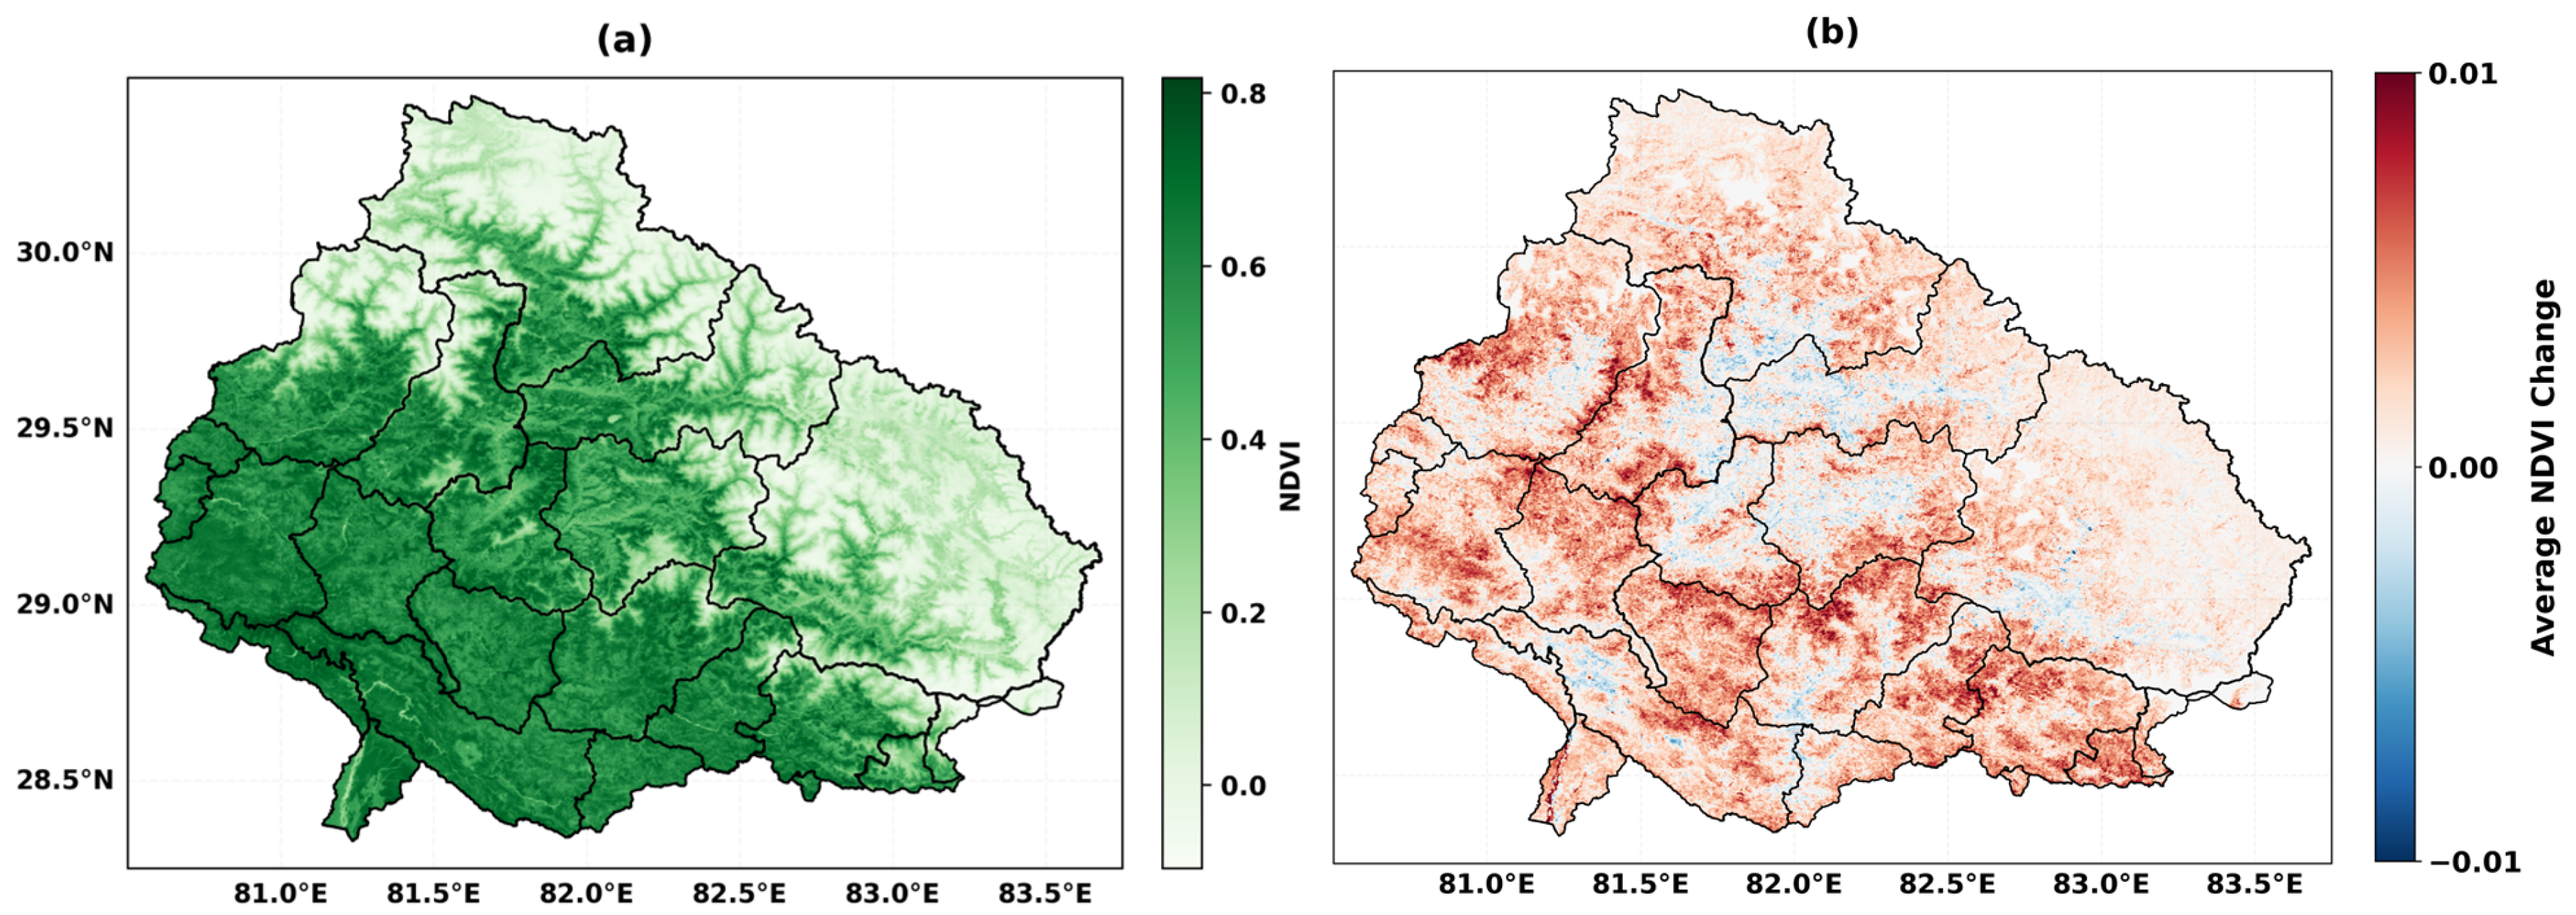
The spatial analysis of the three indicators is done to highlight gridwise drought variability and patterns in the KRB, with the district boundaries overlaid. The spatial distribution of mean NDVI (Figure 10a) shows distinct patterns across elevation gradients. Higher NDVI values are consistently observed in the southern Terai plains and mid-hill regions, indicating dense and healthy vegetation cover. In contrast, the northern high-altitude areas exhibit persistently low NDVI values, generally below 0.2, corresponding to sparse alpine vegetation and snow-covered terrain. The mean NDVI values across the region range from a minimum of −0.10 to a maximum of 0.82, clearly highlighting the spatial heterogeneity in vegetation density and greenness.
The analysis of average annual NDVI change over the KRB for 2000–2024 indicates a slight overall increase in vegetation greenness, with a mean slope of 0.0019 (Figure 10b). Spatially, the changes range from a minimum decrease of −0.0160 to a maximum increase of 0.0199, highlighting localized areas of vegetation loss and gain. The standard deviation (0.0022) suggests that most of the basin experienced minor changes, with a few areas showing stronger variability (Figure 10b). Areas of positive NDVI changes dominate much of the basin, represented in red shades, while pockets of NDVI loss appear in blue tones, likely corresponding to areas facing land use change, water stress, or ecological degradation. This grid-level perspective enhances the temporal trend analysis by revealing localized patterns of vegetation recovery or stress that are not evident from area-averaged data alone.
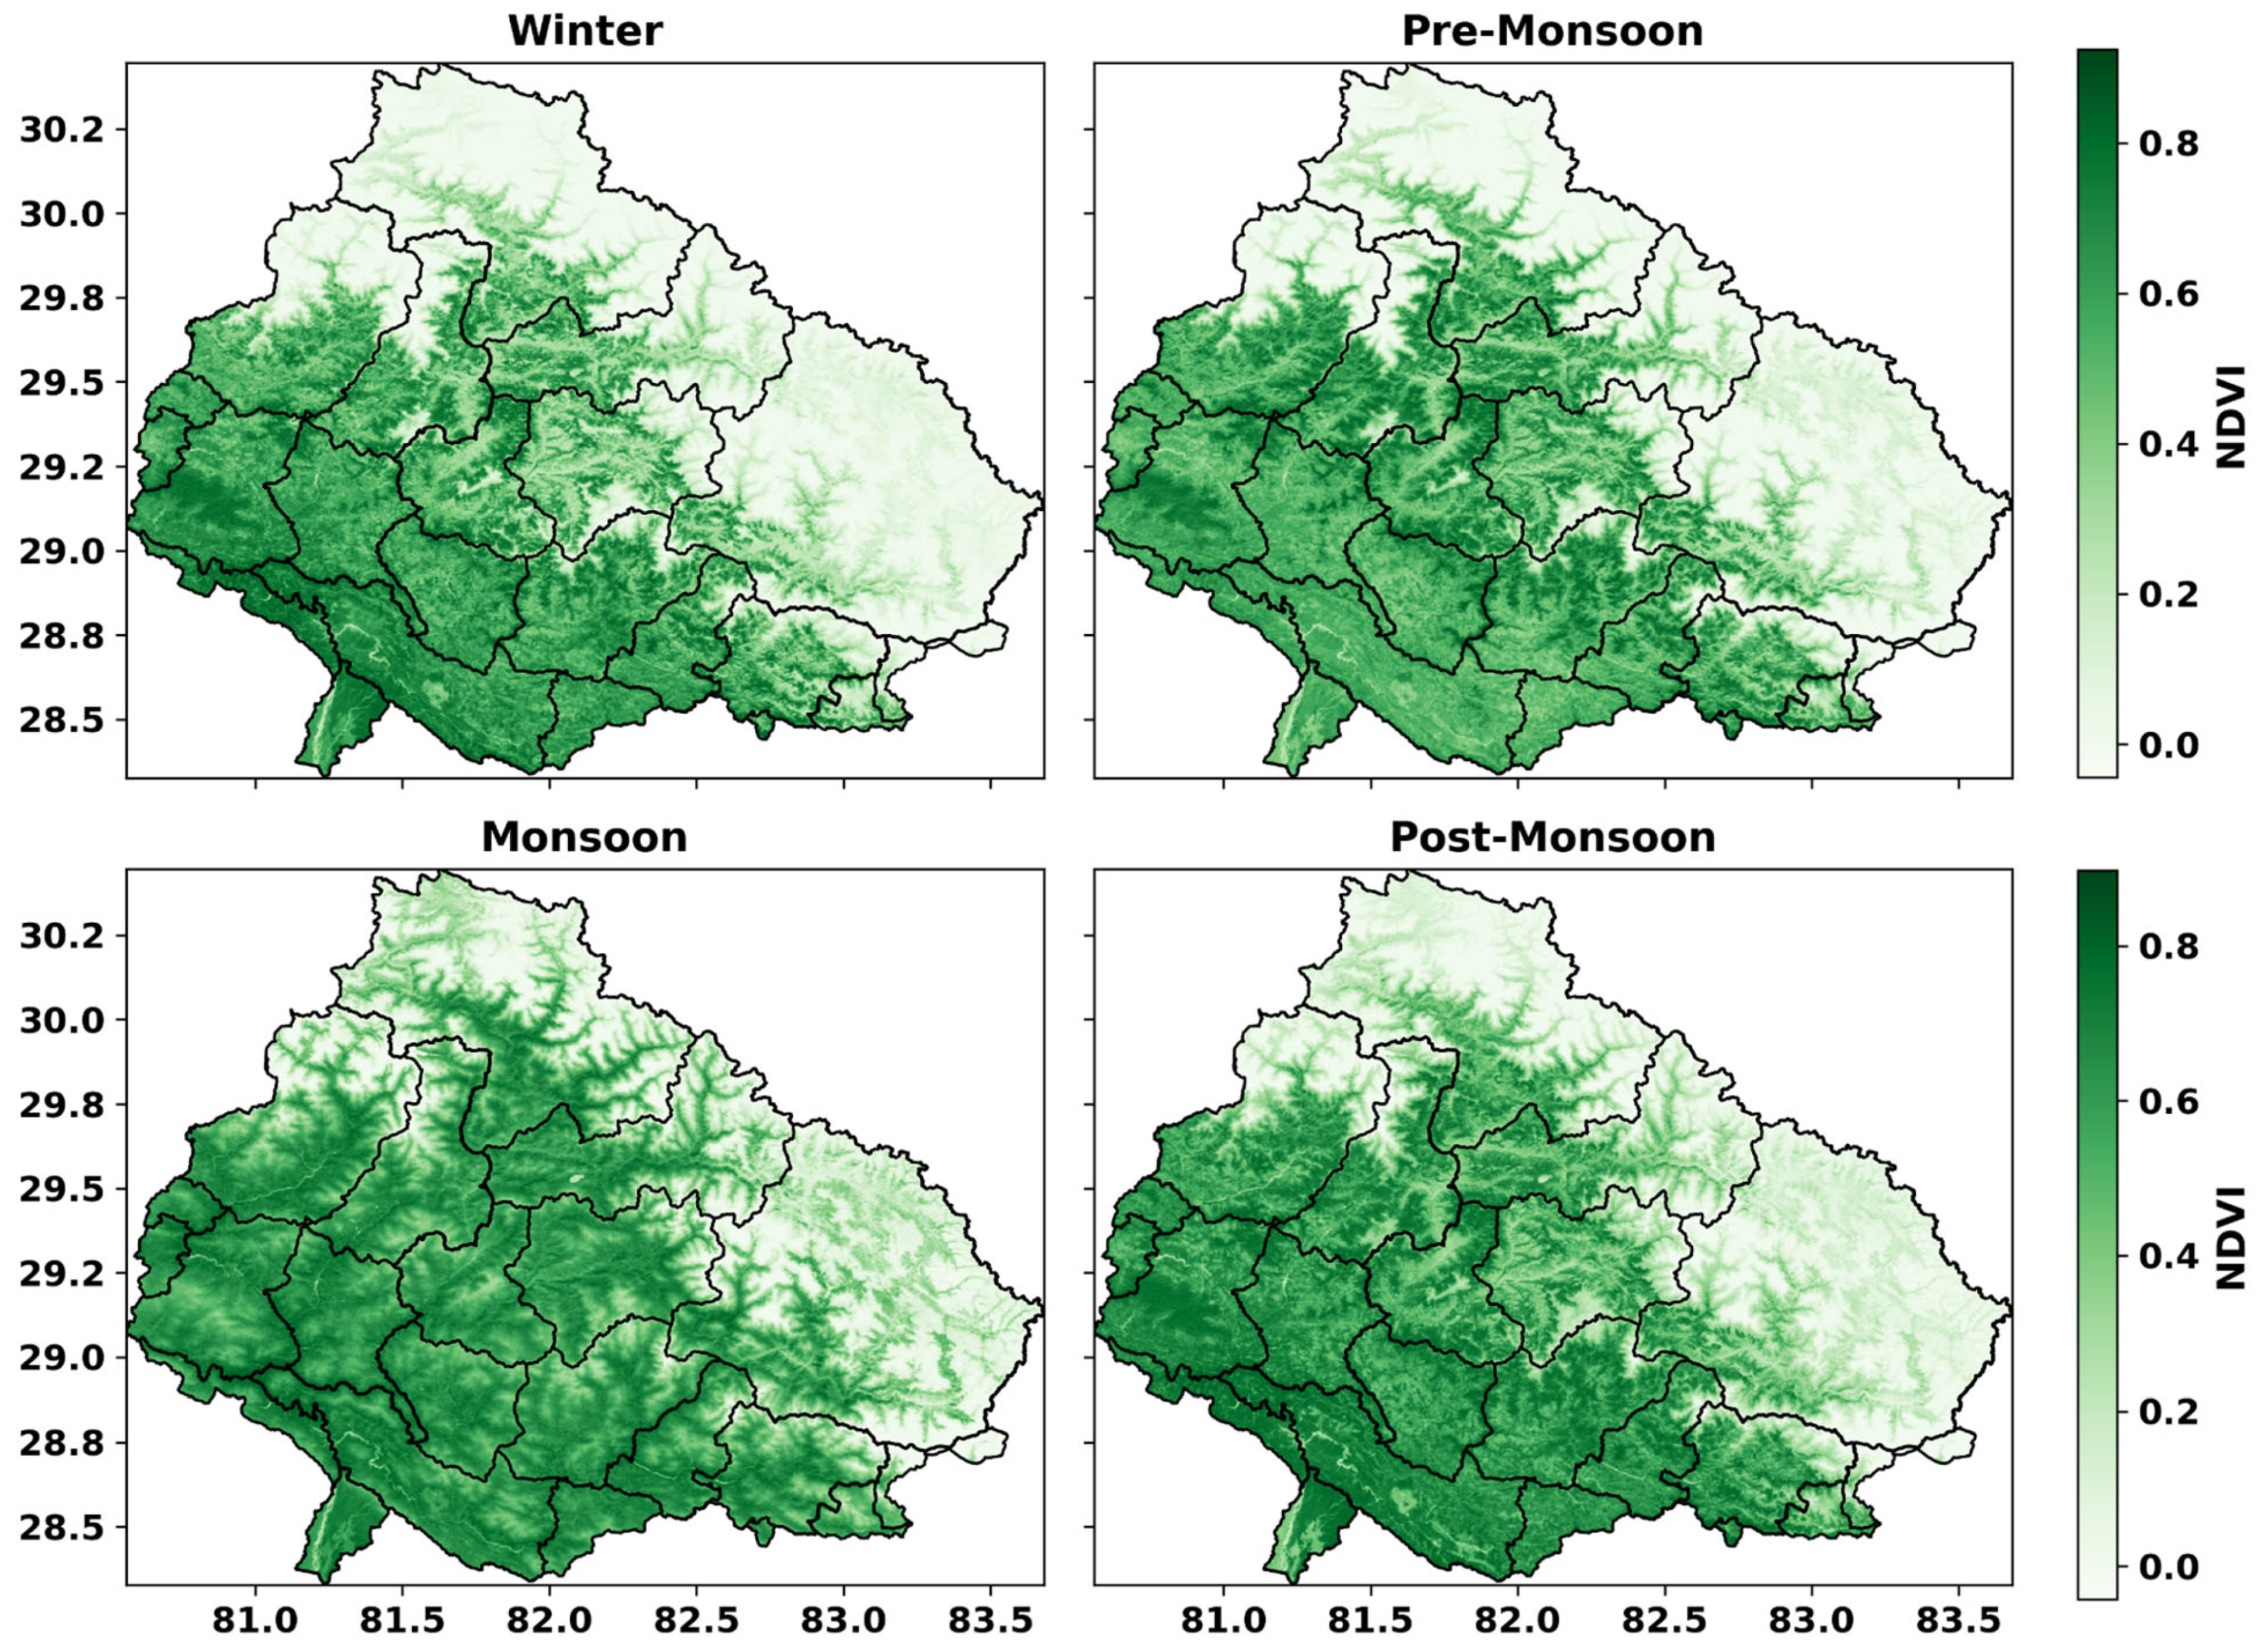
The spatial distribution of NDVI across the KRB shows a distinct seasonal pattern (Figure 11). During the monsoon season, there is a significant expanse of green coverage, which is then followed by the post-monsoon period. In contrast, the winter and pre-monsoon seasons exhibit relatively reduced vegetation due to limited precipitation. The post-monsoon season, in particular, shows dense vegetation, reflecting the delayed effects of monsoonal rainfall. As expected, high-altitude regions remain sparsely vegetated or non-vegetated throughout all seasons, due to cold temperatures and lack of moisture.
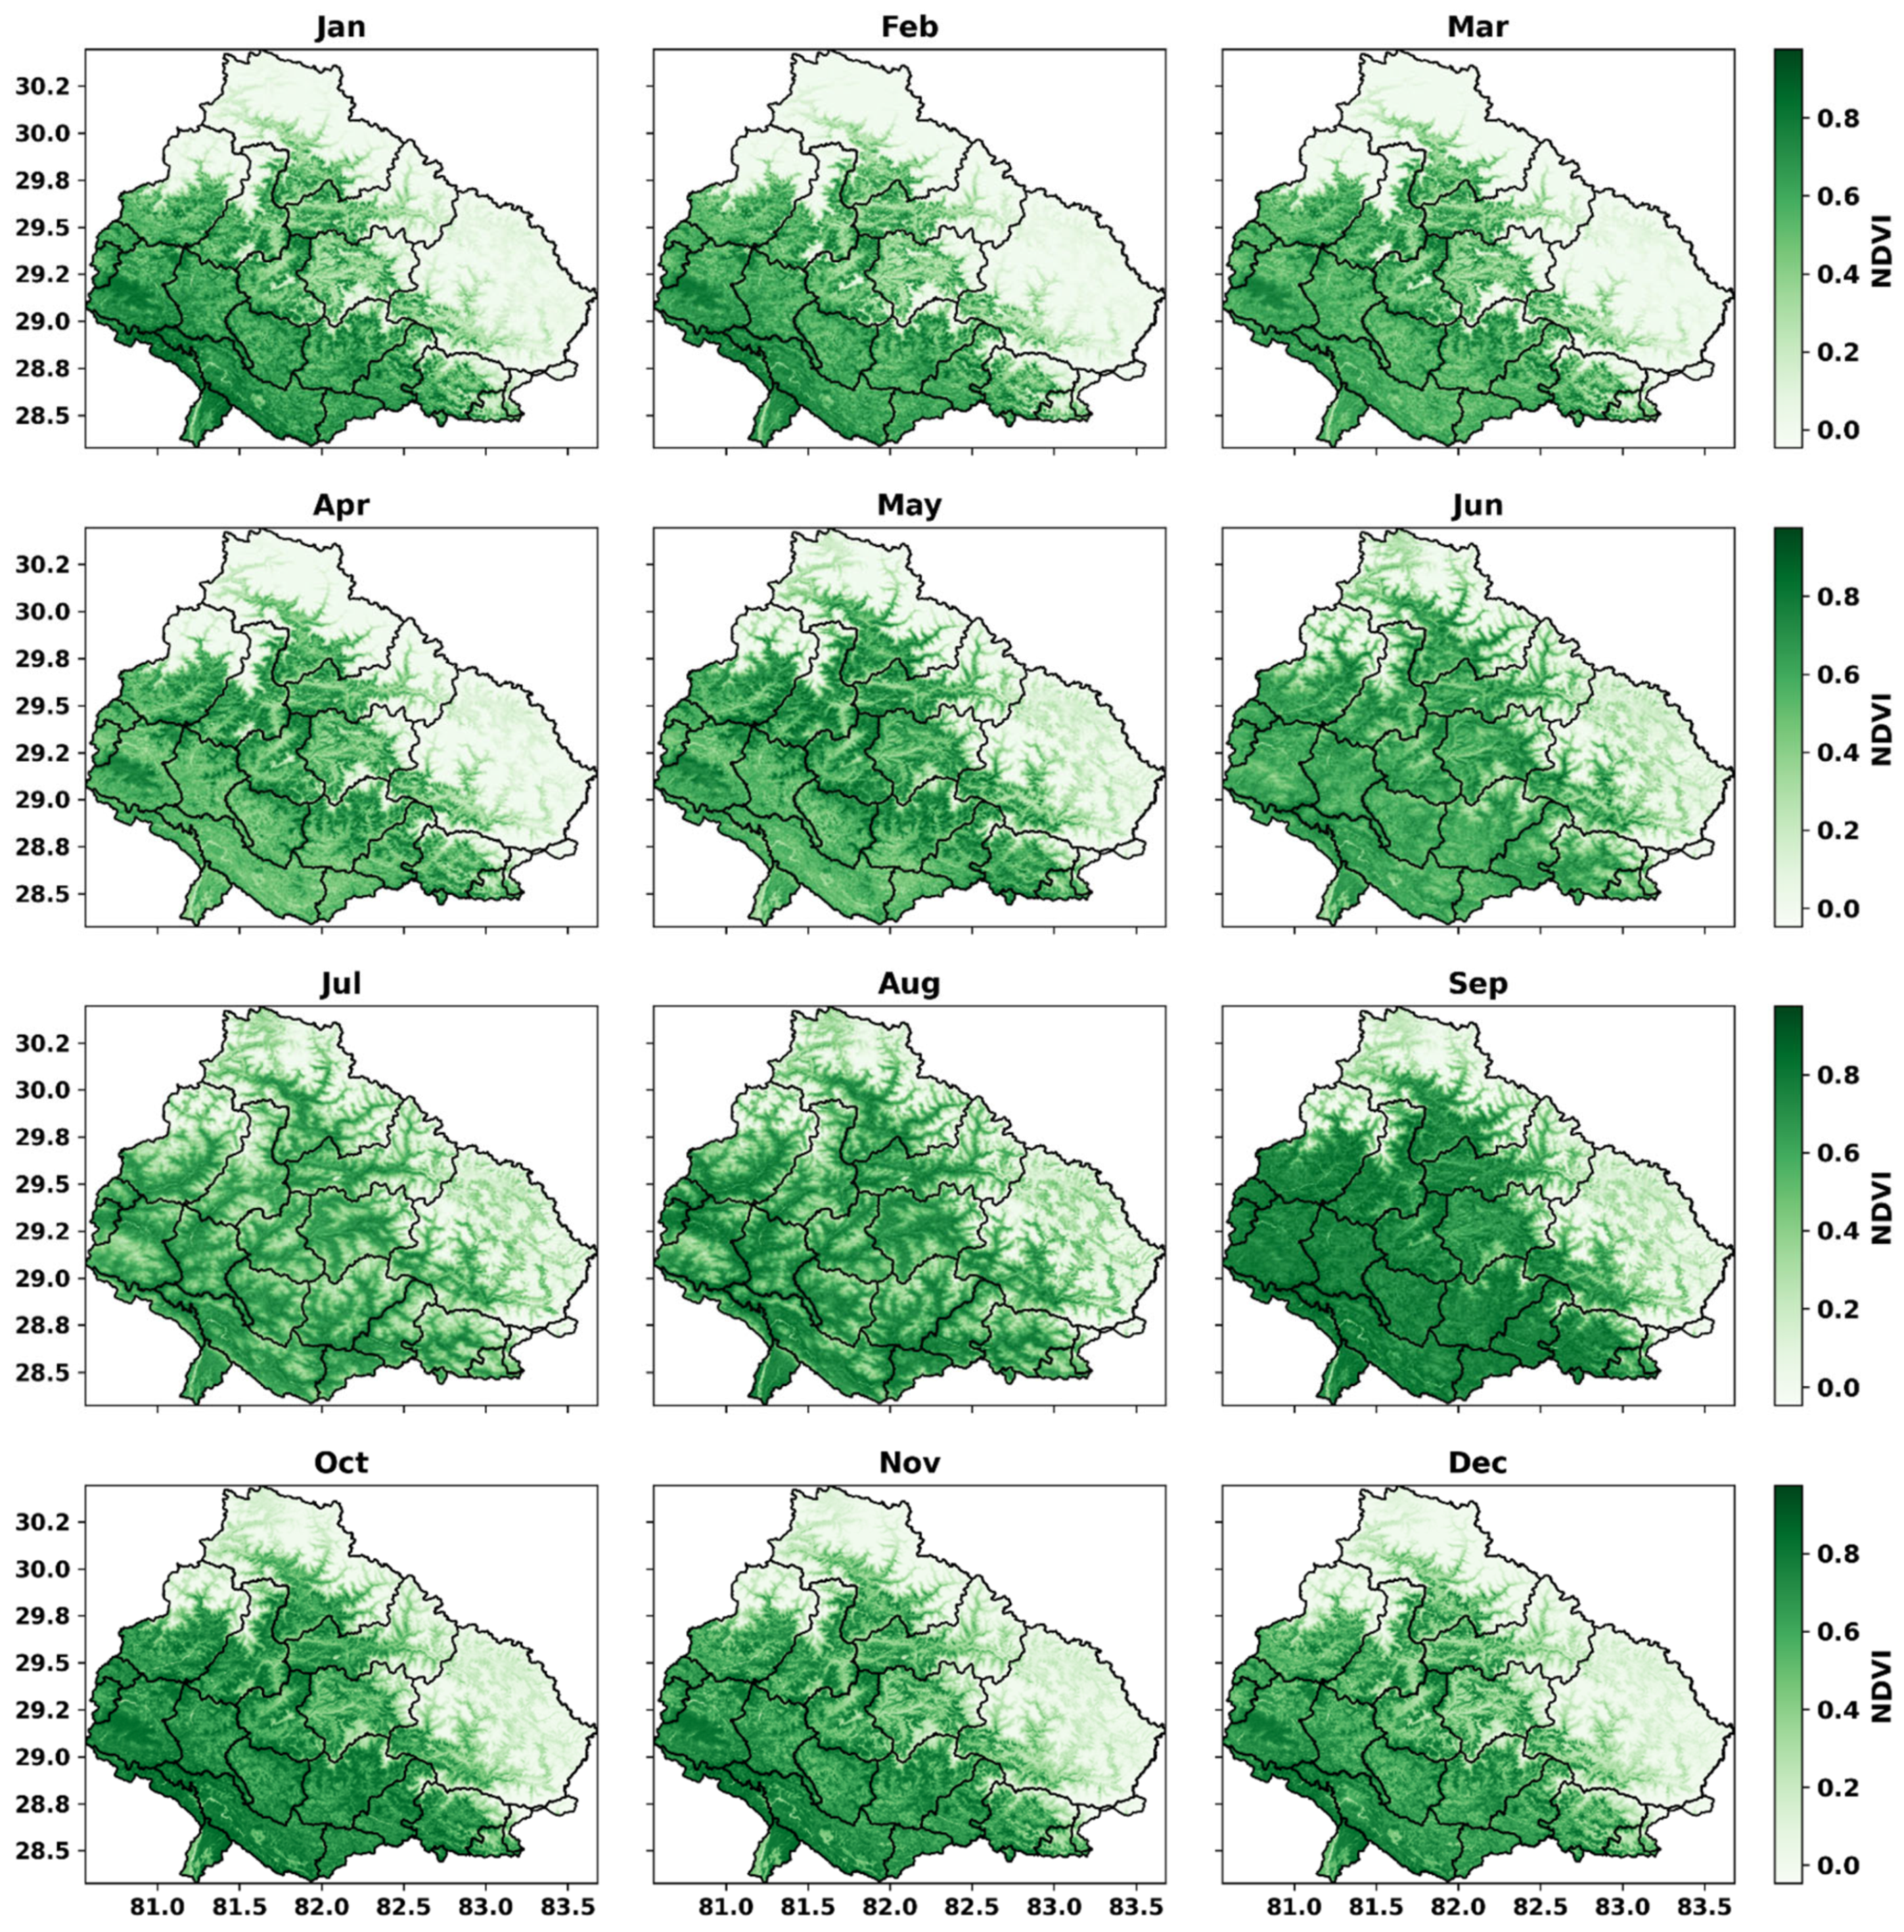
The spatial maps for each month (Figure 12) similarly reveal pronounced eco-geographical gradients, with lower elevation Terai and mid-hills exhibiting strong monthly variation, while the high Himalayas maintain persistently low NDVI. This also illustrates the temporal coherence of NDVI patterns, highlighting September as a consistent peak month and February-March as periods of drought-induced stress.
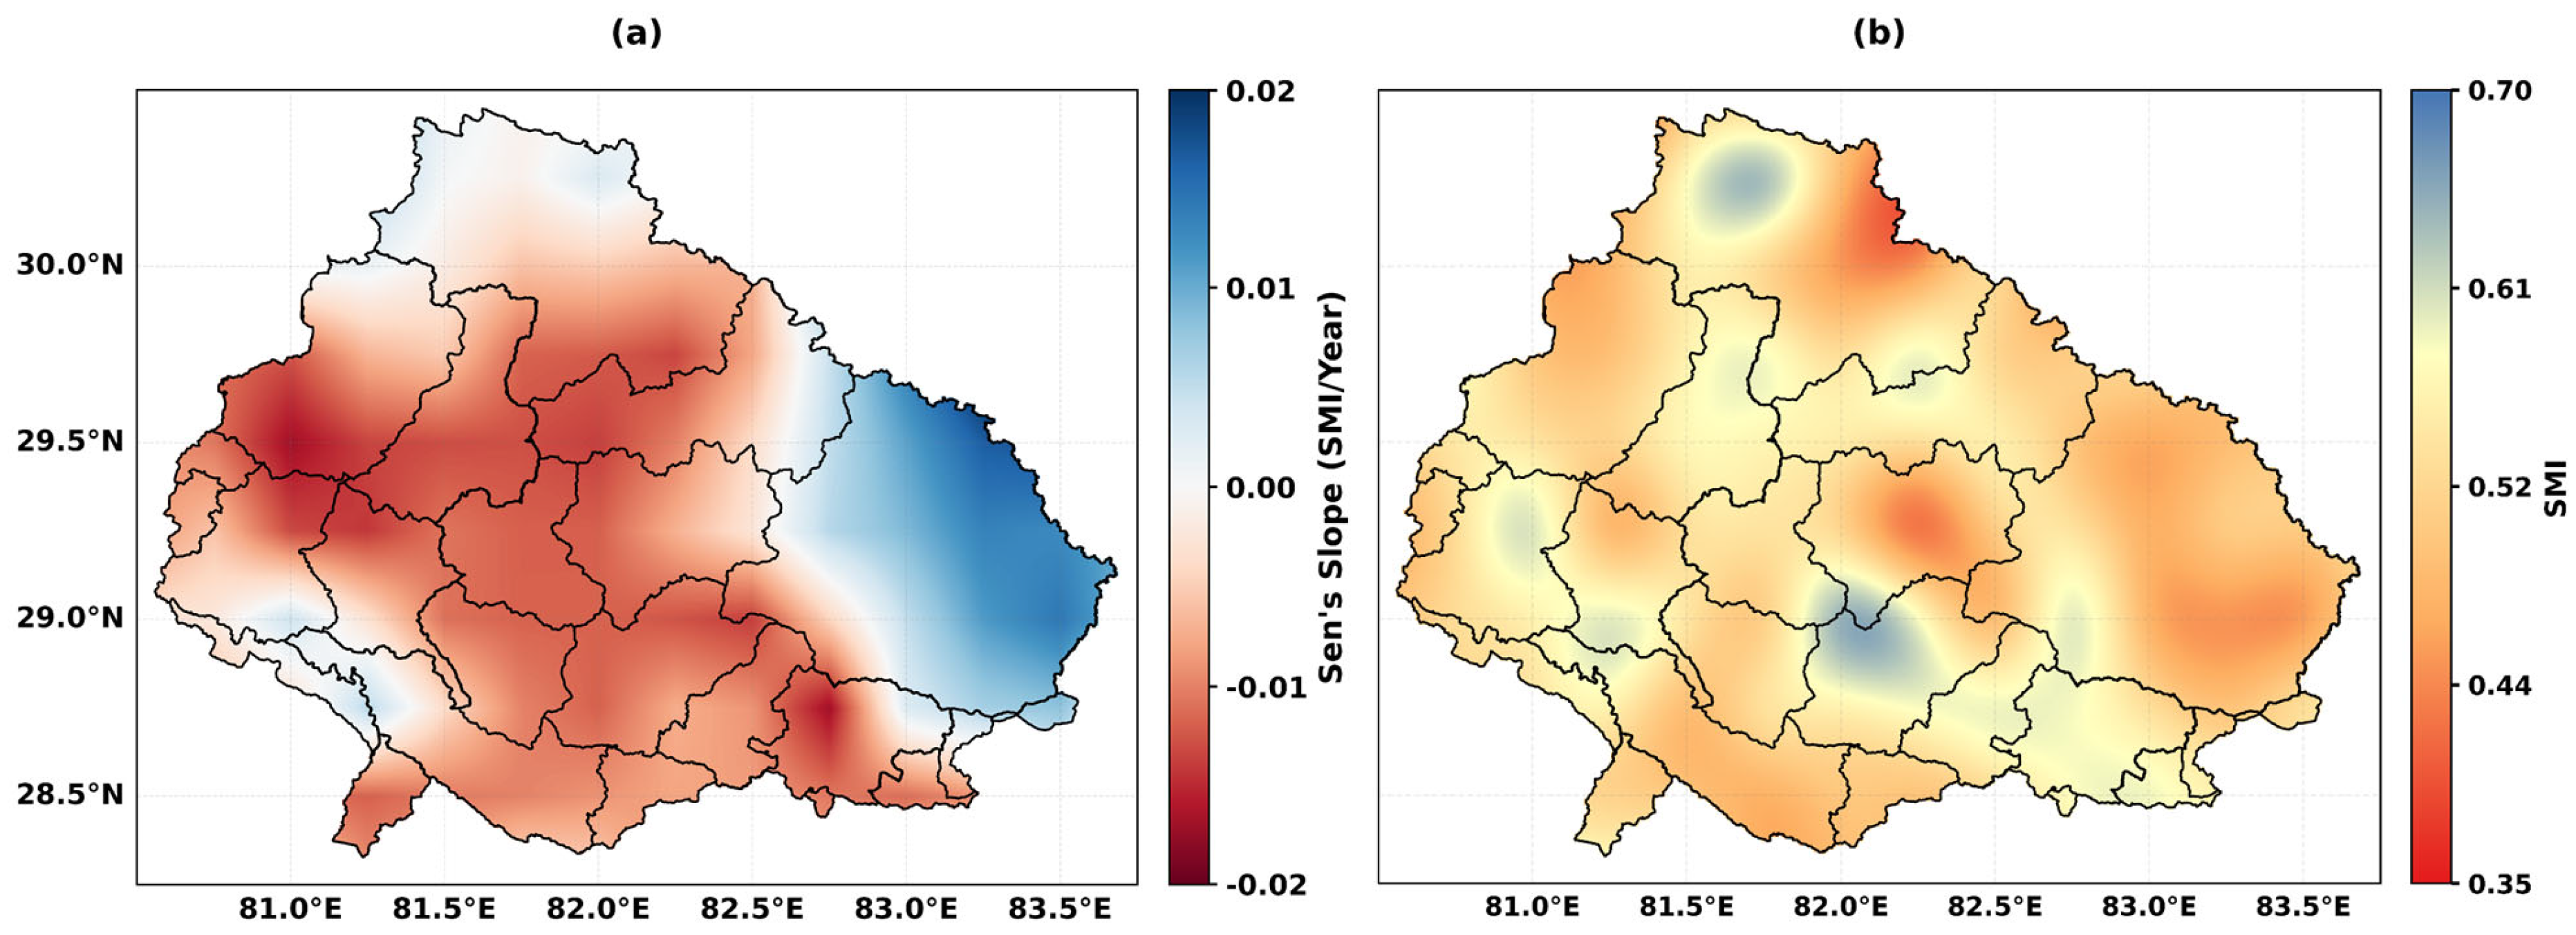
The spatial analysis of SMI trends across the grid cells from 1995 to 2024 highlights distinct regional variations (Figure 13a). The spatial analysis across individual grid cells shows that most areas exhibit small negative trends, with a mean Sen’s slope of −0.0029 per year, and local slopes ranging from −0.015 to 0.020 per year. The spatial distribution of trends is showing low spatial variability (standard deviation = 0.008), highlighting that most of the basin is experiencing consistent, minor reductions in soil moisture, reflecting general stability in overall basin hydrology despite some local variations.
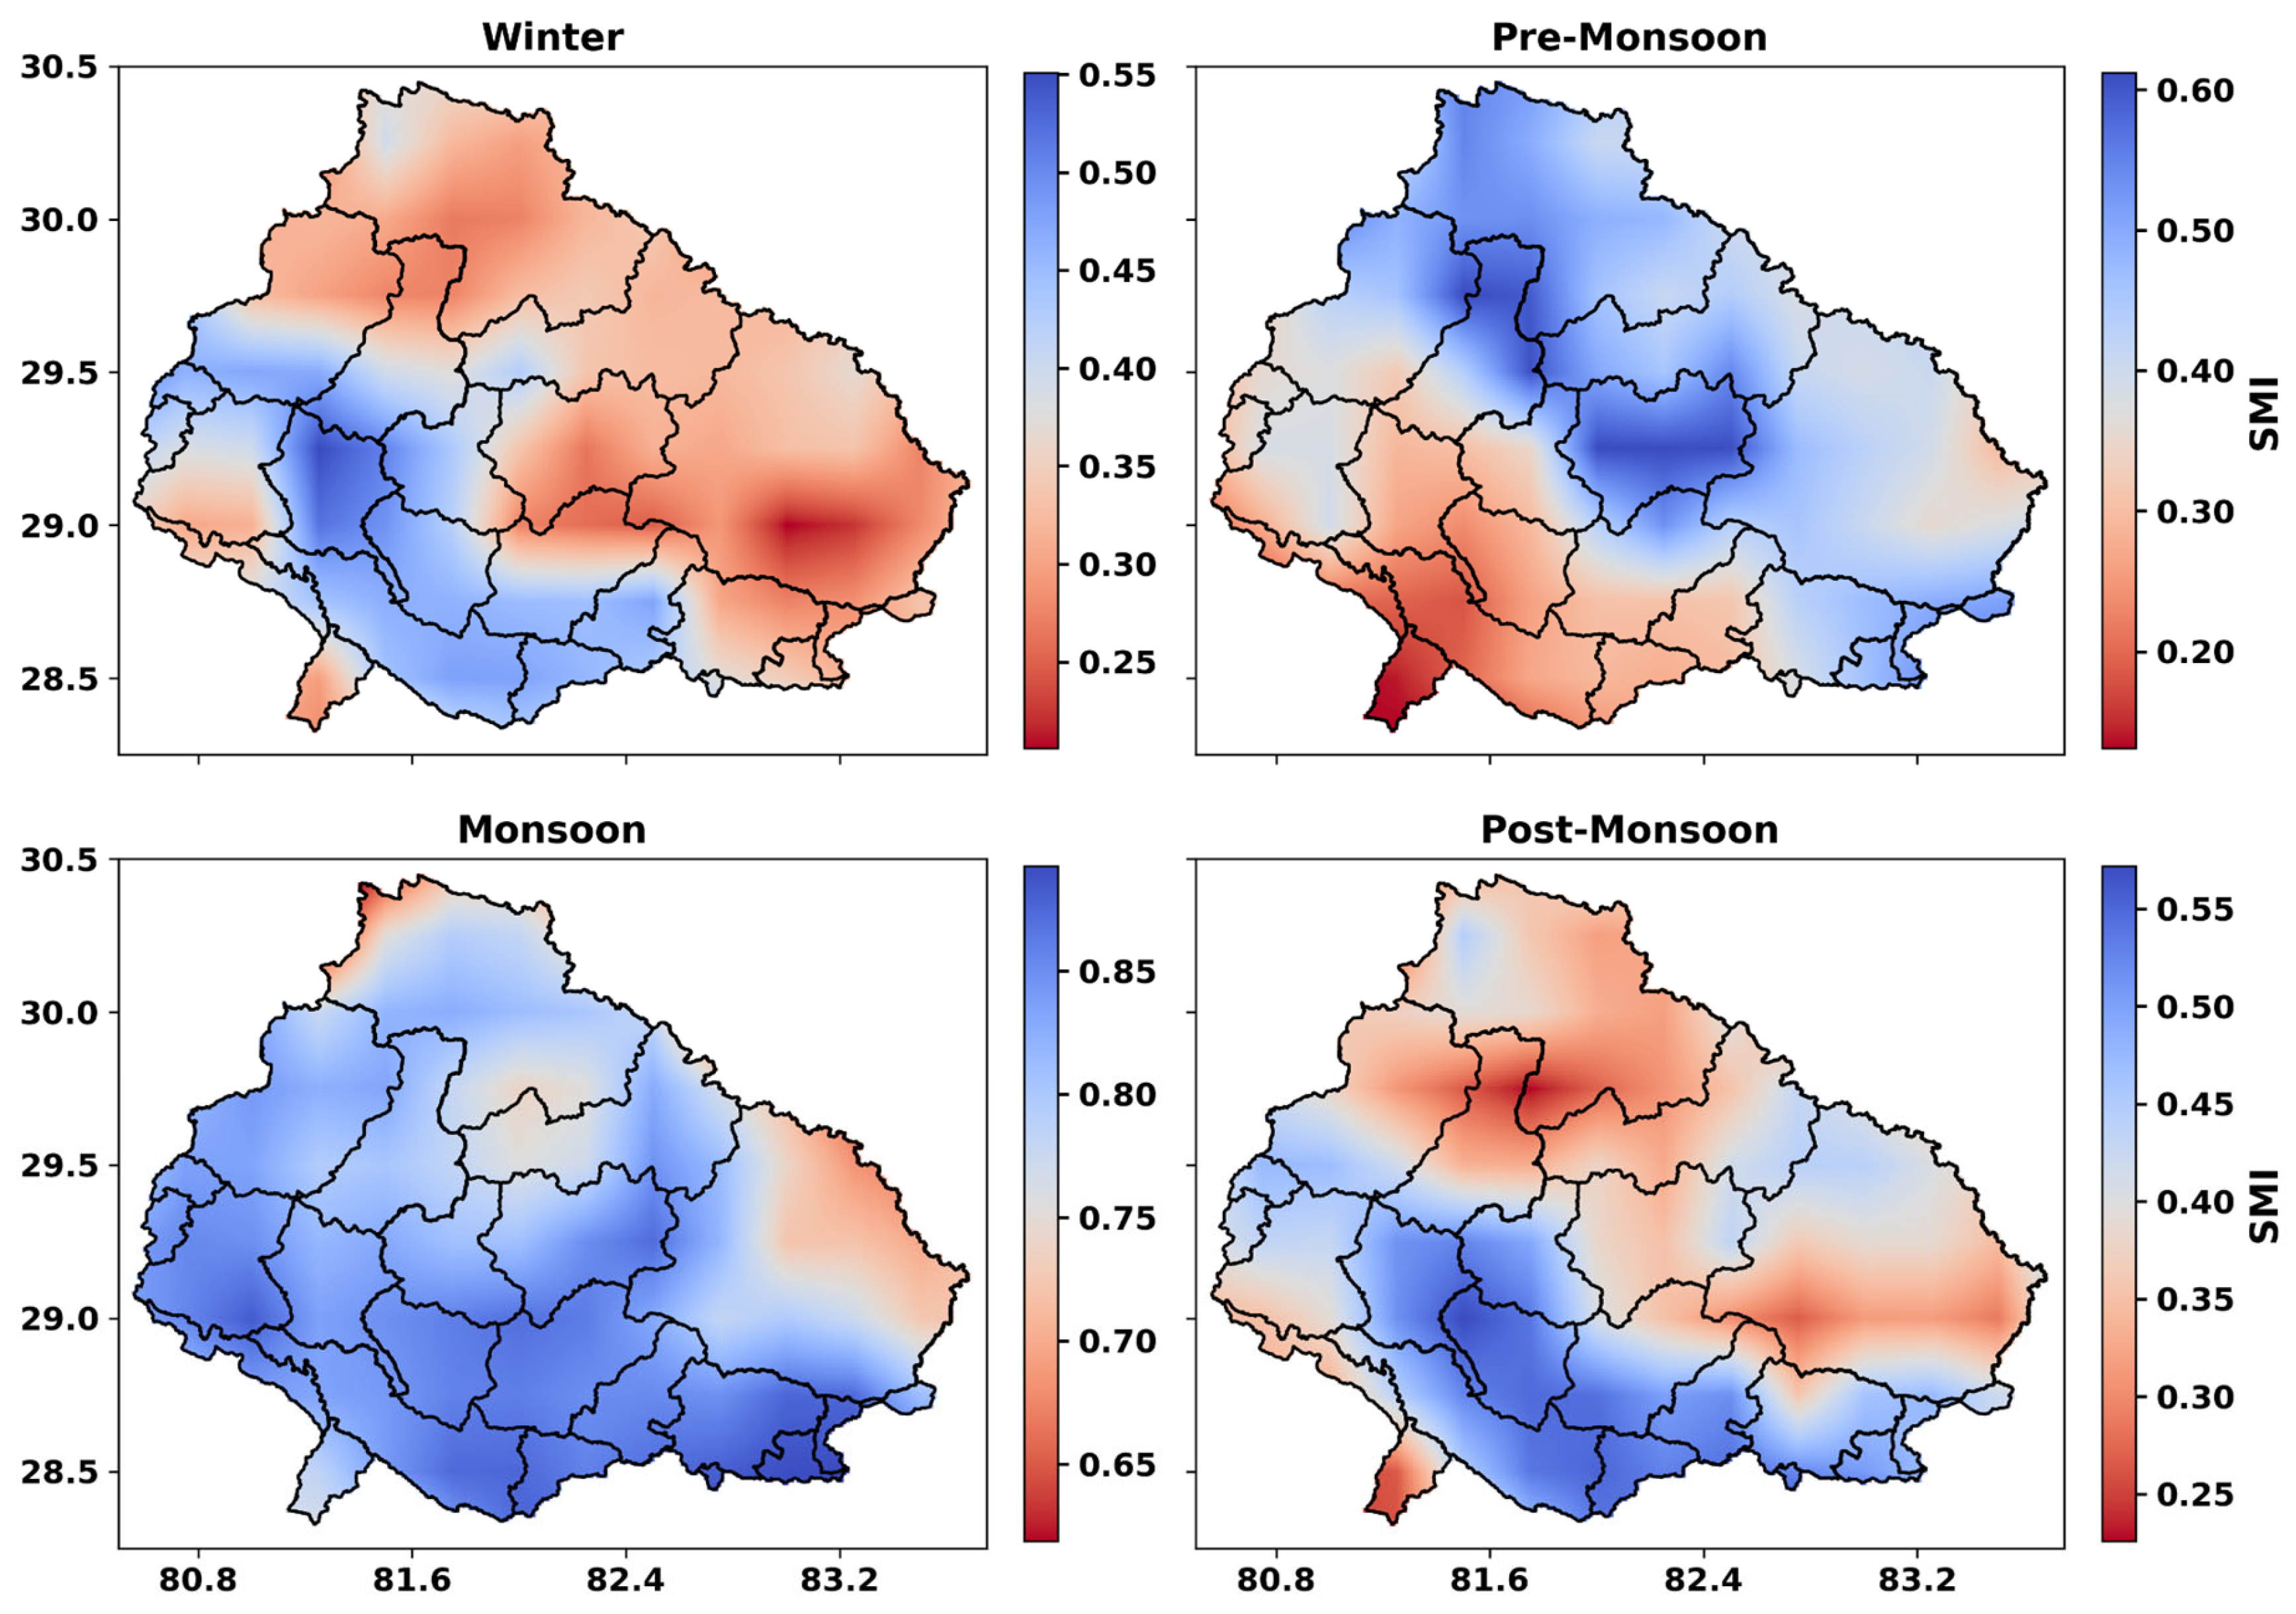
Figure 13b shows the spatial distribution of the average SMI, which provides a general understanding of the typical soil moisture conditions across the KRB. The annual average SMI over the basin for 1995–2024 indicates moderate soil moisture conditions across the region, with a mean SMI of 0.532 and a median of 0.534. The minimum and maximum values (0.396–0.659) indicate localized variability, but the relatively low standard deviation (0.045) shows that most grid cells are clustered around the basin average.
SMI seasonal patterns analyzed spatially show that the monsoon months, spanning from June to September, exhibit notably higher soil moisture levels, indicating widespread wet conditions throughout the basin (Figure 14). In contrast, the pre-monsoon months, especially March and April, show lower SMI values with greater variability, reflecting the dry-season stress that precedes the arrival of monsoon rains. Unlike the NDVI results, the seasonal SMI data indicate that the post-monsoon period experiences relatively drier conditions compared to the pre-monsoon period. However, winter stands out as the driest season, with over half of the basin area registering values below approximately 0.35.
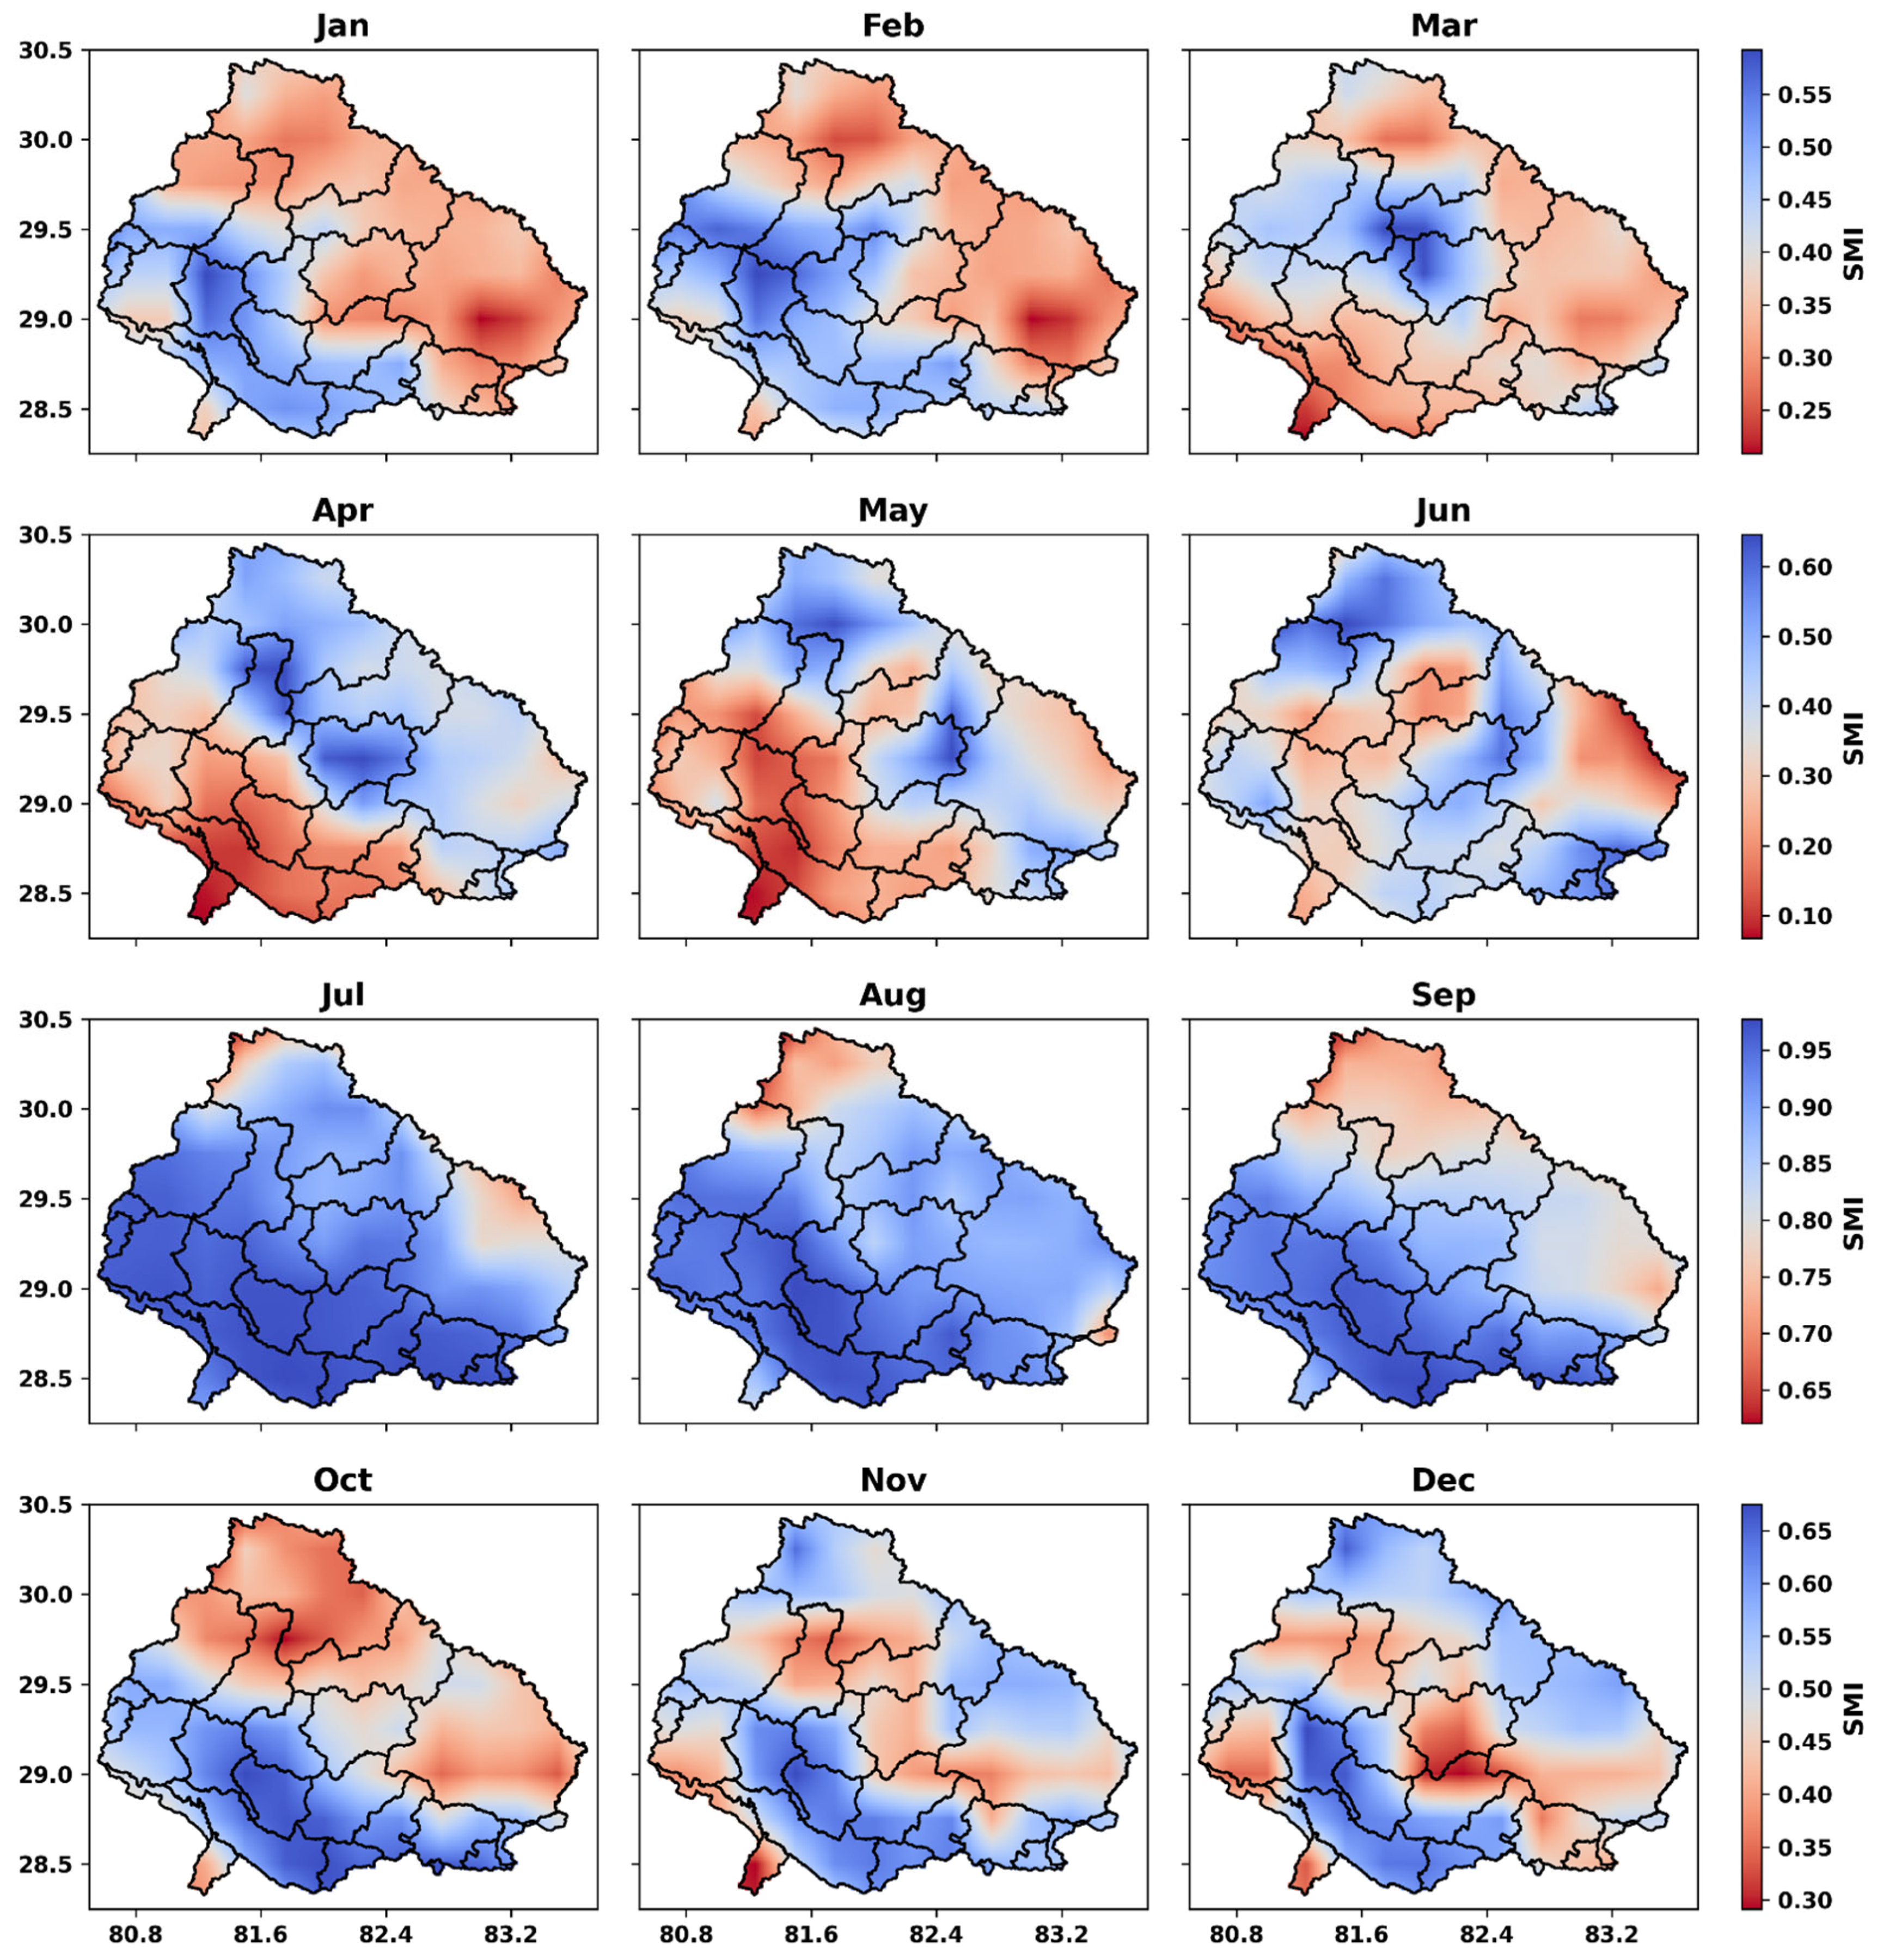
The monthly analysis of the SMI for the period 1995–2024 (Figure 15) shows clear seasonal fluctuations in moisture conditions across the KRB. The lowest mean SMI values are observed in December (0.296) and November (0.316), with minimum values reaching as low as 0.124 and 0.118, respectively. In contrast, the highest monthly mean values occur in August (0.933) and July (0.888), with maximum values reaching up to 0.977 and 0.978. These months also show higher central values, as indicated by median SMI values of 0.944 (August) and 0.930 (July). Standard deviations are lowest in August (0.039), indicating consistent high moisture conditions during the peak monsoon, and highest in May (0.176) and April (0.154), reflecting greater variability in the pre-monsoon period. Across all months, the data exhibit a gradual increase in SMI from March through August, followed by a steady decline toward the dry season.
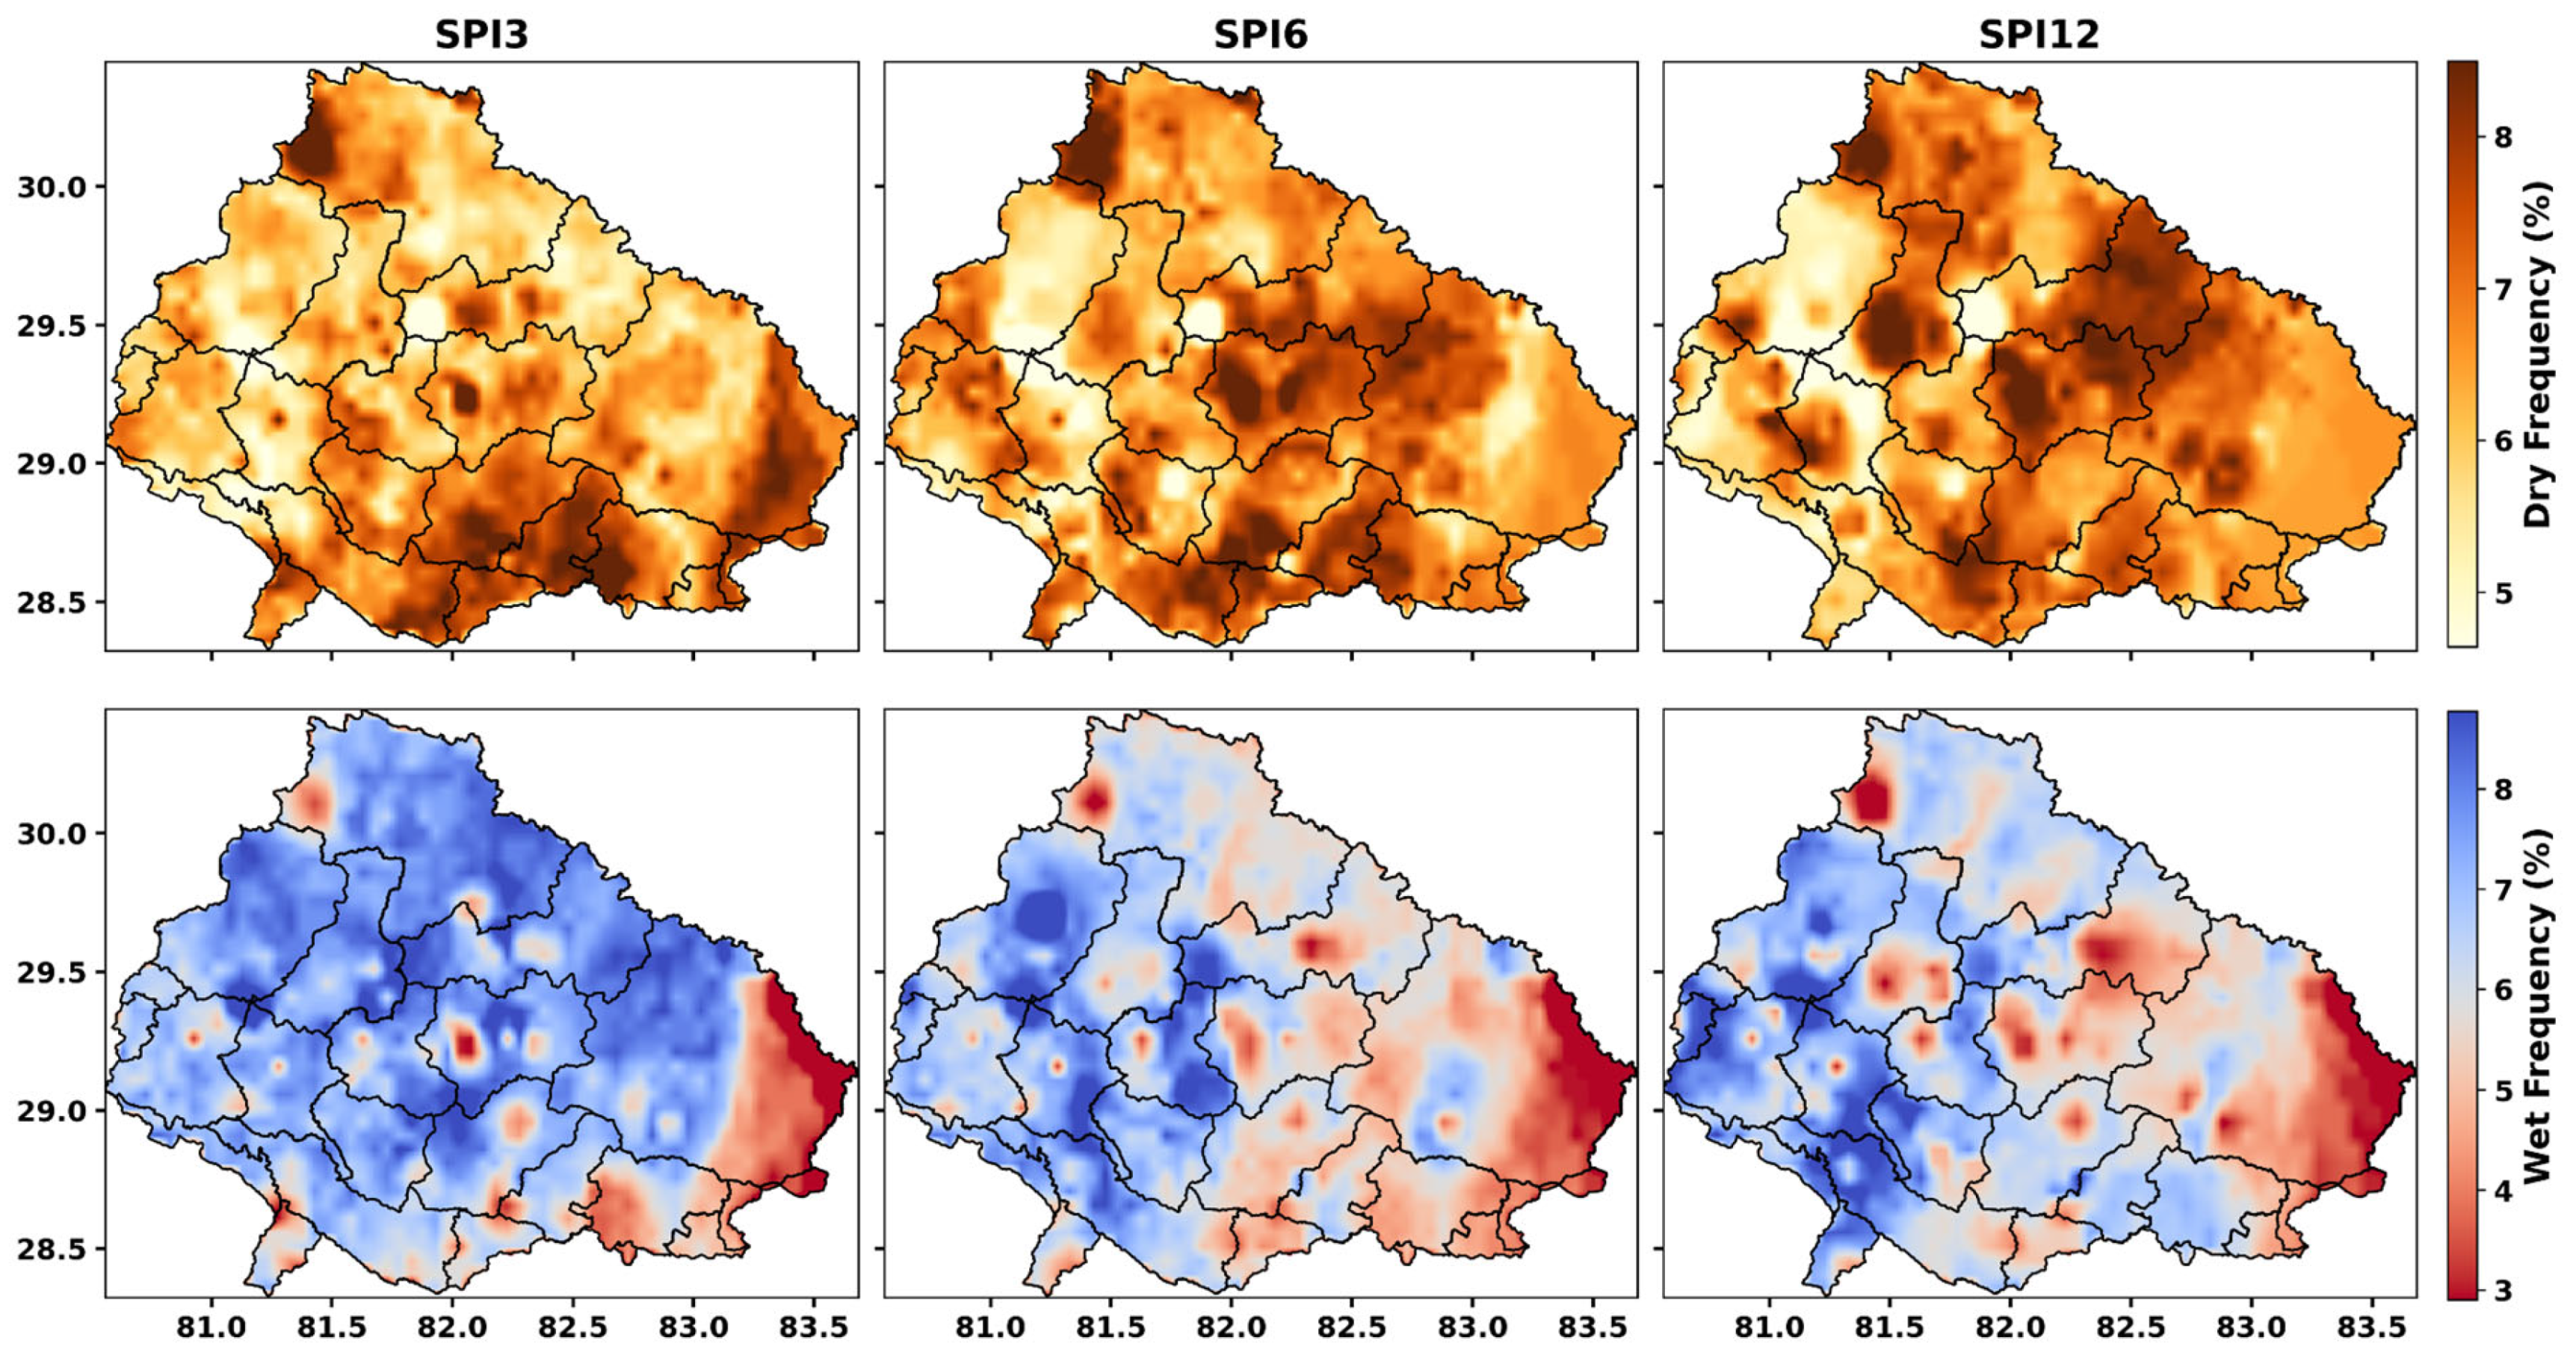
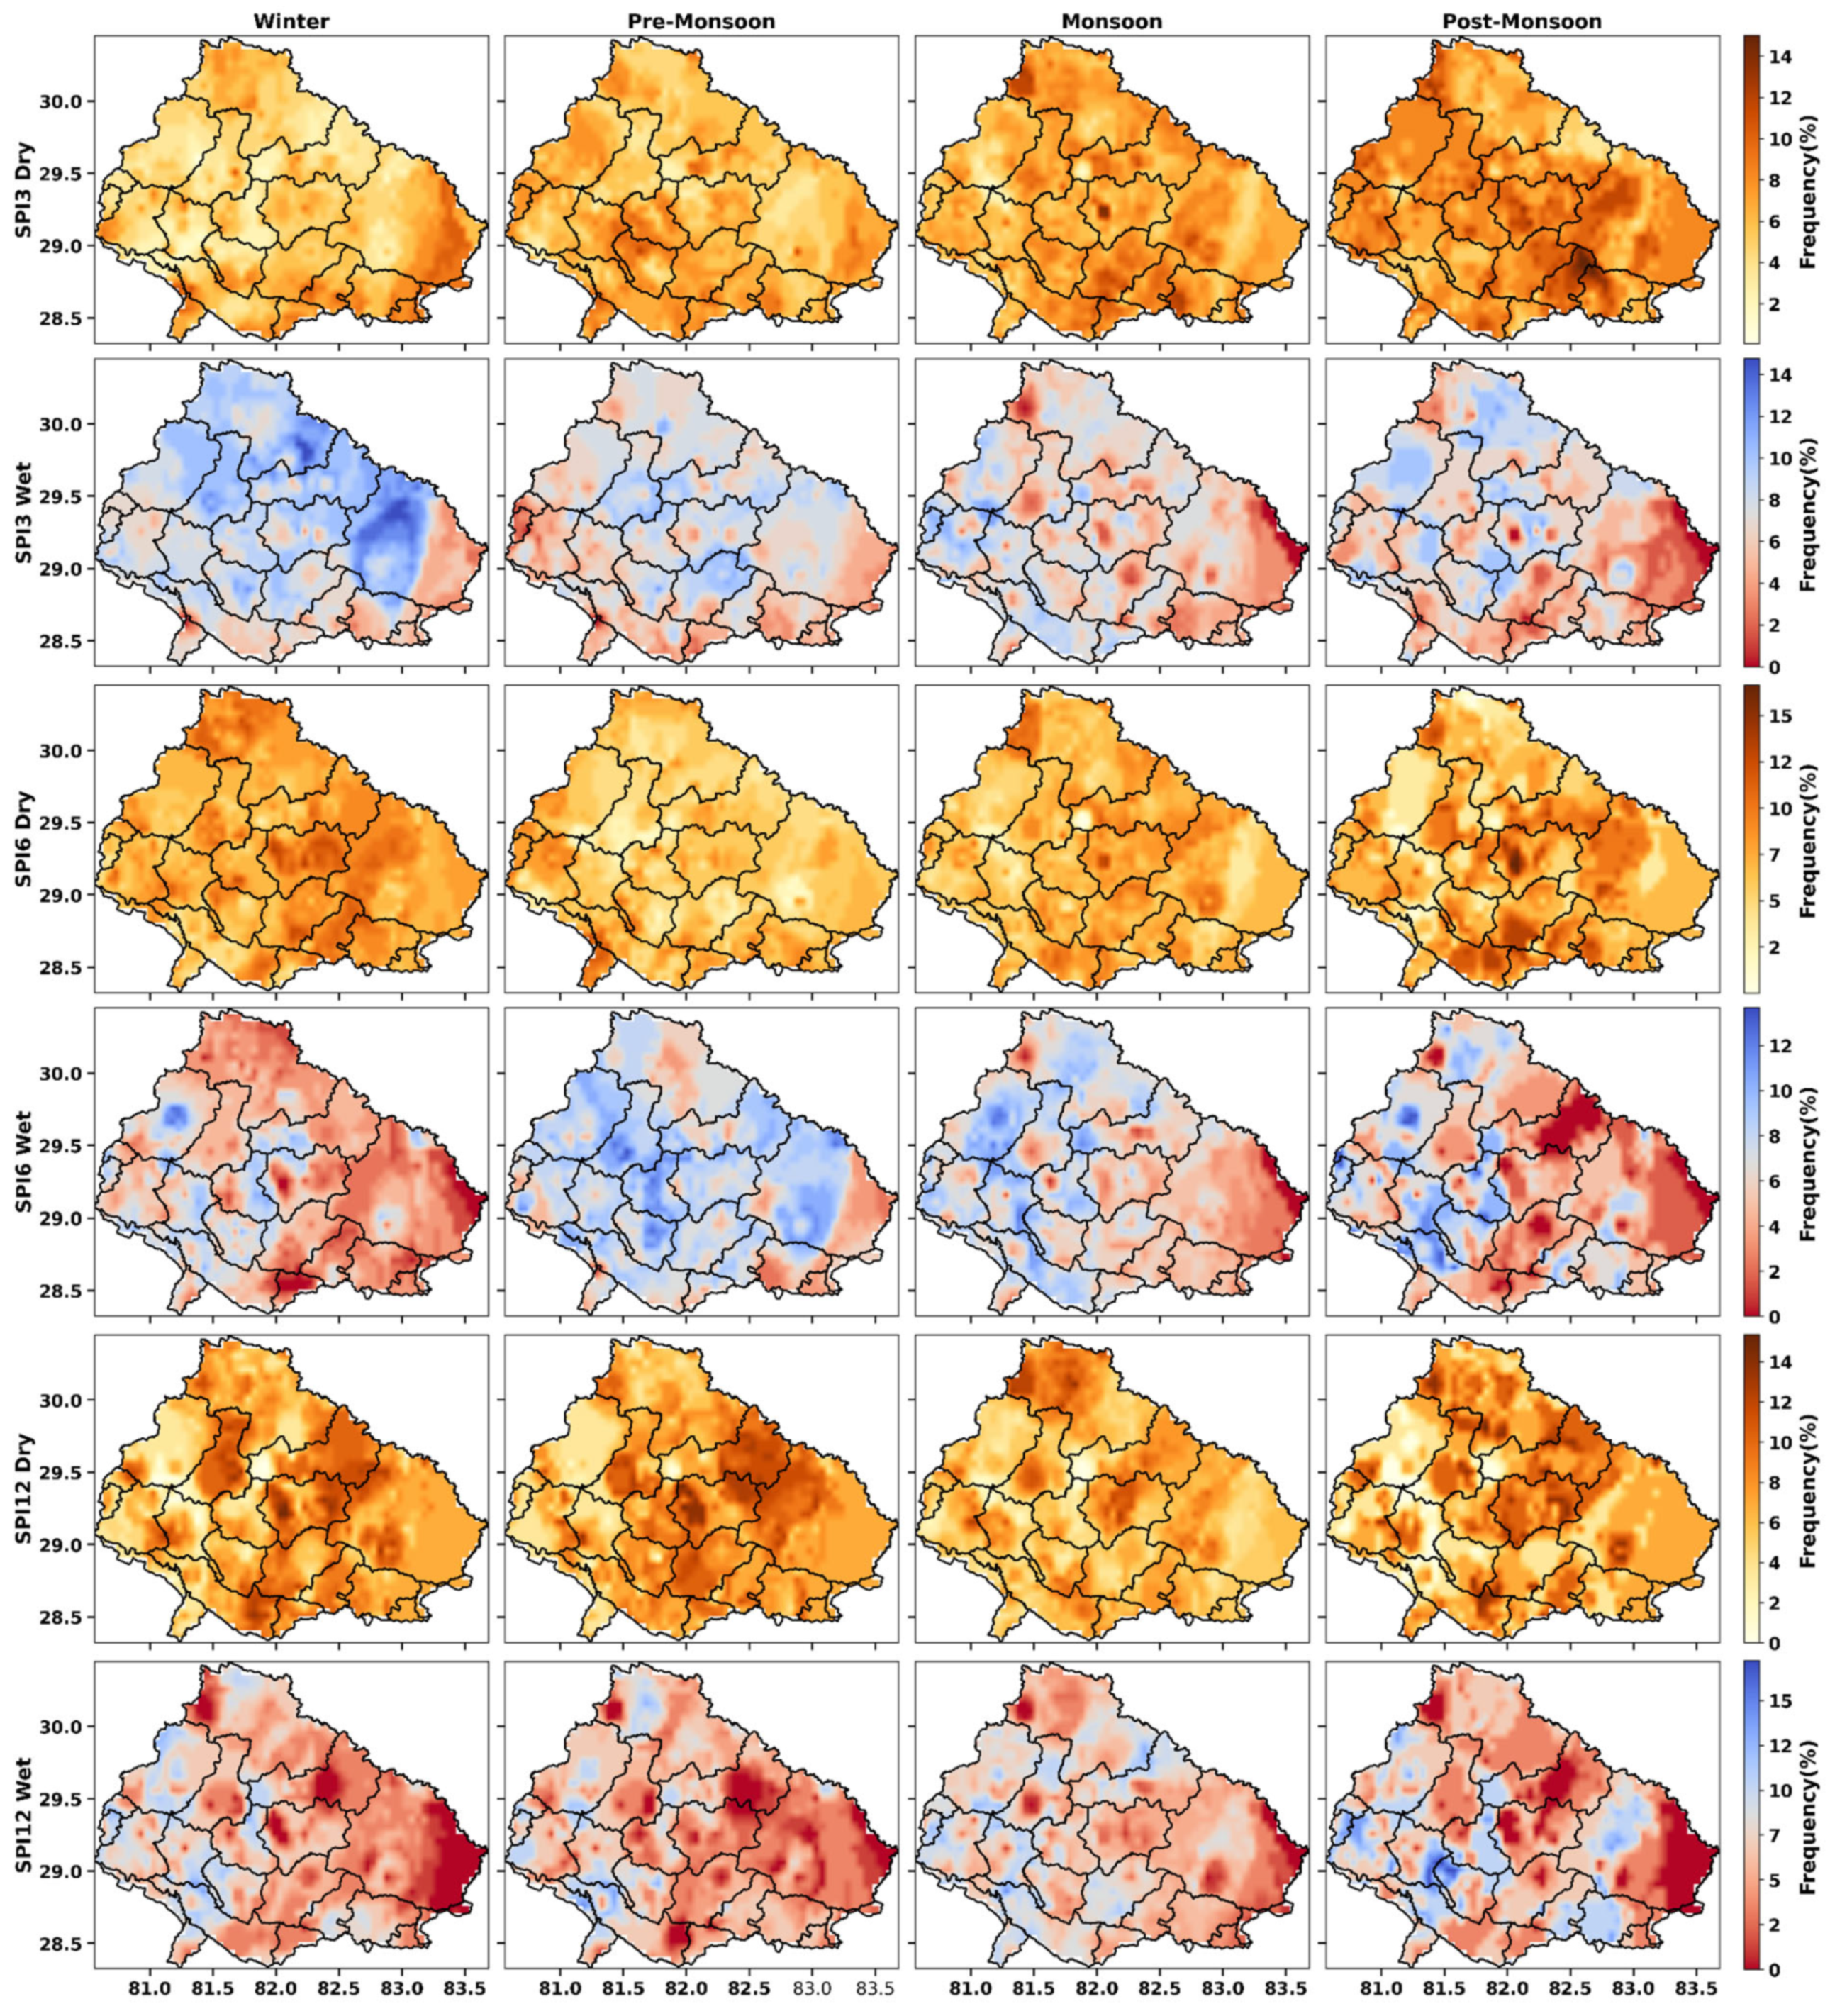
For the spatial analysis of SPI over the KRB, the frequency of drought and wet anomalies was calculated on annual, seasonal, and monthly timescales. The resulting spatial maps (Figure 16, Figure 17 and Figure S1) offer a more accurate representation of the frequency and distribution of dry and wet events across the basin.
The annual SPI drought and wet anomaly frequency analysis reveals that the frequency of extreme events remains relatively low on a yearly scale, typically between 5–7% across the SPI3, SPI6, and SPI12 timescales (Figure 17). For SPI3, the mean drought frequency is 6.43% and wet anomalies 6.87%, with a narrow variability (SD near 1). At longer accumulation periods, variability increases, particularly for SPI12, where dry and wet frequencies reach maximum values of 12.18% and 12.97%, respectively. This indicates that, while annual drought and wet events are not widespread on average, prolonged accumulation periods (SPI12) capture stronger and more spatially extensive anomalies, consistent with the persistence of hydrological drought. The identified hotspots at SPI12 (with >12% frequency) highlight localized regions where drought and wet anomalies recur most frequently, underscoring their importance for water management.
The seasonal analysis reveals stronger intra-annual contrasts in drought and wet anomaly frequencies (Figure 17). In SPI3, dry anomalies are most frequent during the post-monsoon season (mean 7.91%), while wet anomalies peak in winter (mean 8.48%). SPI6 shows elevated drought frequencies in winter (mean 7.84%), whereas wet anomalies are more common in the pre-monsoon (mean 7.51%). For SPI12, both drought and wet anomalies display broader variability, with post-monsoon and winter seasons recording mean dry frequencies of around 7% and wet frequencies occasionally exceeding 6%. Importantly, variability (standard deviation) increases at longer timescales, reaching up to 3.36 for wet anomalies in SPI12 post-monsoon. These findings suggest that drought and wet episodes exhibit clear seasonal dependency, with monsoon and post-monsoon conditions being particularly prone to extremes, while pre-monsoon and winter tend to capture more short-lived wet anomalies.
At the monthly scale, detailed statistics highlight peak drought and wet frequencies that are masked at broader temporal aggregations. In SPI3, November emerges as the driest month (8.35% mean drought frequency), while December is the wettest (10.66% mean wet frequency). For SPI6, drought conditions peak in February (8.38%) and wet anomalies in April (8.90%), consistent with early spring variability. SPI12 shows similar patterns, with February again recording the highest drought frequency (7.47%) and July emerging as the wettest month (6.97%), aligning with the monsoon onset. The monthly anomaly frequency spatial maps (Figure S1) are provided in the Supplementary Materials.

4.5. Categorical Classification of Drought

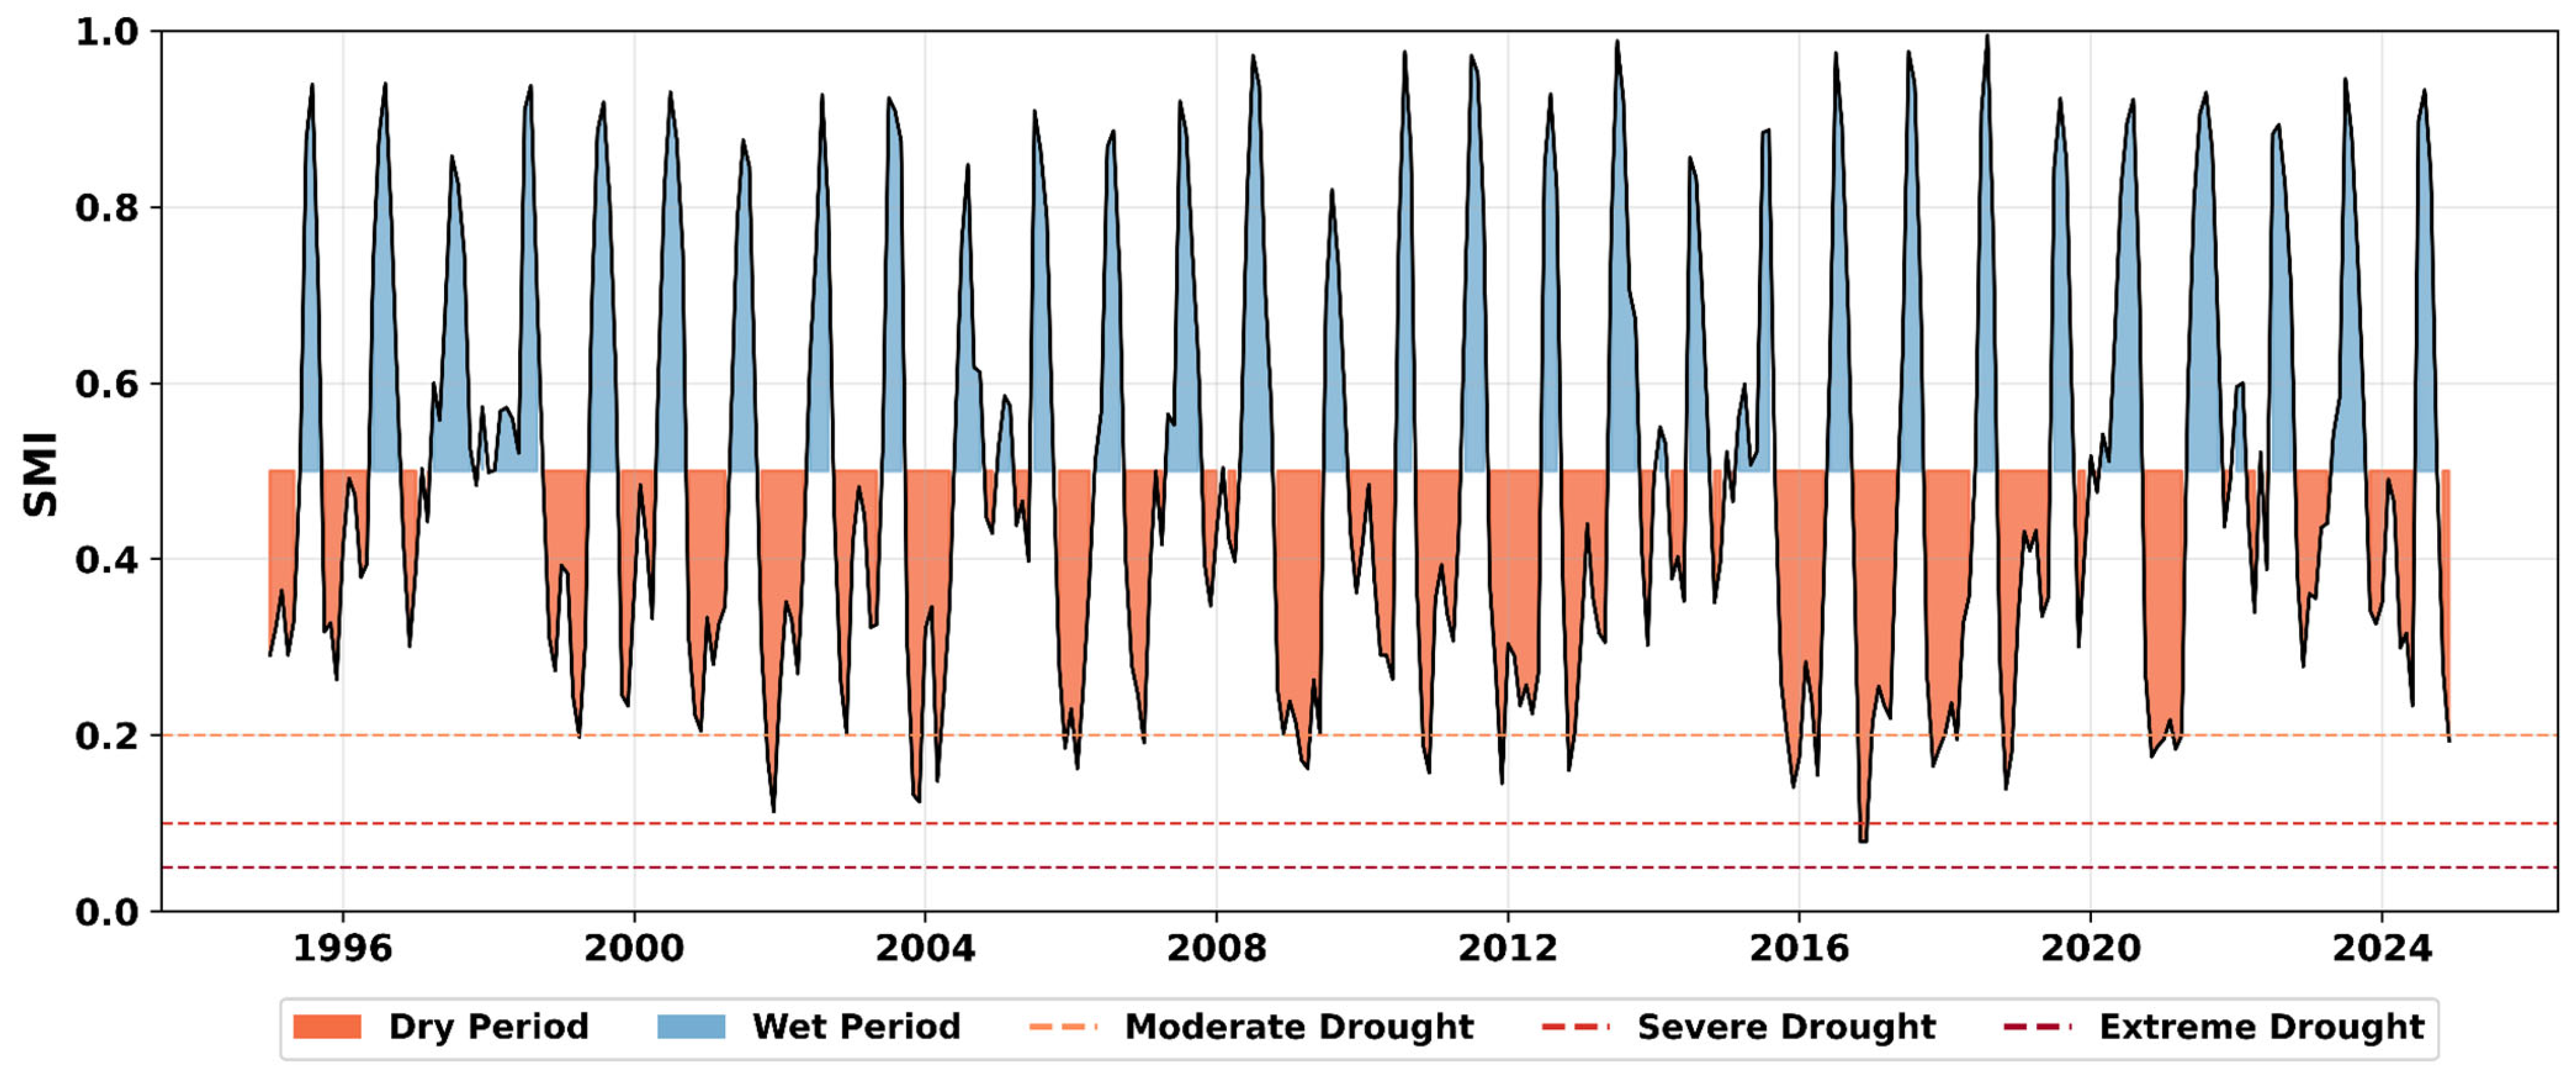
The category-based analysis of the monthly SMI for the KRB, as shown in Figure 18, suggests that the basin’s soil moisture regime from 1995 to 2024 is predominantly characterized by near-normal to mildly dry conditions. The mean (0.501) and the slightly lower median (0.443) indicate overall normal conditions of moisture in the basin, though slightly leaning towards the drier side of the normal on the percentile-based SMI scale. The mild drought category was the most frequent among others, occurring in 34.2% of months, followed by near-normal conditions at 26.7%. Wetter-than-normal conditions comprised approximately 19% of the recorded data. Severe drought was observed in only 0.6% of months, and no instances of extreme drought were observed, suggesting that while mild deficits are common, prolonged severe soil moisture stress is rarely encountered. Conversely, extremely wet months (2.2%) and severely wet months (6.1%) indicate that significant wet anomalies do occur occasionally. This distribution illustrates that soil moisture variability is primarily influenced by short-term deficits and surpluses, without persistent extreme drought conditions.
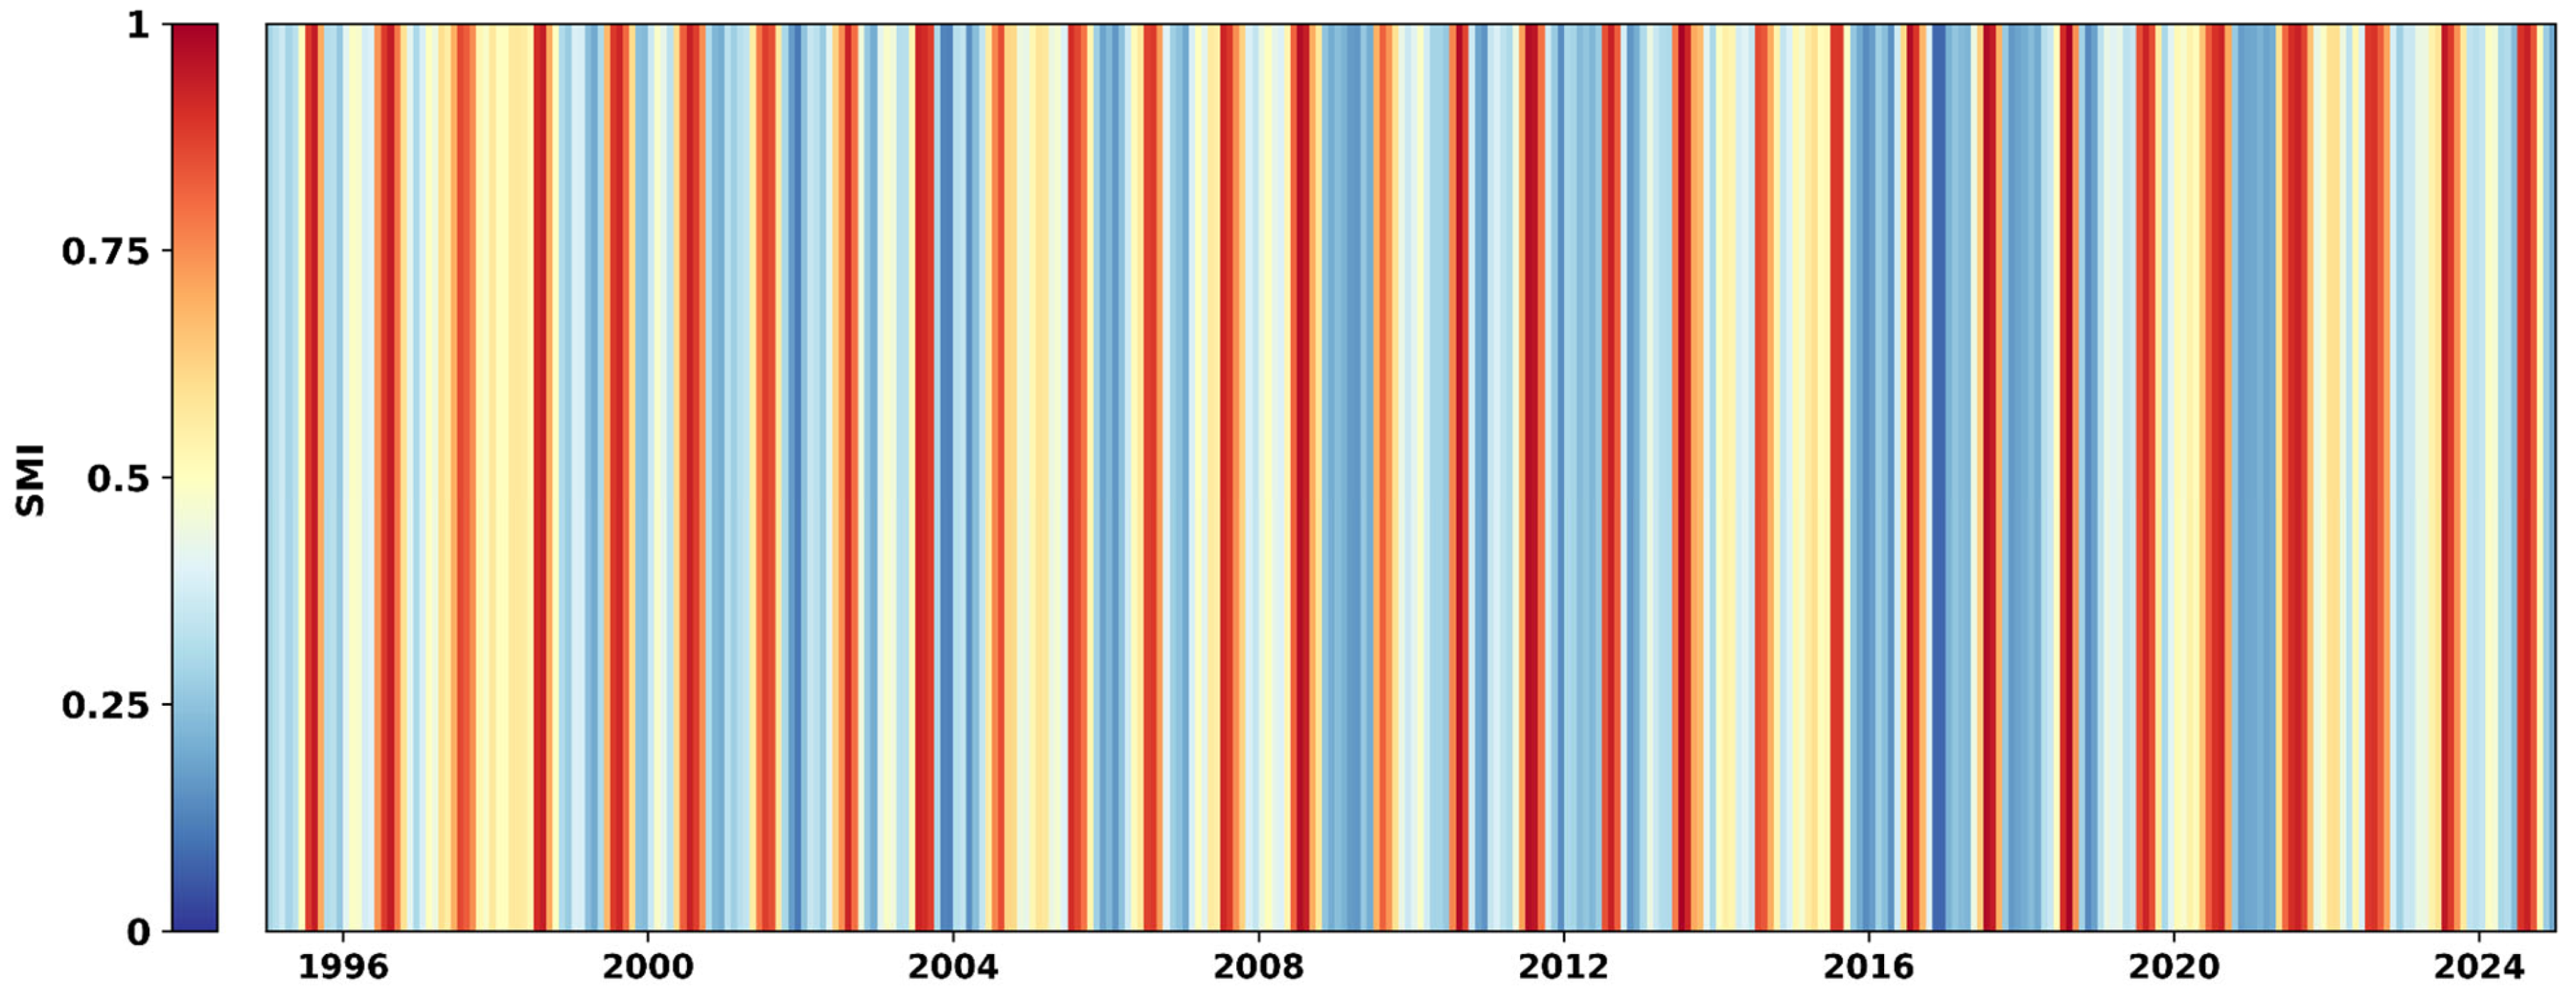
The monthly SMI percentile score heatmap (Figure 19) further explains these trends by highlighting the temporal progression of dry and wet anomalies. Statistical properties support this distribution, with values ranging from a minimum of 0.079 to a maximum of 0.995, thereby covering nearly the entire theoretical range of the percentile-based index. The standard deviation of 0.245 underscores the considerable fluctuations observed across years, as well as the transitions between strongly negative (dry) and strongly positive (wet) anomalies. Overall, the heatmap emphasizes the significant impact of monsoonal rainfall, with distinct wet phases resulting in extremely high SMI values, while extended non-monsoon periods typically exhibit mild to moderate droughts, reflecting the basin’s sensitivity to seasonal hydrological dynamics.
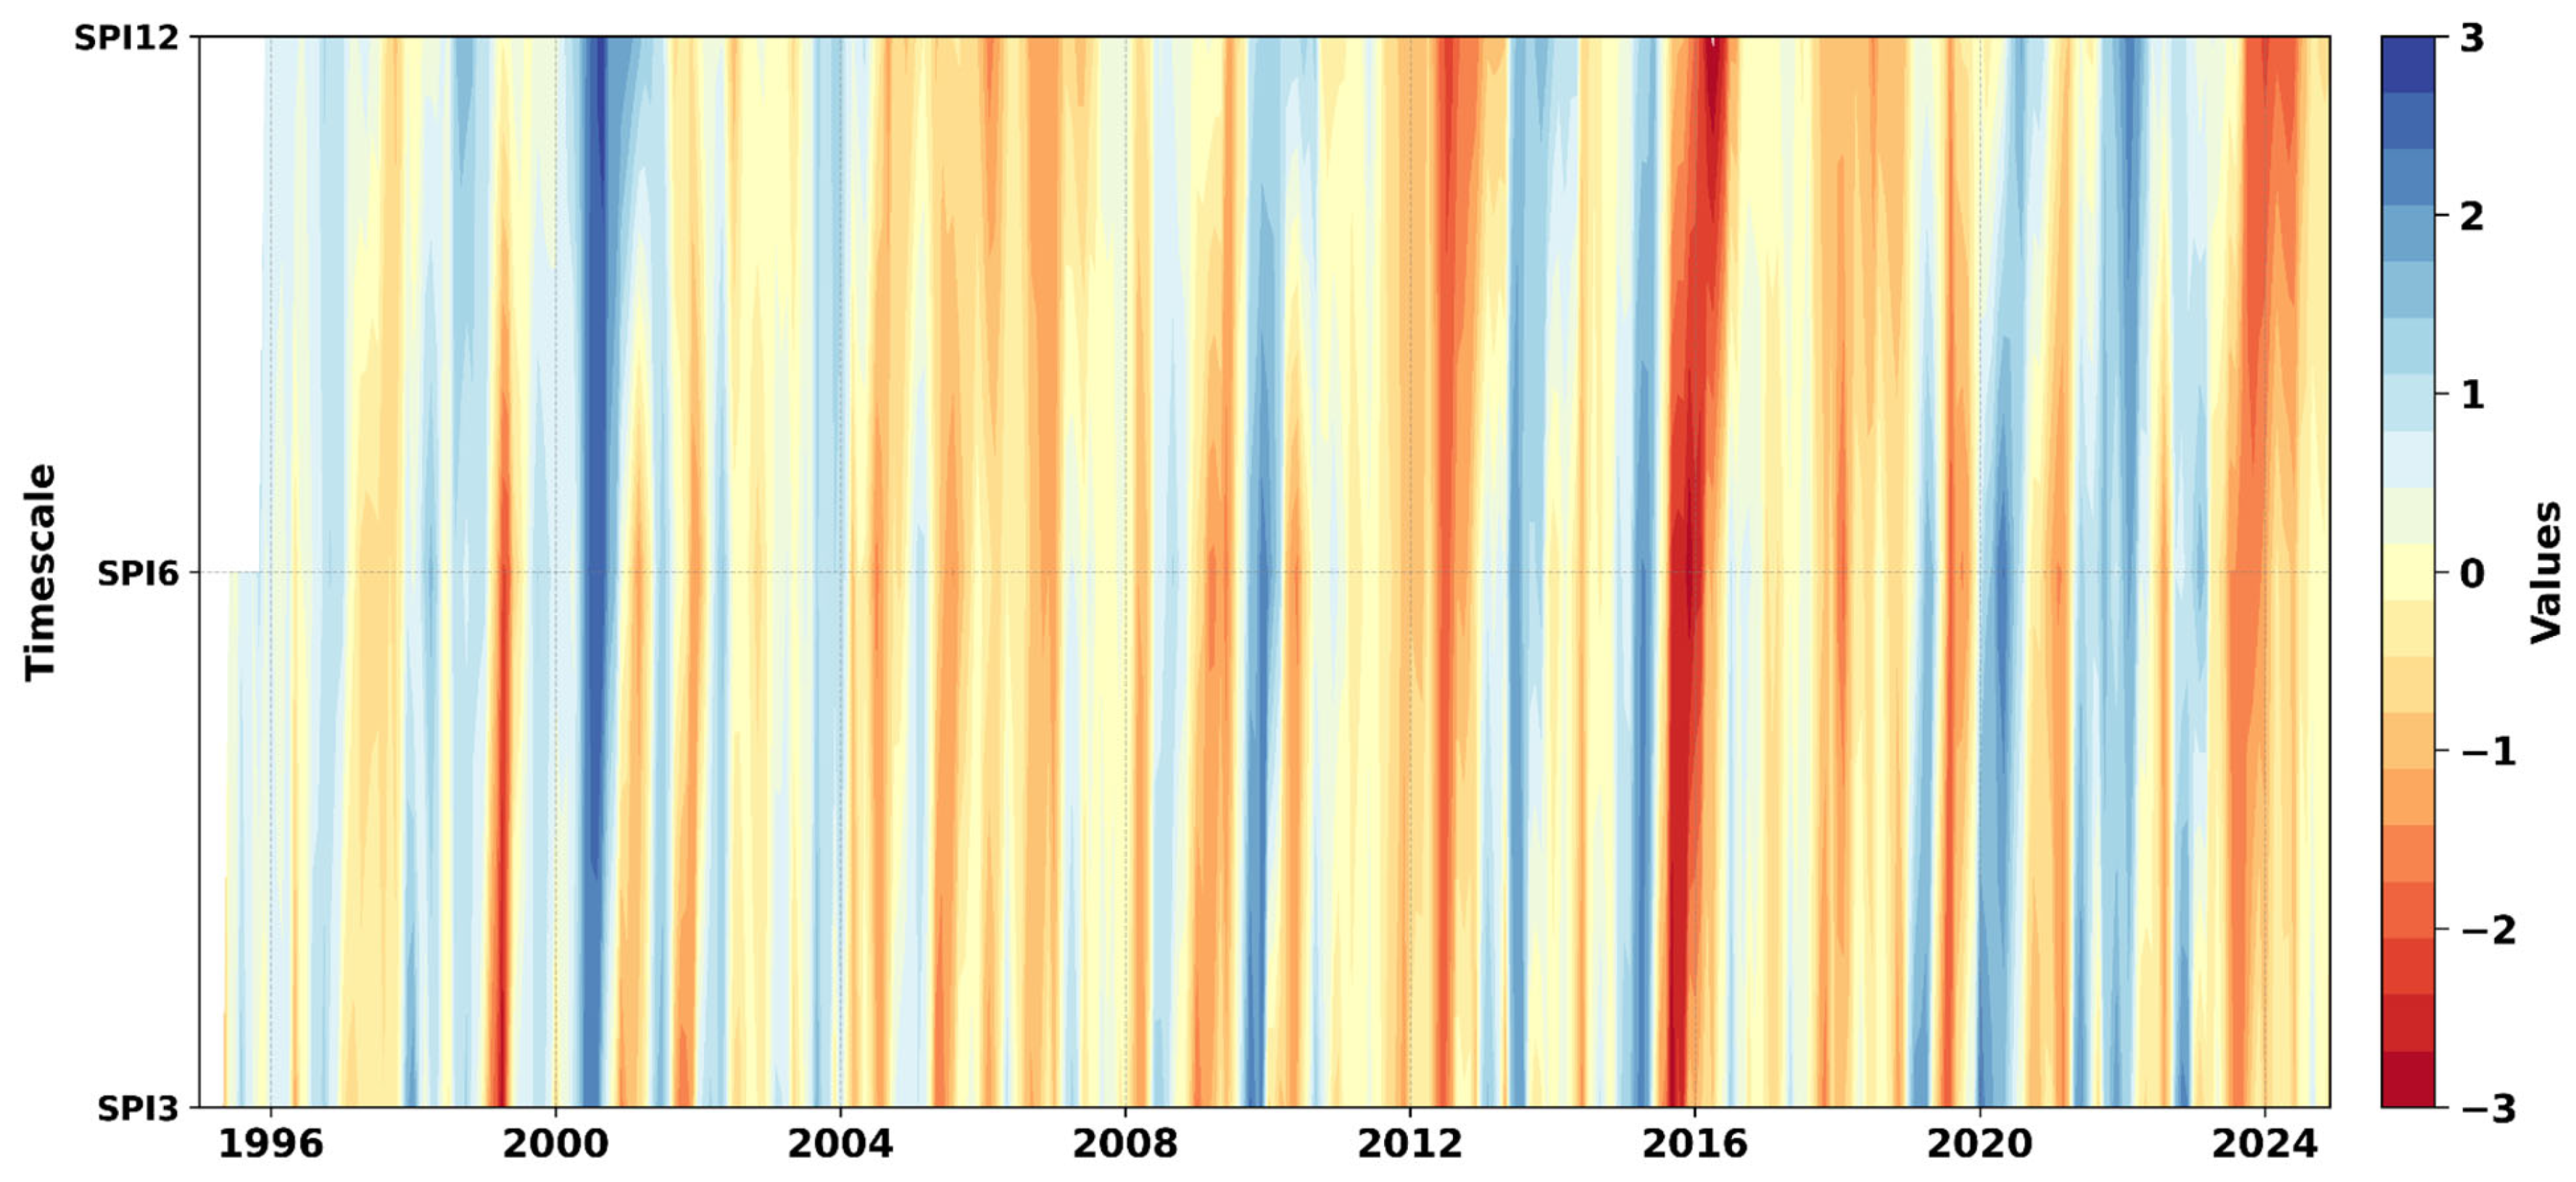
The SPI heatmap (Figure 20) highlights alternating wet and dry phases, with notable severe droughts around 2000, 2016, and 2023, consistent across multiple timescales, suggesting periods of sustained hydroclimatic stress. Overall, these results indicate that both short- and long-term precipitation anomalies contribute to the occurrence of drought and wet events in the region, with long-term SPI capturing more extreme but less frequent anomalies.
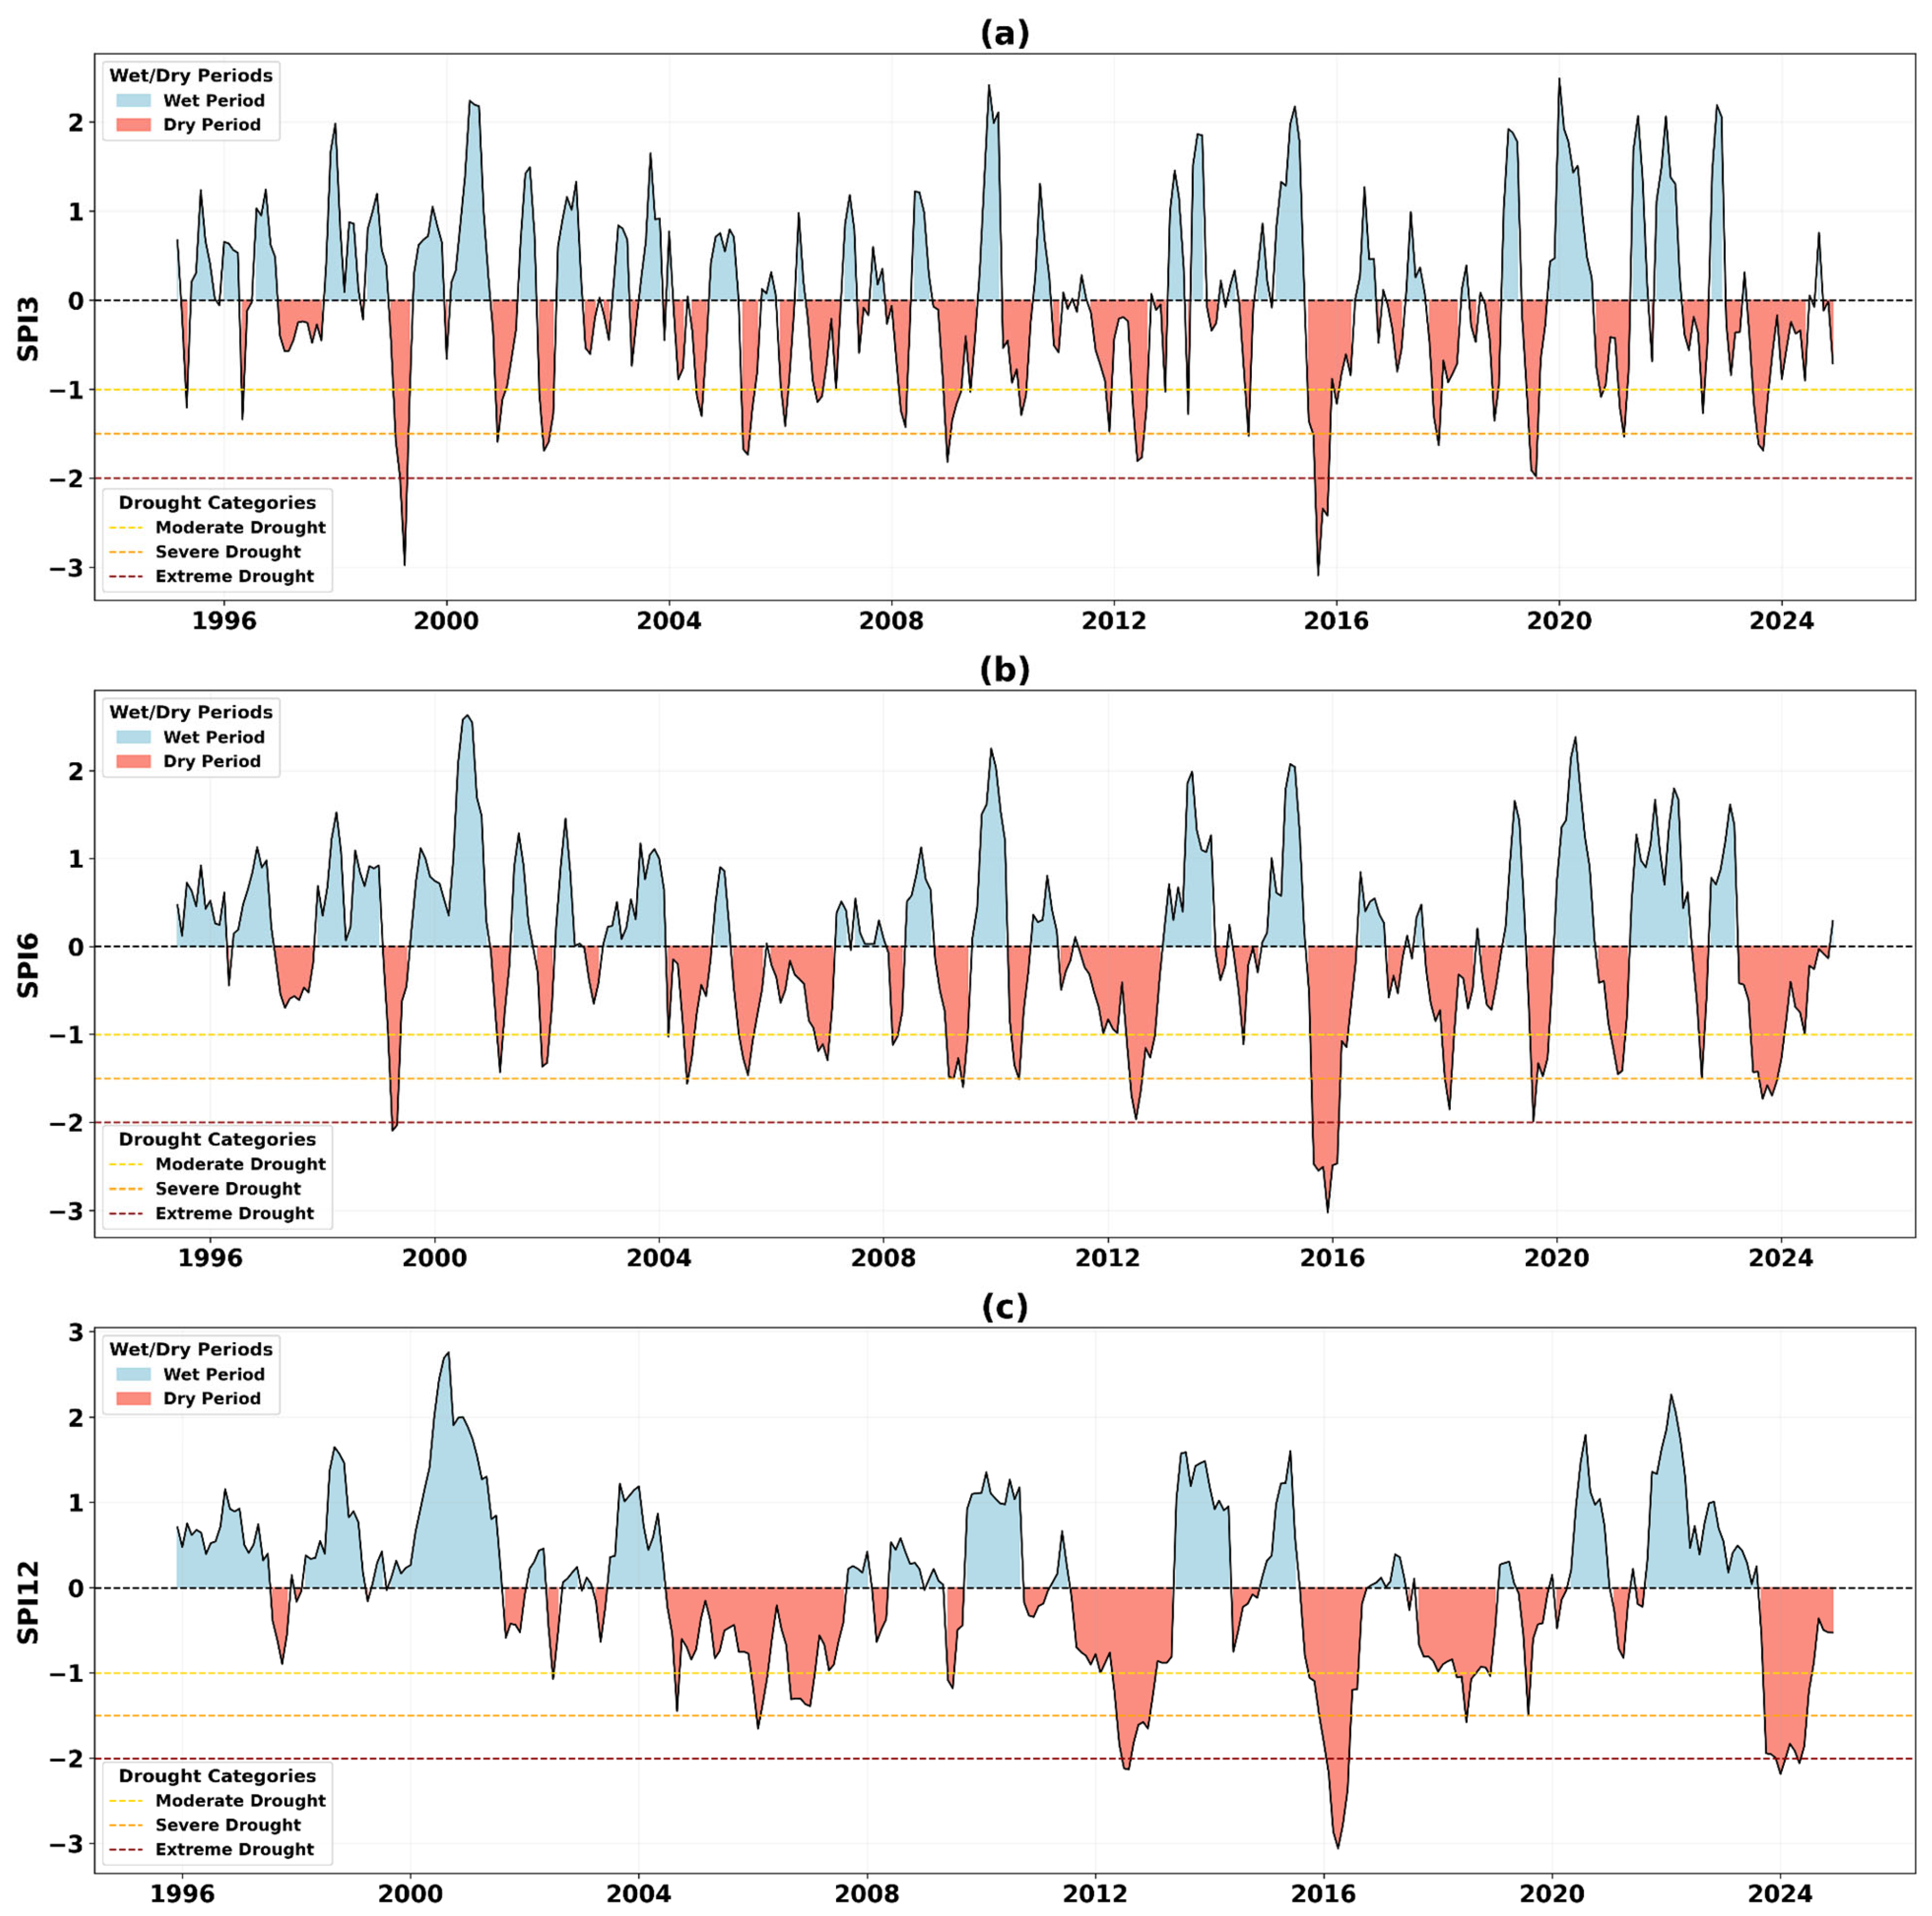
The temporal analysis of standardized precipitation indices (SPI) at 3, 6, and 12-month timescales (Figure 21a–c) reveals distinct patterns of drought and wet conditions over the study period. SPI3, representing short-term precipitation variability, shows a mean near zero with a standard deviation of 1.0, indicating a generally balanced precipitation regime. Droughts (SPI < −1) occurred in 16.2% of months, with extreme droughts (SPI < −2) observed in 1.12% of months, while wet conditions (SPI > 1) were present in 15.6% of months and extreme wet events (SPI > 2) in 3.1%. At intermediate timescales (SPI6), the proportion of extreme drought months slightly increased to 2.25%, whereas wet events decreased marginally. Long-term precipitation variability (SPI12) shows fewer moderate drought months (14.6%) but a higher incidence of extreme droughts (2.87%), reflecting accumulated deficits over the year.

4.6. Meteorological and Agricultural Composites

4.6.1. Principal Component Analysis (PCA)

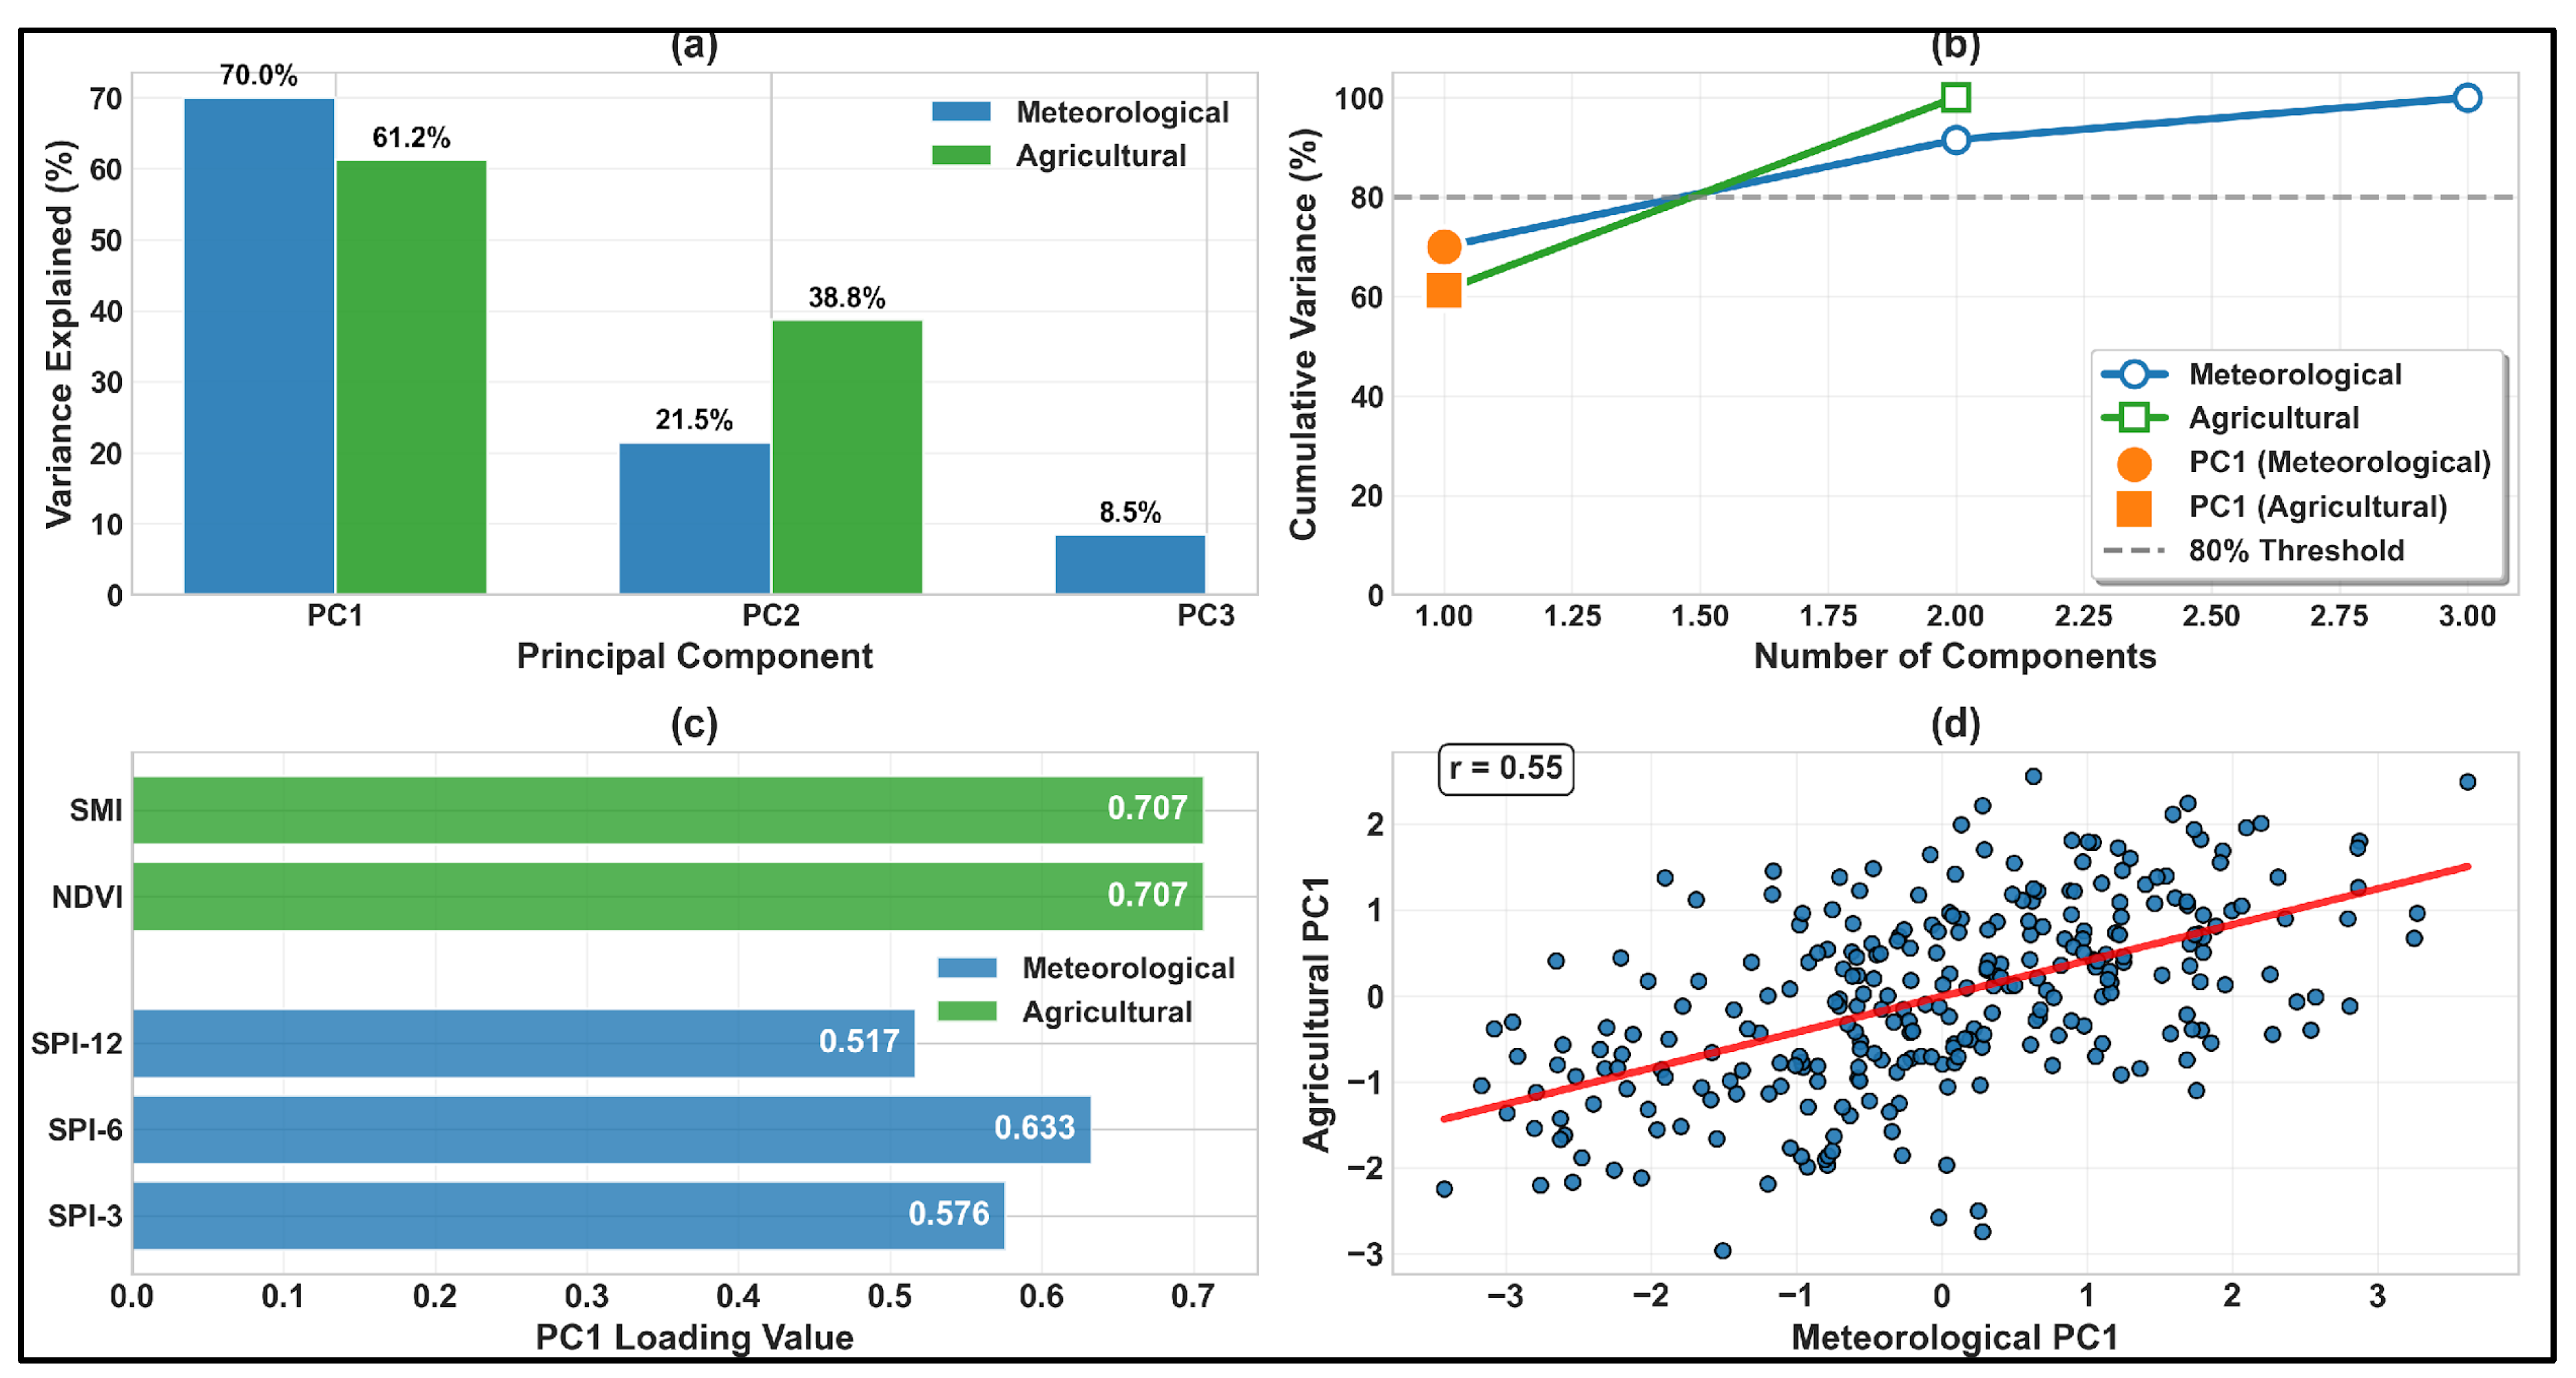
For the basin-average SPI, a single dominant principal component (PC1) was identified by the PCA. This component accounts for 70.0 percent of the total variance; therefore, this component is in a position to represent most of the information contained in the three Standardized Precipitation Index (SPI) variables, as shown in Figure 22a. In Figure 22b, the cumulative variance plot, PC1 alone captures 70.0 percent of the variance, and a further addition of PC2 and PC3 captures a cumulative total of approximately 99.8 percent, meaning that a high level of information is represented by only three components. Likewise, PCA of the lag-adjusted agricultural data also provided one dominant component. Agricultural PC1 accounts for 61.2 percent of the total variance (Figure 22a). This component, though with a slightly reduced percentage than its meteorological counterpart, still contributes a large majority of the variance in the NDVI and SMI data.
The loadings plot (Figure 22c) further indicates that PC1 has strong positive loadings of all three variables of the SPI (SPI3 = 0.576, SPI6 = 0.633, SPI12 = 0.517). This level of collinearity indicates that the three variables are very correlated among themselves, and they are the primary contributors to the same component. This positive correlation of strong values demonstrates that the meteorological PC1 could be viewed as a composite index that shows the general wetness or dryness situation at different time scales. Similarly, NDVI and SMI both showed equal positive loadings (0.707) in the agricultural composite. This result indicates that the agricultural PC1 represents a coherent drought signal where both vegetation health and soil moisture respond consistently to drought conditions. This confirms that periods of vegetation stress coincide with soil moisture deficits, providing a unified agricultural drought signal across the KRB.
The time series of both meteorological and agricultural PC1s were compared to assess their co-variability. The scatter plot in Figure 22d shows a positive correlation between the two composite indices, with a correlation coefficient (r) of 0.55. This moderate-to-strong positive relationship indicates that periods of meteorological drought (low values of meteorological PC1) are generally associated with agricultural drought conditions (low values of agricultural PC1), and vice versa for wet periods.

4.6.2. Lag Analysis

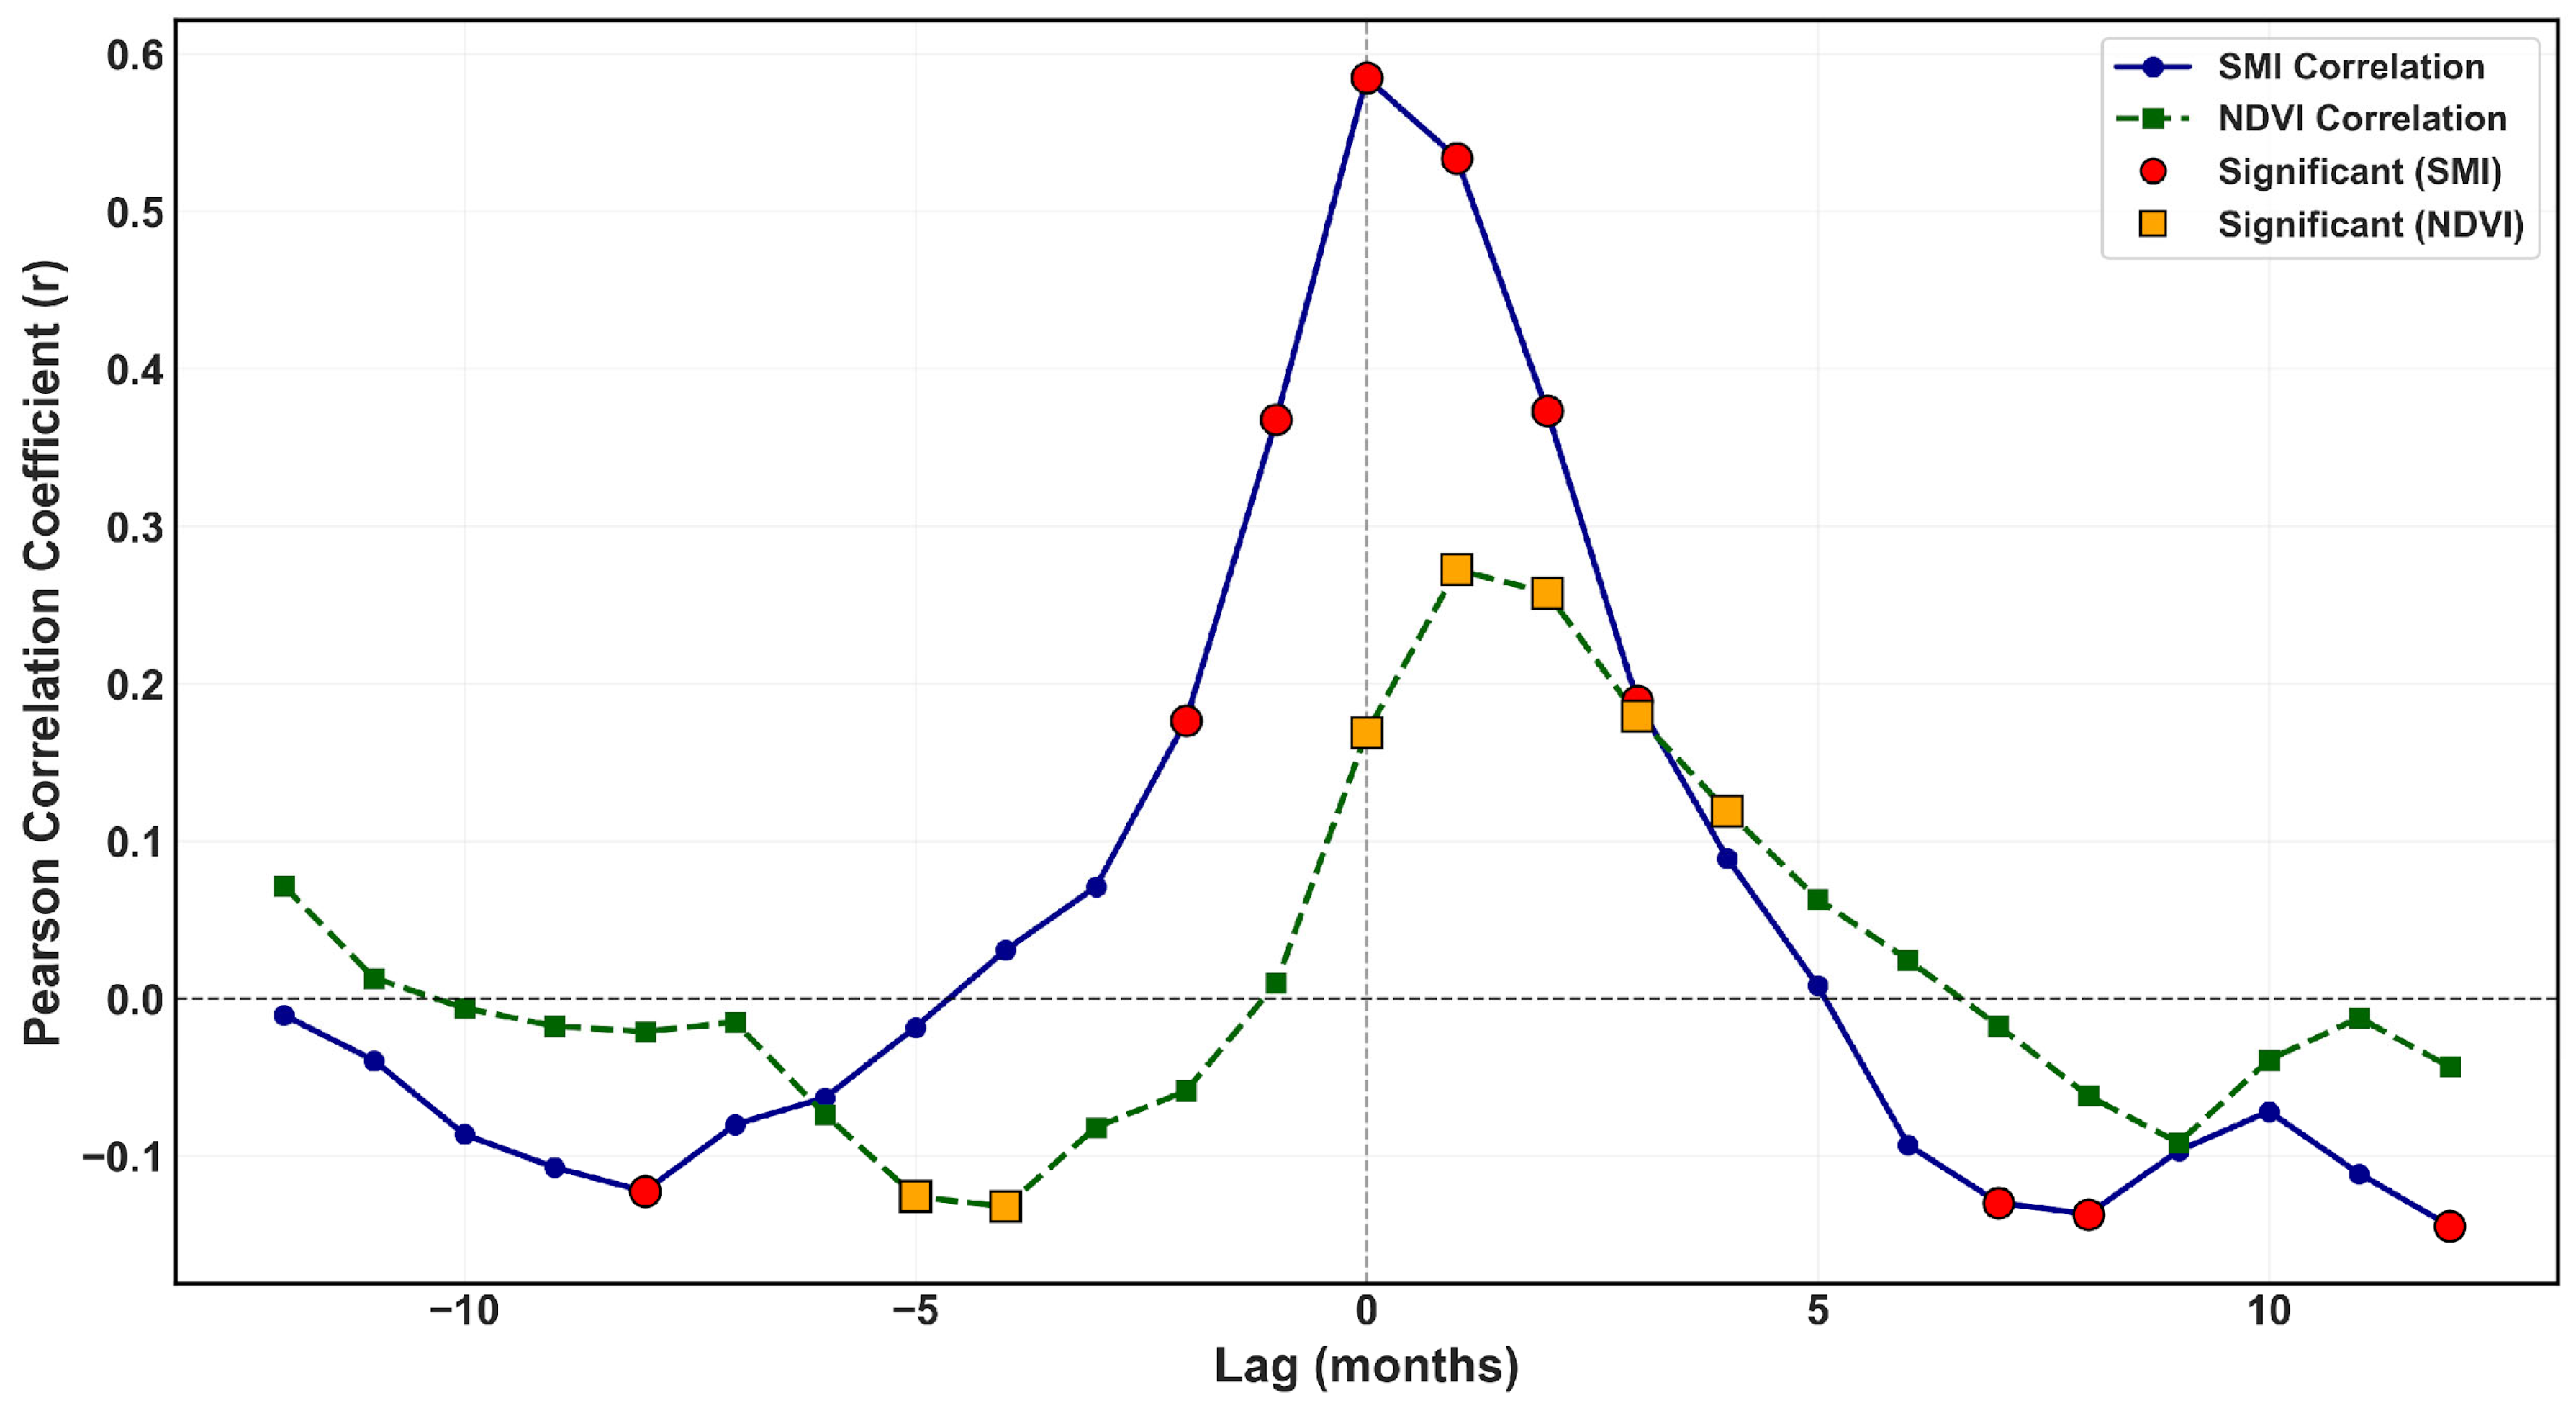
The lag correlation analysis (Figure 23) highlights differences in how soil moisture and vegetation respond to meteorological drought conditions. The meteorological composite and SMI exhibit the highest correlation at 0-month lag, confirming an immediate response of soil moisture to precipitation anomalies. In contrast, the correlation between the meteorological composite and NDVI peaks at a 1-month lag, demonstrating a delayed vegetation response. This indicates that while soil moisture tracks rainfall deficits almost instantaneously, vegetation stress emerges after a short lag, reflecting both physiological delay and possible buffering by soil moisture availability.

4.6.3. The Composite Correlation

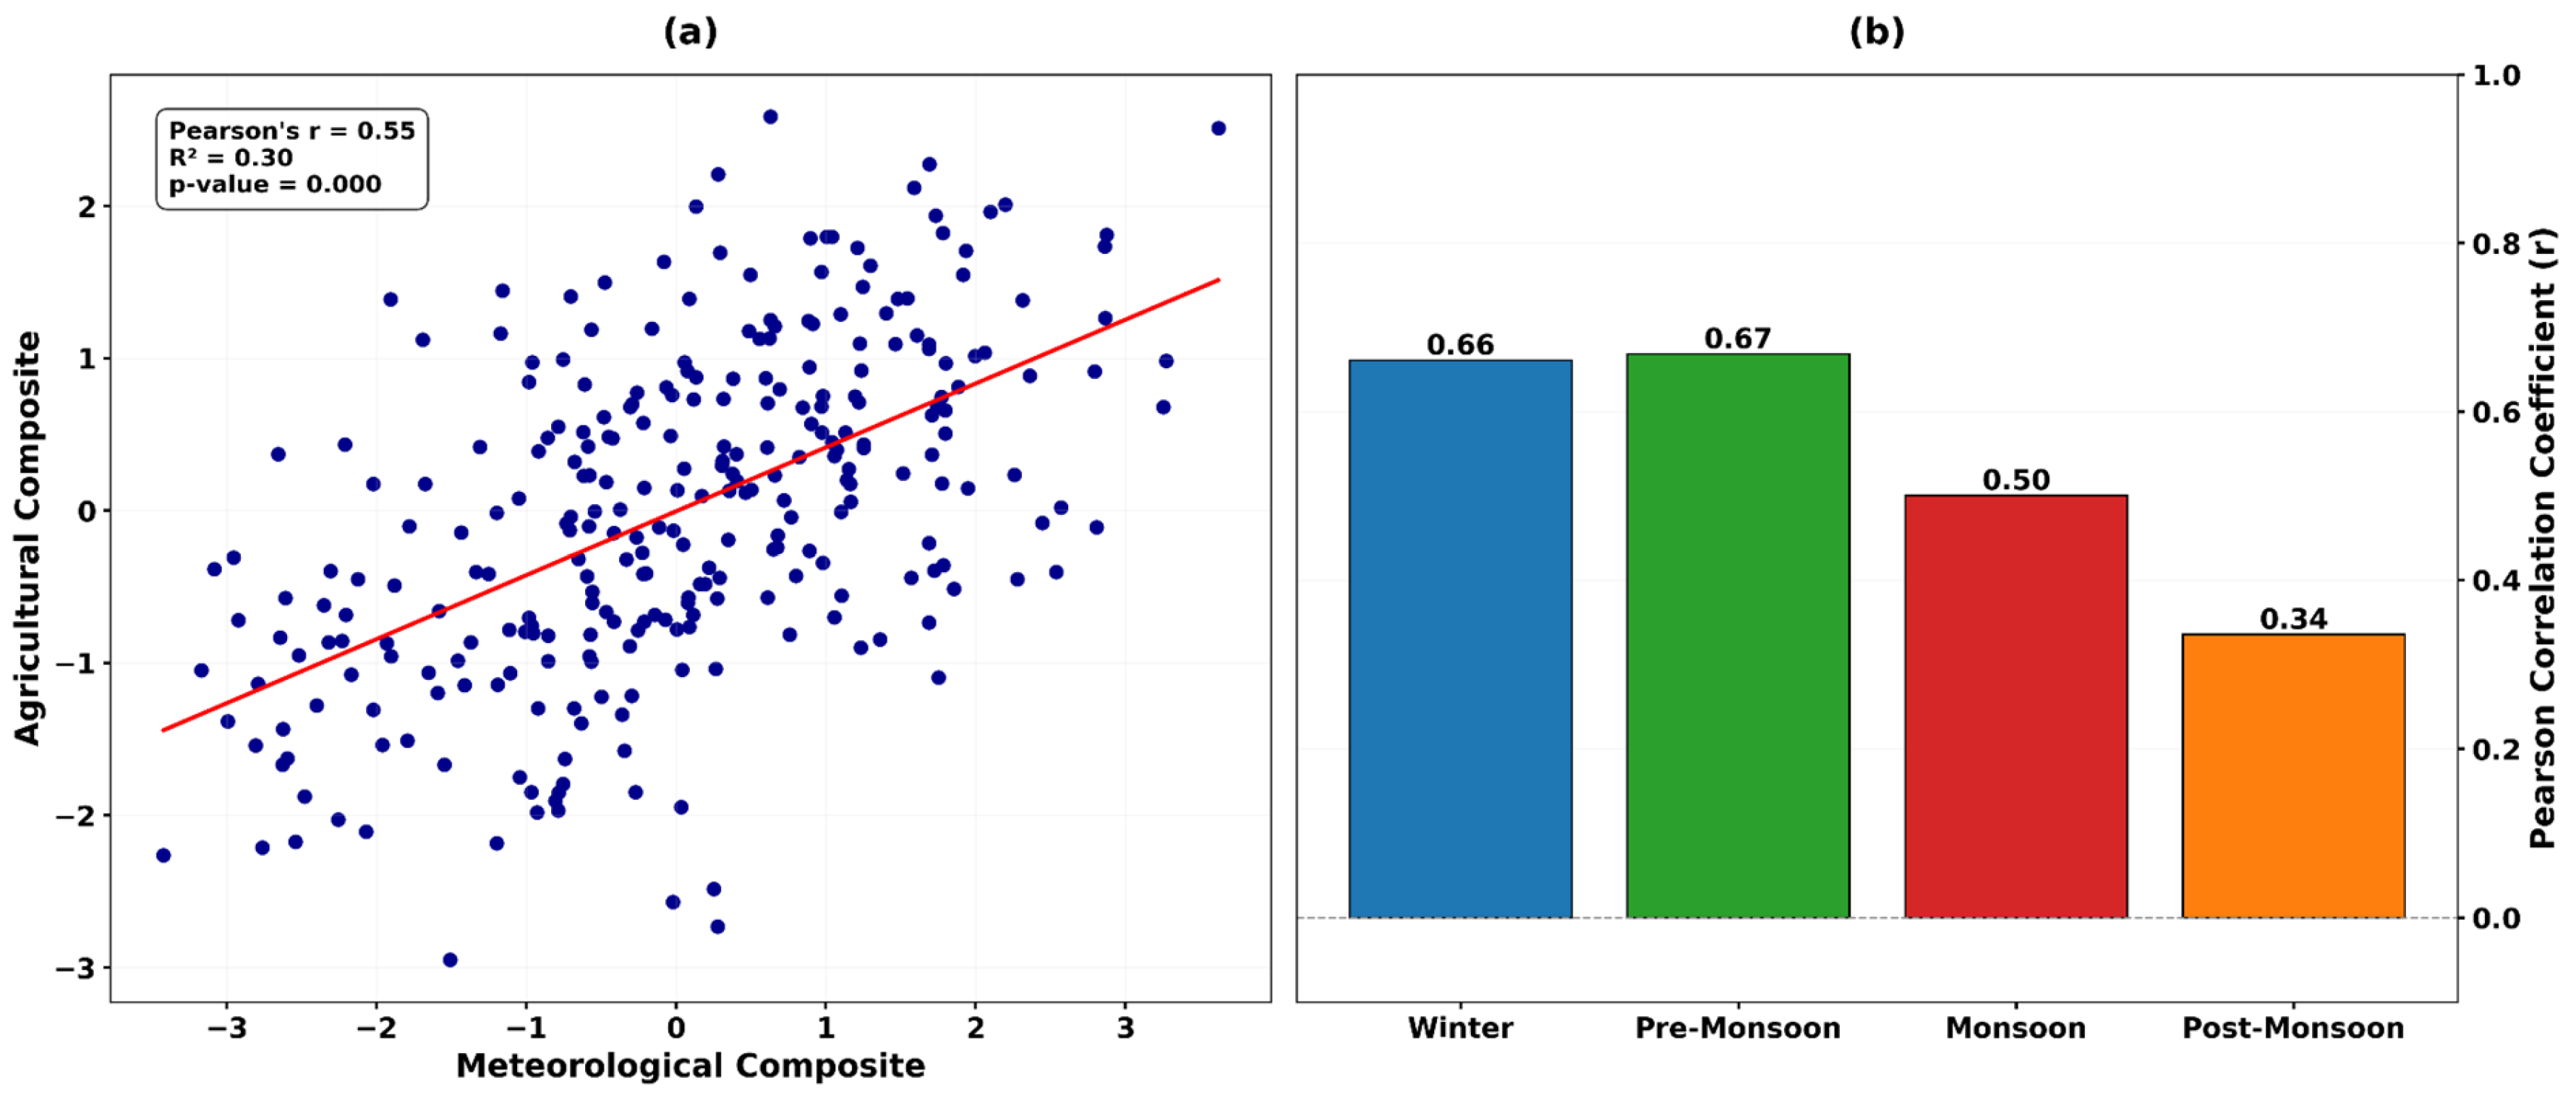
The scatter plots (Figure 24a) show a moderate but significant relationship between the meteorological composite and the lag-adjusted agricultural composite (r = 0.55, p < 0.05, R2 = 0.30). This suggests that about one-third of agricultural drought variability can be explained by meteorological anomalies after considering lag effects. The seasonal breakdown (Figure 24b) demonstrates clear differences in coupling strength: pre-monsoon (r = 0.67) and winter (r = 0.66) show the strongest relationships, while the link weakens during the monsoon (r = 0.50) and post-monsoon (r = 0.34) seasons. These results suggest that agricultural and ecological drought are most sensitive to meteorological drought during typically water-stressed seasons (pre-monsoon, winter).

4.6.4. Time Series and Categorical Comparison

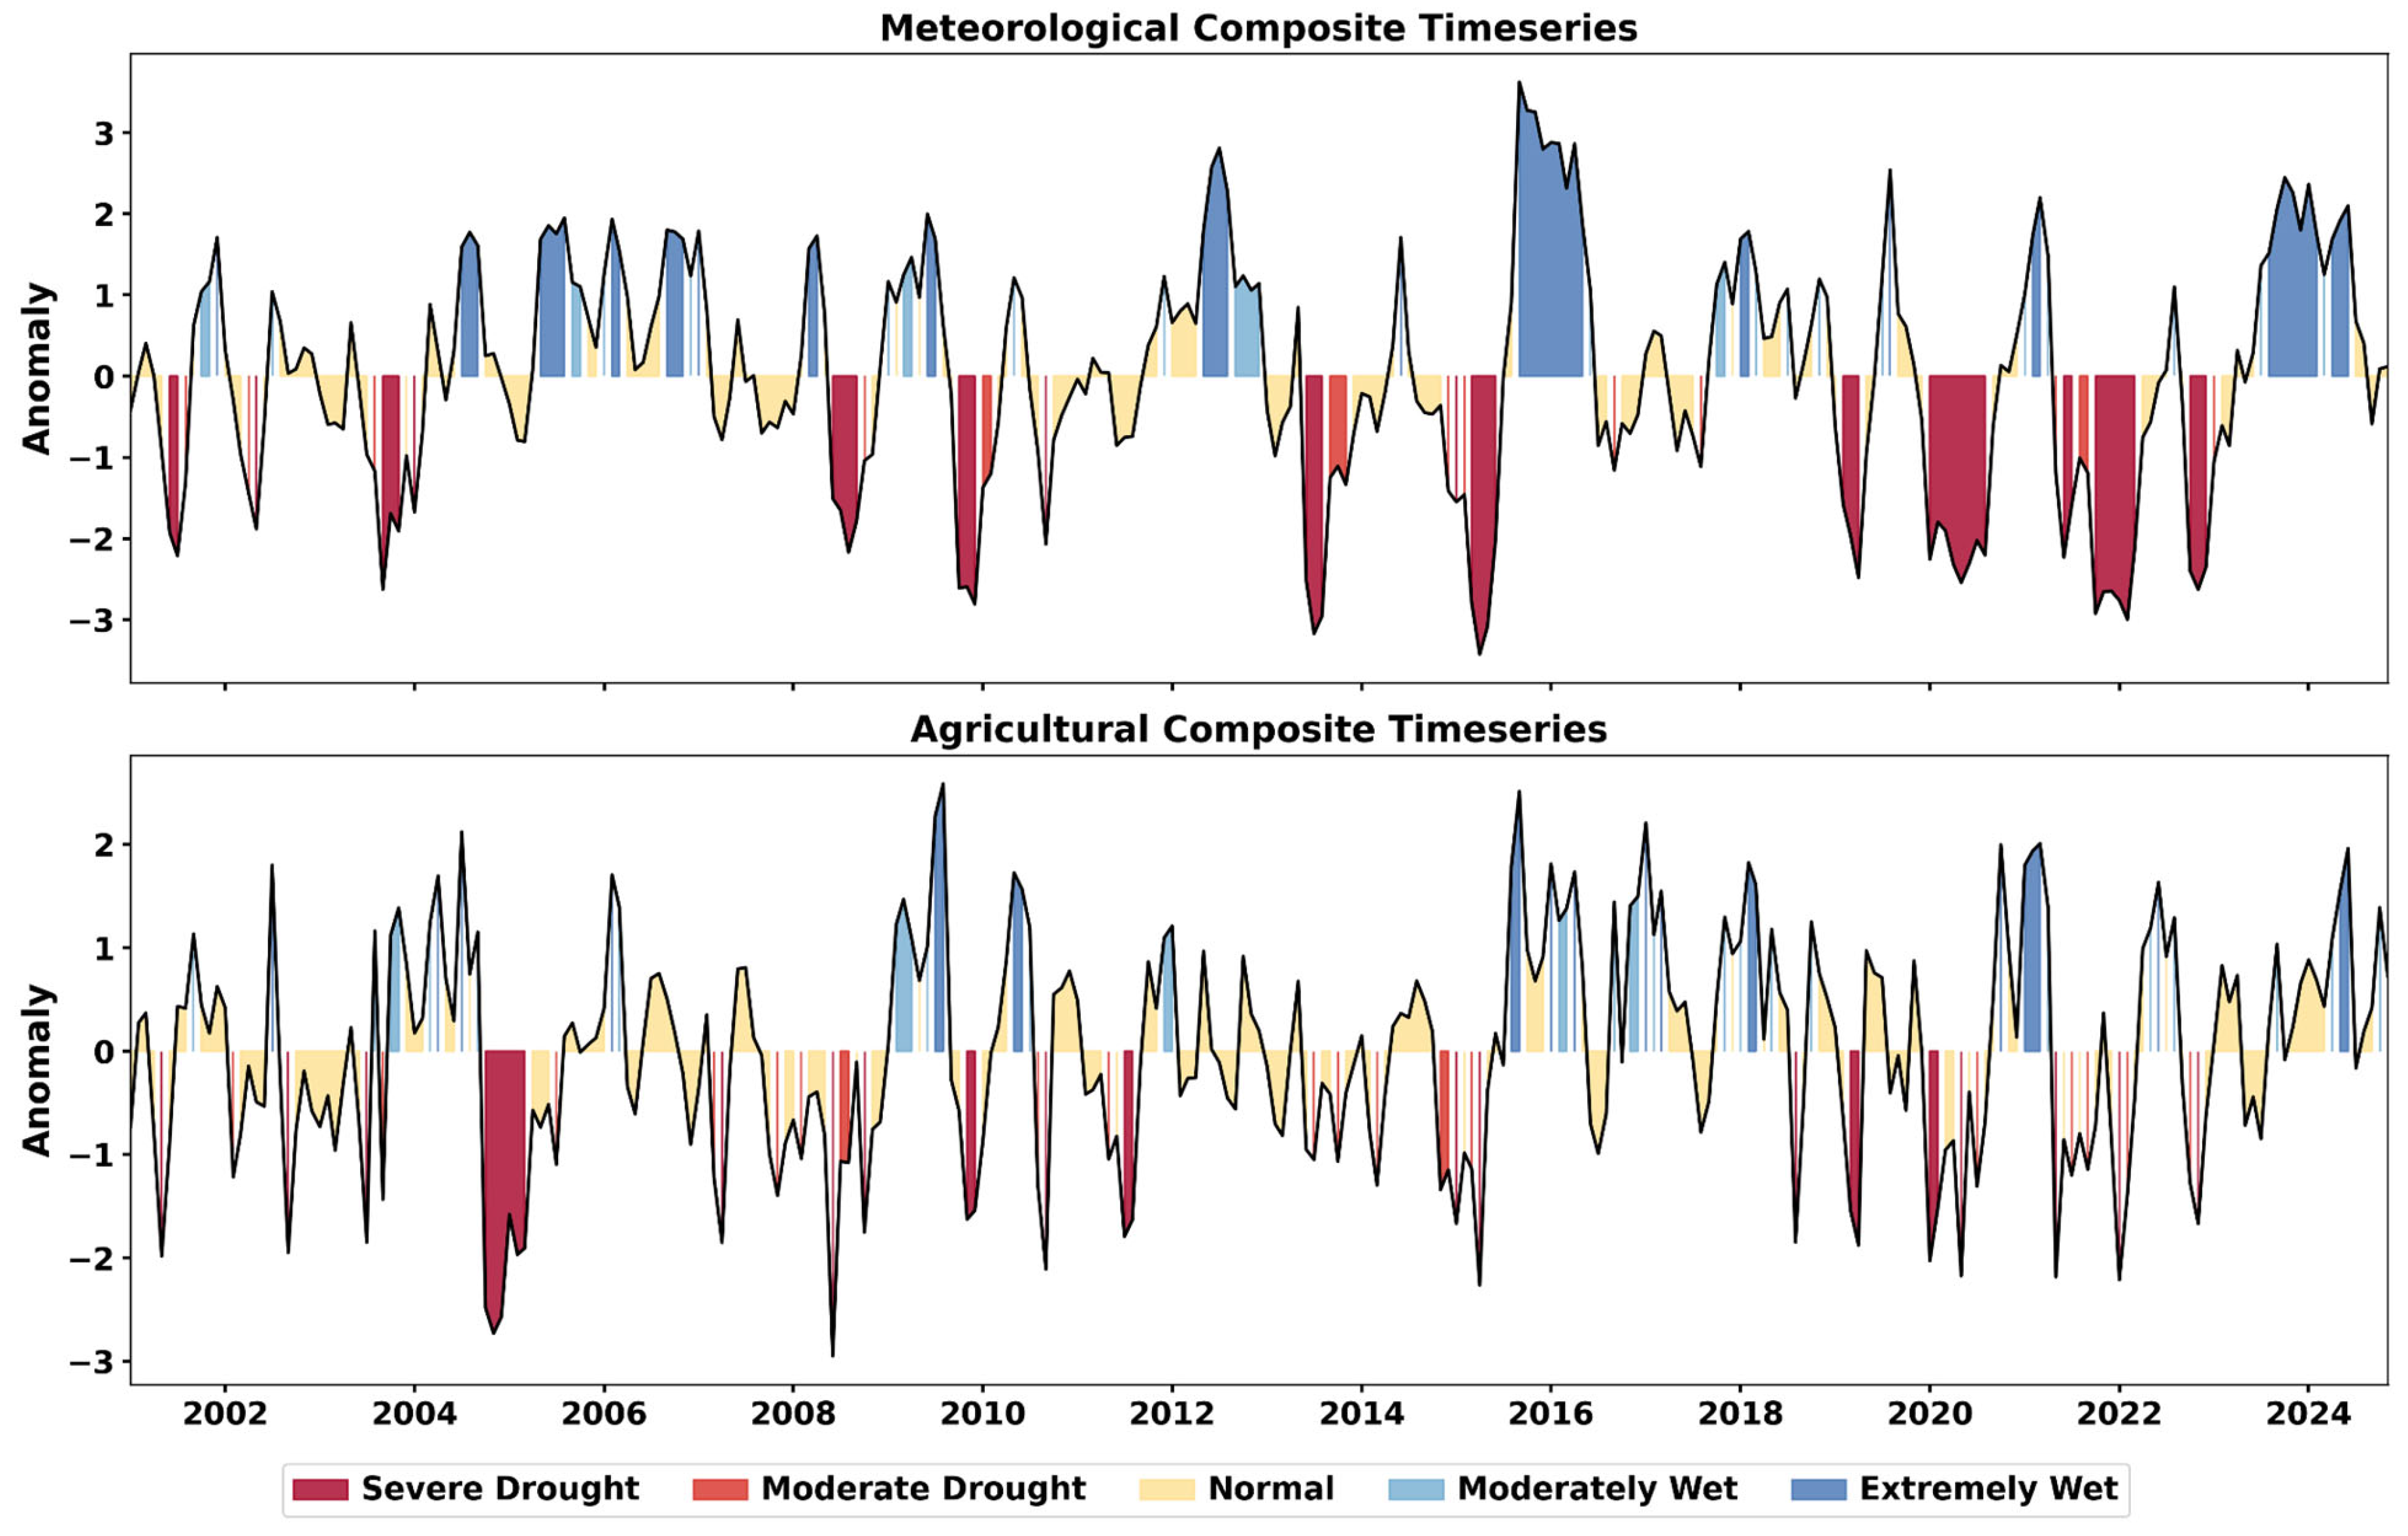
The time series (Figure 25) shows both composites generally following similar broad patterns from 2000–2024. However, important differences appear in their variability and drought expression. The meteorological composite (top) exhibits more pronounced fluctuations, featuring frequent and intense negative anomalies, reflecting the high instability of drought signals influenced by precipitation. On the other hand, the agricultural composite (bottom) appears more even, displaying fewer but more prolonged drought occurrences, aligning with the buffering role of soil moisture and vegetation in mediating short-term rainfall deficits.
The categorical representation strengthens these contrasts: the meteorological composite classified only about half the months as normal (52.26%), with relatively high proportions of severe (15.68%) and moderate (5.92%) droughts. By comparison, the agricultural composite showed a greater share of normal months (64.46%), fewer severe droughts (8.01%), but slightly more moderate droughts (10.45%). This divergence highlights that not all meteorological droughts translate into agricultural droughts, underlining the importance of monitoring both domains to capture the full drought continuum.

4.6.5. Seasonal Variability & Drought Frequency

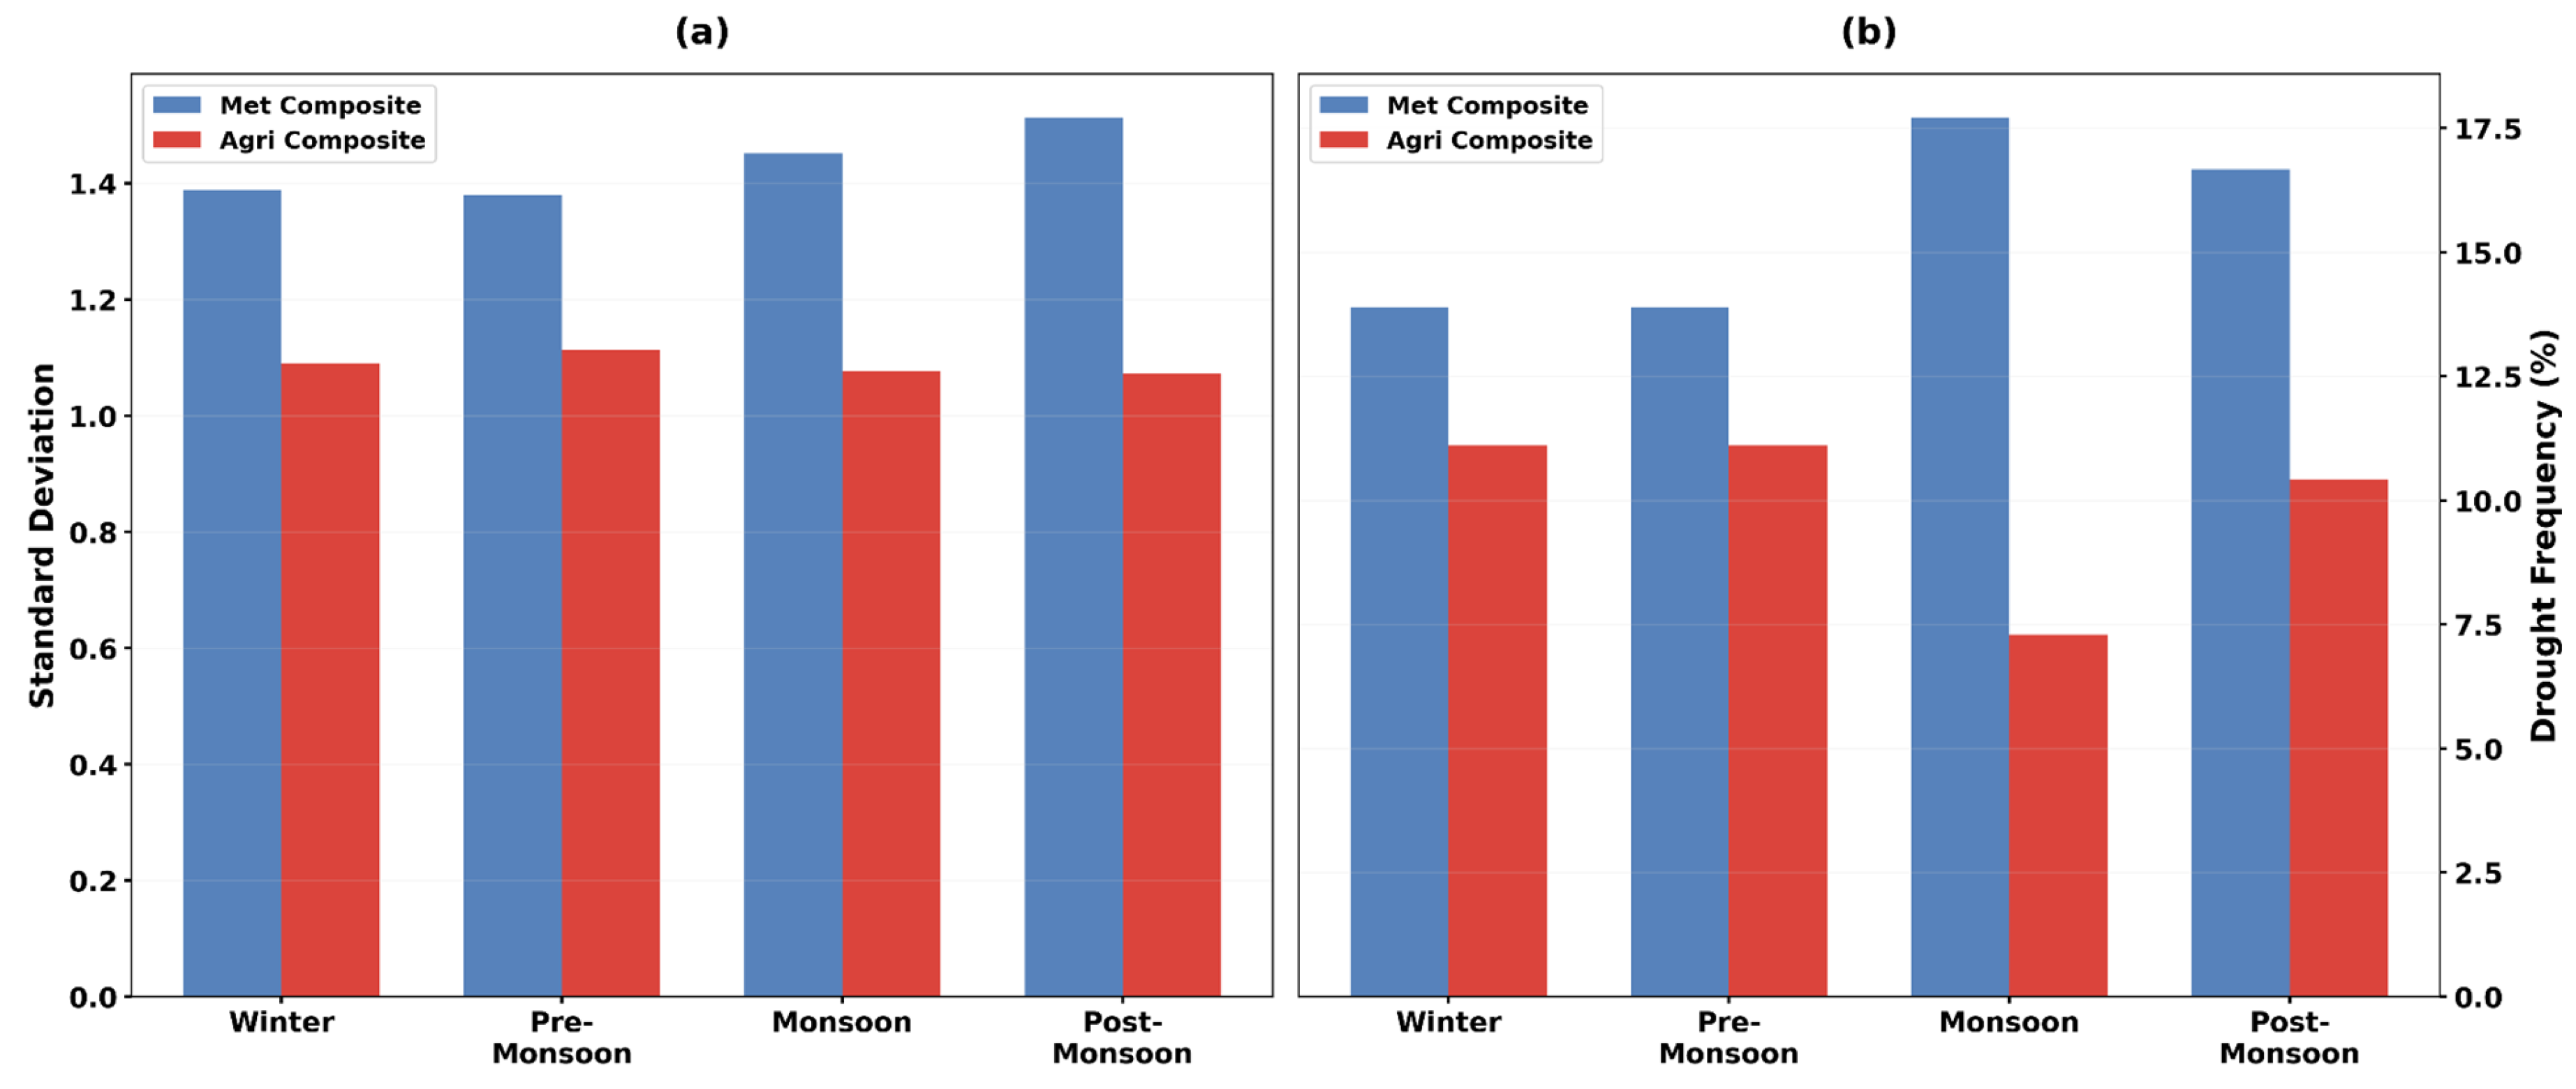
The seasonal variability analysis (Figure 26a) shows consistently higher standard deviation in the meteorological composite (1.4–1.5) compared to the agricultural composite (<1.2). This could reflect the more volatile nature of precipitation-driven droughts relative to the smoother, lagged agricultural responses, along with the somewhat different methods used to standardize the indices. Seasonal drought frequency (Figure 26b) shows some differences between indices. The meteorological composite has the highest drought frequency (>17.5%) during the monsoon, indicating recurrent meteorological anomalies even in the wettest season. By contrast, the agricultural composite peaks in winter (~10%), with the lowest drought frequency during the monsoon (~7.5%). This finding underlines that meteorological droughts are most common in the monsoon, but agricultural droughts are most critical in winter, when water availability is already low and vegetation is highly vulnerable.

5. Discussion and Conclusions

This paper presents a comprehensive framework of the Karnali River Basin (KRB) drought dynamics, as it merges meteorological, hydrological, and ecological views. Standardized indicators (SPI, SMI, and NDVI) were derived using precipitation records interpolated from in situ DHM stations, soil moisture estimates from ERA5, and vegetation indices from MODIS. The principal component analysis (PCA) was used to effectively correlate multi-scale precipitation variability with agricultural indicators. Trend analysis, spatial frequency mapping, categorical classification, and lagged vegetation responses were used to assess drought characteristics.
It was found that there was a significant decline in some measures of precipitation (SPI at longer accumulation periods), which is in agreement with previous researchers. According to a study [23], Nepal experienced higher drought frequency after the 1980s due to the weakening of monsoonal precipitation. Similarly, decreasing trends in precipitation in various basins, with the dry periods in the pre-monsoon and winter seasons intensifying significantly, were also reported [27], which correlates well with these patterns. In the Karnali region, a study [25] emphasizes the occurrence of recurrent meteorological droughts, particularly during the winter months. These droughts underscore the susceptibility of the region, as shown by short-term SPI anomalies. The study also demonstrates differences between seasons and seasons, in terms of meteorological droughts being the most common in the monsoon season, and agricultural droughts being the most severe in winter. Similarly, a recent study [22] found that winter drought was a major risk to the Sudurpashchim and Karnali provinces. Spatial heterogeneity shows that locations with mountain features experience more frequent drought events than Terai, which conforms to the results of previous studies [24,62], emphasizing the synergistic impacts of steep topography, shallow soils, and low irrigation.
There was no statistically significant long-term trend in the SMI, which indicated basin-scale hydrological stability in spite of decreasing precipitation. This is consistent with the findings of a previous study, which estimated water availability in the KRB in the future and highlighted the moderating impacts of snowmelt and irrigation [12,14,22,23,24,60,61,62,63]. Similarly, a study [21] found that crop productivity in western Nepal was able to endure reduced rainfall because of supplemental irrigation and traditional management practices. However, localized SMI declines determined in the spatial analysis coincide with those reported by [67], in the Koshi River Basin, where soil moisture deficits caused yield losses in rain-fed agriculture. These underscore the fact that hydrological drought effects can be concealed at the basin level but still extreme in susceptible sub-regions. As a caveat, the SMI is based on the ERA5 global reanalysis, which may require more local data for evaluation and verification. Previous studies [46,68] and the ECMWF have noted that the ERA5 surface soil moisture (0–7 cm) may underestimate agricultural soil moisture, particularly in complex, mountainous terrains such as the Himalaya. This limitation may introduce uncertainty in representing root-zone dynamics and evapotranspiration processes, emphasizing the need for local calibration or bias adjustment using in situ soil moisture or field data.
A modest but significant increasing trend in NDVI since 2000 was detected, with higher peaks during the monsoon and post-monsoon seasons. This supports findings by [14], who observed increases in vegetation health across Nepal using satellite-derived indices, particularly in irrigated and lowland areas. One study [50] documented positive NDVI trends in mid-hill regions of Nepal, though stability or declines were noted at higher elevations, while another study [51] linked NDVI increases to rising temperatures and changing carbon dynamics. Collectively, these findings suggest that the positive NDVI trend in the KRB likely reflects both atmospheric composition and climatic change as well as agricultural expansion in lowland areas, as previously proposed [20]. However, the interpretation of NDVI trends should be made cautiously, as the index can be affected by snow cover, cloud contamination, sensor limitations, and vegetation type variability. In high-altitude regions, residual snow or persistent cloud cover can suppress NDVI values, potentially biasing the temporal signal. Moreover, NDVI does not directly distinguish between natural vegetation recovery and agricultural intensification, introducing uncertainty in attributing vegetation changes purely to ecological or climatic drivers.
The coexistence of a moderate increase in meteorological drought severity, as indicated by SPI12, and a long-term greening trend (+12% NDVI) illustrates the intricate relationship between climatic and anthropogenic factors. In the lower and mid-hill regions of the Karnali Basin, the availability of snow and glacier meltwater, along with the development of expanded irrigation infrastructure, has likely helped buffer vegetation against decreasing rainfall levels. Additionally, rising temperatures and higher CO2 may have extended the growing season and enhanced photosynthetic activity in certain elevation zones, resulting in higher NDVI values even during drier years. Agricultural intensification and land-use changes further contribute to this disconnect between greenness and meteorological drought. Similar patterns of drought–greenness decoupling have been observed in other South Asian basins [69,70], underscoring the complex responses of mountain agro-ecosystems to hydroclimatic stress.
On a global scale, the dynamics of drought that are being experienced in the KRB are more or less similar to those in other parts of the world, which are experiencing escalated hydroclimatic stress. As an example, it is forecasted that in the next few decades, the central and southern parts of the Middle East will experience a significant rise in the frequency and severity of droughts [71]. In contrast to most arid areas where vegetation loss is associated with increasing drought, the KRB undergoes localized greening associated with irrigation, meltwater, and changes in land use. Other instances of similar decoupling of meteorological drought and vegetation response have been found in Mediterranean and Central Asian basins [72,73]. The two points of this comparison are the universal features of growing drought danger and the local buffering processes that may adjust vegetation reactions within mountainous, monsoon-modified frameworks.
PCA loadings indicate that agricultural drought variability is consistently represented by NDVI and SMI responding in the same direction, with both variables showing positive loadings on PC1. This demonstrates that vegetation health and soil moisture deficits co-occur, rather than opposing each other. While local deviations may occur due to cloud contamination in NDVI, seasonal differences, or elevation-dependent soil moisture dynamics, the overall pattern confirms that periods of vegetation stress are generally associated with soil moisture deficits, reinforcing the utility of PC1 as a unified agricultural drought indicator.
While the multi-index framework provided consistent relationships between meteorological and agricultural drought components, this study did not include an explicit validation of the derived indices against observed agricultural outcomes (e.g., yield statistics or drought impact reports). Such validation could further substantiate the representativeness of the composite indicators and strengthen their operational applicability in drought monitoring. Future studies should integrate agricultural production datasets or field-based drought assessments for a more robust evaluation.
A lag of about one month was observed in the response of NDVI to SMI, which is consistent with the study by Zhang et al. [48]. This reflects delayed vegetation response due to crop phenology and the buffering effects of soil. The immediate response of SMI to rainfall confirms its effectiveness as a hydrological drought indicator, while the delayed effect on NDVI highlights the gradual onset of agricultural droughts [74]. PCA-based composites revealed that meteorological droughts are highly volatile, whereas agricultural droughts develop more slowly. This difference underscores the buffering role of soil and vegetation, as observed by [75].
This result builds on earlier Nepal-focused studies by utilizing multiple drought indicators to provide a comprehensive framework for understanding the propagation of drought across meteorological, hydrological, and agricultural domains. The integrated approach aligns with recent recommendations for multi-scalar, integrated drought monitoring [3,29]. Beyond its relevance to the Karnali River Basin, the methodological framework developed in this study holds broader applicability for other data-scarce, topographically complex basins worldwide. Many mountainous and monsoon-influenced regions face similar challenges in monitoring drought due to limited ground observations, heterogeneous terrain, and coupled meteorological-agricultural dynamics. Some studies have already used composite indices to study drought development on the basin scale. For example, ref. [76] constructed a comprehensive drought index for the Yellow River Basin using multi-source data and PCA, demonstrating the value of integrated approaches in complex basins. Nevertheless, the current study advances the concept by applying a multi-index approach that distinguishes agricultural and meteorological drought components within the Himalayan context, where data scarcity, pronounced elevation gradients, and strong monsoon variability necessitate tailored frameworks for effective drought monitoring.
The findings highlight aspects of growing risks of drought in the Karnali River Basin (KRB), particularly during the pre-monsoon and winter seasons, when there is a decline in rainfall coupled with rising temperatures and increased agricultural water demand. Despite its limitations, the methodological framework utilized in this study, combining multi-source data from weather stations, remote sensing, and reanalysis, standardized drought indices, Principal Component Analysis (PCA) integration, and spatial-temporal analyses, forms a robust and transferable model. This model is suitable for early warning systems, agricultural planning, and water resource management, and holds significant promise for application in other mountainous and data-scarce basins. However, the effectiveness of this approach is contingent upon the availability and reliability of local datasets and knowledge. It is crucial to calibrate global products with regional observations and adapt models to local hydro-climatic contexts to ensure consistent performance across diverse geographic settings.
Overall, these results underscore the significance of integrated drought monitoring frameworks in climate-vulnerable mountain basins. The multi-source and multi-index approach presented here provides a transferable model that can support early warning systems, agricultural planning, and water resource management across regions with similar topographic and hydroclimatic conditions. Beyond Nepal, such frameworks hold promise for other data-scarce and monsoon-dependent basins worldwide, where drought propagation mechanisms and agricultural sensitivities share comparable dynamics. The outcomes of this study can inform evidence-based adaptation and risk management policies, such as the design of basin-scale drought monitoring platforms, improved irrigation scheduling, and climate-resilient agricultural practices. Future work should focus on operationalizing these indices within national drought early warning systems and strengthening the link between scientific assessment and policy decision-making.

Supplementary Materials

The following supporting information can be downloaded at https://www.mdpi.com/article/10.3390/land14112271/s1.

Author Contributions

Conceptualization, K.A.; Methodology, K.A. and N.Y.K.; Resources, K.A.; Data curation, R.S.; Writing—original draft, K.A.; Writing—review & editing, D.P., N.Y.K. and R.S.; Supervision, D.P., D.A. and N.Y.K. All authors have read and agreed to the published version of the manuscript.

Funding

This research received no external funding.

Data Availability Statement

The data that support the findings are available from their original providers at https://dhm.gov.np/pages/data (accessed on 15 August 2025), https://cds.climate.copernicus.eu/datasets/reanalysis-era5-land?tab=download (accessed on 12 September 2025) and https://modis.gsfc.nasa.gov/data/dataprod/mod13.php (accessed on 12 September 2025).

Conflicts of Interest

The authors declare no conflict of interest.

References

  1. Vicente-Serrano, S.M.; Beguería, S.; López-Moreno, J.I. A Multiscalar Drought Index Sensitive to Global Warming: The Standardized Precipitation Evapotranspiration Index. J. Clim. 2010, 23, 1696–1718. [Google Scholar] [CrossRef]
  2. Wilhite, D.; Pulwarty, R.S. Drought and Water Crises: Lessons Drawn, Some Lessons Learned, and the Road Ahead. In Drought and Water Crises; CRC Press: Boca Raton, FL, USA, 2017. [Google Scholar]
  3. IPCC AR6 Synthesis Report: Climate Change 2023—IPCC. Available online: https://www.ipcc.ch/report/sixth-assessment-report-cycle/ (accessed on 11 June 2024).
  4. Wilhite, D.A.; Glantz, M.H. Understanding: The Drought Phenomenon: The Role of Definitions. Water Int. 1985, 10, 111–120. [Google Scholar] [CrossRef]
  5. Mishra, A.K.; Singh, V.P. A review of drought concepts. J. Hydrol. 2010, 391, 202–216. [Google Scholar] [CrossRef]
  6. Karki, R.; Hasson, S.U.; Schickhoff, U.; Scholten, T.; Böhner, J. Rising Precipitation Extremes across Nepal. Climate 2017, 5, 4. [Google Scholar] [CrossRef]
  7. Ullah, I.; Ma, X.; Yin, J.; Omer, A.; Habtemicheal, B.A.; Saleem, F.; Iyakaremye, V.; Syed, S.; Arshad, M.; Liu, M. Spatiotemporal characteristics of meteorological drought variability and trends (1981–2020) over South Asia and the associated large-scale circulation patterns. Clim. Dyn. 2023, 60, 2261–2284. [Google Scholar] [CrossRef]
  8. Potopová, V.; Boroneanţ, C.; Boincean, B.; Soukup, J. Impact of agricultural drought on main crop yields in the Republic of Moldova. Int. J. Climatol. 2016, 36, 2063–2082. [Google Scholar] [CrossRef]
  9. Dahal, N.M.; Xiong, D.; Neupane, N.; Yuan, Y.; Zhang, B.; Zhang, S.; Fang, Y.; Zhao, W.; Wu, Y.; Deng, W. Spatiotemporal assessment of drought and its impacts on crop yield in the Koshi River Basin, Nepal. Theor. Appl. Clim. 2024, 155, 1679–1698. [Google Scholar] [CrossRef]
  10. Below, R.; Grover-Kopec, E.; Dilley, M. Documenting Drought-Related Disasters: A Global Reassessment. J. Environ. Dev. 2007, 16, 328–344. [Google Scholar] [CrossRef]
  11. Wilhite, D.; Svoboda, M.; Hayes, M. Understanding the Complex Impacts of Drought: A Key to Enhancing Drought Mitigation and Preparedness. Water Resour. Manag. 2007, 21, 763–774. [Google Scholar] [CrossRef]
  12. Sigdel, M.; Ikeda, M. Spatial and Temporal Analysis of Drought in Nepal using Standardized Precipitation Index and its Relationship with Climate Indices. J. Hydrol. Meteorol. 2010, 7, 59–74. [Google Scholar] [CrossRef]
  13. Panthi, J.; Dahal, P.; Shrestha, M.L.; Aryal, S.; Krakauer, N.Y.; Pradhanang, S.M.; Lakhankar, T.; Jha, A.K.; Sharma, M.; Karki, R. Spatial and Temporal Variability of Rainfall in the Gandaki River Basin of Nepal Himalaya. Climate 2015, 3, 210–226. [Google Scholar] [CrossRef]
  14. Baniya, B.; Tang, Q.; Xu, X.; Haile, G.G. Chhipi-Shrestha Spatial and Temporal Variation of Drought Based on Satellite Derived Vegetation Condition Index in Nepal from 1982–2015. Sensors 2019, 19, 430. [Google Scholar] [CrossRef] [PubMed]
  15. Pandey, V.P.; Sharma, A.; Dhaubanjar, S.; Bharati, L.; Joshi, I.R. Climate Shocks and Responses in Karnali-Mahakali Basins, Western Nepal. Climate 2019, 7, 92. [Google Scholar] [CrossRef]
  16. Khatiwada, K.R.; Panthi, J.; Shrestha, M.L.; Nepal, S. Hydro-Climatic Variability in the Karnali River Basin of Nepal Himalaya. Climate 2016, 4, 17. [Google Scholar] [CrossRef]
  17. Panthi, B.B. Analysis of Agricultural Drought and its Effects on Productivity at Different District of Nepal. J. Inst. Sci. Technol. 2014, 19, 106–110. [Google Scholar] [CrossRef]
  18. Bastakoti, R.C.; Bharati, L.; Bhattarai, U.; Wahid, S.M. Agriculture under changing climate conditions and adaptation options in the Koshi Basin. Clim. Dev. 2017, 9, 634–648. [Google Scholar] [CrossRef]
  19. Rimal, B.; Zhang, L.; Rijal, S. Crop Cycles and Crop Land Classification in Nepal Using MODIS NDVI. Remote Sens. Earth Syst. Sci. 2018, 1, 14–28. [Google Scholar] [CrossRef]
  20. Bocchiola, D.; Brunetti, L.; Soncini, A.; Polinelli, F.; Gianinetto, M. Impact of climate change on agricultural productivity and food security in the Himalayas: A case study in Nepal. Agric. Syst. 2019, 171, 113–125. [Google Scholar] [CrossRef]
  21. Ghimire, B.; Maharjan, N.; Dotel, J. Drought assessment on barley and millet production in Karnali Province, Nepal. Nepal J. Environ. Sci. 2020, 8, 53–67. [Google Scholar] [CrossRef]
  22. Bista, N.; Mahat, D.; Manandhar, S.; Regmi, B.; Panday, U.S.; Karki, S. Analyzing Trend and Pattern of Agricultural Drought: A Case Study of Karnali and Sudurpashchim Provinces. J. Geoinform. Nepal 2021, 20, 1–8. [Google Scholar] [CrossRef]
  23. Bagale, D.; Sigdel, M.; Aryal, D. Drought Monitoring over Nepal for the Last Four Decades and Its Connection with Southern Oscillation Index. Water 2021, 13, 3411. [Google Scholar] [CrossRef]
  24. Dahal, P.; Shrestha, N.S.; Shrestha, M.L.; Krakauer, N.Y.; Panthi, J.; Pradhanang, S.M.; Jha, A.; Lakhankar, T. Drought risk assessment in central Nepal: Temporal and spatial analysis. Nat. Hazards 2016, 80, 1913–1932. [Google Scholar] [CrossRef]
  25. Khatiwada, K.R.; Pandey, V.P. Characterization of hydro-meteorological drought in Nepal Himalaya: A case of Karnali River Basin. Weather Clim. Extrem. 2019, 26, 100239. [Google Scholar] [CrossRef]
  26. Hamal, K.; Sharma, S.; Khadka, N.; Haile, G.G.; Joshi, B.B.; Xu, T.; Dawadi, B. Assessment of drought impacts on crop yields across Nepal during 1987–2017. Meteorol. Appl. 2020, 27, e1950. [Google Scholar] [CrossRef]
  27. Aryal, A.; Maharjan, M.; Talchabhadel, R.; Thapa, B.R. Characterizing Meteorological Droughts in Nepal: A Comparative Analysis of Standardized Precipitation Index and Rainfall Anomaly Index. Earth 2022, 3, 409–432. [Google Scholar] [CrossRef]
  28. Singh, A.; Solanki, H.; Sharma, P.J. Dynamic evolution of meteorological and hydrological droughts under climatic and anthropogenic pressures in water-scarce regions. Hydrol. Process. 2024, 38, e15290. [Google Scholar] [CrossRef]
  29. Ahady, A.B.; Klopries, E.-M.; Schüttrumpf, H.; Wolf, S. Drought Analysis Methods: A Multidisciplinary Review with Insights on Key Decision-Making Factors in Method Selection. Water 2025, 17, 2248. [Google Scholar] [CrossRef]
  30. Weaver, S.M.; Lupo, A.R.; Hunt, S.; Aloysius, N. Refining Drought Assessment: A Multi-Dimensional Analysis of Condition Monitoring Observer Reports in Missouri (2018–2024). Atmosphere 2025, 16, 389. [Google Scholar] [CrossRef]
  31. AghaKouchak, A. A multivariate approach for persistence-based drought prediction: Application to the 2010–2011 East Africa drought. J. Hydrol. 2015, 526, 127–135. [Google Scholar] [CrossRef]
  32. Rhee, J.; Im, J.; Carbone, G.J. Monitoring agricultural drought for arid and humid regions using multi-sensor remote sensing data. Remote. Sens. Environ. 2010, 114, 2875–2887. [Google Scholar] [CrossRef]
  33. Bookhagen, B.; Burbank, D.W. Toward a complete Himalayan hydrological budget: Spatiotemporal distribution of snowmelt and rainfall and their impact on river discharge. J. Geophys. Res. Earth Surf. 2010, 115. [Google Scholar] [CrossRef]
  34. Shrestha, A.B.; Wake, C.P.; Dibb, J.E.; Mayewski, P.A. Precipitation fluctuations in the Nepal Himalaya and its vicinity and relationship with some large scale climatological parameters. Int. J. Climatol. A J. R. Meteorol. Soc. 2000, 20, 317–327. [Google Scholar] [CrossRef]
  35. Nayava, J.L.; Adhikary, S.; Bajracharya, O.R. Spatial and temporal variation of surface air temperature at different altitude zone in recent 30 years over Nepal. MAUSAM 2017, 68, 417–428. [Google Scholar] [CrossRef]
  36. Palazzi, E.; von Hardenberg, J.; Provenzale, A. Precipitation in the Hindu-Kush Karakoram Himalaya: Observations and future scenarios. J. Geophys. Res. Atmos. 2013, 118, 85–100. [Google Scholar] [CrossRef]
  37. Dyer, S.A.; Dyer, J.S. Cubic-Spline Interpolation: Part 1. IEEE Instrum. Meas. Mag. 2001, 4, 44–46. [Google Scholar] [CrossRef]
  38. Junninen, H.; Niska, H.; Tuppurainen, K.; Ruuskanen, J.; Kolehmainen, M. Methods for imputation of missing values in air quality data sets. Atmos. Environ. 2004, 38, 2895–2907. [Google Scholar] [CrossRef]
  39. Paulhus, J.L.H.; Kohler, M.A. Interpolation of missing precipitation records. Mon. Weather. Rev. 1952, 80, 129–133. [Google Scholar] [CrossRef]
  40. De Silva, R.P.; Dayawansa, N.D.K.; Ratnasiri, M.D. A comparison of methods used in estimating missing rainfall data. J. Agric. Sci.–Sri Lanka 2007, 3, 101–108. [Google Scholar] [CrossRef]
  41. Huang, G. Missing data filling method based on linear interpolation and lightgbm. J. Phys. Conf. Ser. 2021, 1754, 012187. [Google Scholar] [CrossRef]
  42. Franke, R.; Nielson, G. Smooth interpolation of large sets of scattered data. Int. J. Numer. Methods Eng. 1980, 15, 1691–1704. [Google Scholar] [CrossRef]
  43. Tung, Y.-K. Point Rainfall Estimation for a Mountainous Region. J. Hydraul. Eng. 1983, 109, 1386–1393. [Google Scholar] [CrossRef]
  44. Ali, M.G.; Younes, K.; Esmaeil, A.; Fatemeh, T. Assessment of Geostatistical Methods for Spatial Analysis of SPI and EDI Drought Indices. World Appl. Sci. J. 2011, 15, 474–482. [Google Scholar]
  45. Mishra, A.K.; Desai, V.R. Spatial and temporal drought analysis in the Kansabati river basin, India. Int. J. River Basin Manag. 2005, 3, 31–41. [Google Scholar] [CrossRef]
  46. Hersbach, H.; Bell, B.; Berrisford, P.; Hirahara, S.; Horányi, A.; Muñoz-Sabater, J.; Nicolas, J.; Peubey, C.; Radu, R.; Schepers, D.; et al. The ERA5 global reanalysis. Q. J. R. Meteorol. Soc. 2020, 146, 1999–2049. [Google Scholar] [CrossRef]
  47. Didan, K. MODIS/Terra Vegetation Indices 16-Day L3 Global 250m SIN Grid V061. NASA Land Processes Distributed Active Archive Center. Earth Science Data Systems, NASA. 2021. Available online: https://www.earthdata.nasa.gov/data/catalog/lpcloud-mod13q1-061 (accessed on 2 September 2025).
  48. Zhang, H.; Chang, J.; Zhang, L.; Wang, Y.; Li, Y.; Wang, X. NDVI dynamic changes and their relationship with meteorological factors and soil moisture. Environ. Earth Sci. 2018, 77, 582. [Google Scholar] [CrossRef]
  49. Alex, E.C.; Ramesh, K.V.; Hari, S. Quantification and understanding the observed changes in land cover patterns in Bangalore. International. J. Civ. Eng. Technol. 2017, 8, 597–603. [Google Scholar]
  50. Krakauer, N.Y.; Lakhankar, T.; Anadón, J.D. Mapping and Attributing Normalized Difference Vegetation Index Trends for Nepal. Remote. Sens. 2017, 9, 986. [Google Scholar] [CrossRef]
  51. Baniya, B.; Tang, Q.; Huang, Z.; Sun, S.; Techato, K. Spatial and Temporal Variation of NDVI in Response to Climate Change and the Implication for Carbon Dynamics in Nepal. Forests 2018, 9, 329. [Google Scholar] [CrossRef]
  52. Berhan, G.; Hill, S.; Tadesse, T.; Atnafu, S. Using Satellite Images for Drought Monitoring: A Knowledge Discovery Approach. J. Strateg. Innov. Sustain. 2011, 7, 135–153. [Google Scholar]
  53. Aziz, A.; Umar, M.; Mansha, M.; Khan, M.S.; Javed, M.N.; Gao, H.; Bin Farhan, S.; Iqbal, I.; Abdullah, S. Assessment of drought conditions using HJ-1A/1B data: A case study of Potohar region, Pakistan. Geomat. Nat. Hazards Risk 2018, 9, 1019–1036. [Google Scholar] [CrossRef]
  54. McKee, T.B.; Doesken, N.J.; Kleist, J. The relationship of drought frequency and duration to time scales. In Proceedings of the 8th Conference, Applied Climatology, CA, USA, 17–22 January 1993; pp. 179–183. [Google Scholar]
  55. Wagner, W.; Lemoine, G.; Rott, H. A Method for Estimating Soil Moisture from ERS Scatterometer and Soil Data. Remote. Sens. Environ. 1999, 70, 191–207. [Google Scholar] [CrossRef]
  56. Esch, S.; Korres, W.; Reichenau, T.G.; Schneider, K. Soil moisture index from ERS-SAR and its application to the analysis of spatial patterns in agricultural areas. J. Appl. Remote. Sens. 2018, 12, 022206. [Google Scholar] [CrossRef]
  57. Abdi, H.; Williams, L.J. Principal component analysis. Wiley Interdiscip. Rev. Comput. Stat. 2010, 2, 433–459. [Google Scholar] [CrossRef]
  58. Greenacre, M.; Groenen, P.J.F.; Hastie, T.; D’Enza, A.I.; Markos, A.; Tuzhilina, E. Principal component analysis. Nat. Rev. Methods Prim. 2022, 2, 100. [Google Scholar] [CrossRef]
  59. Demšar, U.; Harris, P.; Brunsdon, C.; Fotheringham, A.S.; McLoone, S. Principal Component Analysis on Spatial Data: An Overview. Ann. Assoc. Am. Geogr. 2013, 103, 106–112. [Google Scholar] [CrossRef]
  60. Wang, S.-Y.; Yoon, J.-H.; Gillies, R.R.; Cho, C. What Caused the Winter Drought in Western Nepal during Recent Years? J. Clim. 2013, 26, 8241–8256. [Google Scholar] [CrossRef]
  61. Dahal, P.; Shrestha, M.L.; Panthi, J.; Pradhananga, D. Modeling the future impacts of climate change on water availability in the Karnali River Basin of Nepal Himalaya. Environ. Res. 2020, 185, 109430. [Google Scholar] [CrossRef] [PubMed]
  62. Hamal, K.; Sharma, S.; Pokharel, B.; Shrestha, D.; Talchabhadel, R.; Shrestha, A.; Khadka, N. Changing pattern of drought in Nepal and associated atmospheric circulation. Atmos. Res. 2021, 262, 105798. [Google Scholar] [CrossRef]
  63. Sharma, S.; Hamal, K.; Khadka, N. Drought characteristics over Nepal Himalaya and their relationship with climatic indices. Meteorol. Appl. 2021, 28, e1988. [Google Scholar] [CrossRef]
  64. Mann, H.B. Nonparametric Tests Against Trend. Econometrica 1945, 13, 245–259. [Google Scholar] [CrossRef]
  65. Kendall, M.G. Rank Correlation Methods. 1948. Available online: https://scholar.google.com/scholar_lookup?&title=Rank%20correlation%20methods&publication_year=1975&author=Kendall%2CM (accessed on 4 September 2025).
  66. Yue, S.; Wang, C. The Mann-Kendall Test Modified by Effective Sample Size to Detect Trend in Serially Correlated Hydrological Series. Water Resour. Manag. 2004, 18, 201–218. [Google Scholar] [CrossRef]
  67. Dahal, N.M.; Xiong, D.; Neupane, N.; Zhang, S.; Yuan, Y.; Zhang, B.; Fang, Y.; Zhao, W.; Wu, Y.; Deng, W. Estimating and analyzing the spatiotemporal characteristics of crop yield loss in response to drought in the koshi river basin, Nepal. Theor. Appl. Clim. 2023, 152, 1053–1073. [Google Scholar] [CrossRef]
  68. Muñoz-Sabater, J.; Dutra, E.; Agustí-Panareda, A.; Albergel, C.; Arduini, G.; Balsamo, G.; Boussetta, S.; Choulga, M.; Harrigan, S.; Hersbach, H.; et al. ERA5-Land: A state-of-the-art global reanalysis dataset for land applications. Earth Syst. Sci. Data 2021, 13, 4349–4383. [Google Scholar] [CrossRef]
  69. AghaKouchak, A.; Mirchi, A.; Madani, K.; Di Baldassarre, G.; Nazemi, A.; Alborzi, A.; Anjileli, H.; Azarderakhsh, M.; Chiang, F.; Hassanzadeh, E.; et al. Anthropogenic Drought: Definition, Challenges, and Opportunities. Rev. Geophys. 2021, 59, e2019RG000683. [Google Scholar] [CrossRef]
  70. Hu, Z.; Piao, S.; Knapp, A.K.; Wang, X.; Peng, S.; Yuan, W.; Running, S.; Mao, J.; Shi, X.; Ciais, P.; et al. Decoupling of greenness and gross primary productivity as aridity decreases. Remote. Sens. Environ. 2022, 279, 113120. [Google Scholar] [CrossRef]
  71. Khosravi, Y.; Ouarda, T.B.M.J. Drought risks are projected to increase in the future in central and southern regions of the Middle East. Commun. Earth Environ. 2025, 6, 384. [Google Scholar] [CrossRef]
  72. Xu, B.; Li, J.; Pei, X.; Yang, H. Decoupling the response of vegetation dynamics to asymmetric warming over the Qinghai-Tibet plateau from 2001 to 2020. J. Environ. Manag. 2023, 347, 119131. [Google Scholar] [CrossRef]
  73. Vicente-Serrano, S.M.; Tramblay, Y.; Reig, F.; González-Hidalgo, J.C.; Beguería, S.; Brunetti, M.; Kalin, K.C.; Patalen, L.; Kržič, A.; Lionello, P.; et al. High temporal variability not trend dominates Mediterranean precipitation. Nature 2025, 639, 658–666. [Google Scholar] [CrossRef] [PubMed]
  74. Andujar, E.; Krakauer, N.Y.; Yi, C.; Kogan, F. Ecosystem Drought Response Timescales from Thermal Emission versus Shortwave Remote Sensing. Adv. Meteorol. 2017, 2017, 8434020. [Google Scholar] [CrossRef]
  75. Wheater, H.S.; Pomeroy, J.W.; Pietroniro, A.; Davison, B.; Elshamy, M.; Yassin, F.; Rokaya, P.; Fayad, A.; Tesemma, Z.; Princz, D.; et al. Advances in modelling large river basins in cold regions with Modélisation Environmentale Communautaire—Surface and Hydrology (MESH), the Canadian hydrological land surface scheme. Hydrol. Process. 2022, 36, e14557. [Google Scholar] [CrossRef]
  76. Shi, X.; Ding, H.; Wu, M.; Shi, M.; Chen, F.; Li, Y.; Yang, Y. A comprehensive drought monitoring method integrating multi-source data. PeerJ 2022, 10, e13560. [Google Scholar] [CrossRef] [PubMed]
Figure 1. Karnali River Basin of Nepal with DHM hydrological and meteorological stations.
Land 14 02271 g001
Figure 2. Mean annual NDVI from 2000 to 2024 of KRB.
Land 14 02271 g002
Figure 3. Annual SMI trend from 1995 to 2024 of KRB.
Land 14 02271 g003
Figure 4. Annual trends for dry, wet, and all SPIs over KRB from 1995 to 2024 for SPI3 (a), SPI6 (b) and SPI12 (c).
Land 14 02271 g004
Figure 5. Seasonal NDVI trends from 2000 to 2024 of KRB.
Land 14 02271 g005
Figure 6. Box and whisker plot of the distribution of mean seasonal SMI of KRB from 1995 to 2024.
Land 14 02271 g006
Figure 7. Monthly NDVI trends of KRB from 2000 to 2024.
Land 14 02271 g007
Figure 8. Heatmap of monthly NDVI values of KRB from 2000 to 2024.
Land 14 02271 g008
Figure 9. Box and whisker plot of the distribution of mean monthly SMI of KRB from 1995 to 2024.
Land 14 02271 g009
Figure 10. Spatial distribution of average NDVI (a) and its average change (b) from 2000 to 2024 over KRB. District boundaries are shown for reference.
Land 14 02271 g010
Figure 11. Spatial distribution of NDVI during different seasons of KRB from 2000 to 2024.
Land 14 02271 g011
Figure 12. Spatial distribution of NDVI over KRB for representative months from 2000 to 2024.
Land 14 02271 g012
Figure 13. Spatial trend (a) and mean (b) of SMI over KRB from 1995 to 2024.
Land 14 02271 g013
Figure 14. Seasonal distribution of SMI over KRB from 1995 to 2024.
Land 14 02271 g014
Figure 15. Monthly distribution of SMI over KRB from 1995 to 2024.
Land 14 02271 g015
Figure 16. Annual Dry and Wet Anomaly Frequency over KRB from 1995 to 2024.
Land 14 02271 g016
Figure 17. Seasonal dry and wet anomaly frequency from 1995 to 2024 of KRB.
Land 14 02271 g017
Figure 18. Monthly SMI time series (category-based) of KRB from 1995 to 2024.
Land 14 02271 g018
Figure 19. Heatmap of monthly time series for SMI of KRB from 1995 to 2024.
Land 14 02271 g019
Figure 20. SPI time series heatmap of KRB from 1995 to 2024.
Land 14 02271 g020
Figure 21. Categorical time series of drought in KRB from 1995 to 2024 based on SPIs of SPI3 (a), SPI6 (b) and SPI12 (c).
Land 14 02271 g021
Figure 22. Barchart showing the percentage of variance explained by PCs for both meteorological and agricultural composites (a), Line plot showing the cumulative variance explained by increasing numbers of PCs for both composites (b). Horizontal bar chart illustrating the magnitude of the PC1 loading for each variable in both datasets (c), Scatter plot showing the correlation between the composite PC1 values for both composites with trendline (d).
Land 14 02271 g022
Figure 23. Lagged correlation between meteorological composite (SPI) and individual agricultural composite components (SMI and NDVI). Marker color indicates which correlations are significantly different from zero.
Land 14 02271 g023
Figure 24. Correlation between composite indices, overall as scatterplot (a) and seasonal as barplot (b).
Land 14 02271 g024
Figure 25. Categorical time series of meteorological and agricultural composite indices.
Land 14 02271 g025
Figure 26. Seasonal variability (a) and drought frequency (b) of composites.
Land 14 02271 g026
Table 1. Drought category based on NDVI and SPI z score.
Z Score RangeDrought Category
>0No drought
0 to −0.99Mild drought
−1.00 to −1.49Moderate drought
−1.50 to −1.99Severe drought
≤−2.00Extreme drought
Table 2. Drought category based on percentile-based SMI.
Percentile RangeDrought Category
>0.40No drought
0.20 to 0.40Mild drought
0.10 to 0.20Moderate drought
0.05 to 0.10Severe drought
<0.05Extreme drought
Disclaimer/Publisher’s Note: The statements, opinions and data contained in all publications are solely those of the individual author(s) and contributor(s) and not of MDPI and/or the editor(s). MDPI and/or the editor(s) disclaim responsibility for any injury to people or property resulting from any ideas, methods, instructions or products referred to in the content.