Article

Urban Agglomerations Promote the Coordinated Development of Urbanization and Intensive Land Use

1
Institute of Restoration Ecology, China University of Mining and Technology-Beijing, Beijing 100083, China
2
School of Energy and Environmental Engineering, Hebei University of Engineering, Handan 056038, China
3
Shandong Provincial Key Laboratory of Eco-Environmental Science for Yellow River Delta, Shandong University of Aeronautics, Binzhou 256600, China
*
Authors to whom correspondence should be addressed.
Land 2025, 14(11), 2231; https://doi.org/10.3390/land14112231
Submission received: 2 October 2025 / Revised: 1 November 2025 / Accepted: 4 November 2025 / Published: 11 November 2025

Abstract

As a geographical development mode, can urban agglomeration solve the problem of intensive land use that cannot be solved on the urban scale? What is the degree of balanced development between urbanization and intensive land use? This study constructs the index system of the coupling system between urbanization development and intensive land use, and evaluates the urbanization development subsystem and the intensive land use subsystem using the coupling Comprehensive Gravity–Gram–Schmidt Orthogonalization model (CG-GSO) and the entropy weight method, based on the coupling coordination degree model to explore coordinated development, and, finally, it analyzes the driving factors. The results showed the following: (1) the urbanization development and the intensive land use subsystems were rising in the two urban agglomerations; (2) in the coupling system, the driving factors were the economic development and the land input level dimensions in the Jing-Jin-Ji urban agglomeration, and the economic development and the land output level dimensions in the Yangtze River Delta urban agglomeration; and (3) the Jing-Jin-Ji urban agglomeration was always in the land input stage, while the Yangtze River Delta urban agglomeration had experienced the land utilization stage, the land input stage and the land output stage. In general, urban agglomeration, as a development mode, had indeed solved the imbalance in the coupling system. Although the coordination degree was unbalanced from 2003 to 2020, it increased and had a strong development momentum, approaching the balanced development (the Jing-Jin-JI urban agglomeration was 0.3493 and the Yangtze River Delta was 0.3611) in 2020, and achieving slightly balanced development in 2023, with barely balanced development in 2034 and superiorly balanced development in 2043 (Jing-Jin-Jin urban agglomeration) and in 2044 (Yangtze River Delta urban agglomeration). The research provides ideas for other countries to solve the uncoordinated development between urbanization and intensive land use.

1. Introduction

Land is the most important urban base, and its composition, structure, and dynamic change are the key to urban ecological sustainable development [1,2,3]. In 2020, more than 50% of the world’s population lived in cities covering 0.69% of the earth’s land surface area, and by 2100, the number of urban people is expected to exceed 80% [4,5]. In recent years, urban areas around the world have expanded rapidly along with urban population growth, affecting fragile natural habitats and threatening the achievement of the United Nations Sustainable Development Goal 15, “Life on Land” [6]. Unlike other land cover/land use forms, urban land expansion is one of the most visible, irreversible, and rapid types of change in contemporary human history, and is a key driver of many cross-scale environmental and social changes [7]. The construction of urban space is of guiding significance to the city’s dynamic change [8], and it is essential to explore the internal spatial development process in urban agglomeration, which is the main mode to promote the global urbanization. Five similar regional clusters in the post-Soviet cities, Krakow and Budapest, were analyzed via the cluster analysis method and the similarities and differences between urban regions were explored, with the largest differences found in the center and the suburbs [9]. And, there was a strong correlation between Urban Heat Island intensity in summer and cluster size in European contexts [10]. Furthermore, the study found that socioeconomic process affected urban form, which in turn had a considerable impact on the ecology of urban system, and the local and regional environment [11]. In highly urbanized areas, urban planners and policy makers should adopt land-saving strategies to keep large areas of green space undeveloped [12]. Land use diversity can measure the functional composition of urban land and reflect the structure of urban activities from a land perspective [13]. Existing studies mostly focus on the impact of urban land scale or function on the economy, society, eco-environment, and on energy use in the urbanization process. However, there are few studies on the efficient utilization of urban land scale and function; intensive land use may be the key promoting regional sustainable urbanization development. Intensive land use refers not only to the optimal use of land scale and functions, but also to the balanced development process between land use and multi-dimensional factors, such as the social dimension, economic dimension, and eco-environmental dimension.
There are many obstacles to the sustainable development of land use on the urban scale [14,15], which we try to overcome by utilizing the advantages of urban agglomeration (UA) in terms of material circulation, energy flow, and information transfer. UA is the most concentrated land use. During their development, the coordination between the urbanization process and the intensive land use has become a key issue. Some studies quantitatively evaluated, through the coupling coordination degree model, that the coordination degree of the eastern UAs is generally higher than that of the central and western regions. The Jing-Jin-Ji urban agglomeration (JJJ UA) and the Yangtze River Delta urban agglomeration (YRD UA) are two major UAs in easten China. It has been shown that the spatial pattern of the agglomeration capacity of urban factors in the YRD UA was more uniform than that in the JJJ UA [16]. Moreover, the urban land use efficiency of the YRD UA was better than that of the JJJ UA [17]. Through spatial econometric analysis, it has been indicated that the relationship between economic development and energy efficiency was an “inverted U-shape” in the JJJ UA, while it was an “S-shape” in the YRD UA. These studies did prove that the scale, efficiency, and development stage of land use had an important impact on the sustainable development in UA. However, the existing research is limited and lacks a systematic framework to ensure the stable intensive land use development at the UA scale, which leads to a lack of in-depth discussion on the development stage and development status between UA development—urbanization and intensive land use [18,19,20]. Urbanization and intensive land use need to develop together, and we should find a coordinated development method through concrete adjustment measures. However, there are few studies on the balanced relationship between urbanization development and intensive land use.
Urbanization reflects, comprehensively, regional society, economy, and eco-environment; intensive land use is the optimal allocation of regional land resources and provides a material basis for promoting natural resources development. The coordinated development between urbanization and intensive land use provides a solution for sustainable regional land resources. In view of the above background, we attempt to answer the following: (1) what is the index framework of the coordinated development between urbanization and intensive land use at the UA scale; (2) can UA, as a development mode, achieve the coordinated development of urbanization and intensive land use that cannot be reached at the urban scale; (3) which land use stage the UA is in; (4) what factors can be used as driving factors to ensure the coordinated development; and (5) how long does it take two UAs to realize intensive land use?
The evaluation of urbanization development has experienced the transformation from qualitative measurement to quantitative measurement, and from linear evaluation methods to nonlinear evaluation methods. The linear evaluation method simplifies urbanization development into a linear system, which is easy to calculate, but ignores the nature of the nonlinear system in urbanization development [21]. The nonlinear evaluation method restores the nonlinear essence of the urbanization development system, but the existing research lacks attention to the interrelation between the internal dimensions of the urbanization development system and the inner regions in UA, and the research results cannot reflect the correlation between the inner regions [22,23]. In this study, the CG-GSO model is used to evaluate the urbanization development level of UA, which is based on the Gravity model and the Gram–Schmidt Orthogonalization model, focusing on the interaction of the inner regions and the dimensional correlation in UA, as well as restoring the essence of the nonlinear system [24].
We will make a comparative analysis of the JJJ UA and the YRD UA in the following chapters: in Section 2, the research area, index system, data sources, and related models are introduced; in Section 3, the research results are described according to the urbanization development subsystem, intensive land use subsystem, coupling system and driving factors; in Section 4, we present discussions and policy analyses; and the conclusion is in Section 5.

2. Materials and Methods

2.1. Study Area, Index System and Data Source

As shown in Figure 1, the JJJ UA consists of Beijing (capital), Tianjin (municipality), and Hebei (province) [25]; the YRD UA integrated development region includes Shanghai (municipality), Jiangsu (province), Zhejiang (province), and Anhui (province) in the Outline of the Yangtze River Delta Regional Integrated Development Plan (2019). The JJJ UA belongs to the semi-arid temperate continental monsoon climate, and it is 21.50 ten thousand square kilometers which accounts for 2.3% of China’s land area; the YRD UA belongs to the subtropical monsoon climate, and it is 35.06 ten thousand square kilometers, which accounts for 3.7% of China’s land area. The JJJ UA and the YRD UA are known as two of China’s three economic growth poles, which play an important role in the urbanization process in China [26].
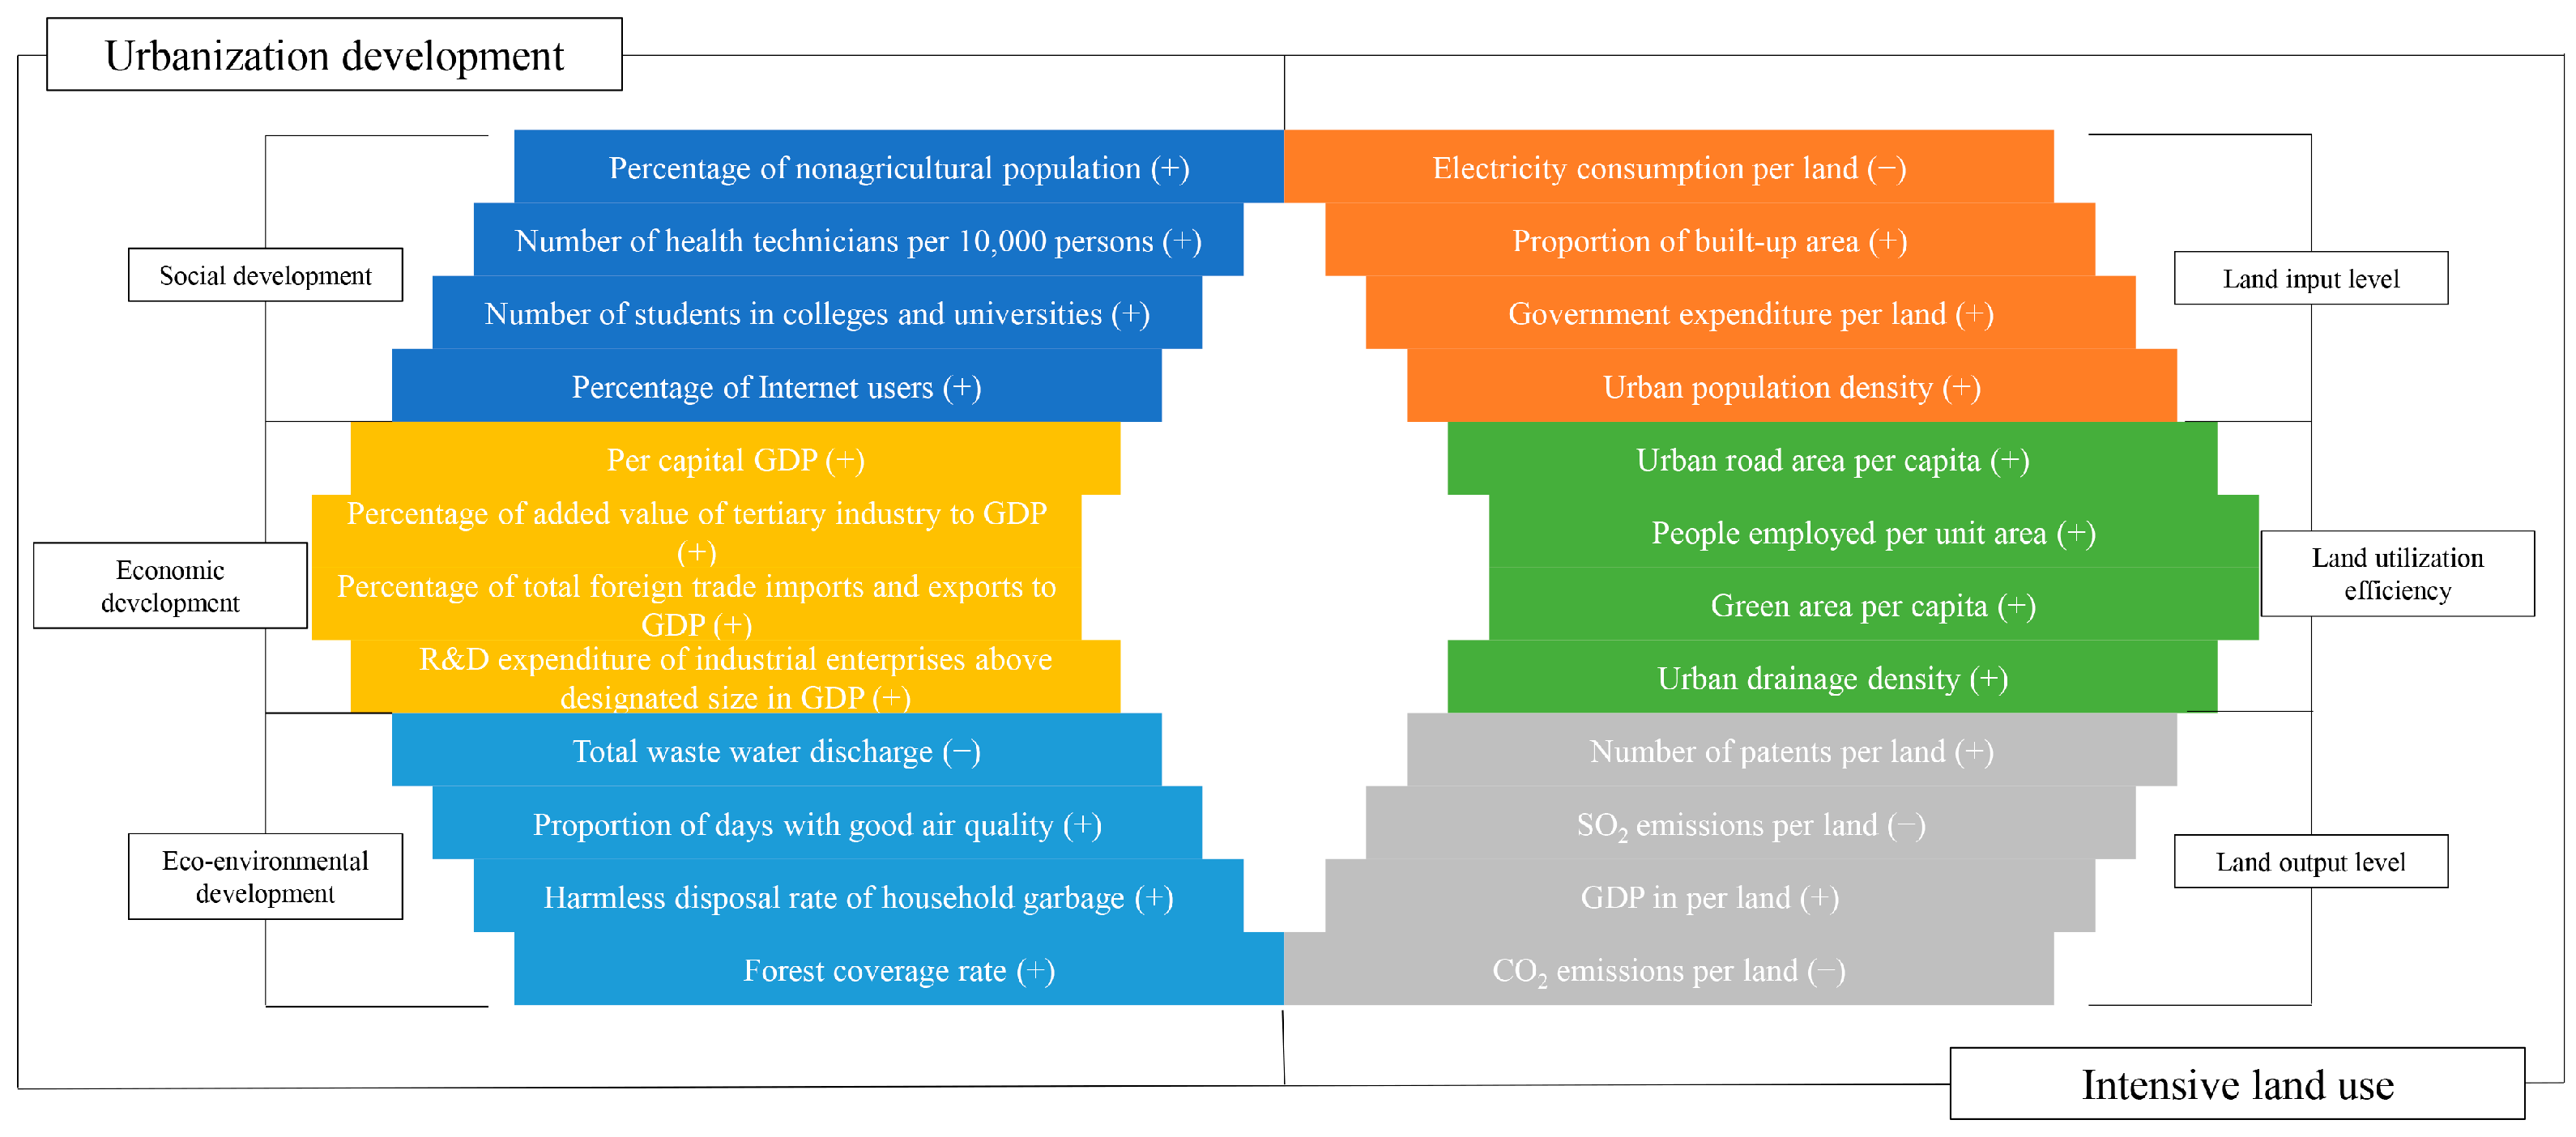
According to the comprehensive, systemic, scientific, and accessible principles of constructing index systems, the coupling system involves the urbanization development subsystem and intensive land use subsystem (Figure 2). The urbanization development subsystem is constituted by the social development dimension (SOD), economic development dimension (ECD), and eco-environmental development dimension (EED) [27], and includes 12 indicators; the intensive land use subsystem is reflected by the whole process of land use, that is, the land input level (LIL), the land utilization efficiency (LUE), and the land output level (LOL) dimensions [28], and includes 12 indicators.
The data of the urbanization development subsystem is obtained from China’s National and Local Statistical Yearbooks, Urban Statistical Yearbooks, Economic Statistical Yearbooks, Industrial Statistical Yearbooks, Science and Technology Statistical Yearbooks, Traffic Statistical Yearbooks, Environmental Statistical Yearbooks, and environmental monitoring data, which is from the Ministry of Ecology and Environment of China. The data of the intensive land use subsystem is obtained via calculation, and the specific information is shown in Table 1.
Based on the above data sources, we used SPSS software (SPSS Statistics 26.0) and R 4.5.0 software to analyze the coupling system between urbanization development and intensive land use in the JJJ and the YRD UAs from 2003 to 2020.

2.2. Methodology

The methodology involves the entropy weight method, the CG-GSO model, and the coupling coordination degree model.

2.2.1. The Entropy Weight Method

The entropy weight method uses information entropy to determine weight objectively and is widely used in existing research [29] as follows:
X i j = ( X i j m i n { X j } ) / ( m a x { X j } m i n { X j } )   ( + )
X i j = ( max { X j } X i j ) / ( m a x { X j } m i n { X j } )   ( )
H α = k β = 1 n f α β l n f α β   ( α   =   1 , 2 , 3 , , m ;   β   =   1 , 2 , 3 , , n )
W α = 1 H α n α = 1 n H α
k = 1 / l n n
Formulas (1) and (2) are applicable to the positive indicators and the negative indicators, respectively.
When using these formulae, Xij is indicator j in year i;
max{Xj} and min{Xj} are the maximum and the minimum indicator j among all years, respectively;
and when we reached 0 in the process, we used 0.0001 instead of the normalized 0.
In the Formula (3), Hα is the entropy of the αth indicator;
fαβ is the proportion of the βth evaluation object in the αth indicator;
and m and n are the number of evaluation indicators and the number of evaluation objects, respectively.
In the Formula (4), Wα represents the entropy weight of αth indicator, and 0 ≤ Wα ≤ 1, α = 1 n H α   = 1.
Finally, in the Formula (5), k is the coefficient.

2.2.2. The CG-GSO Model

The CG-GSO model focuses on the influence of the inner regional real nonlinear internal relationship on the comprehensive urbanization development of UA, which is based on the Comprehensive Gravity model and the Gram–Schmidt Orthogonalization method.
G m n = R I m I n T R b + w I m I n T w b
b 1 = a 1
b 2 = a 2 [ a 2 , b 1 ] [ b 1 , b 1 ] b 1
b 3 = a 3 a 3 , b 1 b 1 , b 1 b 1 a 3 , b 2 b 2 , b 2 b 2
The Formula (6) is based on the Comprehensive Gravity model; Gmn is the interaction force between city M and city N; and Im and In are the comprehensive quality of city m and city n in different dimensions.
Additionally, R is the weights of railway transportation mode from 2003 to 2020—the value is 52.81% in the JJJ UA, and at the same time, the value is 52.53% in the YRD UA;
W is the weights of road transportation mode from 2003 to 2020—the value is 47.19% in the JJJ UA and the value is 47.47% in the YRD UA;
T R b and T W b are the comprehensive “time distance (shortest time)” between city m and city n under railway and road transportation modes;
And b is the distance attenuation coefficient, and it is 1.5 [30,31].
In the Formulas (7)–(9), a 1 ,   a 2 ,   and   a 3 are the primitive vector groups, which represent the original dimensions;
at the same time, b 1 , b 2 , and b 3 are the orthogonal vector groups.
The relevant calculations are carried out in R studio software.

2.2.3. The Coupling Coordination Degree Model

The coupling coordination degree model evaluates the degree to which multiple systems are coupled in various ways. The caluclation was carried out using SPSS software.
C = { f x g y [ f x + g y 2 ] 2 } k
T = d f x + e g y
D = C T
In the Formulas (10)–(12), C is the coupling degree between f(x) and g(y);
f(x) is the urbanization development subsystem; g(y) is the intensive land use subsystem;
k is the regulatory factor, which depends on the number of coupling subsystems;
T is the comprehensive development index;
d and e are the undetermined coefficients, which reflect the contribution of the two subsystems to the coordinated development, and, considering that the urbanization development subsystem and the intensive land use subsystem are equally important, d = e = 1/2 is assigned;
and D is the coupling coordination degree. The classification of the coupling degree and coordination degree are shown in Table 2.

2.2.4. Gray Prediction Model GM (1,1)

For a data series, a new series with an obvious change trend is generated by the method of accumulation, the model is established and predicted for the new data series, then the method of accumulation is used to reverse the calculation to restore it to the original sequence, so as to obtain the prediction result.
X 0 = ( X 0 1 , X 0 2 , , X 0 M )
X 1 t + 1 = X 0 1 b a e a t + b a
X ( 0 ) is the raw data series and X ( 1 ) is the new series.
A and B are identification parameters, which can be obtained by least square fitting.
The building matrix is as follows:
a ¯ = ( B T B ) 1 B T Y = a , b T
The prediction model is as follows:
X ( 0 ) ^ t + 1 = a X ( 0 ) 1 b a e a t

3. Results

3.1. Urbanization Development Subsystem

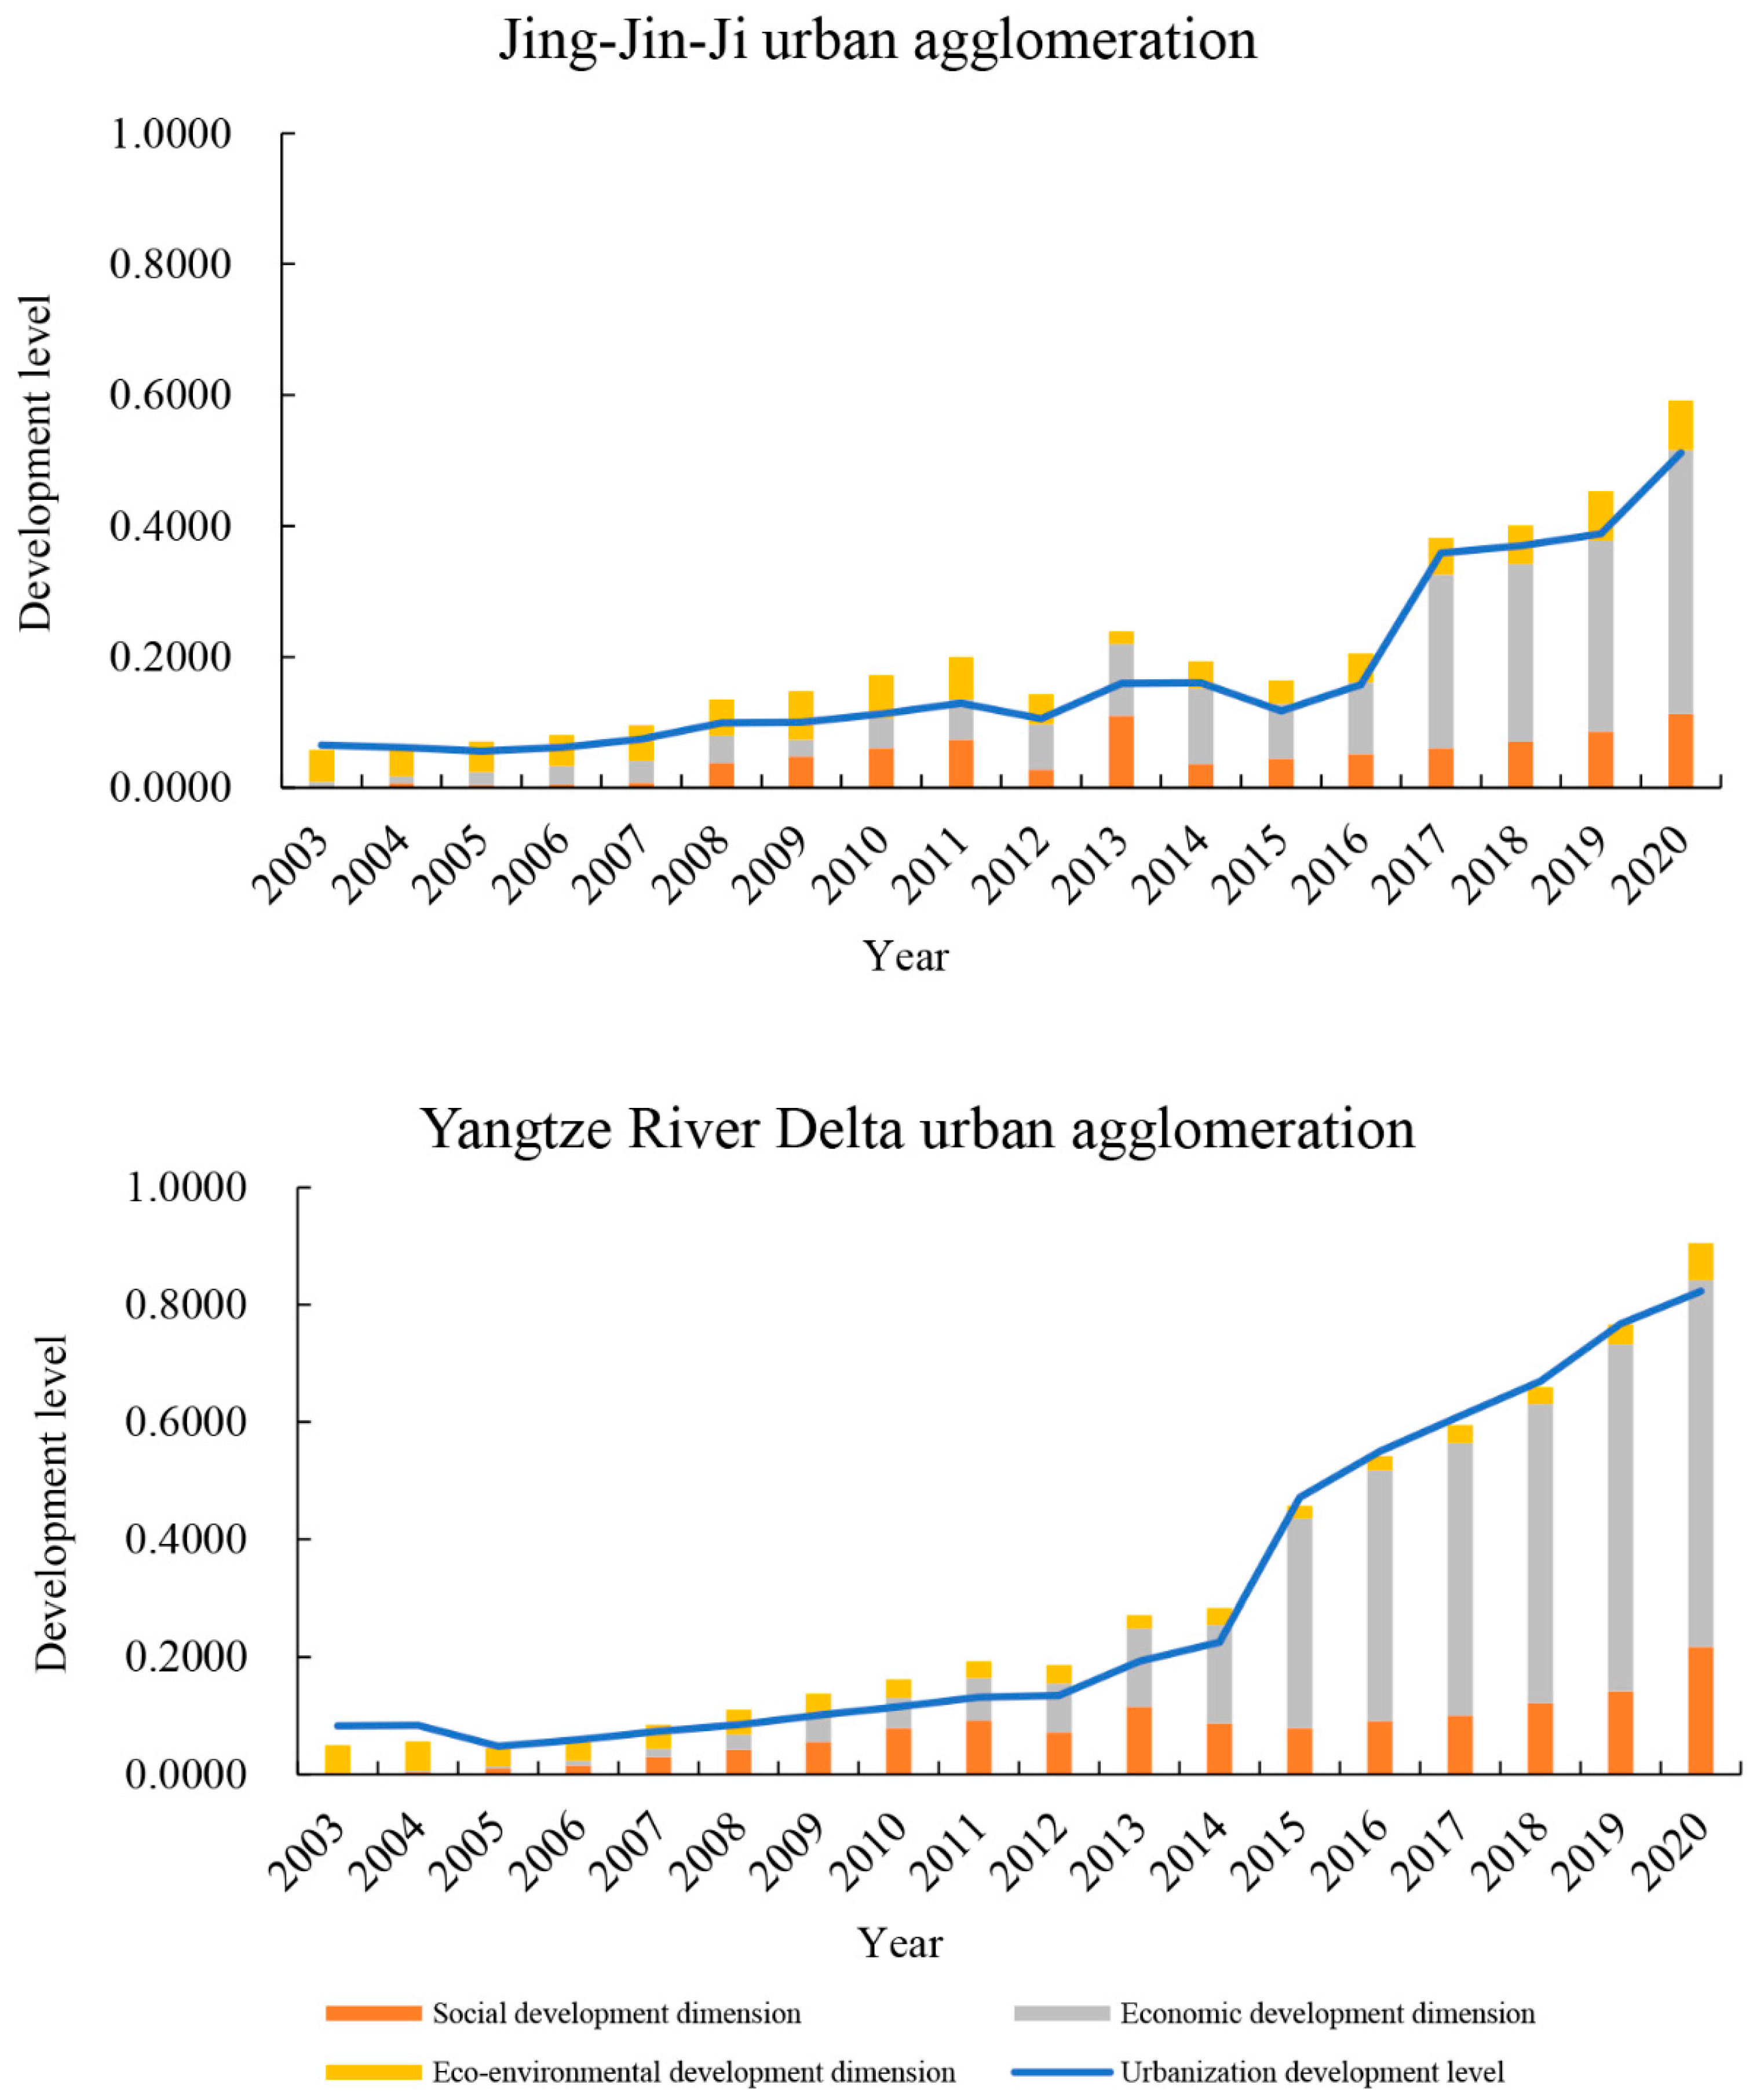
Through the CG-GSo model, we obtained the comprehensive urbanization development level and the dimensional urbanization development level, as shown in Figure 3. The overall comprehensive urbanization development level showed upward trends in the JJJ and the YRD UAs. The JJJ UA increased from 0.0651 in 2003 to 0.5116 in 2020, whilst the YRD UA increased upward from 0.0883 in 2003 to 0.8231 in 2020. The average annual urbanization growth rate was 12.89% in the JJJ UA, while it was 13.57% in the YRD UA. It showed that the urbanization development of the YRD UA was not only higher than that of the JJJ UA, but also had a stronger development momentum. The result proved that, during 2000–2020, the YRD UA was in a rapid urbanization development stage [32,33]. In the JJJ UA, the ECD continued to increase, while the SOD and the EEDs fluctuated. In the YRD UA, the SOD and the ECDs showed overall upward trends, while the EED was a fluctuating development trend. Therefore, in the two UAs, the ECD and the urbanization development level were both rising, which confirmed that urbanization promoted economic growth, as well as that the relationship between economic growth and urbanization was a benign interaction [34].

3.2. Intensive Land Use Subsystem

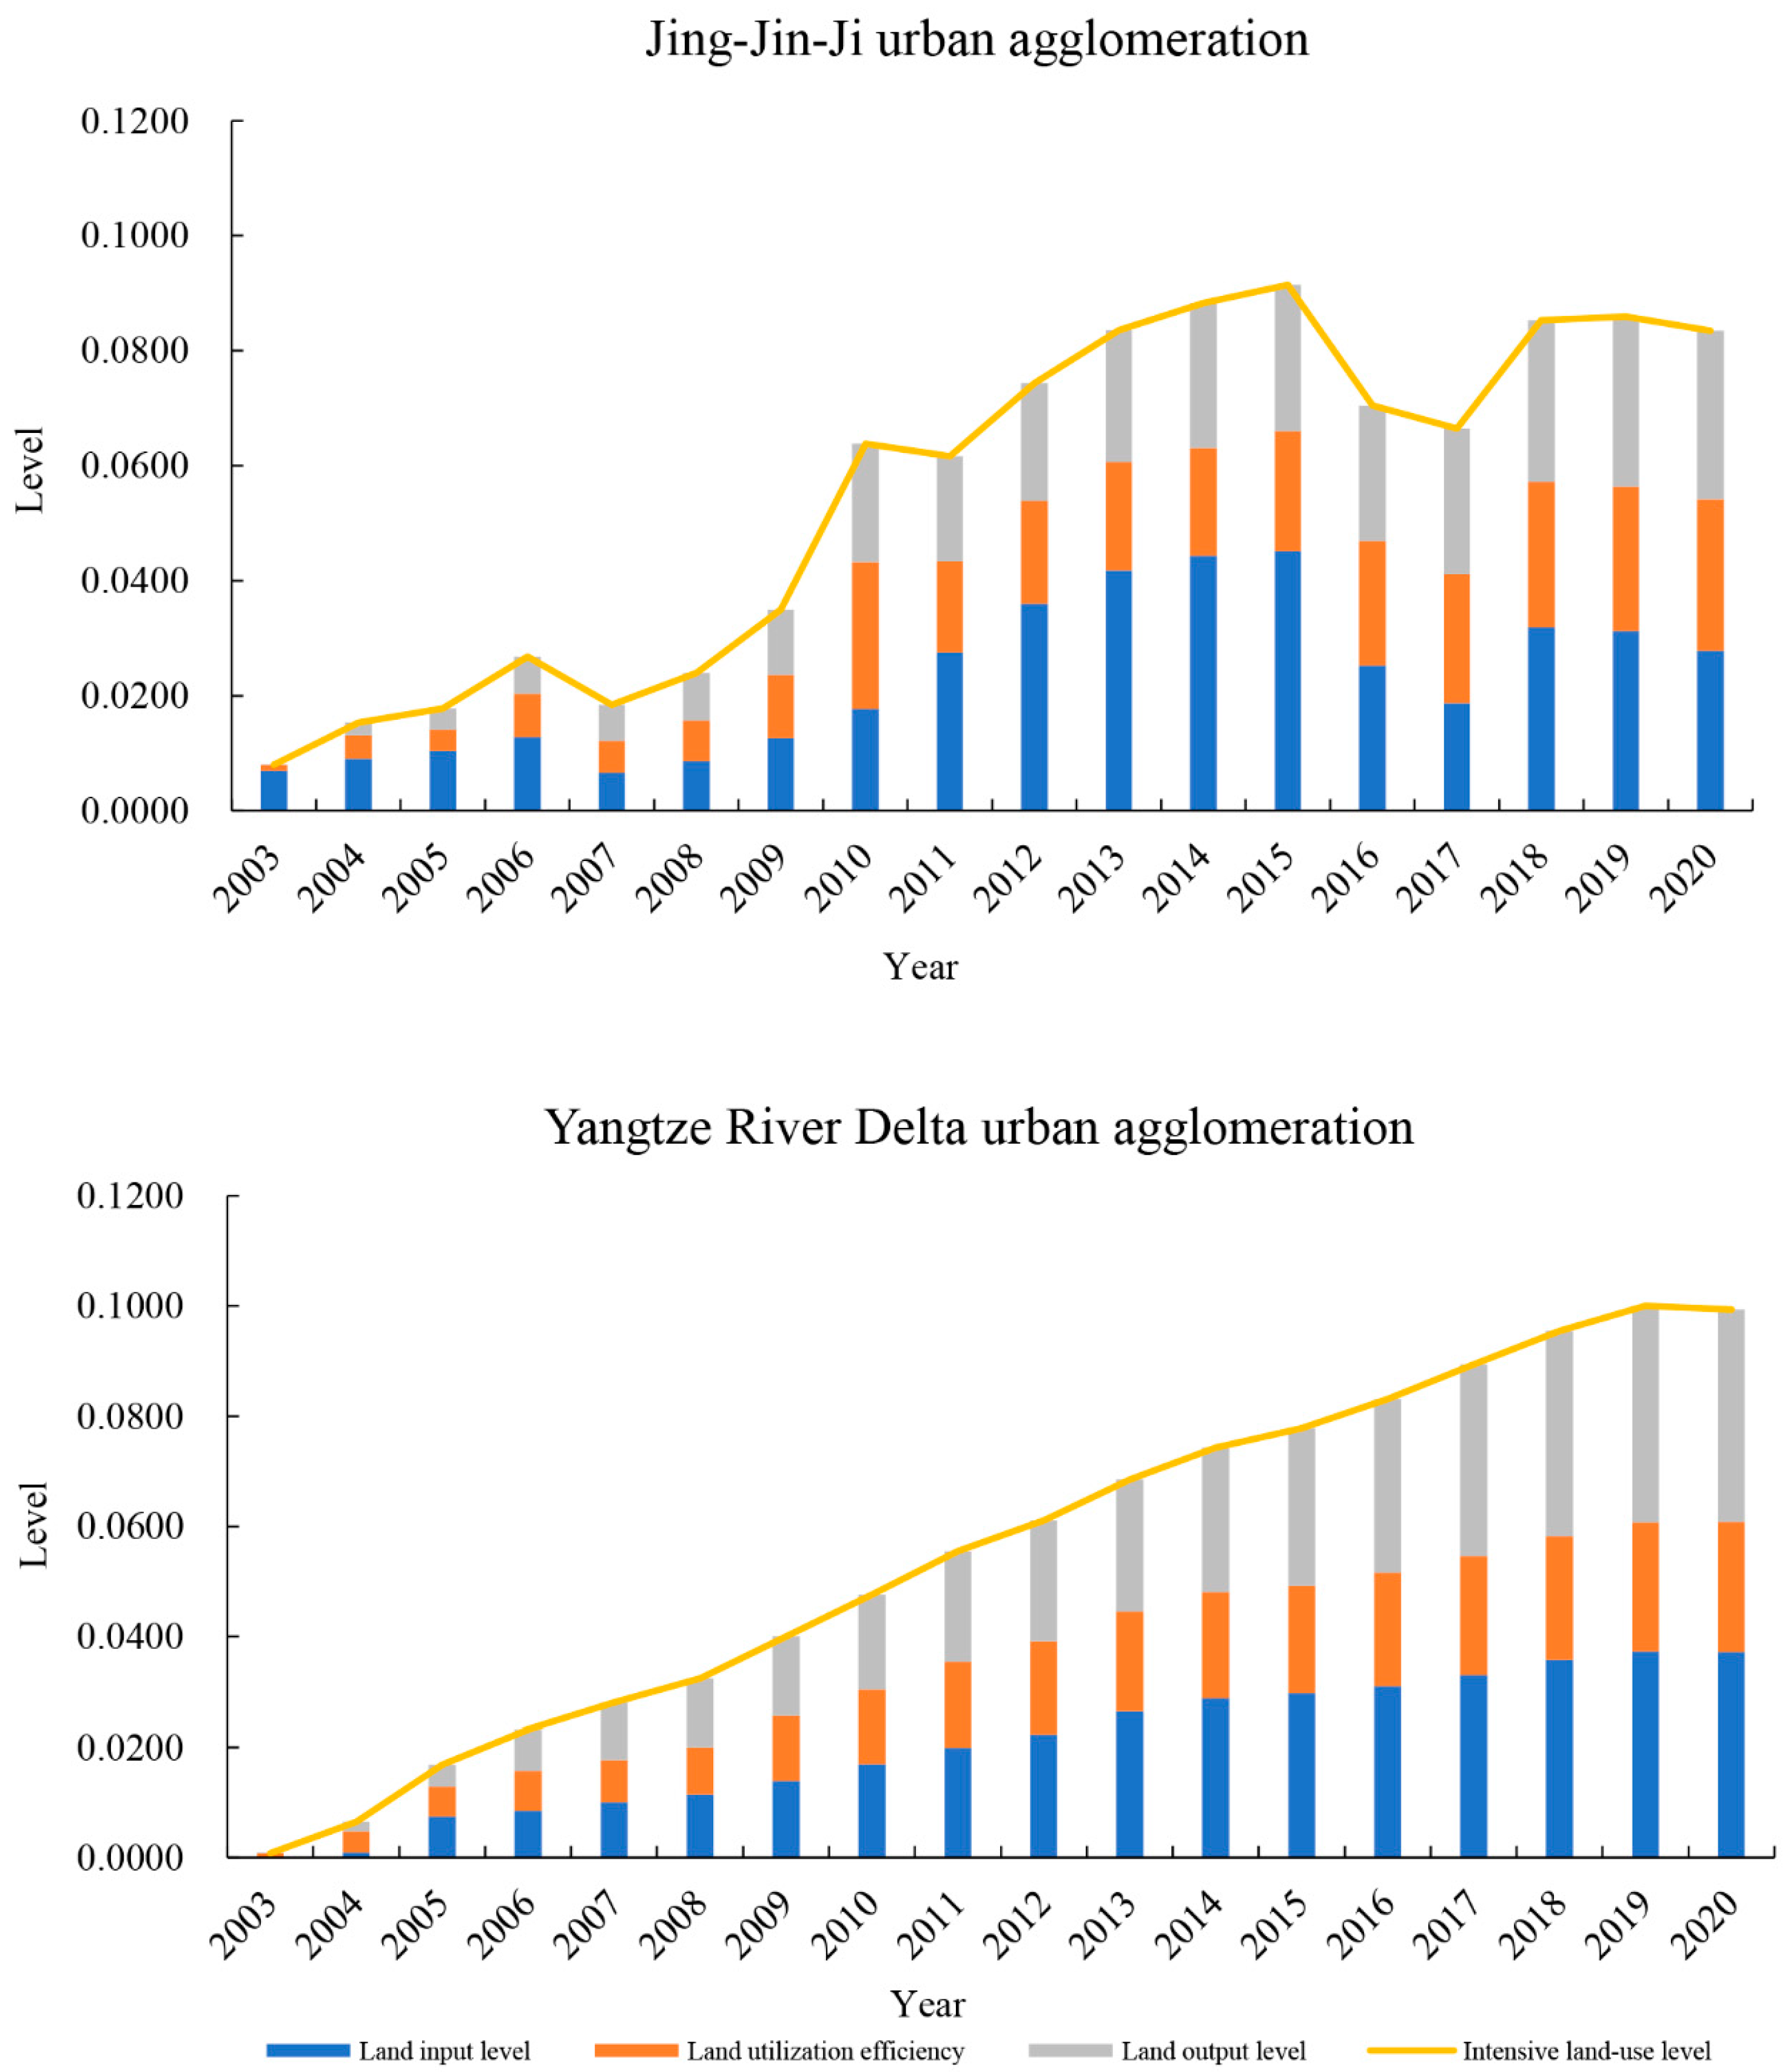
Rapid urbanization has brought about unbalanced land use structure and low land use efficiency. With the deepening of China’s urbanization process, the scarcity of land resources has gradually been unable to adapt to the “rigid demand” of rapid urbanization [35]. In Figure 4, the intensive land use level showed a fluctuating upward trend in the JJJ UA, from 0.0080 in 2003 to 0.0834 in 2020, while there was a steady upward trend in the YRD UA, from 0.0008 in 2003 to 0.0993 in 2020. The average annual intensive land use growth rate was 14.43% in the JJJ UA, and it was 30.85% in the YRD UA. During the study period, although the intensive land use level was high in the beginning in the JJJ UA, the development momentum of the intensive land use subsystem was stronger in the YRD UA, which was 19.06% higher than that of the JJJ UA in 2020. There has been a potential downward trend in the JJJ UA, mainly influenced by multiple factors such as regional development imbalance, resource constraints, and environmental limitations. These years coincided with crucial periods of policy deepening and adjustment, as well as a slowdown in economic growth, which led to fluctuations in short-term land utilization efficiency. In regard to the dimensional perspective, in the JJJ UA, the LUE dimension and the LOL dimension were fluctuating and increasing, while the LIL dimension showed an invert “U” curve and the maximum value was 0.0452 in 2015. In the YRD UA, the LIL, the LUE, and the LOL dimensions were steady upward from 2003 to 2020. Therefore, both from the subsystem’s perspective and the dimensional perspective, the intensive land use development in the YRD UA was more stable than that in the JJJ UA. It supported that the YRD basin had highly intensive land use [36].

3.3. Coordination Development Level of the Coupling System

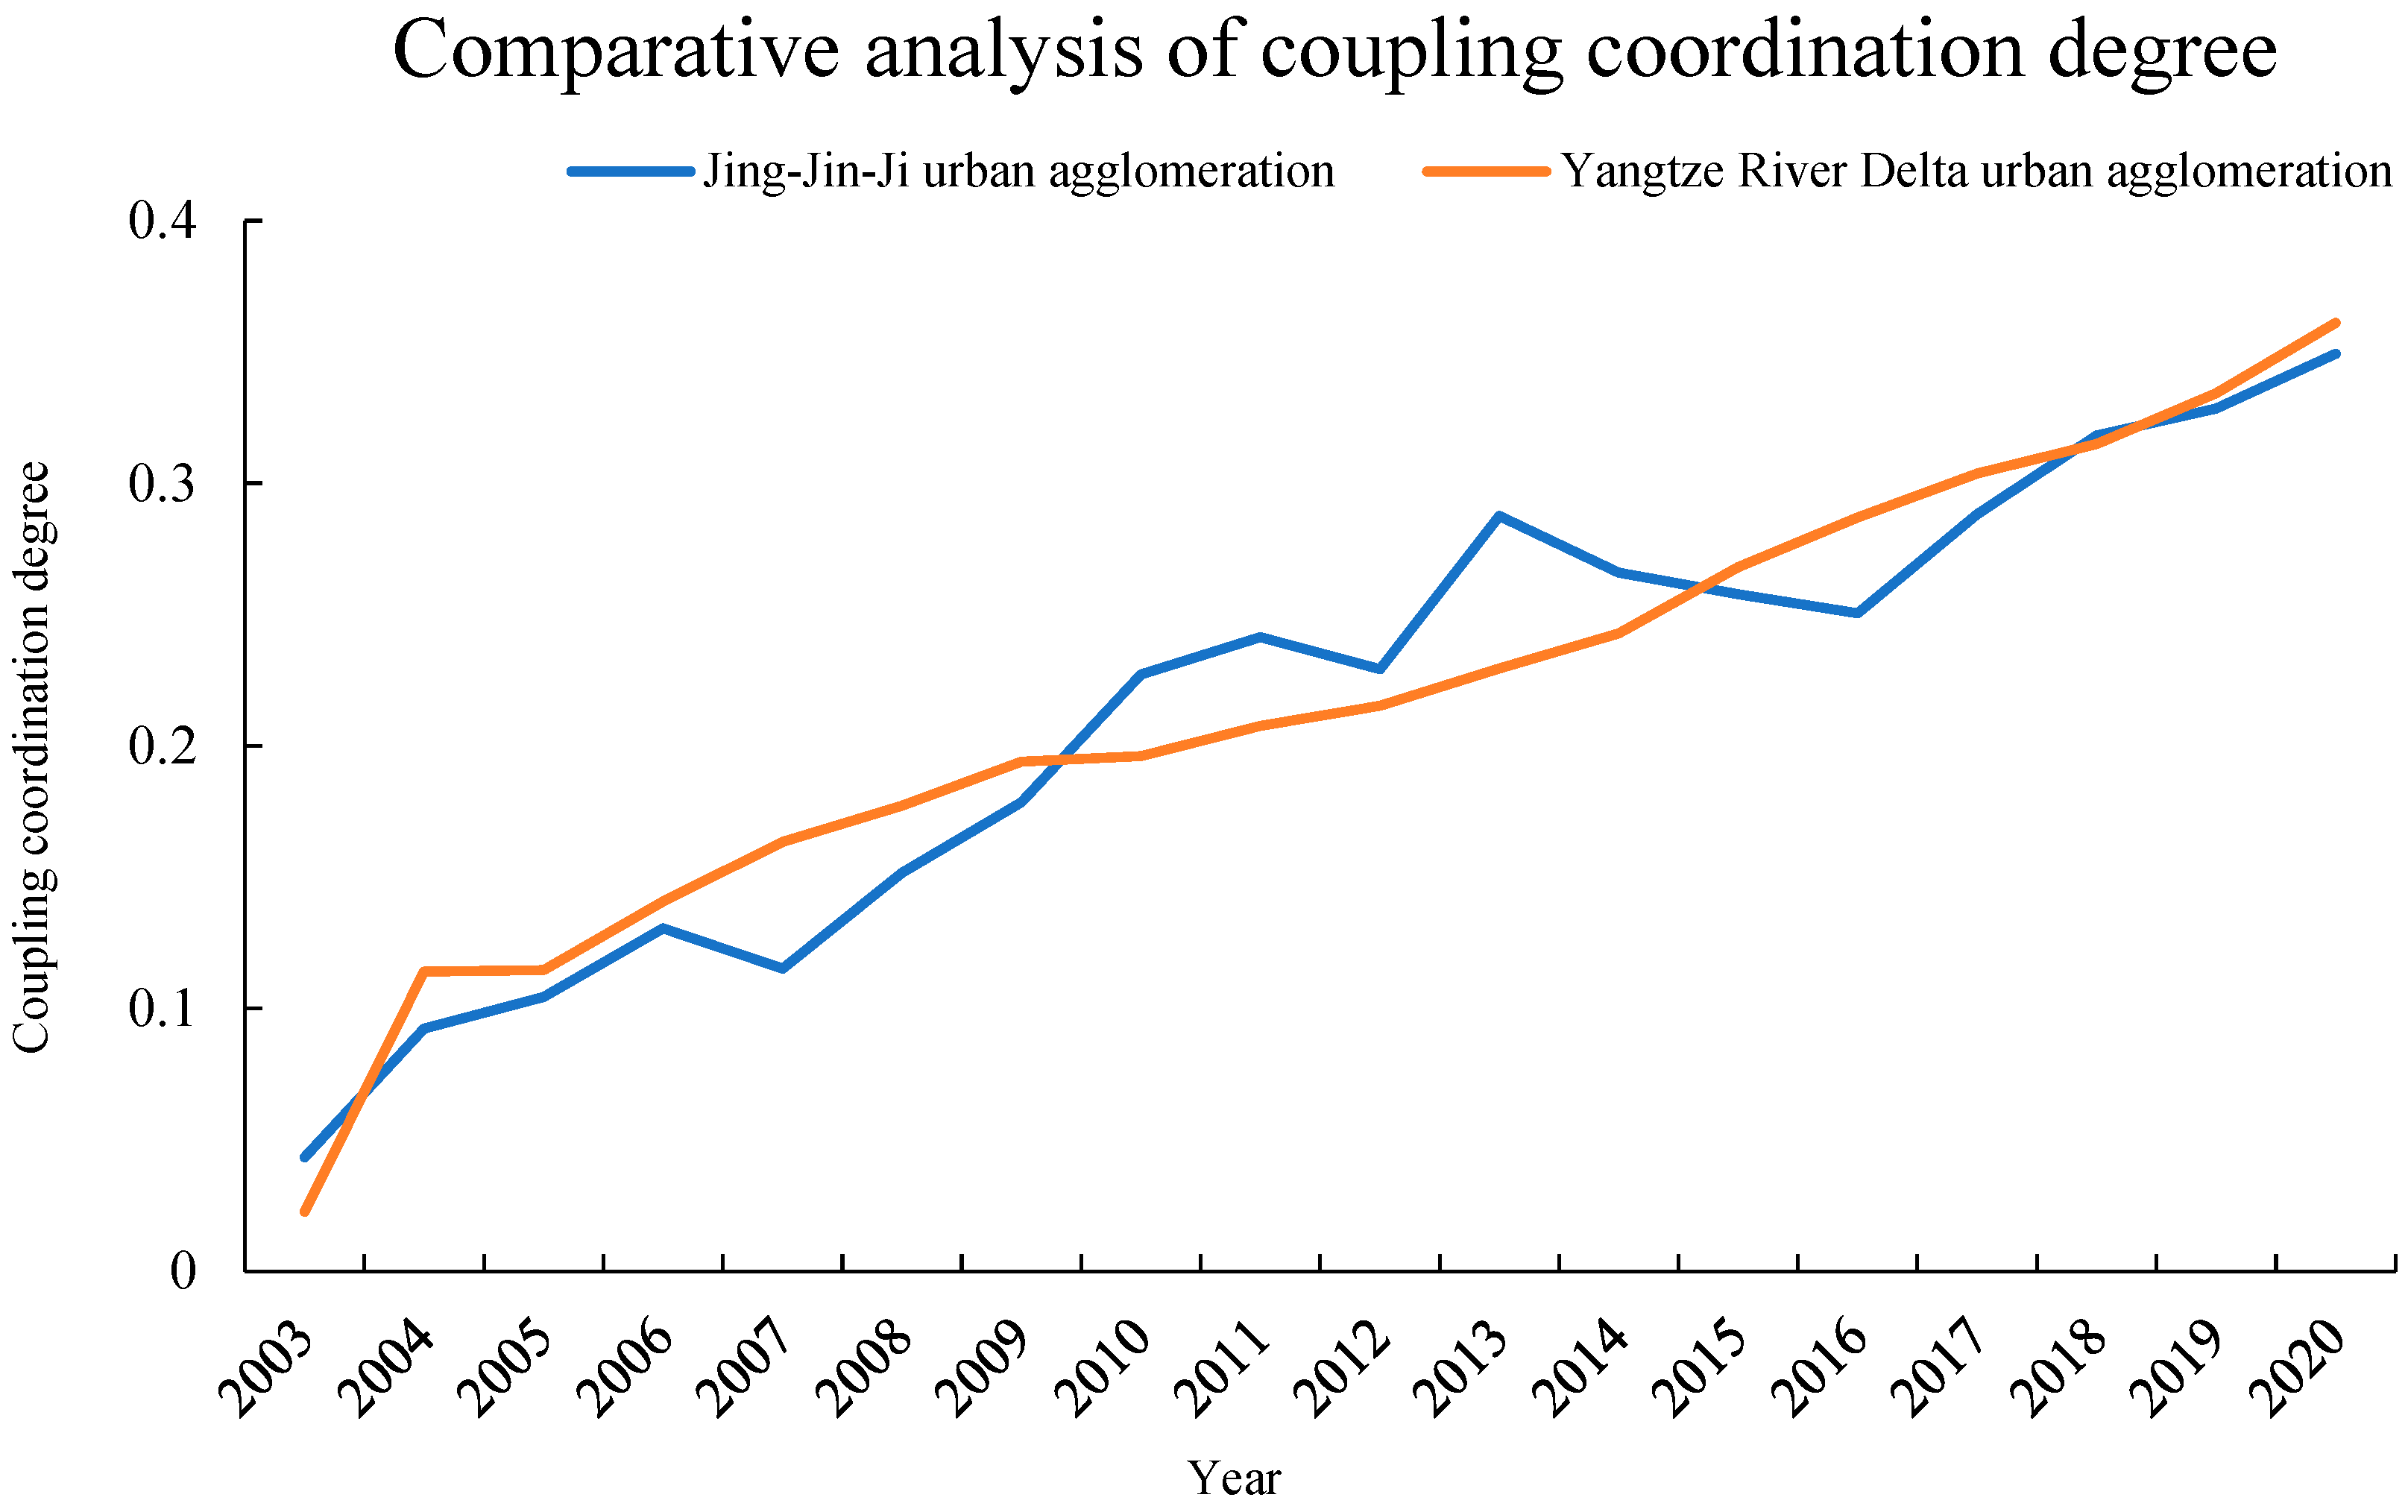
The coupling coordination degree of the coupling system between urbanization development and intensive land use is shown in Figure 5. The coordination development level of the JJJ UA was similar to that of the YRD UA, showing an upward trend from 2003 to 2020, and presenting advantages alternately. In the JJJ UA, the coupling coordination degree improved from 0.0435 (extreme unbalanced development) in 2003 to 0.3493 (moderate unbalanced development) in 2020; in the YRD UA, the coupling coordination degree improved from 0.0227 (extreme unbalanced development) in 2003 to 0.3611 (moderate unbalanced development) in 2020. It indicated that although the coordination degree of the coupling system did not achieve coordinated development in the two UAs, the coupling coordination degree did improve a lot and was close to slightly balanced development (0.4) in 2020.
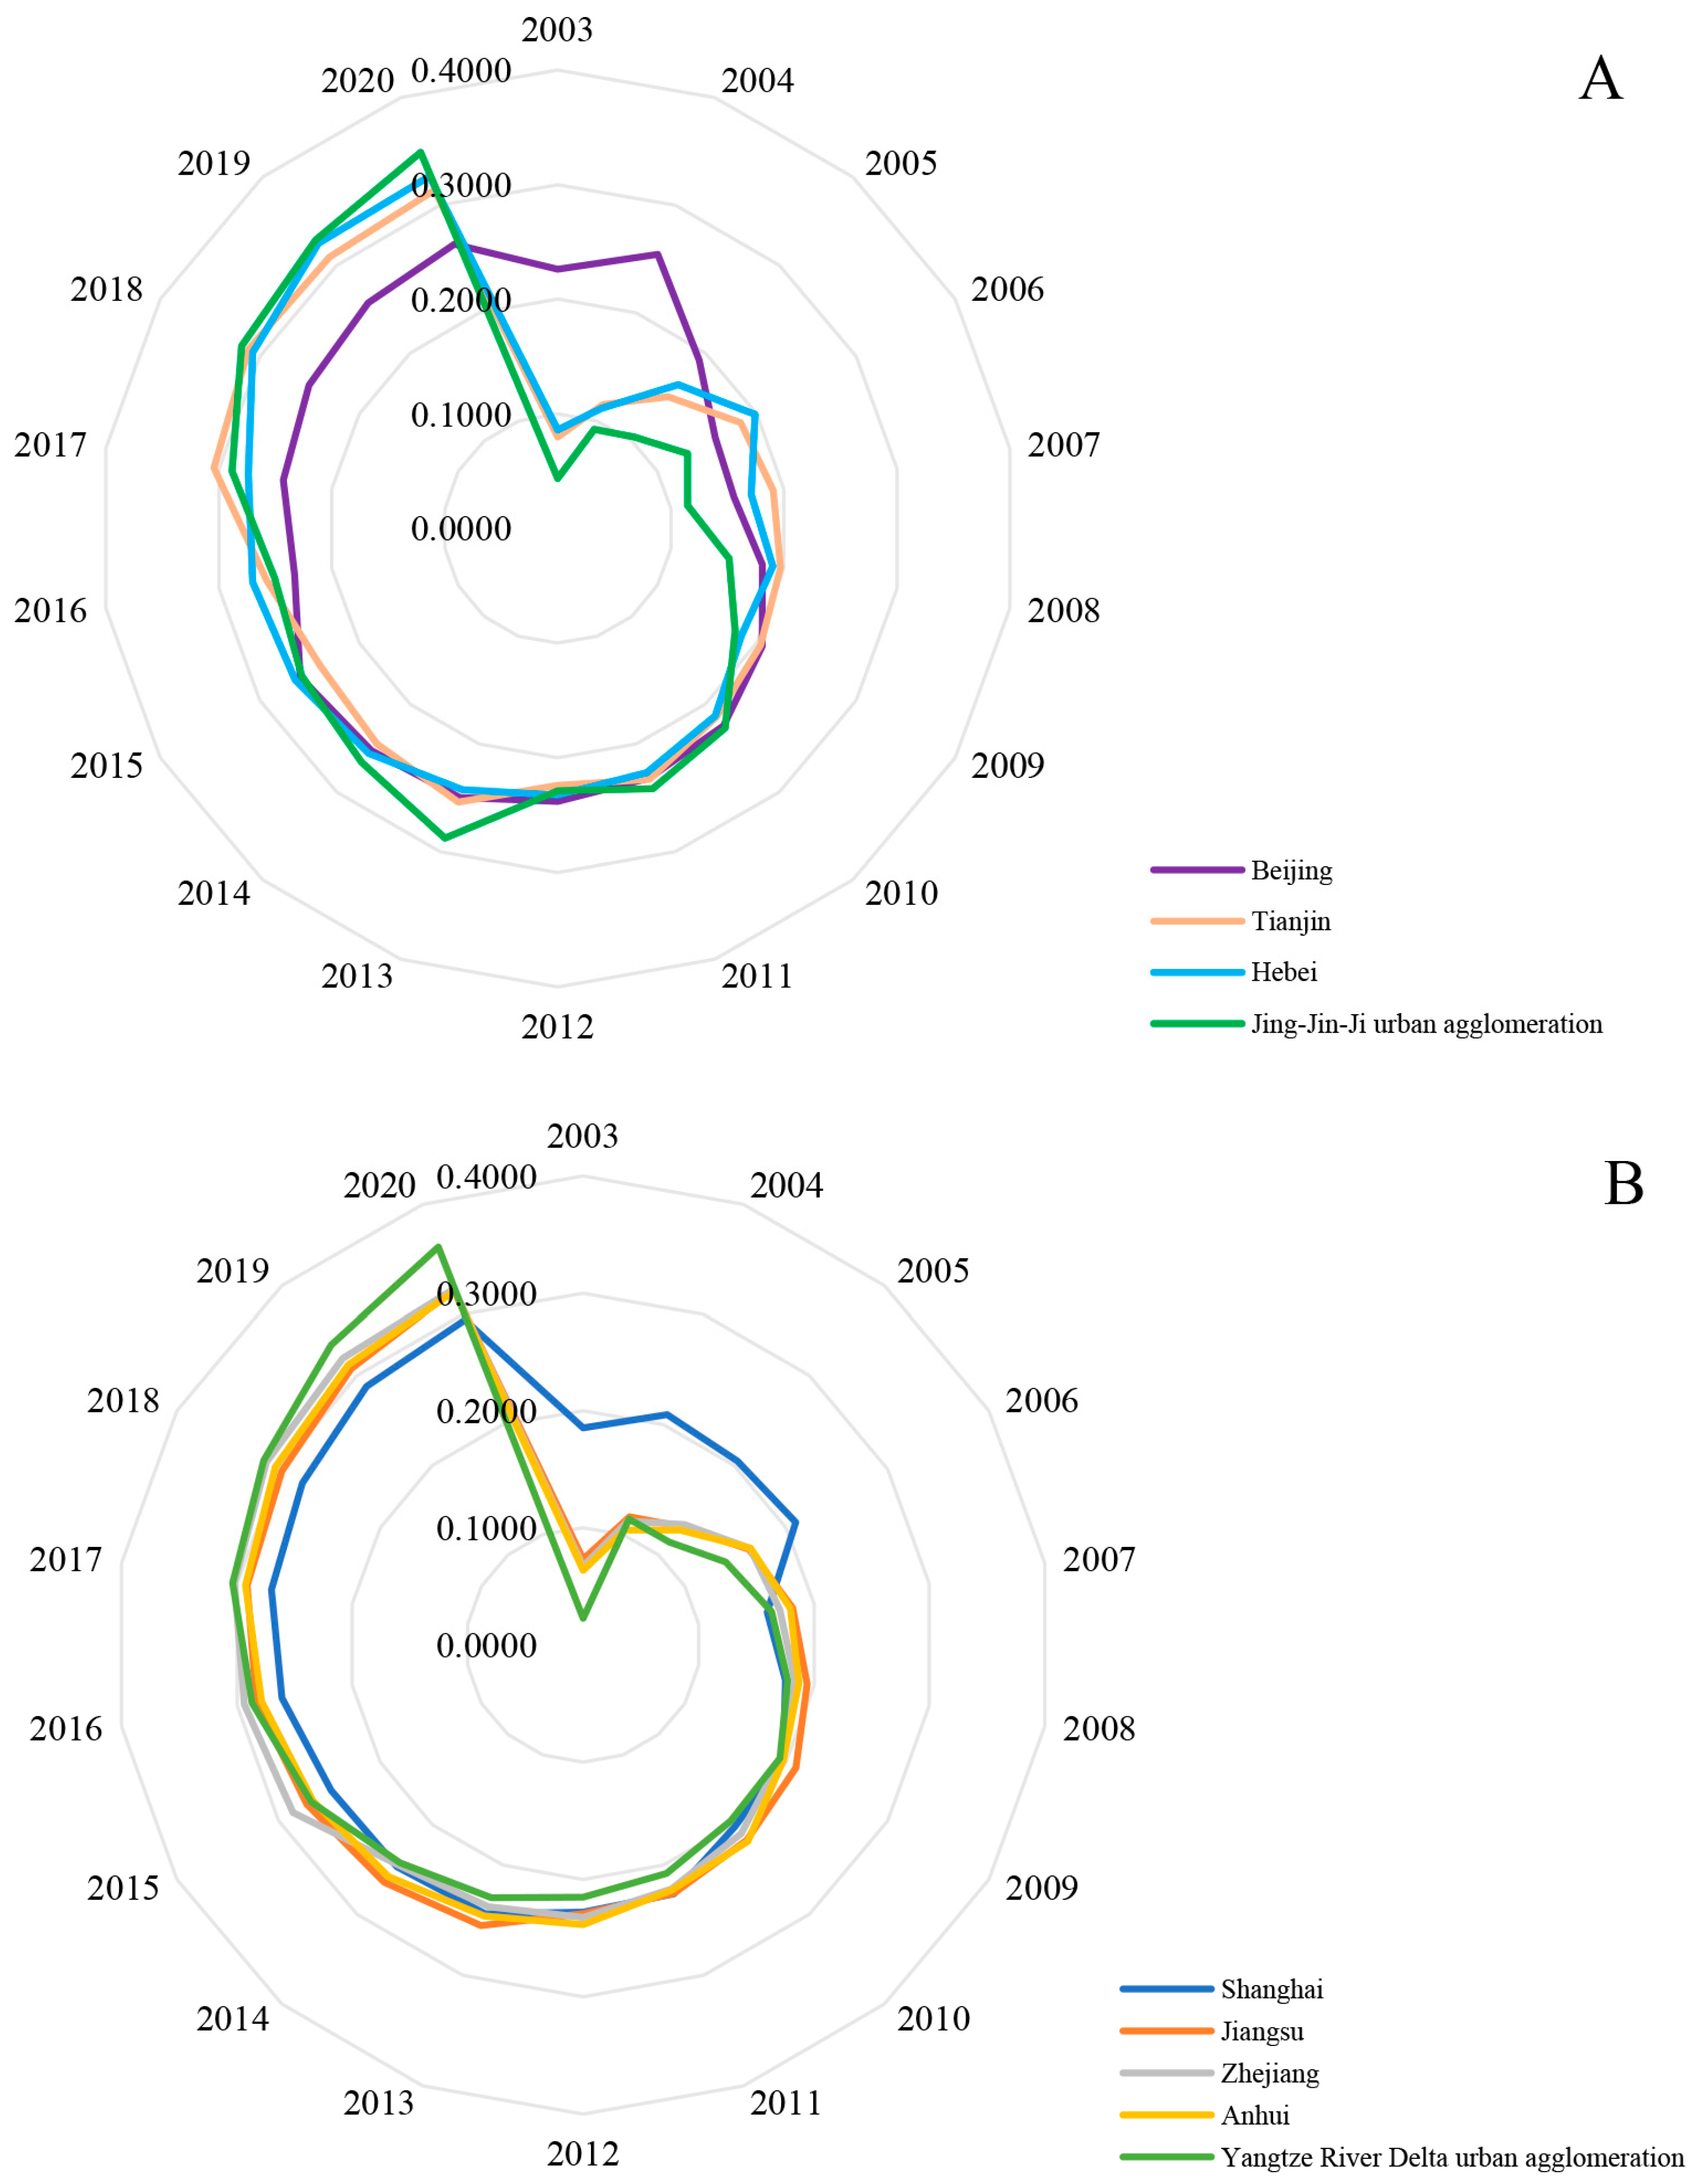
In addition, compared with inner regions, the coupling system of UAs had the lowest coupling coordination degree (Beijing was 0.2260, Tianjin was 0.0799, Hebei was 0.0859, and the JJJ UA was 0.0435; and Shanghai was 0.1854, Jiangsu was 0.0731, Zhejiang was 0.0670, Anhui was 0.0636, and the YRD UA was 0.0227) in 2003 and the highest coupling coordination degree (Beijing was 0.2640, Tianjin was 0.3142, Hebei was 0.3270, and the JJJ UA was 0.3493; and Shanghai was 0.2951, Jiangsu was 0.3223, Zhejiang was 0.3229, Anhui was 0.3209, and the YRD UA was 0.3611) in 2020, which confirmed that the development mode of UA was more conductive to promoting the coordinated development between urbanization and intensive land use (Figure 6). It indicated that the optimal allocation of internal regions promoted the coupling coordination development between urbanization development and intensive land use in UAs.
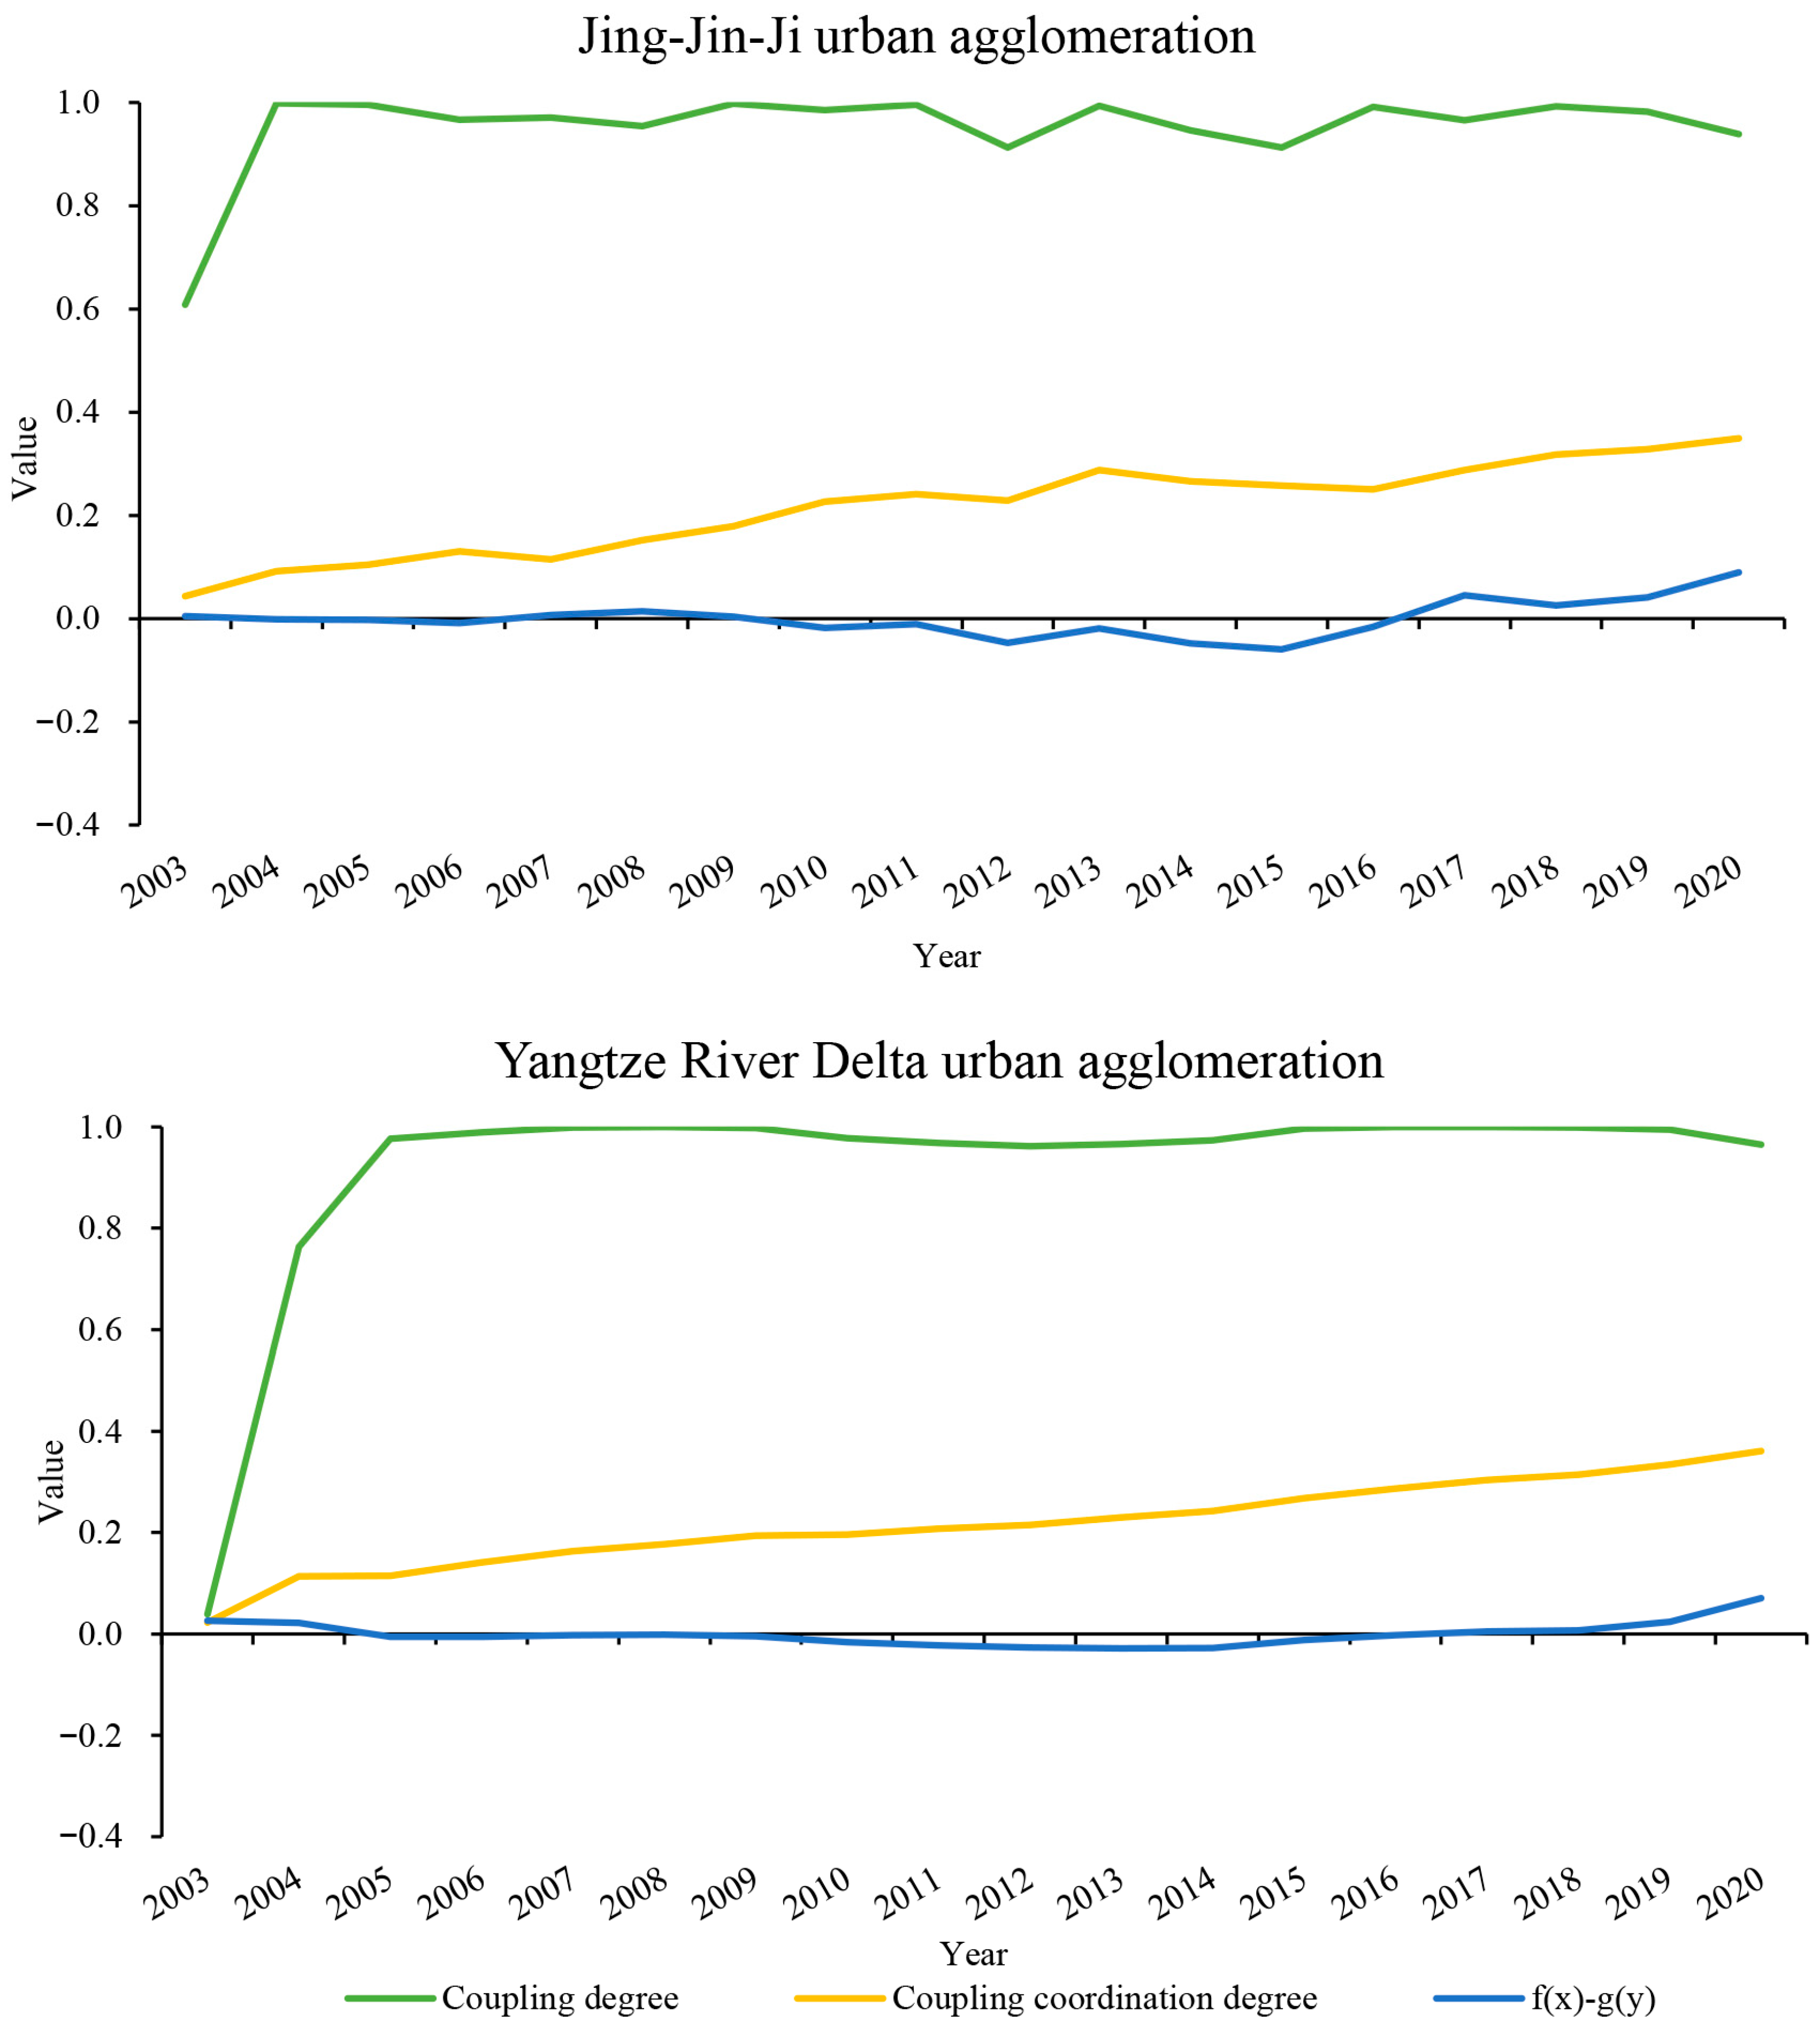
From 2003 to 2020, in the two UAs, the coupling degree first increased, then developed steadily; there were observed upward coordinated trends in the coupling system between urbanization development and intensive land use (Figure 7). To be specific, during 2003–2009, the coupling coordination degree was in extreme unbalanced development (from 0.0435 to 0.1785), and during 2010–2020, the coupling coordination degree was in moderate unbalanced development (from 0.2271 to 0.3493) in the JJJ UA. During 2003–2010, the coupling coordination degree was in extreme unbalanced development (from 0.0227 to 0.1961), and during 2011–2020, the coupling coordination degree was in moderate unbalanced development (from 0.2076 to 0.3611) in the YRD UA. Furthermore, in the JJJ UA, in 2003, 2007–2009, and 2017–2020, the coupling system between urbanization development and intensive land use was in the lagging intensive land use subsystem, and in 2004–2006 and 2010–2016, the coupling system between urbanization development and intensive land use was in the lagging urbanization development subsystem. In the YRD UA, the coupling system between urbanization development and intensive land use was in the lagging intensive land use subsystem in 2003–2004 and 2017–2020, and the coupling system between urbanization development and intensive land use was in the lagging urbanization development subsystem in 2005–2016. Although the coupling coordination degree of the coupling system had not reached balanced development in the JJJ and the YRD UAs, compared with the internal regions, the coupling coordination degree showed upward trends and a stronger development momentum (Figure 6), which was only one step away from balanced development (0.4). It showed that the relationship of urbanization development and intensive land use had improved and was trending towards coordination. Meanwhile, in the two UAs, the difference in the urbanization development subsystem and the intensive land use subsystem was small and showed a fluctuating development state (−0.1 ≤ f(x) − g(y) ≤ 0.1), which indicated that it was in parallel development between subsystems.

3.4. Analysis of Driving Factors

The driving factors are shown in Table 3. It indicates that the ECD (0.5595) in the urbanization development subsystem and the LIL dimension (0.4530) in the intensive land use subsystem were the driving factors facilitating coordinated development in the JJJ UA. During the study period, the JJJ UA experienced economic transformation, namely moving from heavy industry to services and high value-added manufacturing [37]. This transformation increased the share of the tertiary industry, promoted foreign trade, and improved enterprises’ scientific and technological research and development level, making it account for 8.5% of the national GDP in 2020, which boosted rapid economic development. It is found that, compared with the YRD UA and the PRD UA (Pearl River Delta urban agglomeration), the JJJ UA had the highest urban growth rate and scale [38,39], which was reflected in the increasing fixed asset investments, the proportion of built-up areas, and the adding to fiscal expenditure. In addition, since the JJJ UA contained China’s political, cultural, and economic center (Beijing), a key port region (Tianjin), and a heavy industry intensive region (Hebei), it had a population siphon effect on its surrounding areas, raising the population employment rate in the region. These factors promoted the improvement of the LIL dimension, which accounted for the highest proportion in the intensive land use subsystem.
In the YRD UA, the ECD in the urbanization development subsystem and the LOL dimension in the intensive land use subsystem were the driving factors in the coupling system between urbanization development and intensive land use. The YRD UA, as the leading area of China’s economic development, had large information and communication technology industries; in 2019, the revenue from the software industry accounted for 31.28% of the total national income, and the revenue from the information technology service industry accounted for 31.03% of the total national income [40]. It promoted sustained and high-speed economic development. Meanwhile, the Ecological Protection Red Line strategy was implemented in China, which aimed to protect important ecosystems in 2011. Around the YRD UA, 28,995 square kilometers of land had been designated as protected areas, including the Yangtze River shoreline, and important wetlands, forests, and grasslands, which achieved land protection and improved the land coverage rate [41]. The YRD region was the global center of manufacturing and exporter of many industrial and consumer goods; it was closely related to global consumption through the supply chain, which meant the secondary and tertiary industries developed, and GDP increased [42]. This enhanced the land output level.

4. Discussion and Policy Implications

4.1. Urbanization, Intensive Land Use, and the Coupling System

A UA is a cluster of highly connected cities, which were nested within a complex trading network [43]. This study used the CG-GSO model to explore comprehensive and dimensional urbanization development, on the basis of restoring the internal relationships in the JJJ and the YRD UAs. Compared with other evaluation methods of urbanization development [44], the CG-GSO model tries to restore the essence of the nonlinear system of UAs, which enriches the theoretical research on urbanization development [24]. In contrast with previous research [24,33,45], based on the focus and system construction, we built the urbanization index system on the three dimensions of SOD, ECD, and EED, carried out the comparative analysis of the urbanization development in the JJJ and the YRD UAs, realizing the innovation of an index system. This was not only valuable for the study of urbanization development at the UA scale, but also had certain reference value for the study of urban and national urbanization development.
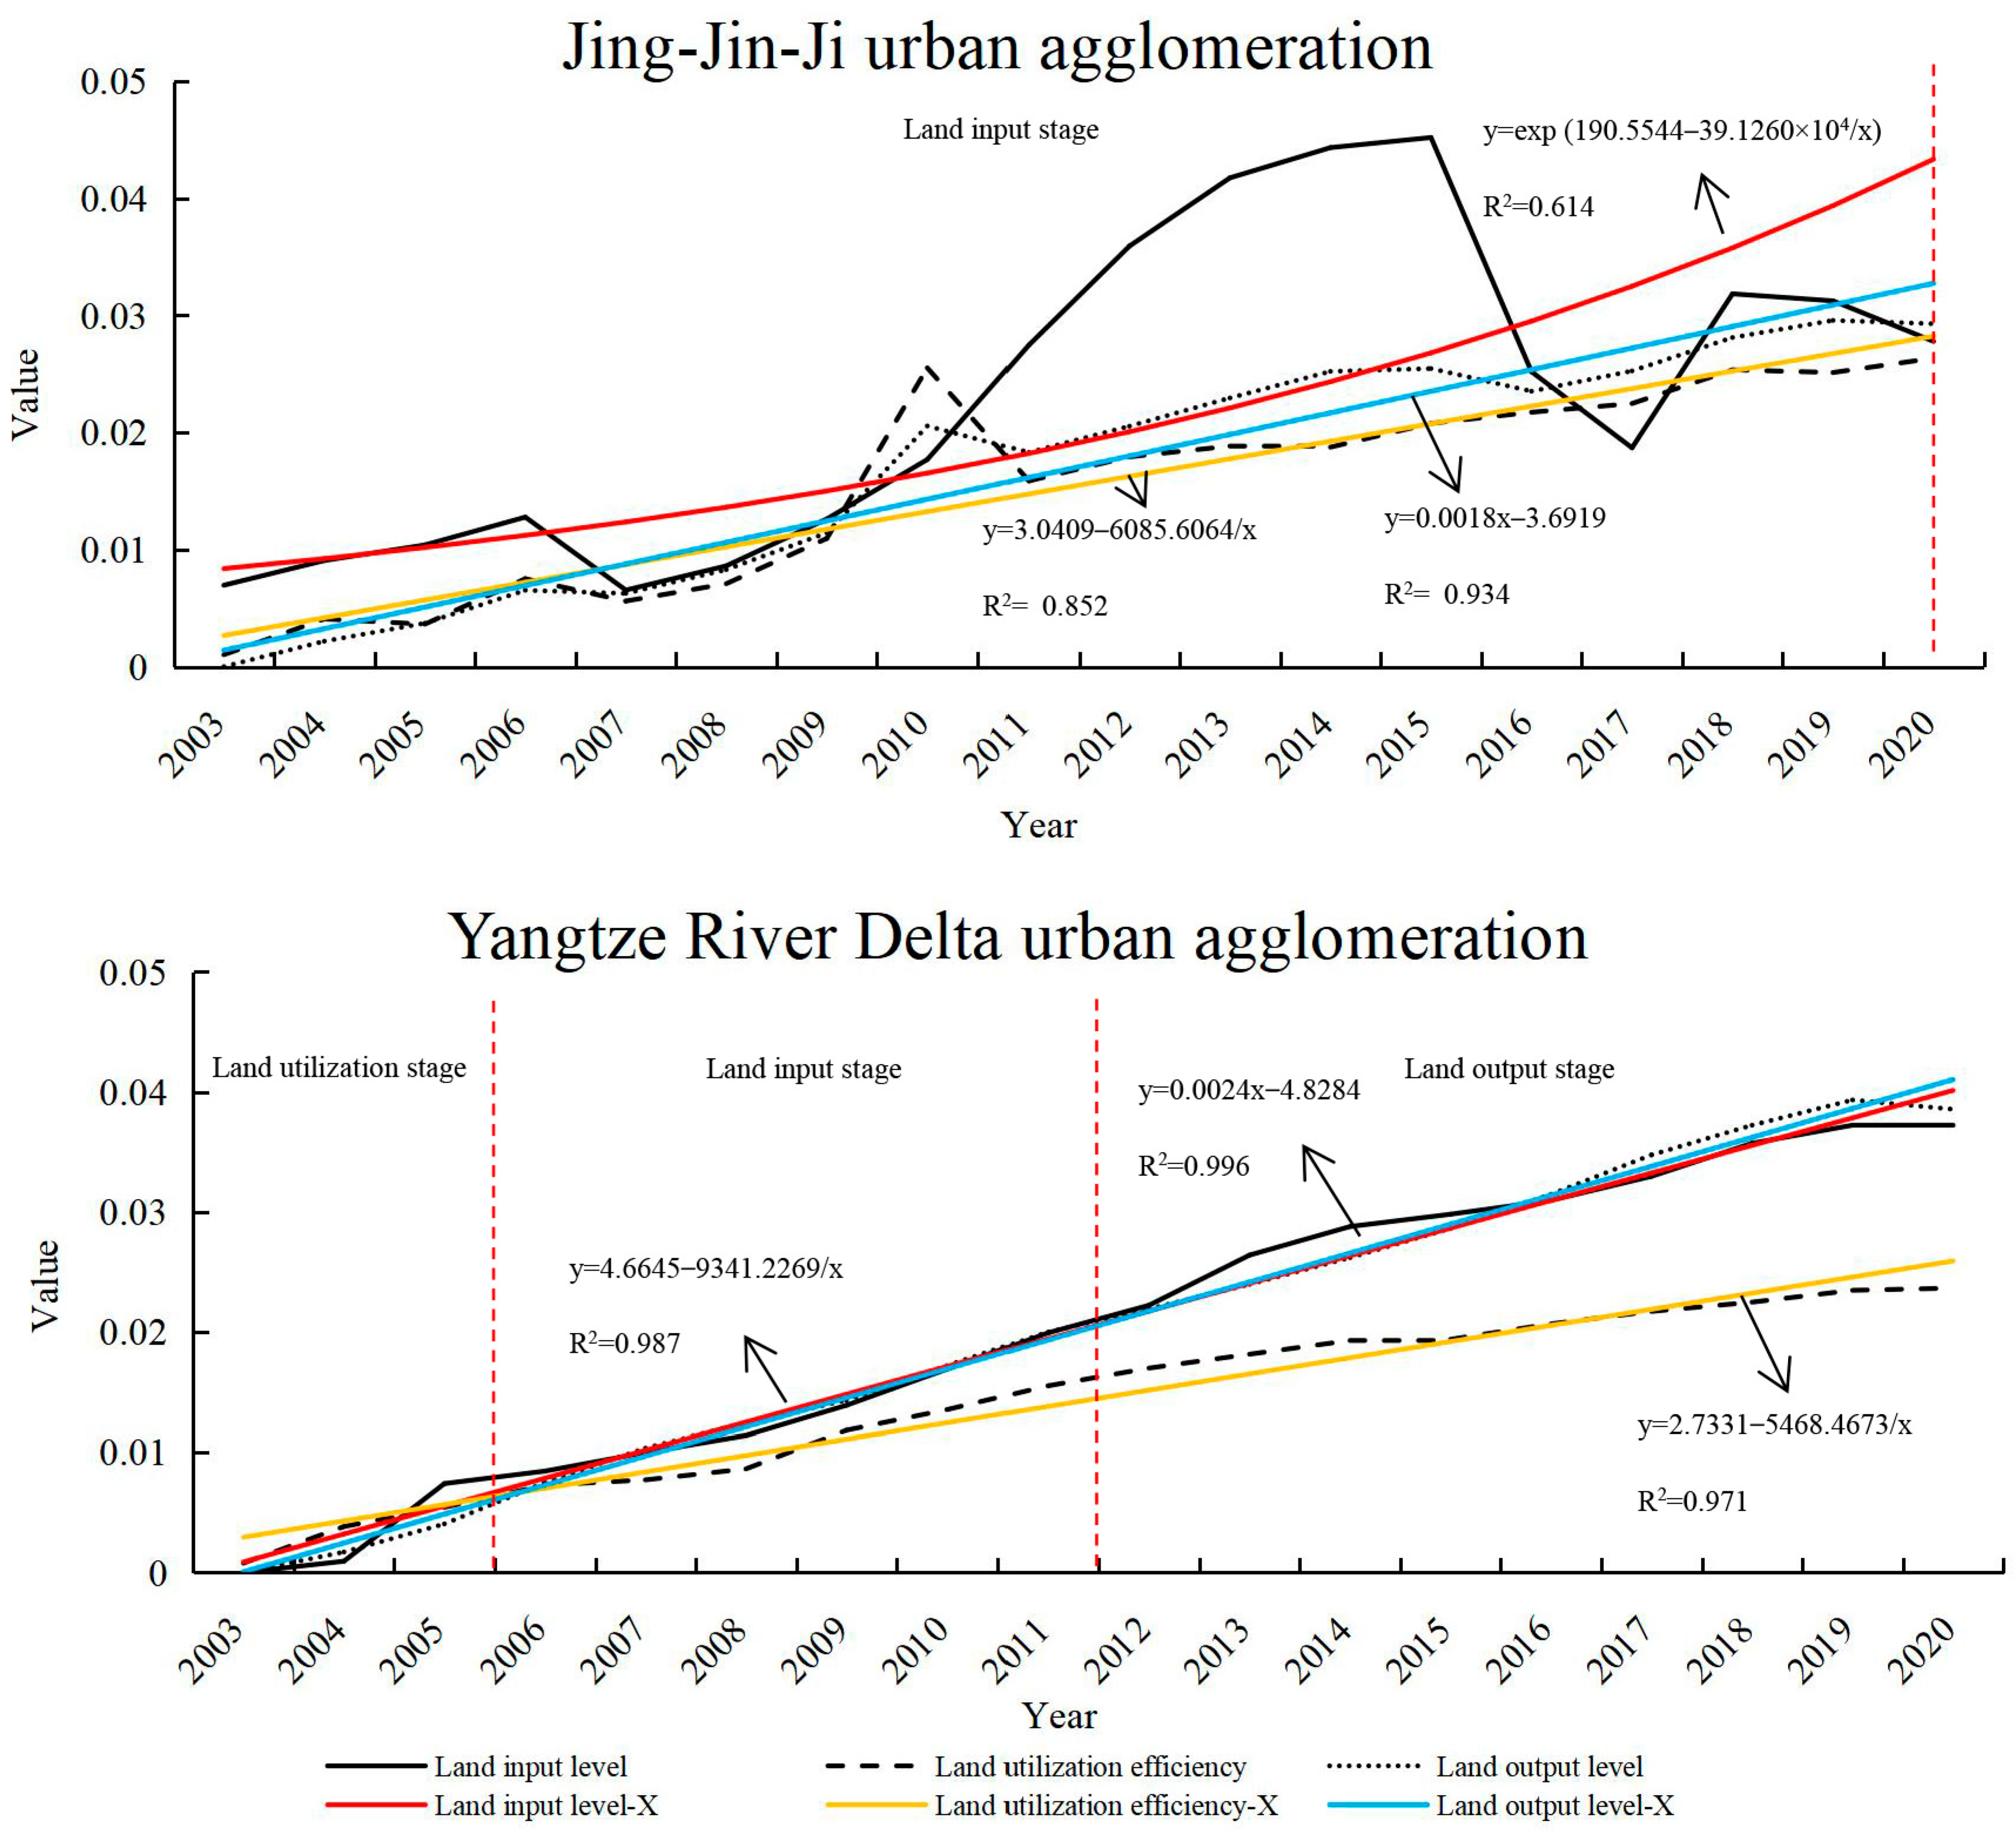
In order to analyze the development stage of the intensive land use subsystem in UAs, the fitting curves of the three dimensions were used to explore, which avoided unnecessary distractions (Figure 8). When the fitting curve of one dimension was in the dominant position, we believed this period was in the development stage of this dimension; namely, the land input stage, the land utilization stage, and the land output stage corresponded to the LIL dimension, the LUE dimension, and the LOL dimension. Among them, the LIL stage focused on the initial resource investment in land development, the LUE stage paid attention to the efficiency and functional allocation of land use, and the LOL stage assessed the economic and ecological benefits of the land. Specifically, the JJJ UA, from 2003 to 2020, was always in the land input stage. This indicated that the JJJ UA was in the primary phase of intensive land use, and had not yet achieved efficient land use and high-quality output. Although the coordinated development strategy of the JJJ region continued to advance, the contradiction between the limited land resources and the growing demand for land use had become increasingly prominent due to the lack of reasonable land use planning [46]. The JJJ UA had experienced large-scale land expansion in the past three decades, which meant it faced great challenges in narrowing intra-regional differences and maintaining a balance between regional economic and ecological benefits [47]. In the YRD UA, during the study period, the intensive land use subsystem could be divided into three development phases. The first phase was the land utilization stage, from 2003 to 2005, the second phase was the land input stage, from 2006 to 2011, and the third phase was the land output stage, from 2012 to 2020. It found that the construction land increased rapidly, and the depth, complexity and intensity of land use continued to increase, leading to the scarcity of reserve land resources in the YRD UA [48]. After the approval of the State Council in 2010, the Regional Plan for the Yangtze River Delta Region promoted the construction of industrial parks in different places and regional cooperations, as well as the established the regional environmental protection emergency linkage mechanism. The implementation of the policy promoted the transformation of regional land use in terms of pattern and efficiency, and the YRD UA entered the land output stage in 2012. It was found that the urbanization of the YRD UA had promoted the sustainable development of the regional ecological resources, and had made social and economic contributions [49], which facilitated the land output stage.
Generally speaking, it indicated that the coupling system between urbanization development and intensive land use developed in a good direction and had a strong momentum in the JJJ and the YRD UAs. UA, as a development mode, had fully exploited its advantages, and dimensional coordinated development had been achieved. It showed that China’s current measures were effective in the reasonable planning of land use and protecting land resources [50,51]. Meanwhile, it provided a reference for other developing countries to promote the construction of UA, the rational allocation of land structure, and the sustainable development of land resources.

4.2. Prediction of Coupling Coordination Degree

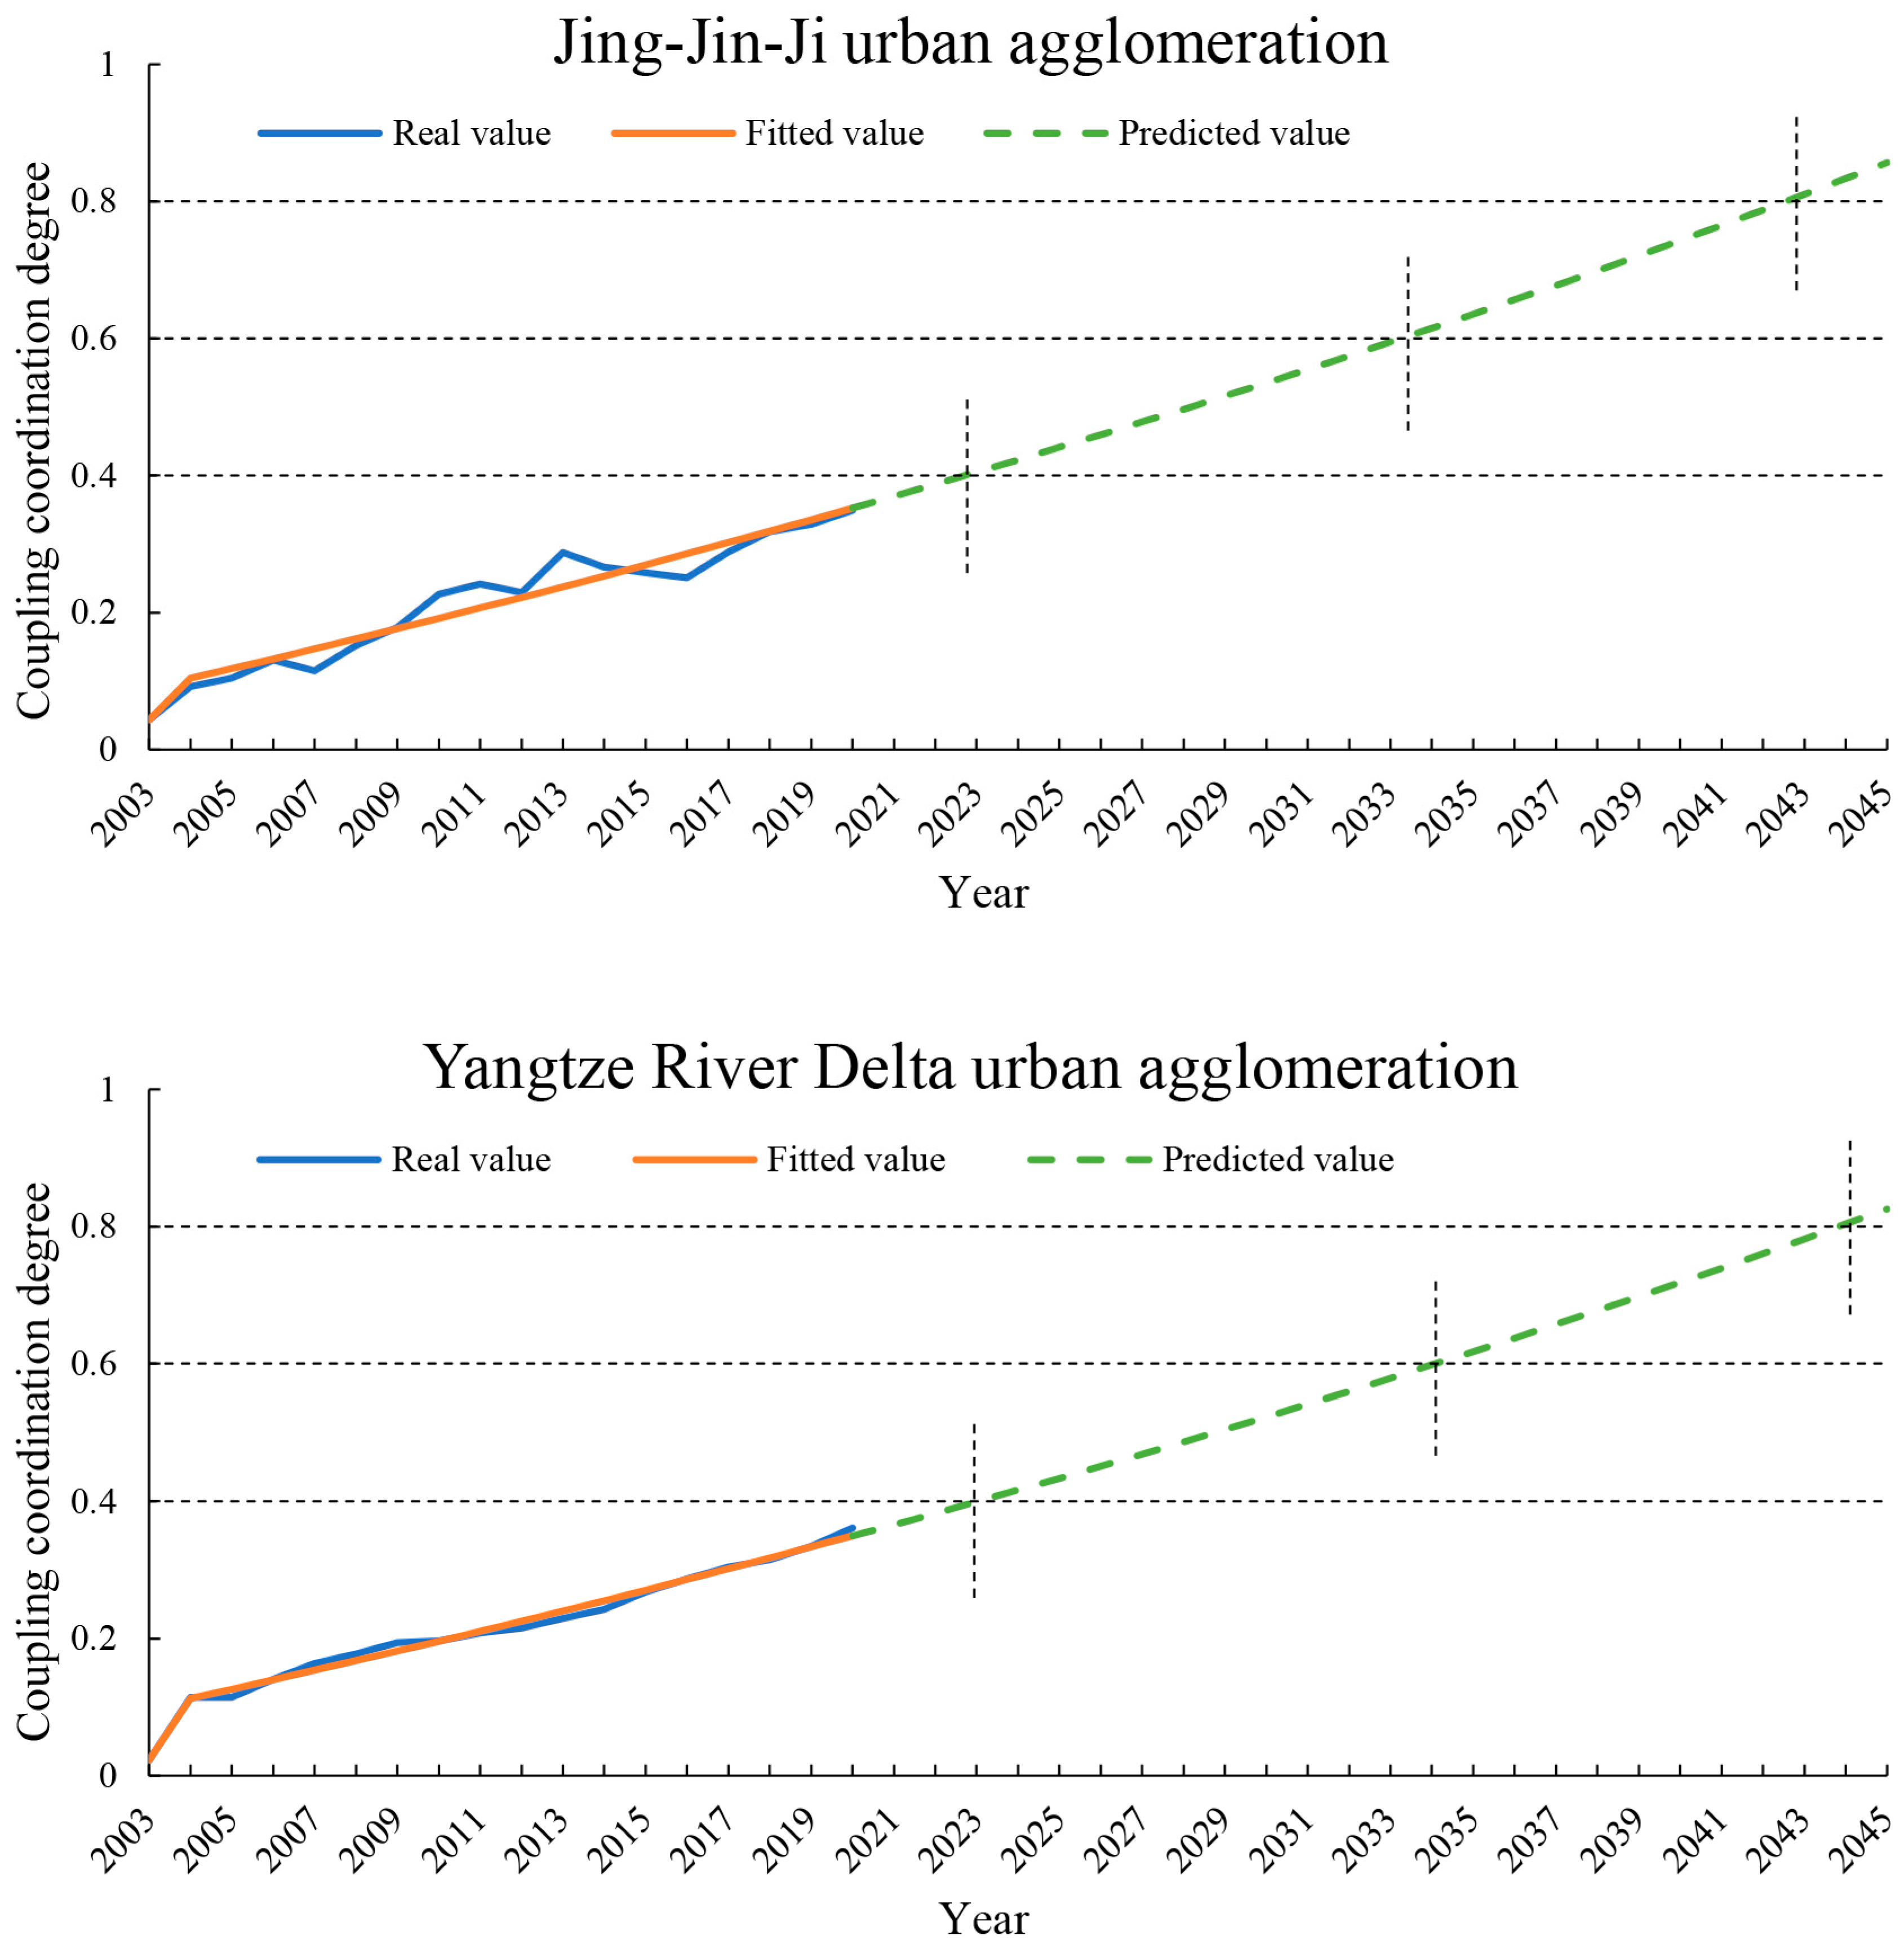
It found that, during the research period, both UAs did not achieve balanced development. However, based on the overall upward trend and strong development momentum in 2003–2020, we used the Gray Prediction model to predict the time point that balanced development between urbanization and intensive land use was reached (Figure 9). We found that, based on the current urbanization development and intensive land use, the JJJ UA and the YRD UA would achieve slightly balanced development in 2023 (the JJJ UA is 0.4049, and that of the YRD UA is 0.4000), barely balanced development in 2034 (the JJJ UA is 0.6150, and that of the YRD UA is 0.6000), as well as superiorly balanced development in the JJJ UA in 2043 (0.8101) and in the YRD UA in 2044 (0.8034). Moreover, we checked the prediction results and found that the accuracy of the model was good, and the model fitting effect met the requirements (Table 4). It suggested that, at present, China’s urban intensive land use system is strengthening cluster territory across administrative boundaries of the local coordination, and at the same time, a series of social, economic, and sustainability benefits are beign achieved, including productivity gains from expanded agglomeration economies and efficiency gains that support the national objective of increasing domestic consumption to fuel future economic growth, providing a valuable reference for other countries [52]. Nevertheless, we found that although urbanization and intensive land use could achieve slightly balanced development in the 14th Five-Year Plan (2020–2035), barely balanced development in the 2035 Vision and Goal Outline, and superiorly balanced development in the “building a great modern country” in 2050, the predicted realized years were later in the planning period. Land use is complex and difficult to plan, comprising a series of processes, such as social distribution, industrial allocation, population migration, and ecosystem service transformation [53,54]. Therefore, the prediction results of this study show that there is still a long way to go to achieve sustainable development between urbanization and intensive land use.

4.3. Policy Implications

Land use and development played a crucial role in promoting regional sustainability. It was found that since the reform and opening up, China had issued many policies to protect and use land resources, but it tended to adopt guiding policies to manage land resources, and land market regulation was given priority, followed by land resource protection [55]. The single policy type was not conducive to the systematic and comprehensive review of land policy strategy, and hindered the land use sustainable development process. The policies of land resources development and utilization in Finland could be used for reference; namely, the active land policy based on land bank, the growth-oriented active land policy, the regional-vitality-driven land policy, the housing-policy-oriented land policy, and the private-development-focused land policy could be used [56]. The classification of these policies could help to understand the differences and commonalities of land policy strategy in local government departments, and promote inner regional coordinated development within urban agglomerations. In the meantime, based on the driving factors analysis, the coupling system could pay attention to promote ECD and increase the LIL in the JJJ UA, while the YRD UA should focus on the ECD and the LOL, which provided sufficient reference for the formulation of intensive land use policy.

5. Conclusions

Intensive land use is the only way to realize sustainable urban development. Herein, our research results showed that in the urbanization development, the JJJ UA increased from 0.0651 in 2003 to 0.5116 in 2020, and the YRD UA increased from 0.0883 in 2003 to 0.8231 in 2020—due to stable economic development, reasonable social allocation, and continuous improvement of the eco-environment. During the study period, in the JJJ UA, the intensive land use subsystem changed from 0.0080 in 2003 to 0.0834 in2020, whilst the YRD UA changed from 0.0008 in 2003 to 0.0993 in 2020. Based on our analysis, the JJJ UA was always in the land input stage, while the YRD UA had experienced the land utilization stage (2003–2005), the land input stage (2006–2011), and the land output stage (2012–2020). Furthermore, the coordinated degree between urbanization development and intensive land use had indeed improved and they were in parallel development, which confirmed the superiority of the UA development mode. This was linked to the implementation of national strategies for balanced development in UAs. With regard to the coupling system, during the study period, although the UAs and inner regions did not achieve balanced development, but compared to the inner regions, the coupling system in UAs developed rapidly and had a strong momentum, which was close to the balanced development in 2020. It showed that UA was playing to its advantages as a development mode. On the urban level, UAs solved the problem of uncoordinated development between urbanization and intensive land use, and optimized the regional and dimensional allocation within UAs. In addition, attention should be paid to the ECD and the LIL dimension in the JJJ UA, as well as to the ECD and the LOL dimension in the YRD UA, to promote the coupling system coordinated development. Through prediction, we found that urbanization and intensive land use would achieve slightly balanced development in 2023, barely balanced development in 2034, and superiorly balanced development in 2043 (JJJ UA) and in 2044 (YRD UA). There is a long way to go to realize intensive land use in urban agglomeration.
Although our research has contributed to the sustainable development of UA, there is limited research exploring the driving factors of the nonlinear system. We find that the coordinated development between urbanization and intensive land use has attracted more and more attention, especially at the regional level, and we will continue to explore this field in the future.

Author Contributions

Conceptualization, M.Z.; methodology, M.Z.; software, M.Z. and X.L.; validation, M.Z. and X.L.; formal analysis, M.Z.; investigation, M.Z. and X.L.; resources, M.Z., X.L. and Z.L.; data curation, M.Z. and X.L.; writing—original draft, X.L.; writing—review & editing, X.L. and Z.L.; visulization, X.L.; supervision, X.L. and Z.L.; project administration, X.L. and Z.L.; funding acquisition, X.L. and Z.L. All authors have read and agreed to the published version of the manuscript.

Funding

The research was funded by the National Key Research and Development Program of China (2022YFF1303203), and Shandong Provincial key Laboratory of Eco-environmental Science for Yellow River Delta (2023KFJJ01).

Data Availability Statement

Data are contained within the article.

Conflicts of Interest

The authors declare no conflict of interest.

References

  1. Sahana, M.; Hong, H.; Sajjad, H. Analyzing urban spatial patterns and trend of urban growth using urban sprawl matrix: A study on Kolkata urban agglomeration, India. Sci. Total Environ. 2018, 628–629, 1557–1566. [Google Scholar] [CrossRef] [PubMed]
  2. Jiang, S.; Meng, J.; Zhu, L.; Cheng, H. Spatial-temporal pattern of land use conflict in China and its multilevel driving mechanisms. Sci. Total Environ. 2021, 801, 149697. [Google Scholar] [CrossRef]
  3. Lyu, Y.; Wang, M.; Zou, Y.; Wu, C. Mapping trade-offs among urban fringe land use functions to accurately support spatial planning. Sci. Total Environ. 2022, 802, 149915. [Google Scholar] [CrossRef]
  4. Zhao, M.; Cheng, C.; Zhou, Y.; Li, X.; Shen, S.; Song, C. A global dataset of annual urban extents (1992–2020) from harmonized nighttime lights. Earth Syst. Sci. Data Discuss. 2022, 14, 517–534. [Google Scholar] [CrossRef]
  5. Mishra, A.; Humpenöder, F.; Churkina, G.; Reyer, C.P.O.; Beier, F.; Bodirsky, B.L.; Schellnhuber, H.J.; Lotze-Campen, H.; Popp, A. Land use change and carbon emissions of a transformation to timber cities. Nat. Commun. 2022, 13, 4889. [Google Scholar] [CrossRef] [PubMed]
  6. Ren, Q.; He, C.; Huang, Q.; Shi, P.; Zhang, D.; Güneralp, B. Impacts of urban expansion on natural habitats in global drylands. Nat. Sustain. 2022, 5, 869–878. [Google Scholar] [CrossRef]
  7. Gao, J.; O’Neill, B.C. Mapping global urban land for the 21st century with data-driven simulations and Shared Socioeconomic Pathways. Nat. Commun. 2020, 11, 2302. [Google Scholar] [CrossRef]
  8. Fleischmann, M.; Arribas-Bel, D. Geographical characterisation of British urban form and function using the spatial signatures framework. Sci. Data 2022, 9, 546. [Google Scholar] [CrossRef]
  9. Kukulska-Kozieł, A.; Szylar, M.; Cegielska, K.; Noszczyk, T.; Hernik, J.; Gawroński, K.; Dixon-Gough, R.; Jombach, S.; Valánszki, I.; Filepné Kovács, K. Towards three decades of spatial development transformation in two con-trasting post-Soviet cities—Kraków and Budapest. Land Use Policy 2019, 85, 328–339. [Google Scholar] [CrossRef]
  10. Zhou, B.; Rybski, D.; Kropp, J.P. On the statistics of urban heat island intensity. Geophys. Res. Lett. 2013, 40, 5486–5491. [Google Scholar] [CrossRef]
  11. Fragkias, M.; Seto, K.C. Evolving rank-size distributions of intra-metropolitan urban clusters in South China. Comput. Environ. Urban Syst. 2009, 33, 189–199. [Google Scholar] [CrossRef]
  12. Soga, M.; Yamaura, Y.; Koike, S.; Gaston, K.J. Land sharing vs. land sparing: Does the compact city reconcile urban development and biodiversity conservation? J. Appl. Ecol. 2014, 51, 1378–1386. [Google Scholar] [CrossRef]
  13. He, X. Energy effect of urban diversity: An empirical study from a land-use perspective. Energy Econ. 2022, 108, 105892. [Google Scholar] [CrossRef]
  14. Cui, X.; Li, S.; Wang, X.; Xue, X. Driving factors of urban land growth in Guangzhou and its implications for sustainable development. Front. Earth Sci. 2018, 13, 464–477. [Google Scholar] [CrossRef]
  15. Ye, X.; Dong, L.; Lv, L.; Shang, Y. Spatiotemporal evolution law and driving force of mining city patterns. Environ. Sci. Pollut. Res. 2021, 29, 10291–10307. [Google Scholar] [CrossRef] [PubMed]
  16. Liu, C.; Wang, T.; Guo, Q. Factors Aggregating Ability and the Regional Differences among China’s Urban Agglomerations. Sustainability 2018, 10, 4179. [Google Scholar] [CrossRef]
  17. Lu, X.; Zhang, Y.; Li, J.; Duan, K. Measuring the urban land use efficiency of three urban agglomerations in China under carbon emissions. Environ. Sci. Pollut. Res. 2022, 29, 36443–36474. [Google Scholar] [CrossRef] [PubMed]
  18. Niu, B.; Ge, D.; Yan, R.; Ma, Y.; Sun, D.; Lu, M.; Lu, Y. The Evolution of the Interactive Relationship between Urbanization and Land-Use Transition: A Case Study of the Yangtze River Delta. Land 2021, 10, 804. [Google Scholar] [CrossRef]
  19. Zhou, Y.; Chen, M.; Tang, Z.; Mei, Z. Urbanization, land use change, and carbon emissions: Quantitative assessments for city-level carbon emissions in Beijing-Tianjin-Hebei region. Sustain. Cities Soc. 2021, 66, 102701. [Google Scholar] [CrossRef]
  20. Surya, B.; Salim, A.; Hernita, H.; Suriani, S.; Menne, F.; Rasyidi, E.S. Land Use Change, Urban Agglomeration, and Urban Sprawl: A Sustainable Development Perspective of Makassar City, Indonesia. Land 2021, 10, 556. [Google Scholar] [CrossRef]
  21. Cabral, P.; Santos, J.A.; Augusto, G. Monitoring Urban Sprawl and the National Ecological Reserve in Sintra-Cascais, Portugal: Multiple OLS Linear Regression Model Evaluation. J. Urban Plan. Dev. 2011, 137, 346–353. [Google Scholar] [CrossRef]
  22. Omoke, P.C.; Nwani, C.; Effiong, E.L.; Evbuomwan, O.O.; Emenekwe, C.C. The impact of financial development on carbon, non-carbon, and total ecological footprint in Nigeria: New evidence from asymmetric dynamic analysis. Environ. Sci. Pollut. Res. 2020, 27, 21628–21646. [Google Scholar] [CrossRef] [PubMed]
  23. Tandon, A.; Verma, P.R. Human population induced urban developments and their effects on temperature rise: A nonlinear mathematical model. Ecol. Complex. 2021, 47, 100947. [Google Scholar] [CrossRef]
  24. Li, X.; Lu, Z. Quantitative measurement on urbanization development level in urban Agglomerations: A case of JJJ urban ag-glomeration. Ecol. Indic. 2021, 133, 108375. [Google Scholar] [CrossRef]
  25. Wang, Y.; Liu, H.; Mao, G.; Zuo, J.; Ma, J. Inter-regional and sectoral linkage analysis of air pollution in Beijing–Tianjin–Hebei (Jing-Jin-Ji) urban agglomeration of China. J. Clean. Prod. 2017, 165, 1436–1444. [Google Scholar] [CrossRef]
  26. Chen, W.; Wu, S.; Lei, Y.; Li, S. Interprovincial transfer of embodied energy between the Jing-Jin-Ji area and other provinces in China: A quantification using interprovincial input-output model. Sci. Total Environ. 2017, 584–585, 990–1003. [Google Scholar] [CrossRef] [PubMed]
  27. Fang, C.; Lin, X. The eco-environmental guarantee for China’s urbanization process. J. Geogr. Sci. 2009, 19, 95–106. [Google Scholar] [CrossRef]
  28. Yang, Z.; Li, S.; Sun, D.; Li, C.; Wu, J. Intensive Evaluation and High-Quality Redevelopment of Enterprise Land Use: A Case Study in China. Land 2022, 11, 432. [Google Scholar] [CrossRef]
  29. Aras, G.; Tezcan, N.; Furtuna, O.K. Multidimensional comprehensive corporate sustainability performance evaluation model: Evidence from an emerging market banking sector. J. Clean. Prod. 2018, 185, 600–609. [Google Scholar] [CrossRef]
  30. Olsson, G. Explanation, Prediction, and Meaning Variance: An Assessment of Distance Interaction Models. Econ. Geogr. 1970, 46, 223–233. [Google Scholar] [CrossRef]
  31. Ewing, G.O. Gravity and Linear Regression Models of Spatial Interaction: A Cautionary Note. Econ. Geogr. 1974, 50, 83–88. [Google Scholar] [CrossRef]
  32. Li, Y.; Ye, H.; Gao, X.; Sun, D.; Li, Z.; Zhang, N.; Leng, X.; Meng, D.; Zheng, J. Spatiotemporal Patterns of Urbanization in the Three Most Developed Urban Agglomerations in China Based on Con-tinuous Nighttime Light Data (2000–2018). Remote Sens. 2021, 13, 2245. [Google Scholar] [CrossRef]
  33. Li, X.; Lu, Z.; Gao, S.; Wang, Y.; Zhang, M. Will city cluster cope with water dilemma? J. Clean. Prod. 2022, 371, 133548. [Google Scholar] [CrossRef]
  34. Liang, W.; Yang, M. Urbanization, economic growth and environmental pollution: Evidence from China. Sustain. Comput. Inform. Syst. 2019, 21, 1–9. [Google Scholar] [CrossRef]
  35. Peng, C.; Song, M.; Han, F. Urban economic structure, technological externalities, and intensive land use in China. J. Clean. Prod. 2017, 152, 47–62. [Google Scholar] [CrossRef]
  36. Cheng, X.; Shao, H.; Li, Y.; Shen, C.; Liang, P. Urban Land Intensive Use Evaluation Study Based on Nighttime Light—A Case Study of the Yangtze River Economic Belt. Sustainability 2019, 11, 675. [Google Scholar] [CrossRef]
  37. Bai, Y.; Zheng, H.; Shan, Y.; Meng, J.; Li, Y. The Consumption-Based Carbon Emissions in the Jing-Jin-Ji Urban Agglomeration Over China’s Economic Transition. Earth’s Future 2021, 9, e2021EF002132. [Google Scholar] [CrossRef]
  38. Sun, Y.; Zhao, S. Spatiotemporal dynamics of urban expansion in 13 cities across the Jing-Jin-Ji Urban Agglomeration from 1978 to 2015. Ecol. Indic. 2018, 87, 302–313. [Google Scholar] [CrossRef]
  39. Haas, J.; Ban, Y. Urban growth and environmental impacts in Jing-Jin-Ji, the Yangtze, River Delta and the Pearl River Delta. Int. J. Appl. Earth Obs. Geoinf. 2014, 30, 42–55. [Google Scholar] [CrossRef]
  40. Wang, J.; Dong, X.; Dong, K. How does ICT agglomeration affect carbon emissions? The case of Yangtze River Delta urban ag-glomeration in China. Energy Econ. 2022, 111, 106107. [Google Scholar] [CrossRef]
  41. Gao, J. How China will protect one-quarter of its land. Nature 2019, 569, 457. [Google Scholar] [CrossRef]
  42. Yang, Y.; Qu, S.; Cai, B.; Liang, S.; Wang, Z.; Wang, J.; Xu, M. Mapping global carbon footprint in China. Nat. Commun. 2020, 11, 2237. [Google Scholar] [CrossRef]
  43. Guo, S.; Wang, Y.; Wang, Y.; Wang, M.; He, P.; Feng, L. Inequality and collaboration in north China urban agglomeration: Evidence from embodied cultivated land in Jing-Jin-Ji’s interregional trade. J. Environ. Manag. 2020, 275, 111050. [Google Scholar] [CrossRef]
  44. Geng, Y.; Zhang, H. Coordination assessment of environment and urbanization: Hunan case. Environ. Monit. Assess. 2020, 192, 637. [Google Scholar] [CrossRef]
  45. Li, X.; Lu, Z.; Hou, Y.; Zhao, G.; Zhang, L. The coupling coordination degree between urbanization and air environment in the Beijing(Jing)-Tianjin(Jin)-Hebei(Ji) urban agglomeration. Ecol. Indic. 2022, 137, 108787. [Google Scholar] [CrossRef]
  46. Sheng, X.; Cao, Y.; Zhou, W.; Zhang, H.; Song, L. Multiple scenario simulations of land use changes and countermeasures for collaborative development mode in Chaobai River region of Jing-Jin-Ji, China. Habitat Int. 2018, 82, 38–47. [Google Scholar] [CrossRef]
  47. Wu, W.; Zhao, S.; Zhu, C.; Jiang, J. A comparative study of urban expansion in Beijing, Tianjin and Shijiazhuang over the past three decades. Landsc. Urban Plan. 2015, 134, 93–106. [Google Scholar] [CrossRef]
  48. Chi, J.; Xu, G.; Yang, Q.; Liu, Y.; Sun, J. Evolutionary characteristics of ecosystem services and ecological risks at highly developed economic region: A case study on Yangtze River Delta, China. Environ. Sci. Pollut. Res. 2022, 30, 1152–1166. [Google Scholar] [CrossRef]
  49. Shen, S.; Yue, P.; Fan, C. Quantitative assessment of land use dynamic variation using remote sensing data and landscape pattern in the Yangtze River Delta, China. Sustain. Comput. Inform. Syst. 2019, 23, 111–119. [Google Scholar] [CrossRef]
  50. Lichtenberg, E.; Ding, C. Assessing farmland protection policy in China. Land Use Policy 2008, 25, 59–68. [Google Scholar] [CrossRef]
  51. Zhang, Z.; Huisingh, D. Combating desertification in China: Monitoring, control, management and revegetation. J. Clean. Prod. 2018, 182, 765–775. [Google Scholar] [CrossRef]
  52. Groff, S.P.; Rau, S. China’s City Clusters: Pioneering Future Mega-Urban Governance; American Affairs: Boston, MA, USA, 2019. [Google Scholar]
  53. Dadashpoor, H.; Azizi, P.; Moghadasi, M. Land use change, urbanization, and change in landscape pattern in a metropolitan area. Sci. Total Environ. 2019, 655, 707–719. [Google Scholar] [CrossRef]
  54. Fang, Z.; Ding, T.; Chen, J.; Xue, S.; Zhou, Q.; Wang, Y.; Wang, Y.; Huang, Z.; Yang, S. Impacts of land use/land cover changes on ecosystem services in ecologically fragile regions. Sci. Total Environ. 2022, 831, 154967. [Google Scholar] [CrossRef] [PubMed]
  55. Zhou, X.-X.; Zhu, Z.-H.; Feng, C. The evolution of land policies in China from 1980 to 2019: A policy-text based analysis. Environ. Sci. Pollut. Res. 2022, 29, 54902–54915. [Google Scholar] [CrossRef] [PubMed]
  56. Krigsholm, P.; Puustinen, T.; Falkenbach, H. Understanding variation in municipal land policy strategies: An empirical typology. Cities 2022, 126, 103710. [Google Scholar] [CrossRef]
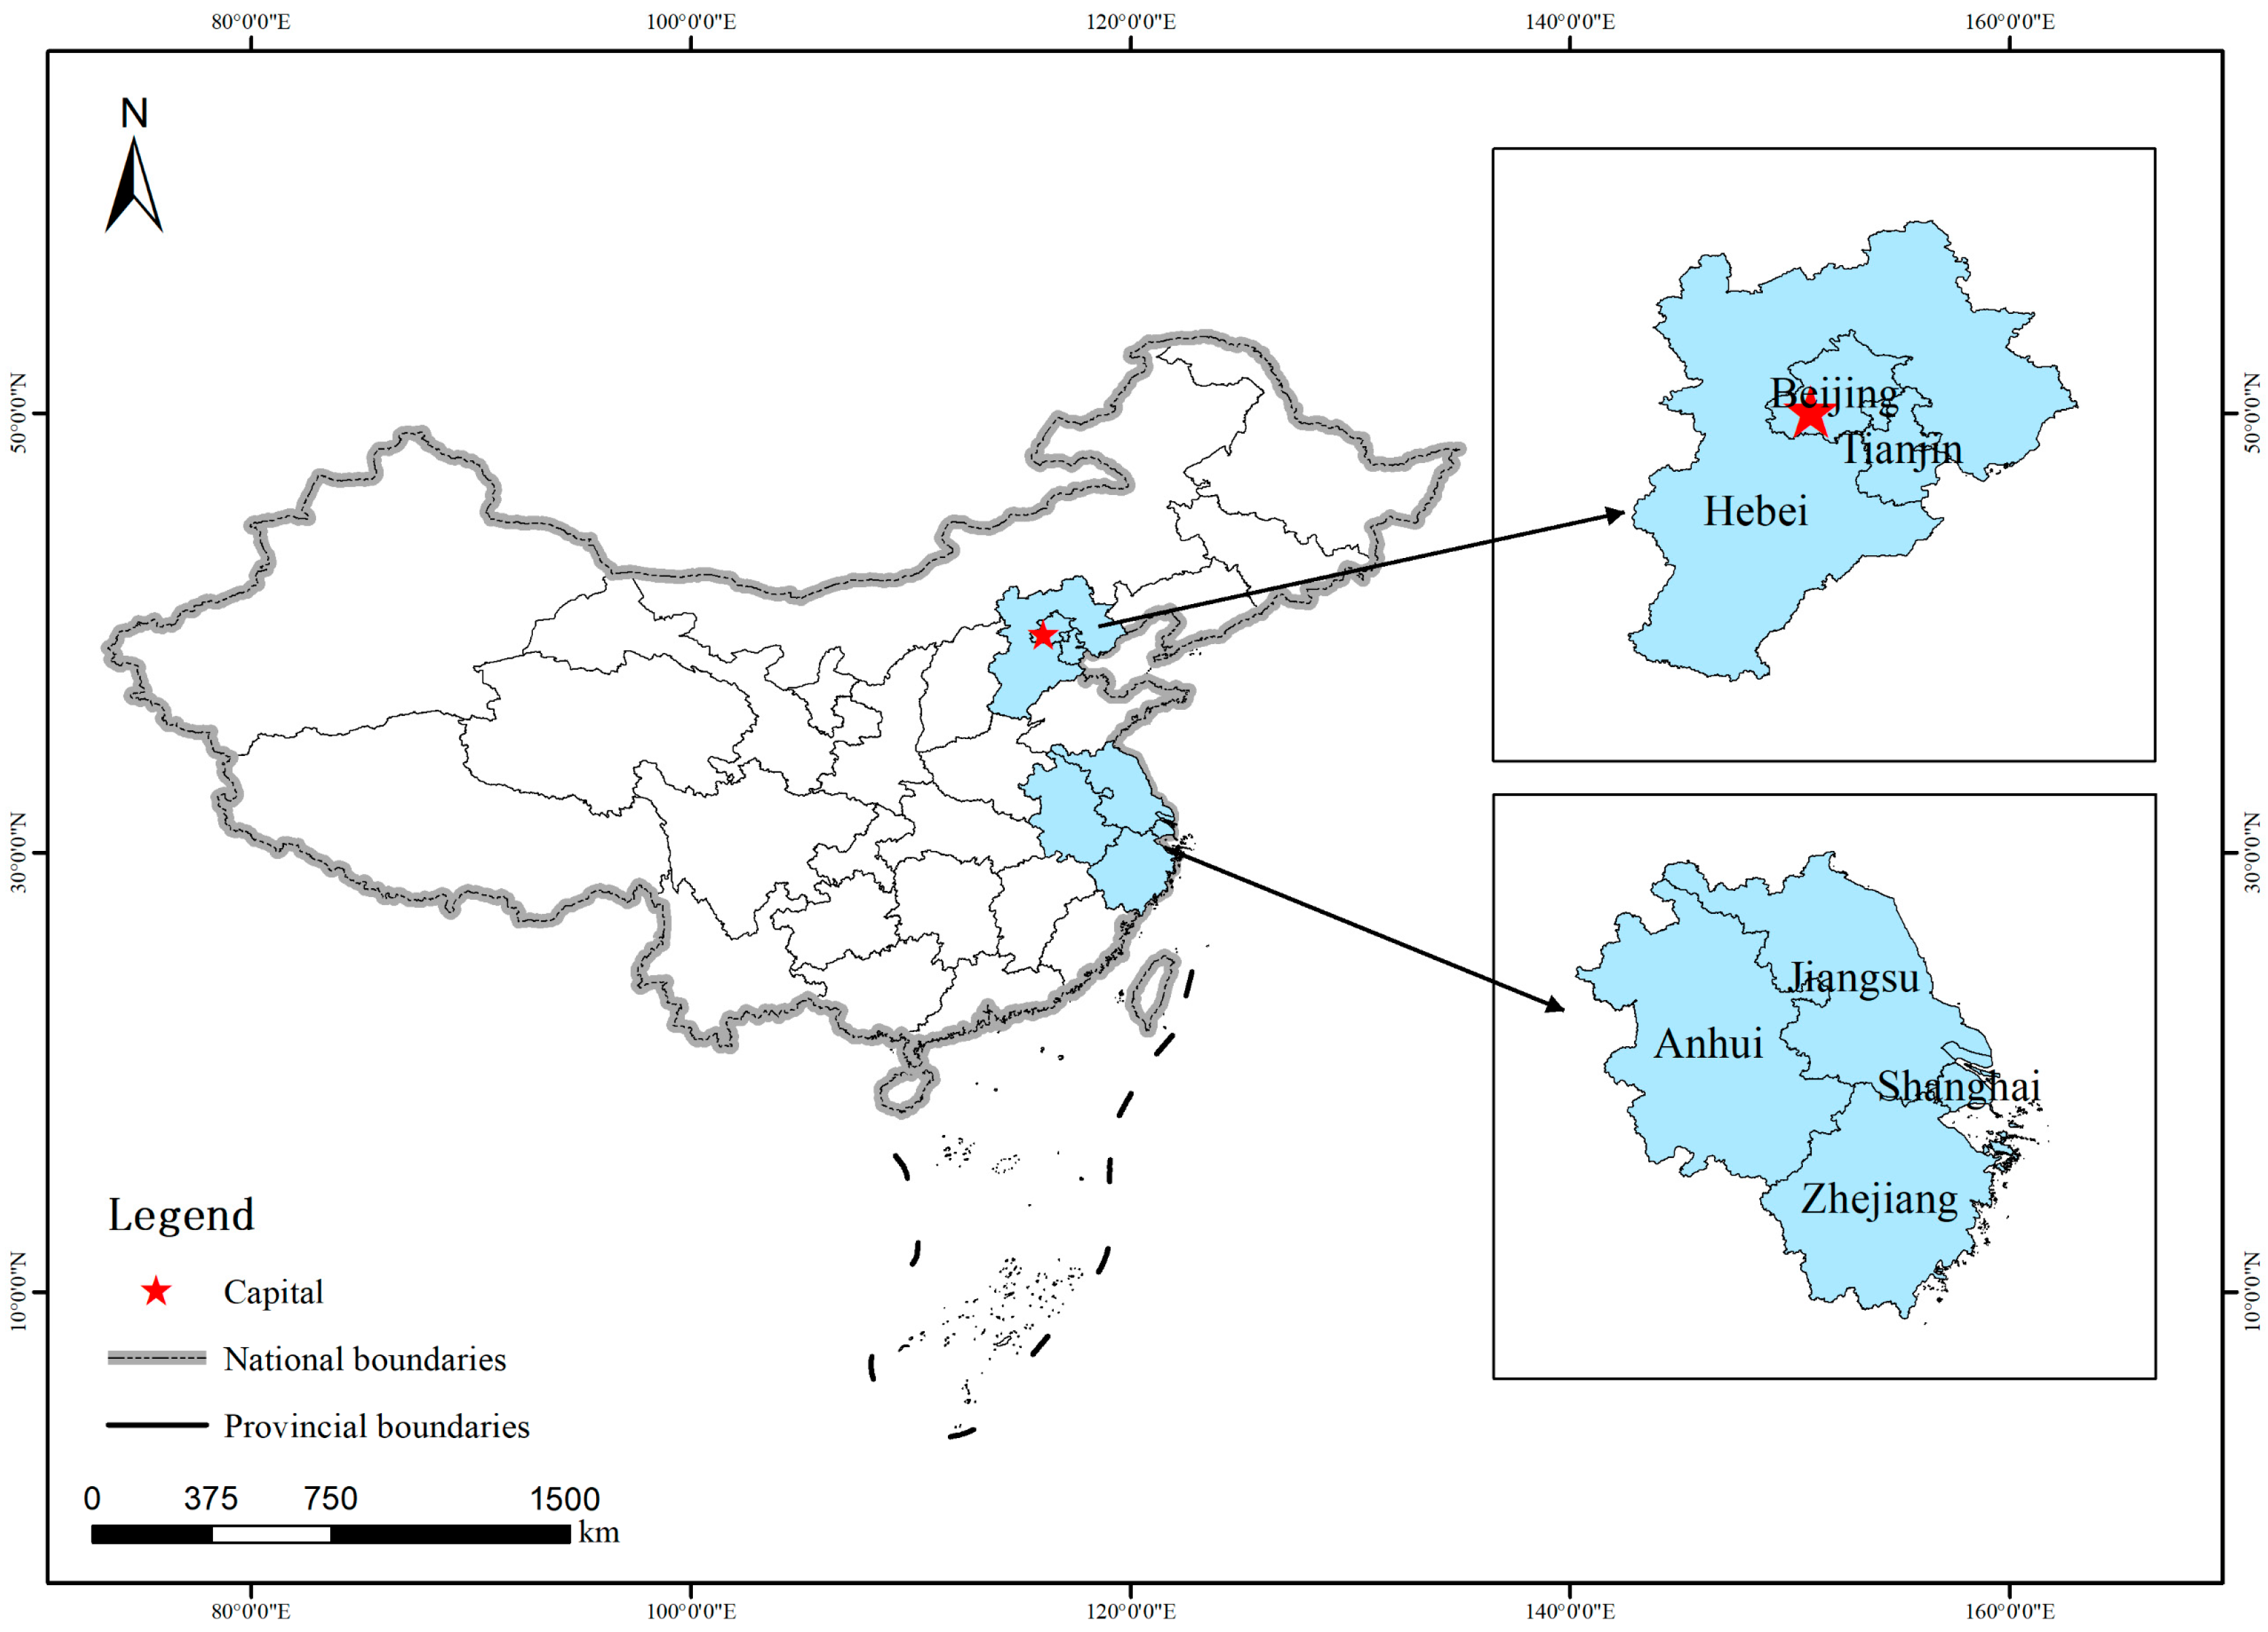
Figure 1. The geographical locations of the JJJ and the YRD UAs.
Land 14 02231 g001
Figure 2. The coupling system of urbanization development and intensive land use.
Land 14 02231 g002
Figure 3. Urbanization development level.
Land 14 02231 g003
Figure 4. Intensive land use level.
Land 14 02231 g004
Figure 5. Comparative analysis of coupling coordination degree in UAs.
Land 14 02231 g005
Figure 6. Coupling coordination degree. (A) describes the JJJ UA, and (B) describes the YRD UA.
Land 14 02231 g006
Figure 7. Coupling degree, coupling coordination degree and f(x) − g(y).
Land 14 02231 g007
Figure 8. Fitting curves of the dimensions in the intensive land use subsystem. Note: “-X” represents the fitting curve.
Land 14 02231 g008
Figure 9. Gray model predicted trend.
Land 14 02231 g009
Table 1. The specific information of the intensive land use subsystem.
DimensionIndicatorsExplanation
LILFixed asset investment per landReal estate development enterprises complete investment (100 million yuan)/urban area (square kilometers)
Proportion of built-up areaBuilt-up area (square kilometers)/urban area (square kilometers)
Government expenditure per landGeneral budget expenditure of local finance (100 million yuan)/urban area (square kilometers)
People employed per unit areaEmployed person in urban units (ten thousand persons)/urban area (square kilometers)
LUEUrban road area per capitaUrban road area per person (square meters)
Urban population densityUrban population (ten thousand persons/square kilometers)
Green area per capitaUrban green area (ten thousand square meters)/resident population in year-end (ten thousand persons)
Urban drainage densityLength of urban drainage pipes (kilometer)/built-up area (square kilometers)
LOLSecondary and tertiary industries added value construction land occupationAdded value of secondary and tertiary industries (ten thousand yuan)/construction land area (square kilometers)
Total retail sales per capitaTotal retail consumption (ten thousand yuan)/urban land area (square kilometers)
GDP in per landGDP (ten thousand yuan)/urban land area (square kilometers)
Green coverage rate of built-up areaGreen area (square kilometers)/built-up area (square kilometers)
Table 2. Classification of coupling and coordination degrees.
ValueCDDifferenceDescription of Classification
(0.0, 0.2]Extreme decoupling developmentExtreme unbalanced developmentf(x) > g(y)Lagging intensive land use subsystem
g(y) > f(x)Lagging urbanization development subsystem
−0.1 ≤ f(x) − g(y) ≤ 0.1Parallel development of two subsystems
(0.2, 0.4]Moderate decoupling developmentModerate unbalanced developmentf(x) > g(y)Lagging intensive land use subsystem
g(y) > f(x)Lagging urbanization development subsystem
−0.1 ≤ f(x) − g(y) ≤ 0.1Parallel development of two subsystems
(0.4, 0.6]Slightly coupling developmentSlightly balanced developmentf(x) > g(y)Lagging intensive land use subsystem
g(y) > f(x)Lagging urbanization development subsystem
−0.1 ≤ f(x) − g(y) ≤ 0.1Parallel development of two subsystems
(0.6, 0.8]Barely coupling developmentBarely balanced developmentf(x) > g(y)Lagging intensive land use subsystem
g(y) > f(x)Lagging urbanization development subsystem
−0.1 ≤ f(x) − g(y) ≤ 0.1Parallel development of two subsystems
(0.8, 1.0]Superiorly coupling developmentSuperiorly balanced developmentf(x) > g(y)Lagging intensive land use subsystem
g(y) > f(x)Lagging urbanization development subsystem
−0.1 ≤ f(x) − g(y) ≤ 0.1Parallel development of two subsystems
Table 3. Weight of dimensions in the coupling system.
RegionSubsystemDimensionWeight
JJJ UAUrbanization developmentSOD0.3250
ECD0.5595
EED0.1155
Intensive land useLIL0.4530
LUE0.2734
LOL0.2736
YRD UAUrbanization developmentSODt0.2333
ECD0.5259
EED0.2408
Intensive land useLIL0.3508
LUE0.2780
LOL0.3712
Table 4. Gray prediction model construction results and test results.
abCρRMSEREmaxDSRmax
JJJ UA−0.01271.08410.05991.00000.022020.0000%0.2000
YRD UA−0.01211.09320.00771.00000.00809.7590%0.1760
Note: a is the development coefficient; b is the gray action; C represents the posteriori difference ration; ρ is the probability of small error; RMSE indicates the root mean square error; REmax is the maximum relative error; and DSRmax is the maximum deviation of stage ratio.
Disclaimer/Publisher’s Note: The statements, opinions and data contained in all publications are solely those of the individual author(s) and contributor(s) and not of MDPI and/or the editor(s). MDPI and/or the editor(s) disclaim responsibility for any injury to people or property resulting from any ideas, methods, instructions or products referred to in the content.