Article

The Impact of Land Tenure Strength on Urban Green Space Morphology: A Global Multi-City Analysis Based on Landscape Metrics

1
College of Landscape Architecture, Beijing Forestry University, Beijing 100083, China
2
Landscape Architecture and Landscape Research Branch, China Academy of Urban Planning and Design, Beijing 100044, China
*
Authors to whom correspondence should be addressed.
These authors contributed equally to this work.
Kaili Zhang and Xiangrong Wang served equally as corresponding authors.
Land 2025, 14(11), 2140; https://doi.org/10.3390/land14112140 (registering DOI)
Submission received: 16 September 2025 / Revised: 16 October 2025 / Accepted: 25 October 2025 / Published: 27 October 2025

Abstract

Urban green spaces (UGS) are pivotal to urban sustainability, yet their morphology—patch size, shape, and configuration—remains insufficiently linked to institutional drivers. We investigate how land tenure strength shapes UGS morphology across 36 cities in nine countries. Using OpenStreetMap data, we delineate UGS and compute landscape metrics (AREA, PARA, SHAPE, FRAC, PAFRAC) via FRAGSTATS; we develop a composite index of land tenure strength capturing ownership, use-right duration, expropriation compensation, and government land governance capacity. Spearman’s rank correlations indicate a scale-dependent coupling: stronger tenure is significantly associated with micro-scale patterns—smaller patch areas and more complex, irregular boundaries—consistent with fragmented ownership and higher transaction costs, whereas macro-scale indicators (e.g., overall green coverage/connectivity) show weaker sensitivity. These findings clarify an institutional pathway through which property rights intensity influences the physical fabric of urban nature. Policy implications are twofold: in high-intensity contexts, flexible instruments (e.g., transferable development rights, negotiated acquisition, ecological compensation) can maintain network connectivity via embedded, fine-grain interventions; in low-intensity contexts, one-off land assembly can efficiently deliver larger, regular green cores. The results provide evidence-based guidance for aligning green infrastructure design with diverse governance regimes and advancing context-sensitive sustainability planning.

1. Introduction

The strength of land ownership rights is one of the key factors influencing urban form and structure, thereby determining the development direction and characteristics of different cities. Land tenure systems exhibit diverse characteristics across different countries and regions. In most countries, land ownership is not purely private or public but consists of a variety of coexisting ownership forms. This diversity provides a rich background and research material for studying the impact of land ownership strength on urban form [1,2].
In urban contexts, property rights strength not only determines the transaction costs of land acquisition but also shapes the morphological complexity of green space patterns. The strength of property rights is not only defined by de jure legal statutes but also by de facto enforcement feasibility and costs, which are closely tied to governmental capacity and socio-cultural norms [3]. It is collectively determined by state authorization, social recognition, and the right-holder’s capacity to act, reflecting its legitimacy, reasonableness, and desirability [4]. Extensive studies, particularly in agricultural economics, have demonstrated that tenure security significantly impacts investment incentives, resource allocation, and economic outcomes [5]. However, despite its recognized importance in rural settings, the transposition of this concept to urban contexts, especially its specific impact on the physical form and pattern of UGS, remains markedly underexplored. This not only concerns the sustainability of urban development but also determines the potential for human societal progress [6,7].
As an essential component of urban ecosystems, urban green spaces share characteristics with urban land use. Urban green spaces (UGS) are critically important for enhancing ecological security, providing recreational services, and improving the quality of the urban living environment. The formation, distribution, and morphological characteristics of UGS are profoundly influenced by the urban land tenure system, particularly the strength of property rights, which serves as a fundamental institutional factor shaping urban spatial structure. The definition of UGS varies across countries and disciplines [8]. In China, influenced by the Soviet urban planning concepts of green spaces and residential area greening, the term “green space” is commonly used to refer to vegetative land in urban planning practices. With the increasing attention to green space system planning as a statutory specialized planning type, China’s urban planning standards and specifications also provide detailed definitions and requirements for green spaces [9]. According to international organizations, definitions of urban green space vary slightly but share a focus on accessibility and ecological function. The World Health Organization [10] defines urban green spaces as all publicly accessible natural or semi-natural areas within urban environments that contribute to human health and well-being. The European Environment Agency [11] emphasizes their role as key components of green infrastructure, supporting ecological networks and climate adaptation. The U.S. Environmental Protection Agency [12] defines them more functionally as vegetated land that delivers ecosystem and social services. Integrating these perspectives, this paper defines urban green spaces as all artificial and natural vegetation-covered public or semi-public areas within urban built-up zones and their immediate surroundings, excluding bodies of water. Based on this definition, urban green spaces play a vital role in shaping urban form, and scientifically informed management strategies contribute to the long-term sustainability of urban ecosystems [13,14].
Although previous studies have explored the impact of land tenure systems on urban form and function, research on the relationship between land ownership strength and the morphological characteristics of urban green spaces remains relatively scarce. At the urban spatial scale, the configuration of UGS is shaped not only by ecological and planning factors but also by institutional arrangements that determine land accessibility and management. Recent international research has highlighted these links: Haase et al. [15] discuss how green space governance affects spatial inclusivity in European cities; Kabisch [16] emphasizes the importance of governance frameworks in maintaining urban green resilience; and Andersson [17] explores how land governance systems influence spatial justice within urban environments. These studies collectively suggest that the form and connectivity of UGS reflect broader socio-institutional logics embedded in land tenure regimes. To address this gap, our study adopts a cross-scale, quantitative, and comparative approach. We first construct a composite index to evaluate the strength of land property rights across different national contexts. Then, we quantify the morphological patterns of UGS in 36 global cities using landscape metrics derived from OpenStreetMap (OSM) data. Finally, we employ Spearman’s rank correlation to rigorously assess the relationship between institutional strength and spatial configuration. This methodological framework enables us to move beyond anecdotal evidence and to provide empirical insights into the institutional drivers of UGS patterns, thereby offering valuable support for context-sensitive urban planning and green space management [18,19]. The methodological framework of this study is detailed in Section 2 (Materials and Methods), where we describe the quantitative approach used to link land ownership strength with the morphological characteristics of urban green spaces across 36 global cities.

2. Materials and Methods

This study first clarifies the potential relationship between land ownership strength and urban green space morphological characteristics through a comprehensive literature review. Second, 36 cities worldwide were selected as research samples, and OpenStreetMap (OSM) data were used to quantify the morphological structure of their urban green spaces. Third, a composite index system was established to evaluate land ownership strength across the respective national contexts of the sample cities. Finally, Spearman’s rank correlation analysis was applied to verify the relationship between land ownership strength and UGS morphological characteristics. Figure 1 illustrates the overall methodological framework of the study. Through this framework, we aim to reveal the institutional mechanisms by which property rights intensity influences urban green space morphology, providing an empirical foundation for sustainable urban planning and green space management [20].

2.1. Research Regions

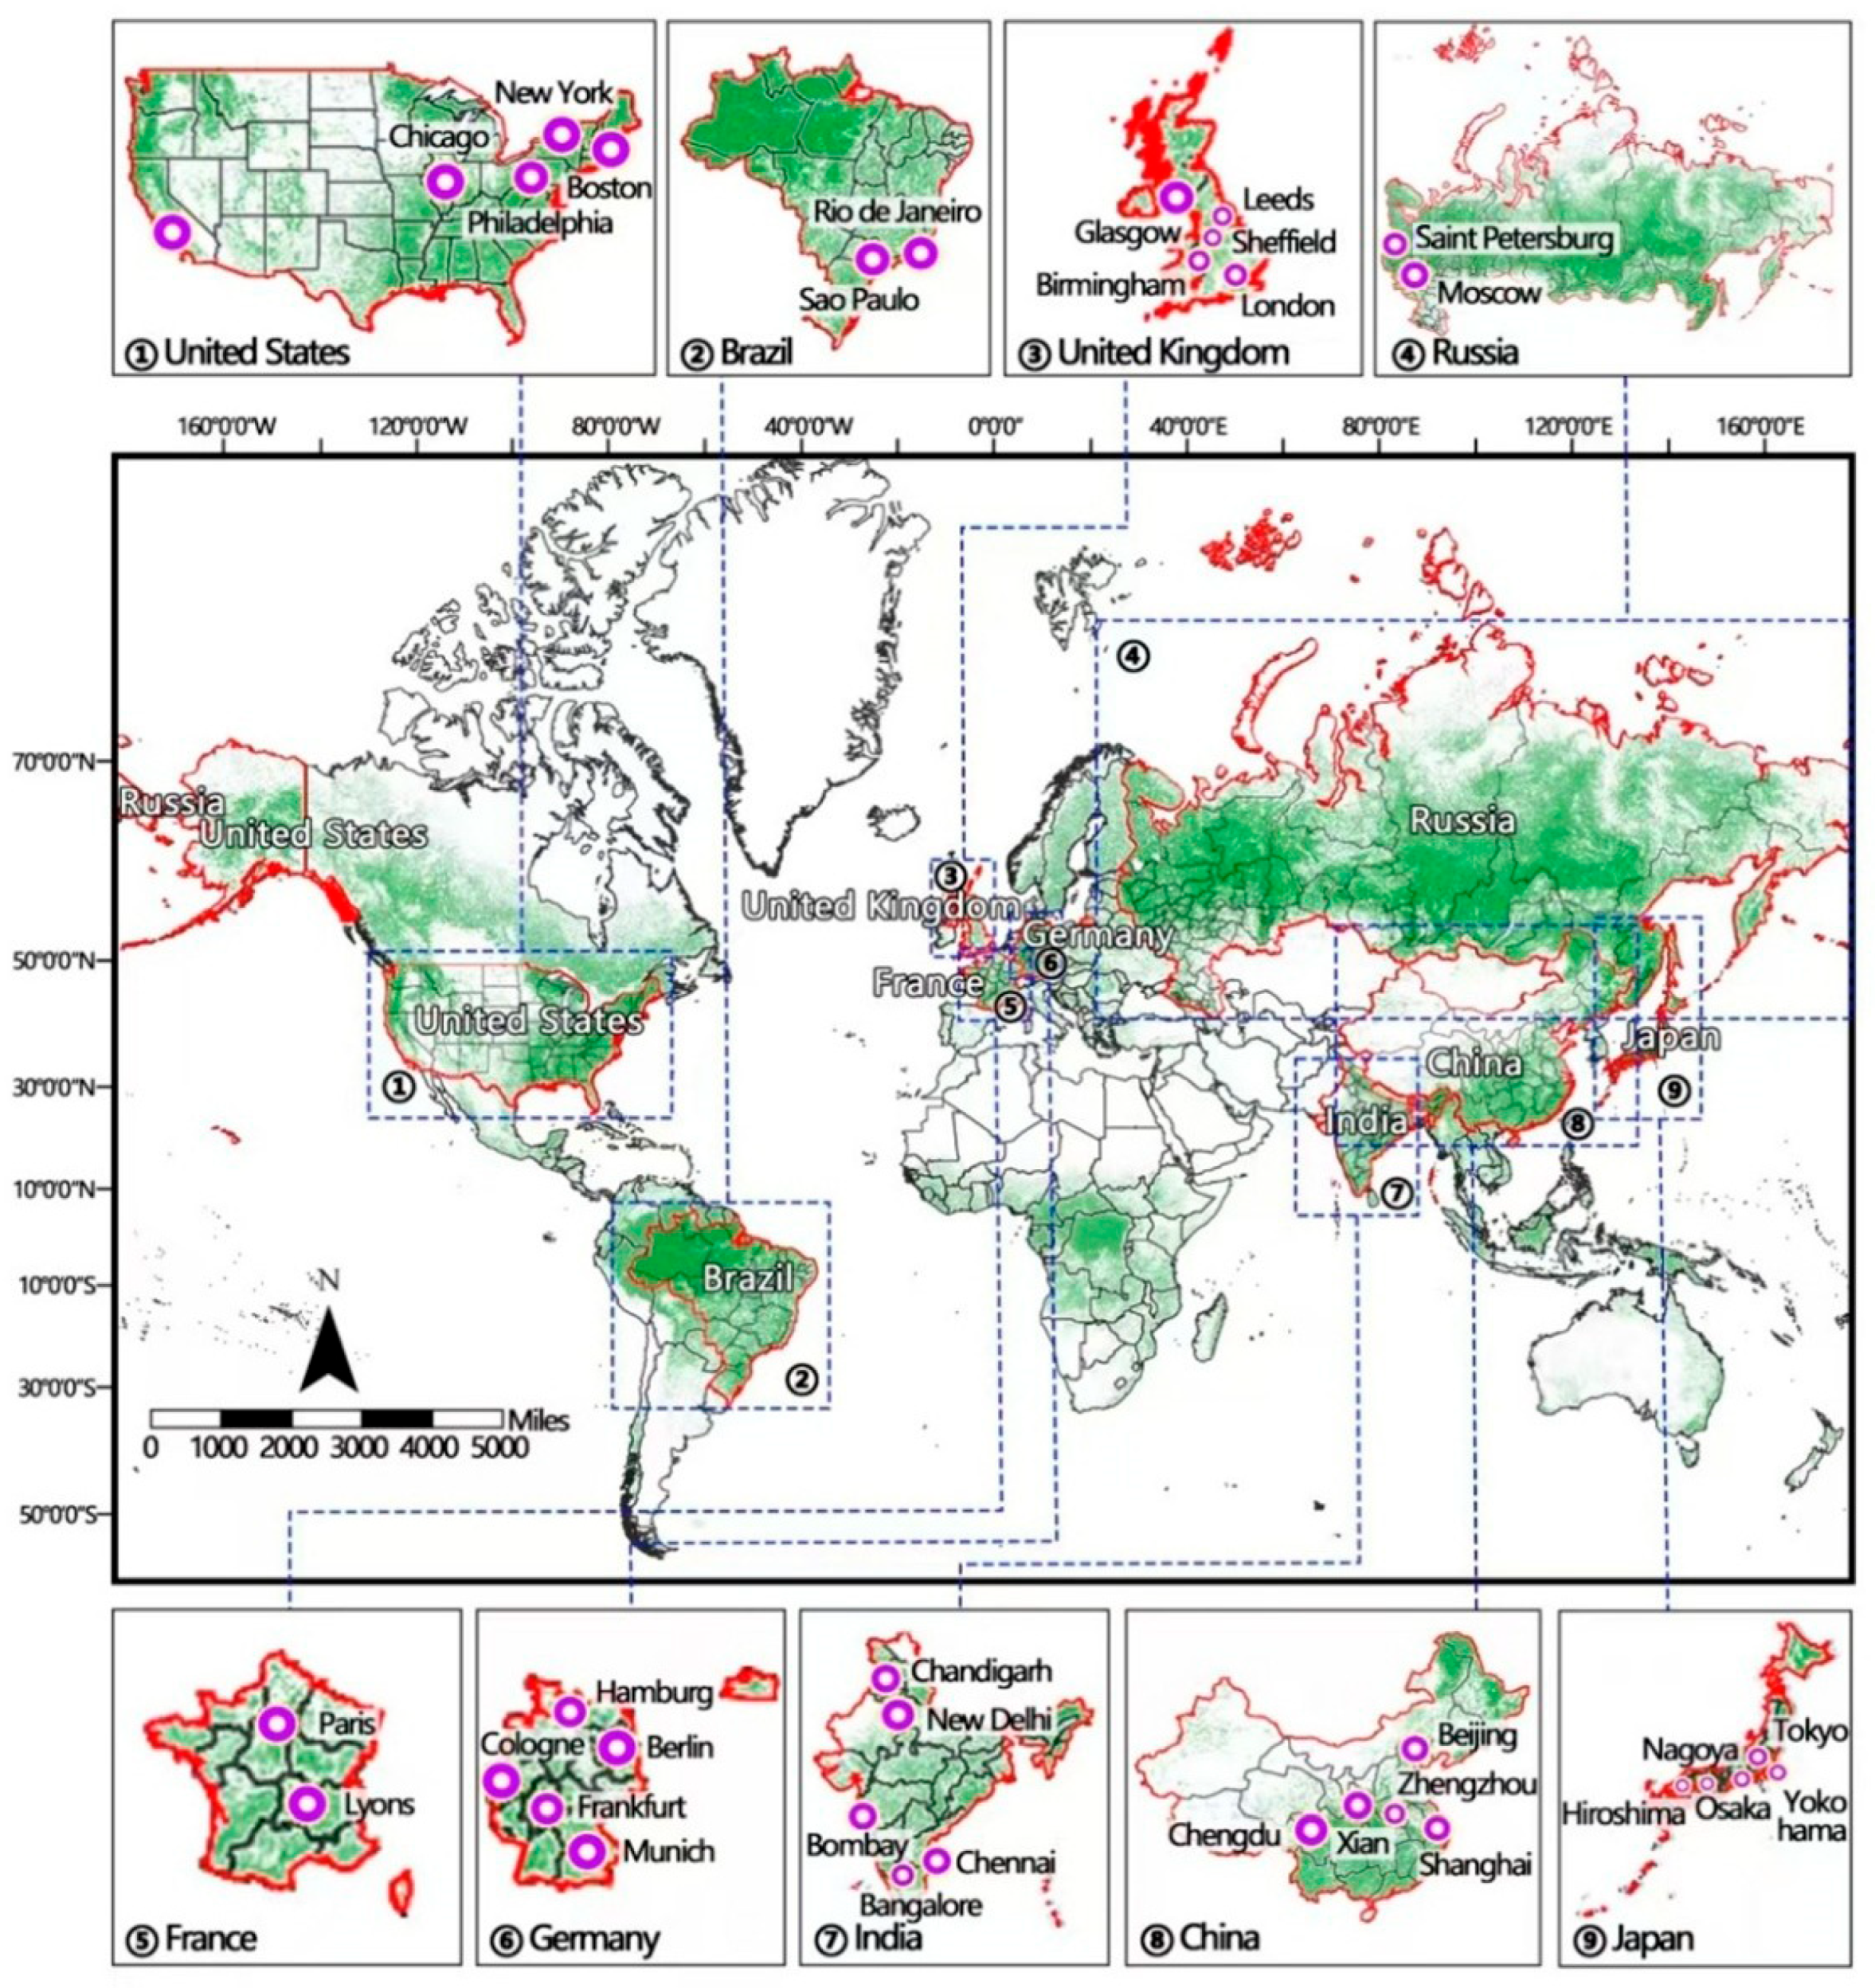
The formation of urban green space patterns is the result of multiple factors acting in concert. Among these, the land tenure system is a significant influencing factor, but it is not the only one [21]. To investigate the impact of land tenure systems while minimizing confounding factors from disparate natural conditions, we selected 36 cities across nine countries (e.g., the UK, USA, Germany, Japan, China, India, France, Brazil, Russia). These countries were chosen to represent a spectrum of land tenure systems (e.g., private-owned, state-owned, and hybrid systems) and economic development levels (developed and developing economies). The sample cities are predominantly national capitals or major economic hubs to ensure their representativeness in urban form studies [22].
The research samples cover both developed and developing countries (Figure 2). The United Kingdom, the United States, Germany, Japan, and France are considered developed countries. These nations have undergone extended periods of urban modernization, their urban green space systems are relatively complete, and their green space morphology and structure are more mature. In contrast, China, India, Brazil, and Russia are developing countries with relatively late urbanization processes. Their urban green space systems are still in the development stage, and their green space morphology and structure are continuously being improved [23,24]. In terms of land tenure systems, the United States, Germany, Japan, France, India, and Brazil practice private land ownership, while China adopts public land ownership. Although land ownership in the United Kingdom is nominally vested in the Crown, its practical operation is similar to private ownership [25]. Russia represents a special case: due to its complex transition from a centralized to a market-oriented land system, the statistical classifications and privatization progress vary widely across regions. To mitigate the institutional bias that might arise from using land tenure type as a single standard, we adopted governance-related indicators from the Worldwide Governance Indicators (WGI) dataset to calibrate and harmonize the comparative analysis [25]. This diverse sample selection allows this study to clearly reflect the morphological structure characteristics of urban green spaces under different land tenure systems, providing strong support for revealing the impact of land tenure systems on urban green space morphology and structure.
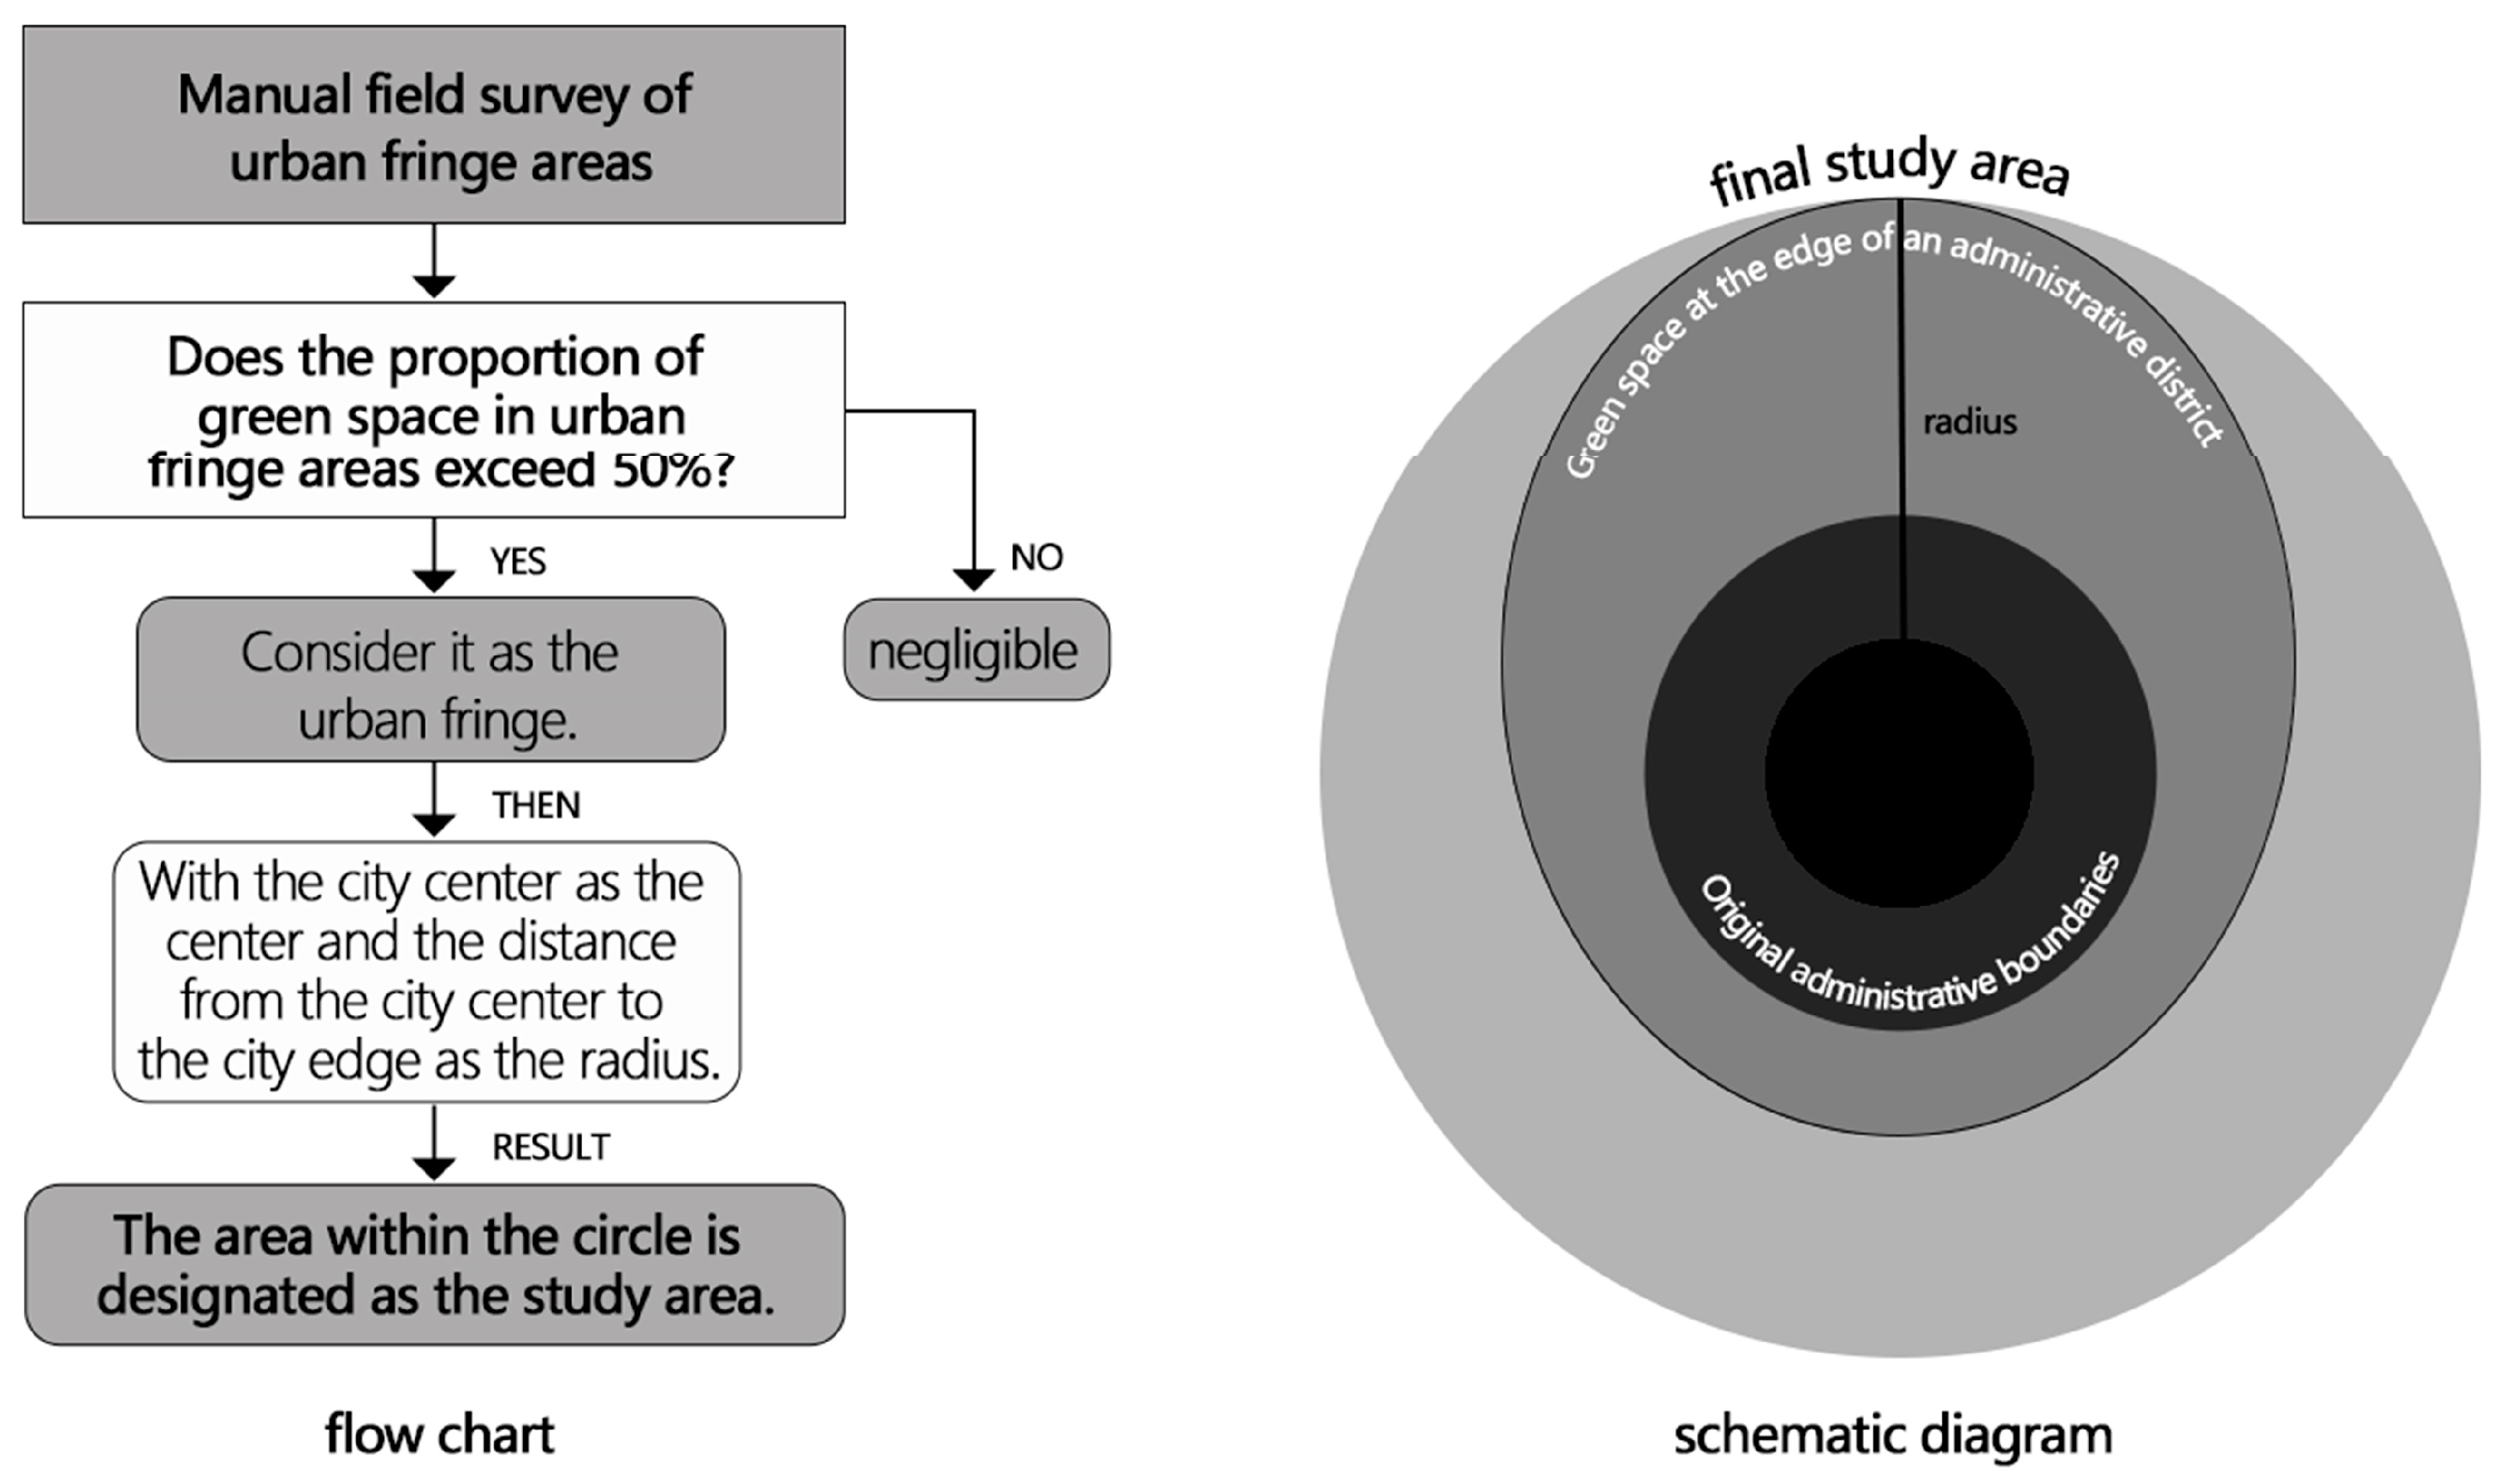
However, this study involves multiple countries, and significant differences exist in the administrative divisions across these nations, making it difficult to establish a unified standard for determining the research scope. Therefore, a threshold of green space proportion > 50% was determined with reference to the Technical Guidelines for National Territorial Spatial Planning of China and the study by Long et al. (2020) on urban development boundaries [26,27]. This threshold was further refined and validated through manual verification to ensure consistency and reliability across different urban contexts. For example, some urban areas, such as the New York Metropolitan Area, Tokyo Bay Area, Greater London Area, and Greater Paris Area, have already formed tightly interconnected urban clusters that span multiple administrative regions. These urban clusters have highly integrated internal structures, making it challenging to clearly define boundaries [28]. Forcing division based solely on administrative boundaries would lead to a loss of structural information and affect the accuracy of the study. Therefore, this research adopts a manual visual judgment method to determine the boundaries of the samples (Figure 3). The specific procedure involves first conducting field surveys of the urban fringe areas, and if the proportion of green space exceeds 50%, the area is considered part of the urban fringe zone. Then, using the city center as the focal point and the distance from the center to the urban fringe zone as the radius, the region within the circle is designated as the research area. This approach more accurately reflects the actual distribution range of urban green spaces, avoids errors caused by administrative divisions, and also helps better capture the relationship between urban green space morphology and land tenure systems [29]. By employing this method, this study aims to more accurately analyze the impact of land tenure systems on urban green space morphology and structure, providing more targeted recommendations for urban green space planning and management.

2.2. Research Methods

2.2.1. Data Sources and Processing

This study uses open-source OpenStreetMap (OSM) data as the primary dataset for the quantification analysis of urban green spaces. Additionally, the current laws, regulations, statistical data, and the Worldwide Governance Indicators (WGI) published by the World Bank are utilized as the foundational data for quantifying property rights strength, using the 2018 percentile ranking data (rank) of relevant countries as the benchmark [30] (Table 1).
The processing of urban green space data follows these steps. First, a functionalized land cover approach is applied, combining spatial recognition based on land cover data with land use attribute filtering to identify urban green spaces more accurately. Specifically, the OSM map was imported into ArcGIS 10.2 to extract the urban green space layers. Through manual comparison, 11 layers related to green space—including parks, forests, village green spaces, recreational areas, orchards, grasslands, green areas, lawns, and farmland—were selected and merged. Next, the extracted urban green space layers undergo rasterization to meet the input requirements for FRAGSTATS 4.2 software. During rasterization, the cell size is set to 0.001, and other parameters are kept at default values, ultimately generating a TIFF format raster image. Finally, the raster image is imported into FRAGSTATS 4.2 software to calculate the relevant landscape pattern indices (Figure 4).

2.2.2. Quantification of Urban Green Space Morphological Structure Characteristics

Landscape pattern indices are an analysis method based on landscape ecology theory, which can quantitatively assess landscape patterns and ecological processes [31]. This method effectively reflects the geometric shape and structural characteristics of urban green spaces, making it suitable for the analytical needs of this study. Therefore, landscape pattern indices are chosen as the quantification method for this research. The relevant calculations are performed using FRAGSTATS 4.2 and ArcGIS 10.2 software. This study selects five landscape pattern indices as quantitative indicators, including patch area (AREA), perimeter–area ratio (PARA), shape index (SHAPE), fractal dimension index (FRAC), and perimeter–area fractal dimension (PAFRAC). These indicators are derived from landscape ecology theory and are widely used to quantify spatial fragmentation and morphological complexity in urban environments [32,33]. They comprehensively reflect the distribution, shape, and structural characteristics of urban green spaces at both individual and overall levels. In this study, we focus solely on their geometric dimensions and do not extend interpretations to ecological functioning. Among these, the arithmetic mean of the first four indices (*MN) and the arithmetic mean of the fractal-dimension index (FRAC_MN) are considered core indicators. The corresponding median (*MD) is used as an auxiliary verification index to reflect the individual green-space conditions of the study samples. The perimeter–area fractal dimension (PAFRAC) serves as an auxiliary indicator to reflect the overall green space configuration of the study samples.

2.2.3. Quantification of Property Rights Strength

Currently, the methods for quantifying land property rights strength involve a variety of approaches. Some studies use the Delphi method to quantitatively analyze farmers’ land property rights strength, expressing it on a scale from 0 to 100 [34]. Other studies use the average compensation cost per unit area for land expropriation as a measure. Some research assesses property rights strength based on whether an individual possesses a land contract management certificate. Additionally, some studies have constructed measurement systems based on relevant theories, including three dimensions: national legal empowerment, social recognition, and the capabilities of property rights holders [3,35]. However, these methods have limitations when measuring the differences in land property rights strength across countries. For example, relying solely on the average compensation for expropriating agricultural land or whether an individual holds a land contract management certificate does not comprehensively reflect the differences between countries. Moreover, the Delphi method, being subjective, lacks objective foundations, which has led to challenges for some methods based on Likert scales and surveys in international research [36].
Therefore, this study selects “national legal empowerment” as the core indicator, using a five-level grading scale to score the various components of national legal empowerment over land ownership. Through weighted and integrated calculations, the actual value of property rights strength for the relevant countries is obtained, and the relative value is derived through ranking, providing a standard for subsequent research. Concurrently, this study employs methods such as a literature review and expert consultation to construct an indicator system based on four dimensions—land ownership, land use rights, land expropriation systems, and government land governance capacity—to achieve a quantitative analysis of land property rights intensity [24,37,38].
1.
Land Ownership
The proportion of privately owned land nationwide is used as a quantification standard. The higher the proportion of privately owned land, the higher the land ownership strength. This study primarily selects the proportion of privately owned land nationwide as a standard for quantifying land ownership. Although land ownership is divided into public and private ownership, even in countries where private land ownership is practiced, not all land is privately owned. Governments at various levels still retain a certain amount of public land. From this perspective, this study argues that the higher the proportion of private land, the higher the land ownership strength. Ownership of underground mineral resources is used as another quantification standard. The more complete the ownership of underground resources, the higher the land ownership strength. Furthermore, this chapter chooses ownership of underground mineral resources as another standard for quantifying land ownership systems. Owning a piece of land does not necessarily mean that the landowner can directly own the underground mineral resources beneath it. In this study, the completeness of underground resource ownership is used as a proxy indicator for institutional integrity, reflecting the depth dimension of property rights coverage within each national legal system. It does not directly influence urban green space morphology but serves to characterize the systemic comprehensiveness of land tenure arrangements.
2.
Land Use Rights
Land ownership duration is used as one of the quantification standards. The longer the land ownership period, the higher the property rights strength. In countries where land is publicly owned and use rights are tradable, the use-right duration is used as the reference; in countries with private land ownership, the ownership duration is applied. In this study, legal ownership is adopted as the classification criterion, excluding short-term leases or transferable use rights. Accordingly, the ownership period refers to the legally recognized duration of possession under national land laws, ensuring comparability across different tenure regimes. The study assumes that the longer the legally defined ownership period, the higher the land property rights strength.
3.
Land Expropriation System
The expropriation compensation standard is used as the quantification standard. The higher the compensation standard, the higher the property rights strength. This study selects the expropriation compensation standard as the grading quantification standard for the land expropriation system. In China, this specifically refers to the conversion of rural collective-owned land into state-owned land. Land expropriation systems vary across countries and are relatively complex. This study is mainly based on the expropriation compensation standard. This study assumes that the higher the expropriation compensation standard, the higher the land property rights strength.
4.
Government Land Governance Capacity
The government effectiveness and regulatory quality indicators from the Worldwide Governance Indicators (WGI) are used to comprehensively assess government land governance capacity. The higher the government effectiveness and regulatory quality, the stronger the land governance capacity, but the weaker the property rights strength [39]. Land property rights strength is closely related to government governance capacity. The stronger the governance capacity, the weaker the land property rights. The government land governance capacity is evaluated using the Worldwide Governance Indicators as the standard to assess the land governance capacity of the sample countries. The WGI, developed by Daniel Kaufmann of the Natural Resource Governance Institute (NRGI) and the Brookings Institution, along with Aart Kraay from the World Bank’s Development Research Group, have been published annually by the World Bank since 1999. The WGI evaluate countries’ governance capacity from six aspects: voice and accountability, political stability and absence of violence, government effectiveness, regulatory quality, rule of law, and control of corruption. Among these, government effectiveness refers to the quality of public services provided by the government, the overall quality of civil servants, the independence of law enforcement, the quality of policy formulation and implementation, and the credibility of the government’s commitment to these policies. Regulatory quality refers to the government’s ability to formulate and enforce strong policies and regulations that promote private sector development. This study uses government effectiveness and regulatory quality indicators to comprehensively assess the government’s land governance capacity. High government effectiveness is considered an indicator of the government’s efficiency in land system protection, while high regulatory quality suggests that laws and regulations are more favorable for protecting private land ownership [40,41].

2.2.4. Assessment of the Integrity of Land Use Rights Systems

After obtaining the quantification indicators for urban green spaces and land property rights systems, this study uses Spearman’s rank correlation coefficient (γs) to analyze the relationship between land ownership strength and urban green space morphological structure characteristics. γs is a non-parametric method suitable for analyzing the correlation between ordinal data and continuous data. The value range is [−1, +1], where an absolute value closer to 1 indicates a stronger correlation, while a value closer to 0 indicates a weaker correlation. After calculating the correlation coefficient, a t-test is further conducted to exclude the interference of sampling errors (Table 2). All statistical analyses are performed using SPSS-25 software.
This study quantifies the integrity characteristics (property rights strength) of the land use rights systems in the research sample locations based on relevant laws, regulations, and policies regarding land use rights and property rights. The evaluation is conducted from five aspects: land ownership, land use rights, land expropriation system, land use control system, and government land governance capacity. First, each of the four indicators, land ownership, land use rights, land expropriation system, and government land governance capacity, is scored.
The evaluation standard for land ownership is the proportion of private land to the total land area and the ownership of underground mineral resources. The proportion of private land to the total land area is divided into five levels, while the ownership of underground mineral resources is divided into three levels: fully state-owned, partially owned, and fully privately owned. Specific details can be found in Table 3. The weighting coefficients for these indicators were determined through expert consultation involving five specialists in land system and landscape studies using the Delphi discussion method. Future research may employ the Analytic Hierarchy Process (AHP) to further validate and refine the weighting structure.
Land use rights are evaluated based on the land ownership duration and are divided into three levels: short-term ownership restrictions, long-term ownership restrictions, and unlimited ownership duration (Table 4).
The evaluation of the land expropriation system is based on the expropriation compensation standard and is divided into three levels: the revenue value based on the current land use, the actual market value of the current land, and the revenue value of the land based on future land use (Table 5).
The evaluation of government land governance capacity is based on the government effectiveness and regulatory quality indicators from the 2018 Worldwide Governance Indicators (WGI) for the countries where the research samples are located [30,42]. These two indicators are summarized and calculated to determine a total value, expressed as a percentile ranking between 0 and 100, where higher values indicate better government effectiveness and regulatory quality (Table 6).
Then, the adjustment coefficient is determined based on the proportion of private land to the total land area (Table 7).
Next, based on the adjusted total value, the countries where the research samples are located are ranked. Government land governance capacity is then scored according to the ranking (Table 8).
Finally, after completing the scoring for each item, the absolute value of the land retention strength S is calculated:
S = K i × N i
where S represents the absolute score of land ownership strength, Ki is the weight of each component, and Ni is the actual score of each component, with 1 ≤ S ≤ 5. After calculating the absolute score S, the countries where the research samples are located are ranked, and the relative score R is derived based on the ranking. Specifically, the absolute scores of land ownership strength for all countries are arranged in order, and the ranking number corresponds to the country’s relative score R. This relative score R will serve as the standard for subsequent analysis and provide the basis for further land management strategy development. Through this ranking and relative score calculation method, this study can clearly demonstrate the relative position of each country in terms of land ownership strength and offer scientific evidence for the formulation and optimization of global land management policies. This evaluation system provides important data support for comparing and learning from land policies across countries.

3. Results

3.1. Correlation Analysis Results

This study explores the intrinsic correlation between land ownership strength and urban green space morphological structure characteristics. Based on existing theoretical assumptions, we hypothesize that when property rights strength is higher, it becomes more difficult for the government to acquire land [43]. Based on this assumption, we hypothesize that there may be a negative correlation between property rights intensity and the area of urban green spaces—that is, the higher the property rights intensity, the smaller the area of urban green spaces may be. Simultaneously, we hypothesize a positive correlation between property rights intensity and the morphological complexity of urban green spaces—that is, the higher the property rights intensity, the more complex the morphology of urban green spaces may be [44].
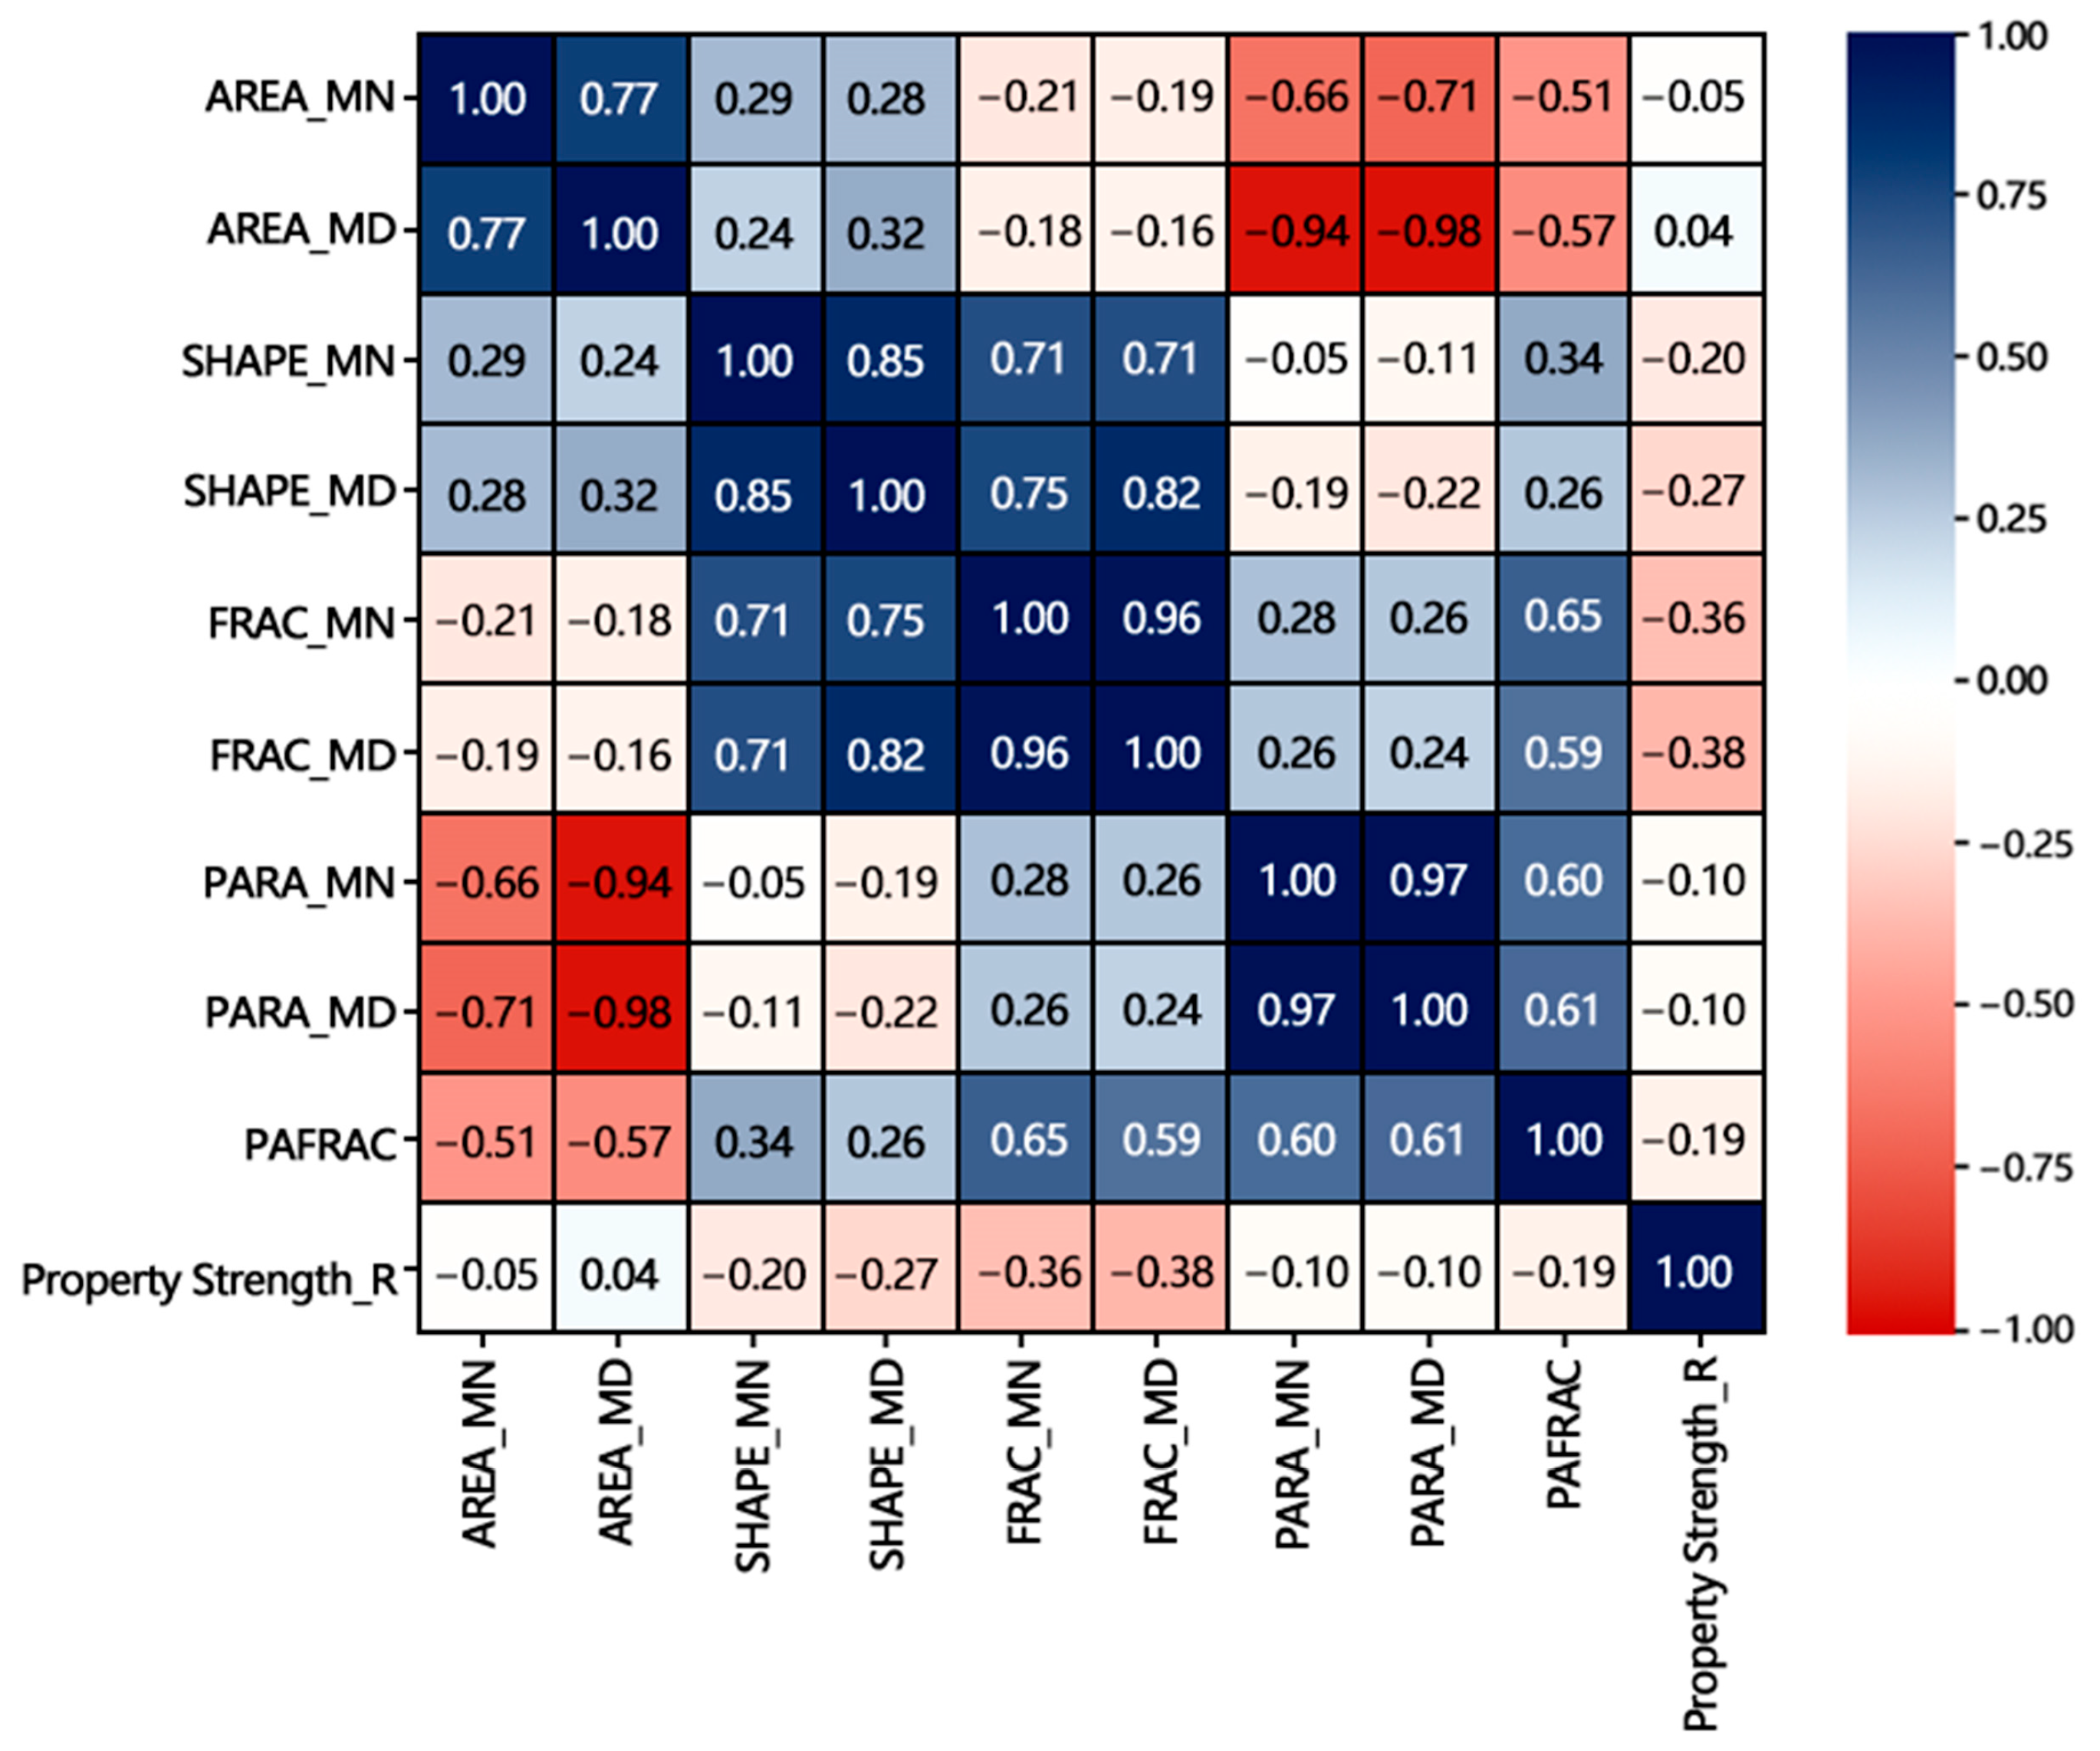
To verify the above hypothesis, we employed the γs. As a nonparametric statistical method, γs is suitable for handling non-normally distributed data and can effectively reflect monotonic correlations between variables [45]. Based on the characteristics of the data, we selected this method to analyze the correlation between land ownership strength and urban green space morphological structure characteristics (Figure 5).
Specifically, we used existing data and performed Spearman’s correlation analysis on the land ownership strength, patch area (AREA), perimeter-area ratio (PARA), shape index (SHAPE), fractal dimension index (FRAC), median (*MD) and arithmetic mean (*MN) of various indicators, and perimeter-area fractal dimension (PAFRAC) using the Correlation-Bivariate menu in statistical analysis software. The results were then compiled into reports (Table 9 and Table 10).

3.2. Patch Scale Interpretation

In further interpreting the results of the correlation analysis, we found that the significance level of the mean fractal dimension index (FRAC_MN) was p = 0.05, indicating that there was no significant correlation between it and property rights strength [46]. Nevertheless, the sign of the correlation coefficient still exhibited a certain trend. Specifically, indicators such as patch area (AREA), shape index (SHAPE), and perimeter-area fractal dimension (PAFRAC) showed a negative correlation with property rights strength. When property rights strength was lower, the values of these indicators were typically larger, suggesting that the urban green space had a larger area and a simpler shape [47].
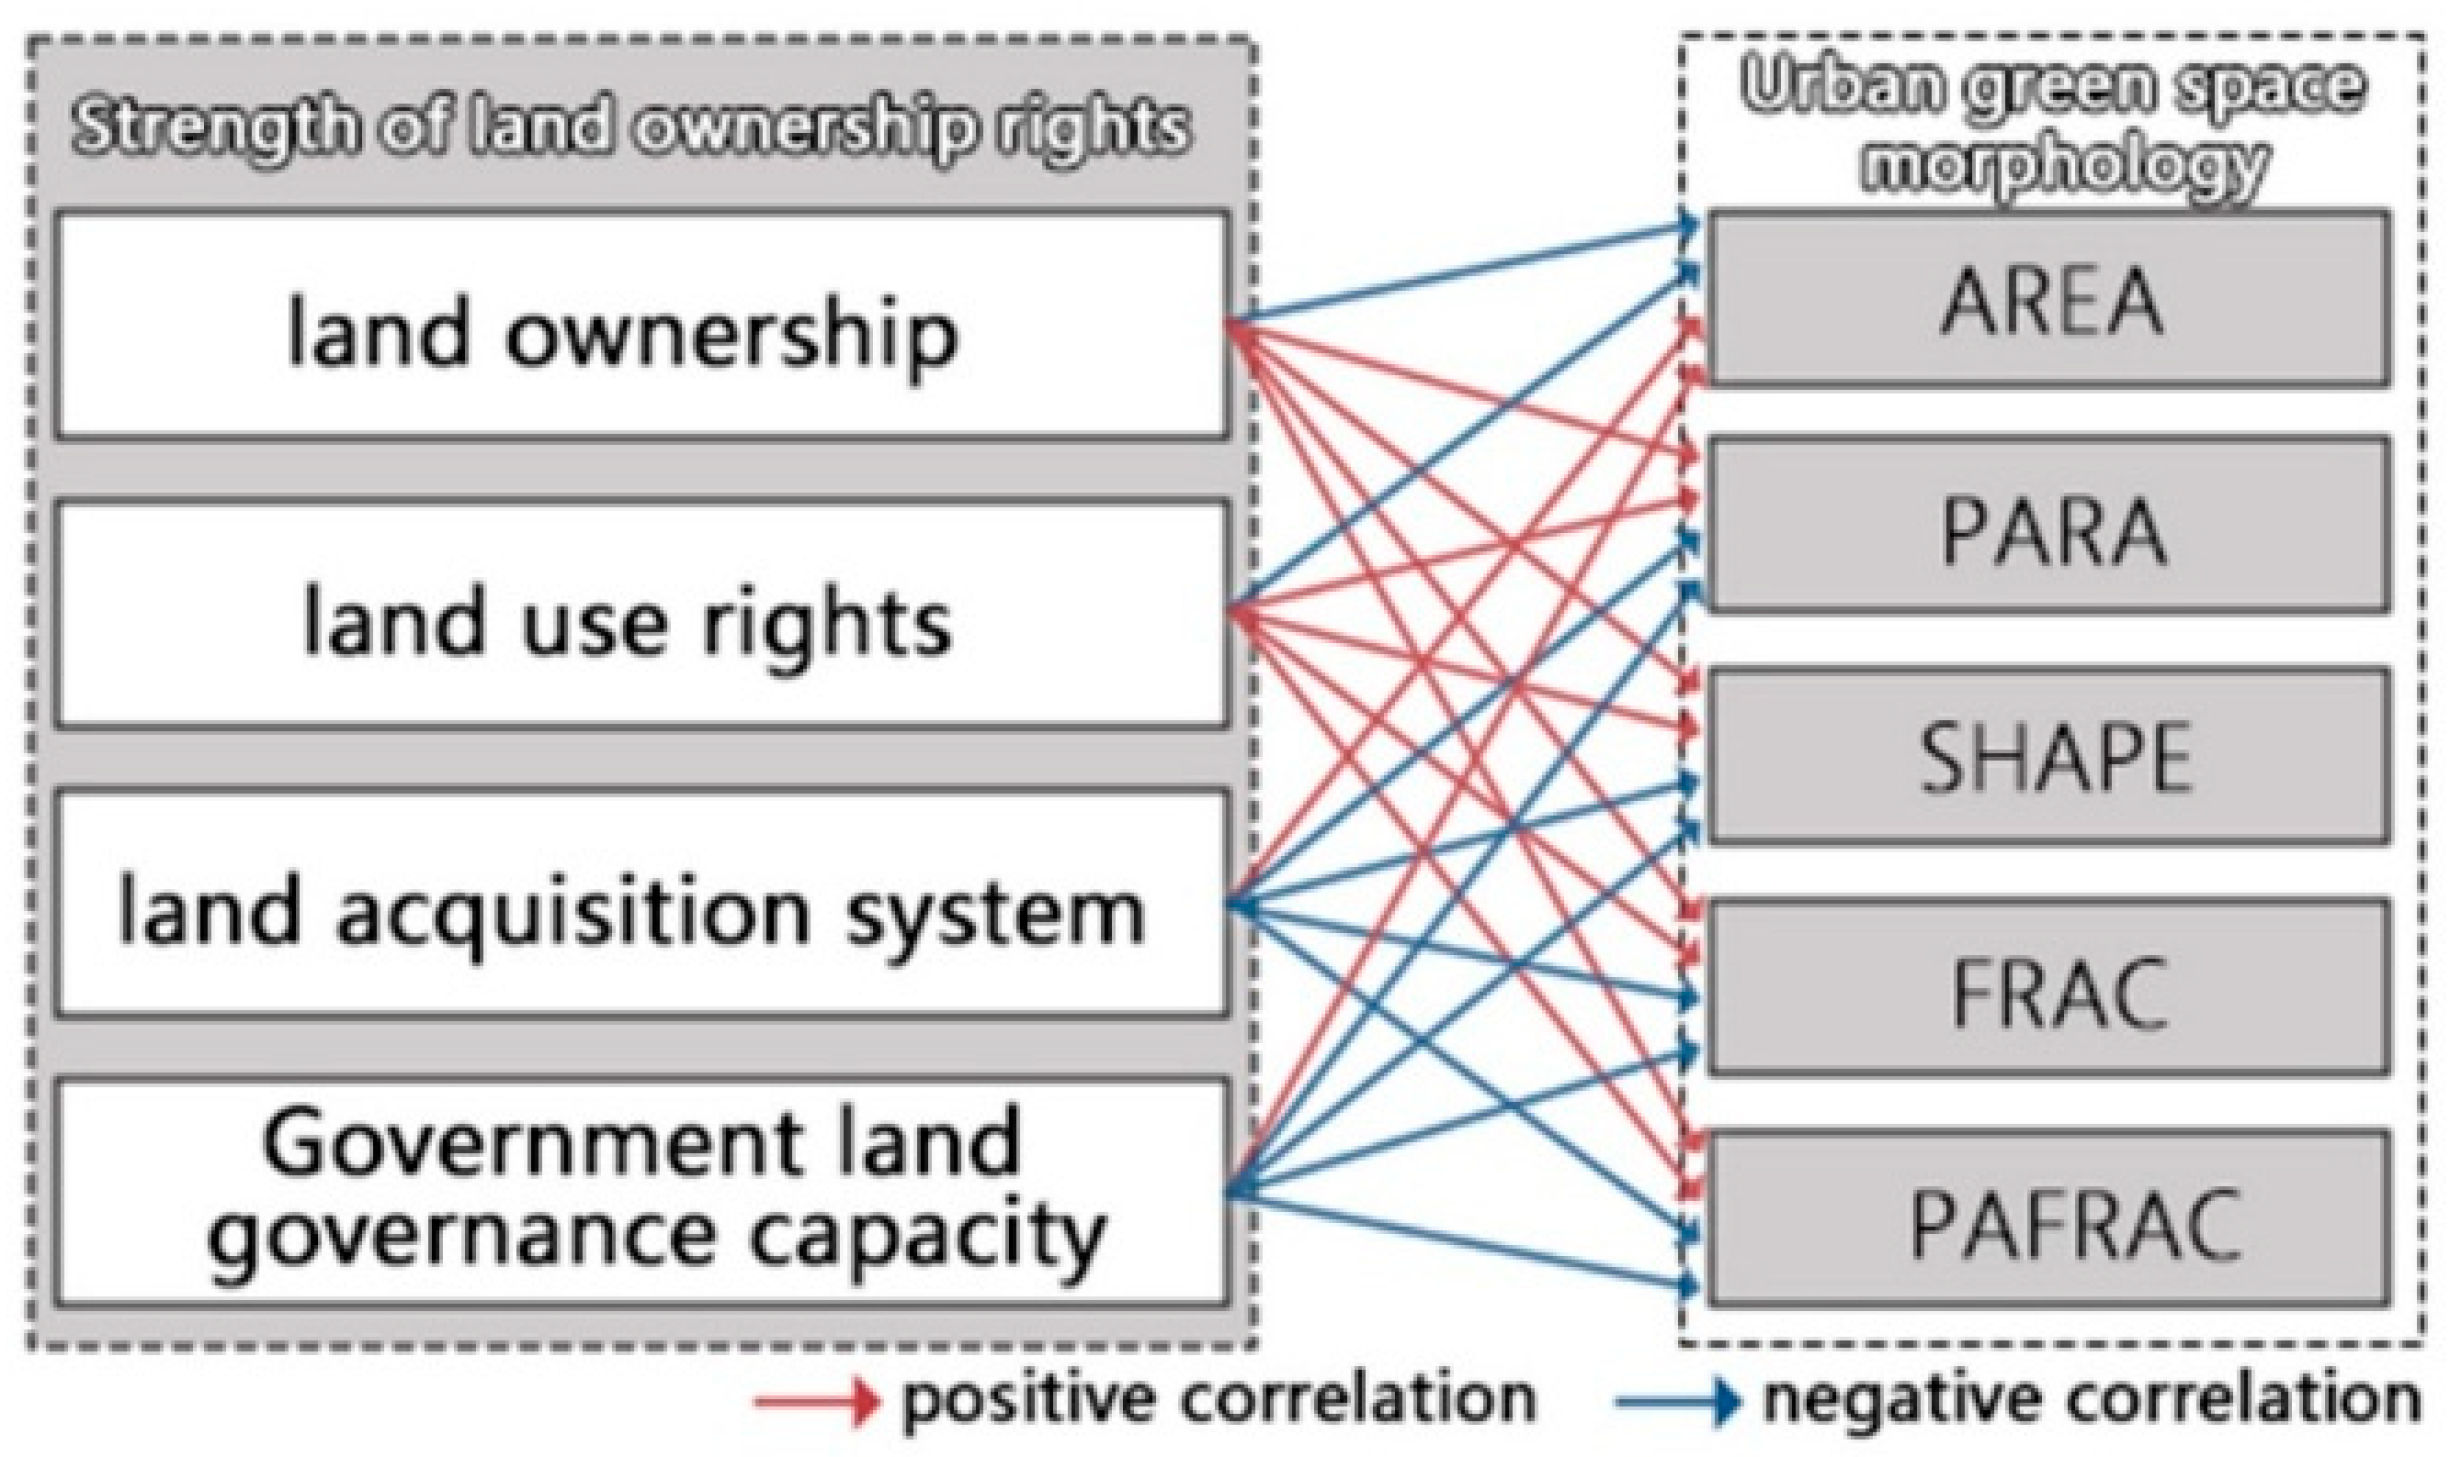
However, the correlation between the median (AREA_MD) and mean (AREA_MN) of the patch area exhibited an opposite sign. This phenomenon may be related to the extreme values in the distribution of patch areas. Since some patches had large areas, this led to a significant difference between the mean and median [37]. The median better reflects the central tendency of the data, while the mean is more susceptible to the influence of extreme values, resulting in inconsistent correlation signs. After comprehensively analyzing the results of the mean (*MN) and median (*MD), we conclude that the characteristics of property rights strength in land ownership have a significant impact on the morphological features of urban green spaces (Figure 6). All correlation computations were based on the normalized correlation coefficient (r), representing the ranked intensity of land property rights strength. Smaller r values correspond to higher ranks and stronger property rights intensity. Under this normalization, negative correlations indicate that as property rights intensity increases (i.e., r decreases), green space patches become smaller and more irregular, approaching a SHAPE index closer to 1.

3.3. Country-Level Pattern Differences

At the national level, differences in institutional arrangements shape distinct spatial outcomes. Countries with higher property rights intensity generally exhibit smaller, more fragmented green patches, reflecting market-driven constraints on land consolidation. In contrast, countries with lower property rights intensity—often characterized by stronger government intervention—tend to develop larger and more contiguous urban green spaces. These patterns underscore how governance capacity and tenure systems jointly regulate urban ecological structure, producing stratified morphological configurations across national contexts.

3.4. Summary of Relationships

Thus, we conclude that property rights strength in land ownership plays an important role in the evolution of urban green space morphology and structure, but the extent of its impact varies depending on the analytical scale and specific indicators used [48]. In this study, only results with p < 0.05 were considered statistically significant, while results with p ≥ 0.05 were interpreted as indicative trends rather than definitive effects.

4. Discussion

This study reveals the hierarchical mechanism by which land tenure systems influence the form and structure of urban green spaces by constructing a cross-national framework for quantifying property rights intensity and coupling it with landscape pattern indices.

4.1. Quantification Framework and Process Validation

This study first delineated urban fringe zones (green space coverage > 50%) through manual visual inspection. The study area was defined using the distance from the city center to the fringe zone as its radius, ensuring the complete inclusion of structural green spaces beyond administrative boundaries. Subsequently, 11 types of green space elements were extracted and merged to calculate five landscape indices—AREA_MN, PARA_MN, SHAPE_MN, FRAC_MN, and PAFRAC—quantifying both patch-level and overall-scale green space morphological characteristics. Property rights intensity was assessed using a four-dimensional indicator system—ownership ratio, land use tenure, land acquisition compensation standards, and government governance capacity. Scores ranging from 1 to 5 were assigned based on national regulations and WGI data, weighted, and summed to yield absolute scores, S. Relative scores, R, were then derived by ranking the absolute scores. Spearman’s γs test (α = 0.05) and two-tailed t-test showed that R is significantly negatively correlated with patch scale indices, verifying the robustness of the quantification process.

4.2. Property Rights—Green Space Coupling Mechanism

At the micro scale, with each level of increase in property rights strength, the average patch area significantly decreases, while the shape index and fractal dimension increase, supporting the property rights constraint–morphological complexity hypothesis. At the macro scale, R’s explanatory power for total green space area and overall connectivity decreases, indicating that policy-driven property rights differences mainly affect the patch scale, while urban-level patterns are still co-regulated by overall planning, historical urban expansion, and natural base factors.

4.3. Policy Tools and Institutional Adaptation

By analyzing the relationship between property rights intensity and the morphology and edge complexity of green space units across different cities, this paper proposes an explanatory framework grounded in policy and administrative contexts rather than solely ecological perspectives. Historical policy trajectories across nations have shaped distinct land tenure structures, directly influencing green space fragmentation, integrity, and overall morphology. Therefore, discussions and evaluations of green space forms should not rely solely on uniform standards for all cities but must account for variations in local administrative foundations and practical conditions. Future green space planning and management should be grounded in this understanding. In areas with low property rights intensity, large, well-defined green spaces can be rapidly established through one-time land acquisitions and centralized development. Conversely, in regions with high property rights intensity, flexible policy tools—such as transfer of land development rights, negotiated expropriation, ecological compensation, and transaction cost reductions—should be employed to maintain network connectivity and ecological functions through fragmented, embedded approaches. Policy design should preemptively assess property rights concentration and transaction costs, optimizing transaction processes and innovating financing mechanisms based on actual conditions to ensure alignment between green space planning objectives and land supply capacity. Future studies could further explore the micro-level coupling mechanisms between property rights intensity and green space distribution at the parcel or community scales, providing deeper insight into how institutional strength shapes spatial morphology within fine-grained urban contexts.

4.4. Comparison with Previous Studies

This study extends existing scholarship by incorporating an institutional comparative perspective into the analysis of urban green space morphology. While Zhang and Li (2023) emphasized regional disparities in land use intensity within single-country contexts, and Whiting (2022) explored governance mechanisms affecting green space accessibility, few studies have systematically examined the cross-national variability of property rights systems and their morphological implications [49,50]. Our findings highlight the institutional dimension—specifically, the intensity of property rights regimes—as a critical but underexplored factor shaping urban green space configuration. By linking property rights strength to landscape metrics across 36 global cities, this study provides a transnational framework that complements and expands upon prior city-scale or policy-oriented approaches.

4.5. Limitations of the Study

Several limitations should be acknowledged. First, differences in data availability and classification across countries may introduce bias in cross-national comparability, particularly in OpenStreetMap-based green space delineation. Second, the expert-derived weighting coefficients determined through the Delphi process involve an element of subjectivity, which may influence the indicator aggregation outcomes. Third, spatial-scale constraints—particularly the city-level aggregation—limit our ability to capture intra-urban heterogeneity and neighborhood-level interactions. Finally, this study does not employ multivariate modeling to identify potential interaction effects among institutional, socioeconomic, and environmental factors. These limitations may affect the strength or interpretation of the observed correlations. Future work should address these issues by integrating standardized multi-source spatial data, incorporating AHP or machine-learning-based weighting validation, and adopting multi-level statistical models to better capture complex cross-scalar relationships.

4.6. Future Research Directions

Future research should decompose property rights intensity across multiple scales—from cities to communities to individual plots—by integrating high-resolution remote sensing data with socioeconomic information. This approach will enable refined analysis of the institutional-spatial coupling mechanism, thereby providing more universally applicable decision support for green space planning across diverse institutional contexts.

5. Conclusions

This study employs 36 global cities as empirical samples, supporting the hypothesis that land property rights systems influence urban green space morphology through the coupling of a four-dimensional property rights intensity index—ownership share, tenure duration, land acquisition compensation, and governance capacity—with patch scale landscape metrics. Findings indicate that property rights intensity is a core institutional variable shaping green space geometric complexity, yet its effects are scale-dependent. At the patch level, a significant negative correlation is observed—higher property rights intensity corresponds to smaller and more irregular green patches. At the broader spatial-pattern level, this relationship becomes moderated by planning policies, urban expansion history, and environmental substrate.
Under high property rights intensity, land privatization and ownership concentration increase transaction costs, fostering fragmentation and spatial heterogeneity. Conversely, under lower property rights intensity, governments can more readily consolidate land to form larger, more contiguous green cores.
Policy implications derived from this comparative analysis emphasize the need to align planning strategies with institutional conditions. In high-intensity contexts, flexible land instruments such as development-right transfers, negotiated acquisition, and ecological compensation can help alleviate barriers to green space connectivity. In low-intensity contexts, one-time large-scale land assembly and statutory ecological zoning provide effective means to maintain structural integrity. Cross-nationally, updating the property rights intensity–green space form database will support adaptive policy iteration.
Property rights intensity ultimately reflects the bargaining power of landholders in spatial transactions, influencing how urban green spaces evolve under different tenure regimes. The observed correlations highlight the institutional dimension as a critical but often overlooked factor in shaping urban landscape form, offering a comparative basis for sustainable spatial governance in diverse legal systems.

Author Contributions

Conceptualization, H.Z. and Y.L.; methodology, H.Z. and Y.L.; software, H.Z. and X.S.; validation, H.Z. and X.S.; formal analysis, H.Z., Y.L. and X.S.; investigation, H.Z. and M.X.; resources, K.Z.; data curation, H.Z., Y.L. and M.X.; writing—original draft preparation, H.Z., Y.L. and X.S.; writing—review and editing, K.Z., X.S. and X.W.; visualization, H.Z. and X.S.; supervision, X.W.; project administration, K.Z. All authors have read and agreed to the published version of the manuscript.

Funding

This research received no external funding.

Data Availability Statement

The raw data supporting the conclusions of this article will be made available by the authors on request.

Acknowledgments

We thank colleagues and collaborators who provided constructive feedback during manuscript preparation. During the preparation of this manuscript, the authors used ChatGPT 5.0 Plus (OpenAI, 2025) solely for language editing under author supervision. The authors take full responsibility for the final content.

Conflicts of Interest

The authors declare no conflicts of interest.

References

  1. Whiting, S.H. Land Rights, Industrialization, and Urbanization: China in Comparative Context. J. Chin. Political Sci. 2022, 27, 399–414. [Google Scholar] [CrossRef]
  2. Khoei, Z. The Effects of Land Ownership System to Urban Development Plan (Case Study: The Section Edge of Tehran City). Int. J. Archit. Urban Dev. 2022, 8, 33–44. [Google Scholar]
  3. Alchian, A.A. Some economics of property rights. Il Politico 1965, 30, 816–829. [Google Scholar]
  4. Li, S.; Luo, B.; Zhong, W. Intensity of Property Rights, Resource Endowments and Satisfaction of Land Requisition—Based on Nationwide Sampling Survey of 273 Farmers. J. Huazhong Agric. Univ. (Soc. Sci. Ed.) 2013, 7, 7–15. [Google Scholar]
  5. Li, S.; Luo, B.; Hu, X.; Chen, S. Determinants of Land Tenure Subdivision, Transaction Characteristics, and Outsourcing Intentions in Crop Production: Findings from Surveys of Farmers and Experts. J. Institutional Econ. 2017, 58–73. [Google Scholar]
  6. Herrera-Benavides, J.; Pfeiffer, M.; Galleguillos, M. Land subdivision in the law’s shadow: Unraveling the drivers and spatial patterns of land subdivision with geospatial analysis and machine learning techniques in complex landscapes. Landsc. Urban Plan. 2024, 249, 105106. [Google Scholar] [CrossRef]
  7. Bush, J. The role of local government greening policies in the transition towards nature-based cities. Environ. Innov. Soc. Transit. 2020, 35, 35–44. [Google Scholar] [CrossRef]
  8. Taylor, L.; Hochuli, D.F. Defining greenspace: Multiple uses across multiple disciplines. Landsc. Urban Plan. 2017, 158, 25–38. [Google Scholar] [CrossRef]
  9. Zhou, Q.; Konijnendijk van den Bosch, C.C.; Chen, Z.; Wang, X.; Zhu, L.; Chen, J.; Lin, Y.; Dong, J. China’s Green space system planning: Development, experiences, and characteristics. Urban For. Urban Green. 2021, 60, 127017. [Google Scholar] [CrossRef]
  10. World Health Organization (WHO Regional Office for Europe). Urban Green Space and Health; WHO Regional Office for Europe: Copenhagen, Denmark, 2016. [Google Scholar]
  11. European Environment Agency. Urban Green Infrastructure: Connecting Cities and Nature; European Environment Agency: Copenhagen, Denmark, 2021. [Google Scholar]
  12. United States Environmental Protection Agency. Green Infrastructure Overview. 2019. Available online: https://www.epa.gov/green-infrastructure/what-green-infrastructure (accessed on 13 July 2025).
  13. Jha, P.; Joy, M.S.; Yadav, P.K.; Begam, S.; Bansal, T. Detecting the role of urban green parks in thermal comfort and public health for sustainable urban planning in Delhi. Discov. Public Health 2024, 21, 236. [Google Scholar] [CrossRef]
  14. Mohd Nor, N.; Sahrir, S. The role of urban green space in promoting sustainable development: A study on putrajaya, malaysia. Plan. Malays. 2024, 22, 111–125. [Google Scholar] [CrossRef]
  15. Haase, D.; Kabisch, N.; Haase, A. Greening cities—To be socially inclusive? About the alleged paradox of society and ecology in cities. Habitat Int. 2017, 64, 41–48. [Google Scholar] [CrossRef]
  16. Kabisch, N. Urban green spaces and governance: Towards a new spatial perspective. Urban For. Urban Green. 2019, 40, 175–184. [Google Scholar]
  17. Andersson, E. Land governance and spatial justice in cities. Landsc. Urban Plan. 2019, 181, 39–49. [Google Scholar]
  18. Ceccato, V.; Ioannidis, I. Using Remote Sensing Data in Urban Crime Analysis: A Systematic Review of English-Language Literature from 2003 to 2023. Int. Crim. Justice Rev. 2025, 35, 102–122. [Google Scholar] [CrossRef]
  19. Sun, B.; Qian, J.; Qu, K.; Draper, G.M. Heuristic decision tree model for ecological urban green space network construction. J. Intell. Fuzzy Syst. 2019, 37, 79–86. [Google Scholar] [CrossRef]
  20. Teimouri, R.; Yigitcanlar, T. An approach towards effective ecological planning: Quantitative analysis of urban green space characteristics. Glob. J. Environ. Sci. Manag. 2018, 4, 195–206. [Google Scholar] [CrossRef]
  21. Wang, A.; Chan, E. Institutional factors affecting urban green space provision—From a local government revenue perspective. J. Environ. Plan. Manag. 2019, 62, 2313–2329. [Google Scholar] [CrossRef]
  22. Derdouri, A.; Murayama, Y.; Morimoto, T.; Wang, R.; Haji Mirza Aghasi, N. Urban green space in transition: A cross-continental perspective from eight Global North and South cities. Landsc. Urban Plan. 2025, 253, 105220. [Google Scholar] [CrossRef]
  23. Łaszkiewicz, E.; Kronenberg, J.; Mohamed, A.A.; Roitsch, D.; De Vreese, R. Who does not use urban green spaces and why? Insights from a comparative study of thirty-three European countries. Landsc. Urban Plan. 2023, 239, 104866. [Google Scholar] [CrossRef]
  24. Ma, Y.; Brindley, P.G.; Lange, E. Comparison of urban green space usage and preferences: A case study approach of China and the UK. Landsc. Urban Plan. 2024, 249, 105112. [Google Scholar] [CrossRef]
  25. Woldesemayat, E.M.; Genovese, P.V. Urban Green Space Composition and Configuration in Functional Land Use Areas in Addis Ababa, Ethiopia, and Their Relationship with Urban Form. Land 2021, 10, 85. [Google Scholar] [CrossRef]
  26. Long, Y.; Liu, X.; Li, X. Delineating urban development boundaries using a big-data approach: A case study of Chinese cities. Cities 2020, 97, 102566. [Google Scholar]
  27. Ministry of Natural Resources of the People’s Republic of China. Technical Guidelines for National Territorial Spatial Planning of China; China Planning Press: Beijing, China, 2020. [Google Scholar]
  28. Chen, Y.; Wang, J.; Long, Y.; Zhang, X.; Li, X. Defining urban boundaries by characteristic scales. Comput. Environ. Urban Syst. 2022, 94, 101799. [Google Scholar] [CrossRef]
  29. Kiberet, B.; Nebere, A.; Workineh, B.A.; Jothimani, M. Integrating geospatial technologies and AHP for optimal urban green space development: A case study of Gondar, Ethiopia. Discov. Sustain. 2025, 6, 303. [Google Scholar] [CrossRef]
  30. Kaufmann, D.; Kraay, A. Worldwide Governance Indicators, 2024 Update; World Bank: Washington, DC, USA, 2024. [Google Scholar]
  31. Wu, J.; Wang, Y.; Chang, H.; Peng, J.; Liu, Y. Application of landscape ecology in territory optimization. J. Nat. Resour. 2020, 35, 14–25. [Google Scholar] [CrossRef]
  32. Forman, R.T.T. Land Mosaics: The Ecology of Landscapes and Regions; Cambridge University Press: Cambridge, UK, 1995. [Google Scholar]
  33. McGarigal, K.; Cushman, S.A.; Ene, E. FRAGSTATS v4: Spatial Pattern Analysis Program for Categorical and Continuous Maps; University of Massachusetts: Amherst, MA, USA, 2012. [Google Scholar]
  34. Kelemen, E.; Megyesi, B.; Matzdorf, B.; Andersen, E.; van Bussel, L.G.J.; Dumortier, M.; Dutilly, C.; García-Llorente, M.; Hamon, C.; LePage, A.; et al. The prospects of innovative agri-environmental contracts in the European policy context: Results from a Delphi study. Land Use Policy 2023, 131, 106706. [Google Scholar] [CrossRef]
  35. Cao, Y.; Zhang, X. Are they satisfied with land taking? Aspects on procedural fairness, monetary compensation and behavioral simulation in China’s land expropriation story. Land Use Policy 2018, 74, 166–178. [Google Scholar] [CrossRef]
  36. Luo, B.; Ling, S.; Zhong, W. Evaluating Institutional Effectiveness: Theoretical Framework and Empirical Testing—Taking the Household Contract Responsibility System as an Example. Jianghai Acad. J. 2014, 5, 70–78+238. [Google Scholar]
  37. Narváez Vallejo, A.; Raumer, H.-G.S.-v.; Eisenberg, B. The interplay of land-use and land-ownership as a key for urban greening management. Urban For. Urban Green. 2024, 99, 128442. [Google Scholar] [CrossRef]
  38. Derkzen, M.L.; van Teeffelen, A.J.A.; Nagendra, H.; Verburg, P.H. Shifting roles of urban green space in the context of urban development and global change. Curr. Opin. Environ. Sustain. 2017, 29, 32–39. [Google Scholar] [CrossRef]
  39. Kaufmann, D.; Kraay, A.C.; Mastruzzi, M. The Worldwide Governance Indicators: Methodology and Analytical Issues; World Bank: Washington, DC, USA, 2010. [Google Scholar]
  40. Shi, C.; Tang, B.-S. Institutional change and diversity in the transfer of land development rights in China: The case of Chengdu. Urban Stud. 2020, 57, 473–489. [Google Scholar] [CrossRef]
  41. Gerber, J.-D. The difficulty of integrating land trusts in land use planning. Landsc. Urban Plan. 2012, 104, 289–298. [Google Scholar] [CrossRef]
  42. Natural Resource Governance Institute. ResourceData|Natural Resource Governance Institute. 2025. Available online: https://www.resourcedata.org/ (accessed on 13 July 2025).
  43. Needham, B. Property Rights and Urban Planning. In International Encyclopedia of the Social & Behavioral Sciences; Elsevier: Amsterdam, The Netherlands, 2015. [Google Scholar] [CrossRef]
  44. Chen, J.; Kinoshita, T.; Li, H.; Luo, S.; Su, D. Which green is more equitable? A study of urban green space equity based on morphological spatial patterns. Urban For. Urban Green. 2024, 91, 128178. [Google Scholar] [CrossRef]
  45. Das, S. (Ed.) Statistical Analysis of Environmental Data. In An Introduction to Water Quality Science: Significance and Measurement Protocols; Springer International Publishing: Cham, Switzerland, 2023; pp. 183–195. [Google Scholar] [CrossRef]
  46. Dhole, A.; Kadaverugu, R.; Tomar, S.; Biniwale, R.; Sharma, A. Impact of land cover classes on surface temperature in the vicinity of urban lakes and vegetation patches: A non-parametric regression analysis over decadal data. Earth Sci. Inform. 2023, 16, 3947–3961. [Google Scholar] [CrossRef]
  47. He, K.; Tan, Z.; Tang, Z. Sowing Uncertainty: Assessing the Impact of Economic Policy Uncertainty on Agricultural Land Conversion in China. Systems 2025, 13, 466. [Google Scholar] [CrossRef]
  48. Ma, J.; Tian, L.; Zhang, Y.; Yang, X.; Li, Y.; Liu, Z.; Zhou, L.; Wang, Z.; Ouyang, W. Global property rights and land use efficiency. Nat. Commun. 2024, 15, 8525. [Google Scholar] [CrossRef]
  49. Whiting, K. Governance, Green Space, and Equity: Reassessing Urban Environmental Justice in Comparative Context. Landsc. Urban Plan. 2022, 220, 104345. [Google Scholar]
  50. Zhang, L.; Li, Y. Regional Differentiation of Land-Use Intensity and Its Policy Implications: Evidence from Urban China. Land Use Policy 2023, 129, 106648. [Google Scholar]
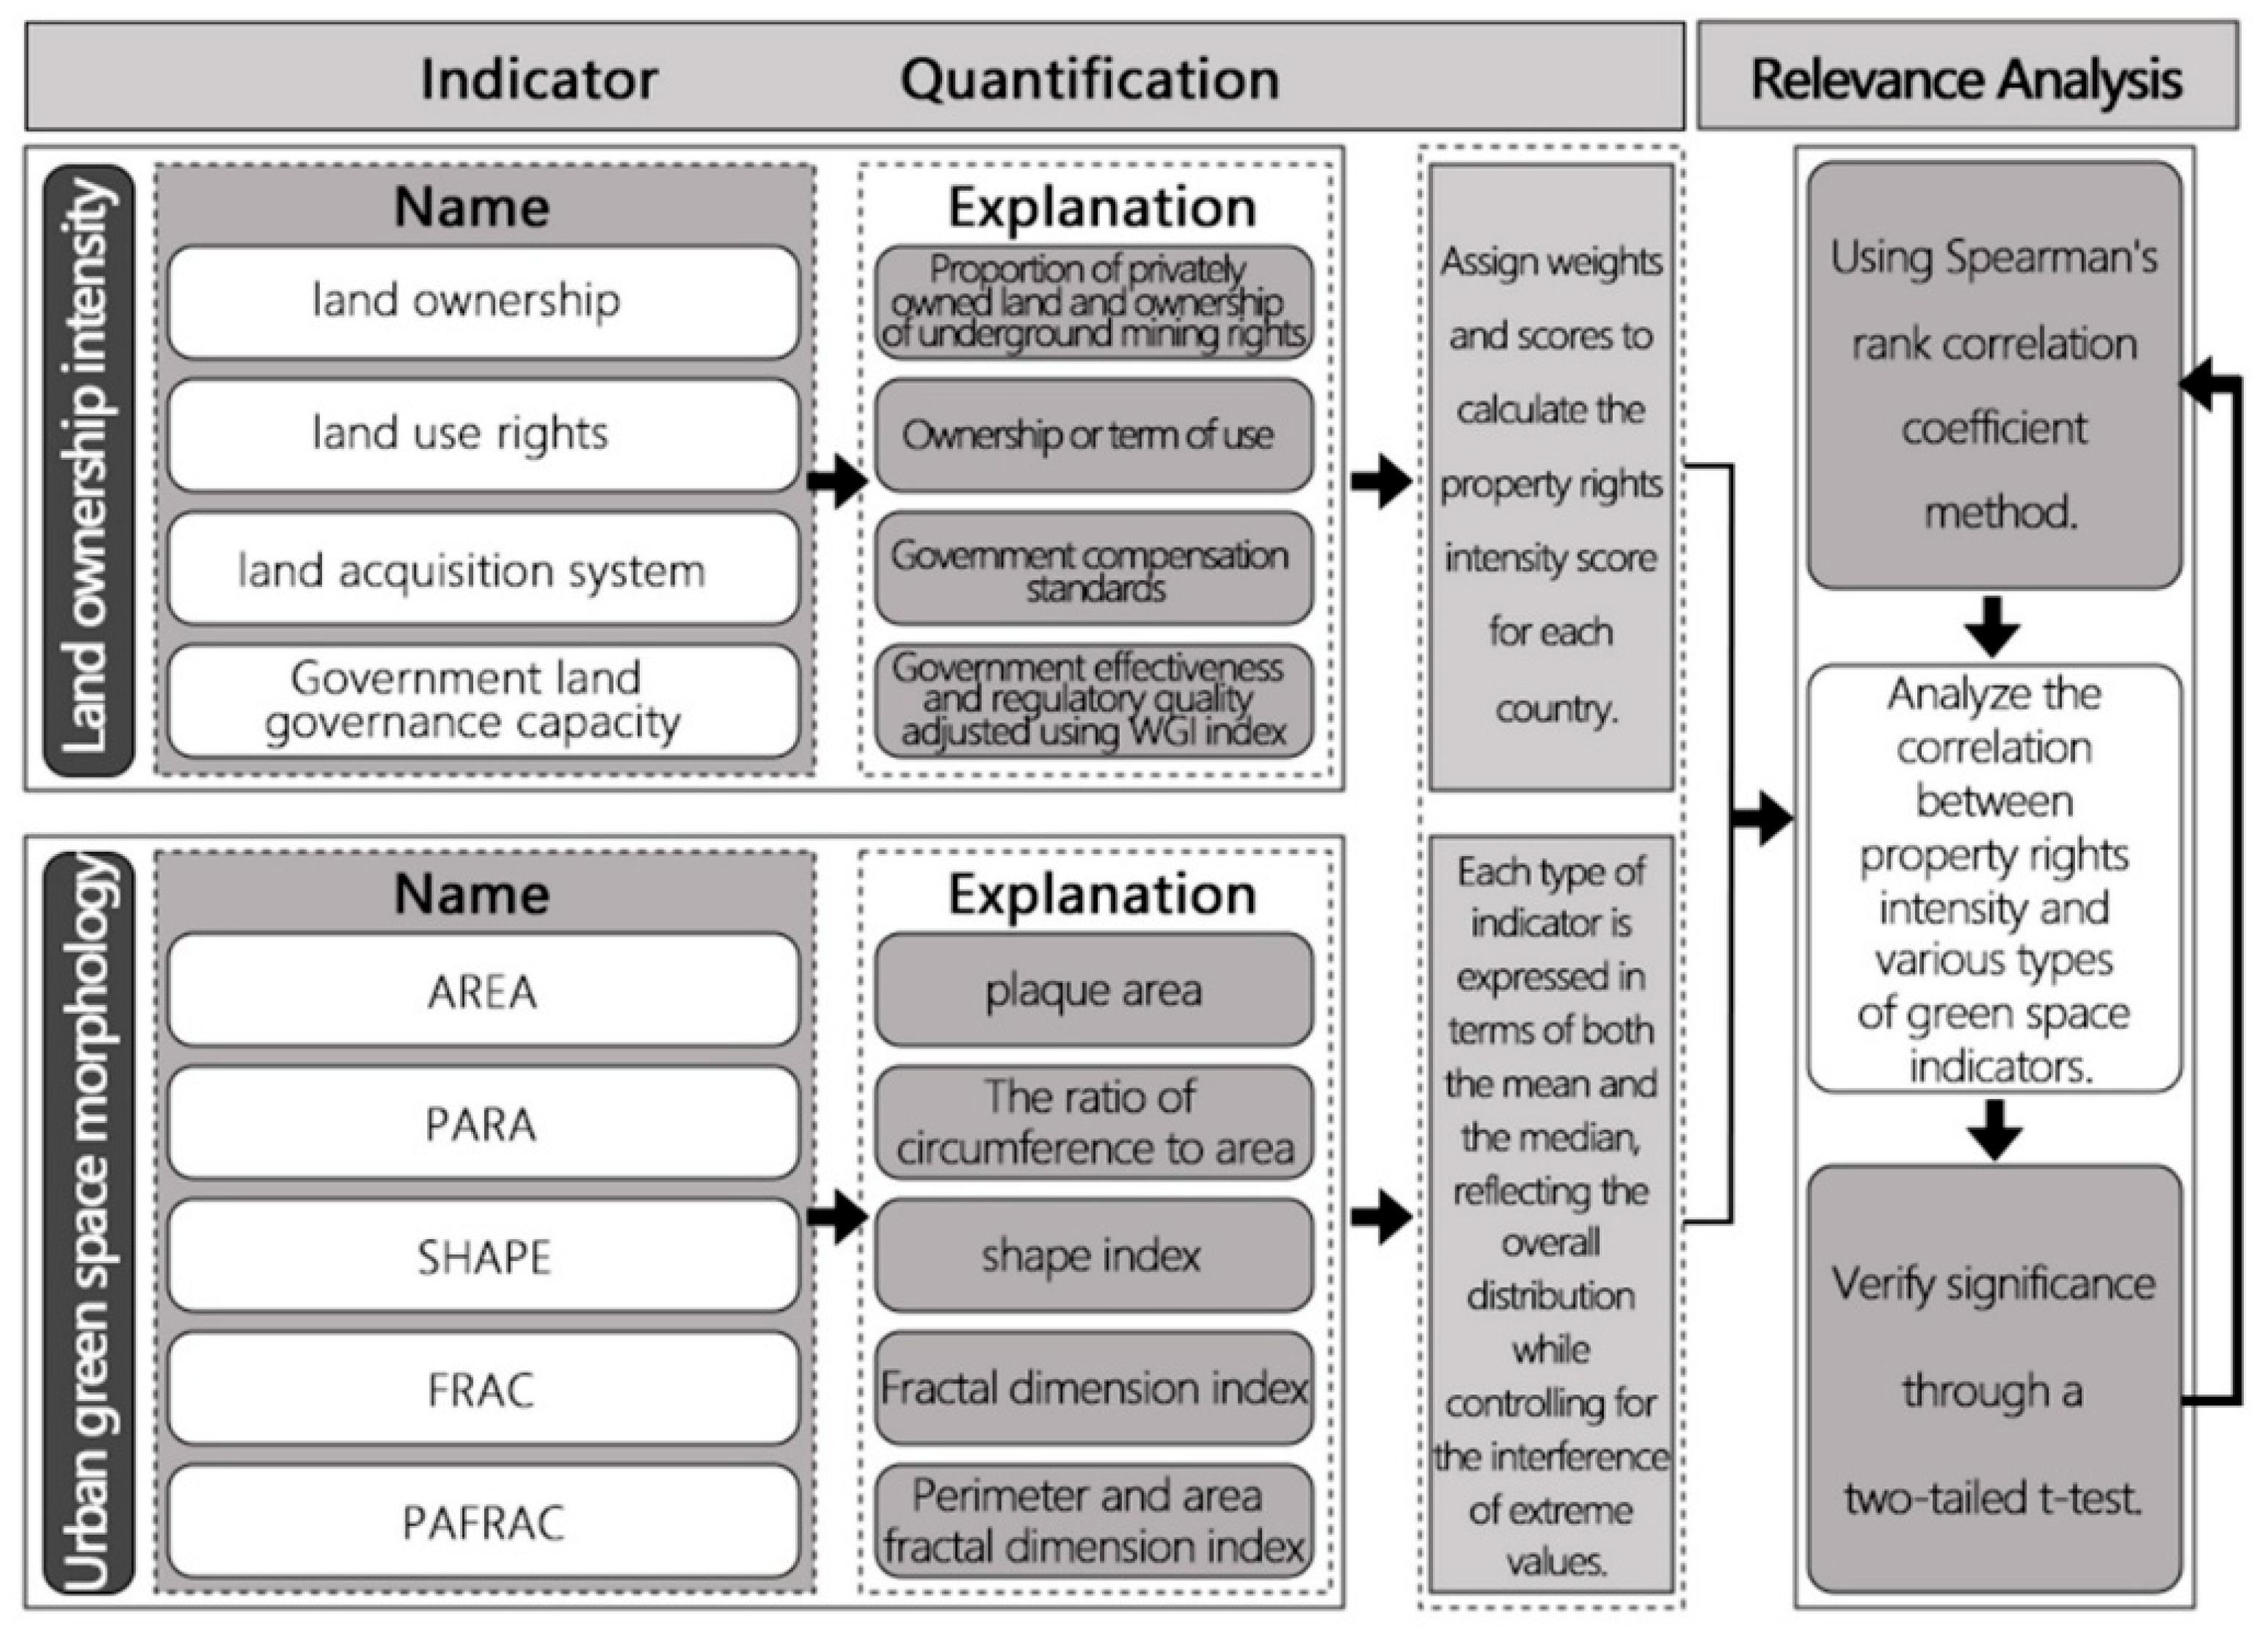
Figure 1. Technology roadmap. This figure outlines how different factors related to land ownership and urban green space morphology are quantified and analyzed for their correlation using statistical methods.
Land 14 02140 g001
Figure 2. Location of the study area. This map illustrates the global distribution of key cities and highlights their respective geographic locations, potentially serving as a reference for studies related to urban planning, environmental factors, or green space distribution.
Land 14 02140 g002
Figure 3. Division of the study area.
Land 14 02140 g003
Figure 4. Data processing flowchart.
Land 14 02140 g004
Figure 5. Heatmap analysis of the correlation matrix. The values in each cell of the matrix range from −1 to 1, indicating the degree of correlation between two variables.
Land 14 02140 g005
Figure 6. The relationship between the strength of land ownership rights and urban green space morphology.
Land 14 02140 g006
Table 1. Data resources.
Data TypeData NameData SourceData Time
Urban green space
OpenStreetMap (OSM)
https://extract.bbbike.org/15–17 February 2020.
Property rights intensity
Worldwide Governance Indicators (WGI)
http://data.worldbank.org.cn/
Relevant laws and regulations currently in force in various countries, statistical data
Table 2. The range of values of |γs| and the degree of correlation.
Value Range of |γs|Degree of Relevance
0 ≤ |γs| < 0.3Weakly correlated
0.3 ≤ |γs| < 0.8In correlation
0.8 ≤ |γs| ≤ 1Strong correlation
Table 3. List of land ownership status and scores in the countries where the research samples are located.
Study Samples CountryThe Country’s Land PercentageOwnership of Underground Mineral Resources
State %ScoreStateRemarkScore
UK81%5Partially owned by the owner of the land.Gold, silver, and energy mines are excluded.3
USA60%3Wholly belongs to the owner of the land.-5
Germany80%5Partially owned by the owner of the land.Except for a few non-important minerals such as soil, sand, and stone.
All other mineral deposits are owned by the state.
4
Japan59%3Completely state-owned-1
China0%1Completely state-owned-1
India70%4Completely state-ownedThe federal government is decentralized, with state and local governments.2
France96%5Completely state-owned-1
Brazil70%4Completely state-owned-1
Russia8%1Completely state-owned-1
The weighting coefficients were established via Delphi consultation with five domain experts; future studies may verify these weights using the AHP.
Table 4. List of land ownership deadlines and scores in the countries where the research samples are located.
Study Samples CountryTerm of Land Ownership
StateRemarkScore
UKThere is no limit to the duration of ownershipLand belongs to the British Crown; tenure is permanently owned5
USAThere is no limit to the duration of ownershipPerpetual ownership5
GermanyThere is a long limit on tenure timeThe right to use can be bought and sold for 50–99 years4
JapanThere is no limit to the duration of ownershipPerpetual ownership5
ChinaThere is a short limitation on tenure timeOnly the right to use, depending on the nature of the land, for a period of 30–70 years2
IndiaThere is no limit to the duration of ownershipPerpetual ownership5
FranceThere is no limit to the duration of ownershipPerpetual ownership5
BrazilThere is no limit to the duration of ownershipPerpetual ownership5
RussiaThere is a long limit on tenure timeThere is very little private land, leased by the state3
Table 5. The status of the land acquisition systems in the countries where the research samples are located, and the list of scores.
Study Samples
Country
Land Expropriation System
StateRemarkScore
UKActual market valueBased on the price of the expropriated land in the public market, the land price related conversion of the land shall not be compensated in principle3
USAThe value of the proceeds from future land useThe benefits obtained by the expropriator from the expropriation or the losses of the expropriated person shall prevail5
GermanyActual market valueWhen the expropriation plan is decided by the Expropriation Bureau, the market value of the expropriated land shall prevail3
JapanActual market valueThe market transaction price of the land adjacent to the expropriated land or similar land is used as the basis for the calculation3
ChinaThe value of the proceeds from the current land useThe total amount shall not exceed 30 times the average annual output value of the expropriated land for three years1
IndiaActual market value130% of the current market value of the expropriated land4
FranceActual market valueThe market value of the land around the expropriated land one year before the final award date shall prevail2
BrazilActual market valueThe average market price of the land around the expropriated land within 5 years shall prevail3
RussiaActual market valueBased on the principle of equivalent compensation, it is determined according to the market price that the land can be expropriated according to the needs of the state2
Table 6. Summary of the two WGl for the countries where the study samples are located.
Study Samples
Country
Government Effectiveness
(%)
Regulatory Quality
(%)
The Sum of the Two Indicators
UK87.9896.15184.13
USA92.3192.31184.62
Germany93.2794.71187.98
Japan94.2387.98182.21
China69.7148.08117.79
India63.9446.63110.57
France91.8383.65175.48
Brazil36.0639.9075.96
Russia50.9631.7382.69
Table 7. Summary of adjustments to the two WGI for the countries in the study sample.
Study Samples
Country
Score for Private Land as a Percentage of Land in the CountryAdjustment FactorThe Sum of the Two IndicatorsAdjusted Sum
UK51.2184.13220.96
USA31.0184.62184.62
Germany51.2187.98225.58
Japan31.0182.21182.21
China10.8117.7994.23
India41.1110.57121.63
France51.2175.48210.58
Brazil41.175.9683.56
Russia10.882.6966.15
After calculation using Formula 6, the results are summarized in this table.
Table 8. List of government land governance capacity scores for the countries in the study sample.
Study Samples CountryRanking of Government Land Governance CapacityRemarkScore
UK2-5
USA4-4
Germany1-5
Japan5-3
China7-2
India6-3
France3-4
Brazil8-2
Russia9-1
Table 9. Strength of property rights means (MN) and Spearman’s correlation coefficient test results.
Property StrengthThe Average Area of the Present BlockMean Shape IndexFractal Dimensional Exponential MeanMean Perimeter-to-Area RatioFractal Dimension of Perimeter area
RAREA MNSHAPE MNFRAC MNPARA MNPAFRA-C
Property rightsCorrelation1−0.05−0.20−0.36−0.10−0.19
Coefficient r-
StrengthSaliency P 0.86490.20750.00940778178941633 *0.30910.1103
(two-tailed)
Case number363636363636
* Correlation is significant at the 0.05 level (two-tailed).
Table 10. Strength of property rights medians (MD) and Spearman’s correlation coefficient test results.
Property StrengthMedian Plaque AreaThe Median Shape IndexThe Median Fractal Dimension ExponentPerimeter Area
RAREA MDSHAPE MDFRAC MDPARA MD
Property rightsCorrelation10.04−0.27−0.38−0.10
StrengthCoefficient r-
Saliency P 0.48870.10930.00715991164330228 *0.2732
(two-tailed)
Case number3636363636
* Correlation is significant at the 0.05 level (two-tailed).
Disclaimer/Publisher’s Note: The statements, opinions and data contained in all publications are solely those of the individual author(s) and contributor(s) and not of MDPI and/or the editor(s). MDPI and/or the editor(s) disclaim responsibility for any injury to people or property resulting from any ideas, methods, instructions or products referred to in the content.