Article

Diffuse Reflectance Spectroscopy for Mapping Soil Carbon Stock in the Gilbués Desertification Region at Brazilian Cerrado

by
Julio César Galdino de Sousa
1,
Yuri Jacques Agra Bezerra da Silva
1,
Vanessa Martins
2,
Sueli Rodrigues
1,
Marcos Paulo Rodrigues Teixeira
1,
Paulo Henrique Dalto
1,
Laércio Vieira de Melo Wanderley Neves
1,
Antonio Rafael Sánchez-Rodríguez
3 and
Ronny Sobreira Barbosa
1,*
1
Campus Professora Cinobelina Elvas, Universidade Federal do Piauí, Km 01, Rua Manoel Gracindo, Planalto Horizonte, Bom Jesus 64900-000, Piauí, Brazil
2
Colégio Técnico de Bom Jesus, Universidade Federal do Piauí, Km 01, Rua Manoel Gracindo, Planalto Horizonte, Bom Jesus 64900-000, Piauí, Brazil
3
Departamento de Agronomía, Campus Universitario de Rabanales, Universidad de Córdoba, Ctra. Madrid-Cadiz, Km 396, 14071 Córdoba, Spain
*
Author to whom correspondence should be addressed.
Land 2023, 12(9), 1812; https://doi.org/10.3390/land12091812
Submission received: 15 August 2023 / Revised: 8 September 2023 / Accepted: 17 September 2023 / Published: 20 September 2023

Abstract

:
The carbon stock (C Stock) is a key soil attribute, especially in areas under degradation. The objective of this study was to map the C Stock and other physical and chemical attributes on the soil surface of a micro-watershed located in the Gilbués Desertification Nucleus and to calibrate pedometric functions to map them, applying spectra obtained by Diffuse Reflectance Spectroscopy (DRS) in the near-infrared (NIR) region. This study was developed in the Piripiri Stream Micro-watershed (PSMW), which presents different levels of degradation. A total of 214 composite soil samples were collected from the 0–0.10 m depth layer. Spectral and laboratory analyses were performed following traditional methods. The results from 100 samples were subjected to descriptive analysis, pedometric modeling, and geostatistics, while the remainder were used exclusively for the prediction and modeling of the predicted attribute maps. C Stock ranged from 0.3 to 11%, with the highest values associated with the least sandy sites. We assert that stakeholders, including government agencies, could utilize DRS for mapping main soil attributes, such as C Stocks, soil granulometry, or total organic carbon, in regions characterized by similar parent material and soil properties. This application can support informed decision-making regarding land management in extensive areas facing soil threats.

1. Introduction

Northeastern Brazil is known worldwide for its great productive potential and the implementation of large-scale agricultural projects involving crops such as soybeans, corn, and cotton, as well as beef cattle [1,2]. The state of Piauí, Brazil, which is one of the units of the Brazilian Federation in this territory, besides being known for excelling in food production, also stands out for harboring the largest area of desertification in the country (6200 km2), known as the Gilbués Desertification Nucleus [2]. Within this desertification nucleus, there are clear signs of intense processes of accelerated water erosion, which have led to the need to investigate the factors contributing to this desertification, as well as strategies to facilitate its monitoring.
Previous studies have addressed different aspects of desertification in the region. Lopes and Soares [3] examined changes in soil properties affected by desertification in Gilbués. Costa and collaborators [4] investigated the impacts of agroforestry systems on soil conservation, agricultural productivity, and local socioeconomic well-being. France and collaborators [5] used satellite imagery to analyze vegetation dynamics and identify areas susceptible to desertification. Valladares and collaborators [6] characterized and classified the soils of Gilbués, exploring their relationship with degradation processes. However, these were focal studies that reflected demands for studies that can be extrapolated to larger areas.
Land degradation processes represent a global threat that has negative impacts on ecosystem functioning and the ability to provide ecosystem services such as nutrient cycling, water retention, and habitat provision [7,8]. In addition, soil degradation also directly influences biogeochemical cycles, most notably the carbon cycle. During the degradation process, the reduction of soil organic matter occurs, which results in the release of carbon dioxide (CO2) into the atmosphere, intensifying the greenhouse effect [9].
Considering that soil is the main carbon sink in terrestrial ecosystems, storing approximately three times more carbon than forests [10] and almost twice as much as is stored in the atmosphere [11,12], assessing the effects of degradation caused by accelerated water erosion can contribute to understanding soil carbon stocks (C Stock).
An alternative for this assessment is the simultaneous analysis of total soil organic carbon content (TOC), total nitrogen content (TN), nitrogen stock (N Stock), pH, and soil granulometry. The accurate quantification of these attributes is relevant to understanding soil carbon dynamics and sequestration capacity. TN and soil pH also play an essential role in this context, influencing microbial activity and organic matter decomposition, as mentioned by Bunemann and collaborators [13].
Soil particle size and density (BD) have a direct influence on porosity, aeration, water infiltration, and nutrient availability. These attributes are fundamental to the stability of soil aggregates and the preservation of C Stock, as highlighted by Milne et al. [14]. Given the importance of these factors, the assessment and mapping of soil C Stock in the Gilbués Desertification Nucleus have become essential tools in understanding degradation processes.
The mapping and modeling of soil characteristics play a vital role in mitigating soil degradation by providing a deeper understanding of the processes and factors that influence its properties [15,16]. The assessment of soil C Stock through mapping is essential to support decisions related to land use change, providing valuable information for appropriate decision-making [17]. Furthermore, Nijbroek et al. [18] recommended TOC as an essential parameter to counteract soil degradation.
However, the estimation of soil C Stock based on traditional chemical analysis is a laborious and costly process, as mentioned by McDowell et al. [19] and Demattê et al. [20]. Faced with the need to obtain faster, more efficient, and cost-effective estimates of these stocks, innovative methodologies have emerged, such as pedometrics, which allow for the prediction of a wide range of soil attributes at regional and global scales [21,22].
In this context, Diffuse Reflectance Spectroscopy (DRS) is a low-cost alternative for the application of pedometrics [23], in which the near-infrared (NIR) region has stood out as one of the most used for this purpose [22,24]. However, the use of this technique demands complex data analysis, aiming to associate spectral behavior with the soil attribute content [25].
In the literature, there are various options for pedometrics modeling to use the DRS for predicting soil attributes. They are usually presented as machine learning, where adopts algorithms based on models such as multiple linear regression (MLR), principal component regression (PCR), random forest (RF), artificial neural network (ANN), support vector machine regression (SVMR) and partial least square regression (PLSR) [26,27]. Each model has its own particularities, and the pedometrician is free to choose the best one at their own convenience. Through those models, it is possible to enable a deeper understanding of soil properties. This approach may contribute to C Stock prediction, as well as to facilitate the assessment of soil degradation and the effectiveness of management practices.
In view of the above, obtaining accurate soil carbon content data on a large scale can facilitate the mapping of degradation and the assessment of the effectiveness of management practices. Therefore, the use of DRS represents a promising advance in the estimation for soil C Stock mapping, contributing to the sustainable management of these areas.
Bearing in mind the potential of DRS in the NIR region as a cost-effective means of soil attribute assessment, the main aim of this study was to map soil C Stock and other physical and chemical attributes within a micro-watershed located in the Gilbués Desertification Nucleus (large area under degradation, 319 km2), Piauí (Brazil), and to calibrate pedometric functions to map them. We hypothesize that the algorithms employed in our models will efficiently predict a wide range of soil attributes, including C Stock, using spatial variables as inputs. To achieve the aim of the study and to test the hypothesis, we collected 214 composite soil samples (0–0.10 m), 100 that were analyzed in the laboratory and used for pedometric modeling, and the rest for prediction, by combining DRS and PLSR.

2. Materials and Methods

2.1. Study Area

This study was carried out in the Piripiri Stream Micro-watershed (PSMW) in the Gurguéia river basin, inserted in the Gilbués Desertification Nucleus in the state of Piauí, Brazil. The PSMW has an area of 319 km2 and is located in the domains of the municipality of Monte Alegre, which belongs to the micro-region of the upper middle Gurguéia, located in the south of the state of Piaui, northeastern Brazil (Figure 1). The study site is located in an ecotone zone between Caatinga and Cerrado, with a predominance of specimens belonging to Campo Cerrado and Cerrado Strictu Sensu [5,28].
The local relief is characterized by strong irregularities, with the presence of flat areas with horizontal structures known as “chapadões”, with an average altitude of 481 m above sea level, in addition to features strongly eroded by concentrated runoff processes [3]. As for the climate, a transition from semiarid to dry subhumid is observed, with an average annual rainfall regime classified as equatorial and continental, ranging between 800 and 1200 mm per year [28,29,30]. In this region, two well-defined periods occur: a rainy period, which covers the months of November to April, and a dry period, which occurs from May to October. Average annual temperatures range from 25 to 35 °C [29].
The PSMW is in an area of lithological transition between the Parnaíba and São Francisco provinces, with more than 70% represented by the Parnaíba province, where sediments of the Paleozoic era of marine, coastal, and continental origin stand out, deposited in almost horizontal layers. These are distributed in the Piauí, Pedra de Fogo, and Sambaíba Formations, belonging to the Balsas Group, in addition to the Poti Formation, which belongs to the Canindé Group [30]. The São Francisco Province occurs in Mesozoic terrains distributed between the Areado and Urucuia Formations belonging to the Balsas Group [29]. Throughout the PSMW, there is a dominance of sedimentary rocks, especially siltstones, sandstones, claystones, shales, pelite, and conglomerates, as they present lithologies with characteristics extremely vulnerable to erosion [31].
The five orders of soils predominant in the area are Acrisols (Argissolos/Ultisols), Ferralsols (Latossolos/Oxisols), Luvisols (Luvissolos/Alfisols), Leptosols (Neossolos/Entisols), and Planosols (Planossolos/Alfisols), according to the World Reference Base for Soil Resources [32], Brazilian Soil Classification System—SiBCS [33], and soil taxonomy [34] (Figure 1).
Acrisols predominate in the southwestern portion of the MPBR in the domains of the Areado Formation, occurring mainly in dissected areas and gentle and undulating reliefs where the intensity of erosive processes is quite pronounced [29]. Ferrasols are distributed throughout the PSMW, with a predominance on the plateaus or high plateaus [35].
Luvisols, the most abundant in the PSMW, generally have their occurrence associated with source material rich in mafic minerals [36], while Leptosols are found in areas of lower topography near water bodies, settled in the Piauí Formation [37]. Planosols are the least occurring soil order in the PSMW, and their presence in tropical semiarid conditions is associated with source material with a predominance of felsic minerals [38].

2.2. Soil Sampling and Laboratory Analysis

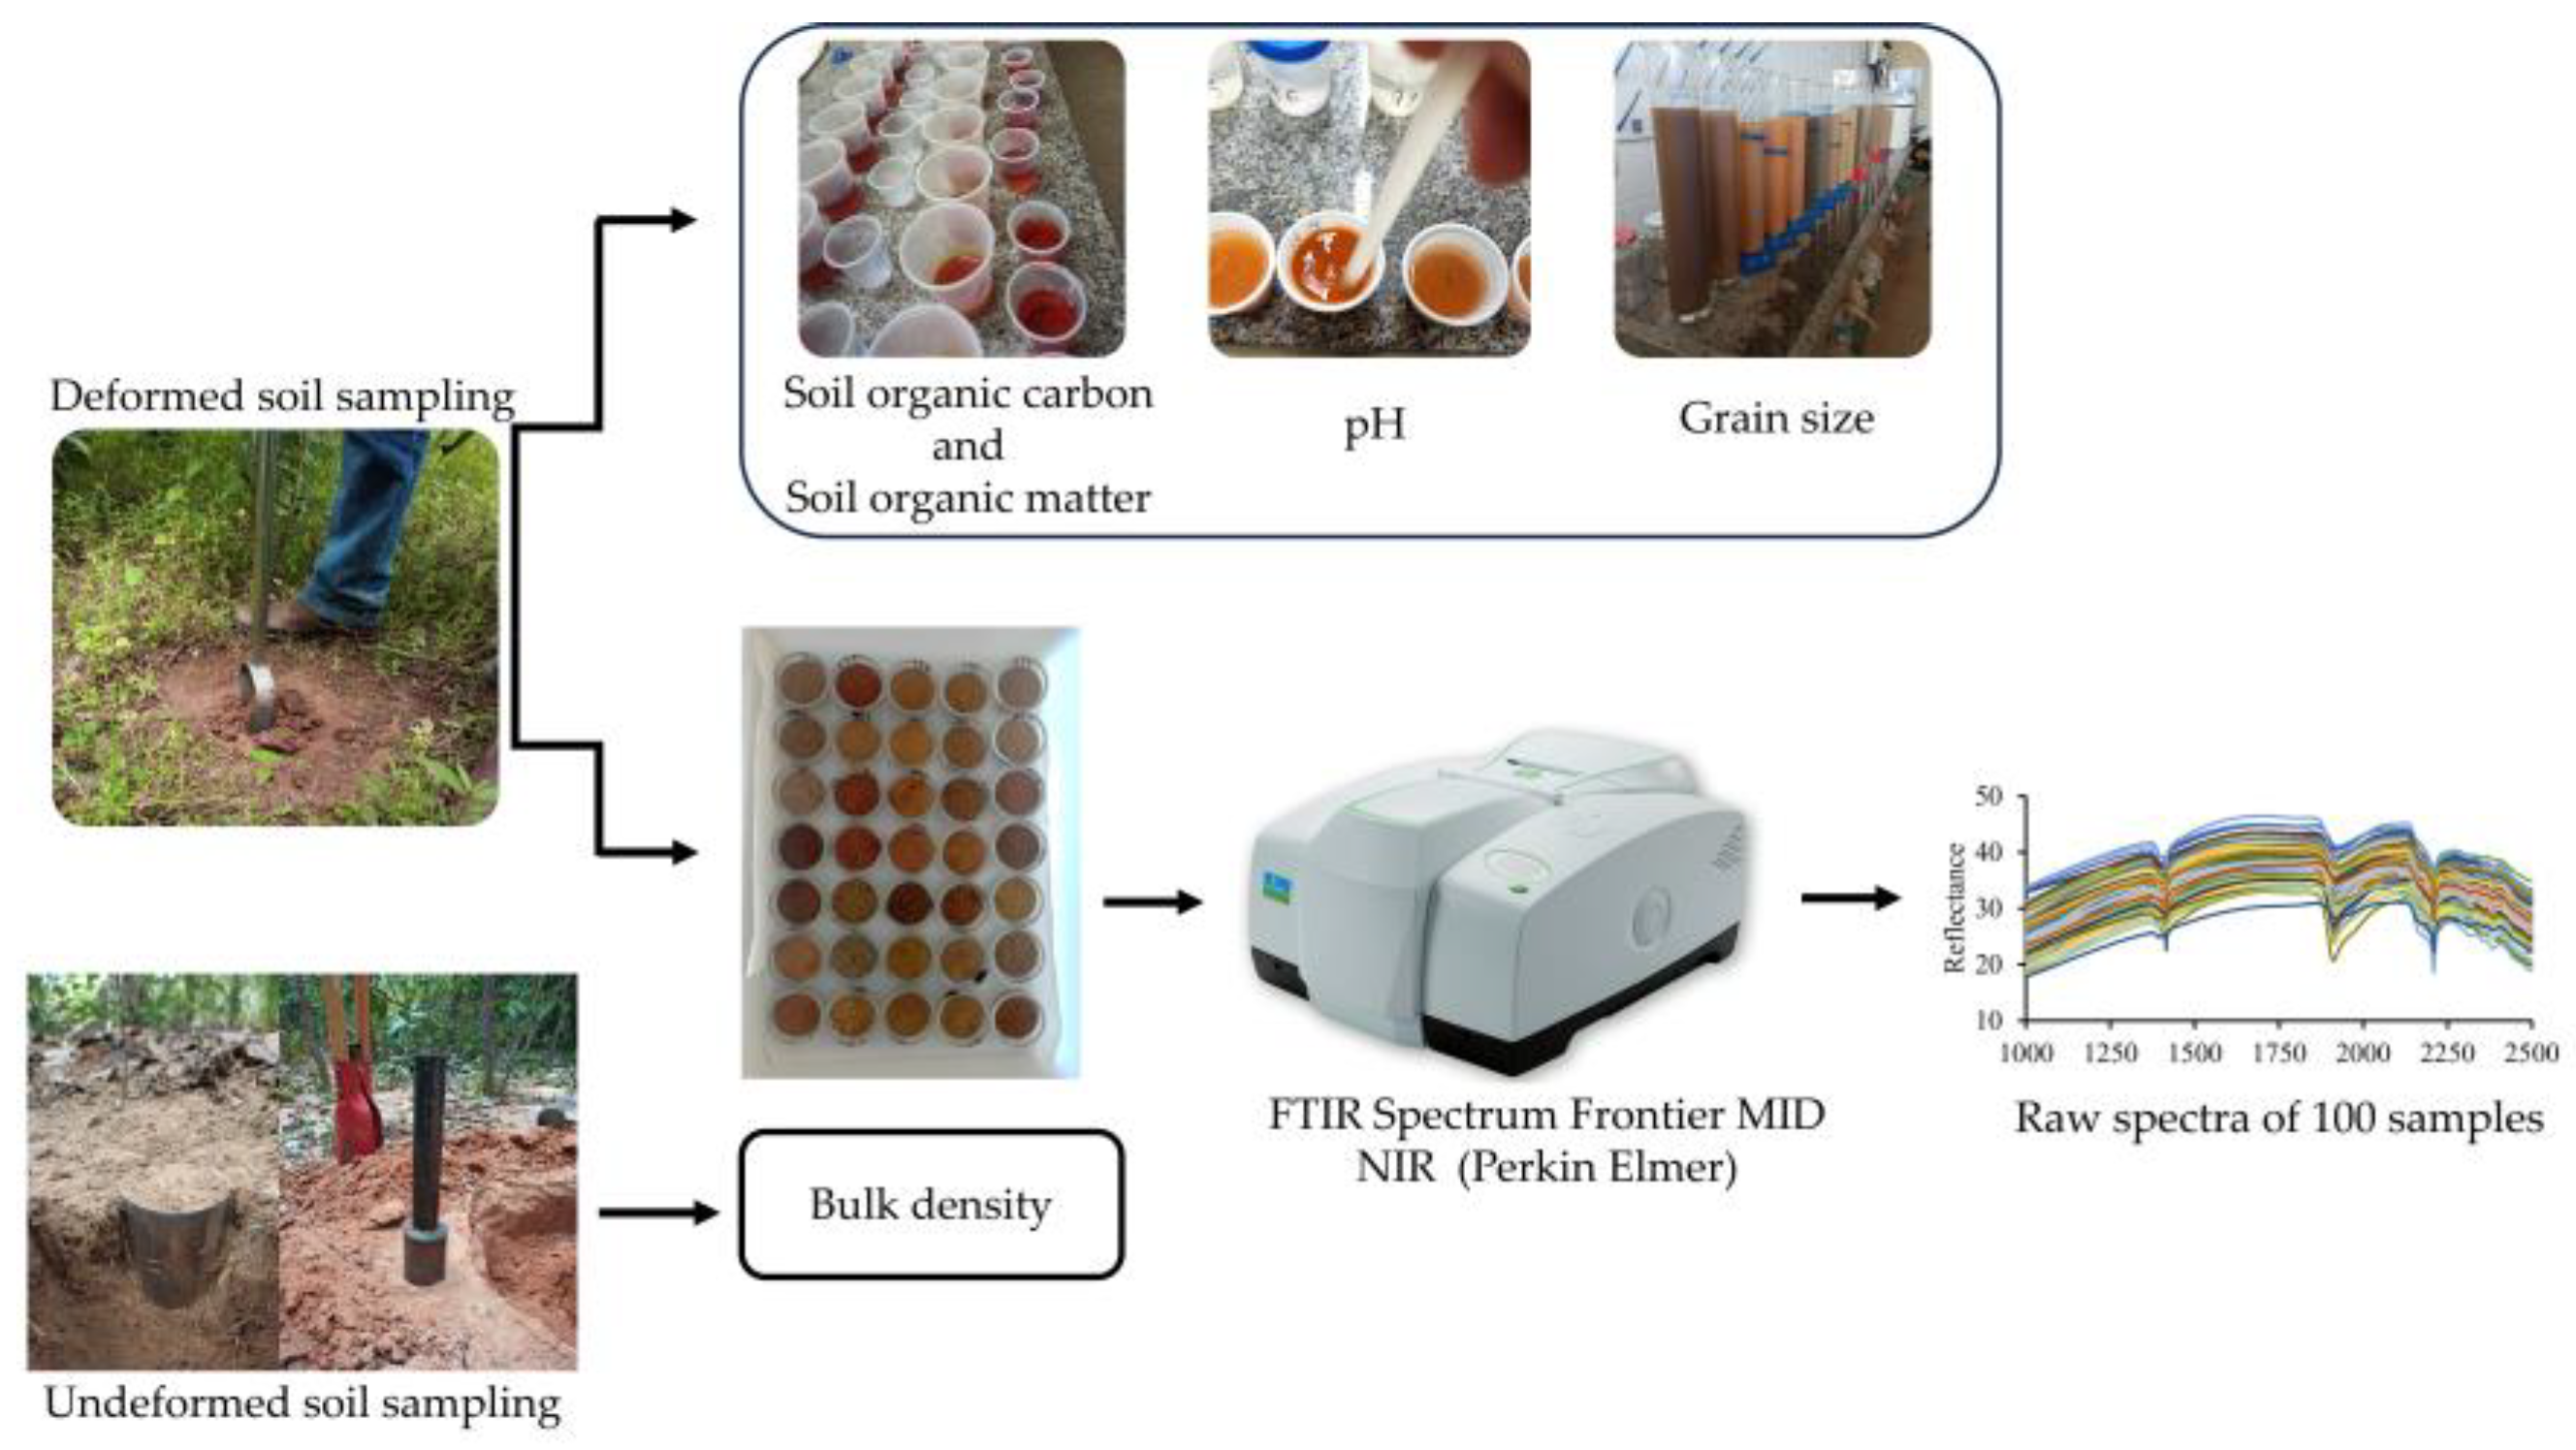
A total of 214 composite soil samples were collected using a stainless steel Dutch auger (deformed samples). Each composite sample consisted of eight single samples taken from the 0 to 0.10 m depth layer around each sampling site. The center point of each site was georeferenced. The location of the sampling points was determined randomly while still considering a minimum distance of 500 m between points, accessibility, and representativeness of all landscape physiognomies (Figure 1). In Figure 2, examples are presented of the soil sampling procedure (deformed and undeformed), as well as photos of the laboratory analysis performed in this study.
The 214 samples were air-dried, homogenized, and passed through a 2 mm sieve. Then, they were randomly separated into two groups, called the modeling group (MG) and the prediction group (PG). The MG was composed of 100 samples, while the PG was composed of 114. Despite there being no specific rule in the literature to proceed with this splitting, the homogeneity of the sampling point distribution and its soil class representativity along the studied perimeter were considered for each group. That evaluation was performed visually, considering the information provided in Figure 1. The laboratory analyses were performed exclusively on the samples that composed the MG. These analyses included C Stock, N Stock, TOC, TN, particle size (sand, silt, and clay), and pH in the laboratory (Figure 2).
The grain size composition was determined with the pipette method, using 0.1 mol L−1 sodium hydroxide as a dispersant for the determination of soil texture [39]. The pH was determined at soil:water ratio 1:2.5 (v/w) in distilled water [39]. TOC was obtained by the modified Walkley–Black method [40], and TN was determined by the Kjeldahl method [40]. Samples were taken to obtain the BD by the volumetric ring method [41].
With the TOC, TN, and BD data, the C Stock and N Stock were calculated through the following Equation (1) [42]:
C   Stock   or   N   Stock   Mg ha 1 = ( TOC   or   TN × BD × e ) / 10
where C Stock/N Stock are carbon and nitrogen stocks (Mg ha−1), TOC/TN are soil organic carbon and total nitrogen (g kg−1), BD is bulk density (g cm3), and e is soil thickness of the soil layer, which was 0.10 m in this study.

2.3. Spectral Measurements

Reflectance data were obtained on 214 samples using a Fourier transform infrared spectrometer (FTIR Spectrum Frontier MID NIR—Perkin Elmer) with a near-infrared (NIR) wavelength of 1000–2500 nm. Samples were packed in Petri dishes and dried in an oven at 45 °C for 24 h before readings.
The readout resolution was 2 cm−1 with 32 scans per sample and a sample interval of 0.5 nanometers. Four readings were taken per sample with 90° angle rotations to ensure the representativeness of the analyzed surface [43,44]. Thus, the spectrum value of each sample is the product of the average of four readings. After every ten scans, the equipment was calibrated using white spectralon with 100% reflectance (LABSPHERE, NORTH SUTTON, NH, USA: L124-1634).
The spectral data were subjected to spectral pre-processing techniques. First, the transformation of reflectance spectra into absorbance was performed using the R to Log (1/R) approach [45]. Then, the multiplicative scatter correction (MSC) [46] was applied to minimize unwanted effects. In addition, standard normal distribution with wavelet detrending (SNV with Wavelet detrending) [47] was used as part of the pre-processing. To further improve the results, the Savitzky–Golay first derivative [48] was also applied.

2.4. Statistics and Pedometrics Modeling

The MG was used for descriptive statistical analysis, pedometric modeling to obtain prediction models, as well as for geostatistical analysis and mapping of the studied attributes. The PG, in turn, was employed for the prediction of the attributes of interest through DRS, in addition to geostatistical analysis and mapping, aiming to obtain the maps of the attributes predicted by DRS.
Descriptive statistical analysis was conducted to identify the minimum, average (Av), maximum, and standard deviation (SD) values. Descriptive statistics were calculated using Minitab® 21.1.1 software [49]. For pedometric modeling, the MG was subdivided into subgroups, the calibration and external validation subgroups, composed of 70 and 30 samples, respectively. The calibration of the prediction models was performed by regression analysis, Partial Least Squares Regression (PLSR), using the leave-one-out cross-validation method.
Once reliable models were found, they were subjected to external validation by comparing observed values with predicted values. External validation was performed by the Bagging-PLSR technique, which consists of randomly extracting data with the replacement of a training set [45]. After this process, the data were applied to the PG in order to obtain the DRS predicted values in these 114 samples. The entire process of pre-processing of NIR spectra, as well as pedometrics modeling (calibration, validation, and prediction), were carried out using Parles® software, version 3 [45].
The accuracy of the models was assessed by the adjusted coefficient of determination (R2adj), root mean squared error (RMSE), and residual deviation of the prediction Ratio of Performance to Deviation (RPD), which is the standard deviation of the original data divided by the RMSE of the validation. The prediction performance of the model was based on RPD values using the classification from [50], where RPD > 2 indicates that it has good predictions, RPD between 1.4 and 2 indicates reliable predictions, and RPD < 1.4 indicates that it has unreliable predictions.

2.5. Geostatistical Modeling

Geostatistical modeling was performed following the recommendations of [51]. The semivariograms were fitted to theoretical models, whose best fitting performance was based on obtaining lower RMSE values and higher R2 values. For this purpose, the spherical, exponential, and Gaussian models were considered. After adjusting the semivariograms, the Spatial Dependence Degree (SDD) was observed by the ratio between the nugget effect (C0) and the plateau (C0 + C).
SDD was classified according to the criteria proposed by [52], where strong spatial dependence < 25%, 25% < moderate > 75%, and weak > 75%. Ordinary kriging was used to spatially interpolate the data. Geostatistical analysis was performed with GS+™ v.7 Build 17 software (Gamma Design Software, LLC, Plainwell, MI, USA) in combination with Surfer v. 9.11.947 Copyright© 1993–2010 (Golden Software, LLC, Golden, CO, USA).

3. Results

3.1. Descriptive Analysis

Soil properties at PSMW showed a high variation, highlighting the granulometric fractions (sand, silt, and clay) with the highest standard deviations, followed by C Stock and TOC content, as shown in Table 1. A wide range of variation in the proportions of particle size fractions was observed: sand ranged from 4 to 96%, silt ranged from 2 to 60%, and clay ranged from 1 to 38%.
Notably, the sand fraction predominated in the region, especially in areas with higher occurrence of Ferralsols, Luvisols, and Leptosols, as illustrated in Figure 1. C Stock and nitrogen showed variations from 0.3 to 11% and from 0.004 to 0.13%, respectively. In addition, TOC content ranged from 0.4 to 15%, while nitrogen content ranged from 0.004 to 0.13%. The highest concentrations of C Stock and TOC were observed in areas predominantly composed of Acrisols and Leptosols.
BD is a measure of the amount of mass present in a given volume of soil. At PSMW, BD values ranged from 1.05 to 1.80 g cm−3, as indicated in Table 1. Soils with sand, sandy loam, and sandy loam textures were found to have the highest density values. This means that these soils have a higher compaction, which can have several implications for their management and quality.
At PSMW, pH values ranged from 4.59 to 6.63, as presented in Table 1. This range of values indicates a slightly acidic to acidic soil reaction. Soils classified as Leptosols, Luvisols, and Ferralsols showed the lowest pH values, indicating that they are the most acidic soils in the region. The mean granulometric fraction content in the PSMW soils was in the followed order: sand (77%) > silt (13%) > clay (10%).
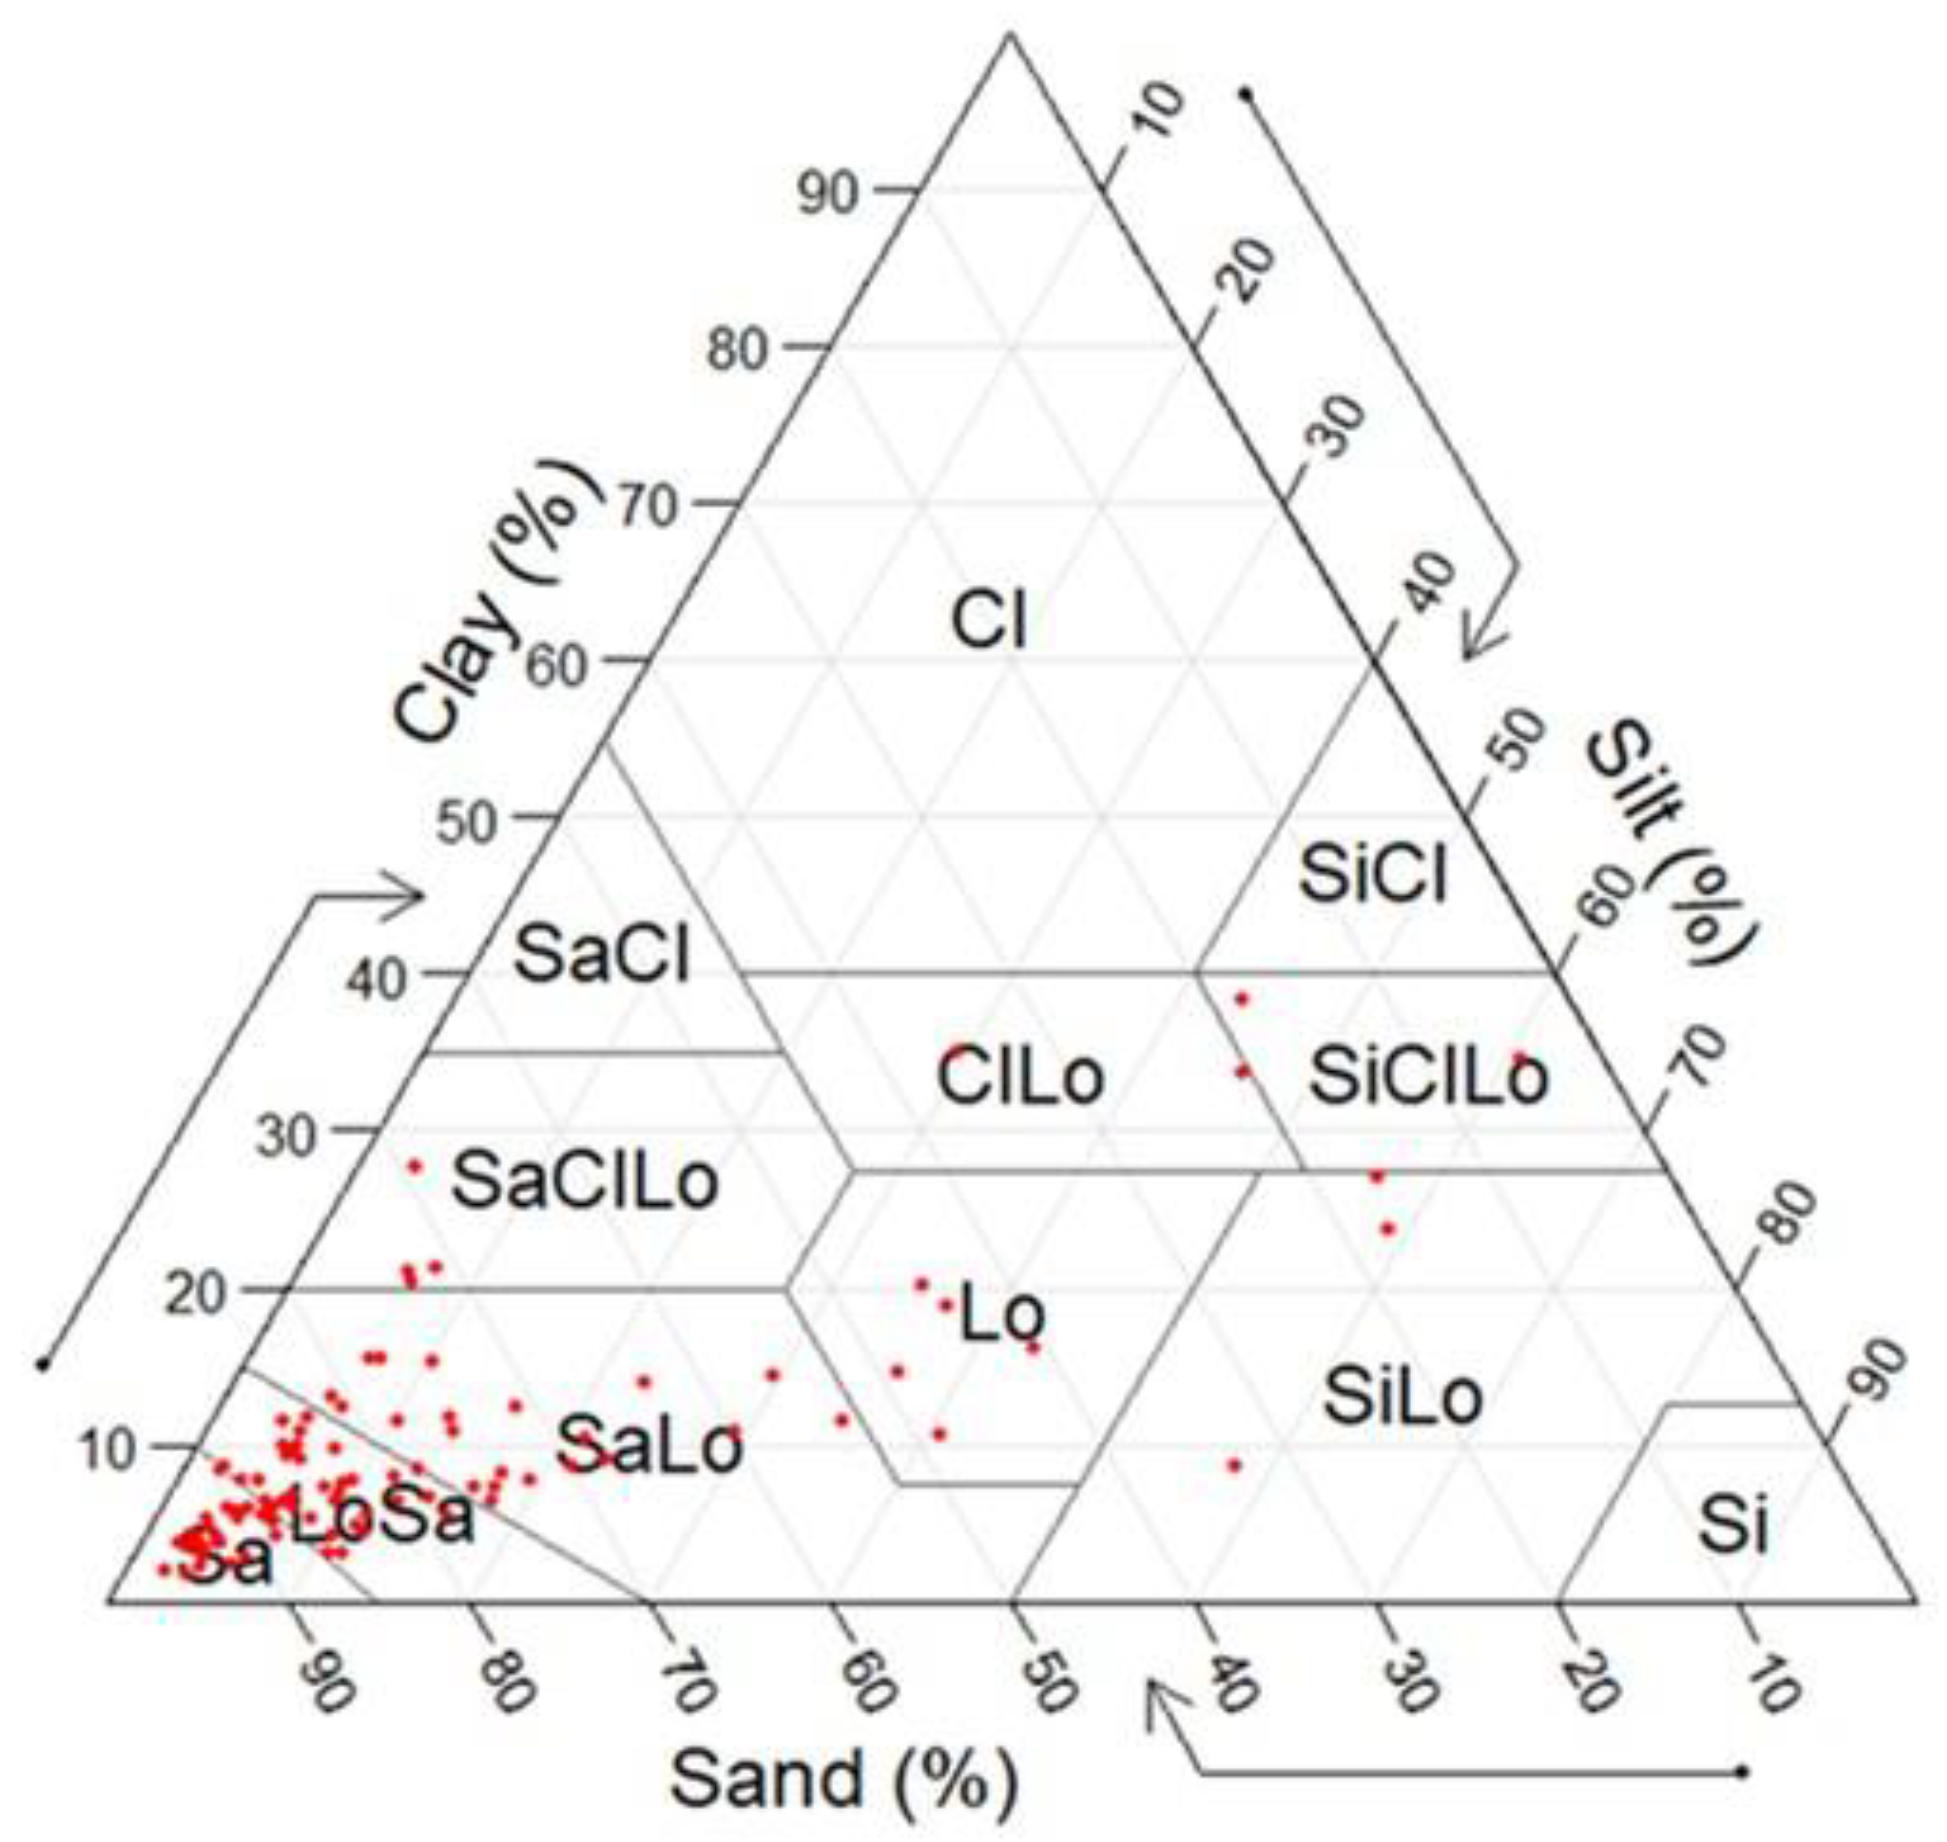
This granulometric composition results in textural classes with a predominance of sand, sandy loam, sand loam, and loam, as illustrated in Figure 3. This information is relevant for understanding the physical characteristics of the soil, such as its water and nutrient retention capacity. Considering the average density of the soils studied in the PSMW, it can be stated that they present typical characteristics of sandy soils, which generally have a lower water retention capacity and lower natural fertility.

3.2. Spectral Characteristics and Prediction Models

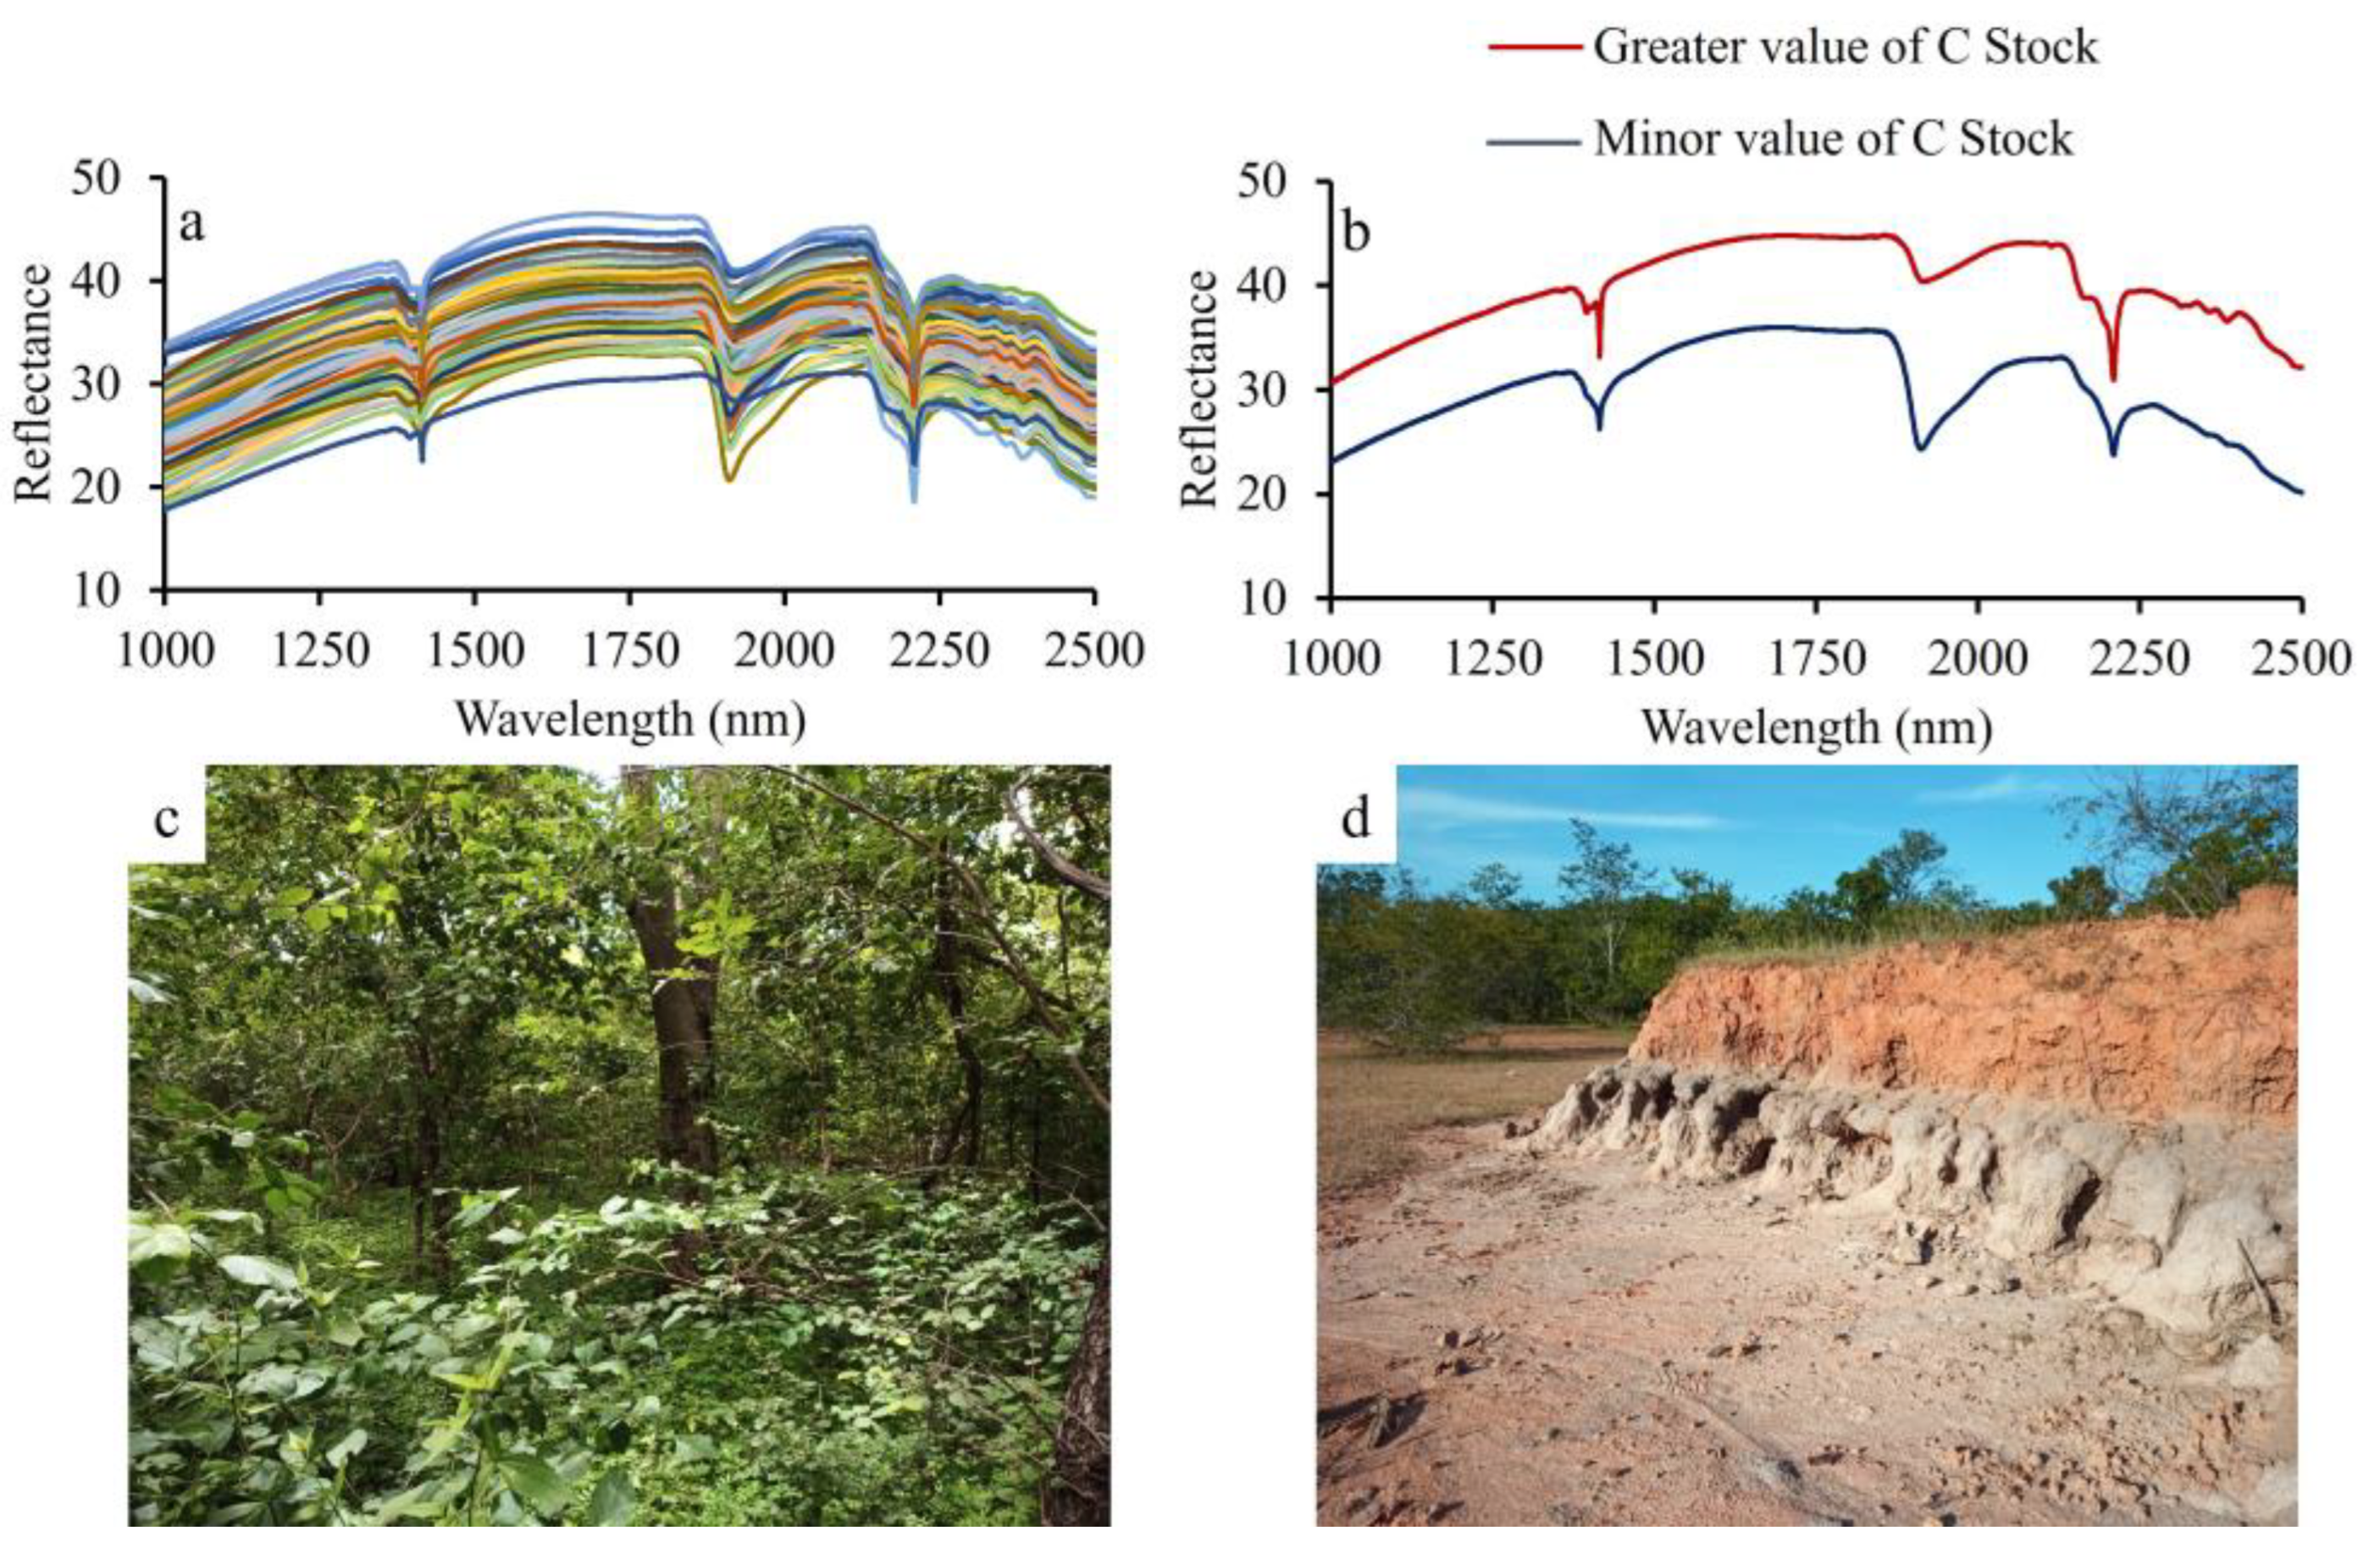
Figure 4a shows the results of the spectra for MG. The reflectance spectra of the soil samples showed similar behaviors, which means that they share light absorption and reflection patterns influenced by soil properties such as C Stock, clay, and sand contents. It was observed that soils with higher C Stock, clay, and lower sand contents showed higher reflectance with less expressions of spectral vales, as illustrated in Figure 4b.
On the other hand, soils with lower C Stock, clay, and higher sand contents showed lower reflectance, however, with significant expression of spectral vales. In addition, when comparing the reflectance intensity between the different soil classes, it was found that Leptosols, Luvisols, and Ferralsols showed higher reflectance than Acrisols and Planosols. This indicates that these soil classes have distinct spectral properties, reflecting more light compared to the other classes mentioned.
The reflectance spectra of the soils studied also showed specific characteristics, such as well-established absorption features at wavelengths of 1400, 1900, and 2200 nm. These absorption features can be indicative of certain soil properties or the presence of specific components, providing valuable information for the characterization of the soils studied.
In summary, this result describes the spectral characteristics of the PSMW soils, highlighting the influence of soil properties on the behaviors of the reflectance spectra and showing differences in reflectance intensity between soil classes. Absorption features at the mentioned wavelengths are also highlighted as distinctive elements in the spectra of the analyzed soils.
The results of the pedometric parameters, which are used to predict soil properties, are presented in Table 2. In general, sand and clay fractions showed more significant prediction values (evaluated by R2adj, RMSE, and RPD indices) during data cross-validation. Next, the C Stock, silt, and TOC properties also had considerable prediction values.
When performing the external validation of the models (evaluated by R2adj and RMSE indices), the distribution of the highest prediction values occurred in the following order: clay > sand > C Stock > silt > TOC (Table 2). The prediction models for C Stock, TOC, sand, silt, and clay demonstrated calibration fits that are considered reliable for predicting these soil properties.
This means that the models were well fitted to the data during the calibration process and showed a good predictive ability of the soil properties. On the other hand, the attributes N Stock, TN, BD, and pH did not have accurate prediction models, indicated by the low RPD values. This suggests that these models were not able to accurately predict the soil properties corresponding to these attributes.
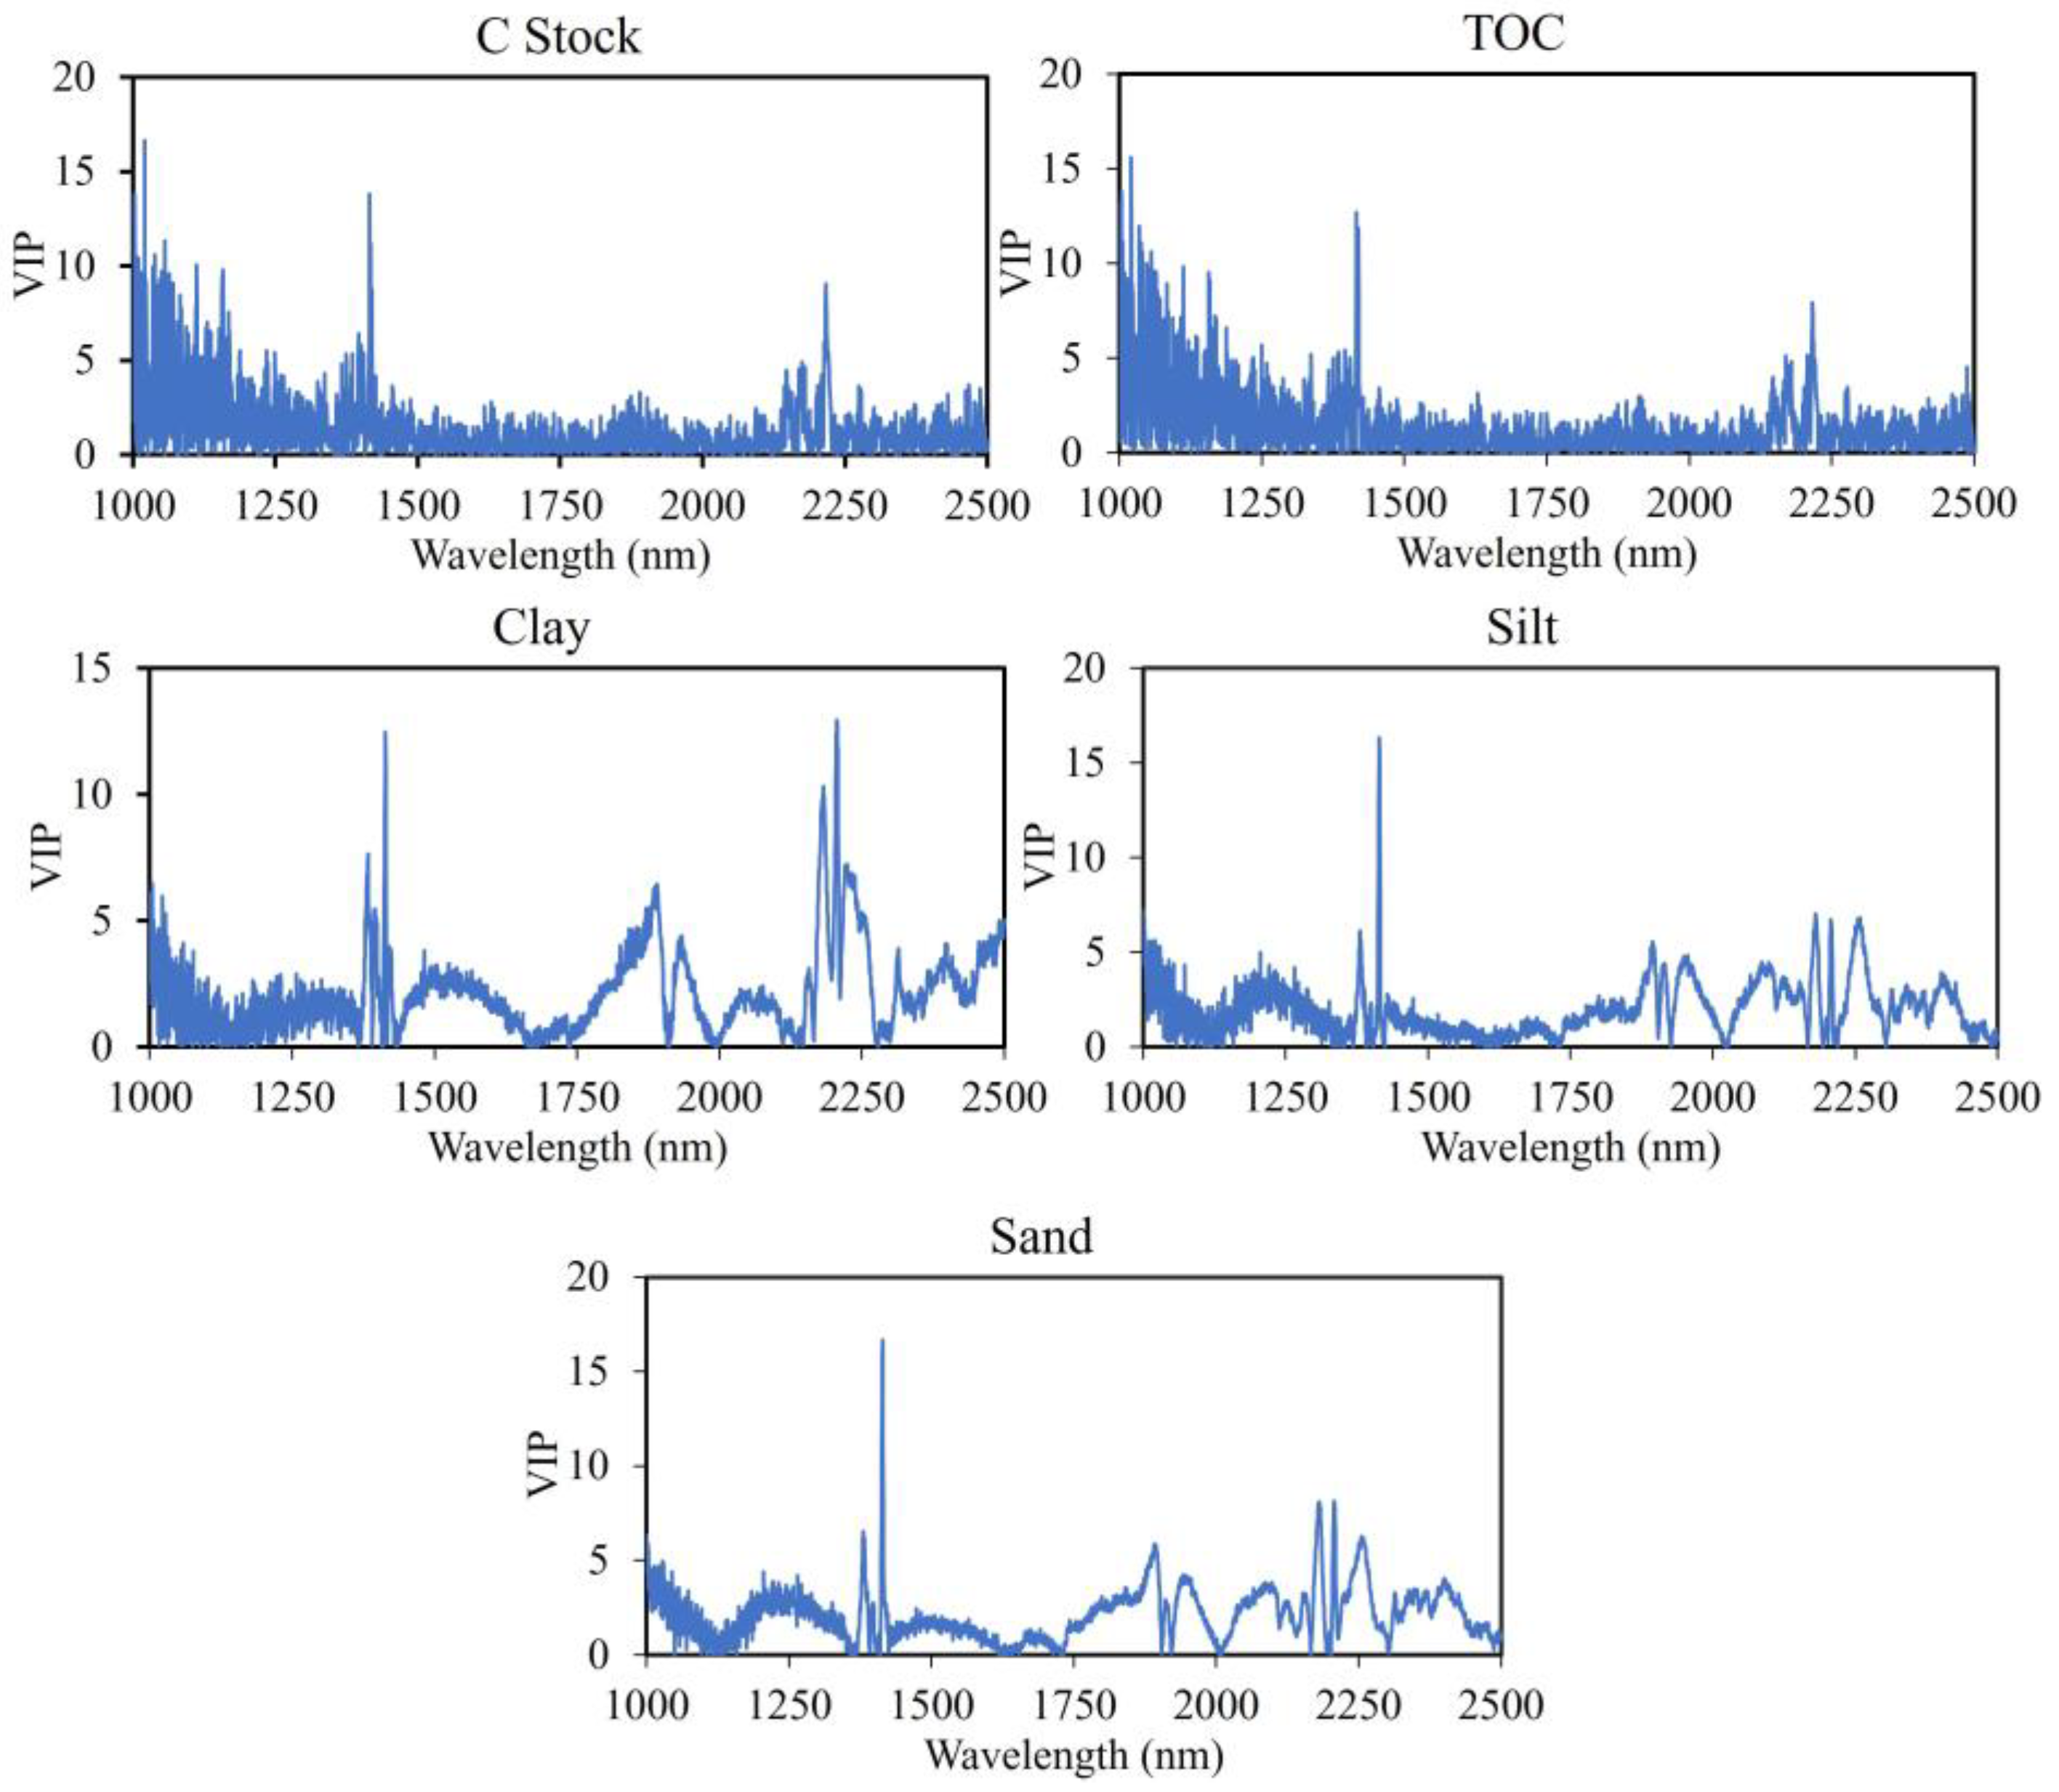
To reinforce the estimates of the MG soil properties, Variable Importance in Projection—VIP plots—were plotted (Figure 5) to identify the most important wavelengths for the prediction of sand, silt, and clay content, as well as C Stock and TOC. The VIP values for C Stock and TOC were similar, with prominent peaks around 1000, 1400, and 2200 nm, with the highest VIP values in the 1021 nm range. Sand and silt had the highest VIP values in the 1414.5 nm range, and clay had its highest value in the 2206 nm range.

3.3. Spatial Variability of Chemical Properties and Granulometric Fractions

The parameter values of the spatial statistics of MG and PG are organized in Table 3. For most of the soil properties, the models that best fit the variability of the data were the exponential for PG and the spherical for MG, making it possible to observe a moderate degree of spatial dependence for MG and strong for PG. When comparing the two datasets, it can be seen that the range for most soil properties of the MG had higher values, with the exception of sand and silt. Both MG and PG attributes had a coefficient of determination (R2) greater than 0.7. The geostatistical results for the external validation of the PG attributes had R2 values greater than 0.9 and a RMSE close to zero, as illustrated in Table 4.
Ordinary kriging, used to map soil properties, can be seen in Figure 6, where the spatial distribution for MG and PG soil properties is presented. There was similarity in the maps produced, attesting to the efficiency of the technique for the prediction of the evaluated attributes. It was found that for both MG and PG, the highest values of C Stock and TOC were concentrated in the region of predominance of Acrisols, which is in the southwestern part of the study area. In the northwestern and southeastern part, where Leptosols predominate, there was also a concentration of C Stock and TOC in lowland areas.
Regarding the granulometric fractions, there was a predominance of the sand fraction in almost all of the PSMW (Figure 6). The highest sand contents were found mainly in Leptosols, Luvisols, and Ferralsols. In turn, silt and clay had their highest concentrations in the Acrisols region in the southwestern most part of the PSMW. It is possible to identify a relationship between granulometry and C Stock and TOC, and in areas with high sand content, the lowest values for the latter were verified. When the same properties were related to the clay contents, it was observed that the higher the values for clay, the higher the C Stock and TOC contents.

4. Discussion

4.1. Pedogenesis

The variability of grain size in the soils studied is a result of differences in the degree of weathering between the different soil orders present in the PSMW. It is important to highlight that the samples collected come from soils formed by different materials of origin and are located in different positions of the landscape, which results in varied pedogenetic processes. In addition, these soils are also affected by human action, as observed in previous studies performed by Oliveira and collaborators [53] on soils of the Brazilian semiarid. Silva et al. [54], when evaluating the texture of Brazilian tropical soils, related the granulometric variability to the size of the study area, which influences the factors and processes of soil formation.
Another important fact to be highlighted is that the areas with the highest levels of degradation were identified in the most southwestern part of the PSMW, where Acrisols predominate. It is possible that the collection (0–0.10 m) contemplated material from subsurface horizons with a greater accumulation of clay, such as the “B textural” horizons of Acrisols [29]. The values found for TOC and TN, as well as for C Stock and N Stock, are related to the different levels of degradation present in the study area. The C and N contents decrease with the local erosive processes; however, the agricultural activities developed in the PSMW may have provided different agricultural inputs and plant material to the soil, justifying the high amplitude in the values [1].
In a recent study performed by Gomes et al. [55], the C Stock mapping in Brazilian soils showed that the low concentrations of this attribute found in the Brazilian semiarid region were associated with extreme climatic conditions, which favor strong soil losses by erosion in the rainy season and lower contributions of organic matter by small vegetation. However, the mean TOC value presented in this study (48.12 g kg−1) was higher than the mean value estimated for the state of Piauí by the survey of the spectral library of Brazilian soils [20]. These variations in mean values are attributed to the differences found between the soil orders of the study area [56,57], vegetation density [58], and topography [59].
These results draw attention to the impacts on soil carbon storage capacity, especially with land use change [60]. Considering the soil reaction, PSMW soils were classified as strongly acidic according to the classification recommended by Raij and Quaggio [61], being common in the region due to the source material developed from base-poor rocks, as reported by Mendes et al. [62]. Thus, this information can be useful, contributing to the construction of the spectral library for soils in Piauí.
BD is an important measure that reflects soil compaction and physical quality, and is influenced by factors such as poor management, heavy machinery traffic, and intensive land use. High BD values may indicate a condition of soil degradation, compromising porosity and water holding capacity. A study conducted by Souza et al. [63] on cerrado soils in Brazil investigated the effects of soil degradation on BD. The results showed that degraded areas had significantly higher BD values compared to preserved areas.
The authors concluded that compaction due to degradation negatively affected soil structure and physical quality, resulting in high density values. Another relevant article of research is the study conducted by Blanco-Canqui and collaborators [64], who investigated the relationship between soil degradation and density. The results indicated that areas with a history of intensive management and inadequate soil management practices had higher BD values, evidencing the association between soil degradation and compaction.

4.2. Pedometrics

The shape of the soil spectral curve is largely affected by its composition, with emphasis on iron oxides, organic matter content, and soil texture [22]. Thus, the qualitative analysis of soil spectral signatures plays a crucial role in the identification and interpretation of bands in the near infrared (NIR) related to soil constituents. The upward slope in the 1000–2100 nm spectral region in soil spectra may be related to different processes associated with soil degradation in view of the relationship of this spectral region with the chemical, physical, and biological composition of the soil.
Stevens et al. [65] investigated the relationship between soil degradation and reflectance spectra in different areas. They observed that the upward slope in the 1000–2100 nm region can be attributed to the reduction of organic matter and the increased concentration of low-quality clay minerals in degraded soils. These changes in mineralogical composition and organic matter affect the interaction of electromagnetic radiation with the soil, resulting in the upward slope observed in the spectra. Chabrillat et al. [66] reiterated this theory by investigating the relationship between soil degradation and reflectance spectra in areas affected by mining.
In this research, the authors observed that soil degradation caused by mining can result in changes in soil properties, such as a decrease in organic matter and an increase in the concentration of clay minerals. On the other hand, the morphological features of the spectra assume an almost linear downward slope in the region between 2100 and 2500 nm. This spectral behavior is common in Brazilian soils [67,68]. They state that this characteristic is largely due to the presence of clay minerals.
The sample with higher C Stock and high presence of clay showed a lower amount of reflected energy when compared to the sample with lower C Stock and clay (Figure 4b). Soils with a more clayey texture and with the presence of organic matter absorb a greater share of light transmitted by Vis-NIR [68]. On the other hand, soils with a sandy texture containing low levels of iron oxides showed higher reflectance intensity compared to clayey soils [69,70]. The high reflectance for the samples with high sand content occurred due to the predominance of quartz in the sand fraction [20,71].
In the survey of the global spectral library to characterize the world’s soils, researchers stated that dark soils with high organic matter contents have low reflectance [72]. Demattê et al. [20] associated the low reflectance of soil samples from Brazil with the presence of iron oxides, opaque minerals, and TOC. In general, the spectra with higher and lower reflectance showed prominent absorption features around 1000, 1400, 1900, and 2200 nm (Figure 4).
In the near-infrared region, the main chemical elements interacting with electromagnetic radiation in soils were free water and hydroxyl (OH), usually being part of the soil solution or linked to the clay–mineral network that promotes greater moisture retention in the soil [73]; organic matter; carbonates [72,73,74]; and the presence of kaolinite and other phyllosilicates of common occurrence in the soils of the Brazilian semiarid region [67,75].
The technique using DRS combined with PLSR was efficient in predicting the particle size fractions for the TOC and C Stock of PSMW (Table 2). The granulometric attributes, such as sand and clay, showed predictive performance, this being due to the texture being a structural constituent of the soil, having well recognized absorption characteristics in the Vis-NIR and MIR regions [43]. Among the predicted attributes, TOC presented the lowest predictive capacity, which may be related to the dominant textural classes in the PSMW, which were sandy, sand loam, and sandy loam (Figure 5).
Soils with this texture have a higher marcroporosity and, consequently, a higher degree of degradation of organic matter by aerobic microorganisms [20]. On the other hand, sandy-textured soils provide a higher dispersion of spectra in the bands between 400 and 2500 nm, which results in a poorer TOC concentration prediction [76]. Another issue to be considered is the fact that TOC shows better predictive results in the mid-infrared (MIR) region due to its stronger direct relationship with MIR spectral data produced by fundamental vibrations [43]. Even in the face of these factors, the models generated for TOC and C Stock from this research were sufficient for their prediction and, subsequently, the mapping of these attributes in PSMW.
The low accuracy for the predictive models of TN and N Stock is probably due to the low concentrations of these attributes in the studied samples. The unsatisfactory predictive model for BD is related to the structural condition of the pore space, which makes it difficult to capture by NIRS and MIR spectra [20]. The low performance of the PLSR model for pH is associated with the low relationship between this attribute and the wavelengths in the spectral range between the visible (Vis) and NIR regions [73]. Wang and Wang [77], as well as Wan et al. [78], also found unsatisfactory predictions for soil pH in the Vis-NIR region by this method, lacking further research to improve this technique for other soil attributes.
The VIP plots (Figure 5) are considered indicators of the correlation between infrared frequencies and the soil constituents of interest, in this case, C Stock, TOC, sand, silt, and clay. In Figure 5, four wavelengths are identified (1000, 1400, 1900, and 2200 nm) that presented greater influence for the creation of the models of the evaluated attributes. The VIP expressions near 1000 are related to the soil color, especially the presence of soil organic matter, and iron oxides such as goethite and hematite [79]. The peaks in the 1400 and 1900 nm bands are associated with water adsorption and the presence of phyllosilicates, such as 2:1, 1:1, or interstratified minerals [67,80,81,82].
The VIP peak at 2200 nm may be associated with the presence of kaolinite and gibbsite, the likely cause being the OH bonds at 1400 nm [78]. Demattê and Terra [83] also agree that the peak near 1400 nm may be associated to kaolinites. This association is the reason why the higher VIP peak for clay was expressed at 1400 nm. This association was also observed by Gozukara et al. [84] and Hong et al. [85]. The expression near 1900 nm may be a result of the OH stretch combined with the Al–OH network because of the vibrations of water in the structure of phyllosilicates or absorbed on mineral surfaces [86]. This information explains the results of this research since the soils of the state of Piauí are rich in kaolinite and gibbsite; Mendes et al. [62] used the same narrative to explain the spectral behaviors found. It is important to highlight that kaolinitic and gibbsitic soils are predominant in tropical environments due to advanced weathering [86].

4.3. Spatial Variability of the Soil Properties

The spherical and exponential models are the most widely used in the adjustment of most attributes studied in soil science [87,88,89]. Thus, the SDD presented by MG in this study was associated with soil formation factors (climate, parent materials, and topography, as well as natural variations in soils, such as soil texture and soil classes) [90,91].
Moderate spatial dependence, on the other hand, was conditioned by a homogenization of soils, which resulted from the interaction between inherent soil characteristics and management with land use change [92,93,94]. Therefore, the SDD presented for the PG may be correlated to the levels of degradation present in the study area, as well as to land use.
The range values for the MG and PG datasets were high, showing a higher spatial autocorrelation and wider homogeneous scale and indicating that the estimated soil properties are influenced by natural factors over large distances [95,96,97]. The results presented in the cross-validation of the predicted data (Table 4) were considered excellent considering the criteria of [98]. According to [99], the smaller RMSE values can generate the kriging predictions of soil properties closer to the estimated values.
Thus, the semivariogram models proved to be reliable for the prediction of soil properties at unsampled sites, and for this reason, the produced isoline maps can be used for the assessment and monitoring of PSMW C Stocks. It is possible to observe a similarity in the distribution of the C content and physical and chemical properties evaluated in PSMW. There is a positive correlation between TOC, C Stock, and soil clay fraction, as well as a negative correlation between the same attributes and the sand fraction (Figure 6). Fernández-Martínez et al. [100] obtained similar results estimating texture and organic carbon by DRS.
Although the southwestern region of the watershed has the areas most affected by soil degradation, it also has well-preserved sites free of the erosive processes, justifying the high C values of TOC and C Stock in this region. It is also associated with high concentrations of clay and silt contents, which may be attributed to the shorter distance between particles, reducing carbon loss by oxidation, despite soil degradation. It is worth mentioning that this region is dominated by Acrisols and Luvisols, and in a study developed by [55], soils with 57% more C Stock were found in Ferralsol and Acrisol soils in Brazil.
This is due to these soils being less susceptible to degradation when compared to other soil orders because they are deep, well-drained, and, with higher concentrations of clay, well-structured, which facilitates aggregation and greater accumulation of C and N when well managed [101]. In northeastern Brazil [102], the highest C Stock content in Ferralsols and Acrisols was found.
According to Ribeiro and collaborators [103], the C dynamics in soils also depend on a set of factors and their interactions beyond the flora diversity. Hence, in this study, it is necessary to consider the addition of carbon from rainfall sediments loaded with organic, particulate, and solubilized compounds, which were deposited annually at these sites. The same does not occur in less degraded sites of the basin, however, without the influence of sediments of pluvial origin and because they have higher sand contents, which results in greater soil aeration, facilitating the loss of carbon by oxidation [104].
In fact, soils with sand fraction occurred in almost all of the PSMW, which is attributed to the dominance of poorly weathered soil classes and/or horizons of sandier texture in the surface layer since the samplings occurred from 0 to 0.10 m. This characteristic contributed to the low concentration of the C Stocks in the studied area, as was reported in similar conditions by [103], who stated that even in dense Caatinga, soils with high sand contents presented low concentrations for the C and N stocks at depth.
The models obtained need to be adjusted and extrapolated to other areas of the Gilbués Desertification Nucleus in order to ensure their applicability throughout this region. It is also important to develop new studies to improve the modeling of other pedotransfer functions, which can predict other attributes of relevance to the mitigation of the erosion process in the region. The information presented here can serve as a tool to assist territorial management, aiming at soil and water conservation in the Brazilian Cerrado region.

5. Conclusions

DRS is efficient in predicting particle size, C Stock, and total TOC in the Piripiri Stream Micro-watershed. Among the physical and chemical attributes used for prediction and mapping, the external validation of the models by the distribution of the highest prediction values occurred in the following order: clay > sand > C Stock > silt > TOC of the PSMW. The results showed that the percentage of C Stock is inversely proportional to the solid particle sizes of the 0–0.10 m layer of the studied soils, allowing for the prediction of these parameters for soil mapping by DRS.
The southwestern region of the Piripiri Stream Micro-watershed retains the highest C Stock, where the highest concentrations of clay and silt predominate, even in the face of greater degrees of degradation. These results suggest that in this portion of the watershed, accelerated water erosion was more intense, exposing on the surface of the studied soils the subsurface horizons (Bw) and being richer in particles < 0.002 mm. Clay-sized particles are more sensitive to the electromagnetic spectrum in the near-infrared range, especially at wavelengths at 1400, 1900, and 2200 nm.
With this, it is suggested that government agencies in the region apply the DRS to map these same attributes in other territories within the Gilbués Desertification Nucleus so that strategies to control the erosive process can be adopted. It is also suggested that further studies be conducted to improve these models for greater reproducibility of predictions.

Author Contributions

Conceptualization, J.C.G.d.S., Y.J.A.B.d.S. and R.S.B.; methodology, V.M., S.R. and R.S.B.; software, J.C.G.d.S., M.P.R.T. and P.H.D.; validation, R.S.B., S.R. and V.M.; formal analysis, J.C.G.d.S., M.P.R.T. and P.H.D.; investigation, J.C.G.d.S., A.R.S.-R. and R.S.B.; resources, A.R.S.-R. and R.S.B.; data curation, J.C.G.d.S. and R.S.B.; writing—original draft preparation, J.C.G.d.S., M.P.R.T. and P.H.D.; writing—review and editing, J.C.G.d.S., L.V.d.M.W.N. and A.R.S.-R.; visualization, L.V.d.M.W.N. and A.R.S.-R.; supervision, Y.J.A.B.d.S. and R.S.B.; project administration, R.S.B. All authors have read and agreed to the published version of the manuscript.

Funding

This research received no external funding.

Data Availability Statement

Data available upon reasonable request.

Acknowledgments

We thank the Federal University of Piauí/Campus Professora Cinobelina Elvas (UFPI/CPCE), the Agricultural Science Graduate Program (PPGCA), and the Coordination for the Improvement of Higher Education Personnel (CAPES) for providing the infrastructure and financial support for sampling and for soil analysis. We also thank the research group Pedology Applied to Environmental Sustainability for their support during this project. We also thank the Department of Agronomy of the University of Córdoba for the partnership and the support they provided from the Spanish State Research Agency through the Severo Ochoa and María de Maeztu Program for Centers and Units of Excellence in R&D (Ref. CEX2019-000968-M).

Conflicts of Interest

The authors declare no conflict of interest.

References

  1. Santos, D.P.; Marchão, R.L.; Barbosa, R.S.; Junior JPd, S.; Silva, E.M.; Nóbrega, J.C.A.; Niva, C.C.; Santos, G.G. Soil macrofauna associated with cover crops in an Oxisol from the southwest of Piauí state, Brazil. Arq. Inst. Biol. 2020, 87, 1–9. [Google Scholar] [CrossRef]
  2. Simplício, A.A.F.; Costa, C.A.G.; Navarro-Hevia, J.; Araújo, J.C. Erosion at hillslope and micro-basin scales in the Gilbués desertification region, Northeastern Brazil. Land Degrad. Dev. 2021, 32, 1487–1499. [Google Scholar] [CrossRef]
  3. de O-Lopes, L.S.; Soares, R.C. Desertification susceptibility of Gilbués (Piauí State) and Cabrobó (Pernambuco State) drylands, in Northeastern Brazil. Rev. Geogr. Am. Cent. 2016, 1, 307–323. [Google Scholar] [CrossRef]
  4. Costa, A.R.S.; Ferreira, G.L.; Souza, E.B.; Rolim Neto, F.C. Desertification in semi-arid northeast of Brazil. Rev. Geama 2016, 2, 427–445. [Google Scholar]
  5. França, C.J.L.; Piuzana, D.; Ross, L.S.J. Potential and emerging environmental fragility in desertification nucleus in the brazilian semi-arid (Gilbués, Piauí). Espacios 2017, 575, 1056–1065. [Google Scholar]
  6. Valladares, G.S.; Júnior, A.F.; da Aquino, C.M. Soils characterization in the desertification nucleus of Gilbués, Piauí, Brazil, and their relationship with degradation processes. Physis Terrae-Rev. Ibero-Afro-Am. Geogr. Física Ambiente 2020, 2, 115–135. [Google Scholar] [CrossRef]
  7. Lal, R. Climate Change and Soil Degradation Mitigation by Sustainable Management of Soils and Other Natural Resources. Agric. Res. 2012, 1, 199–212. [Google Scholar] [CrossRef]
  8. Intergovernmental Panel on Climate Change (IPCC). Aquecimento Global de 1.5 °C: Sumário para Formuladores de Políticas; IPCC: Geneva, Switzerland, 2023; p. 28. Available online: https://www.ipcc.ch/site/assets/uploads/2019/07/SPM-Portuguese-version.pdf (accessed on 10 January 2023).
  9. Tan, Z.; Leung, L.R.; Li, H.Y.; Tesfa, T.; Zhu, Q.; Huang, M. A substantial role of soil erosion in the land carbon sink and its future changes. Glob. Chang. Biol. 2020, 26, 2642–2655. [Google Scholar] [CrossRef] [PubMed]
  10. Sorenson, P.T.; Quideau, S.A.; Rivard, B. High resolution measurement of soil organic carbon and total nitrogen with laboratory imaging spectroscopy. Geoderma 2018, 315, 170–177. [Google Scholar] [CrossRef]
  11. Friedlingstein, P.; O’Sullivan, M.; Jones, M.W.; Andrew, R.M.; Gregor, L.; Hauck, J.; Le Quéré, C.; Luijkx, I.T.; Olsen, A.; Peters, G.P.; et al. Data used with permission of the Global Carbon Project under the Creative Commons Attribution 4.0 International license. Earth Syst. Sci. Data 2020, 12, 3269–3340. [Google Scholar] [CrossRef]
  12. Angelopoulou, T.; Tziolas, N.; Balafoutis, A.; Zalidis, G.; Bochtis, D. Remote sensing techniques for soil organic carbon estimation: A review. Remote Sens. 2019, 11, 676. [Google Scholar] [CrossRef]
  13. Bünemann, E.K.; Bongiorno, G.; Bai, Z.; Creamer, R.E.; de Deyn, G.; de Goede, R.; Fleskens, L.; Geissen, V.; Kuyper, T.W.; Mäder, P.; et al. Soil quality—A critical review. Soil Biol. Biochem. 2018, 120, 105–125. [Google Scholar] [CrossRef]
  14. Milne, E.; Banwart, S.A.; Noellemeyer, E.; Abson, D.J.; Ballabio, C.; Bampa, F.; Bationo, A.; Batjes, N.H.; Bernoux, M.; Bhattacharyya, T.; et al. Soil carbon, multiple benefits. Environ. Dev. 2015, 13, 33–38. [Google Scholar] [CrossRef]
  15. Villarino, S.H.; Studdert, G.A.; Baldassini, P.; Cendoya, M.G.; Ciuffoli, L.; Mastrángelo, M.; Piñeiro, G. Deforestation impacts on soil organic carbon stocks in the Semiarid Chaco Region, Argentina. Sci. Total Environ. 2017, 575, 1056–1065. [Google Scholar] [CrossRef] [PubMed]
  16. Bogunovic, I.; Pereira, P.; Brevik, E.C. Spatial distribution of soil chemical properties in an organic farm in Croatia. Sci. Total Environ. 2017, 584–585, 535–545. [Google Scholar] [CrossRef] [PubMed]
  17. Nabiollahi, K.; Shahlaee, S.; Zahedi, S. Land use and soil organic carbon stocks—Change detection over time using digital soil assessment: A case study from Kamyaran Region, Iran (1988–2018). Agronomy 2021, 11, 597. [Google Scholar] [CrossRef]
  18. Nijbroek, R.; Piikki, K.; Söderström, M.; Kempen, B.; Turner, K.; Hengari, S.; Mutua, J. Soil organic carbon baselines for land degradation neutrality: Map accuracy and cost tradeoffs with respect to complexity in Otjozondjupa, Namibia. Sustainability 2018, 10, 1610. [Google Scholar] [CrossRef]
  19. McDowell, M.L.; Bruland, G.L.; Deenik, J.L.; Grunwald, S.; Knox, N.M. Soil total carbon analysis in Hawaiian soils with visible, near-infrared and mid-infrared diffuse reflectance spectroscopy. Geoderma 2012, 189–190, 312–320. [Google Scholar] [CrossRef]
  20. Demattê, J.A.M.; Dotto, A.C.; Paiva, A.F.; Sato, M.V.; Dalmolin, R.S.; de Araújo, M.D.S.B.; da Silva, E.B.; Nanni, M.R.; ten Caten, A.; Noronha, N.C.; et al. The Brazilian Soil Spectral Library (BSSL): A general view, application and challenges. Geoderma 2019, 354, 113793. [Google Scholar] [CrossRef]
  21. Nawar, S.; Mouazen, A.M. On-line vis-NIR spectroscopy prediction of soil organic carbon using machine learning. Soil Tillage Res. 2019, 190, 120–127. [Google Scholar] [CrossRef]
  22. Moura-Bueno, J.M.; Dalmolin, R.S.D.; Horst-Heinen, T.Z.; Caten, A.T.; Vasques, G.M.; Dotto, A.C.; Grunwald, S. When does stratification of a subtropical soil spectral library improve predictions of soil organic carbon content? Sci. Total Environ. 2020, 737, 139895. [Google Scholar] [CrossRef] [PubMed]
  23. Viscarra Rossel, R.A.; Walvoort, D.J.J.; McBratney, A.B.; Janik, L.J.; Skjemstad, J.O. Visible, near infrared, mid infrared or combined diffuse reflectance spectroscopy for simultaneous assessment of various soil properties. Geoderma 2006, 131, 59–75. [Google Scholar] [CrossRef]
  24. Carvalho, J.K.; Moura-Bueno, J.M.; Ramon, R.; Almeida, T.F.; Naibo, G.; Martins, A.P.; Santos, S.L.; Gianello, C.; Tiecher, T. Combining different pre-processing and multivariate methods for prediction of soil organic matter by near infrared spectroscopy (NIRS) in Southern Brazil. Geoderma Reg. 2022, 29, e00530. [Google Scholar] [CrossRef]
  25. Conforti, M.; Buttafuoco, G. Insights into the Effects of Study Area Size and Soil Sampling Density in the Prediction of Soil Organic Carbon by Vis-NIR Diffuse Reflectance Spectroscopy in Two Forest Areas. Land 2023, 12, 44. [Google Scholar] [CrossRef]
  26. Farifteh, J.; van der Meer, F.; Atzberger, C.; Carranza, E.J.M. Quantitative Analysis of Salt-Affected Soil Reflectance Spectra: A Comparison of Two Adaptive Methods (PLSR and ANN). Remote Sens. Environ. 2007, 110, 59–78. [Google Scholar] [CrossRef]
  27. Silva, I.A.d.S. Environmental degradation in Gilbués-pi: Conceptual bases, geoenvironmental restrictions and impacts in the landscape. Rev. Equador 2013, 1, 14–29. [Google Scholar] [CrossRef]
  28. Macambira, D.M.; Gomes, J.M.A. Desertification in Gilbués—Piauí under the perspective of environmental history. Hist. Quest. Debates 2021, 69, 155–186. [Google Scholar] [CrossRef]
  29. de Silva, I.A.S. Clima e Arenização em Gilbués-Piauí: Dinâmica das Precipitações e a Vulnerabilidade da Paisagem aos Eventos Pluviais Intensos. Master’s Thesis, (Mestrado em Geografia)–Instituto de Estudos Socioambientais, Universidade Federal de Goiás, Goiânia, Brasil, 2014. [Google Scholar]
  30. Sales, M.C.L. Environmental degradation in Gilbués, Piauí. Mercat.-Rev. Geog. UFC 2003, 2, 115–134. [Google Scholar]
  31. de Aguiar, R.B.; Gomes, J.R.d.C. Project Registration of Groundwater Supply Sources State of Piauí Diagnosis of the Municipality of Monte Alegre do Piauí; CPRM: Brisbane, Australia, 2004. [Google Scholar]
  32. IUSS Working Group WRB. World Reference Base for Soil Resources. International Soil Classification System for Naming Soils and Creating Legends for Soil Maps, 4th ed.; International Union of Soil Sciences (IUSS): Vienna, Austria, 2022. [Google Scholar]
  33. dos Santos, H.G.; Jacomine, P.K.T.; dos Anjos, L.H.C.; de Oliveira, V.A.; Lumbreras, J.F.; Coelho, M.R.; Almeida, J.A.; Filho, J.C.d.A.; de Oliveira, J.B.; Cunha, T.J.F. Brazilian System of Soil Classification, 5th ed.; Embrapa: Brasília, Brazil, 2018; p. 355. [Google Scholar]
  34. Soil Survey Staff. Soil Taxonomy: A Basic System of Soil Classification for Making and Interpreting Soil Surveys, 2nd ed.; U.S. Department of Agriculture Handbook 436; Natural Resources Conservation Service: Washington, DC, USA, 1999; p. 869. [Google Scholar]
  35. RADAM Brasil. Projeto RADAM Brasil. DNPM/Projeto; Departamento Nacional de Produção Mineral: Rio de Janeiro, Brazil, 1973; p. 507. [Google Scholar]
  36. Câmara, E.R.G.; dos Santos, J.C.B.; Filho, J.C.d.A.; Schulze, S.M.B.; Corrêa, M.M.; Ferreira, T.O.; de Sousa, J.E.S.; Júnior, V.S.d.S. Parent rock–pedogenesis relationship: How the weathering of metamorphic rocks influences the genesis of Planosols and Luvisols under a semiarid climate in NE Brazil. Geoderma 2021, 385, 114878. [Google Scholar] [CrossRef]
  37. Crepani, E.; Medeiros, J.S.; Palmeira, A.F.; Silva, E.F. Geographic Database of the Municipalities of Gilbués and Monte Alegre do Piauí (PI) (Municipalities Belonging to the Gilbués Desertification Nucleous); INPE: São José dos Campos, Brazil, 2008. [Google Scholar]
  38. Neves, L.V.M.W.; Sousa, J.E.S.; Santos, J.C.B.; Araújo Filho, J.C.; Corrêa, M.M.; Sousa, M.G.; Fracetto, F.J.C.; Fracetto, G.G.M.; Araujo, J.K.S.; Freire, G.A.P.; et al. Weathering of gneiss saprolites and formation of Planosols under semiarid climate (NE Brazil). J. S. Am. Earth Sci. 2023, 123, 104206. [Google Scholar] [CrossRef]
  39. Teixeira, P.C.; Donagemma, G.K.; Fontana, A.; Teixeira, W.G. Soil Analysis Methods Manual, 3rd ed.; Embrapa: Brasilia, Brazil, 2017; p. 574. [Google Scholar]
  40. Silva, A.C.; Torrado, P.V.; Abreu Junior, J.S. Methods for quantifying soil organic matter. Rev. Unifenas Alfenas 1999, 5, 21–26. [Google Scholar]
  41. Grossman, R.B.; Reinsch, T.G. Bulk density and linear extensibility. In Methods of Soil Analysis, Part 4: Physical Methods; Soil Science Society of America: Madison, WI, USA, 2002; pp. 201–228. [Google Scholar]
  42. Solomon, D.; Fritzsche, F.; Lehmann, J.; Tekalign, M.; Zech, W. Soil Organic Matter Dynamics in the Subhumid Agroecosystems of the Ethiopian Highlands. Soil Sci. Soc. Am. J. 2002, 66, 969–978. [Google Scholar] [CrossRef]
  43. Terra, F.S.; Demattê, J.A.M.; Viscarra Rossel, R.A. Spectral libraries for quantitative analyses of tropical Brazilian soils: Comparing vis-NIR and mid-IR reflectance data. Geoderma 2015, 255–256, 81–93. [Google Scholar] [CrossRef]
  44. Terra, F.S.; Demattê, J.A.M.; Viscarra Rossel, R.A. Proximal spectral sensing in pedological assessments: Vis–NIR spectra for soil classification based on weathering and pedogenesis. Geoderma 2018, 318, 123–136. [Google Scholar] [CrossRef]
  45. Viscarra Rossel, R.A. ParLeS: Software for chemometric analysis of spectroscopic data. Chemom. Intell. Lab. Syst. 2008, 90, 72–83. [Google Scholar] [CrossRef]
  46. Geladi, P.; MacDougall, D.; Martens, H. Linearization and scatter-correction for near-infrared reflectance spectra of meat. Appl. Spectrosc. 1985, 39, 491–500. [Google Scholar] [CrossRef]
  47. Barnes, R.J.; Dhanoa, M.S.; Lister, S.J. Standard normal variate transformation and de-trending of near-infrared diffuse reflectance spectra. Appl. Spectrosc. 1989, 43, 772–777. [Google Scholar] [CrossRef]
  48. Savitzky, A.; Golay, M.J.E. Smoothing and differentiation of data by simplified least squares procedures. Anal. Chem. 1964, 36, 1627–1639. [Google Scholar] [CrossRef]
  49. Minitab, L.L.C. Minitab Statistical Software, Release 21.1.1.; Minitab, LLC: State College, PA, USA, 2022. [Google Scholar]
  50. Chang, C.W.; Laird, D.A.; Mausbach, M.J.; Hurburgh, C.R. Near-Infrared Reflectance Spectroscopy-Principal Components Regression Analyses of Soil Properties. Soil Sci. Soc. Am. J. 2001, 65, 480–490. [Google Scholar] [CrossRef]
  51. Viera, S.R. Geostatistics in soil spatial variability studies. Tópicos Ciência Solo 2000, 1, 1–54. [Google Scholar]
  52. Cambardella, C.A.; Moorman, T.B.; Novak, J.M.; Parkin, T.B.; Karlen, D.L.; Turco, R.F.; Konopka, A.E. Field-Scale Variability of Soil Properties in Central Iowa Soils. Soil Sci. Soc. Am. J. 1994, 58, 1501–1511. [Google Scholar] [CrossRef]
  53. Oliveira, D.L.B.; Pereira, L.H.d.S.; Schneider, M.P.; Silva, Y.J.A.B.; Nascimento, C.W.A.; van Straaten, P.; Veras, G. Bio-inspired algorithm for variable selection in i-PLSR to determine physical properties, thorium and rare earth elements in soils from Brazilian semiarid region. Microchem. J. 2021, 160, 105640. [Google Scholar] [CrossRef]
  54. Silva, S.H.G.; Weindorf, D.C.; Pinto, L.C.; Faria, W.M.; Acerbi Junior, F.W.; Gomide, L.R.; Mello, J.M.; Pádua Junior, A.L.; Souza, I.A.; Teixeira, A.F.S.; et al. Soil texture prediction in tropical soils: A portable X-ray fluorescence spectrometry approach. Geoderma 2020, 362, 114136. [Google Scholar] [CrossRef]
  55. Gomes, L.C.; Faria, R.M.; de Souza, E.; Veloso, G.V.; Schaefer, C.E.G.; Fernandes Filho, E.I. Modelling and mapping soil organic carbon stocks in Brazil. Geoderma 2019, 340, 337–350. [Google Scholar] [CrossRef]
  56. Harrison-Kirk, T.; Beare, M.H.; Meenken, E.D.; Condron, L.M. Soil organic matter and texture affect responses to dry/wet cycles: Effects on carbon dioxide and nitrous oxide emissions. Soil Biol. Biochem. 2013, 57, 43–55. [Google Scholar] [CrossRef]
  57. Lenka, S.; Singh, A.K.; Lenka, N.K. Soil water and nitrogen interaction effect on residual soil nitrate and crop nitrogen recovery under maize–wheat cropping system in the semi-arid region of northern India. Agric. Ecosyst. Environ. 2013, 179, 108–115. [Google Scholar] [CrossRef]
  58. Jobbágy, E.G.; Jackson, R.B. The vertical distribution of soil organic carbon and its relation to climate and vegetation. Ecol. Appl. 2000, 10, 423–436. [Google Scholar] [CrossRef]
  59. Tang, X.; Xia, M.; Pérez-Cruzado, C.; Guan, F.; Fan, S. Spatial distribution of soil organic carbon stock in Moso bamboo forests in subtropical China. Sci. Rep. 2017, 7, srep42640. [Google Scholar] [CrossRef]
  60. Li, Y.; Liu, Z.; Li, S.; Li, X. Multi-scenario simulation analysis of land use and carbon storage changes in Changchun city based on FLUS and InVEST model. Land 2022, 11, 647. [Google Scholar] [CrossRef]
  61. van Raij, B.; Quaggio, J.A. Determination of phosphorus, calcium, magnesium and potassium extracted with ion exchange resin. In Book Chemical Analysis to Assess the Fertility of Tropical Soils; van Raij, B., de Andrade, J.C., Cantarella, H., Quaggio, J.A., Eds.; Instituto Agronômico: Campinas, Brazil, 2001; pp. 189–199. [Google Scholar]
  62. Mendes, W.D.S.; Boechat, C.L.; Gualberto, A.V.S.; Barbosa, R.S.; Silva, Y.J.A.B.D.; Saraiva, P.C.; Duarte, L.D.S.L. Soil spectral library of Piauí state using machine learning for laboratory analysis in Northeastern Brazil. Rev. Bras. Cienc. Solo 2021, 45, e0200115. [Google Scholar] [CrossRef]
  63. Souza, Y.A.F.; Leite, M.G.P.; Fujaco, A.M.G. A hydroelectric dam borrow pit rehabilitation. Two decades after the project, what went wrong? J. Environ. Manag. 2021, 293, 112850. [Google Scholar] [CrossRef] [PubMed]
  64. Blanco-Canqui, H.; Shaver, T.M.; Lindquist, J.L. Soil degradation as a reason for yield plateau in no-till corn and soybean. Soil Sci. Soc. A J. 2015, 79, 723–730. [Google Scholar]
  65. Stevens, A.; Udelhoven, T.; Denis, A. Exploring the spectral properties of soils from the UV to the thermal infrared: A spectral library of 400 soil samples. Remote Sens. Environ. 2018, 216, 423–430. [Google Scholar]
  66. Chabrillat, S.; Ben-Dor, E.; Cierniewski, J.; Gomez, C.; Schmid, T.; van Wesemael, B. Imaging spectroscopy for soil mapping and monitoring. Surv. Geophys. 2019, 40, 361–399. [Google Scholar] [CrossRef]
  67. Demattê, J.A.M.; Horák-Terra, I.; Beirigo, R.M.; Terra, F.d.S.; Marques, K.P.P.; Fongaro, C.T.; Vidal-Torrado, P. Genesis and properties of wetland soils by VIS-NIRSWIR as a technique for environmental monitoring. J. Environ. Manag. 2017, 197, 50–62. [Google Scholar] [CrossRef]
  68. Dotto, A.C.; Dalmolin, R.S.D.; Caten, A.T.; Grunwald, S. A systematic study on the application of scatter-corrective and spectral-derivative preprocessing for multivariate prediction of soil organic carbon by Vis-NIR spectra. Geoderma 2008, 314, 262–274. [Google Scholar] [CrossRef]
  69. Resende, F.V.; Souza, L.S.D.; Oliveira, P.S.R.D.; Gualberto, R. Efficiency of mulching on soil moisture and temperature, weed control and yield of carrot in summer season. Cienc. Agrotec. 2005, 29, 100–105. [Google Scholar] [CrossRef]
  70. Demattê, J.A.M.; Fongaro, C.T.; Rizzo, R.; Safanelli, J.L. Geospatial Soil Sensing System (GEOS3): A powerful data mining procedure to retrieve soil spectral reflectance from satellite images. Remote Sens. Environ. 2018, 212, 161–175. [Google Scholar] [CrossRef]
  71. Benedet, L.; Faria, W.M.; Silva, S.H.G.; Mancini, M.; Demattê, J.A.M.; Guilherme, L.R.G.; Curi, N. Soil texture prediction using portable X-ray fluorescence spectrometry and visible near-infrared diffuse reflectance spectroscopy. Geoderma 2020, 376, 114553. [Google Scholar] [CrossRef]
  72. Viscarra Rossel, R.A.; Behrens, T.; Ben-Dor, E.; Brown, D.J.; Demattê, J.A.M.; Shepherd, K.D.; Shi, Z.; Stenberg, B.; Stevens, A.; Adamchuk, V.; et al. A global spectral library to characterize the world’s soil. Earth-Sci. Rev. 2016, 155, 198–230. [Google Scholar] [CrossRef]
  73. Stenberg, B.; Rossel, R.A.V.; Mouazen, A.M.; Wetterlind, J. Visible and near infrared spectroscopy in soil science. Adv. Agron. 2010, 107, 163–215. [Google Scholar] [CrossRef]
  74. Nocita, M.; Stevens, A.; van Wesemael, B.; Aitkenhead, N.; Bachmann, M.; Barthès, B.; Ben Dor, E.; Brown, D.J.; Clairotte, M.; Csorba, A.; et al. Soil spectroscopy: An alternative to wet chemistry for soil monitoring. Adv. Agron. 2015, 132, 139–159. [Google Scholar] [CrossRef]
  75. Sousa, J.E.S.; Andrade, G.R.P.; de Araújo Filho, J.C.; dos Santos, J.C.B.; Corrêa, M.M.; Ferreira, T.O.; de Souza Júnior, V.S. Weathering and mineral alteration of metamorphic rocks and genesis of Planosols along a rainfall gradient in Borborema Province, Northeast Brazil. Geoderma Reg. 2023, 33, 00642. [Google Scholar] [CrossRef]
  76. Stevens, A.; Nocita, M.; Tóth, G.; Montanarella, L.; van Wesemael, B. Prediction of Soil Organic Carbon at the European Scale by Visible and Near InfraRed Reflectance Spectroscopy. PLoS ONE 2013, 8, e66409. [Google Scholar] [CrossRef]
  77. Wang, L.; Wang, R. Determination of soil pH from Vis-NIR spectroscopy by extreme learning machine and variable selection: A case study in lime concretion black soil. Spectrochim. Acta Part A Mol. Biomol. Spectrosc. 2022, 283, 121707. [Google Scholar] [CrossRef] [PubMed]
  78. Wan, M.; Qu, M.; Hu, W.; Li, W.; Zhang, C.; Cheng, H.; Huang, B. Estimation of soil pH using PXRF spectrometry and Vis-NIR spectroscopy for rapid environmental risk assessment of soil heavy metals. Proc. Saf. Environ. Prot. 2013, 132, 73–181. [Google Scholar] [CrossRef]
  79. Clark, R.N.; King, T.V.V.; Klejwa, M.; Swayze, G.; Vergo, N. High spectral resolution reflectance spectroscopy of minerals. J. Geophys. Res. 1990, 95, 12653–12680. [Google Scholar] [CrossRef]
  80. Viscarra Rossel, R.A.; Lobsey, C.R.; Sharman, C.; Flick, P.; McLachlan, G. Novel proximal sensing for monitoring soil organic C stocks and condition. Environ. Sci. Technol. 2017, 51, 5630–5641. [Google Scholar] [CrossRef]
  81. Iorio, E.D.; Circelli, L.; Lorenzetti, R.; Costantini, E.A.; Egendorf, S.P.; Colombo, C. Estimation of andic properties from Vis-NIR diffuse reflectance spectroscopy for volcanic soil classification. Catena 2019, 182, 104109. [Google Scholar] [CrossRef]
  82. Clark, D.H.; Lamb, R.C. Near infrared reflectance spectroscopy: A survey of wavelength selection to determine dry matter digestibility. J. Dairy Sci. 1991, 74, 2200–2205. [Google Scholar] [CrossRef]
  83. Demattê, J.A.M.; Terra, F.S. Spectral pedology: A new perspective on evaluation of soils along pedogenetic alterations. Geoderma 2014, 217–218, 190–200. [Google Scholar] [CrossRef]
  84. Gozukara, G.; Akça, E.; Dengiz, O.; Kapur, S.; Adak, A. Soil particle size prediction using Vis-NIR and pXRF spectra in a semiarid agricultural ecosystem in Central Anatolia of Türkiye. Catena 2022, 217, 106514. [Google Scholar] [CrossRef]
  85. Hong, H.; Cheng, F.; Yin, K.; Churchman, G.K.; Wang, C. Three-component mixed-layer illite/smectite/kaolinite (I/S/K) minerals in hydromorphic soils, south China. Am. Miner. 2015, 100, 1883–1891. [Google Scholar] [CrossRef]
  86. Schwertmann, U.; Herbillon, A.J. Some aspects of fertility associated with the mineralogy of highly weathered tropical soils. In Myths and Science of Soils of the Tropics, 1st ed.; Lal, R., Sanchez, A., Eds.; SSSA Special Publications: Madison, WI, USA, 1992; pp. 47–59. [Google Scholar] [CrossRef]
  87. Jiang, H.L.; Liu, G.S.; Liu, S.D.; Li, E.H.; Wang, R.; Yang, Y.F.; Hu, H.C. Delineation of site-specific management zones based on soil properties for a hillside field in central China. Arch. Agron. Soil Sci. 2012, 58, 1075–1090. [Google Scholar] [CrossRef]
  88. Metwally, M.S.; Shaddad, S.M.; Liu, M.; Yao, R.-J.; Abdo, A.I.; Li, P.; Jiao, J.; Chen, X. Soil properties spatial variability and delineation of site-specific management zones based on soil fertility using fuzzy clustering in a hilly field in Jianyang, Sichuan, China. Sustainability 2019, 11, 7084. [Google Scholar] [CrossRef]
  89. Shit, P.K.; Bhunia, G.S.; Maiti, R. Spatial analysis of soil properties using GIS based geostatistics models. Model. Earth Syst. Environ. 2016, 2, 1–6. [Google Scholar] [CrossRef]
  90. Fu, W.; Tunney, H.; Zhang, C. Spatial variation of soil nutrients in a dairy farm and its implications for site-specific fertilizer application. Soil Tillage Res. 2010, 106, 185–193. [Google Scholar] [CrossRef]
  91. Guan, F.; Xia, M.; Tang, X.; Fan, S. Spatial variability of soil nitrogen, phosphorus and potassium contents in Moso bamboo forests in Yong’an City, China. Catena 2017, 150, 161–172. [Google Scholar] [CrossRef]
  92. Rahul, T.; Kumar, N.A.; Biswaranjan, D.; Mohammad, S.; Banwari, L.; Priyanka, G.; Sangita, M.; Bihari, P.B.; Narayan, S.R.; Kumar, S.A. Assessing soil spatial variability and delineating site-specific management zones for a coastal saline land in eastern India. Arch. Agron. Soil Sci. 2019, 65, 1775–1787. [Google Scholar] [CrossRef]
  93. Yao, X.; Yu, K.; Deng, Y.; Liu, J.; Lai, Z. Spatial variability of soil organic carbon and total nitrogen in the hilly red soil region of Southern China. J. For. Res. 2020, 31, 2385–2394. [Google Scholar] [CrossRef]
  94. Zeraatpisheh, M.; Bakhshandeh, E.; Emadi, M.; Li, T.; Xu, M. Integration of PCA and fuzzy clustering for delineation of soil management zones and cost-efficiency analysis in a citrus plantation. Sustainability 2020, 12, 5809. [Google Scholar] [CrossRef]
  95. Cavalcante, E.G.; Alves, M.C.; Souza, Z.M.D.; Pereira, G.T. Spatial variability of physical attributes of soil under different use and management conditions. Rev. Bras. Eng. Agric. Ambient. 2007, 15, 237–243. [Google Scholar] [CrossRef]
  96. Zhang, P.; Shao, M.A. Spatial variability and stocks of soil organic carbon in the Gobi Desert of northwestern China. PLoS ONE 2014, 9, e93584. [Google Scholar] [CrossRef] [PubMed]
  97. Chaikaew, P.; Chavanich, S. Spatial variability and relationship of mangrove soil organic matter to organic carbon. Appl. Environ. Soil Sci. 2017, 2017, 4010381. [Google Scholar] [CrossRef]
  98. Li, L.; Lu, J.; Wang, S.; Ma, Y.; Wei, Q.; Li, X.; Li, X.; Cong, R.; Ren, T. Methods for estimating leaf nitrogen concentration of winter oilseed rape (Brassica napus L.) using in situ leaf spectroscopy. Ind. Crops Prod. 2016, 91, 194–204. [Google Scholar] [CrossRef]
  99. Shaddad, S.M.; Buttafuoco, G.; Elrys, A.; Castrignanò, A. Site-specific management of salt affected soils: A case study from Egypt. Sci. Total Environ. 2019, 688, 153–161. [Google Scholar] [CrossRef]
  100. Fernández-Martínez, F.; Camacho-Tamayo, J.H.; Rubiano-Sanabria, Y. Estimating texture and organic carbon of an Oxisol by near infrared spectroscopy. Cienc. Agron. 2022, 53, 20218167. [Google Scholar] [CrossRef]
  101. dos Santos, U.J.; de Medeiros, E.V.; Duda, G.P.; Marques, M.C.; Souza, E.S.D.; Brossard, M.; Hammecker, C. Land use changes the soil carbon stocks, microbial biomass and fatty acid methyl ester (FAME) in Brazilian semiarid area. Arch. Agron. Soil Sci. 2019, 65, 755–769. [Google Scholar] [CrossRef]
  102. Santana, M.S.; Sampaio, E.V.S.B.; Giongo, V.; Menezes, R.S.C.; Jesus, K.N.; Albuquerque, E.R.G.M.; Nascimento, D.M.; Pareyn, F.G.C.; Cunha, T.J.F.; Sampaio, R.M.B.; et al. Carbon and nitrogen stocks of soils under different land uses in Pernambuco state, Brazil. Geoderma Reg. 2019, 16, 00205. [Google Scholar] [CrossRef]
  103. Ribeiro, F.P.; Oliveira, A.D.; Bussinguer, A.P.; Rodrigues, M.I.; Cardoso, M.S.S.; Lustosa Júnior, I.M.; Valadão, M.B.X.; Gatto, A. How long does it take to decompose all litter in Brazilian savanna forest? CERNE 2022, 28, 102819. [Google Scholar] [CrossRef]
  104. Bendito, B.P.C.; Chaves, H.M.L.; Scariot, A. Erosion and Sedimentation Processes in a Semi-Arid Basin of the Brazilian Savanna under Different Land Use, Climate Change, and Conservation Scenarios. Water 2023, 15, 563. [Google Scholar] [CrossRef]
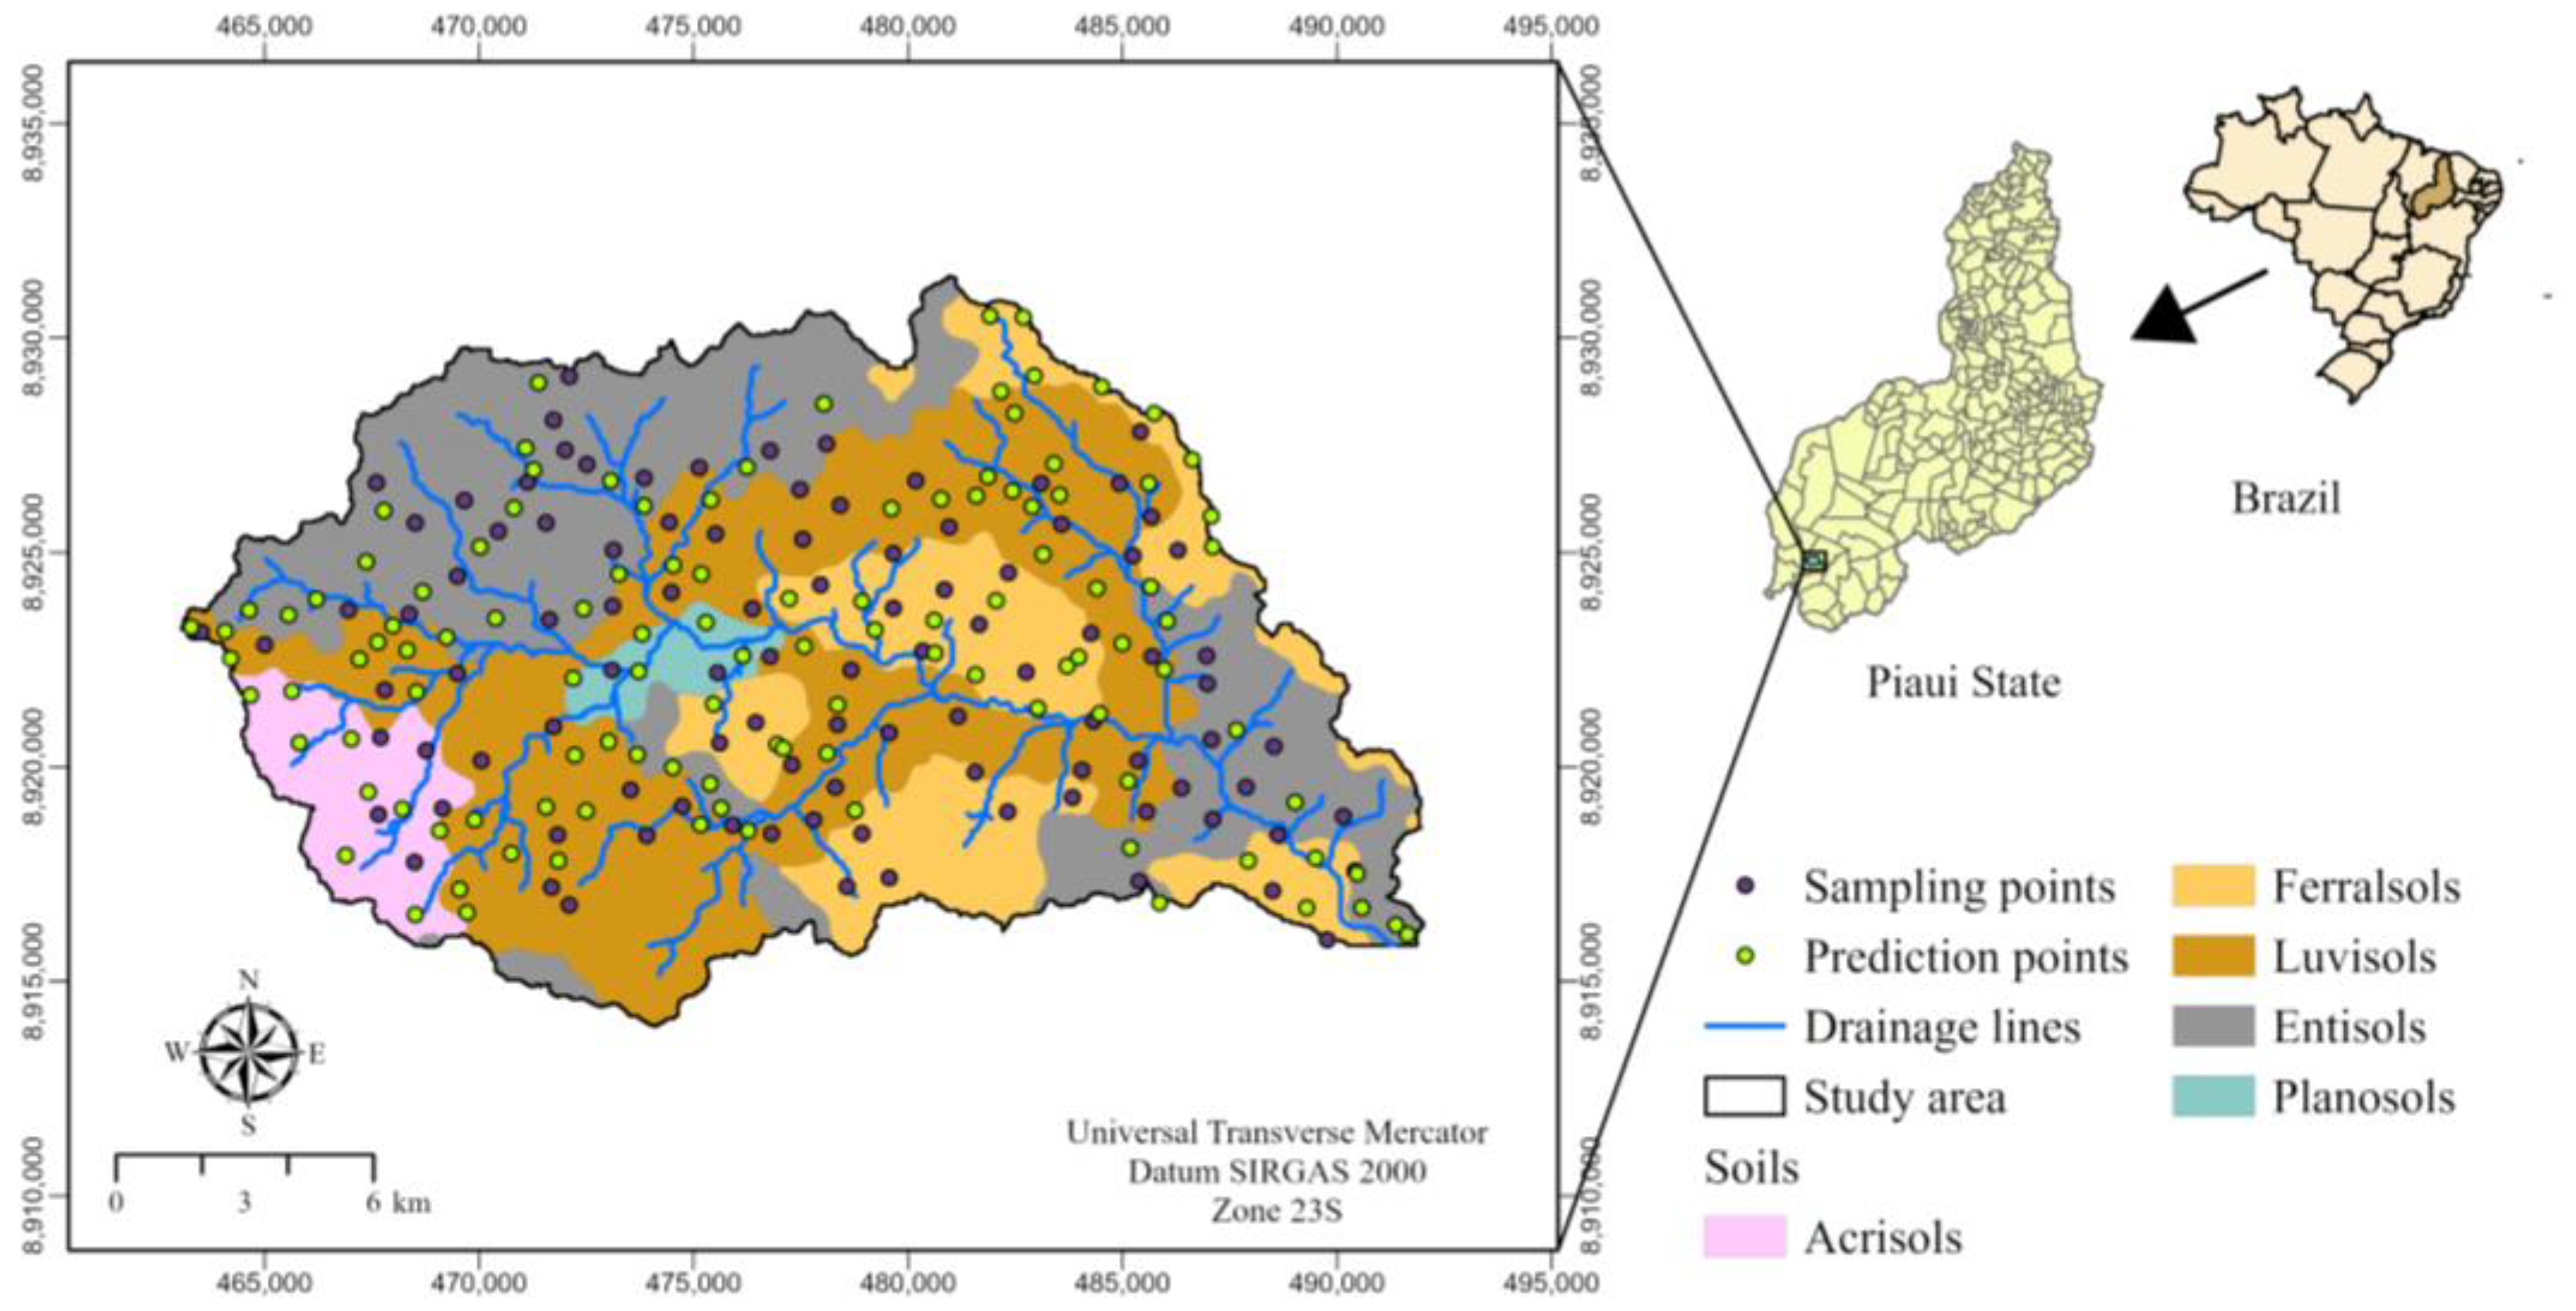
Figure 1. Location of the study area. Soil class and soil sampling points.
Land 12 01812 g001
Figure 2. Sample collection process exemplification and steps of the laboratory analysis employed in this study.
Land 12 01812 g002
Figure 3. Texture triangle with sand, silt, and clay content concentrations for PSMW soil samples (red dots). Cl, clay; SaCl, sand clay; SaClLo, sand clay loam; SaLo, sand loam; LoSa, loamy sand; Sa, sand; ClLo, clay loam; Lo, loam; SiCl, silty clay; SiClLo, silty clay loam; SiLo, silt loam; Si, silt.
Land 12 01812 g003
Figure 4. Raw spectra of the modeling group, whereas each sample is represented by a color line (a); spectra of samples that presented the greatest and lowest values for C Stock (b). Photo of the collection site that presented the greatest (c) and least (d) C Stock content.
Land 12 01812 g004
Figure 5. Variable importance for projection (VIP) plots of the predicted soil attributes. C Stock, carbon stock; TOC, total soil organic carbon.
Land 12 01812 g005
Figure 6. Spatial distribution maps for MG (Observed) and PG (Predicted) by Diffuse Reflectance Spectroscopy (DRS); C Stock, carbon stock; TOC, total soil organic carbon.
Land 12 01812 g006
Table 1. General statistics of soil samples from the group used for modeling the calibration and external validation models.
VariablenMinimumAverageMaximumSD
Sand (g kg−1)10046.90768.20958.20195.80
Silt (g kg−1)10021.60134.30607.60139.10
Clay (g kg−1)10017.9397.59381.8574.98
C Stock(Mg ha−1)1005.7671.42234.7343.12
N Stock (Mg ha−1)1000.080.932.630.56
TOC (g kg−1)1003.8748.12153.2130.81
TN (g kg−1)1000.060.632.410.41
BD (g/cm3)1001.051.511.800.14
pH (H2O)1004.595.426.630.42
n, number of samples; SD, standard deviation; C Stock, carbon stocks; N Stock, nitrogen stocks; TOC, total soil organic carbon; TN, total nitrogen; BD, bulk density.
Table 2. Results of pedometric parameters to evaluate the performance of the spectral model.
AttributesNFCross-ValidationExternal Validation
(n = 70)(n = 30)
R2adjRMSERPDR2adjRMSE
Sand (g kg−1)80.7778.062.110.62186.37
Silt (g kg−1)80.6162.331.590.53144.25
Clay (g kg−1)80.7529.261.840.6743.13
C Stock (Mg ha−1)50.6211.081.750.5367.99
N Stock (Mg ha−1)20.040.481.03--
TOC (g kg−1)50.6211.081.520.5249.79
TN (g kg−1)20.050.331.04--
BD (g cm3)40.070.140.92--
pH 60.160.401.05--
NF, number of factors; n, number of samples; C Stock, carbon stock; N Stock, nitrogen stock; TOC, total soil organic carbon; TN, total nitrogen; BD, Bulk density; R2adj, coefficient of determination adjusted; RMSE, root mean squared error; RPD, residual prediction deviation.
Table 3. Spatial statistics for the modeling and prediction groups of the samples collected in the PSMW.
AttributesData SetModelC0C0 + CSDD (%)Range (m)R2
Sand (g kg−1)MGExponential71019,4403.6519300.86
PGExponential15,30047,00047.2020000.82
Silt (g kg−1)MGGaussian1019,1000.0514000.95
PGExponential771022,54034.2019600.85
Clay (g kg−1)MGSpherical700567112.3428000.93
PGExponential2710935028.9822600.82
C Stock (Mg ha−1)MGSpherical118980.0521600.95
PGExponential579486.0111000.94
TOC (g kg−1)MGSpherical110000.121700.92
PGExponential244295.5911100.94
C0, nugget effect; C0 + C, still; SDD, spatial dependence degree; R2, coefficient of determination; MG, modeling group; PG, prediction group; C Stock, carbon stock; TOC, total soil organic carbon.
Table 4. Cross-validation parameter values for the ERD-predicted dataset (n = 114).
AttributesR2RMSE
Sand (g kg−1)0.920.12
Silt (g kg−1)0.900.13
Clay (g kg−1)0.950.11
C Stock (Mg ha−1)0.960.15
TOC (g kg−1)0.970.15
R2, coefficient of determination; RMSE, root mean squared error; C Stock, carbon stock; TOC, total soil organic carbon.
Disclaimer/Publisher’s Note: The statements, opinions and data contained in all publications are solely those of the individual author(s) and contributor(s) and not of MDPI and/or the editor(s). MDPI and/or the editor(s) disclaim responsibility for any injury to people or property resulting from any ideas, methods, instructions or products referred to in the content.