1. Introduction
Optical remote sensing image has the advantages of high resolution and rich feature information and being intuitive and easy to understand [
1]. The primary objective of target detection is to identify interesting targets from massive data and extract their location information. The task of target detection in optical images involves the automated analysis of details about the image characteristics using relevant algorithms, followed by the classification of targets and extraction of their positional characteristics. During the early stages of exploration, target detection in optical images primarily relies on manual classification and positioning, which proves to be both time-consuming and labor-intensive while also falling short of meeting real-time requirements.
Over the course of several years, the landscape of automatic recognition and detection methods for optical images has undergone a progressive transformation. This evolution has encompassed various techniques, such as template matching [
2] and image analysis [
3]. However, these methodologies necessitate prior manual design and calibration of feature information. This dependence on expert-engineered feature information introduces a reliance on a substantial cadre of experts and is characterized by a tailored focus, often lacking in robust generalization capability. In tandem with the advancement of artificial intelligence technology, object detection approaches grounded in deep learning have emerged as prominent contenders. These methods have garnered widespread adoption and dissemination across numerous traditional disciplines [
4,
5,
6]. This method uses the theoretical basis that neural networks can fit any function and studies a neural network that can automatically complete feature information learning and task reasoning, which significantly enhances target detection tasks’ speed and precision in natural scenes [
7]. While this deep learning-based network has demonstrated remarkable performance in natural scenes, its application in optical remote sensing images remains challenging due to significant disparities between the two types of imagery.
As deep learning-based target detection continues to be extensively investigated, an increasing number of one-stage object-detecting algorithms are being employed in optical remote sensing images. A mainstream approach is to perform cluster analysis on the target dataset through an automatic clustering algorithm, then design an adaptive distance calculation formula to obtain a more meaningful intersection ratio, and finally learn from the model architecture of the YOLO series to complete the adaptability. For example, the idea of the Densely Connected Convolutional Networks (Densenet) [
8] is applied, which combines the dense connection layer in the Dense network and the residual block to improve the network’s capacity to extract feature information. Moreover, within the Neck network that performs the feature fusion, diverse structures of the characteristic pyramid are extensively employed, and these prevailing optimization approaches exhibit superior performance compared to conventional approaches.
In 2019, Ghorbani et al. introduced a novel approach utilizing the PIIFD characterization operator [
9] to address differentiated samples and their background changes. The study demonstrated the superior performance of this method in optical remote sensing target detection compared to traditional approaches; Cao C et al. introduced a ship detection algorithm based on YOLO in 2020 [
10], which actually adopts the above mainstream method. The author deviated from the conventional YOLO approach of utilizing three anchor boxes and instead recalculated the anchor box parameters, specifically using a clustering algorithm, and incorporated the detection scale into the output layer of the network extracting characteristics. The receptive field method enhances the detection accuracy of smaller objects like ships, reducing the network further. Xu et al. adopted an improved method by selecting the feature fusion structure of the network [
11]. It is difficult to disseminate low-level semantic information when the target is small.
In the feature extraction network, Yang et al. [
12] increased the low-level feature information, which is beneficial to the classification and localization of small targets. Meanwhile, the author changes the connection mode of the network to dense connection, which reduces the loss of the propagation of the underlying features in the network. Wang et al. [
13] also tried to integrate low-level characteristic details into the network and amplified the significance of smaller target samples by assigning them higher weights within the loss function, thus increasing the accuracy of detecting small targets. The deconvolution layer was employed to integrate shallow characteristics with deep characteristics, thereby augmenting the detection capability of small targets in Li et al.’s study [
14]. To mitigate the influence of background information on the detection task. Fu et al. [
15] performed weight distinction before the fusion of low-level characteristic details and characteristic details. The weight details are implemented by a balance operator, but the robustness is poor. Zhang et al. [
16] utilized the two-stage object detection network Faster RCNN, up-sampling all candidate objects obtained in the first stage. This feature upsampling operation is usually done by deconvolution calculation so that a larger-scale feature map can be obtained. Using a similar idea, Schilling et al. [
17] studied scale improvement by adding high-level feature maps and also used deconvolution layers to achieve this scale expansion and fused low-level characteristic details with the expanded high-level characteristics to achieve the final target detection task. Liu et al. [
18] replaced the deconvolution calculation with the atrous convolution calculation to reduce the computational cost. While this enhancement does yield a reduction in network parameters to some extent, it leads to the loss of certain features while maintaining the same receptive field. To this end, Ying et al. [
19] studied the problem caused by atrous convolution by completing partial information fusion through the attention mechanism.
Optical distant sensing images are not only unique from images in common natural scenes but also have huge differences between various targets in their own sample images. This phenomenon of huge differences in appearance and shape makes it difficult to preset the anchor frame of the network, resulting in the result that the target is missed [
20,
21,
22].
The current mainstream solution is to increase the number of anchor boxes to try to cover more possible targets. In addition, the network’s robustness about the appearance and shape of the object can be enhanced through variable neural networks and key feature detection. Currently, numerous studies have focused on augmenting the network’s generalization capabilities toward target appearance by explicitly increasing the quantity and diversity of anchor boxes [
23,
24,
25]. Since the target angle is relatively random in optical remote sensing images, it is difficult to fundamentally solve such problems with poor robustness, and increasing the number of anchor boxes also causes the overall computational cost of the network with greater pressure. It can be seen that the solution at the current stage is essentially to alleviate the occurrence of this problem through brute force calculation.
The primary focus of this study is on enhancing the detection capability of small-scale objects in optical remote sensing imagery without significantly increasing computational complexity. By improving the channel division method of the Cross Stage Partial (CSP) structure [
26] and simultaneously applying it to the Neck component of the YOLO network, the reusability of features is enhanced. The proposed enhancements are employed in both the Neck and Backbone structures of the YOLOv4 network, resulting in the introduction of the CSPX_1 structure. Given the necessity for specific adaptive improvements to the CSP structure in the Neck component, ResBlock structures are removed, and a stack of Cross-body Link (CBL) structures is added. A feature fusion structure named CSPX_2 is designed to acquire fused features with stronger semantic information. Building upon the Bidirectional Feature Pyramid Network (BiFPN), the feature fusion network within the model is improved, introducing bidirectional feature fusion mechanisms into the Neck network structure of YOLOv4. Adaptive improvements are tailored to the structure of the YOLO network and the characteristics of remote sensing imagery. The DOTA dataset is used for experimentation, and during data preprocessing, various data augmentation schemes are employed to enhance features related to small objects.
The experimental phase involves a performance comparison between the proposed model and baseline models. The proposed model showcases approximately a 3.2% improvement in mAP (mean Average Precision) compared to the traditional YOLOv4 model. This validates the effectiveness of the proposed model improvements. Additionally, a comparison of small object detection performance with multiple detection models further demonstrates that the improvements made in this study to the YOLOv4 network’s feature fusion aspect successfully enhance the model’s detection performance and robustness concerning medium to small-scale objects. It proves the feasibility of the weighted bidirectional multi-scale feature fusion mechanism on the YOLO network architecture and provides certain improvement ideas for models with similar structures.
The main innovations and contributions of this article are as follows:
The main contribution of this research is the improvement in feature fusion of the YOLOv4 network, which successfully enhances the model’s detection performance and robustness against small land targets.
This study introduces improvements to the CSP structure, which enhances the reusability of functions. Through the introduction of the CSPX_1 structure, the CSP enhancement function is integrated into the Neck and Backbone structures of the YOLOv4 network, which is an innovation aimed at improving the overall detection performance.
Research on introducing the CSPX_2 structure and bidirectional feature fusion mechanism into the Neck network structure. This helps capture stronger semantic information and improve object detection accuracy. This research verifies the feasibility of the weighted bidirectional multi-scale feature fusion mechanism within the YOLO network architecture. This innovation has the potential to benefit models with similar structures in various fields.
3. Methods
3.1. The Structure of Cross-Stage Partial
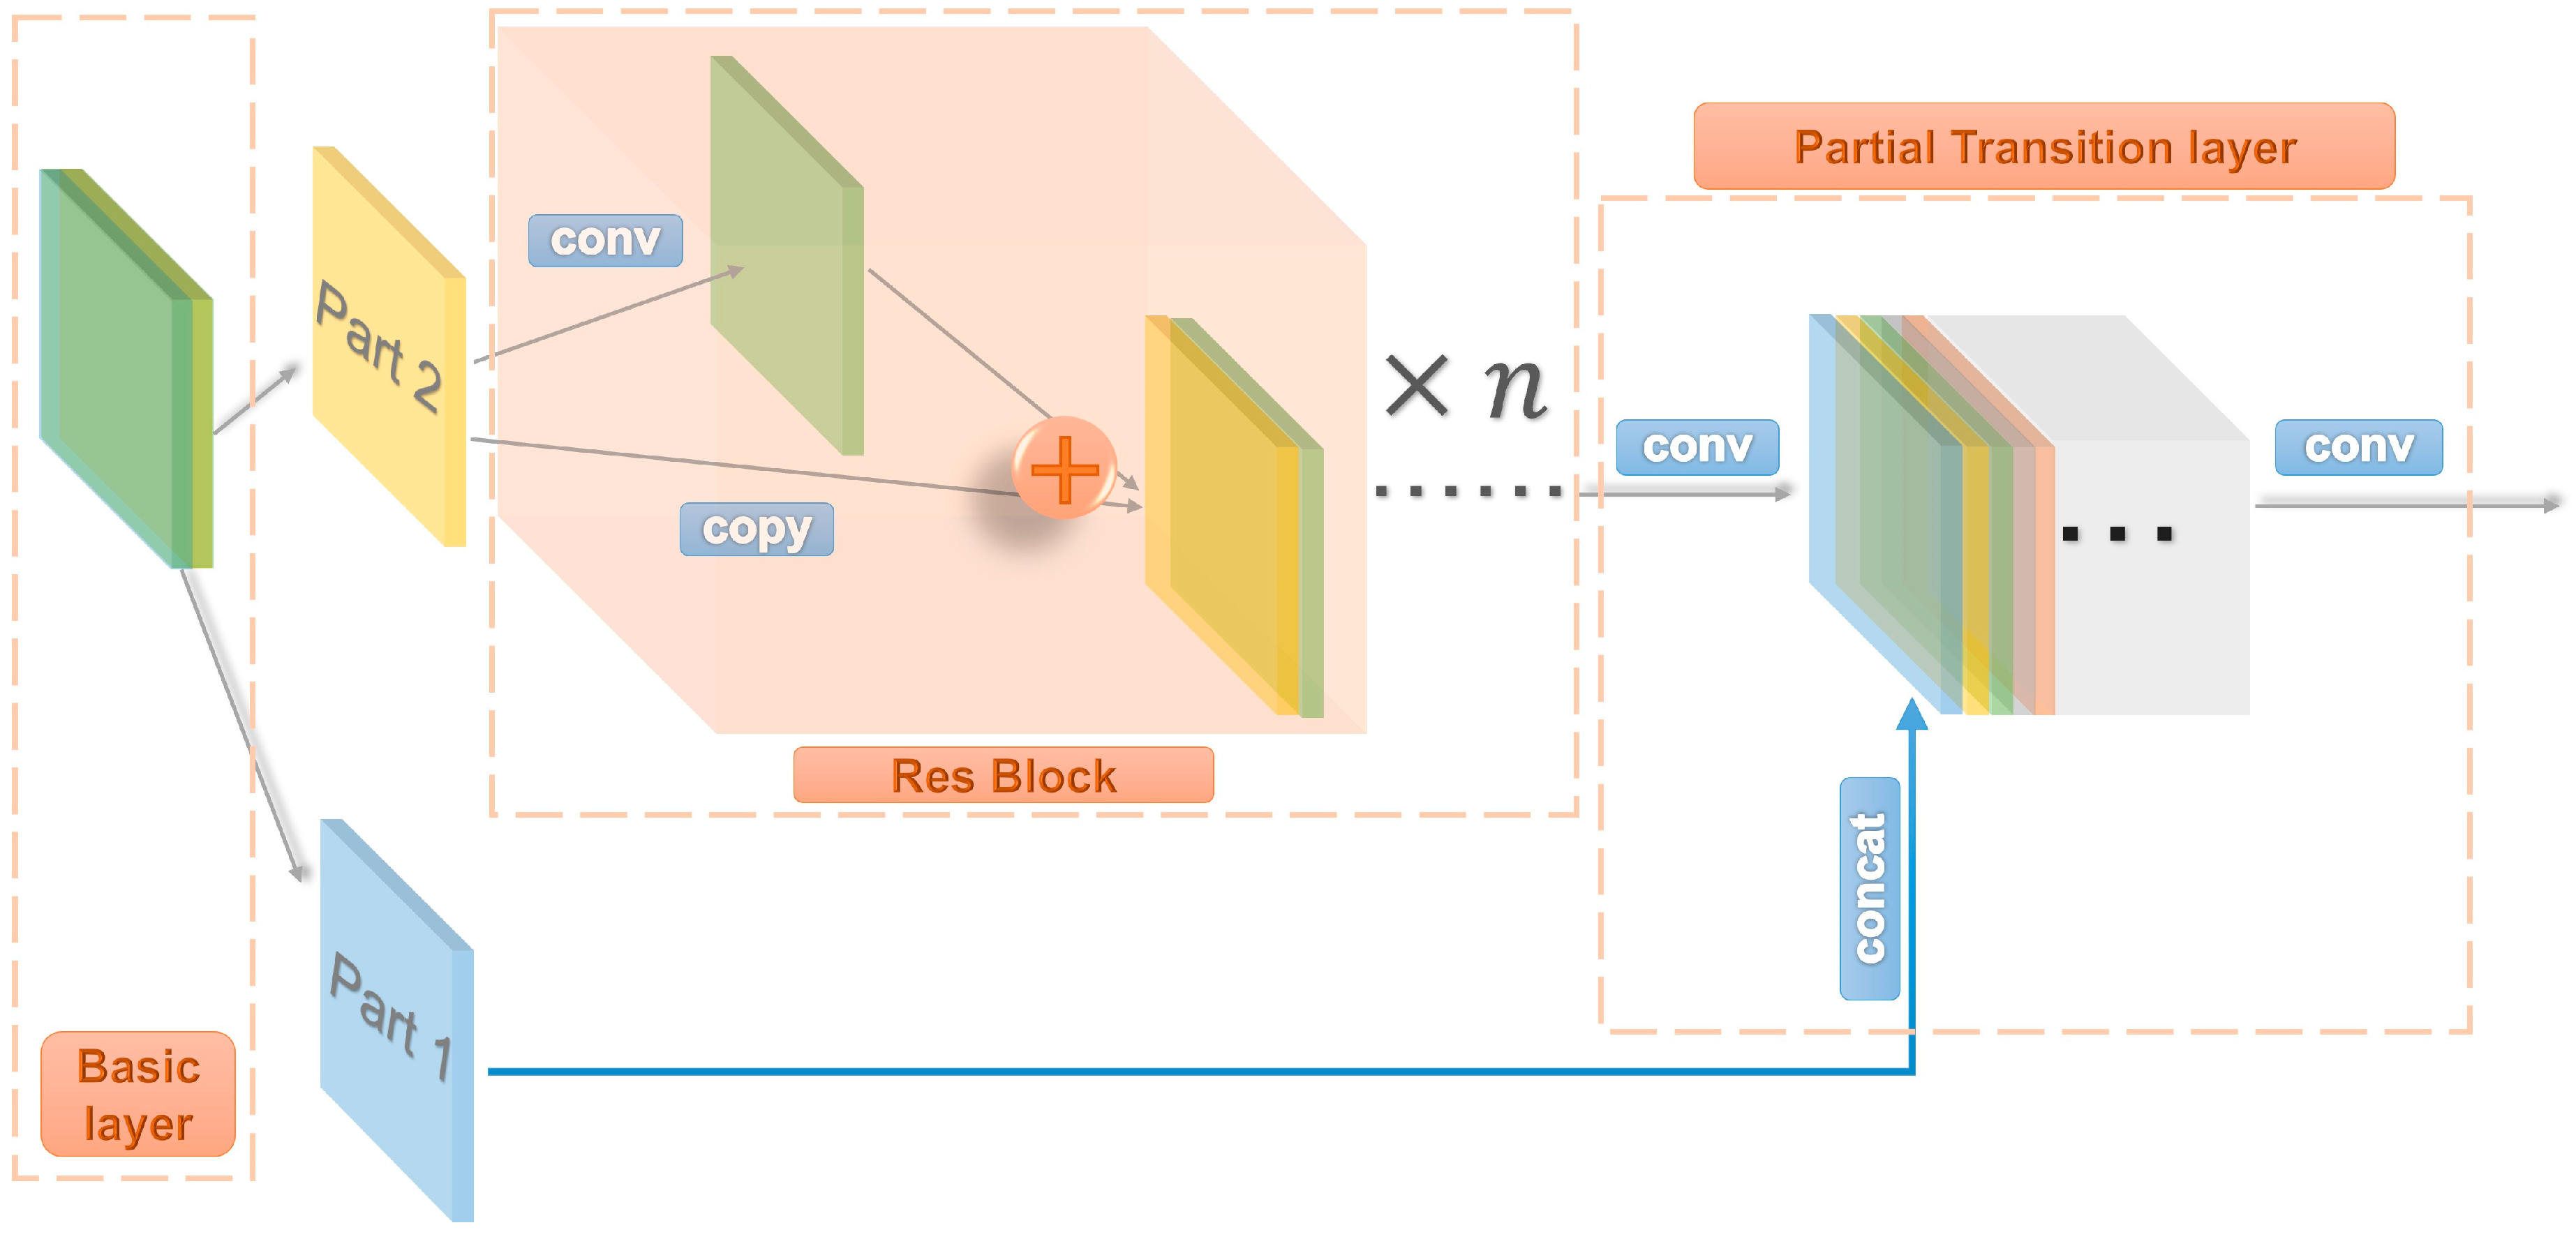
The main purpose of the CSPNet [
29] is to enhance the network’s structural level in order to mitigate the computational burden of the network. CSPNet partitions the input into two distinct components: short-connected edge and convolutional edge.
The convolutional edge extracts feature information through the operation of the traditional convolution structure, and the short-connected edge is directly processed with the output of the CSPNet structure after a small amount of processing. Feature maps are connected, as shown in
Figure 1.
Through this channel division method, CSPNet reduces the memory cost required by the network in the operation process, and on this basis, improves the learning ability and maintains the performance of the model.
The main reason why CSPNet can accelerate network processing is that by intercepting the gradient flow, it prevents the network from continuously calculating repeated content when updating gradient information, as shown in Equations (1) and (2) for the forward propagation of ordinary DenseNet and backpropagation [
30].
where
represents the convolution operator,
represents feature information splicing,
is the update method of the weight parameters,
is the
i-th layer’s gradient information,
is the
i-th layer’s weight information, while
is the changed layer’s feature output.
It can be seen from this formula that a substantial quantity of gradient information is reused in backpropagation, which causes different hierarchical structures in the network to learn the same feature information. Therefore, the CSPNet structure proposes to divide the input feature information, denoted as
. Among them,
represents the shorted edge,
represents the convolution edge, and the output
is obtained after the calculation of the convolution edge of
, and, finally, the final output result
can be obtained by splicing
and
. Its forward propagation and backpropagation weight update rules are shown as Equations (3) and (4) [
31].
From the provided equation, it is evident that each side’s gradient update channel operates independently. As a result, these channels do not contain redundant gradient information with respect to each other. This approach prevents the flow of gradients and thereby mitigates the computation of a substantial portion of redundant gradient information. While it is true that certain feature information within an individual CSP structure may not undergo processing by predetermined feature extraction networks, the CSP structure itself functions as a fundamental component of the network. It incorporates established computational units from the original network. Consequently, in the practical application of the CSP structure, the feature extraction segment of the network is formed by stacking multiple CSP structures consecutively. This approach effectively prevents the loss of feature information.
YOLOV4 replaces all residual structures of DarkNet with CSP structures in the backbone part of the network [
27]. This replacement not only substantially enhances the characteristic extraction ability of the backbone network in YOLOV4, but also reduces the inference calculation to a certain extent quantity. On this basis, this study explores the possibility of applying the CSP structure to the Neck part of the YOLO network.
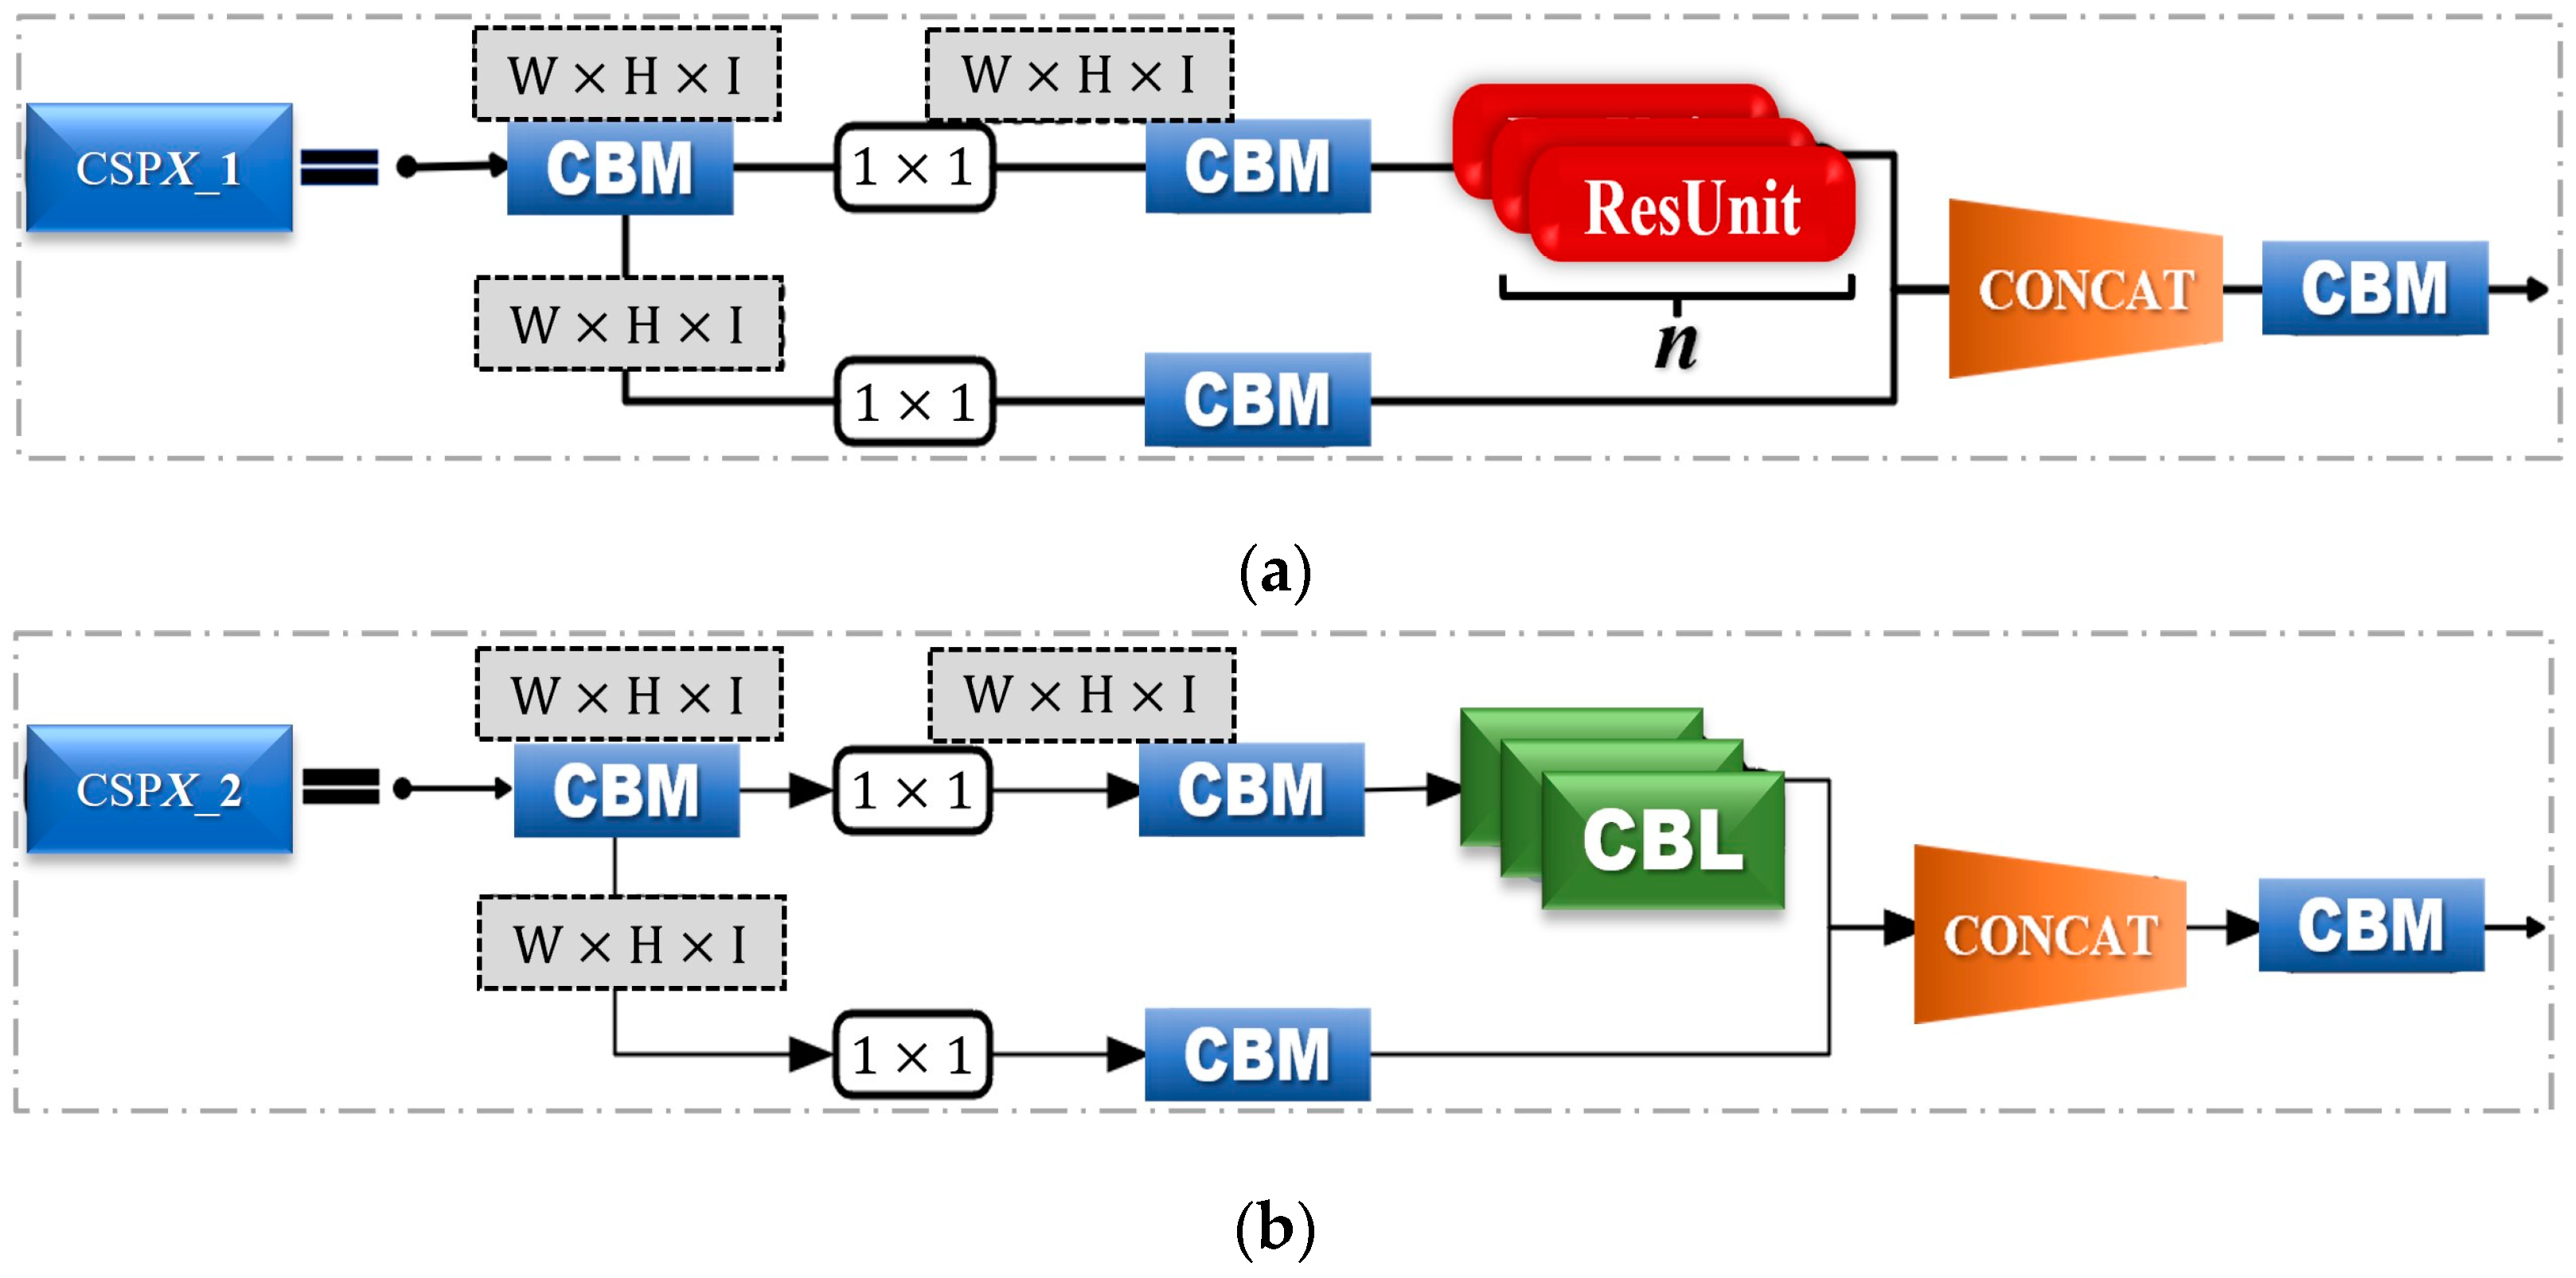
To reduce the amount of computation during inference, this paper uses the CSPX_1 structure shown in
Figure 2a. Unless otherwise specified, all CSPX_1 structures in this article are of this type. For the Neck part, because the task of the backbone network is to extract features, a large number of residual networks are designed to improve the learning ability of features. But in the Neck part of the network, its main task is to fuse features, so specific adaptive improvements are required for the CSP structure of the Neck part. This article makes modifications on the basis of CSPX_1, deletes the ResBlock structure, and increases the stacking of the CBL structure. This improvement is to obtain stronger fusion features of semantic information, and its structure diagram is shown in
Figure 2b.
The enhanced CSP architecture introduced in this article also involves the division of feature channels after the input of features. However, the data flow from these two divisions is managed by predetermined computational units. The resulting outputs from these units do not require dimension adjustment before being directly concatenated. This approach not only enhances feature reusability compared to the traditional CSP structure but also adheres to the core principles of the CSP architecture. Moreover, it reduces computational complexity in comparison to standard convolutional structures by truncating gradient information.
3.2. The Structure of BiFPN
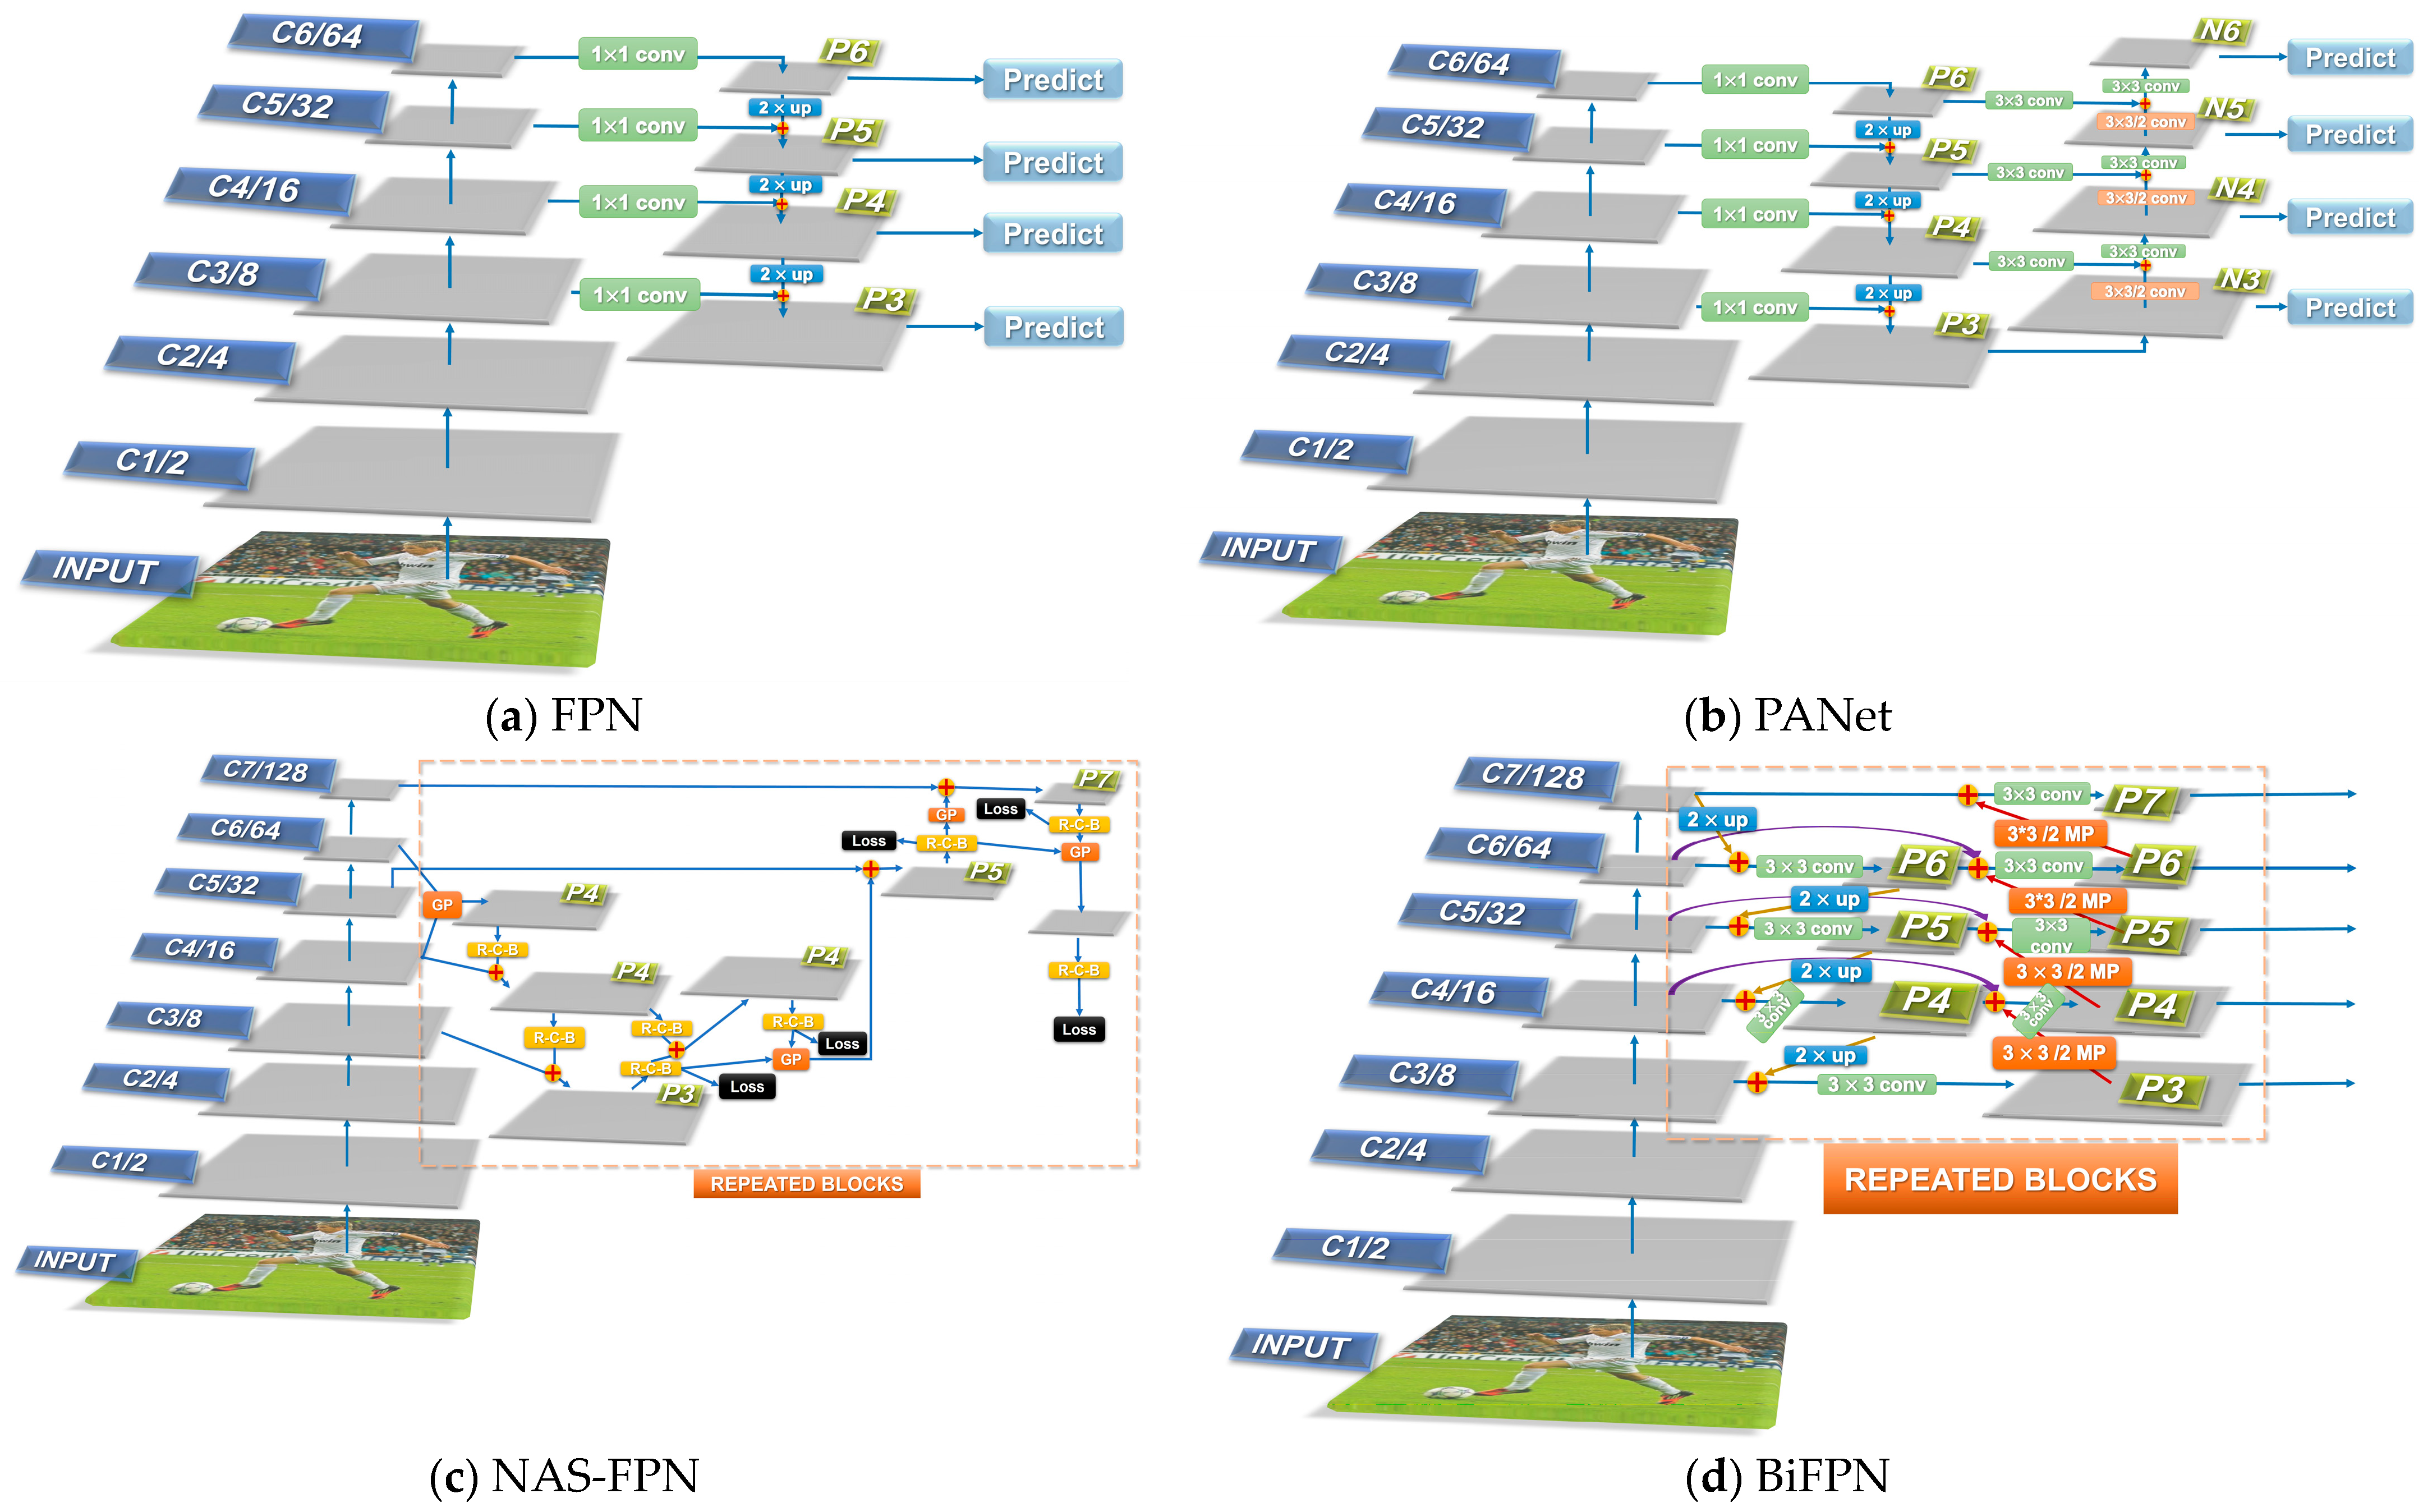
YOLO network’s first characteristic fusing method was influenced by the Feature Pyramid Network (FPN) structure and introduced into YOLOV3’s Neck network. Although many cross-scale feature fusion network structures have been developed since FPN, such as Path Aggregation Network and Neural Architecture Search-feature Pyramid Networks used in the YOLO series, these structures are used to fuse feature information extracted from different network levels. However, these input feature information from different network levels often has different resolutions, so the input feature information of different scales also has unequal contributions to the output feature information after fusion. Therefore, it is a reasonable solution to weigh the feature information of different scales when fusing features, allowing the network adaptively to learn the weight during training.
This is one of the main design ideas of BIFPN [
32], which introduces weights that can be adaptively learned by the network to distinguish the importance of characteristic details at different scales for effective feature layers. In addition, the feature fusion mechanism, rooted in the FPN concept, clarifies the importance of feature fusion between different levels, but these methods all use simple upper- and lower-layer connections as a fusion method and do not consider the problem of excessive abstraction of feature information caused by such repeated fusion, so BiFPN also proposes a bidirectional cross-scale connection feature fusion mechanism. By adding a skip connection to the network at the same level, the underlying semantic characteristic is enhanced, and since the connected characteristic is at the same network level, it does not introduce too much computational cost.
Figure 3 illustrates FPN’s structures and its variants.
The feature fusion network described in this paper fully absorbs the idea of BiFPN, introduces the bidirectional feature fusion mechanism into the Neck network structure of YOLOv4, and makes adaptive improvements to the structure of the YOLO network.
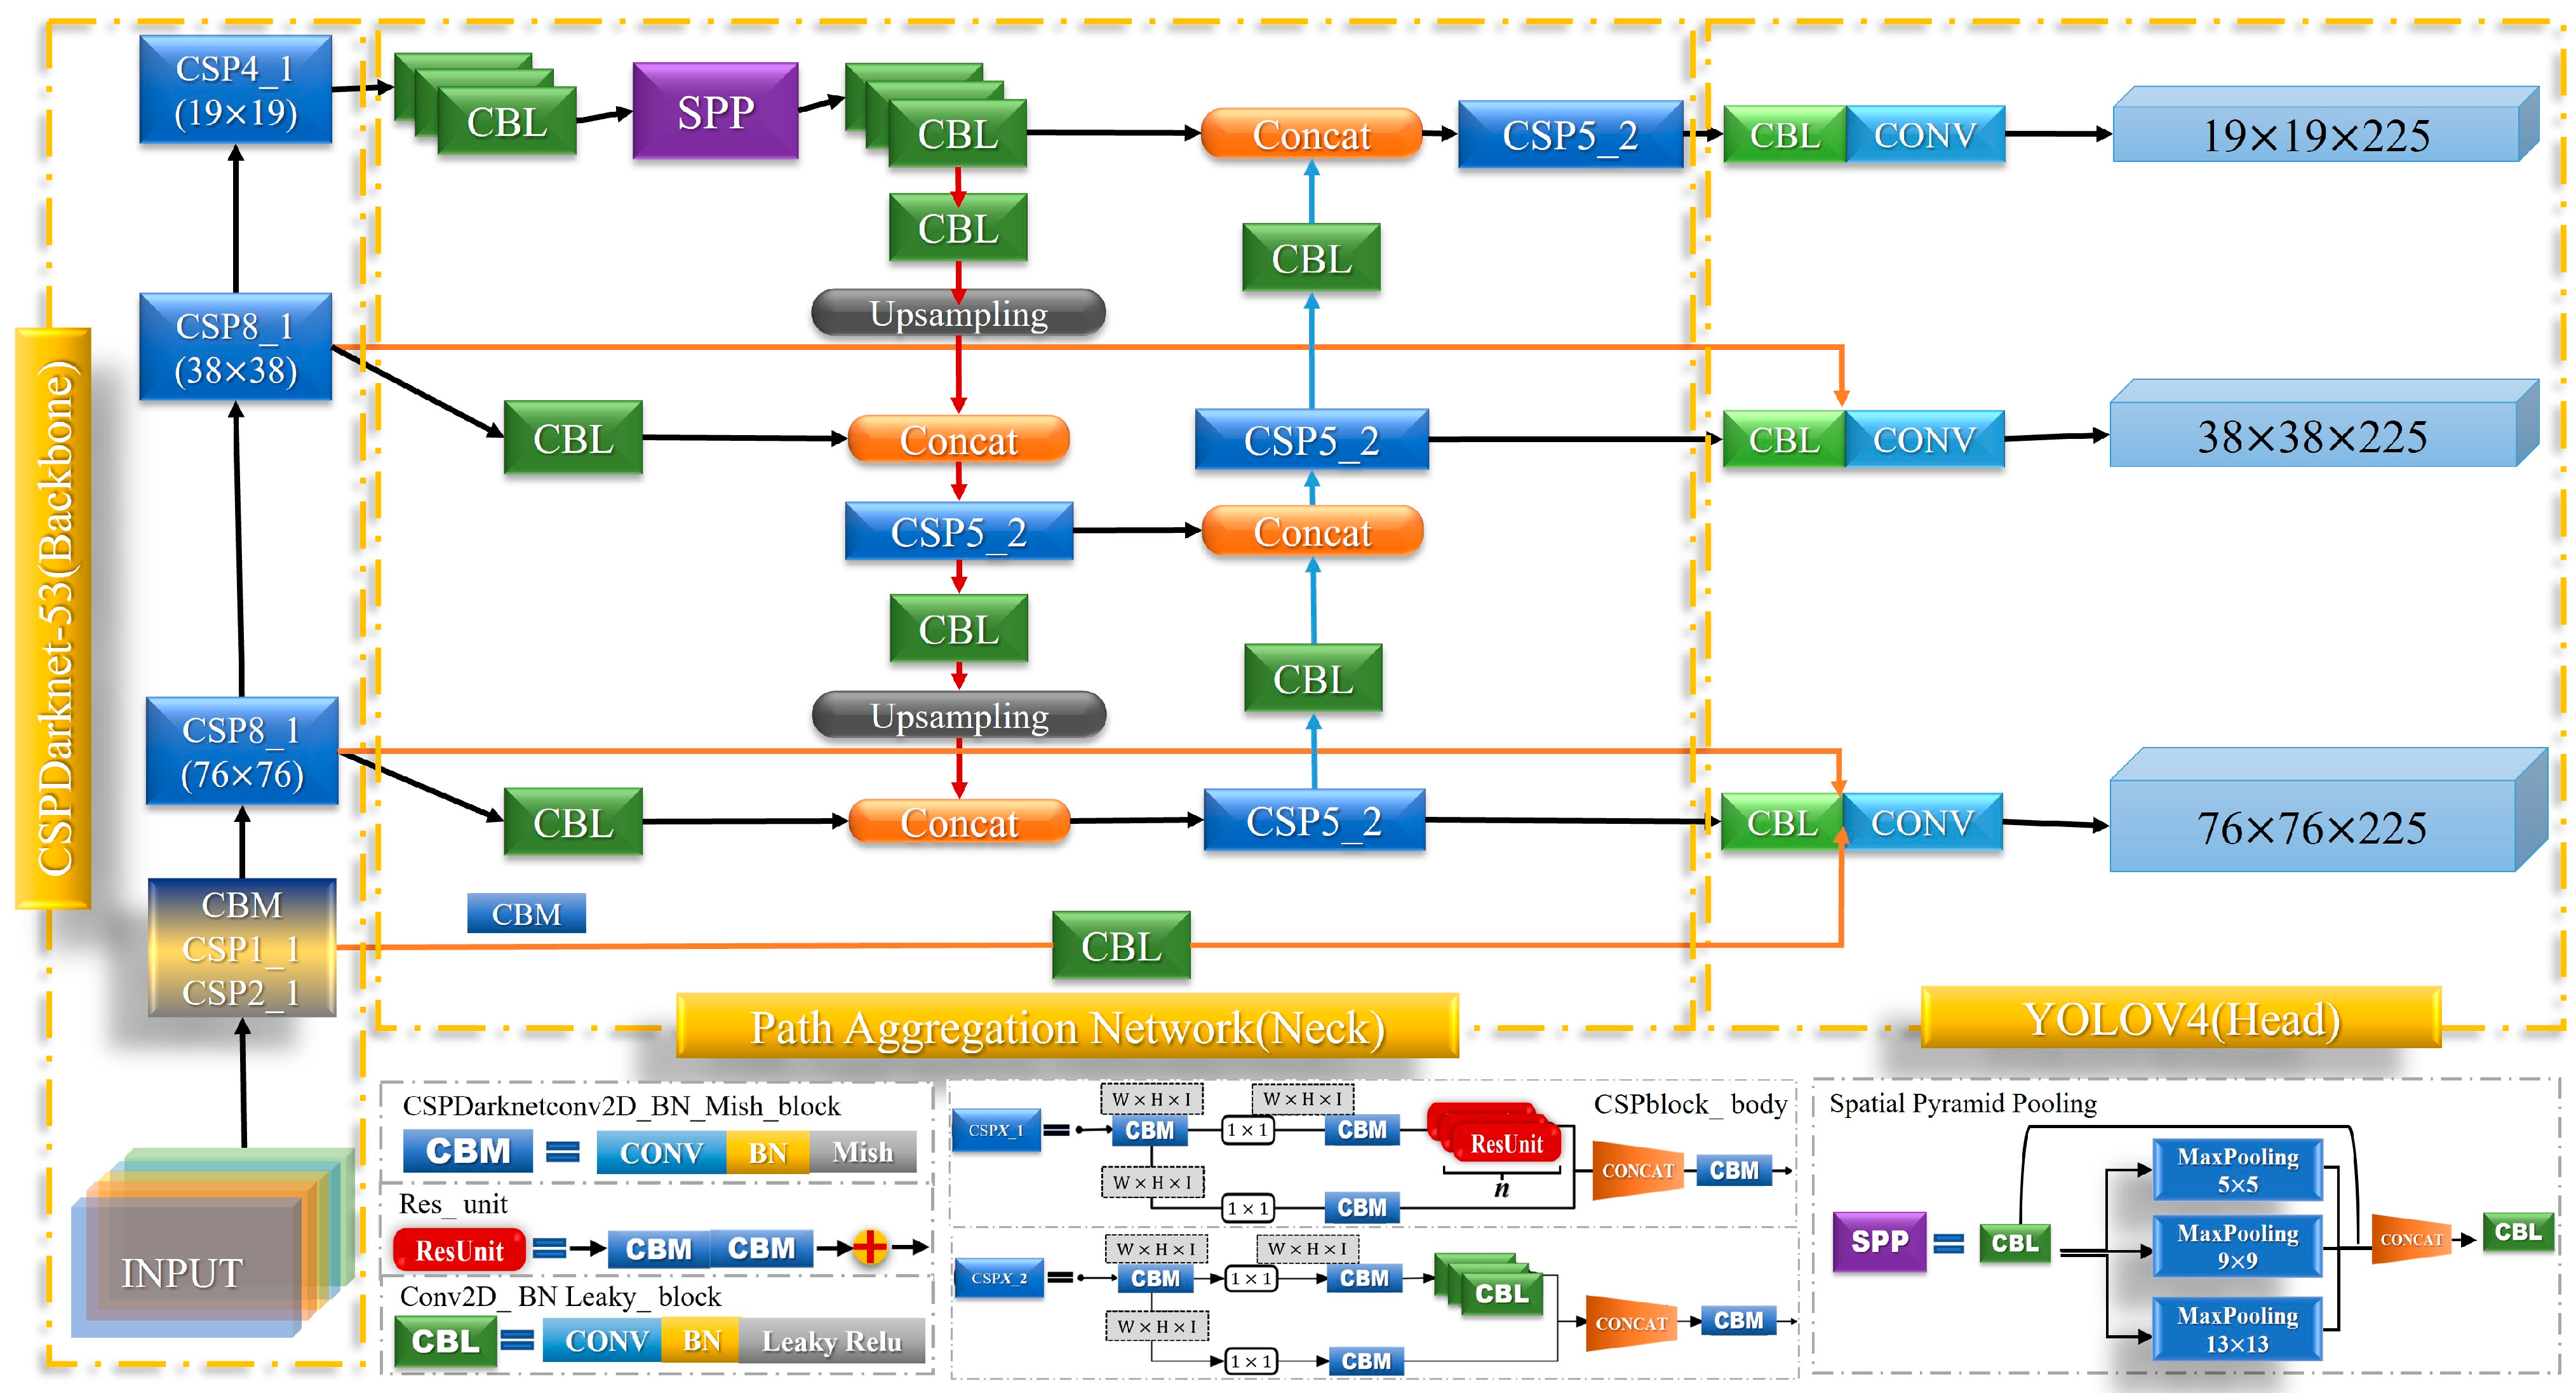
3.3. Improved Remote Sensing Image Object Detection Model YOLOV4_Bi
After the improvement of the CSP and the Neck network structure, YOLOV4_Bi shown in
Figure 4 is obtained.
The orange data flow in the figure represents the horizontal skip connection, and the red and blue data flow represents the bidirectional cross-scale connection. As mentioned above, considering the fine-grained and densely distributed features exhibited in optical remote sensing images, the YOLOV4_CPSBi network proposed in this paper removes the horizontal skip connection at the top of the traditional YOLOV4 network and transfers the computation of the connection to the bottom of the network. It provides more abundant underlying feature information for the small target detector. This improvement effectively improves the detection ability of small-scale objects in optical remote sensing images without escalating computational complexity.
5. Results
5.1. Quantitative Analysis of the Detection Performance of YOLOV4_CSPBi
This section uses the parameters provided in
Section 4.3 for quantitative analysis of the detection performance of YOLOV4_CSPBi.
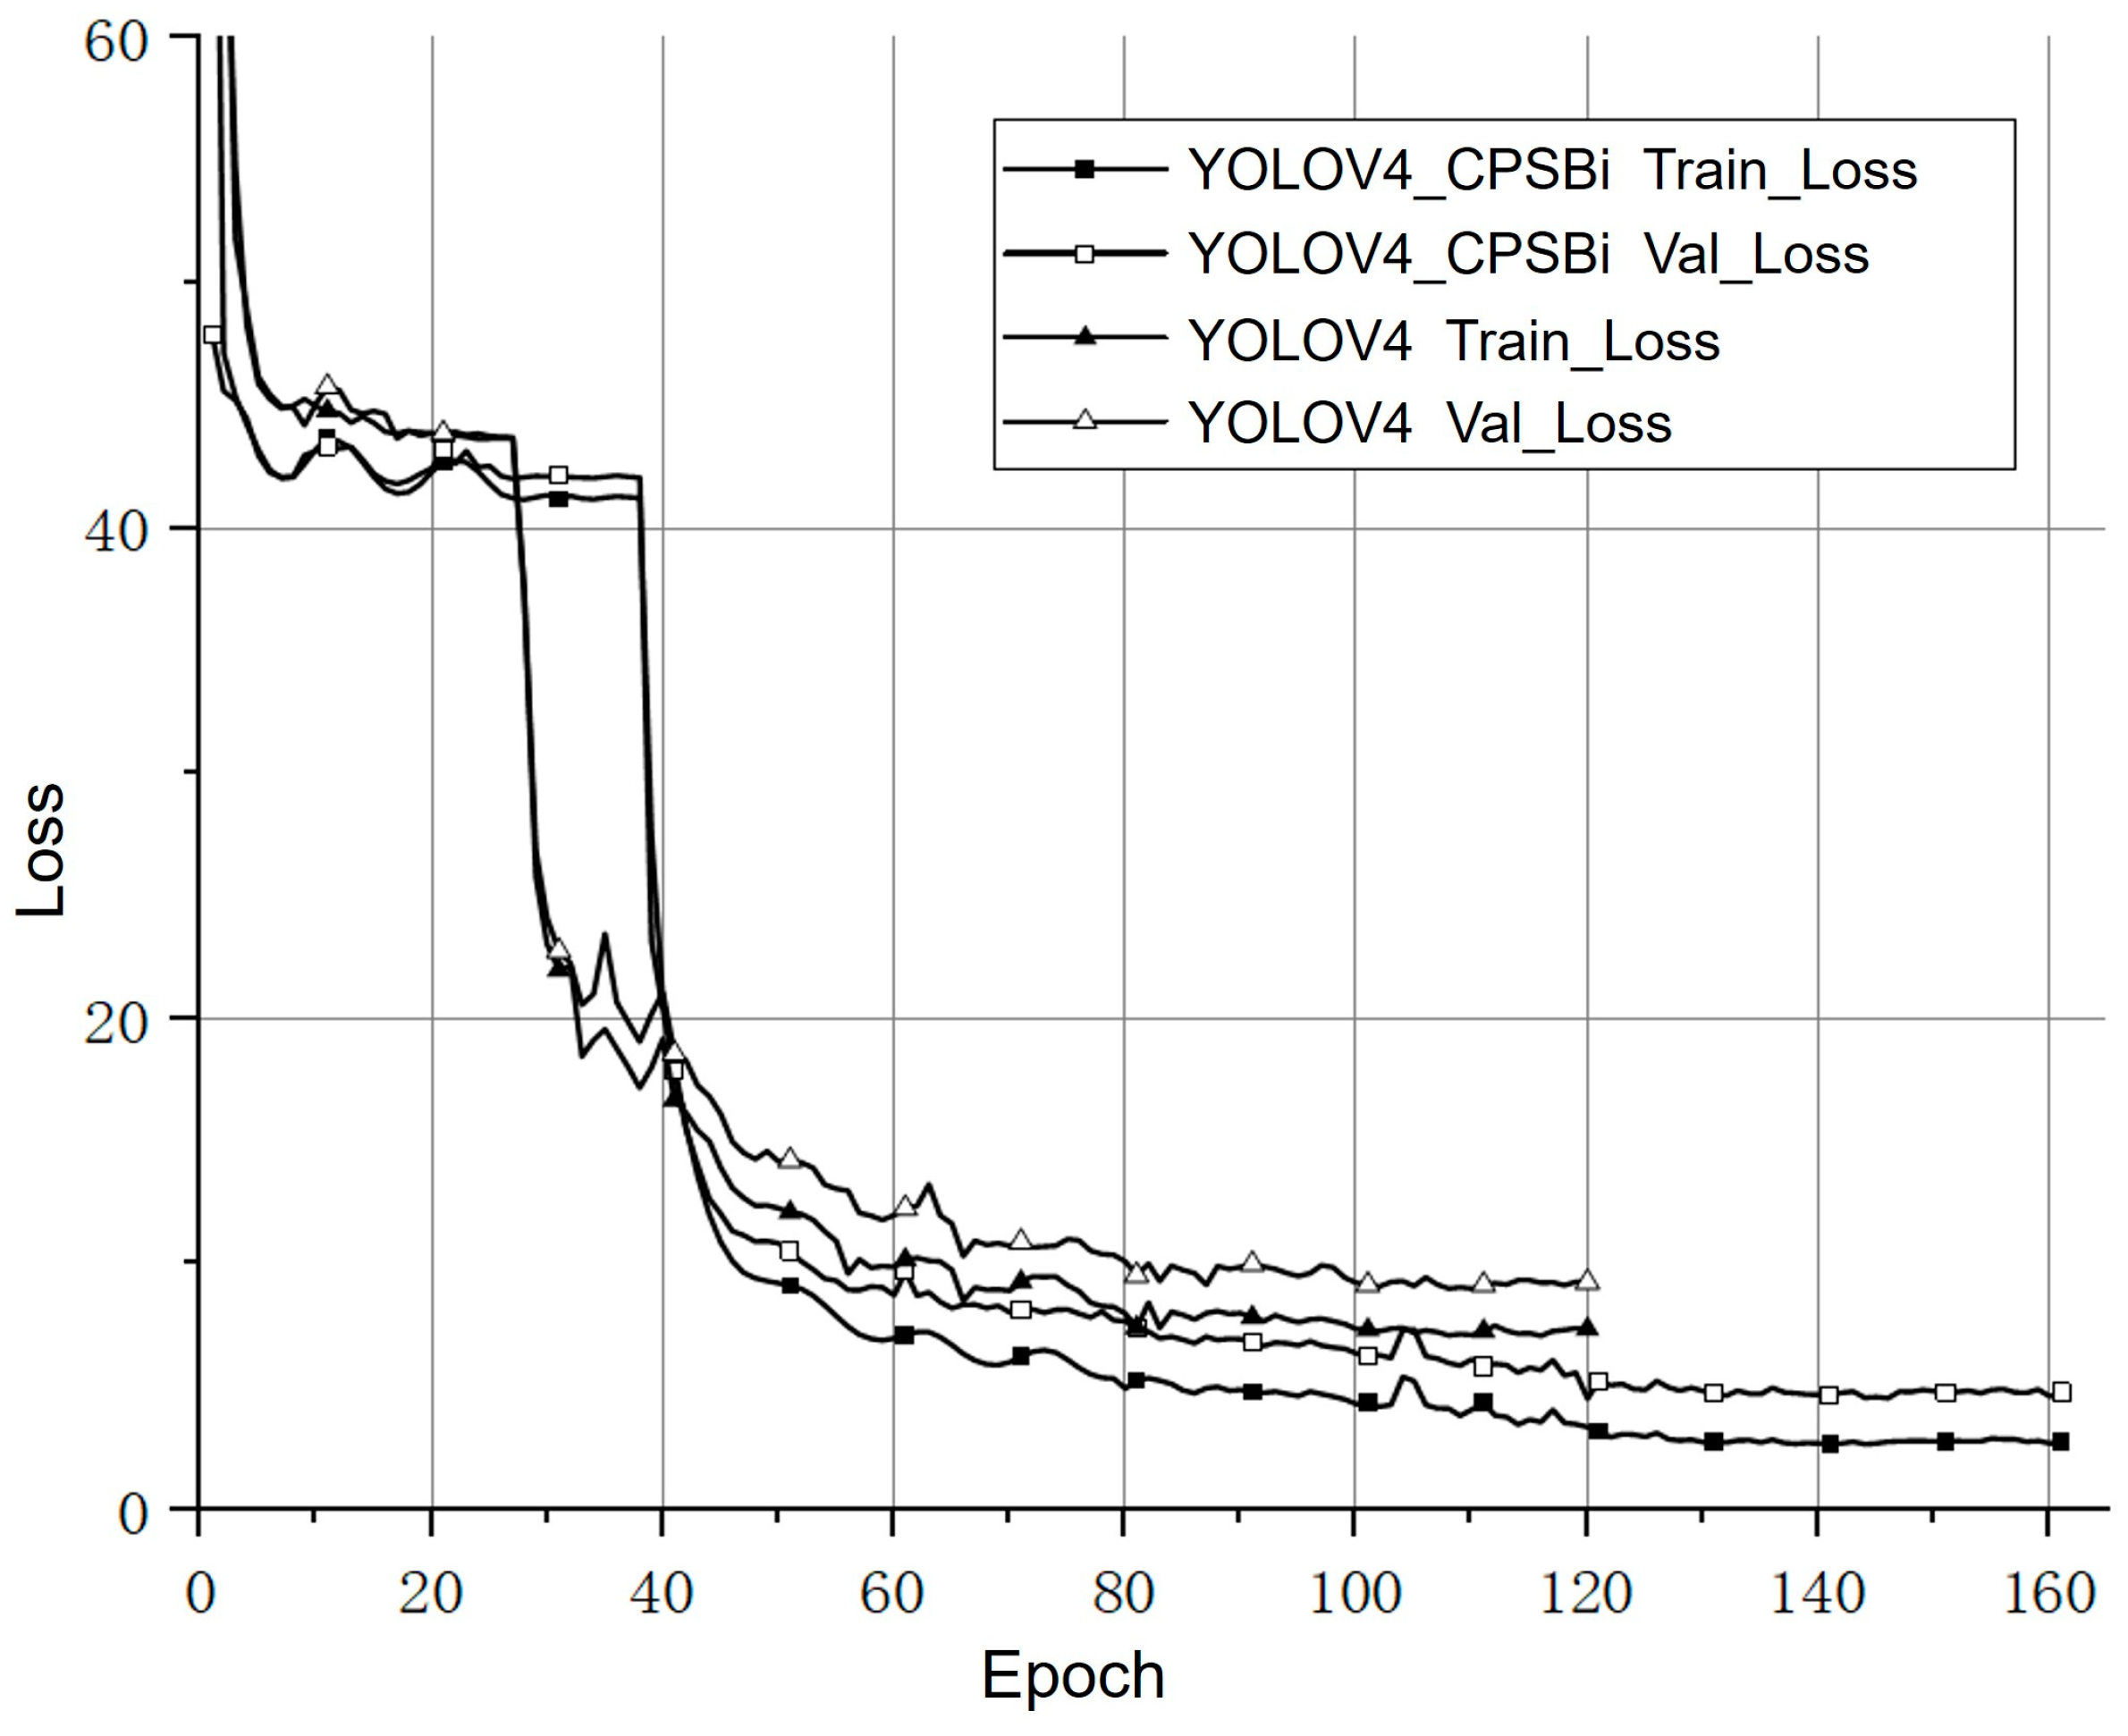
Figure 5 shows the Loss curves of the training process of the proposed model and the baseline model.
Figure 5 presents that during the phase of freezing the backbone characteristic extraction network due to the low degree of feature fusion of the traditional YOLOV4 network, the convergence of this training stage is entered earlier. The proposed YOLOV4_CPSBi model, by enhancing the reusability of feature details within the feature fusion network, triggers the Early_Stop mechanism later in the freezing stage of the backbone network and has a stronger learning ability.
From the experimental findings presented in
Table 5, it is evident that YOLOV4_CPSBi exhibits significantly enhanced target detection capabilities compared to YOLOV4.
The mAP metric has demonstrated an improvement of approximately 3.2% compared to the traditional YOLOv4 model. Moreover, across the majority of object categories, the proposed model exhibits notably superior detection performance. In the case of four specific object categories—large vehicles, harbors, ships, and helicopters—the detection AP has achieved enhancements of 6.3%, 6.6%, 8.0%, and 6.6%, respectively. These results vividly highlight the efficacy of the various enhancements introduced in YOLOv4_CPSBi.
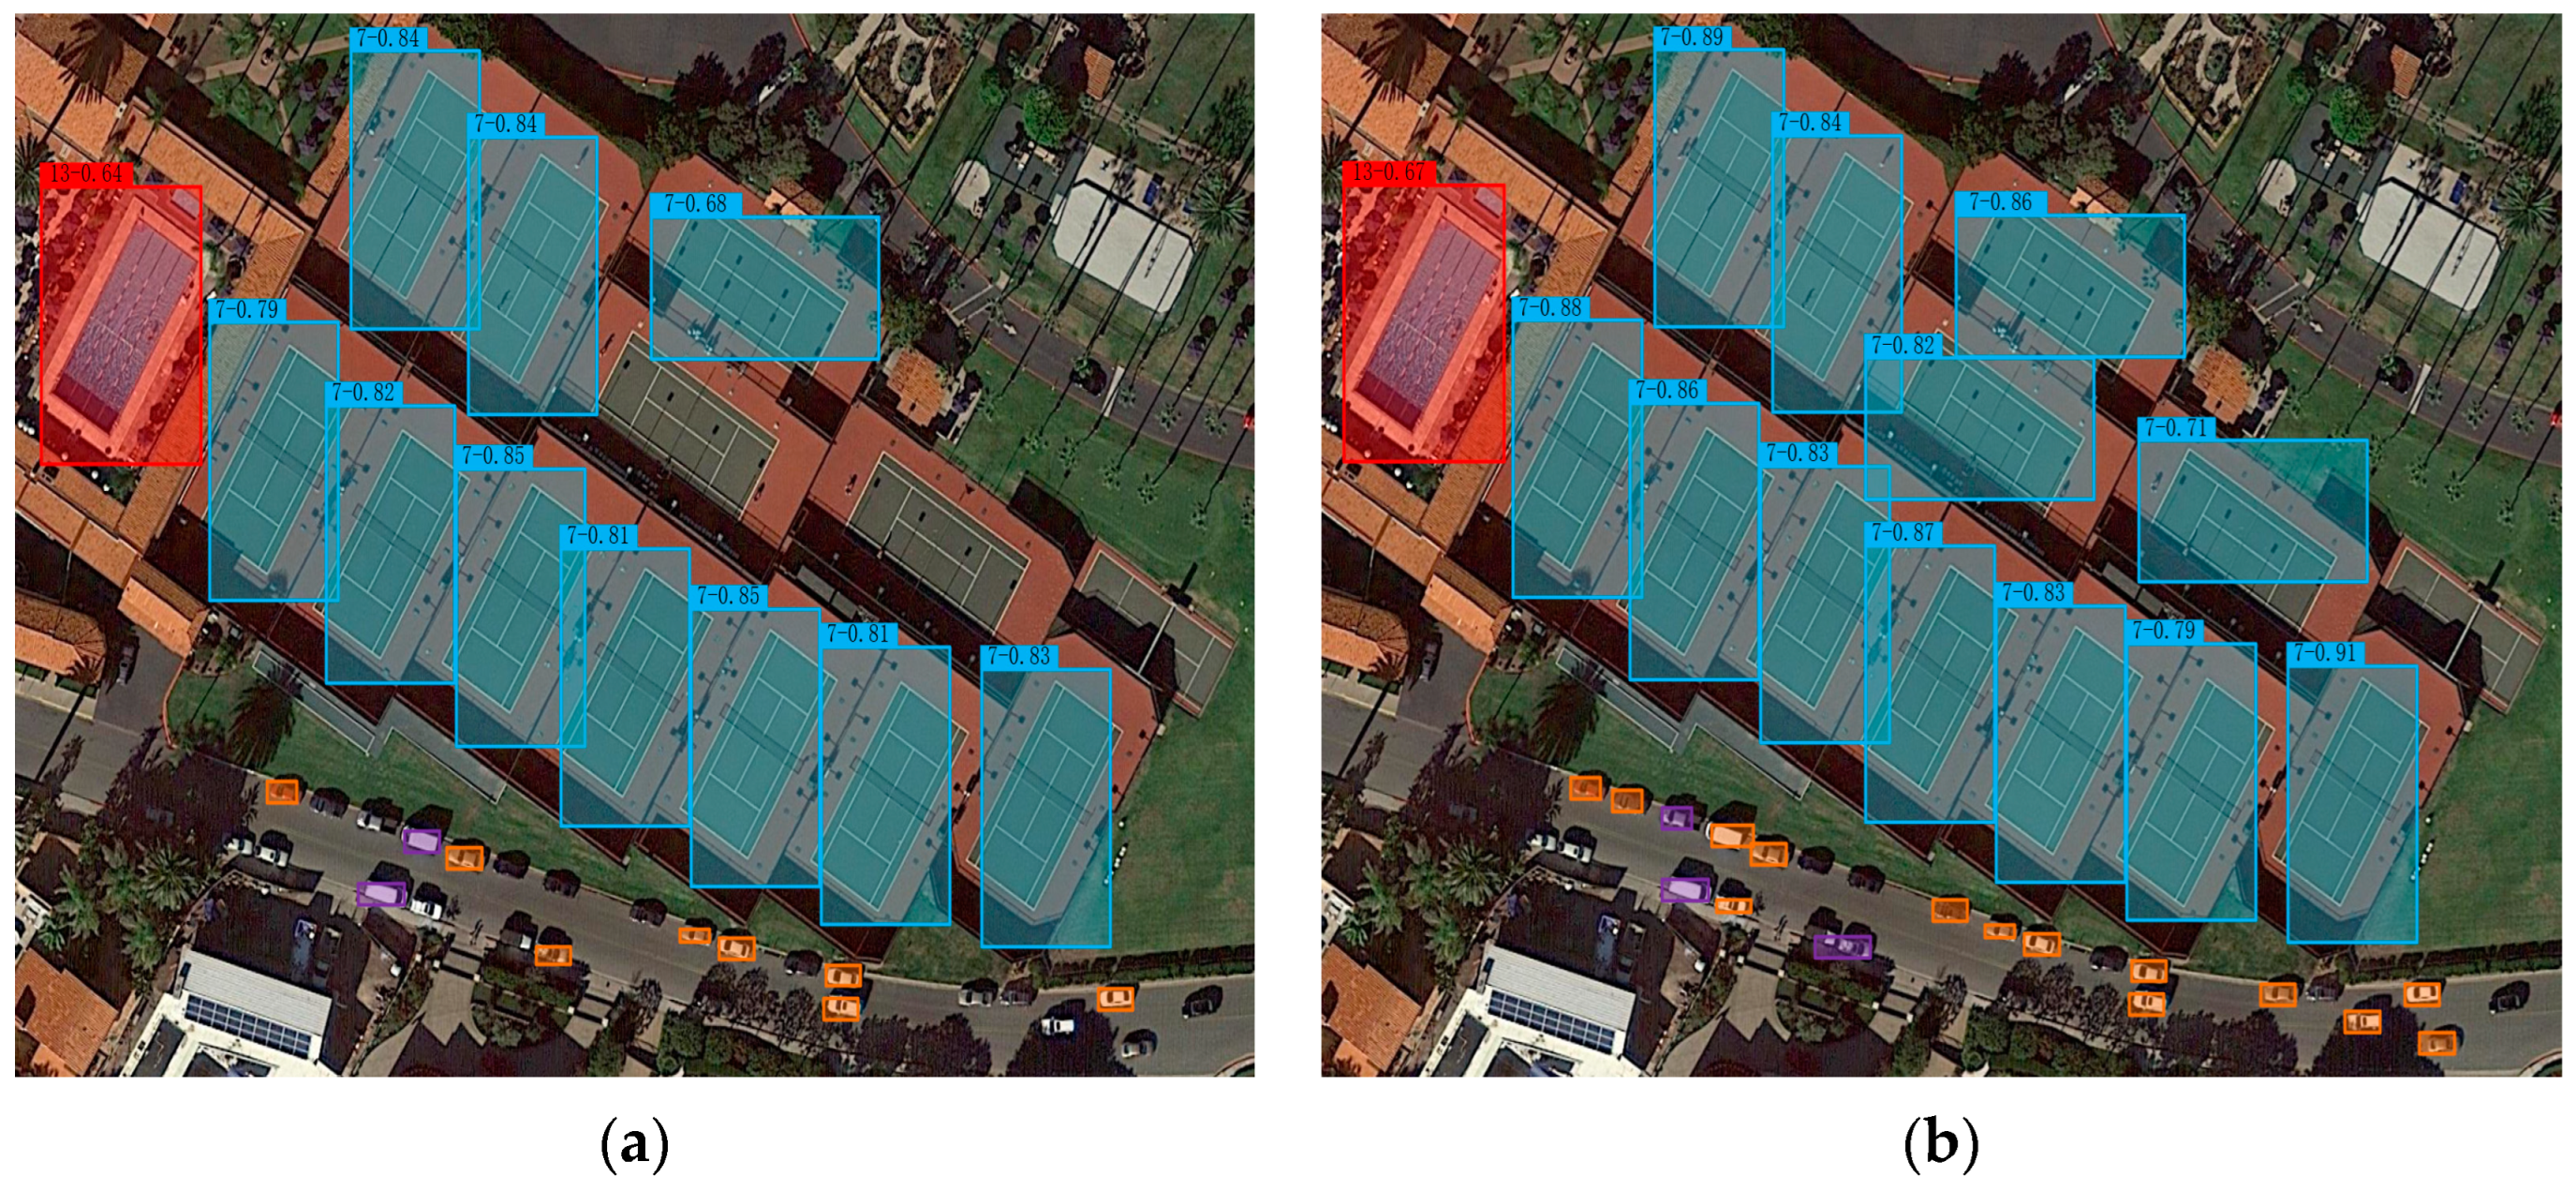
Figure 6 presents a visual illustration comparing the final detection outcomes.
Figure 6a showcases the detection effect obtained using the conventional YOLOV4 network, while
Figure 6b portrays the detection effect achieved by the YOLOV4_CPSBi network. The detection confidence of the traditional YOLOV4 network is generally lower than that of YOLOV4_CPSBi, and three tennis courts and a large number of car targets are missed. Among them, the reason for the missed inspection of the tennis courts is that the three tennis courts that were missed are all because their directions have changed greatly. However, the dataset used in this experiment has been enhanced and expanded on the features of rotation in similar directions, so it can be shown that the YOLOV4_CPSBi model has a stronger learning ability for this rotation difference feature than the traditional YOLOV4 network.
5.2. Ablation Experiment
This section primarily focuses on validating the impact of the Focal Loss [
34] and the two optimizers on both the baseline model and the proposed YOLOV4_CPSBi in terms of performance. Focal Loss is a specific loss function based on the target detection model, which addresses the uneven distribution of positive and negative samples while detecting the one-stage target. The loss function is a relatively simple sample image with a small loss weight. The method improves the detection success rate of difficult samples. Its formal expression is shown in Equation (9).
As shown in
Table 6. Adam and SGD optimizers have little effect on model performance, but the addition of Focal Loss greatly diminishes the model’s overall efficiency. This may happen because the Focal Loss incorrectly marks the correct samples of lower quality as Difficult, which instead makes the model pay more attention to some False Positives, resulting in an increase in the false positive rate. However, in view of the successful application of Focal Loss in the RetinaNet network, after fully studying its positive and negative sample calibration principle, it is theoretically possible to improve the difficult sample mining ability of the YOLO series network, which is also one of the directions that should be continued in the future.
In
Table 6, \ represents that Focal Loss is not used, and √ represents that Focal Loss is used. — represents no change; ~ represents the same level and little change; ↓ represents performance degradation.
5.3. Quantitative Analysis Detection Capability for Small and Medium-Sized Objects
Since YOLOV4_CPSBi has made adaptive improvements for remote sensing images with small and dense targets, this paper focuses on the comparison of the detection performance in the DOTA dataset specifically for small and medium-scale objects, employing the same type of network. The scales are divided into small-scale objects (S, image size less than 56 × 56 pixels), medium-scale objects (M, image size less than 126 × 126 pixels), and large-scale objects (L, image size larger than 126 × 126 pixels).
In this experiment, YOLOV3, YOLOV4, SSD, and RetinaNet of the same type as YOLOV4_CPSBi were selected as comparison models. These models are all representative networks of the one-stage target detection model. The main advantage is that the network performs the inference task of classification and localization, and the speed of object detection is higher than that of other types of networks.
Table 7 presents the comparative data of this experimental study, wherein AP_L, M, and S denote the average precision values for large, medium, and small scales, respectively.
It is evident from the results that YOLOV4_CPSBi, which eliminates the horizontal feature fusion connection in the large-size target detector, exhibits a slight decrease in AP_L. However, it demonstrates a notable enhancement in the detection capability of AP_M and AP_S, particularly in detecting small targets, where its AP performance shows an improvement of nearly 8% compared to YOLOV4.
S2ANet is specifically designed for rotating object detection in aerial images, so it may perform better in the presence of some oriented objects. However, the method proposed in this article is designed for small and dense objects rather than directional objects, so there are certain differences from S2ANet on the DOTA dataset.
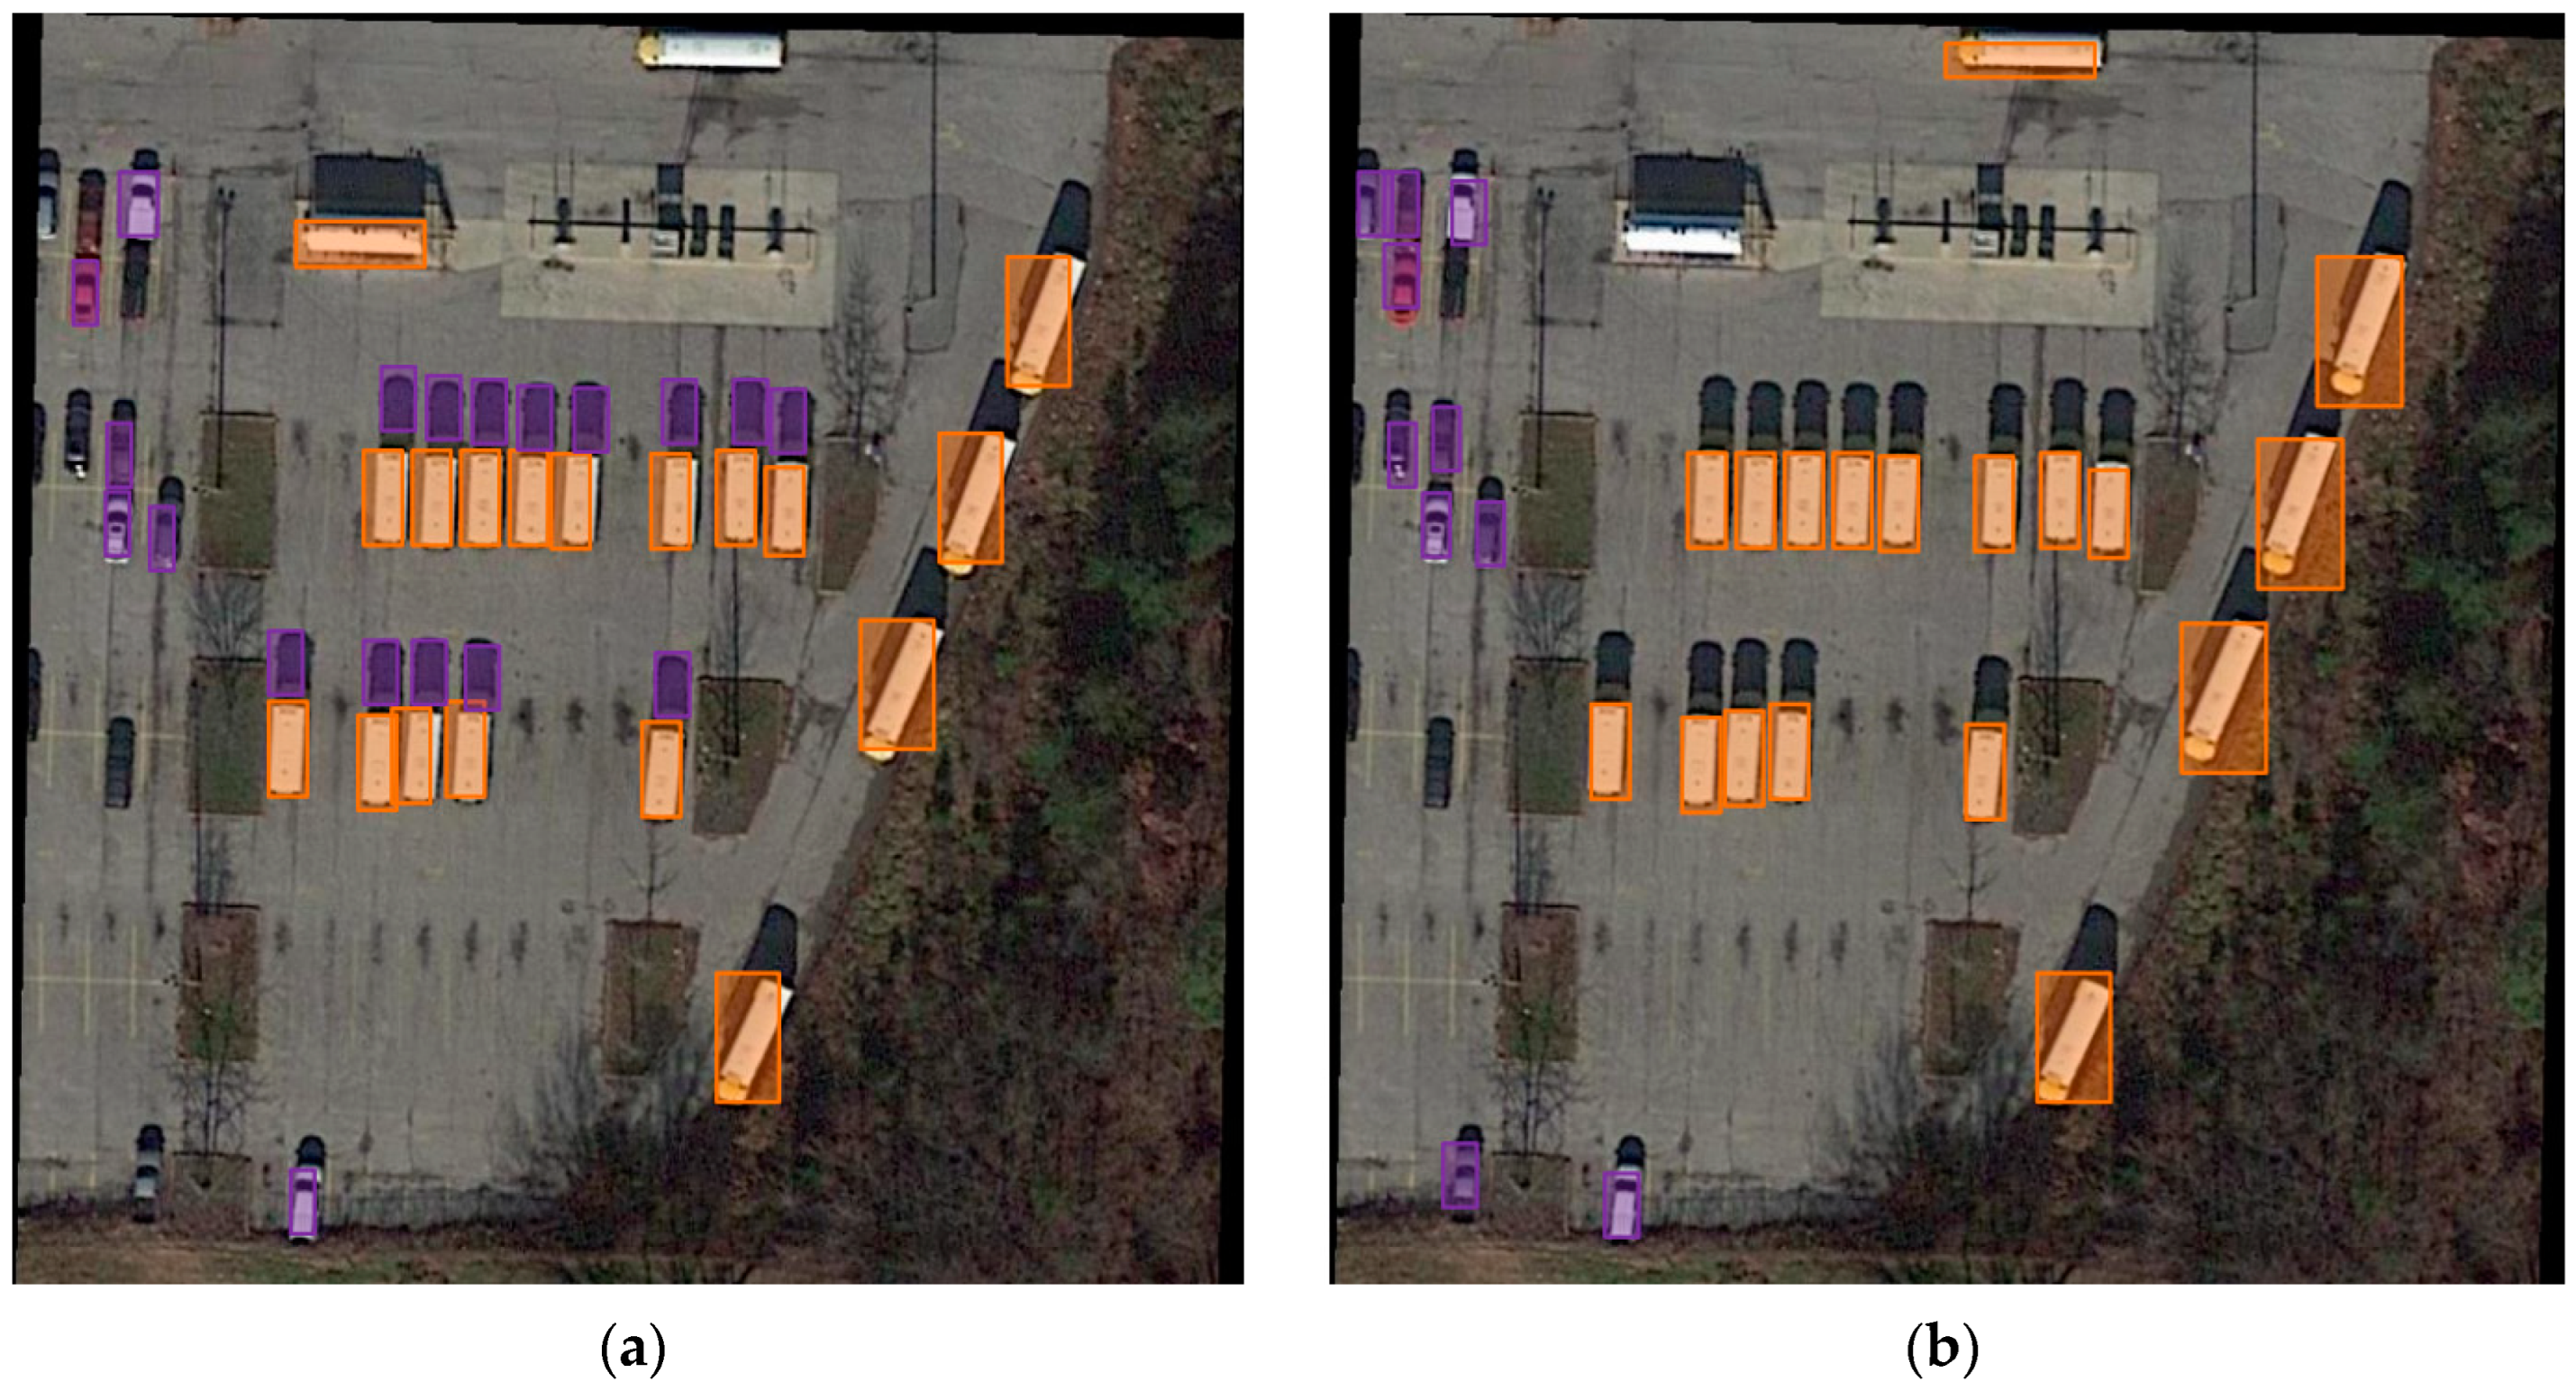
Based on the favorable performance indicated in the table, this paper selects YOLOV4 and YOLOV4_CPSBi for further visual comparison when faced with a substantial amount of small and densely distributed detection samples, as depicted in
Figure 7.
Figure 7a represents the detection outcomes of the YOLOV4 network, while
Figure 7b corresponds to the detection results of the YOLOV4_CPSBi network. Notably, the orange boxes indicate Large-Vehicle (LV) targets, while the purple boxes represent Small-Vehicle (SV) targets. It is evident from the visual analysis that YOLOV4_CPSBi exhibits higher detection accuracy for small targets. YOLOV4 missed 6 cases of SV targets and 1 case of LV targets, while YOLOV4_CPSBi only missed 2 cases of SV targets.
Moreover, in
Figure 7, a noticeable observation can be made regarding the stronger robustness of the YOLOv4_CPSBi network. The YOLOv4 network demonstrates a significant number of false positives in the detection image, inaccurately classifying 13 instances of negative samples as Small-Vehicle targets and 1 instance of a negative sample as a Large-Vehicle target. In contrast, the detection results of YOLOv4_CPSBi do not exhibit any misclassifications. This further validates that the improvements made in this study to the YOLOv4 network’s feature fusion aspect have successfully enhanced the model’s detection performance and robustness concerning medium to small-scale objects.
7. Conclusions
The detection of targets within optical remote sensing images holds significant implications across both civilian and military contexts. This study centers on the intricate challenge presented by the identification of small and densely clustered land targets within such images. To address this challenge, we propose an enhanced target detection network, denoted as YOLOV4_CPSBi, which builds upon the conventional YOLOV4 network. This novel network architecture enhances convolution computations and augments the technique of feature fusion. Furthermore, it fosters improved feature information utilization by employing a bidirectional cross-scale weighted connection approach.
The efficacy of the proposed model approach is substantiated through an exhaustive array of comparative experiments, establishing its prowess in target detection. In particular, the mAP metric of the proposed model when applied to the DOTA dataset surpasses that of the conventional YOLOV4 model by a margin of 3.2%. This augmentation in performance is consistently pronounced across numerous target categories, with a notable boost observed in the detection accuracy for objects such as carts, ports, ships, and helicopters. Impressively, the detection AP for these target categories demonstrates improvements of 6.3%, 6.6%, 8.0%, and 6.6%, respectively.
Additionally, the YOLOV4_CPSBi model showcases remarkable advancements in its detection capabilities, particularly in the context of AP_M and AP_S, attributes that are especially pertinent to small-scale target identification. Comparative evaluation indicates a nearly 8% enhancement in AP performance when juxtaposed with YOLOV4. Collectively, these results validate the substantial enhancement that the proposed model brings to land object detection tasks in optical remote sensing images. Notably, its heightened robustness concerning medium and small-scale target recognition reinforces its utility and efficacy in this domain.


 ,
, 


