Article

The Role of Historical Data to Investigate Slow-Moving Landslides by Long-Term Monitoring Systems in Lower Austria

Geomorphological Systems and Risk Research, Department of Geography and Regional Research, University of Vienna, Universitätsstraße 7, 1010 Vienna, Austria
*
Author to whom correspondence should be addressed.
Land 2023, 12(3), 659; https://doi.org/10.3390/land12030659
Submission received: 31 January 2023 / Revised: 4 March 2023 / Accepted: 7 March 2023 / Published: 11 March 2023

Abstract

:
Landslides are one of the most significant natural hazards worldwide. They can have far-reaching negative impacts on societies in different socio-economic sectors as well as on the landscape. Among the different types and processes that can also affect infrastructure and land use planning, slow-moving landslides are often underestimated. Therefore, studying areas affected by slow movements provide an opportunity to better understand the spatial and temporal patterns of these processes, their forcings, mechanisms, and potential risks. This study aims to investigate the importance of historical data for improving landslide hazard assessment in Lower Austria (Austria), which is particularly prone to landslides. This paper focuses on how historical information formed the basis for the establishment of three long-term landslide monitoring observatories in this region. The analysis conducted highlights the importance of using historical data to better assess the frequency and magnitude relationships and phases of landslide activity. In particular, they can extend the temporal window and provide relevant information on past events and accelerations to improve knowledge of landslide dynamics and the resulting socio-economic impacts. In order to better assess the landslide hazard associated, it is necessary to integrate historical data and monitoring datasets obtained by surface and subsurface methods. Both components allow for the characterization of the spatio-temporal evolution of slow movements and the analysis of the hazard over time. Based on a variety of historical sources, it was possible to install the instruments constituting the long-term landslide monitoring observatories in a meaningful manner. The results demonstrate the influential role of human impact on the stability conditions, which may also contribute to landslide occurrence. In this regard, the attempt to combine historical data and long-term, continuous monitoring systems in the presented landslide observatories can improve landslide risk reduction measures in the region. The integration of different techniques and tools, along with ongoing research and collaboration with local authorities, will further improve our understanding of these slow-moving processes and the development of effective management strategies.

1. Introduction

Natural hazards, such as landslides, have been well known for many decades to pose a serious threat to societies, communities, and individuals worldwide [1,2,3]. Due to the increasing population pressure and the need for infrastructure, e.g., for transportation systems and agricultural purposes, natural hazards pose a growing threat within various socio-economic dimensions [4,5]. Indeed, landslide phenomena have been increasingly reported in recent decades, causing damage or threatening society in manifold ways [3]. In addition, global climate change is expected to lead to an increase in the frequency and intensity of landslides, potentially leading to increased negative impacts on society in the future [6,7].
According to Cruden and Varnes [8] and Dikau et al. [9], landslides are defined as the movement of rock, debris, or earth down a slope. Only in the case that humans and/or anthropogenic structures are negatively affected the event will be considered a hazard [10]. Landslides are dynamic systems that commonly occur on hillslopes and in mountainous regions worldwide and are important contributors to landscape evolution [11,12]. These natural phenomena encompass a wide range of mechanisms and processes at different spatial and temporal scales [2]. As a result, understanding the temporal evolution of slope instabilities is a difficult task, as combinations of different controlling factors could exist. Three important factors have been identified to be critical in the kinematic transition from a stable to an actively unstable slope: (i) preconditioning, (ii) preparatory, and (iii) triggering factors [2]. These factors are dynamic, and the inter-dependencies of natural processes and human activities have influences on the spatio-temporal occurrence of landslides [13]. Assessing the driving mechanisms that are causing the instability is useful to deepen hazard analysis and determine adaptation and mitigation strategies to lower the vulnerability of the elements at risk.
In order to reliably assess the driving mechanisms, the hazard, and the consequent risk of current and future landslides, historical data can be of key value [12,14]. In many cases, historical information is an important tool for land use planning and disaster risk mitigation management that should be integrated into the methodological approaches [15]. Historical data can be divided into four categories [16]: (i) data that directly record the occurrence of the event, e.g., drought, flood, landslide, and erosion rates; (ii) data that can be used to identify causal factors, e.g., climatic records; (iii) data that provide additional relevant information, e.g., geological surveys; and (iv) phenomenological data that account for temporal variability of the phenomenon, e.g., groundwater response to precipitation.
However, there is skepticism about the reliability of historical data [17]. Historical data can sometimes omit relevant evidence about the location, date, magnitude, and duration of the event. In addition, each archive has specific temporal and spatial information that makes it difficult to build a homogenous database. Furthermore, most historical archives are biased and record only unusual or catastrophic events, omitting isolated events or those that occurred in uninhabited areas [17,18]. Despite these criticisms, some studies have demonstrated the potential of using historical data for landslide hazard assessment, e.g., in Germany, New Zealand, and Italy (e.g., [19,20,21,22]).
Historical data provide important information about landslide activity and processes over a long period of time; however, they are not self-sufficient. In most cases, they are used to complete and enhance the information obtained from geological and geomorphological analyses. Nevertheless, historical data can also be incorporated into landslide monitoring. A continuous record of long-term monitoring is necessary to provide an unbiased temporal database. Furthermore, near-real-time monitoring can provide high-quality data to better understand the dynamics of active landslides and to develop more effective landslide mitigation and adaptation measures, such as early warning systems [23]. Landslide monitoring systems are used worldwide to detect and predict landslide activity [23]. Ground-based landslide monitoring systems typically consist of field sensors on or within the landslide-prone area, a data acquisition system to sample and control the sensors, a communication system to connect data from the field to base-station computers, and software for data processing and dissemination at a base station [23].
The design and implementation of a long-term monitoring system depend on specific considerations based on historical information that vary from site to site [23]. First of all, it is important to take into account the aim of the monitoring, to pinpoint the timing of landslide events, to gather information on the type of landslide to be monitored, the involved material, the activity status, and the physical setting on the site [23,24].
For evaluating the frequency of landslides in a particular area, it is vital to incorporate historical data in the analysis [12]. The availability and quality of historical data are very different and vary from case to case. There are prominent landslides that were dated thousands of years back with geochronological techniques and other events during the last centuries were reported in newspapers or documented by historians [25,26]. Historical data about landslide hazards were also collected in Austria, in particular in Lower Austria, which is highly prone to landslide events [27,28,29]. However, there is a lack of studies compiling previous works and data as a basis for the establishment of long-term monitoring systems for landslide hazard assessment.
The European Alps, Austria in particular, are highly impacted by natural hazards affecting settlements and infrastructure [30]. Its topography is characterized by a variety of morphological landscapes, from alluvial flat areas to high-alpine landscapes, in which landslides represent a significant threat to private and public infrastructures, possibly influencing the socio-economic setting. The landslide occurrence in Austria is conditioned by a number of factors, including lithology, geomorphology, and human impact [31]. Deep-seated and shallow landslides are common in many regions of Austria, in particular in those areas situated in areas of the Central Alps comprised of metamorphic rock types and the Flysch Unit (e.g., Lower Austria) [32]. In addition to landslide susceptibility, the infrastructure at risk in Lower Austria is interesting due to the continuing economic losses due to landslides and the availability of historical data [33,34]. As a result, the exposure to landslide hazards considerably involves human activities and local authorities dealing with mitigation actions within the Lower Austrian territory [33,35,36].
Among the different types of landslides occurring in Lower Austria, understanding the dynamics of slow-moving landslides is of particular interest. Considering the difficulties in real-time monitoring of rapid landslides, slow-moving processes provide the opportunity to better study landslide dynamics over a long period of time [37]. Furthermore, the study of these processes is essential because they have often been identified as early deformation signals for fast-moving landslides or cascading hazards that could have catastrophic effects [37]. Complexity and non-uniform spatial and temporal kinematics of slow movements preclude the use of short-term measures to assess landslide processes [37,38]. For this reason, it is important to integrate available historical data with long-term, multi-parameter monitoring approaches in order to assess and mitigate the potential landslide hazard [39,40].
This study aims to prove the importance and added value of the integration of historical data in the long-term continuous monitoring process to improve the hazard assessment of three slow-moving landslides in Lower Austria. The monitoring setups and strategies are similar across the three sites, so-called landslide observatories, in Lower Austria (Hofermühle, Gresten, and Brandstatt observatories). All sites share the use of a variety of methods and sensors to monitor changes in both surface and subsurface conditions. This approach allows us to assess the spatial and temporal relationships between displacement rates and hydro-meteorological inputs, as well as potential land use changes to landslide dynamics. The objectives of this study are threefold:
  • To gather historical data of landslide events in an inventory and to analyze their characteristics in each of the three study sites in Lower Austria.
  • Assess how historical data played an important role in the landslide hazard assessment, in the selection of the study sites in Lower Austria, and the implementation of different methods within the monitoring systems.
  • Explore how historical data lead to coping and response strategies in planning decisions.
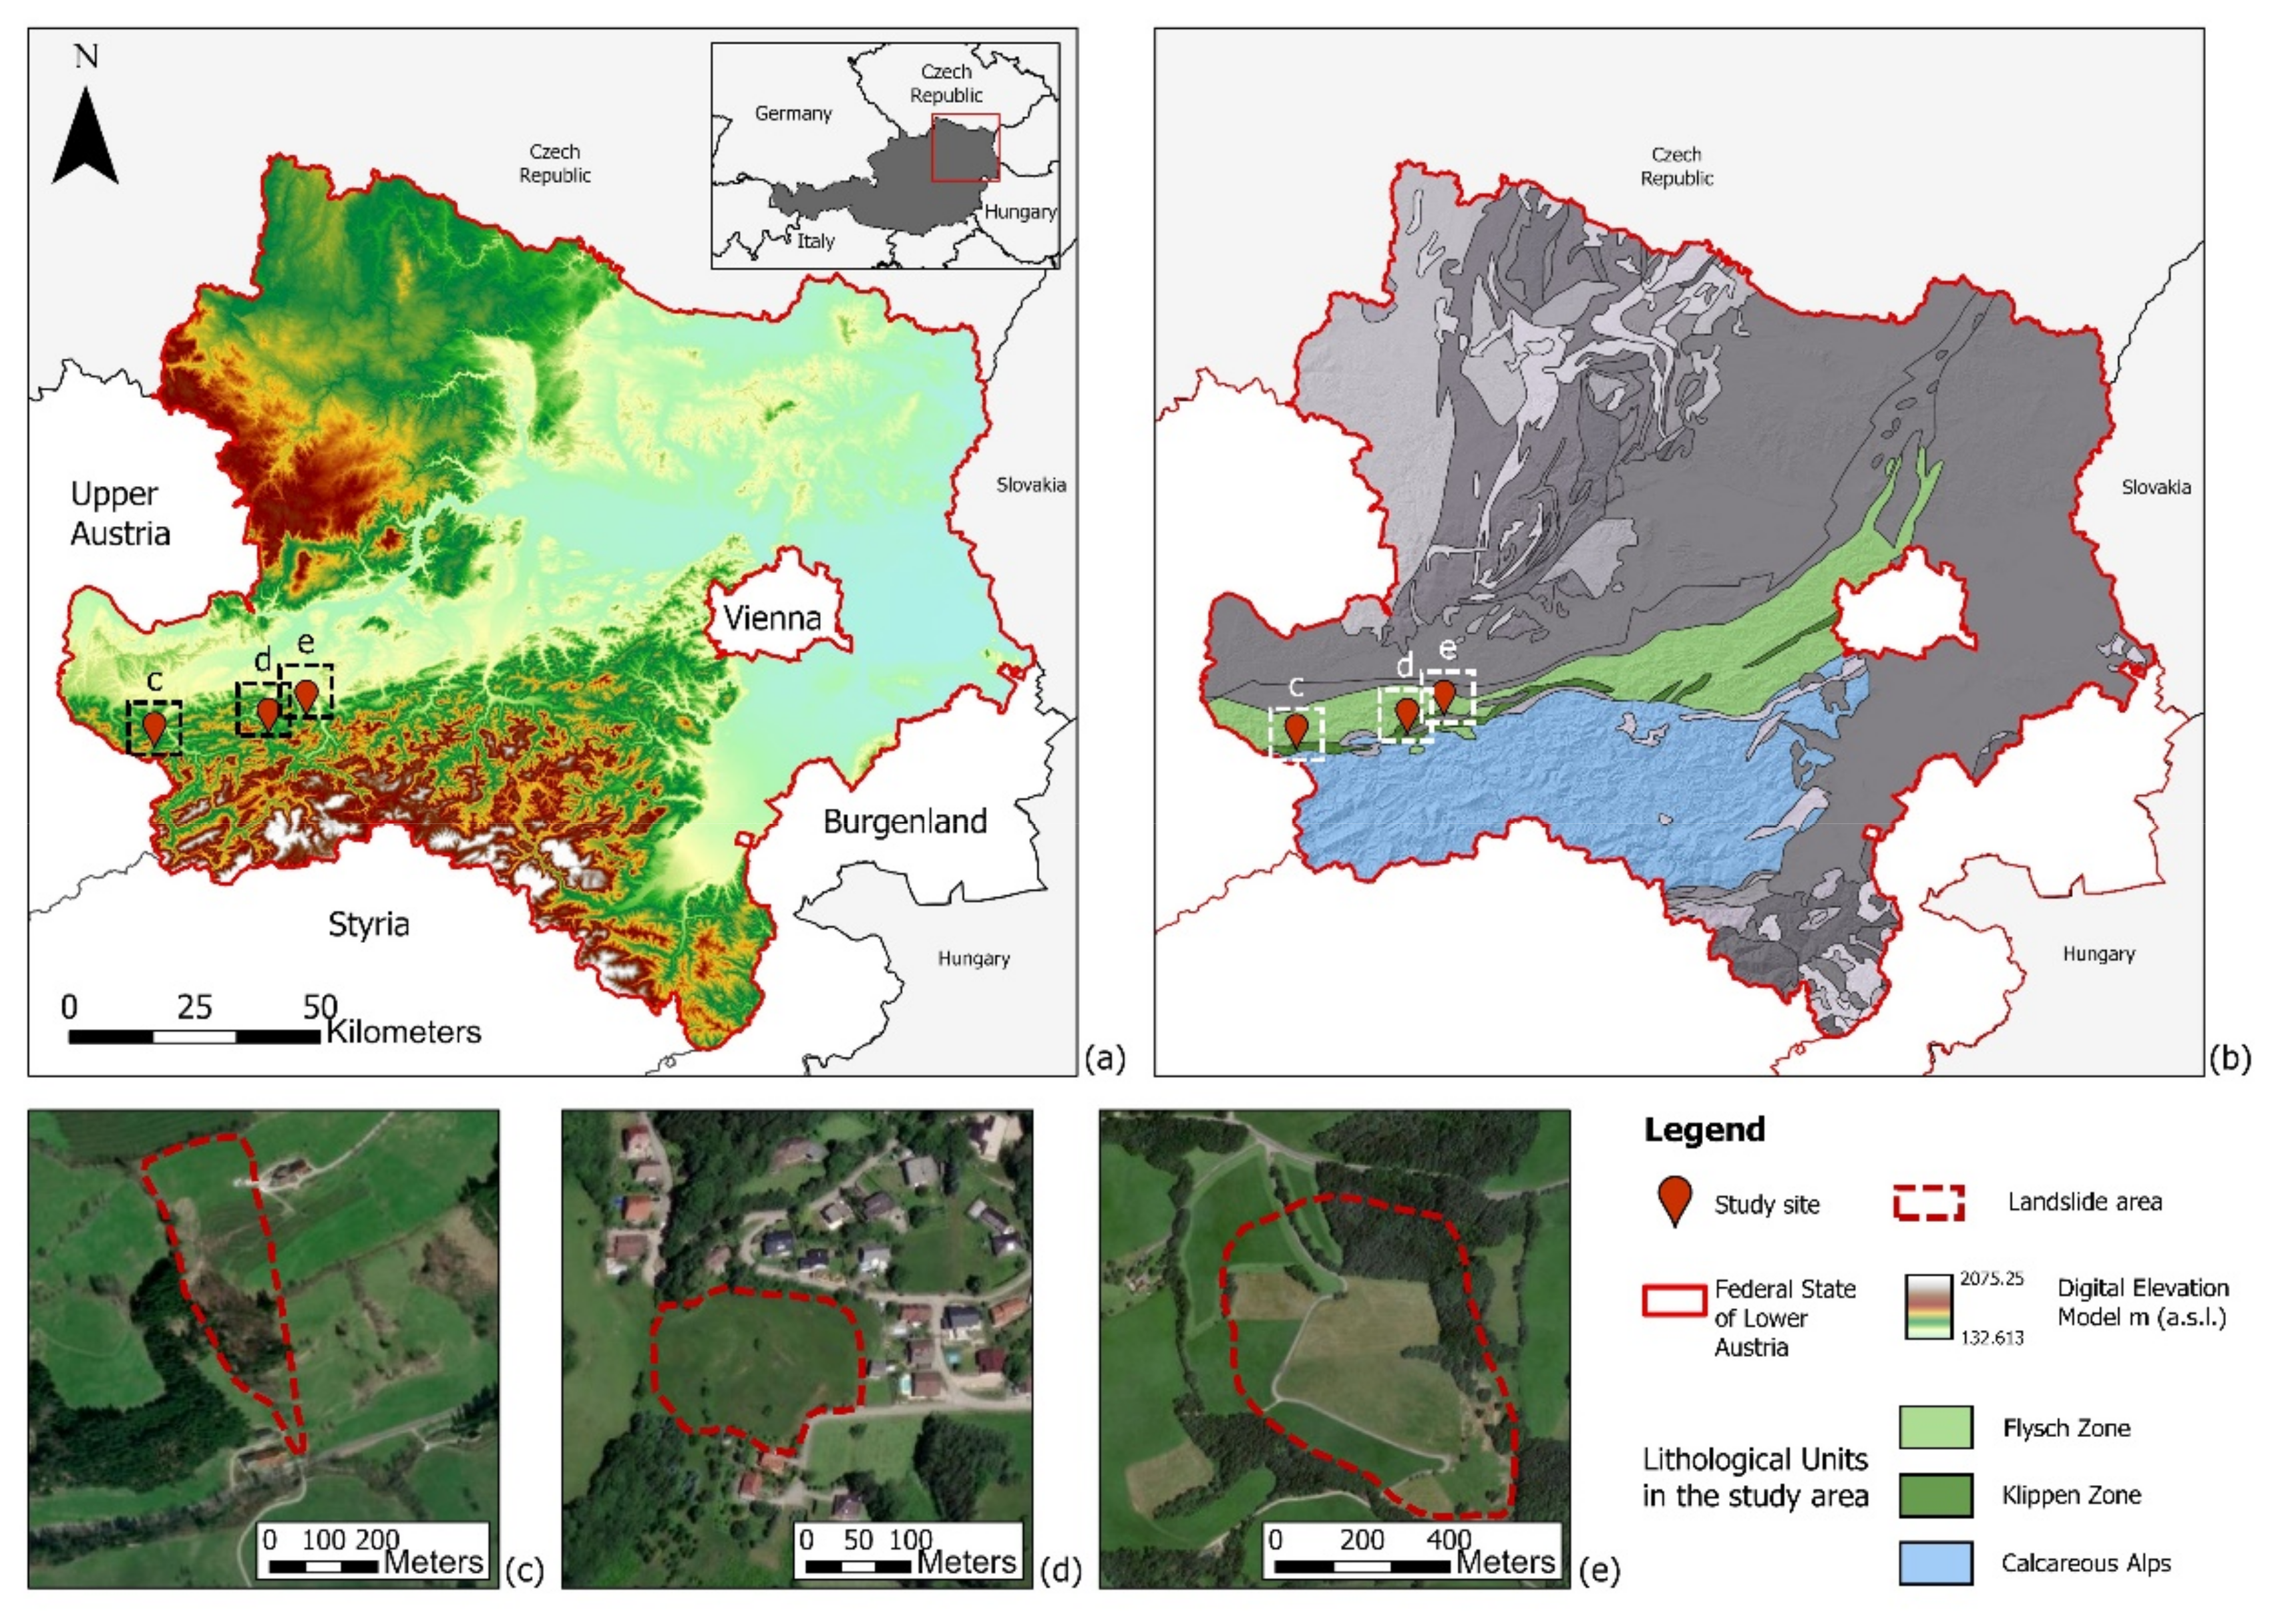
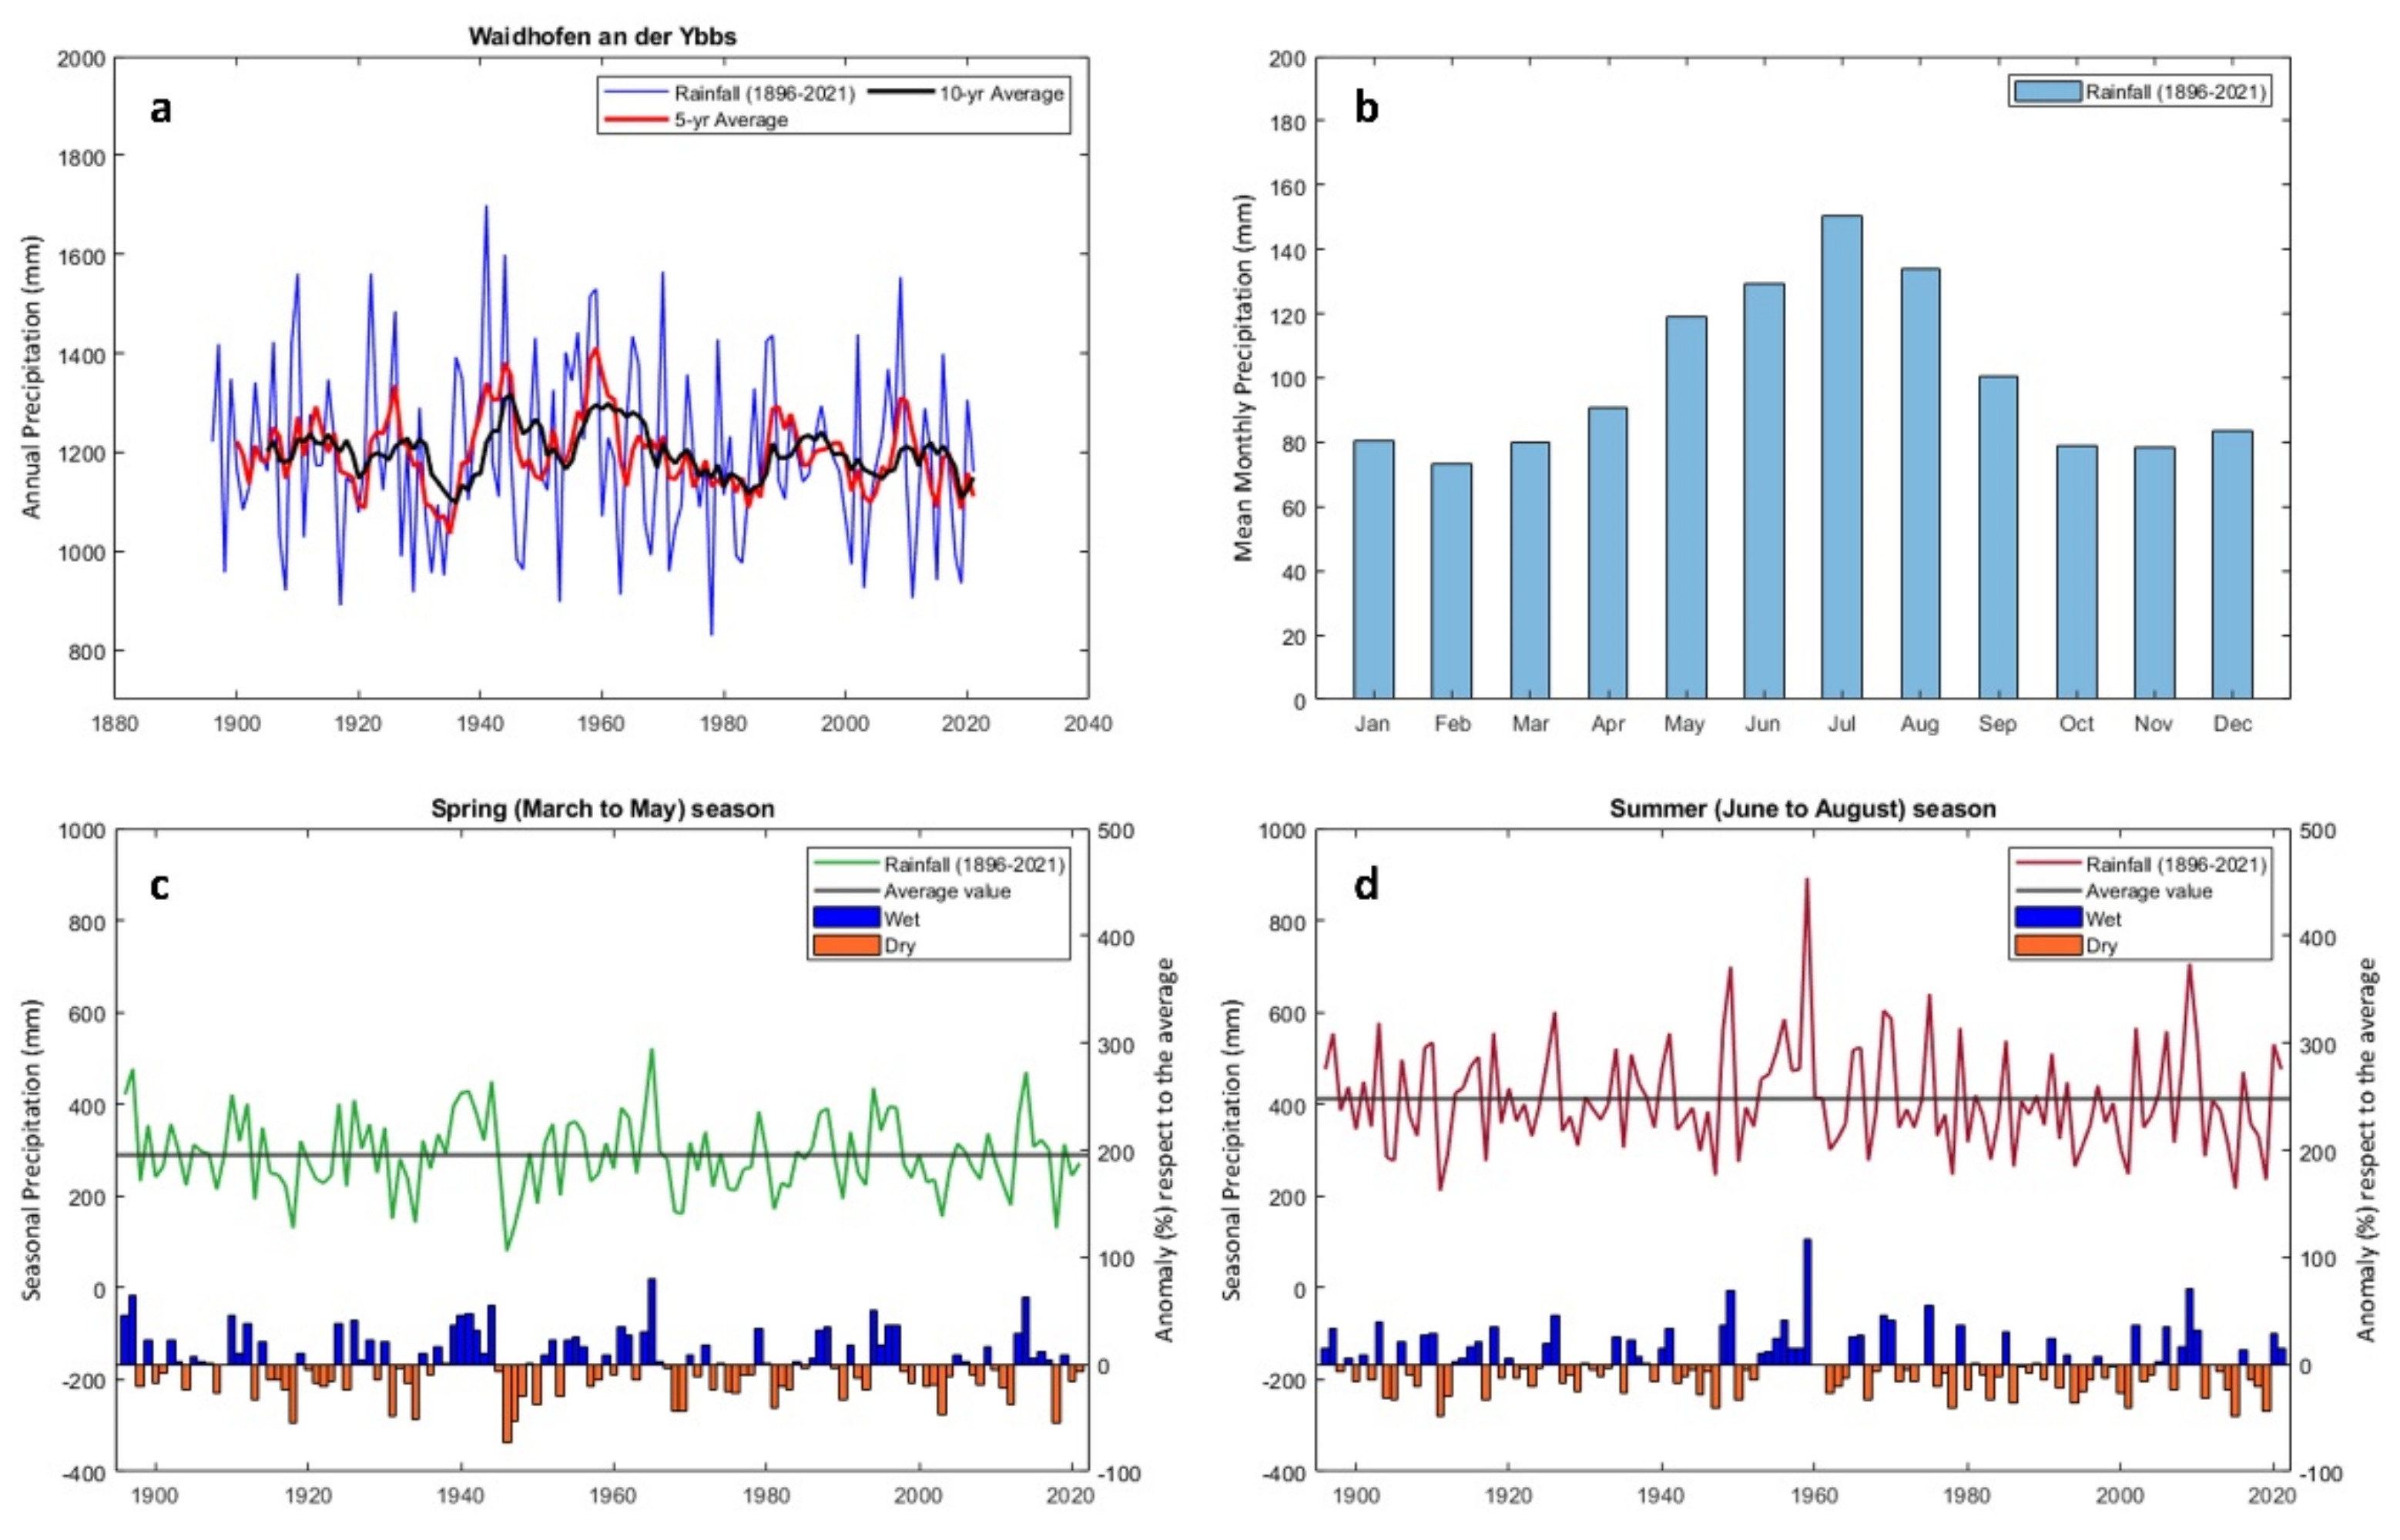
2. Study Area

The landslide observatories presented in this study are situated in the federal state of Lower Austria. This region covers a total area of approximately 19,000 km2 in north-eastern Austria (Figure 1a,b). The three landslide observatories under investigation are introduced in the next sub-sections as Hofermühle, Gresten, and Brandstatt, respectively (Figure 1c–e). These sites are comparable in terms of natural settings (geological and climatic conditions), land use, and anthropogenic influences, such as drainage systems. However, they show distinct site-specific differences in the number of landslide subsystems, spatial extent, and dynamics.
The study sites are located in a complex geological setting, and it represents the most important predisposing factor driving the landslide occurrence and activity in the region [28,43,44,45]. Most of the complex, hydrologically triggered slope instabilities described in the previous studies in Lower Austria are predominantly located in the transition zone between the Flysch Zone (FZ) and the Klippen Zone (KZ) Units and the Northern Calcareous Alps (NCA) Unit (Figure 1b). Due to the high content of clay minerals and the corresponding weathering products, the geo-mechanical behavior of these lithological units prompts this area to landslide processes [28,45]. Actually, of the 1100 landslides registered in Lower Austria from 1965 to 2006, 62% were reported in the FZ (42%) and KZ (20%) [46].
Climate conditions are driving both the weathering and the triggering mechanisms of slope instabilities affecting the FZ and KZ lithologies in the study area. Here, the main triggering factors of landslide activity include long-lasting heavy rainfall and rapid snow melting [29,31]. The study area is located in the NE Alpine foreland and it is characterized by a warm temperature and humid climate. Long-term precipitation time series are available from the Histalp project (www.zamg.ac.at/histalp) in order to assess patterns and trends within the European Alps. Here, it is assumed that the meteorological station located in Waidhofen an der Ybbs is a representative location to properly identify the hydro-meteorological setting of the landslide observatories presented (Figure 2) due to its proximity to the three study sites.
However, since the snow height has not been continuously monitored over time, insights from the contribution of snow melting from the past cannot be proved, but its influence is reported [31,47]. The mean annual precipitation rate is approximately 1197 mm/year (period 1896–2021; data obtained from Histalp project). Although the annual precipitation recorded an alternation across the average value in recent years, the analysis of the rainfall time series exhibits a trend of increased precipitation in the 10-yr average value, especially after 2019 (Figure 2a). Monthly mean precipitation amounts are also reported (Figure 2b), in which summer (June to August, 413 mm) is the dominant precipitation season, and an increasing trend from March to July is evident. Notable changes have not been found in the analysis of the spring season (March to May) time series, where a fluctuation between the dry and wet seasons occurs (Figure 2c). The most interesting and evident changes are shown in the summer season time series (Figure 2d), in which dry periods have become dominant since the late eighties. However, an increasing trend in the precipitation amounts was recorded in the period 2002–2009, showing the highest recorded summer sum of 706 mm in 2009.

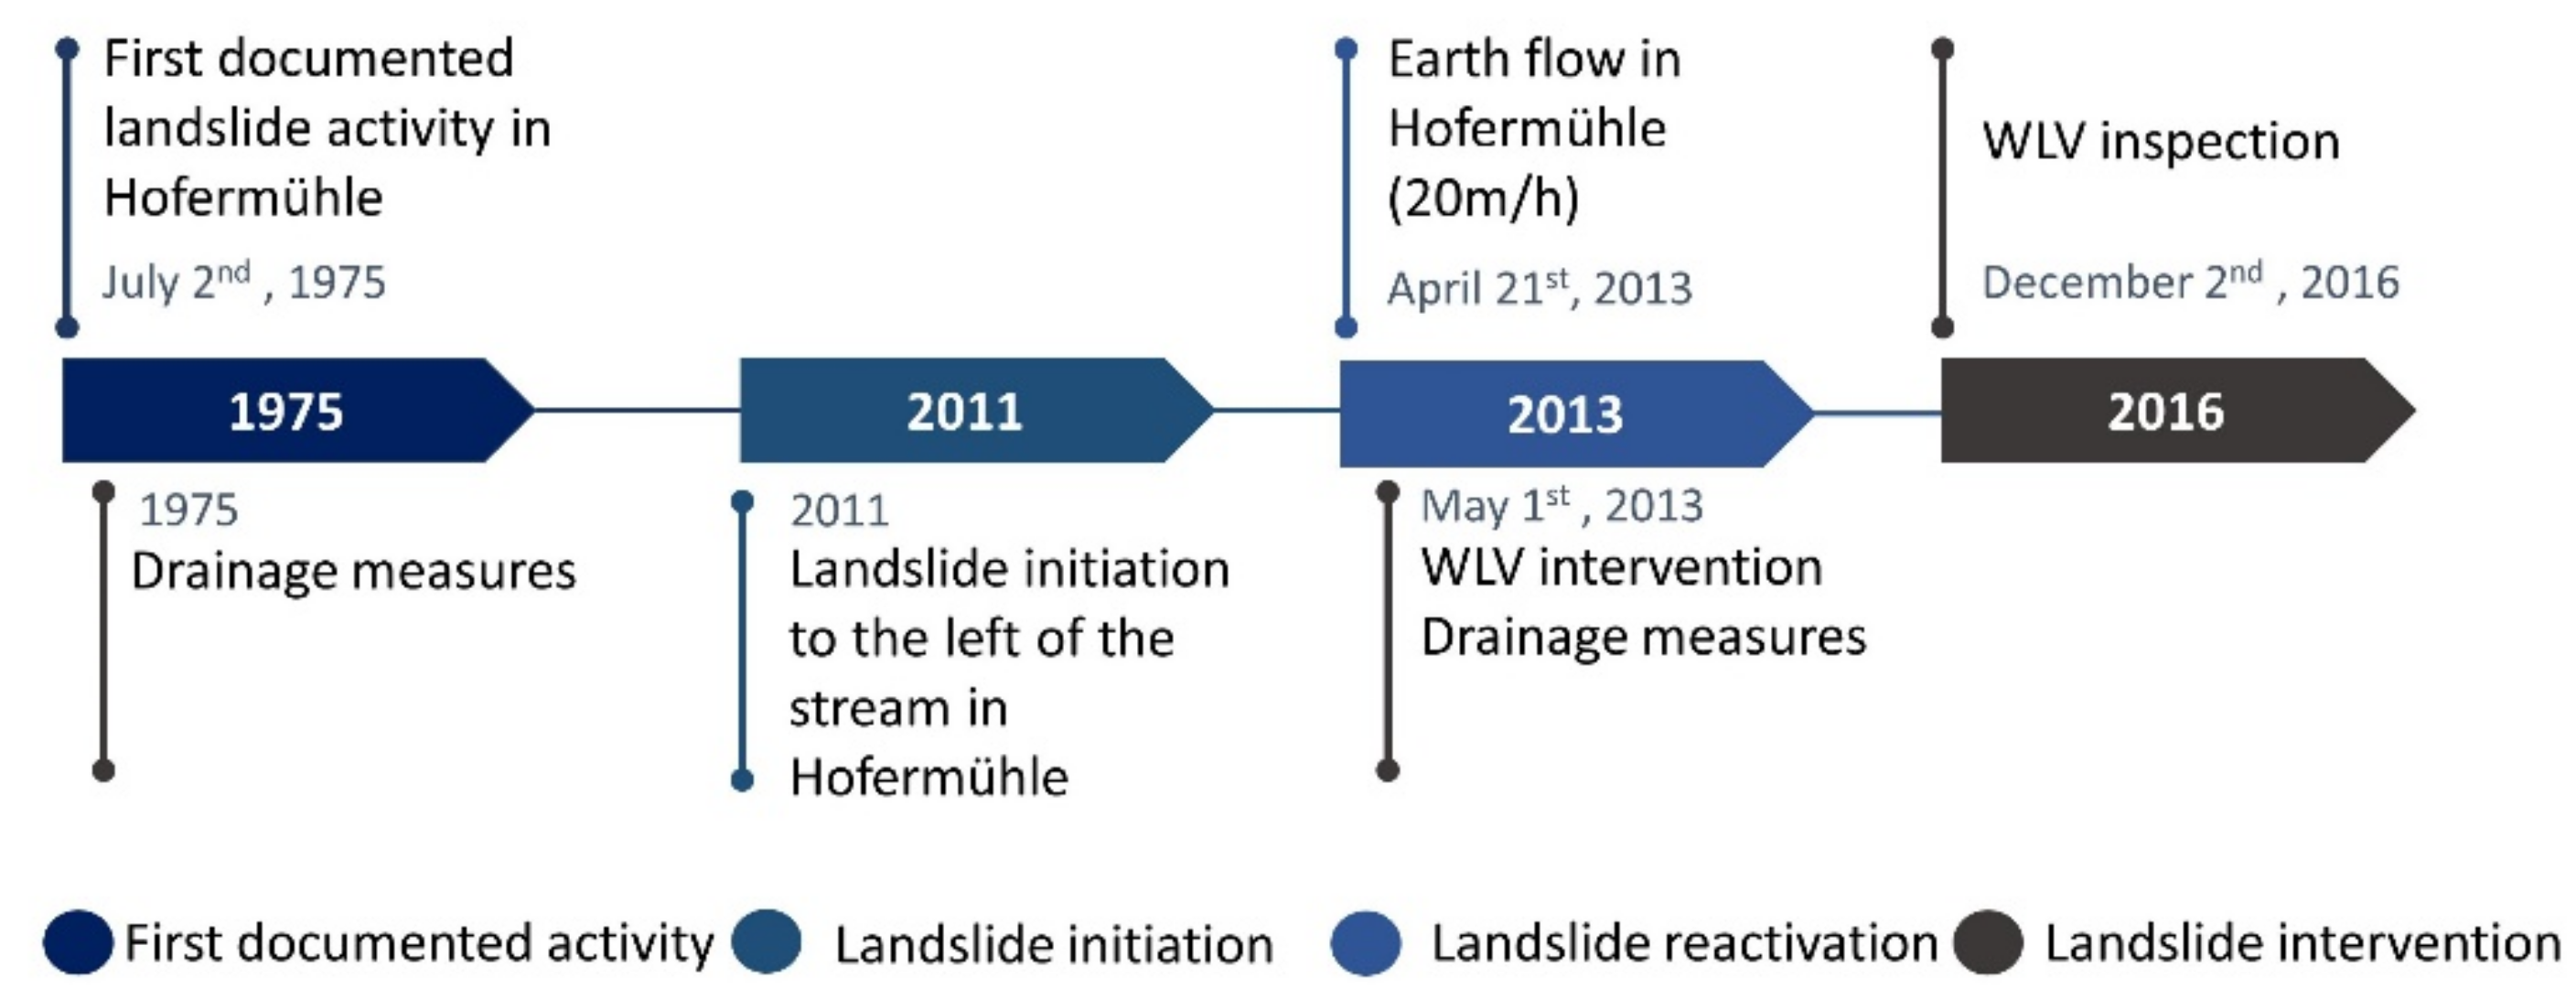
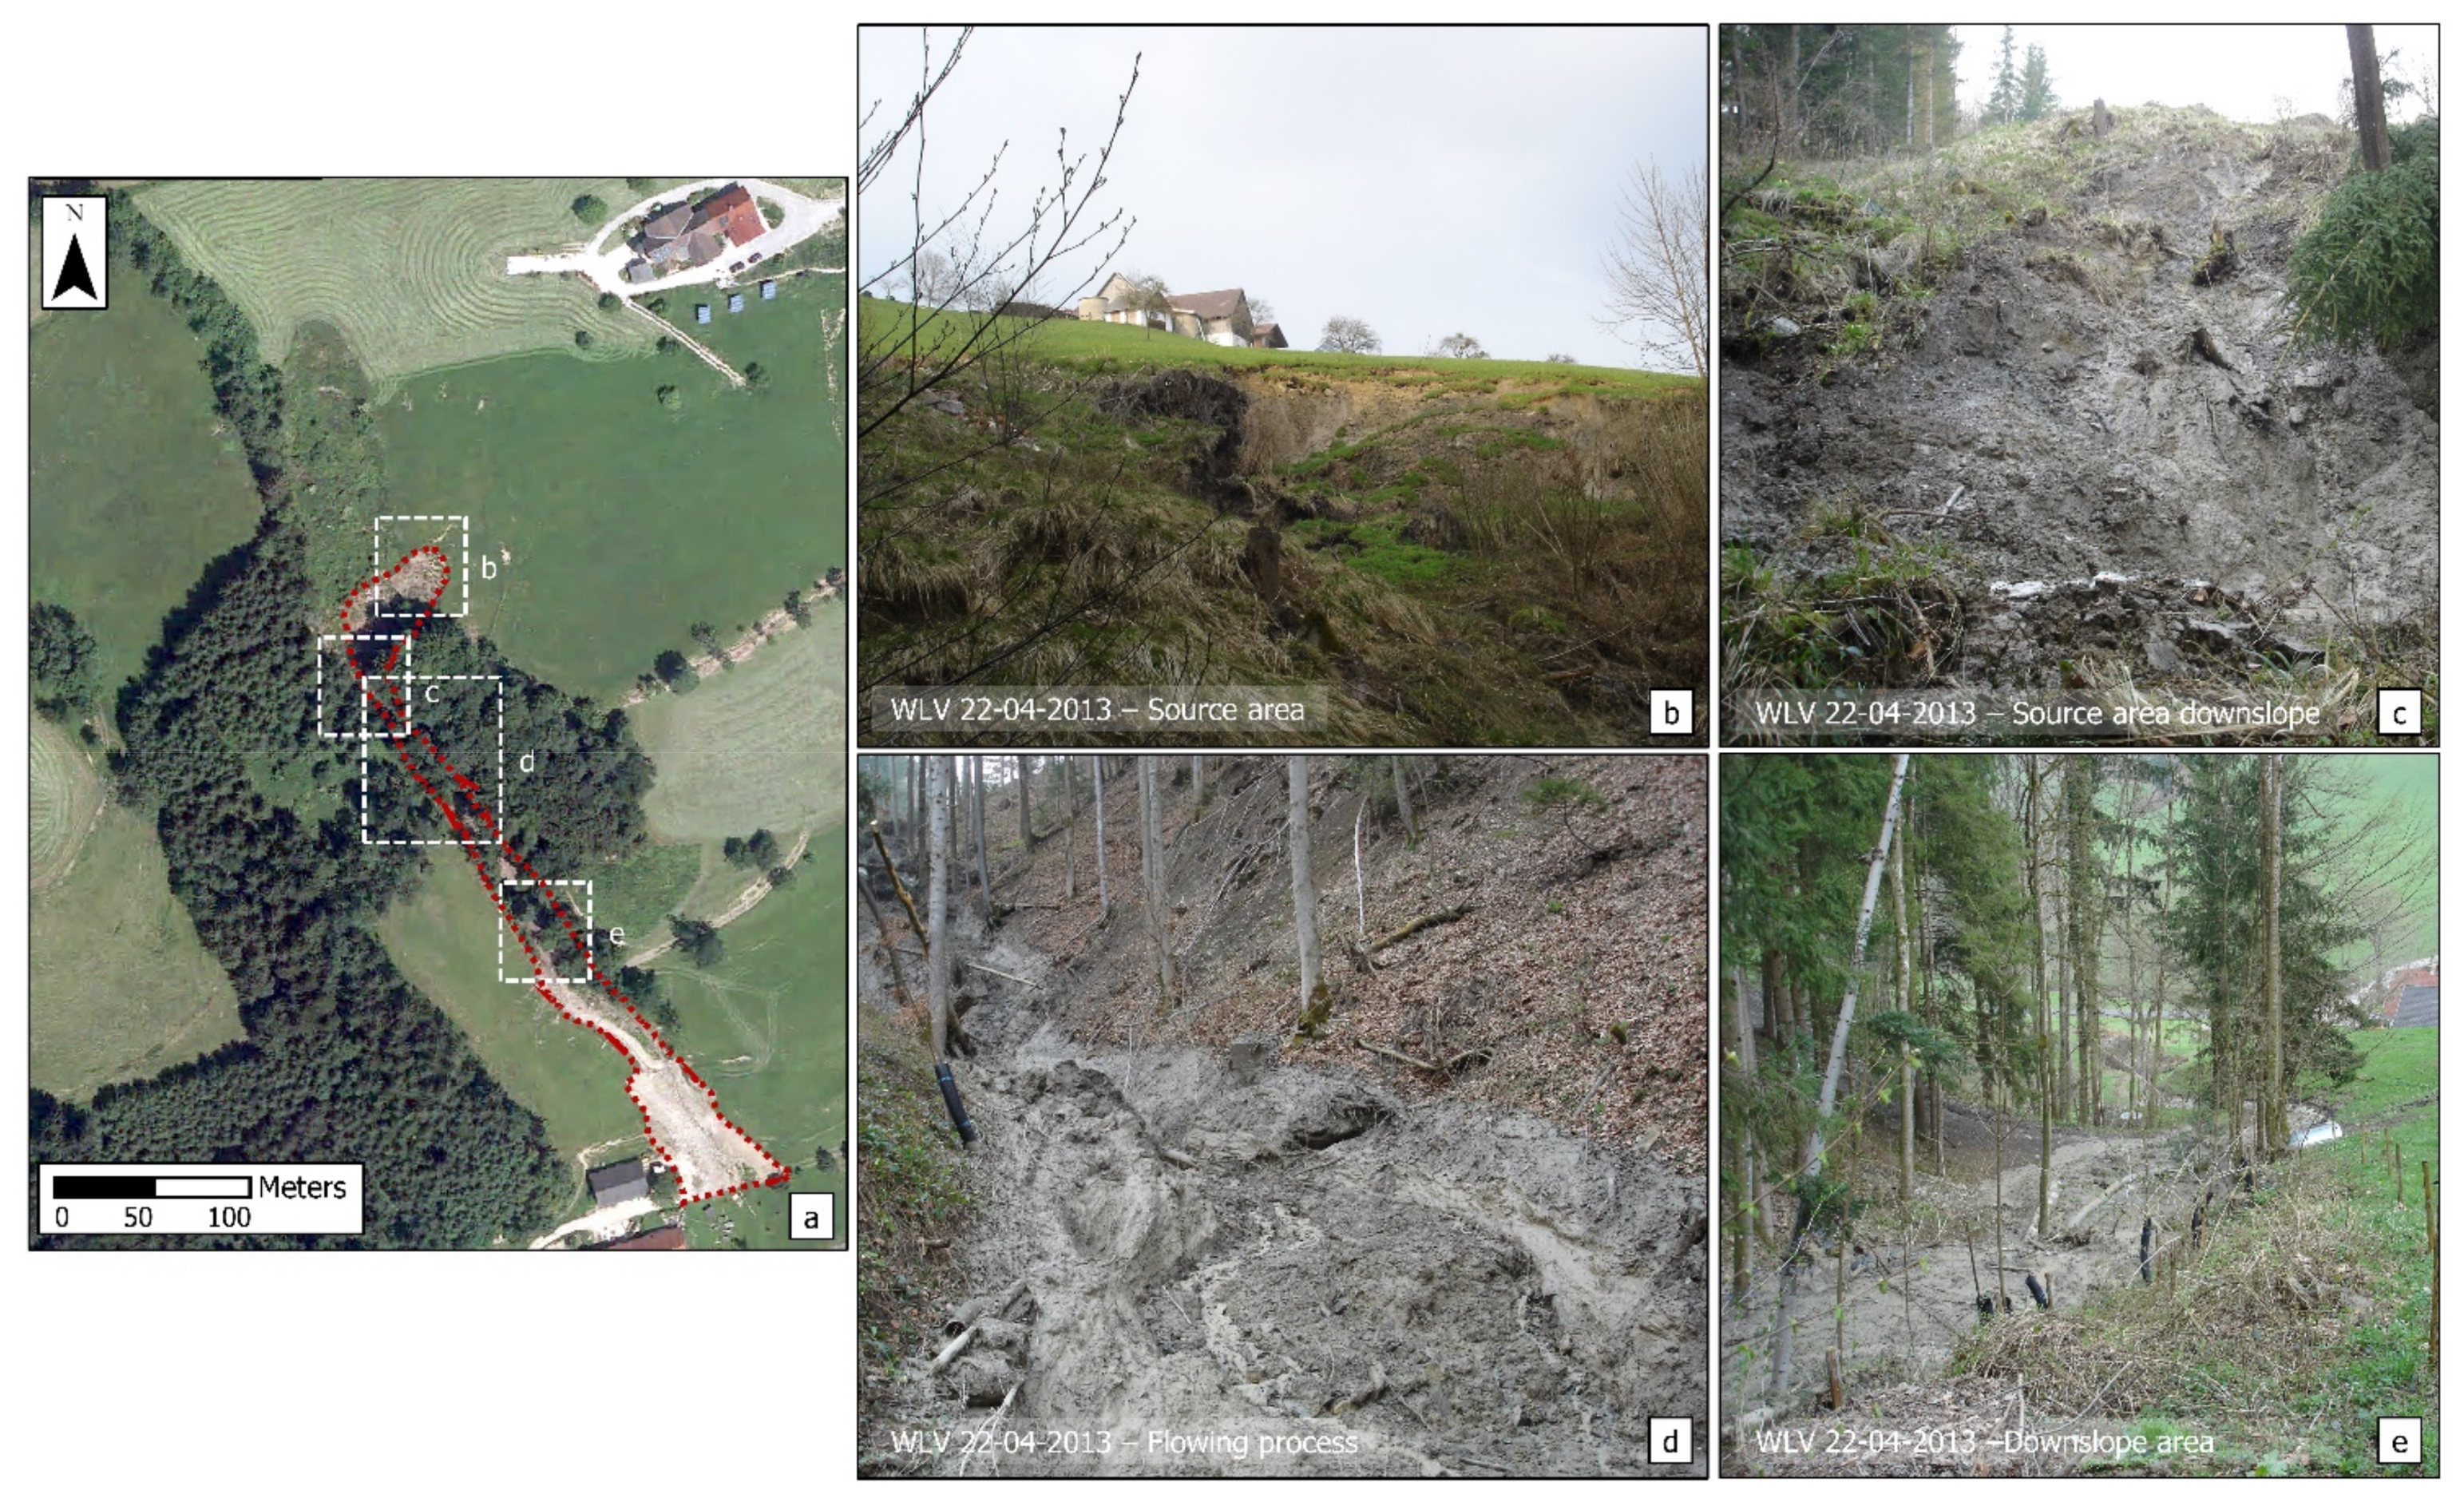
2.1. Hofermühle Landslide—Konradsheim District

The Hofermühle monitoring station is a representative landslide located in the northern part of the Redtenbach catchment in the Konradsheim district of Waidhofen an der Ybbs, Lower Austria. The Hofermühle landslide is defined as a complex rotational slow-moving landslide [8] with different spatial and temporal phases of activity [29]. The upper part of the Hofermühle catchment shows a slow, continuous displacement of mm/cm per year [29]. Furthermore, it was shown that areas which are poorly drained in the slope might be more prone to landslide processes [48]. Historical events have shown that the material from the continuous movement can move towards the torrent, resulting in sporadic fast mudflow processes [29,49].

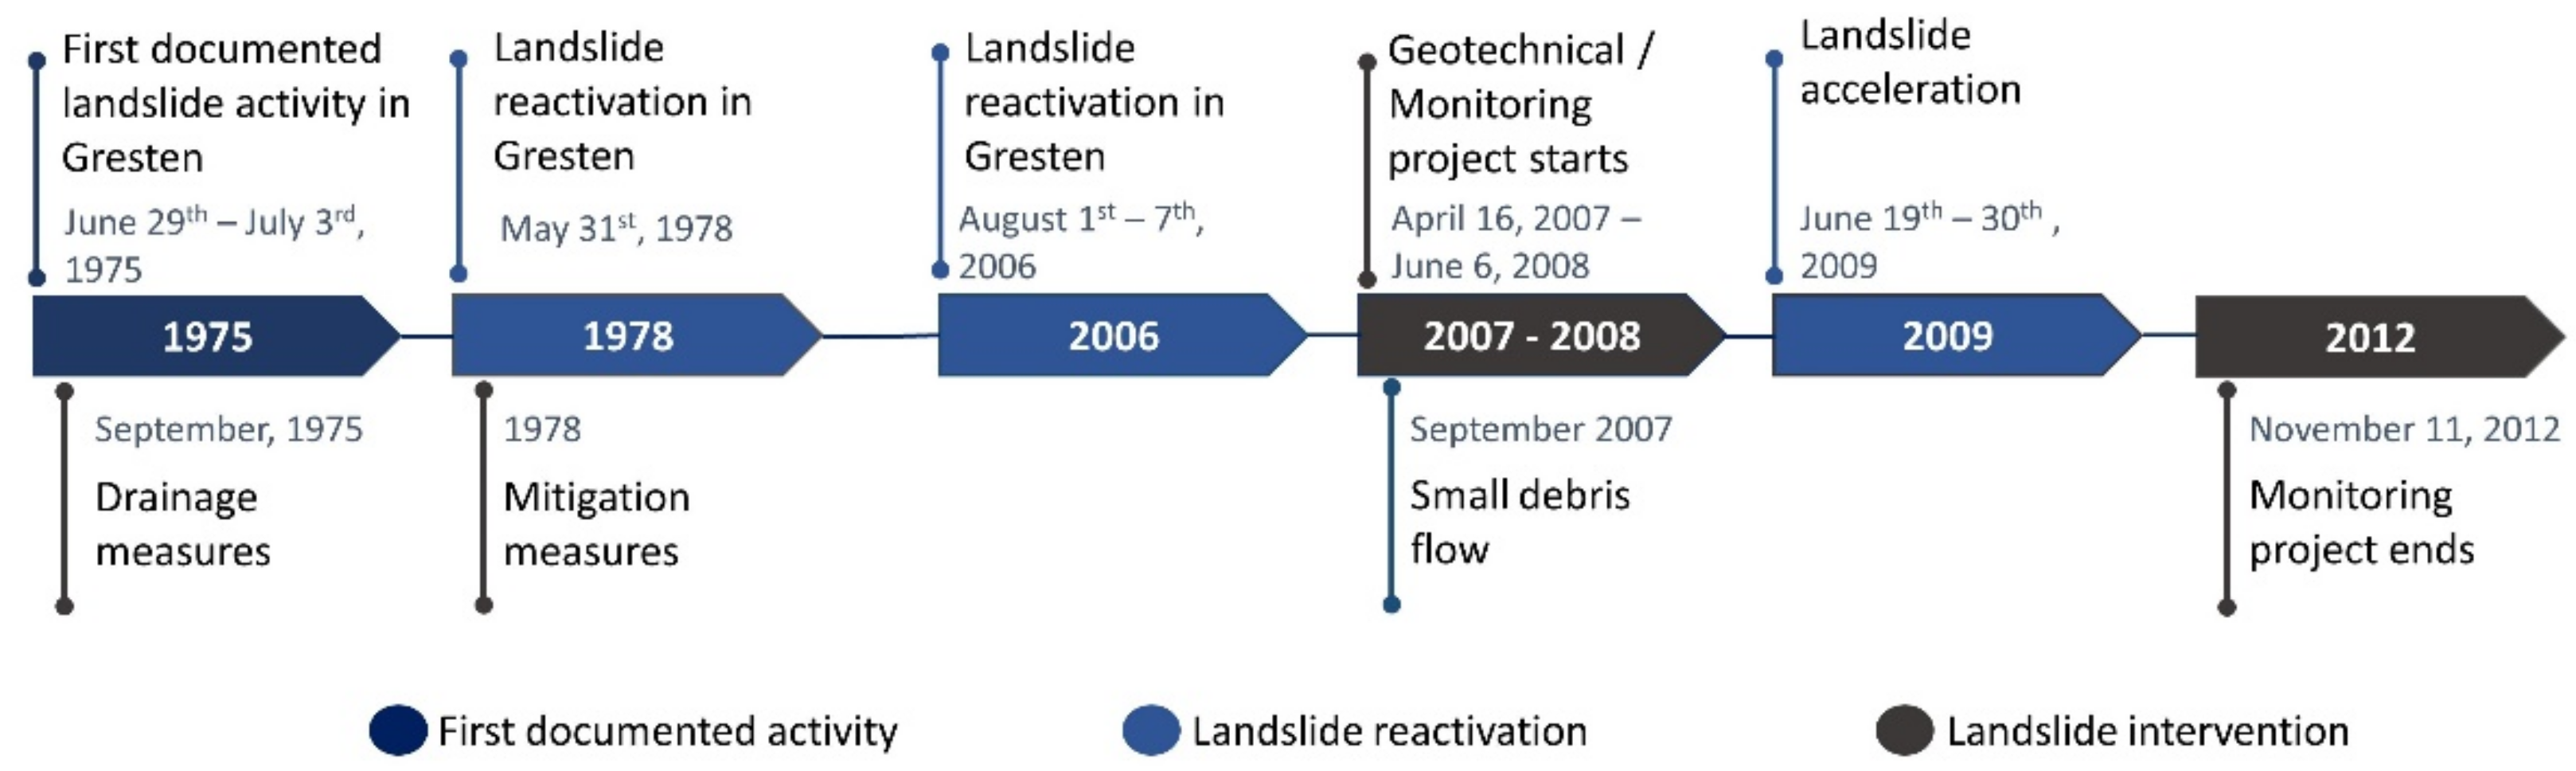
2.2. Gresten Landslide—Scheibbs District

The Salcher landslide area is located in the central part of the municipality of Gresten, district of Scheibbs, in the western part of Lower Austria. It is an unwooded, east-facing slope with dip angles between 10–20°, which was used as a skiing area until the 1950s [28]. The complex geologic setting of the region is evident in this study site, as the GKZ lies within a band of approximately 2 km between the FZ to the north and the NCA to the south [28]. Historical data and further investigations have confirmed that the slope has been in constant motion for decades [50]. The active landslide area covers 4000 m2, with a potential shear plane of 4 m depth. It corresponds to a slow-moving rotational landslide [8]. The potential accelerations of the landslide pose a constant threat to local communities as residential buildings and roads are located near the active landslide area.

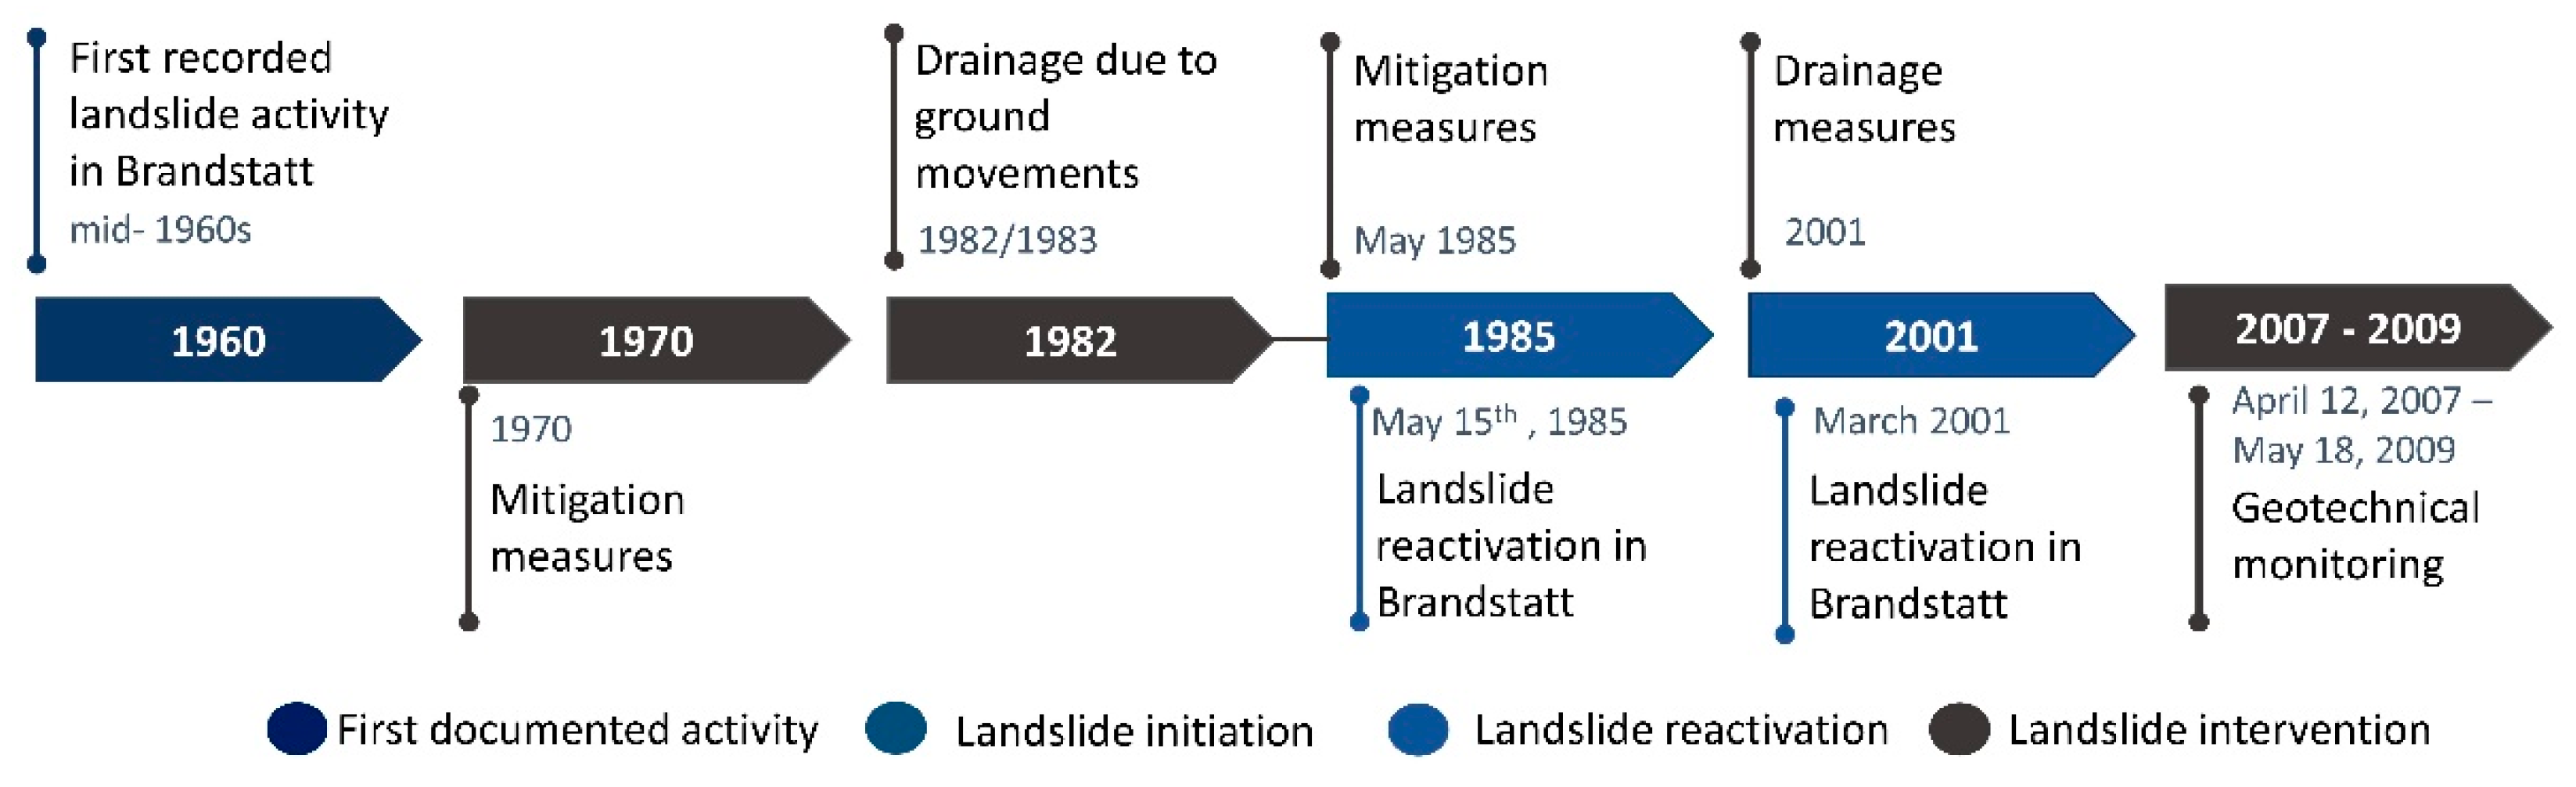
2.3. Brandstatt Landslide—Scheibbs District

The Brandstatt landslide monitoring site is located in the municipality of Gresten, district of Scheibbs in Lower Austria. The study area is a good example of a deep-seated, complex landslide with an area of about 0.2 km2 [51]. It is characterized by a north-facing slope with an inclination of 15–20°, which is mainly used as grassland and pasture. The corresponding subsurface is determined by a complex geological setting where the GKZ is in contact with the inner-Alpine Molasse. Especially in the middle and upper part of the slope, sandstone blocks and deeply weathered soft clay shales are intercalated [51,52]. The lower part is dominated by clastic and carbonate lithologies of the Molasse unit, in which dark grey marls, yellowish sandstones, and grey calcareous sands were found [51]. The slope exhibits wavy deformations patterns, such as bulges and depressions, that are often indications of continuous landslide activity [53].

3. Material and Methods

This study of historical landslides was conducted primarily by compiling various types of data from national and regional institutions and scientific journals concerning the three study areas. Regional landslide databases provided by the Geological Survey of Lower Austria were consulted but did not provide sufficient information on the magnitude and intensity of past events in the monitoring areas. Therefore, technical reports from the relevant authorities were also obtained and reviewed. The sources consulted, such as aerial photographs, field reports, and maps, were mainly provided by the Geological Survey of Lower Austria and the Austrian Service of the Torrent and Avalanche Control (WLV). The reviewed databases include the landslide catalog of the Geological Survey of Lower Austria and landslide inventories from previous investigations [45]. Additional information, such as detailed geotechnical and geological information on the study areas, was found in published technical reports [50]. There were some scientific articles describing landslide processes in our study areas, e.g., publications by Petschko et al. [27,45] and Stumvoll et al. [28,29]. Additionally, information on landslides was also compiled from various bachelor and master theses.
These findings were complemented and cross-checked using scientific articles and personal interviews with local residents and staff from local municipalities. All data were extracted, summarized, and integrated into a common landslide database for further analysis. The landslide database was then merged with meteorological data to find significant correlations between landslide dynamics and meteorological conditions. Based on the temporal occurrence of landslides, a temporal probability could be estimated for each study site.
Temporal information was mainly referenced in local technical reports published directly after a landslide occurrence. Spatial information was obtained from extensive field campaigns, historical maps, and aerial photographs of past landslide events. The resulting landslide inventory provided substantial information on past landslides. That information was the necessary input for the subsequent set-up of the respective landslide monitoring programs. The reports primarily included the location, date, and magnitude of the event after it occurred, potential triggering mechanisms, landslide maps, as well as partial information on damage assessment and immediate and long-term actions needed to mitigate the effects of future events. The database also contained information on landslide-prone areas in the three study areas and confirmed the need to establish a long-term monitoring project with continuous application of different methods and installation of sensors in order to extend the sparse single data to detailed knowledge of landslide dynamics in spatio-temporal dimensions.

4. Analysis of Historical Landslide Data

4.1. Hofermühle Landslide

The first documented landslide activity in the Hofermühle catchment dates from 2 July 1975 (Figure 3) [47]. This was a large-scale landslide on the orographic right side of the stream [54]. As a consequence, the area was drained after this event. It is unclear to which extent this measure contributed to slope stability, but until 2011 there were no further reported events. According to the report of the WLV, there was major landslide activation in 2011, triggered in the area of the upper orographic left side of the stream [49]. The landslide had a displacement of 2 m in 2 weeks. The last report of landslide activity was recorded on 21 April 2013 [55]. After heavy precipitation on the previous days, the material mobilized in 2011 was saturated in the lower part of the landslide (Figure 4a–c), triggering an mudflow with a velocity of 20 m/h [49], down to the torrent path (Figure 4d,e). Considering the potential risk for the properties located on the alluvial cone, the WLV removed the run-off inhibiting trees in the drainage cross-section, cleared the debris masses, and built a dam at the outlet of the torrent to mitigate potential future events [55,56]. According to the WLV report in 2016, the formation of cracks, inclination of trees, and depressions are indications that the landslide process is still active [54]. Within the last 47 years, the occurrence of three major landslides were detected at the Hofermühle site, whereas their spatial distribution was confined to a particular area of the slope.

4.2. Gresten Landslide

The first signs of horizontal surface movement were observed in the 1950s, as the ski lift pillars in a small skiing slope were tilted [28]. The first recorded landslide activity on the Salcher slope in Gresten dates to 3 July 1975 as a result of a heavy precipitation event (Figure 5) [47]. In that year, a landslide on the eastern slope of the Pichelkegel in the lift area caused the lower support of the lift to tilt downhill, making the road impassable [58]. Consequently, drainage measures were implemented in the fall of 1975 [58]. A few years later, on 31 May 1978, the reactivation of slope movement occurred. The accumulated daily precipitation of 101.9 mm triggered displacement in some parts of the landslide [53,59]. The landslide depression had a width of 10 m along the path and extended upslope to 8 m. At that time, the authorities took measures and recommended that the slope be secured with a layer of stone at the base of the embankment [59]. Subsequently, the depression was filled with bulk material [59].
Despite the initiated measures, repeated movements occurred on the slope in August 2006, damaging local infrastructure [60]. These movements were possibly related to the 162.5 mm of precipitation during 1–7 August [28]. In September 2007, a small debris flow occurred to the northeast of the slope [50]. These events highlighted the need for professional monitoring of the Salcher landslide. Therefore, a geotechnical investigation was conducted by the Geological Survey of Austria and the University of Natural Resources and Life Sciences in Vienna, Austria, from 16 April 2007 to 6 June 2008, which included drilling, trenching, and laboratory analysis of the landslide [50].
In June 2009, a 20 cm acceleration of the landslide occurred. This phenomenon was mainly due to the exceptional rainfall that triggered large landslides throughout Lower Austria [60], as was also observed in the meteorological data in Section 2. In view of these past events, the authorities of Lower Austria conducted a monitoring project between 26 April 2007 and 11 November 2012 to perform a geotechnical characterization of the landslide area [60]. Compiling the historical landslide activity and considering landslide initiation and reactivation events, five major events within 47 years have been reported.

4.3. Brandstatt Landslide

The first landslide activity in Brandstatt was documented in the mid-1960s (Figure 6) [52]. According to a report of the Lower Austrian Provincial Government in 1970, a large landslide occurred a few years earlier above the Groß-Schacher property, disrupting the main road over a length of 100 m [52]. After the event, deep drainage ribs were installed, and a double row of wooden piles was laid on the valley side of the road. In 1982 and 1983, a drainage system was installed in the slope due to the constant ground movements that threatened the main road [61]. On 15 May 1985, a reactivation of the landslide occurred. Ground movements were initiated about 12 m above the main road and extended about 50 m across the meadow area adjacent to the valley [61]. After this event, some remedial measures were proposed by the authorities, such as drainage measures, filling the storm drains with permeable material and diverting the collected water [61]. In March 2001, a lawn bulge of 0.5 × 30 m formed. The displacement continued over the next few months and swept the pasture fence standing on top of it. The event was related to the heavy precipitation of the winter of 2000/2001, where precipitation in the alpine foothills reached up to 175% of the long-term value [53]. As a result, further mitigation measures were recommended, such as the installation of deep drains and soundings to determine the optimal drain depth [53]. From 12 April 2007 to 18 May 2009, a geophysical and geotechnical monitoring project was conducted by the Geological Survey of Austria to characterize the landslide area [62]. The results and the corresponding landslide map were published in July 2012 [51]. The historical data of the last 62 years document four major events. Despite the undertaken measures, the landslide is further moving at different speeds in different areas, which leads to continuous road damage that is subsequently repaired by the municipality. Due to this, regular mowing is not possible anymore in part of the area and it is therefore utilized as a grazing area for cattle.

5. Establishment of Landslide Observatories (2014–Today)

Due to the reported historical data and the continuous socio-economic impacts, the three sites in Lower Austria were selected for the implementation of long-term monitoring systems. The installations within the landslide monitoring sites were initiated in 2014 by the Geomorphological Systems and Risk Research (ENGAGE) working group of the Department of Geography and Regional Research at the University of Vienna; project information at www.noeslide.at (accessed on 30 January 2023). In the initiation phase, this work was accompanied by the Geological Survey of Lower Austria. The selection of the specific locations for the different instruments is based on the analyzed landslide historical data and field observations. The gathered information varies in spatio-temporal resolution, from point measurements with 5-min intervals, e.g., automatic inclinometers, to areal data obtained on a monthly basis, e.g., terrestrial laser scanning or UAV flights. There are a large variety of surface and subsurface methodological approaches at the different landslide observatories. Beside basic installations that are present at every site (e.g., meteorological station), site-specific techniques have been implemented in the respective locations.

5.1. Common Monitoring Devices

In order to achieve comparable data, all landslide observatories are equipped with Campbell Scientific meteorological stations. The stations were installed within the landslide areas in order to obtain continuous, reliable, and site-specific data. These are based on CR1000 or CR1000X data logger and sensors for temperature and humidity (HC2S3), air pressure (CS106), heated precipitation sensors (Young 52202), pyranometers (CMP3 or MS-60), Windsonic4 ultrasonic anemometers, TDR probes (CS605), and piezometers (Geokon 4500AL) (see Table 1, Table 2 and Table 3). The meteorological stations are connected to permanent power lines. The connection with the data server is either via NL-240 module into an existing WiFi network or directly via LAN cable to provide a permanent internet connection. The external server based at the University of Vienna requests the data every 5 min, controls autonomously if the data are within the defined parameters, and sends warnings by mail in case of any deviation.
Besides surface monitoring, different subsurface monitoring installations are in use. One key technique in landslide research to obtain subsurface dynamics are inclinometers [63,64,65]. Manual inclinometers are installed at all monitoring sites, which are measured monthly with a vertical inclinometer (Glötzl NMGD type) [28,29,66,67]. It has to be noted that the installation of inclinometers in areas with a movement of more than a few centimeters can lead to a dysfunction of the instrument due to either the breaking of the plastic case or the inability of the measuring probe to fully enter the pipe. Historical data and field observations were considered to identify suitable locations within the landslide body.

5.2. Site-Specific Monitoring Devices

The basic equipped meteorological stations are complemented at the Gresten and Hofermühle landslide observatories by mechanical anemometers (034B Met One), distrometers (OTT Parsivel2), and SBS500 precipitation sensors to measure raindrop size distribution and velocity. These precipitation parameters are considered to be important triggering factors. Hofermühle and Brandstatt are additionally equipped with heated snow depth sensors (SR50AH).
In addition to the subsurface installations being present on every site, there are devices that are specifically installed in order to meet site-specific landslide dynamics. At Hofermühle, an automatic inclinometer (Measurand ShapeArray F type) [29,68] is also operated via a data logger. The data is recorded at five-minute intervals. In Gresten, the automatic inclinometer (Glötzl SNMGD) [69] measures displacements in 10-min intervals. Additionally, the Geosphere Austria (formerly Geological Survey of Austria) operates a fully automatic electrical resistivity tomography monitoring profile that measures every 3 h [69,70,71,72].
Time series of terrestrial laser scans open up the possibility of creating high-resolution, multi-temporal digital elevation models (DEMs), which are used to generate runoff models and display surface changes [29,56,73]. Consequently, UAV surveys (DJI Mavic 2 Pro) and TLS measurements (Riegl VZ-6000) are carried out regularly at Brandstatt and Hofermühle. In Gresten, a permanent terrestrial laser scanner (Optech ILRIS-3D) [28,74] has been in operation since 2015. The scans are scheduled daily at noon.

5.2.1. Site-Specific Monitoring—Hofermühle

Dynamic probing of heavy (DPH) subsurface characteristics by the resistance of the different soil layers and the maximum penetration depth can be identified [29]. In order to expand the knowledge about subsurface characteristics, e.g., the detection of potential shearing planes, dynamic probing heavy [75] was performed at 32 locations on 24 August 2017; 17–21 September 2018; 17–19 October 2018; 26–29 March 2019; and 12 March 2020 [29]; using a pneumatic SRS-15 (German type) penetrometer [29]. To complement the information of DPH with sediment samples, nine sediment cores were retrieved via percussion drilling using a GeoTOOL GTR 780V drilling rig on 17–21 September and 17–19 October 2018 [29] and were transported to the laboratory for further analysis.
With the aim of recording purely superficial movement patterns by means of point measurements, around 60 reference points in the form of marked boulder stones were created at the Hofermühle and deposited at the surface. These have been measured about once a month from 2014 to 2019 using manual GPS measurements (Table 1).

5.2.2. Site-Specific Monitoring—Gresten

Approximately 10 DPH surveys took place in Gresten using the same technique as described in Section 5.2.1. In addition, 10 sediment cores were extracted using the GeoTOOL GTR 780V for further analysis [28].
GNSS and total station surveys of geodetic piles were performed by the former Geological Survey of Austria [28,60]. From 2015 to 2019, a wireless network of acceleration sensors was operated on the landslide to register the smallest changes on the surface (Table 2).

5.2.3. Site-Specific Monitoring—Brandstatt

The development of the Brandstatt observatory with permanent installations, such as inclinometers and piezometers, started in the spring of 2022 (Figure 7). Here, the first DPH measurements were carried out. In total, 29 DPH measurements [75] were performed in Brandstatt in 2022 using the same devices as mentioned in Section 5.2.1. The maximum penetration depth was reached at 16.2 m. The GeoTOOL GTR 1100 MF was used for percussion drilling to extract seven sediment cores in the summer of 2022, which are currently being analyzed.

6. Discussion

Compiling landslide inventories with historical data has several limitations and uncertainties. The collection of all past events is hardly feasible and lacks comprehensiveness. Very often, landslide records are based on events that caused damage to society. Thus, all historical databases contain the minimum landslide information only. This is true for high-frequency/low-magnitude events which were not recorded or did not occur in parts of the study area where it was not noted by the population [14,22]. The longer the event lies in the past, the less probable data about the event can be collected [22]. Notifying landslide events is subjective and can lead to difficulties in accuracy and process identification, also depending on the person’s experience. Nevertheless, it can be expected that major events were recorded. The selection of study areas is challenging as researchers are reliant on the support of the landowners. Consequently, potentially interesting areas could not be accessible or only to a limited extent. However, despite these limitations, the collection of historical data was valuable and represents the basis for modern landslide monitoring systems in Lower Austria.

6.1. The (Historical) Role of Human Impact and Land Use Planning

Since historical data extend our knowledge in a given area, this information has proven to be a useful tool for decision-making in landslide hazard contexts and, consequently, for land use planning [14,76]. One of the most important elements for understanding the potential future damage is tracking, recording, and analyzing past landslides and assessing in the greatest detail the consequences to nature and society [77]. Therefore, landslide inventories are fundamental inputs for frequency reconstructions and comprehensive landslide risk assessments [78]. Historical damage events to private property and infrastructure associated with periodic landslide occurrences have implications for land use planning [79]. Considering that restrictive measures, such as construction bans, could result in significant indirect losses to the detriment of property owners. Urban planners must evaluate the potential loss of life and damage in order to implement more proactive landslide mitigation measures and effective disaster risk reduction measures [79]. In the case of the study sites, most of the land was private, and human losses have not been documented so far. Therefore, there were no significant landslide mitigation measures that could potentially impact property owners. However, it is important to note that land use has changed in the study areas, e.g., with the cessation of ski operations in Gresten and exclusive use as grassland in Brandstatt.
The analysis of historical information has shown that landslides are inevitably linked to anthropogenic activities. Landslide narratives include not only their occurrence but also the previous and subsequent human interventions. In the case of Lower Austria, several measures to mitigate these effects and future occurrences have been implemented. Successive drainage systems were put in place by local property owners, as well as local authorities, to counteract triggering factors that could contribute to the acceleration of landslides. However, it is also a matter of concern that these interventions, as well as land use changes, can also potentially contribute to landslide occurrence [35]. Furthermore, the expected changing precipitation patterns due to global climate change, as well as the frequency and magnitude, complicate future sustainable adaptation and mitigation measures [6].
Landslide occurrence in the study sites was first documented in the mid-1960s to 1970s and must be linked to land use changes that alter hydrological systems. Human interventions exacerbate hazards, add pressure to the systems, and create risk as infrastructure is threatened by these events. In all three study sites, houses, roads, and grassland are at risk of landslide activity. Human activity is often a root cause of landslides, not only by predisposing or triggering them [79] but also as a result of inadequate mitigation. Moreover, inadequate mitigation and adaptation measures can themselves have a negative influence on slope stability and cause landslides.

6.2. The Importance of Historical Data in Landslide Monitoring

It is generally accepted that landslide monitoring should be relevant, feasible, and useful [80]. Historical data should also be incorporated into the planning and design of the monitoring process, as it is an essential source of information on past landslide activity. The integration of historical and real-time data offers a unique opportunity to develop more comprehensive landslide hazard models and mitigation measures. Historical records in the study areas provided information on the type, geometry, frequency, magnitude, and intensity of past landslide events. Considering the above, the historical data were undoubted inputs in the development of the monitoring planning to better understand slow-moving landslide dynamics in Lower Austria.
The monitoring data of the last years confirmed the non-uniform temporal and kinematic landslide behavior [28,29,73]. There are different periods of activity and differential re-activations on the slopes. The historical data improved the understanding of predisposing factors (lithology, tectonics) and triggering factors (heavy rainfall, snow melting). With the help of these data, it was possible to correlate landslide activity to meteorological factors, such as specific precipitation events at the Hofermühle and in Gresten. Since the installation of the monitoring site in Brandstatt has just begun, respective information cannot be obtained yet. Indeed, the analysis of past events plays an important role in estimating risk, which is a combination of the hazard and the vulnerability of the exposed elements at risk.
Past landslide reports have repeatedly demonstrated that a continuous monitoring process is imperative to better understand landslide dynamics (e.g., [14,22]). Slow-moving landslides, in comparison to rapid landslides, present a unique opportunity for natural disaster prevention by setting in place suitable monitoring systems and modeling the mechanics of their movement [39]. Furthermore, landslides with relatively low moving rates offer the possibility to study the involved processes in depth over a longer period with different phases of activity. This helps to correlate movements to specific potential triggering factors, such as precipitation events and to improve the understanding of the influence of global climate change. Few studies have examined the dependence of landslide failure mechanisms on environmental conditions over time [39,81].
With both the importance of long-term monitoring approaches and the integration of historical information compiled by various stakeholders in Lower Austria recognized, decisions on measuring devices and locations for the monitoring project presented in this work were undertaken. The Hofermühle provides an example of how the integration of available historical landslide data with a long-term, multi-parameter monitoring approach is necessary to assess and mitigate the potential landslide scenario (Figure 8a–c). Historical data have provided information regarding past landslide events in the Hofermühle catchment in order to characterize past hazards. The mudflow that occurred in 2013 at Hofermühle especially revealed that the slow-moving landslide could be partially mobilized and evolve into a fast-flow process towards the main torrent path (Figure 8b). In particular, the estimation of the deposit heights and the run-out distance have been employed to evaluate the landslide risk and design mitigation strategies in the lower part of the slope. Decisions on locations for real-time monitoring have been established in agreement with local authorities for the perspective of disaster risk reduction and adaptation. In this sense, the slope-distributed network has been installed to assess ground displacements (surface and subsurface) and hydrologic parameters in the more active sectors of the unstable slope (Figure 8c) to evaluate potential landslide hazard scenarios and impacts.

6.3. Approaches of Linking Historical Data to Landslide Monitoring

There are several case studies in the literature that demonstrate the importance of historical data in the decision-making process of implementing long-term monitoring systems to better assess landslide hazards. The Johnson Creek landslide, near Newport, Oregon, was investigated by the United States Geological Survey (USGS) and had a long history of landslides during rainy seasons that continually affected the main highway [23]. A large landslide occurred between January 2002 and February 2003. Therefore, in 2004, the USGS used historical information on landslide processes to install a near-real-time monitoring system at this site. The goal of the near-real-time monitoring system was to better understand the relationship between rainfall and pore pressures that control landslide movement [23]. The monitoring system consisted of a rain gauge, vibrating wire piezometers along a longitudinal section of the slide, inclinometers above the slide plane, and extensometers. In November 2006, the contribution of vertical rainfall infiltration to pore water pressures was evaluated by installing additional sensors within the slide body. Two vertical arrays of six vibrating wire piezometers and dielectric soil moisture content sensors were installed in the central and upper parts of the landslide. Monitoring revealed that pore water pressure increased after rain events and that the landslide moved when pore water pressure exceeded a threshold value [23].
Another case successfully involving historical information are landslides in the London Clay coastal cliffs at Warden Point, Isle of Sheppey, Kent. This area has been continuously monitored since 1971 [84,85]. Historical data were an important contribution to understanding landslide and erosion dynamics in this region. Erosion history information has been obtained from editions of the major Ordnance Survey maps of 1876, 1896, 1931, and 1964. In addition, the first detailed descriptions of landslides in these areas were produced by Hutchinson et al. [86]. According to Dixon and Bromhead [84], new landslides occurred repeatedly in the same sections of the cliff, and therefore 56 piezometers were installed near these past landslides. These monitoring efforts led to the calculation of pore water pressures associated with the eroded landslide mass and the conclusion that first-time landslides occur on slopes that have been steepened due to marine erosion [84].
The studies from Dixon and Bromhead [84] were followed by coastal landslide monitoring in the cliff region of Aldbrough, East Riding of Yorkshire, UK [85]. Since September 2001, the monitoring of deep-seated, rotational landslides has been conducted using Terrestrial LiDAR surveys and UAV photogrammetry. Thirty-eight surveys were carried out until 2017, and twenty-seven surveys were used to calculate volume erosion. In addition to surface monitoring, drilling and laboratory geotechnical investigations were performed. The monitoring based on past landslide events indicated that major landslides occurred every six to seven years. In addition, the integration of the TLS data and the borehole analysis was useful for understanding the role of landslides and their pre-conditioning factors. Moreover, according to the authors, this obtained dataset of past landslides constituted a useful tool for calibrating coastal process modeling.
Another example of the integration of historical data and landslide monitoring is the Cirque des Graves landslides in Normandy [87]. This is a slow-moving and deep-seated coastal landslide that is regularly affected by accelerations with displacements of several meters. Historical information on past landslide activity and the economic and physical conditions has been the rationale for landslide monitoring since 1985 [87]. The authors concluded that a combination of historical data and slope instrumentation was needed to improve knowledge of slope dynamics. Therefore, the monitoring system was installed in strategic locations, and it is based on permanent GNSS receivers and hydro-meteorological observation points. This analysis showed existing linkages between groundwater levels and landslide kinematics to define critical piezometric thresholds that trigger landsliding [87].

7. Conclusions

Landslides are natural processes that affect and can influence societal systems in manifold ways. Understanding the evolution of complex landslides is difficult since their kinematics can depend on the combination of different predisposing and triggering mechanisms. Together with challenges arising from Global Change, including climate change, future landslide dynamics become increasingly complex. Therefore, this demands an even deeper understanding of the processes. In this context, historical data represent an essential element when performing frequency-magnitude analysis for evaluating the potential hazards and risks represented by landslides.
In this study, historical data on landslide events in three areas of Lower Austria were compiled, which represented the basis for the implementation of long-term monitoring systems. The importance of available historical data has been analyzed in order to estimate the landslide frequency and magnitude relationships of the selected slow-moving landslides in the Flysch Zone, a complex and highly susceptible area to sliding processes in Lower Austria. Despite the fact that the study sites are located under similar conditions (geology, tectonics, climate, and land use), the analysis of the historical information has shown that there are considerable differences among the landslide observatories in terms of landslide hazard characteristics. Based on historical data, planning decisions were made to protect infrastructure by building protective structures.
Furthermore, these can extend the chronological window on past events and displacement accelerations in the interest of improving the understanding of landslide processes and their natural and socio-economic impacts. The combination of both surface and subsurface monitoring methods allows for different spatial scales, from point information (e.g., inclinometers) to areal information (e.g., terrestrial laser scans). In this perspective, the attempt to combine historical data and long-term, continuous monitoring systems in the presented landslide observatories allows for an investigation of the spatio-temporal evolution of slow-moving landslides. Based on a variety of historical sources, it was possible to install the instruments constituting the long-term landslide monitoring observatories in a meaningful manner.
In many cases, historical information is an important tool for land use planning and disaster risk mitigation management that should be integrated into methodological approaches. This is stressed by the results of this study, which further shows the importance of historical data in establishing long-term monitoring systems. The non-linear behavior of slow-moving landslides and understanding the predisposing and triggering mechanisms controlling the slope stability remain a challenge, but it could be shown that historical data can contribute to reducing landslide hazards and the potential impacts on the local inhabitants.

8. Perspectives

Considering the points raised in this study, there are some challenges, issues, and future plans for the application of historical data in landslide research and landslide observatories. Historical data can support the unraveling of the complex interrelation between human activities and landslide dynamics. However, even if we have historical data, it is challenging to understand and predict the impacts of global climate change due to the non-linear processes involved, such as the change in precipitation patterns, which can change the spatio-temporal frequency and magnitude of hazards in the future. Therefore, it is necessary to carry out a quantitative analysis of landslide hazards through the simulation of future scenarios.
Common early warning models have a high rate of false and missed alarms [80]. Therefore, the monitoring process is a crucial step for implementing an appropriate early warning system [80]. Long-term and multi-parameter landslide monitoring provides a large amount of data that not only proportionate spatio-temporal information about past landslide activity but also facilitates the calculation of empirical thresholds that can be used to predict future landslides [78]. Therefore, early warning models that are based on key hydro-mechanical parameters of deformation and precipitation improve the accuracy and practicality of landslide early warning [80]. In this regard, historical data on landslides are of great importance to estimate the potential future consequences.
The development of a common international procedure for landslide documentation can help to standardize the data for the historical data of the future, which are obtained today. This could help to further stimulate research connected to historical data and improve our understanding of landslides and mitigate their impacts. There are examples, such as initiatives to continuously compile past events within an online portal of the Federal Ministry of Agriculture, Forestry, Regions, and Water Management of the Republic of Austria (www.naturgefahren.at) or the DOMODIS project. Further, the application of innovative methods, such as Artificial Intelligence approaches, could help develop systems to determine thresholds for triggering mechanisms for early warning purposes.

Author Contributions

Conceptualization, P.M., Y.A.J.D. and E.C.; methodology, P.M., R.K. and Y.A.J.D.; formal analysis, E.C. and Y.A.J.D.; investigation, P.M., Y.A.J.D. and E.C.; resources, P.M., Y.A.J.D. and E.C.; data curation, E.C. and Y.A.J.D.; writing—original draft preparation, P.M., Y.A.J.D. and E.C.; writing—review and editing, P.M., Y.A.J.D., E.C. and T.G.; visualization, Y.A.J.D. and E.C.; supervision, P.M.; project administration, P.M. and T.G. All authors have read and agreed to the published version of the manuscript.

Funding

This research received no external funding. Open Access Funding by the University of Vienna.

Data Availability Statement

The data presented in this study are available on request from the corresponding author. The analyzed precipitation series are publicly available in the archived dataset from the Histalp project www.zamg.ac.at/histalp (accessed on 30 January 2023).

Acknowledgments

We are thankful for the support from ENGAGE—Geomorphological Systems and Risk Research working group at the Department of Geography and Regional Research at the University of Vienna. A special thanks to Lilly Bucher and Daniele Spedaliere. The University of Vienna provided regular funding and allowed us to build and maintain the monitoring sites. Furthermore, we want to thank the Regional Geological Survey of the Regional Council of Lower Austria for their continuous support, namely Michael Bertagnoli and Joachim Schweigl. Additionally, the regional office of Lower Austria West of the Avalanche and Torrential Control unit of the Federal Ministry of Austria for Agriculture, Forestry, Regions, and Water Management based in Melk provided important support, namely Eduard Kotzmaier. The Geosphere Austria, formerly known as the National Geological Survey of Austria (GBA), provided very useful information. The different municipalities in Gresten, Scheibbs and Waidhofen an der Ybbs welcomed us always warmly and accompanied our research continuously. Finally, without the agreement and the openness of the local landowners, the installation of the monitoring sites would never have been possible. Thanks for your interest and willingness to improve scientific knowledge. We thank the open access funding by the University of Vienna.

Conflicts of Interest

The authors declare no conflict of interest.

References

  1. Guzzetti, F.; Carrara, A.; Cardinali, M.; Reichenbach, P. Landslide hazard evaluation: A review of current techniques and their application in a multi-scale study, Central Italy. Geomorphology 1999, 31, 181–216. [Google Scholar] [CrossRef]
  2. Glade, T.; Crozier, M.J. The Nature of Landslide Hazard Impact. In Landslide Hazard and Risk; Glade, T., Anderson, M., Crozier, M.J., Eds.; John Wiley & Sons Ltd.: Hoboken, NJ, USA, 2005; Volume 1, pp. 41–74. [Google Scholar]
  3. Petley, D. Global patterns of loss of life from landslides. Geology 2012, 40, 927–930. [Google Scholar] [CrossRef]
  4. Casteller, A.; Häfelfinger, T.; Cortés Donoso, E.; Podvin, K.; Kulakowski, D.; Bebi, P. Assessing the interaction between mountain forests and snow avalanches at Nevados de Chillán, Chile and its implications for ecosystem-based disaster risk reduction. Nat. Hazards Earth Syst. Sci. 2018, 18, 1173–1186. [Google Scholar] [CrossRef] [Green Version]
  5. Vranken, L.; Van Turnhout, P.; Van Den Eeckhaut, M.; Vandekerckhove, L.; Poesen, J. Economic valuation of landslide damage in hilly regions: A case study from Flanders, Belgium. Sci. Total Environ. 2013, 447, 323–336. [Google Scholar] [CrossRef] [PubMed] [Green Version]
  6. Crozier, M.J. Deciphering the effect of climate change on landslide activity: A review. Geomorphology 2010, 124, 260–267. [Google Scholar] [CrossRef]
  7. Gariano, S.L.; Guzzetti, F. Landslides in a changing climate. Earth Sci. Rev. 2016, 162, 227–252. [Google Scholar] [CrossRef] [Green Version]
  8. Cruden, D.M.; Varnes, D.J. Landslide Types and Processes. Landslides: Investigation and Mitigation; Special Report 247; Transportation Research Board: Washington, DC, USA, 1996; pp. 36–75. [Google Scholar]
  9. Dikau, R.; Brunsden, D.; Schrott, L.; Ibsen, M.L. Landslide Recognition. Identification, Movement and Causes; John Wiley & Sons Ltd.: Chichester, UK, 1996; p. 251. [Google Scholar]
  10. Varnes, D.J. Landslide Hazard Zonation: A Review of Principles and Practice; IAEG Commission on Landslides and Other Mass-Movements; UNESCO Press: Paris, France, 1984. [Google Scholar]
  11. Dai, F.C.; Lee, C.F.; Ngai, Y.Y. Landslide risk assessment and management: An overview. Eng. Geol. 2002, 64, 65–87. [Google Scholar] [CrossRef]
  12. Glade, T.; Albini, P.; Frances, F. An Introduction to the Use of Historical Data in Hazard Assessment. In The Use of Historical Data in Natural Hazard Assessments; Glade, T., Albini, P., Frances, F., Eds.; Kluwer Academic Publishers: Dordrecht, The Netherlands, 2001; pp. XVII–XXV. [Google Scholar]
  13. Van Den Eeckhaut, M.; Poesen, J.; Vandekerckhove, L.; Van Gils, M.; Van Rompaey, A. Human-environment interactions in residential areas susceptible to landsliding: The Flemish Ardennes case study. Area 2010, 42, 339–358. [Google Scholar] [CrossRef]
  14. Carrara, A.; Crosta, G.; Frattini, P. Geomorphological and historical data in assessing landslide hazard. Earth Surf. Process. Landf. 2003, 28, 1125–1142. [Google Scholar] [CrossRef]
  15. Ray, R.L.; Lazzari, M. Introductory Chapter: Importance of Investigating Landslide Hazards. In Landslides-Investigation and Monitoring; IntechOpen: London, UK, 2020; p. 1. [Google Scholar]
  16. Brunsden, D.; Ibsen, M.L. The nature of the European archive of historical landslide data, with specific reference to the United Kingdom. In Temporal Occurrence and Forecasting of Landslides in the European Community; Final Report Epoch EC Programme; European Commission, Science Research Development: Brussels, Belgium, 1994; Volume 2. [Google Scholar]
  17. Ibsen, M.L.; Brunsden, D. The nature, use and problems of historical archives for the temporal occurrence of landslides, with specific reference to the south coast of Britain, Ventnor, Isle of Wight. Geomorphology 1996, 15, 241–258. [Google Scholar] [CrossRef]
  18. Guzzetti, F.; Cardinali, M.; Reichenbach, P. The AVI Project: A bibliographical and archive inventory of landslides and floods in Italy. Environ. Manag. 1994, 18, 623–633. [Google Scholar] [CrossRef]
  19. Cruden, D.M. Estimating the Risks from Landslides Using Historical Data. In Landslide Risk Assessment, Proceedings of the International Workshop; Cruden, D.M., Fell, R., Eds.; Balkema: Rotterdam, The Netherlands, 1997; pp. 177–184. [Google Scholar]
  20. Calcaterra, D.; Parise, M.; Palma, B. Combining historical and geological data for the assessment of the landslide hazard: A case study from Campania, Italy. Nat. Hazards Earth Syst. Sci. 2003, 3, 3–16. [Google Scholar] [CrossRef] [Green Version]
  21. Esposito, G.; Carabella, C.; Paglia, G.; Miccadei, E. Relationships between Morphostructural/Geological Framework and Landslide Types: Historical Landslides in the Hilly Piedmont Area of Abruzzo Region (Central Italy). Land 2021, 10, 287. [Google Scholar] [CrossRef]
  22. Glade, T. Landslide Hazard Assessment and Historical Landslide Data—An Inseparable Couple. In The Use of Historical Data in Natural Hazard Assessments; Springer: Dordrecht, The Netherlands, 2001; pp. 153–168. [Google Scholar]
  23. Reid, M.E.; Baum, R.L.; Lahusen, R.G.; Ellis, W.L. Capturing Landslide Dynamics and Hydrologic Triggers Using Near-Real-Time Monitoring. In Landslides and Engineered Slopes. From the Past to the Future; CRC Press: Boca Raton, FL, USA, 2008; pp. 201–214. [Google Scholar]
  24. Loche, M.; Alvioli, M.; Marchesini, I.; Bakka, H.; Lombardo, L. Landslide susceptibility maps of Italy: Lesson learnt from dealing with multiple landslide types and the uneven spatial distribution of the national inventory. Earth Sci. Rev. 2022, 232, 104–125. [Google Scholar] [CrossRef]
  25. Calcaterra, D.; Parise, M. The Contribution of Historical Information in the Assessment of Landslide Hazard. In The Use of Historical Data in Natural Hazard Assessments; Glade, T., Albini, P., Frances, F., Eds.; Kluwer Academic Publishers: Dordrecht, The Netherlands, 2001; pp. 201–216. [Google Scholar]
  26. Pánek, T. Recent progress in landslide dating: A global overview. Prog. Phys. Geogr. Earth Environ. 2014, 39, 168–198. [Google Scholar] [CrossRef]
  27. Petschko, H.; Brenning, A.; Bell, R.; Goetz, J.; Glade, T. Assessing the quality of landslide susceptibility maps–case study Lower Austria. Nat. Hazards Earth Syst. Sci. 2014, 14, 95–118. [Google Scholar] [CrossRef] [Green Version]
  28. Stumvoll, M.J.; Canli, E.; Engels, A.; Thiebes, B.; Groiss, B.; Glade, T.; Schweigl, J.; Bertagnoli, M. The “Salcher” landslide observatory—Experimental long-term monitoring in the Flysch Zone of Lower Austria. Bull. Eng. Geol. Environ. 2019, 79, 1831–1848. [Google Scholar] [CrossRef] [Green Version]
  29. Stumvoll, M.J.; Schmaltz, E.M.; Kanta, R.; Roth, H.; Grall, B.; Luhn, J.; Flores-Orozco, A.; Glade, T. Exploring the dynamics of a complex, slow-moving landslide in the Austrian Flysch Zone with 4D surface and subsurface information. Catena 2022, 214, 106–203. [Google Scholar] [CrossRef]
  30. Sebald, J.; Senf, C.; Heiser, M.; Scheidl, C.; Pflugmacher, D.; Seidl, R. The effects of forest cover and disturbance on torrential hazards: Large-scale evidence from the Eastern Alps. Environ. Res. Lett. 2019, 14, 1–12. [Google Scholar] [CrossRef] [Green Version]
  31. Schweigl, J.; Hervás, J. Landslide mapping in Austria. In Scientific and Technical Research Series; Office for Official Publications of the European Communities: Luxembourg:, 2009. [Google Scholar]
  32. Fuchs, S.; Wenk, M.; Keiler, M. Geomorphic Hazards in Austria. In Landscapes and Landforms of Austria; Springer: Cham, Switzerland, 2022; pp. 105–117. [Google Scholar]
  33. Lemenkova, P.; Promper, C.; Glade, T. Economic Assessment of Landslide Risk for the Waidhofen ad Ybbs Region, Alpine Foreland, Lower Austria. In Proceedings of the Protecting Society through Improved Understanding, 11th International Symposium on Landslides and the 2nd North American Symposium on Landslides and Engineered Slopes, Banff, AB, Canada, 3–8 June 2012; pp. 279–285. [Google Scholar]
  34. Promper, C.; Glade, T. Landcover Changes for Landslide Risk Evolution–First Results from Lower Austria. In Proceedings of the Protecting Society through Improved Understanding, 11th International Symposium on Landslides and 2nd North American Symposium on Landslides and Engineered Slopes, Banff, AB, Canada, 3–8 June 2012. [Google Scholar]
  35. Promper, C.; Puissant, A.; Malet, J.P.; Glade, T. Analysis of land cover changes in the past and the future as contribution to landslide risk scenarios. Appl. Geogr. 2014, 53, 11–19. [Google Scholar] [CrossRef]
  36. Promper, C.; Gassner, C.; Glade, T. Spatiotemporal patterns of landslide exposure—A step within future landslide risk analysis on a regional scale applied in Waidhofen/Ybbs Austria. Int. J. Disaster Risk Reduct. 2015, 12, 25–33. [Google Scholar] [CrossRef]
  37. Lacroix, P.; Handwerger, A.L.; Bièvre, G. Life and death of slow-moving landslides. Nat. Rev. Earth Environ. 2020, 1, 404–419. [Google Scholar] [CrossRef]
  38. Petley, D.N.; Carey, J.M.; Ng, K.Y.; Massey, C.I.; Froude, M.J. Understanding Patterns of Movement for Slow Moving Landslides. In Proceedings of the 20th NZGS Geotechnical Symposium, Napier, New Zealand, 24–26 November 2017. [Google Scholar]
  39. Li, Y.; Utili, S.; Milledge, D.; Chen, L.; Yin, K. Chasing a complete understanding of the failure mechanisms and potential hazards of the slow moving Liangshuijing landslide. Eng. Geol. 2021, 281, 10597. [Google Scholar] [CrossRef]
  40. Moradi, S.; Heinze, T.; Budler, J.; Gunatilake, T.; Kemna, A.; Huisman, J.A. Combining Site Characterization, Monitoring and Hydromechanical Modeling for Assessing Slope Stability. Land 2021, 10, 423. [Google Scholar] [CrossRef]
  41. BMDW. Digital Elevation Model (DEM) Based on Airborne Laserscan Data of the Austrian Federal States Raster Resolution 10 m. In Bundesministerium für Digitalisierung und Wirtschaftsstandort (BMDW); geoland.at, Ed.; data.gv.at (Open Data Österreich); BMDW: Vienna, Austria, 2015. [Google Scholar]
  42. Weber, L. Flächendeckende Beschreibung der Geologie von Osterreich 1:500.000 im Vektorformat. Exzerpt (Basiskarte Geologie) aus der Metallogenetischen Karte von Osterreich 1:500.000; Geologische Bundesanstalt: Vienna, Austria, 1997. [Google Scholar]
  43. Thenius, E. Geologie der Österreichischen Bundesländer in Kurzgefaßten Einzeldarstellungen; NiederÖsterreich, Geologische Bundesanstalt: Wien, Austria, 1974. [Google Scholar]
  44. Schnabel, W. The Flysch Zone of the Eastern Alps; Verlag der Geologischen Bundesanstalt (GBA): Vienna, Austria, 1999; p. 49. [Google Scholar]
  45. Petschko, H.; Bell, R.; Leopold, P.; Heiss, G.; Glade, T. Landslide Inventories for Reliable Susceptibility Maps in Lower Austria. In Landslide Science and Practice: Volume 1: Landslide Inventory and Susceptibility and Hazard Zoning; Margottini, C., Canuti, P., Sassa, K., Eds.; Springer: Berlin/Heidelberg, Germany, 2013; pp. 281–286. [Google Scholar]
  46. Gottschling, P. Massenbewegungen. In Geologie der Österreichischen Bundesländer—Niederösterreich; Wessely, G., Ed.; Geologische Bundesanstalt: Vienna, Austria, 2006; pp. 335–340. [Google Scholar]
  47. Schwenk, H. Massenbewegungen in Niederösterreich 1953–1990. Jahrb. Geol. Bundesanst. 1992, 135, 597–660. [Google Scholar]
  48. Orozco, A.F.; Steiner, M.; Katona, T.; Roser, N.; Moser, C.; Stumvoll, M.J.; Glade, T. Application of induced polarization imaging across different scales to understand surface and groundwater flow at the Hofermühle landslide. Catena 2022, 219, 106–612. [Google Scholar]
  49. Sausgruber, T. Hofermühlrutschung Waidhofen/Ybbs; Forsttechnischer Dienst für Wildbach-und Lawinenverbauung: Melk, Austria, 2013. [Google Scholar]
  50. Jochum, B.; Lotter, M.; Ottner, F.; Tiefenbach, K. Geophysikalische und Ingenieurgeologische Methoden zur Untersuchung von durch Massenbewegungen bedingte Bauschäden in Niederösterreich. BBK-Projekt NC-62/F (2007) und ÜLG-35 (2007); Internal Report; Amt der Niederösterreichischen Landesregierung. Geologischer Dienst: Sankt Pölten, Austria, 2008. [Google Scholar]
  51. Schweigl, J. Abschlussbericht BD1-G-411/011-2009; Internal Report; Amt der Niederösterreichischen Landesregierung. Geologischer Dienst: Sankt Pölten, Austria, 2012. [Google Scholar]
  52. Amt der Niederösterreichischen Landesregierung. Gutachten (BD-96-G-1970); Internal Report; Amt der Niederösterreichischen Landesregierung: Sankt Pölten, Austria, 1970. [Google Scholar]
  53. Gottschling, P. Geologisches Gutachten BD1-G-867/1. Landesbaudirektion—Geologischer Dienst. Katastrophenerhebungsblatt. Hinteregger; Internal Report; Landesbaudirektion. Geologischer Dienst: Sankt Pölten, Austria, 2001. [Google Scholar]
  54. Sausgruber, T. Protokoll zum Lokalaugenschein Hangprozess Hofermühle/Hofermühlrutschung (3491/13-2016); Internal Report; Wildbach- und Lawinenverbauung: Melk, Austria, 2016. [Google Scholar]
  55. Kotzmaier, E. Aktenvermerk Krojer Rutschung (Hofermühle) 03.05.2013; Internal Report; Wildbach- und Lawinenverbauung: Melk, Austria, 2013. [Google Scholar]
  56. Stumvoll, M.J.; Schmaltz, E.M.; Glade, T. Dynamic characterization of a slow-moving landslide system—Assessing the challenges of small process scales utilizing multi-temporal TLS data. Geomorphology 2021, 389, 1–16. [Google Scholar] [CrossRef]
  57. NOEL GV. Digital Orthophoto; Department for Hydrology and Geoinformation, Federal State Government of Lower Austria, Ed.; Federal State Government of Lower Austria: St. Pölten, Austria, 2013. [Google Scholar]
  58. Schwenk, H. Marktgemeinde Gresten, Schiliftanlage der Fa; Pfeiffer & Kreuse OHG, Erdrutsch; Internal Report; Amt der niederösterreichischen Landesregierung: Sankt Pölten, Austria, 1976. [Google Scholar]
  59. Schwenk, H.; Gresten, G.; Salcher, G. Gemeinde Gresten, Güterweg Salcher. Erdrutschschaden 1978. Erhebungsbericht und Gutachten des geologischen Dienstes der Baudirektion; Internal Report; Melk, Austria, 1979. [Google Scholar]
  60. Schweigl, J. Gresten, Krause (Gst.Nr.1999/1), Bramreiter (Gst.Nr.1999/6) u.Plank (Gst.Nr.1999/7) Katastrophenschaden 2006, Rutschung Salcher, geologischer Abschlussbericht zu den Vermessungen (No. BD1-G-142/001-2007); Internal Report; Amt der Niederösterreichischen Landesregierung: Sankt Pölten, Austria, 2013. [Google Scholar]
  61. Hinteregger, H. Landesbaudirektion—Geologischer Dienst. Katastrophenerhebungsblatt. Geologisches Gutachten. (BD-G-867); Internal Report; Landesbaudirektion. Geologischer Dienst: Sankt Pölten, Austria, 1987. [Google Scholar]
  62. Lotter, M.; Jochum, B. Geophysikalische und Ingenieurgeologische Methoden zur Untersuchung von Durch Massenbewegungen Bedingte Bauschäden in Niederösterreich (BBK-Projekt NC-62/F (2007) und ÜLG-35 (2007)); Internal Report; Amt der Niederösterreichischen Landesregierung. Geologischer Dienst: Sankt Pölten, Austria, 2010. [Google Scholar]
  63. Simeoni, L.; Mongiovì, L. Inclinometer monitoring of the Castelrotto landslide in Italy. J. Geotech. Geoenviron. Eng. 2007, 133, 653–666. [Google Scholar] [CrossRef]
  64. Stark, T.D.; Choi, H. Slope inclinometers for landslides. Landslides 2008, 5, 339–350. [Google Scholar] [CrossRef]
  65. Bordoni, M.; Vivaldi, V.; Bonì, R.; Spanò, S.; Tararbra, M.; Lanteri, L.; Parnigoni, M.; Grossi, A.; Figini, S.; Meisina, C. A methodology for the analysis of continuous time-series of automatic inclinometers for slow-moving landslides monitoring in Piemonte region, northern Italy. Nat. Hazards 2022, 115, 1115–1142. [Google Scholar] [CrossRef]
  66. Glötzl. Datasheet Neigungsmessrohre ABS 50, ABS 74, PVC 60, ALU 48; GLÖTZL Gesellschaft für Baumesstechnik mbH: Rheinstetten, Germany, 2016; p. 2. [Google Scholar]
  67. Glötzl. Datasheet NMGD Vertikalneigungsmesser; GLÖTZL Gesellschaft für Baumesstechnik mbH: Rheinstetten, Germany, 2019; p. 1. [Google Scholar]
  68. Measurand. Datasheet SAAF Model 003; Measurand: Hanwell, NB, Canada, 2019; p. 6. [Google Scholar]
  69. Hauck, C.; Stumvoll, M.J.; Jochum, B.; Guardiani, C.; Glade, T. The Influence of Hydro-Meteorological Conditions on Landslide Dynamics—An Application to the Salcher Landslide in Gresten, Lower Austria. In EGU General Assembly Conference Abstracts; EGU: Vienna, Austria, 2018; p. 15672. [Google Scholar]
  70. Tsourlos, P.; Jochum, B.; Supper, R.; Ottowitz, D.; Kim, J.H. Optimizing Geoelectrical Arrays for Special Geoelectrical Monitoring Instruments. In Near Surface Geoscience 2016—22nd European Meeting of Environmental and Engineering Geophysics; European Association of Geoscientists & Engineers: Utrecht, The Netherlands, 2016; Volume 2016, p. 495. [Google Scholar]
  71. Lidauer, S.; Jochum, B.; Ottowitz, D.; Stumvoll, M.J.; Glade, T. Geoelectric long-time monitoring: Changes and pattern within subsurface resistivity during different precipitation events in the Salcher landslide, Gresten (Lower Austria). In EGU General Assembly Conference Abstracts; EGU: Vienna, Austria, 2018; p. 12679. [Google Scholar]
  72. Ottowitz, D.; Hoyer, S.; Jochum, B.; Riegler, M.; Preuner, P.; Scolobig, A.; Supper, A. Long-Term Landslide Monitoring for Understanding of Underlying Dynamic Processes as Basis for an End-User Focused Early Warning—LAMOND; Geologische Bundesansalt Fachabteilung Geophysik: Vienna, Austria, 2018. [Google Scholar] [CrossRef]
  73. Stumvoll, M.J.; Konzett, M.; Schmaltz, E.M.; Glade, T. Application of UAS to Detect Infrequent and Local Large-Scale Surficial Displacements: Critical Examples from the Fields of Landslide and Erosion Research. In sUAS Applications in Geography; Konsoer, K., Leitner, M., Lewis, Q., Eds.; Springer: Cham, Switzerland, 2022; pp. 203–233. [Google Scholar]
  74. Canli, E.; Höfle, B.; Hämmerle, M.; Thiebes, B.; Glade, T. Permanent 3D laser scanning system for an active landslide in Gresten (Austria). Geophys. Res. Abstr. 2015, 17, 2885. [Google Scholar]
  75. DIN EN ISO 22476-2:2005; Geotechnical Investigation and Testing—Field Testing—Part 2: Dynamic Probing. ISO: Geneva, Switzerland, 2005.
  76. Schwab, J.; Gori, P.; Jeer, S. Landslide Hazards and Planning; American Planning Association: Chicago, IL, USA, 2005. [Google Scholar]
  77. Klose, M.; Damm, B.; Terhorst, B. Databases in geohazard science: An introduction. Geomorphology 2015, 249, 1–3. [Google Scholar] [CrossRef]
  78. Piacentini, D.; Troiani, F.; Daniele, G.; Pizziolo, M. Historical geospatial database for landslide analysis: The Catalogue of Landslide Occurrences in the Emilia-Romagna Region (CLOCkER). Landslides 2018, 15, 811–822. [Google Scholar] [CrossRef]
  79. Klose, M.; Maurischat, P.; Damm, B. Landslide impacts in Germany: A historical and socioeconomic perspective. Landslides 2016, 13, 183–199. [Google Scholar] [CrossRef]
  80. Qiang, X. Understanding the landslide monitoring and early warning: Consideration to practical issues. J. Eng. Geol. 2020, 28, 360374. [Google Scholar] [CrossRef]
  81. Palis, E.; Lebourg, T.; Tric, E.; Malet, J.-P.; Vidal, M. Long-term monitoring of a large deep-seated landslide (La Clapiere, South-East French Alps): Initial study. Landslides 2017, 14, 155–170. [Google Scholar] [CrossRef]
  82. NOEL GV. Digital Orthophoto; Department for Hydrology and Geoinformation, Federal State Government of Lower Austria, Ed.; Federal State Government of Lower Austria: St. Pölten, Austria, 2002. [Google Scholar]
  83. NOEL GV. Digital Orthophoto; Department for Hydrology and Geoinformation, Federal State Government of Lower Austria, Ed.; Federal State Government of Lower Austria: St. Pölten, Austria, 2019. [Google Scholar]
  84. Dixon, N.; Bromhead, E.N. Landsliding in London Clay coastal cliffs. Q. J. Eng. Geol. Hydrogeol 2002, 35, 327–334. [Google Scholar] [CrossRef]
  85. Hobbs, P.R.N.; Jones, L.D.; Kirkham, M.P.; Holyoake, S.J.; Pennington, C.V.L.; Dashwood, C.; Reeves, H.J. Establishment of a coastal landslide observatory at Aldbrough, East Riding of Yorkshire, UK. Q. J. Eng. Geol. Hydrogeol 2020, 53, 88–100. [Google Scholar] [CrossRef]
  86. Hutchinson, J.N. Survey of the Coastal Landslides of Kent; Building Research Station: London, UK, 1965. [Google Scholar]
  87. Lissak, C.; Macaire, O.; Malet, J.P.; Bitri, A.; Samyn, K.; Grandjean, G.; Davidson, R. Airborne, and ground-based data sources for characterizing the morpho-structure of a coastal landslide. Geomorphology 2014, 217, 140–151. [Google Scholar] [CrossRef]
Figure 1. Location of the landslide observatories and areas of investigation in Lower Austria. (a) Location of the Lower Austria federal state, in north-eastern Austria. Relief shading is based on the Austrian 10 m DEM [41]; (b) Geological map in which the lithological units reported are of major interest for the study area (after [42]); (ce) Location of the (c) Hofermühle, (d) Gresten, and (e) Brandstatt observatory, respectively, as well as areas affected by landslide displacements in recent years. Satellite images of the landslide sites provided in the ArcGIS Pro 3.0.0 software using World Imagery (Source: Esri, Maxar, Earthstar Geographics, and the GIS User Community).
Land 12 00659 g001
Figure 2. Precipitation time series from Waidhofen an der Ybbs meteorological station (period visualized: 1896–2021, data obtained from Histalp project). (a) Annual precipitation rate is reported, as well as the 5-years and 10-years average value; (b) Monthly mean precipitation amounts; (c) Seasonal time series are reported respectively for the spring; (d) summer season and rainfall anomalies with respect to the average.
Land 12 00659 g002
Figure 3. Historical information of the landslide activity at the Hofermühle site.
Land 12 00659 g003
Figure 4. Hofermühle earth flow event occurred in 2013. (a) Area involved in the runout path of the mobilized material; (b,c) Sliding processes in the source area; (d,e) Flowing processes along the Hofermühle torrent path. The orthophoto used in (a) is provided by the Federal State Government of Lower Austria [57] whereas the photographs of the 2013 event are provided by the Torrent and Avalanche Control authority (WLV) [49].
Land 12 00659 g004
Figure 5. Historical information on the activity of the Salcher landslide in Gresten.
Land 12 00659 g005
Figure 6. Historical information on the landslide activity in Brandstatt site.
Land 12 00659 g006
Figure 7. Location of DPH (dynamic probing heavy) tests and different monitoring devices, such as piezometers, inclinometers, TDR devices, and the meteorological station at the Brandstatt landslide observatory. Satellite image of the study area provided in the ArcGIS Pro 3.0.0 software using World Imagery (Source: Esri, Maxar, Earthstar Geographics, and the GIS User Community).
Land 12 00659 g007
Figure 8. Digital orthophoto from (a) 2002, (b) 2013, and (c) 2019 of the Hofermühle landslide. The area affected during the earth-flow event in 2013 is also represented in (b). Main areas of investigation are indicated in (c), as well as simplified morphological features of the landslide activity. Monitoring installations and structural measures to mitigate a possible landslide are visible in (c). Orthophotos are provided by the Federal State Government of Lower Austria [57,82,83].
Land 12 00659 g008
Table 1. Compilation of the different methods applied and data obtained from Hofermühle. The methods are distinguished between surface (A) and subsurface (B) monitoring approaches. The installations of the meteorological station are added in italics. The obtained data are structured in the same way with additional information on the measurement intervals as footnotes.
MethodsData
Surface monitoring (A)Subsurface monitoring (B)Data (A)Data (B)
multi-temporal TLS measurements4 manual inclinometer (Glötzl NMGD)high resolution 3D-point cloud 1measured values A/B [cm], deformation A/B [cm], borehole profile A/B [cm] 2
multi-temporal UAV measurementsautomatic inclinometer (Measurand SAAF)high resolution DEM 3deformation [mm] 4
GPS measurements, measuring stones (finished) GPS time series
Meteorological Station:
-temperature and humidity (HC2S3)9 TDR probes (CS605)temp [°C], rel. humidity [%] 4permittivity [unitless],
electr. conductivity [dS/m], temp. [°C] 4
-air pressure (CS106)8 piezometers (Geokon 4500AL)baro. pressure [mbar] 4avg. groundwater level [m], avg. temp. [°C] 4
-heated precipitation sensor (Young 52202) total precip. [mm] 4
-precipitation sensor (SBS500) total precip. [mm] 4
-pyranometer (CMP3) solar radiance [kW and J, avg] 4
-Windsonic4 ultrasonic anemometer direction [deg.], wind speed [ms, avg] 4
-mechanical anemometer (034B Met One) direction [deg.], wind speed [ms, avg] 4
-distrometer (OTT Parsivel) prec. intensity [mm/h], SYNOP Code, particle quantity, radar reflectivity [dBz] 4
-heated snow depth sensor (SR50AH) distance to ground [m] 4
1 3–6 months measurement interval; 2 monthly interval; 3 6 months measurement interval; 4 5 min measurement interval.
Table 2. Compilation of the different methods applied and data obtained from Gresten. The methods are distinguished between surface (A) and subsurface (B) monitoring approaches. The installations of the meteorological station are added in italics. The obtained data are structured in the same way with additional information on the measurement interval as footnotes.
MethodsData
Surface monitoring (A)Subsurface monitoring (B)Data (A)Data (B)
multi-temporal TLS measurements3 manual inclinometer (Glötzl NMGD)high resolution 3D-point cloud 1measured values A/B [cm], deformation A/B [cm], borehole profile A/B [cm] 2
multi-temporal UAV measurements (finished)automatic inclinometer (Glötzl SNMGD)high resolution DEM 3deformation [cm], temp. [°C] 4
GPS and TS measurements, with geodetic plies (finished)automatic ERT (operated by the GBA)GPS time series 3model of the specific electrical resistance 5
wireless sensor network (finished) dislocation measurements 6
Meteorological Station:
-temperature and humidity (HC2S3)3 TDR probes (CS605)temp [°C], rel. humidity [%] 7permittivity [unitless],
electr. conductivity [dS/m], temp. [°C] 7
-air pressure (CS106)5 piezometers (Geokon 4500AL)baro. pressure [mbar] 7avg. groundwater level [m], avg. temp. [°C] 7
-heated precipitation sensor (Young 52202) total precip. [mm] 7
-precipitation sensor (SBS500) total precip. [mm] 7
-pyranometer (MS-60) solar radiance [kW and J, avg] 7
-Windsonic4 ultrasonic anemometer direction [deg.], wind speed [ms, avg] 7
-mechanical anemometer (034B Met One) direction [deg.], wind speed [ms, avg] 7
-distrometer (OTT Parsivel) prec. intensity [mm/h], SYNOP Code, particle quantity, radar reflectivity [dBz] 7
1 daily measurement interval; 2 monthly measurement interval; 3 3 months measurement interval; 4 10 min interval; 5 3 h interval; 6 hourly interval; 7 5 min measurement interval.
Table 3. Compilation of the different methods applied and data obtained from Brandstatt. The methods are distinguished between surface (A) and subsurface (B) monitoring approaches. The installations of the meteorological station are added in italics. The obtained data are structured in the same way with additional information on the measurement interval as footnotes.
MethodsData
Surface monitoring (A)Subsurface monitoring (B)Data (A)Data (B)
multi-temporal TLS measurements5 manual inclinometer (Glötzl NMGD)high resolution 3D-point cloud 1measured values A/B [cm], deformation A/B [cm], borehole profile A/B [cm] 2
multi-temporal UAV measurements high resolution DEM 1
Meteorological Station:
-temperature and humidity (HC2S3)9 TDR probes (CS605)temp [°C], rel. humidity [%] 3permittivity [unitless],
electr. conductivity [dS/m], temp. [°C] 3
-air pressure (CS106)3 piezometers (Geokon 4500AL)baro. pressure [mbar] 3avg. groundwater level [m], avg. temp. [°C] 3
-heated precipitation sensor (Young 52202) total precip. [mm] 3
-pyranometer (MS-60) solar radiance [kW and J, avg] 3
-Windsonic4 ultrasonic anemometer direction [deg.], wind speed [ms, avg] 3
-heated snow depth sensor (SR50AH) distance to ground [m] 3
1 annual measurement interval; 2 monthly measurement interval; 3 5 min measurement interval.
Disclaimer/Publisher’s Note: The statements, opinions and data contained in all publications are solely those of the individual author(s) and contributor(s) and not of MDPI and/or the editor(s). MDPI and/or the editor(s) disclaim responsibility for any injury to people or property resulting from any ideas, methods, instructions or products referred to in the content.

