1. Introduction
1.1. Research Background
The uncertainties posed by climate change in the Mediterranean region justify a detailed study of the behaviour of its rainfall regimes. It is not only a matter of reconstructing and characterising climate variability, but also of identifying the most severe and infrequent hydrometeorological events. These phenomena, such as torrential rainfall that cause floods, affect the availability of water resources and generate casualties and important impacts on human activity. It is therefore suitable that the study of these phenomena should address both the physical–atmospheric and the social impact aspects in an integrated approach.
The problem with the study of extreme hydrometeorological events is their low frequency. There is little experience and knowledge of them during the instrumental period, which covers only the 20th century. Their detection, reconstruction and analysis over long time periods requires the preparation of information beyond the instrumental records, using various sources that provide proxy–data for periods of several centuries and even millennia [
1]. Flood events of magnitude and hydrological behaviour are identified, providing more precise knowledge about frequencies and their temporal variability at different scales, whether from sedimentological records or from historical documentary sources [
2]. This reduces uncertainties regarding the challenge of climate change and makes it possible to prepare preventive or territorial planning measures to deal with the effects of the most severe episodes, or the increased frequency of events of medium severity.
Information on past floods has the difficulty of being largely available in qualitative formats. Historical documentary sources accumulate a large number of episodes, but their information is descriptive and only partially quantifiable. Therefore, adaptation by means of cataloguing and classification criteria are required in order to have a quantitative component for analyses of the information obtained on broad spatial and temporal scales. Largely, this information is unpublished and is gradually recovered in different research projects or during the preparation of local/regional studies or academic papers. Therefore, the creation and application of specific methodological tools that could take advantage of these information retrieval efforts for the creation of large, unified databases is justified.
A common procedure for the classification of individual historical floods involves the use of indices that reflect the degree of severity of the episode [
3,
4,
5,
6]. The classification according to impact depends on human exposure to floods and reported damages. These are not always directly related to the physical magnitude of the flood, as they depend more on the degree of exposure and vulnerability of the affected person at any given time. Disentangling the different categories of information (hazard, exposure and vulnerability) from historical documentation and the role played by each of them requires a multivariable and quantitative classification approach that has not yet been explored. However, when episode information is detailed, authors classify according to the causes of the flood [
7] or the value of the peak flow [
8], although the determination of the peak flow may not be easy or accurate [
9]. The reality is that there is no agreement on what the components of a good classification are, let allow a unified method [
7], as the classification system depends on the input information and the intended treatment of the classified data.
1.2. Objectives and Structure
The main objective of this paper is to present a numerical system (qualitative) of classification of historical flood events. This system seeks to differentiate the magnitude of the hydrological response (physical processes) from the impact on society, since there is not always a direct relationship between the danger and the damage caused. Moreover, the method must be able to work with different types of flood events (pluvial floods, fluvial floods, marine storm floods, torrential rainfalls, etc.) and a wide variety of data sources.
This will improve the analysis of a broad time scale in which not only the flood episodes of the historical period but also of the modern instrumental period can be integrated.
The article includes a description of the existing databases on historical floods in different countries. It details the initiatives and the situation in Spain. Finally, the proposed classification system is described with some study cases as an example of the capacity of the proposed system to integrate the information with quantitative and cartographic support.
1.3. State of Art of Historical Flood Databases
1.3.1. Characteristics of Sources and Available Information
The required information for the reconstruction of flood events on a historical level is presented in multiple documentary and bibliographic sources. Examples include: Administrative documentary sources of local civil and ecclesiastical authorities; private documentary sources such as diaries and memoirs; and bibliographic sources, such as local histories or descriptive works on singular episodes. Their common feature is their qualitative character with a limited quantifiable component. A number of different criteria can be applied for the description and characterisation of this information.
Previous fieldwork experience in the Spanish Mediterranean basin has led to a classification based on the reliability of the sources and their information for use in climatic and meteorological reconstructions. To summarise, three types of information sources are identified [
10]:
- +
Type 1. Primary sources. Information on flood events generated by contemporary eyewitness authors.
- –
Subtype (a). Documentary sources.
- –
Subtype (b). Local newspapers.
- +
Type 2. Secondary sources. Information obtained from primary sources by authors who are not eyewitnesses.
- –
Subtype (a). Scientific literature.
- –
Subtype (b). Historiographical sources and thematic papers.
- +
Type 3. Tertiary sources. Information obtained from secondary sources by non–presencial authors.
- –
Subtype (a). Technical reports.
- –
Subtype (b). Non–specialized works and social network collections.
For these types of information sources, those of subtype “a” correspond to objective and/or systematic sources, which cover a large part of the events that took place. Those of subtype “b” correspond to subjective and/or sporadic sources, which only cover a part of the events [
10].
These criteria may be distant or different from the most common in historiographical research, but they are the ones that have given the best results in the identification and characterisation of extreme natural phenomena on the Spanish Mediterranean River Basins. They have been applied since 2013 in the national PREDIFLOOD and MEDIFLOOD projects without generating problems or operational conflicts in the undertaken projects. Different historical flood chronologies were built following these criteria and methods. The result of the climatic and meteorological analysis shows that preparation of the data is positive [
11,
12,
13,
14].
The sources of information already have a consolidated methodology for their identification and selection. On a practical level, the sources of information selected as meeting the quality criteria for any research start–up are [
10]:
- +
Type 1. Administrative documentary sources of local, civil and ecclesiastical authorities for the historical period. Local press for the modern period.
- +
Type 2. Local Historiography.
- +
Type 3. Various material available on social networks.
- +
Epigraphic limnimetric records (Water Flood Marks).
- +
Instrumental records.
1.3.2. Studies with “Serial” Information
The qualitative information on floods obtained from historical sources is organised into simple classifications because its aim is to enable the analysis of all types of cases over long periods of time. Flood cases are locations with a documentary record of flood. When flood cases of different locations are produced by the same meteo–hydrological episode, all flood cases are organized and defined like a unique “flood episode”. However, in historical time it is frequent that flood episodes only contain information from one flood case. A classification of three categories is generally accepted for flood cases, although with different terminologies and modifications adapted to the hydrological behaviour of the different regions studied.
These criteria are a combination of hydrological evidence and social impacts. In Spain, a classification of three categories has been used [
15]:
- (1)
Ordinary floods: No overflow, no damage.
- (2)
Extraordinary floods: overflow, damage to property.
- (3)
Catastrophic floods: overflow, destruction of infrastructure.
The results obtained from this classification are used in studies aimed to identify and characterise patterns of climate variability within the Little Ice Age. It only uses information related to relevant geographical locations, such as large cities or areas with significant infrastructural elements. For these locations, chronologies of flood events are established and their frequency is analysed. Countless projects have been generated for different European regions and river basins under this pattern, and as more information has become available, new updates have been generated, as in the case of the Spanish Mediterranean River Basins [
11,
12,
15,
16]. Recent works are proving that the methodologies used on a continental scale were consistent with the projects to characterise floods in Europe during the 16th century [
17], or the most recent example using dozens of chronologies for Europe for the last 500 years [
18].
However, information organised in series or chronologies for specific locations, or even their aggregation in regional indices, reduces the analysis capacity. During the information treatment process, a lot of material is discarded because it is outside the selected locations and subsequently is not used. In the process of reconstructing past events, there is always a doubt about the usefulness of any information: can one work with demanding criteria and discard material, or should all the information collected be taken into consideration because it could contribute to a better understanding of the event?
It is reasonable to think that a different organisation of information is needed to tackle work in high spatio–temporal resolution. This approach requires the recovery of as much information as possible, as well as its integrated processing and analysis, by means of a new configuration of criteria. The use of all the information available in historical episodes allows an effective interdisciplinary approach, dealing with meteorological/climatic, hydrological and social aspects. An example of this approach has been the reconstruction of the flash flood event recorded in Catalonia on 23 September 1874, known as “Aiguat de Santa Tecla”, which caused 535 deaths in a few hours of river flooding [
19].
1.3.3. Current Historical Flood Databases
Current digital resources allow the processing of information from historical sources in a systematic way, exploiting their contents as efficiently as possible. In addition, they make it possible to store large amounts of information in various formats, to organise it and to improve it gradually. These capabilities are driving the creation of large databases on a national and international scale for historical and instrumental information on meteorological variables and extraordinary hydrometeorological events.
The “serial” procedure discussed in the previous section was valid for basic historical climatology, but methodological progress is needed. It seems clear that an intermediate information preparation phase in large databases is desirable for a more flexible and integrated research. The initial objectives can still be achieved, but the capacity for other lines of research is also enhanced. One example is palaeometeorological reconstruction, the classification and typification of severe episodes, or the more precise characterisation of documented impacts and social vulnerabilities in the study of severe hydrometeorological events.
There are several examples of initiatives focusing on the creation of databases on historical weather and climate information. One of the oldest initiatives is the Euro–Climhist database, created by Dr. Christian Pfister of the University of Bern, Switzerland (
https://www.euroclimhist.unibe.ch/en/, accessed on 18 November 2022). Other more recent initiatives are at the national level, such as the UK [
20,
21] or France’s BDHI [
22]. In Germany, there is an even more comprehensive or ambitious initiative: TAMBORA (the climate and environmental history collaborative research environment). In this database, which also covers information in any format, collaborative mechanisms are proposed so that all citizens can actively participate in it [
23]. Currently this database not only compiles information on floods, but also deals with all kinds of climatic and environmental information, such as droughts [
24].
A final aspect that shows interest in these initiatives is creation of a thematic network at the international level to promote the exchange of experiences in the field of historical flood events: the Flood Working Group (FWG), sponsored by PAGES (Past Global Changes) Programme.
Spain also offers initiatives aimed at the creation of databases on historical floods. Two episodes of catastrophic floods encouraged the cataloguing of historical episodes. The first was in October 1982 in Valencia and Murcia Regions and caused 40 fatalities and losses of EUR 300 M [
25]. The second was in November 1982 and affected Catalonia Region causing 26 fatalities and estimated losses of EUR 271 M [
26].
Based on these episodes, Spanish administrations launched an effort in 1983 to compile information on similar episodes in historical times, creating a national level database organised by river basins: National Catalogue of Historical Floods (CNIH), Civil Protection, Ministry of the Interior, Government of Spain [
27].
These works in Spain have been reinforced by the European Directorate 2007/60/CE (European Parliament and European Council), on the assessment and management of flood risks and in Royal Decree 903/2010, of 9 July, on the assessment and management of flood risks. Since 2006, the database has been publicly accessible online and has been updated several times, up to 2014. Following the European Directive, the Hydrographic Demarcations are developing different initiatives for better flood risk management. However, the work on historical episodes is far from the potential offered by the documentary sources of historical archives.
1.3.4. Initiative of the ARCHIVE Association
The interdisciplinary research group that has developed the databases that support the proposed classification system has been active for the last 12 years. It received funding from two national projects (PREDIFLOOD, 2013–2015 and MEDIFLOOD, 2016–2019) that allowed the creation of a historical flood database for Catalonia (AMIC). Its results substantially improved the efforts made in Spain until then (see
Table 1 and
Table 2). The existing indices to assess the quality of historical flood databases are applied to Spanish databases [
28]. Coverage Index combines spatial and temporal dimensions of the data (Coverage Index = (area × years)/1,000,000 km
2). The combination of the number of flood events with the Coverage Index defines a definitive assessment of the quality of the database (Density Index = number of flood events/Coverage Index). According to these criteria, the CNIH database (2014 version: Density Index 7.5) is clearly improved by the AMIC database (2019 version: Density Index 48.5).
This research is no longer funded by national projects on an ongoing basis, so an association has recently been established to enable the database to continue (ARCHIVE from the Catalan language: Associació del Risc Climàtic Històric. Impacte, Vulnerabilitat, Exposició/Association of Historical Climate Risk. Impact, Vulnerability, Exposure). The new activity has reinforced the extension of the database to cover rivers draining to the Spanish Mediterranean coast from the French border to the Strait of Gibraltar (AMICME database). According to the flood database evaluation system used [
28], the new database covers a large territory, but for that reason the density index has been temporarily reduced (version 2021: Density Index 22.3). The catalogued flood events include the following information: complete date, affected river and basin, points or municipalities with documented flooding, georeferencing, flood level, material damage and impact to people.
2. Materials and Methods. Proposal for a Segregated Classification System
2.1. Background to the Proposed Methodology
The capabilities of computer resources make it possible to access a greater quantity and diversity of primary sources, and to efficiently manage the information that can be generated. This context requires renewed methodologies and procedures for cataloguing and classification.
Work on the Spanish Mediterranean River Basins since 1998 employed a three–category quantitative classification system based on a combination of fluvial behaviour and the severity of documented impacts [
15]. This system was developed locally for a Catalan coastal sector (Maresme County) with good results for the 18th–20th centuries [
29]. The only progress of this classification system has consisted of enriching the number of classification categories to five [
10].
The analysis of phenomena at different scales and with different characteristics also makes it advisable to use unified and general methodologies and procedures. The application of specific ad hoc methods for each case of study would no longer be efficient, making it difficult to connect different episodes in analyses at different spatio–temporal scales.
The AMICME database presented here is a structure that aims to organise the materials and information collected for floods over a broad time period and in a multidisciplinary environment. It is still a preliminary structure, open to modifications and improvements, and will undoubtedly be further developed as materials from different sources of information are introduced.
There are numerous precedents of flood databases in the context of public administrations in Spain (e.g., CNIH already mentioned). However, their purpose is more directed to the storage of information than the preparation of data for multidisciplinary analysis. The proposal generated by the AMICME database takes maximum advantage of these experiences. However, as far as possible, we have avoided creating a typical database, resulting in a one–off compilation effort, for specific purposes.
The initial idea of having a simple catalogue of cases (geographic point where the flood occurred) and events (episode including all flood cases) evolved into the creation of a complex structure that could accommodate and organise the set of materials recovered from each flood. Additionally, it also evolved into a series of consultation tools to reference and organise access to detailed information when needed for analysis from different approaches.
In order to improve the identification of flood events and facilitate access to that information, it was decided to define a new classification system that could overcome the limitations of the system in use since 1993 [
29]. This first three–level classification system combined fluvial and anthropic aspects without the possibility of differentiation. It also prevented the possibility of linking the occurrence of cases with the extent or complexity of flood events as a whole, since its values were only used in the generation of serial chronologies at annual or seasonal resolution.
After more than 30 years, this paper presents a new classification system that makes it possible to differentiate three dimensions or variables of the phenomenon: the hydraulic behaviour of river floods, the impacts on structural elements and the vulnerability of the population. On the other hand, the extent of the events can also be quantified by distinguishing the affectation by flood case and the number of rivers and river basins involved.
2.2. Proposed Segregated Variables
The proposed classification system organises the information into three different variables, each with a numerical scale of four categories (0 to 3). Separation of the variables allows a more precise analysis according to the objectives of every research, avoiding the integration of different information into the same numerical expression, which produces an irreversible loss of detail. The variables that make it possible to segregate the historical information available for the last 500/750 years on the Spanish Mediterranean coast are the following:
- +
Variable 1. Hydraulic behaviour of the river flood.
It responds to the physical behaviour of the hydrometeorological risk (hazard). It is the main component of a climatic risk situation due to excess rainfall because it produces an objective response in the fluvial system that can also be quantified by the reconstruction of the maximum discharge reached by the flood event.
Historical documentation does not preserve instrumental records or systematic magnitude measurements of river floods. However, institutional and private testimonies perfectly identify fluvial behaviour at least in order to be able to classify them by categories.
- +
Variable 2. Flood impact on structural elements.
This provides a response to the objective degree of exposure to climate risk. The level of damage caused to permanent constructive elements can be an indicator not only of the overflow level reached but also of the force or speed at which flooding was occurring.
The balance of damages and the description of the most relevant incidents produced by each river flood are the best described elements in the historical documentation. The reason for this is obvious: every affected community must assess the damage and destruction and deal with its repair or reconstruction in order to be able to recover normal activity as soon as possible.
- +
Variable 3. Social/personal vulnerability to the flood.
It responds to the subjective degree of vulnerability to the impact. The number of people directly affected by a flood event is not a direct indicator of the severity of the event, but shows the interaction between the event and the social context in which it occurs.
The human component is the most discontinuously documented and reflects highly disparate situations. It is a factor that does not depend on objective factors. Certain perceptions and attitudes can generate situations with different outcomes, ranging from victimless self–protection in the face of a major flood to the loss of human lives in avoidable situations.
2.3. Proposed Quantification of Each Variable
The categories propose their numerical classification from 0 to 3 according to the magnitude or severity of their effects. Their informative elements are different, but it is intended that the scales of the four categories have their numerical expressions assimilable to each other as far as the respective severity level is concerned.
- +
Variable 1. Hydraulic Component
The description of every flood case in its natural characteristics in the river system is the element of best objective identification by direct witnesses. Its values are defined according to the behaviour of every river course beyond its normal conditions.
- –
Value 0: Insufficient information for a definitive classification. When the testimony does not clearly define the behaviour of the water in a river course during an episode, it is prudent not to assign a numerical value to it, pending more precise and reliable information.
- –
Value 1: In situ pluvial flood or marine flood due to marine storm. These are situations in which the river system is barely responsive. After heavy but small–scale rainfall, water is retained and floods low–lying areas. These floods are often aggravated by drainage problems caused by human constructions, such as structural elements or urban development where drainage networks with sufficient capacity have not been provided.
- –
Value 2: Simple river flood, within the usual river bed. An episode of torrential or prolonged rainfall, when occurring over a wide area, causes an increase in the flows of the river system. If the magnitude of the event is moderate, the event results in an ordinary flood, without ever overflowing the usual bed.
- –
Value 3: River overflow of any magnitude. Widespread heavy or torrential rainfall of sufficient magnitude causes increases in flow that cannot be assimilated by the usual channel and overflow occurs. The circulation of water in unusual areas is an easily identifiable circumstance.
- +
Variable 2. Structural Component
This category describes the effects on permanent constructions or activities of human origin, with a high exposure but relatively low vulnerability. The severity of the event is transmitted in a gradation of impacts on elements of relatively objective and constant behaviour such as building structures and crops.
- –
Value 0: Insufficient information for a definitive classification.
- –
Value 1: Minor disturbance with inconvenience or damage to movable property or temporary exposed activities. These are reversible problems that occur in flood–prone areas, such as basement flooding, damage to vehicles and street furniture.
- –
Value 2: Moderate damage with loss of movable property and damage to permanent structures. These are situations in which the force of the water affects some built elements with considerable damage. Some examples are hydraulic infrastructures such as protective dams, bridges or watermills, as well as damage to buildings and public roads. In any case, it is damage that requires a repair intervention with an economic cost and significant alterations until normality can be restored.
- –
Value 3: Severe affectation with partial or complete destruction of permanent structures. The response of the river system to a severe event can result in the partial or complete destruction of any infrastructure or building in the vicinity of the water course. Both in historical and modern times there are elements susceptible to this destruction. The list would be endless. In historical times, in addition to buildings, farms were also sensitive elements where overflows could cause losses due to the washing out of crops and permanent crops (vineyards, fruit trees) and irrigation installations and for regular work (irrigation ditches, warehouses, silos, dams). In modern times, supply installations, often close to water courses, have proved to be significantly sensitive: drinking water distribution networks, sewerage, electricity, gas and communications supplies.
- +
Variable 3. Human Component.
This element of classification appears significantly in the most recent floods and requires a segregated classification of structural impacts due to the special idiosyncrasies of human beings when faced with situations of natural risk. Their responses vary greatly depending on the cultural background and the existing perception of climate risk and the capacities of the available resources.
- –
Value 0: Insufficient information for a definitive classification.
- –
Value 1: Minor affectation with discomfort or displacement for self–protection. These are situations in which the integrity of the population is not threatened, but their usual activities are altered. Mobility is particularly affected, in such a way that routes or schedules are voluntarily or involuntarily modified in journeys and in private and public means of transport.
- –
Value 2: Moderate affectation with evacuations and/or forced lockdowns. These are situations in which the presence of water is already a threat to the physical integrity of people. In some situations there are spontaneous evacuations or evacuations coordinated by the authorities. There may also be rescues in the face of imminent danger. The population temporarily loses its mobility, and either individually or at the direction of the authorities, movement is restricted and the population is isolated or immobilised.
- –
Value 3: Serious impact with injuries and fatalities. These are situations in which self–protection decisions or instructions from the authorities are not sufficient to avoid personal injuries and fatalities, either due to the behaviour of the water itself or due to the collapsing construction elements. This category also includes fatalities caused by failure to follow the instructions of the authorities or reckless actions in the course of the ongoing event.
This numerical classification system presents situations that are not well defined or that go beyond the criteria contemplated a priori. The main factor to bear in mind with regard to natural phenomenon is that the system is adapted to the most common circumstances typical of the studied area, the Mediterranean Basin, where floods are produced by torrential rainfall events and less commonly by extensive or persistent rainfall. There are other causes of flood events, which are covered by the same classification system even if their occurrence is minimal. Examples are episodes caused by rapid snow melt of large snow–covered areas, or breakage of natural dykes (formed by glaciers or landslides). However, events with human involvement are also recorded and catalogued, such as dam collapse due to natural events and/or technical inefficiencies (i.e., collapse of Puentes Dam, 30 April 1802, Guadalentín River, Lorca city; more than 600 casualties). Rapid emptying of dams due to technical decisions or tactical interest in war situations (i.e., flood episode of 26 July 1938 in Ebro River. During 115 days of Ebro Battle, five flood episodes were provoked to affect crossing attempts on the Ebro River).
Another circumstance that generates a notable impact on the classification system is the detection of spurious episodes, generated with the use of incorrect, erroneous information that does not correspond to a real existing event. In cases of obvious errors, the classification system does not generate numerical values, but rather the indicative “ERR” (from “error”, mistake, in the original language).
In this way, an identification code is generated for false or non–existent flood cases. The aim is to prevent their inclusion in any subsequent numerical analysis as if they were a real case. However, they should be identified precisely to recall previous studies that have used such erroneous information and to prevent them from being analysed in future research. If misinformation is completely suppressed, it may reappear in different studies without being detected in time. This should be avoided if possible.
2.4. Proposed Numerical Indices for Case Characterisation
A weighted composite index containing the information of the three variables above is proposed for characterisation of the flood cases. Combining the information from the three variables into a single numerical value allows an integrated analysis of the flood events that constitute each episode. The formula for the Index per flood event (I
c) is:
where:
xnatural variable = Index value for variable 1, Hydraulic Component.
xstructural variable = Index value for variable 2, Structural Component.
xsocial variable = Index value for variable 3, Human Component.
This formula weights each of the three variables that make up the classification system differently, placing greater emphasis on the variables with greater reliability and objectivity. Thus, the natural variable has a higher weighting because it is the phenomenon that is most reliably and consistently identified, as well as being the most objective of the variables. The structural variable has a medium weighting because it objectively reflects damage to build elements, but which are subject to human factors. Finally, the social variable has a neutral valuation due to its susceptibility to assess the vulnerability and exposure of the population affected by the flood. The information records are not subjective or erroneous, but the circumstances in which human casualties occur are inconsistent and with an important random component.
The index by cases generates values similar to those of the previous variables (0 to 3), which facilitates the reading of the data, their comparison and interpretation. It is a summary value that simplifies the information and allows integration by episodes.
3. Results. Application of the Classification System
This section provides examples of the application of the possibilities offered by the proposed classification system. The possibility of integrating with cartographic resources the totality of cases of flood events, and for very different historical periods.
This is a methodological initiative for which no previous references have been found in the scientific literature. The integration of historical and modern information has not been a common work in historical flood databases. However, the analysis of low–frequency events makes it increasingly interesting.
3.1. Cartographic Representation of Flood Events
One of the objectives of the proposed classification system is that it allows a direct and synthetic representation of the cases that compose a flood episode. In this sense, we show the cartographic representation of a set of six episodes with different casuistry, which allow us to illustrate the applicability and versatility of the classification system. The episodes represented have been selected according to different criteria:
- –
Temporal distribution. One episode per century is shown, from the 16th century to the present day. This tests the ability to synthesise flood events over long periods of time.
- –
Diversity of casuistry. Episodes have been chosen with as many different characteristics of fluvial behaviour and damage as possible, as well as different numbers of data records and different areas affected.
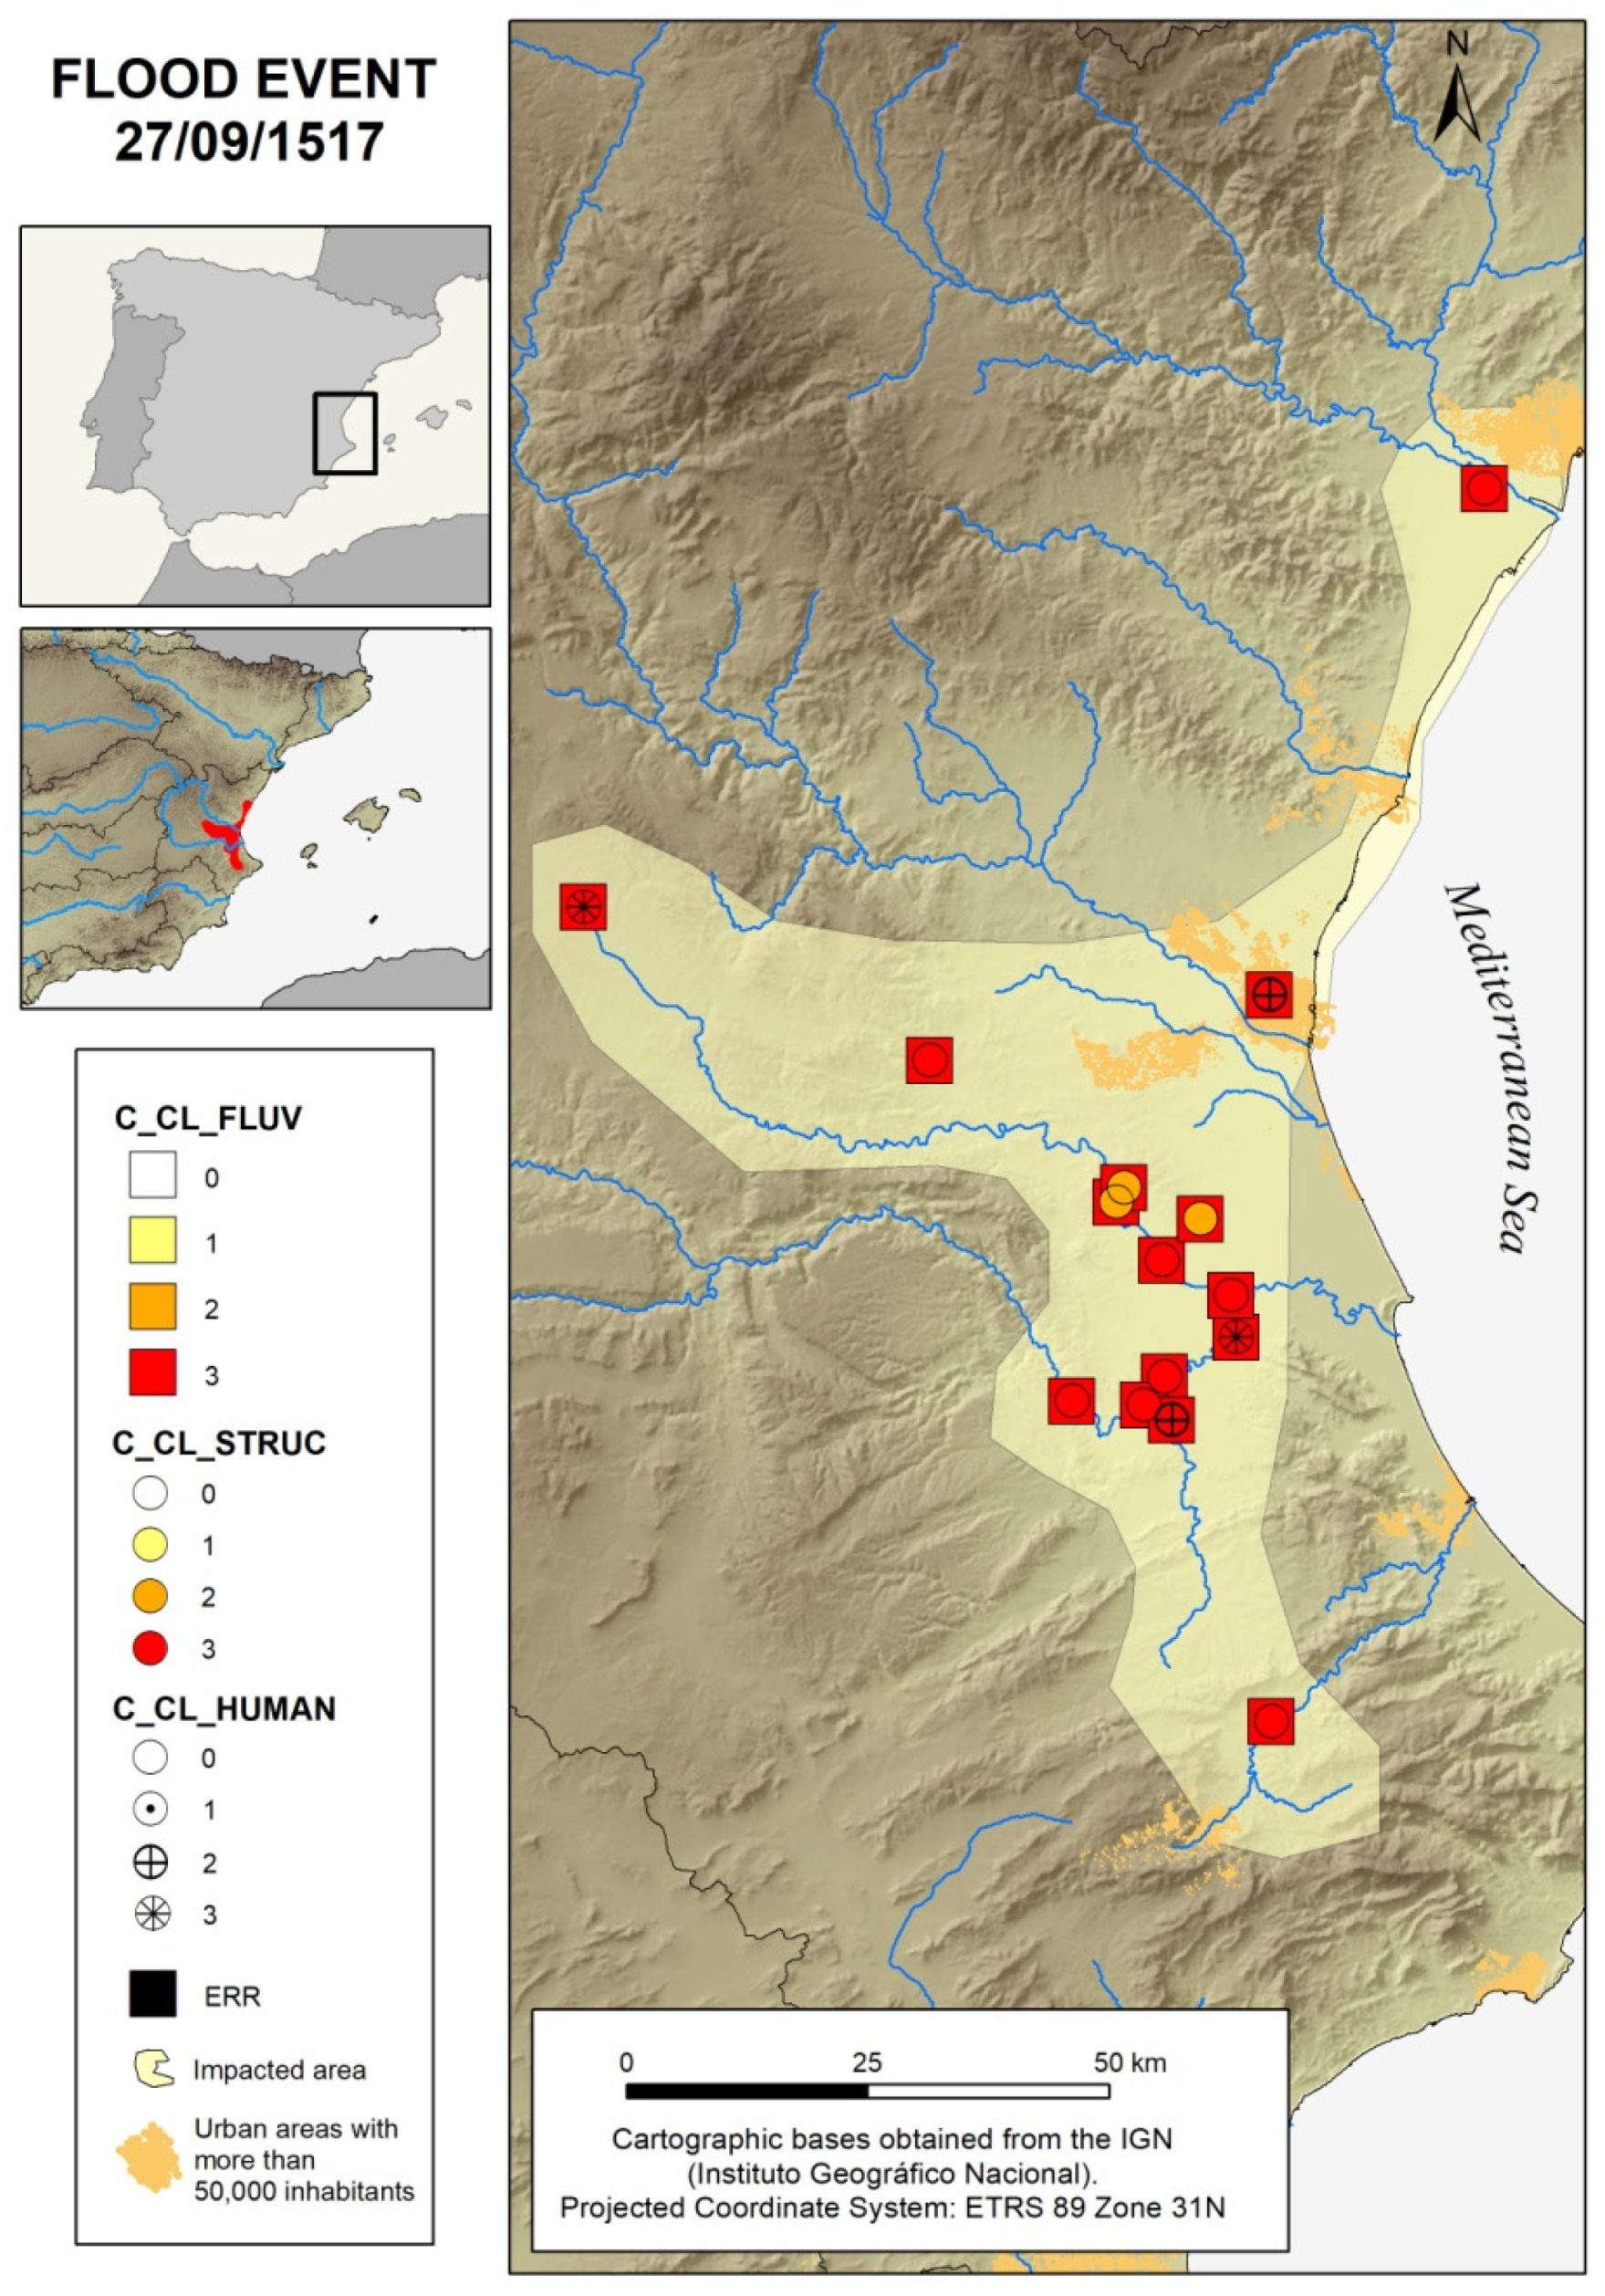
The first of the flood episodes depicted is that of the Kingdom of Valencia on 27 September 1517 (
Figure 1). This episode affected multiple river basins included on the Júcar River Hydrographic Demarcation (Júcar River Catchment Authority—according to Spanish Administration, Water Authority Institutions are organized by large Catchment Areas), and has a total of 18 flood cases in different towns and rivers. The representation of the cases of this episode allows us to see their distribution and their location close to important river courses of the Júcar Hydrographic Demarcation. The characteristic of all the cases in this episode is that they reach the maximum level in the natural variable (river overflow), causing serious damage to structures in the affected populations. On the other hand, there are few cases in which there were personal casualties in these villages.
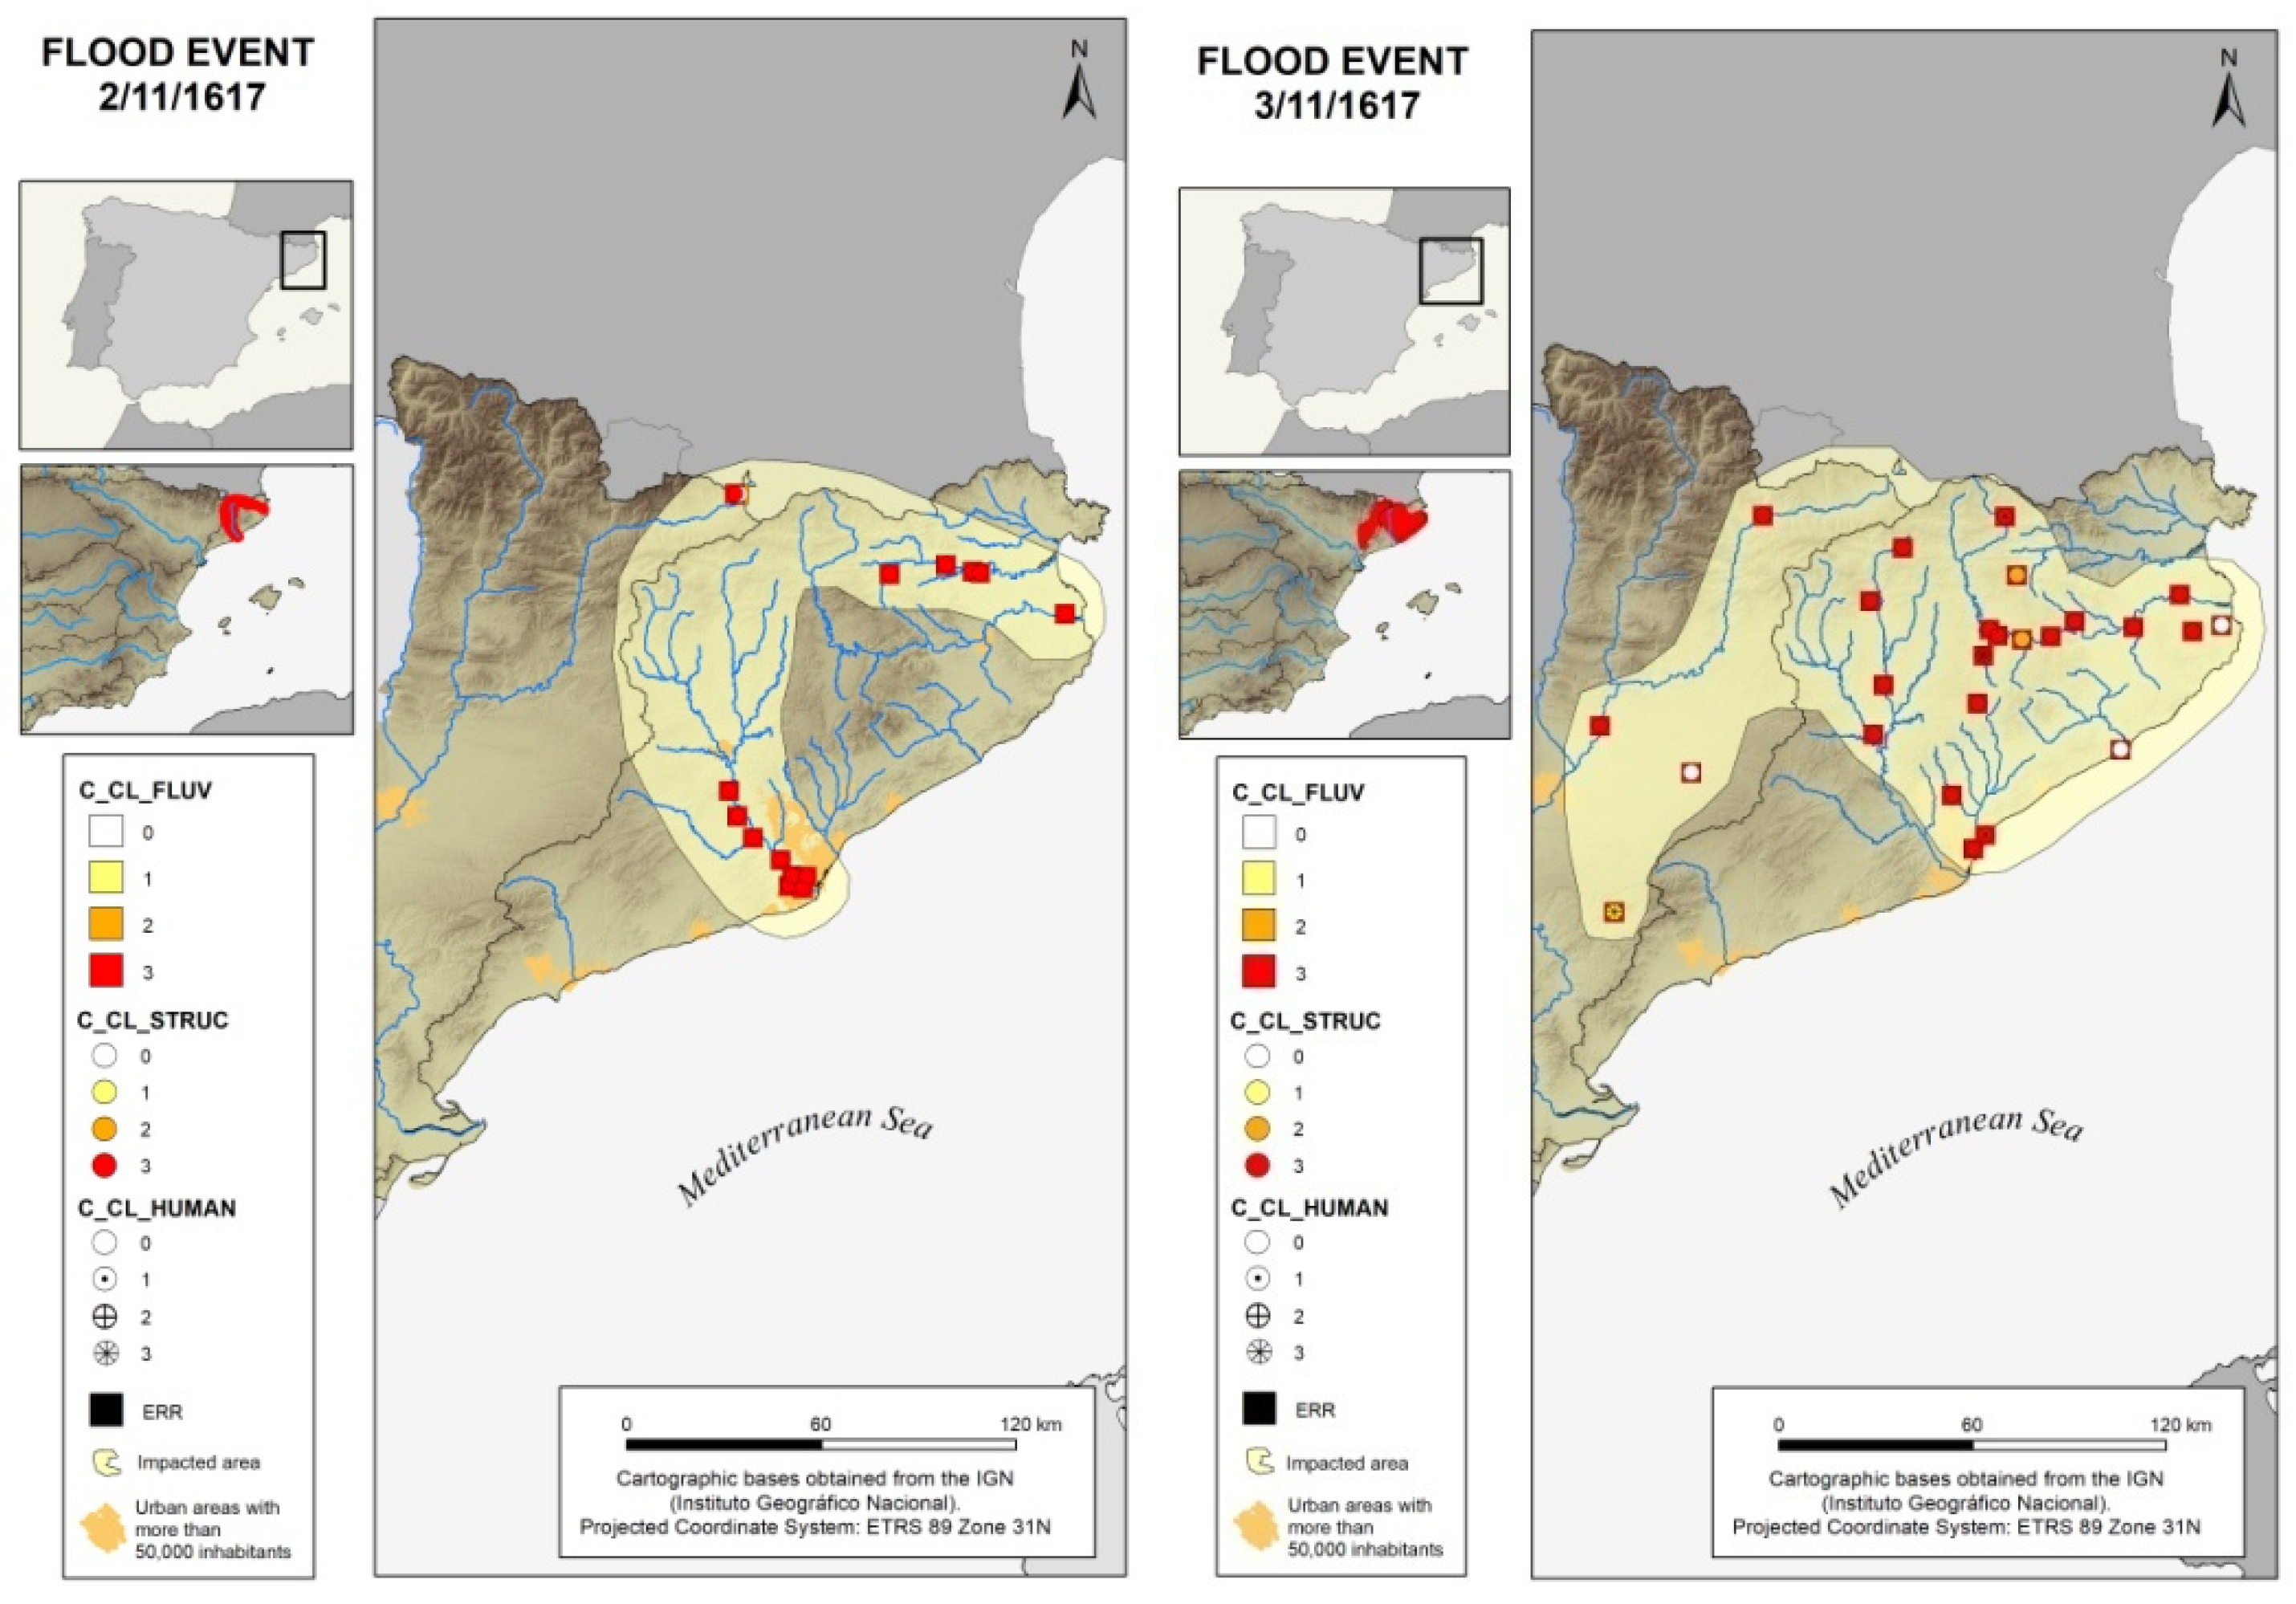
The second episode is that of 2 and 3 November 1617 (
Figure 2). This episode affected three different Hydrographic Demarcations, causing 84 cases of flooding. It has been decided not to represent the cases of flooding that occurred in the Júcar Basin in order to focus the mapping on the basins with the highest concentration of cases. Even ignoring remote cases, the magnitude of the episode justifies the division into two different daily maps that represent the dates of the episode with the highest number of impacts. In the case of the impacts caused by the flood on the 2nd of November (
Figure 2, left), the effects are concentrated in towns near the Llobregat and Ter rivers in the Internal Catalan Basins. On the other hand, on the following day (
Figure 2, right), the effects were more widespread, affecting the headwaters of these river basins more severely and even affecting tributaries of the Ebro river basin, which is much larger. In both cases, it can be seen that this episode is also characterised by a large number of cases in which both the fluvial and structural variables are intense.
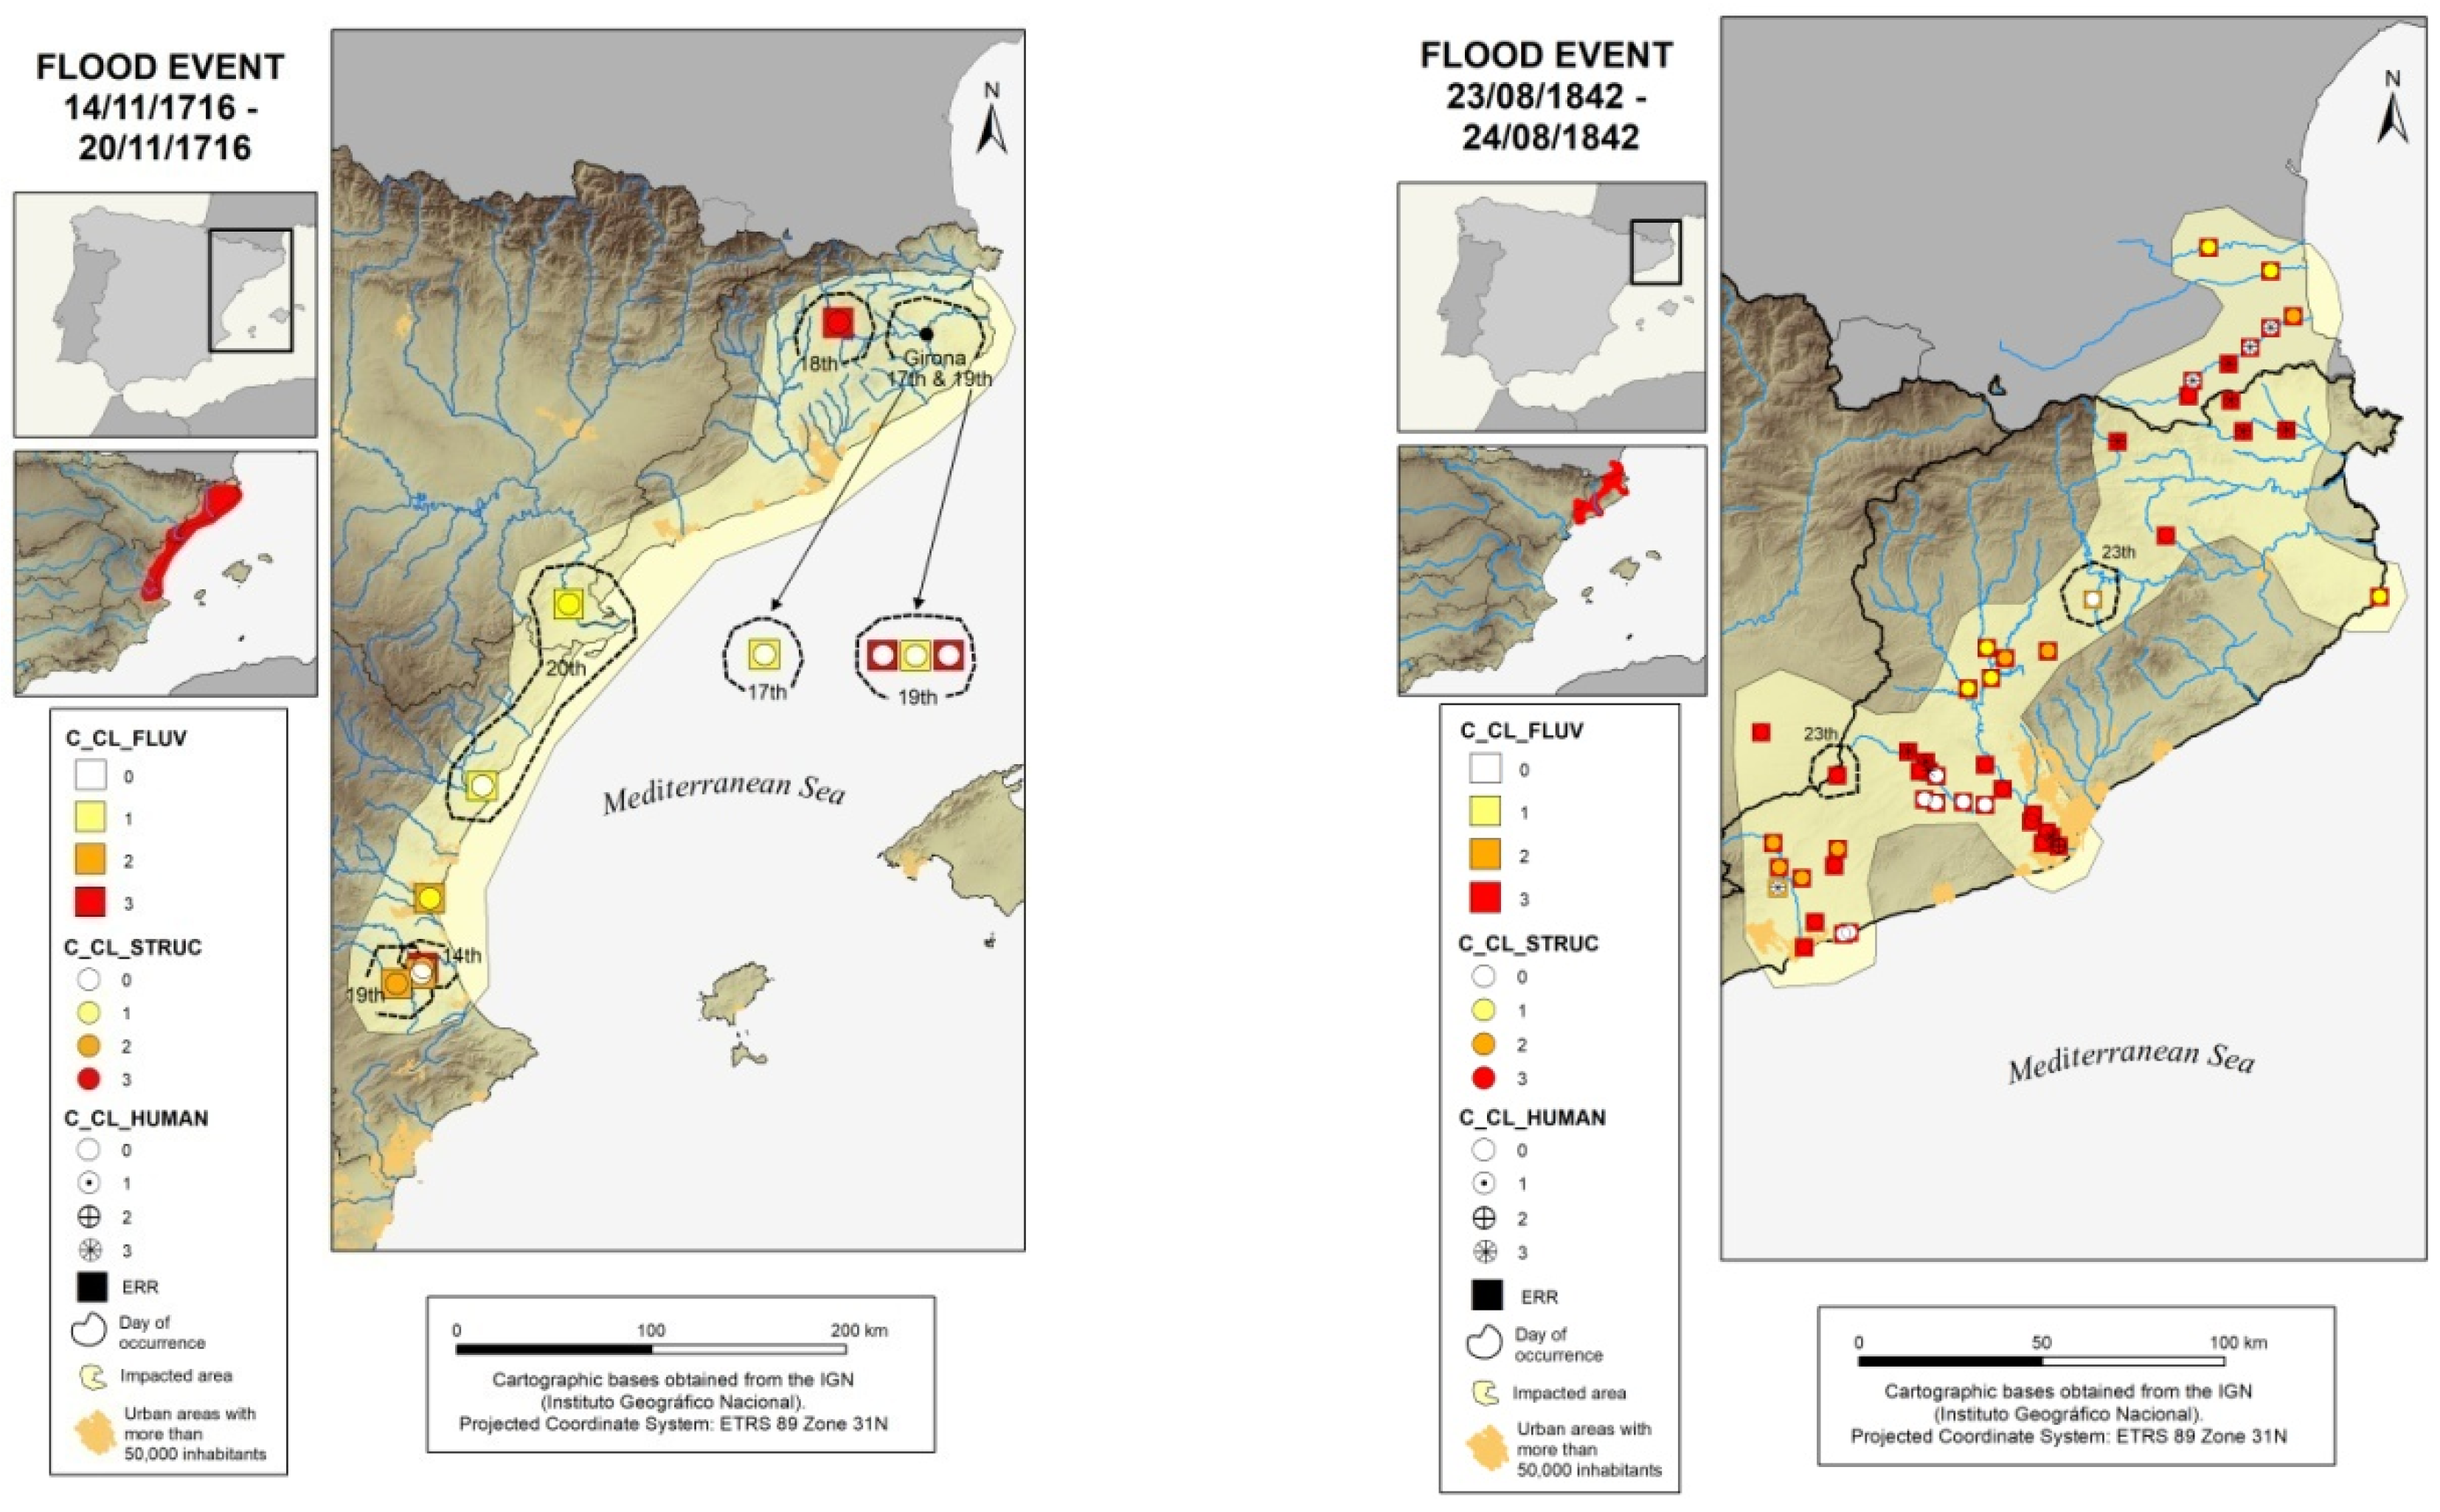
The third episode selected is from 14 to 20 November 1716 and caused damage along the Mediterranean coast of the Iberian Peninsula. This episode has 11 flood cases and affected three different Hydrographic Demarcations. This map serves as an example for the representation of episodes with more than one flood case at the same point.
The effects caused by this episode were widely distributed throughout the territory, with the most severe affectations occurring on the 19th and 20th in the city of Girona and, at the same time, in other villages along the Valencian coast (
Figure 3, left).
The episode selected for the 19th century is the one known as “Aiguat de Sant Bartomeu” on 23 and 24 November 1842. This episode affected a total of three Hydrographic Demarcations, causing 57 flood cases. Its affectations were mainly distributed along the coastal area of the Internal Catalan Basins (Catalonia) and the Pyrenean River Basins that run through France (
Figure 3, right). This episode is notable for having a few flood cases whose impact on structures was lower than in other episodes. On the other hand, the impact on the population was more significant, causing fatalities in many parts of the affected area.
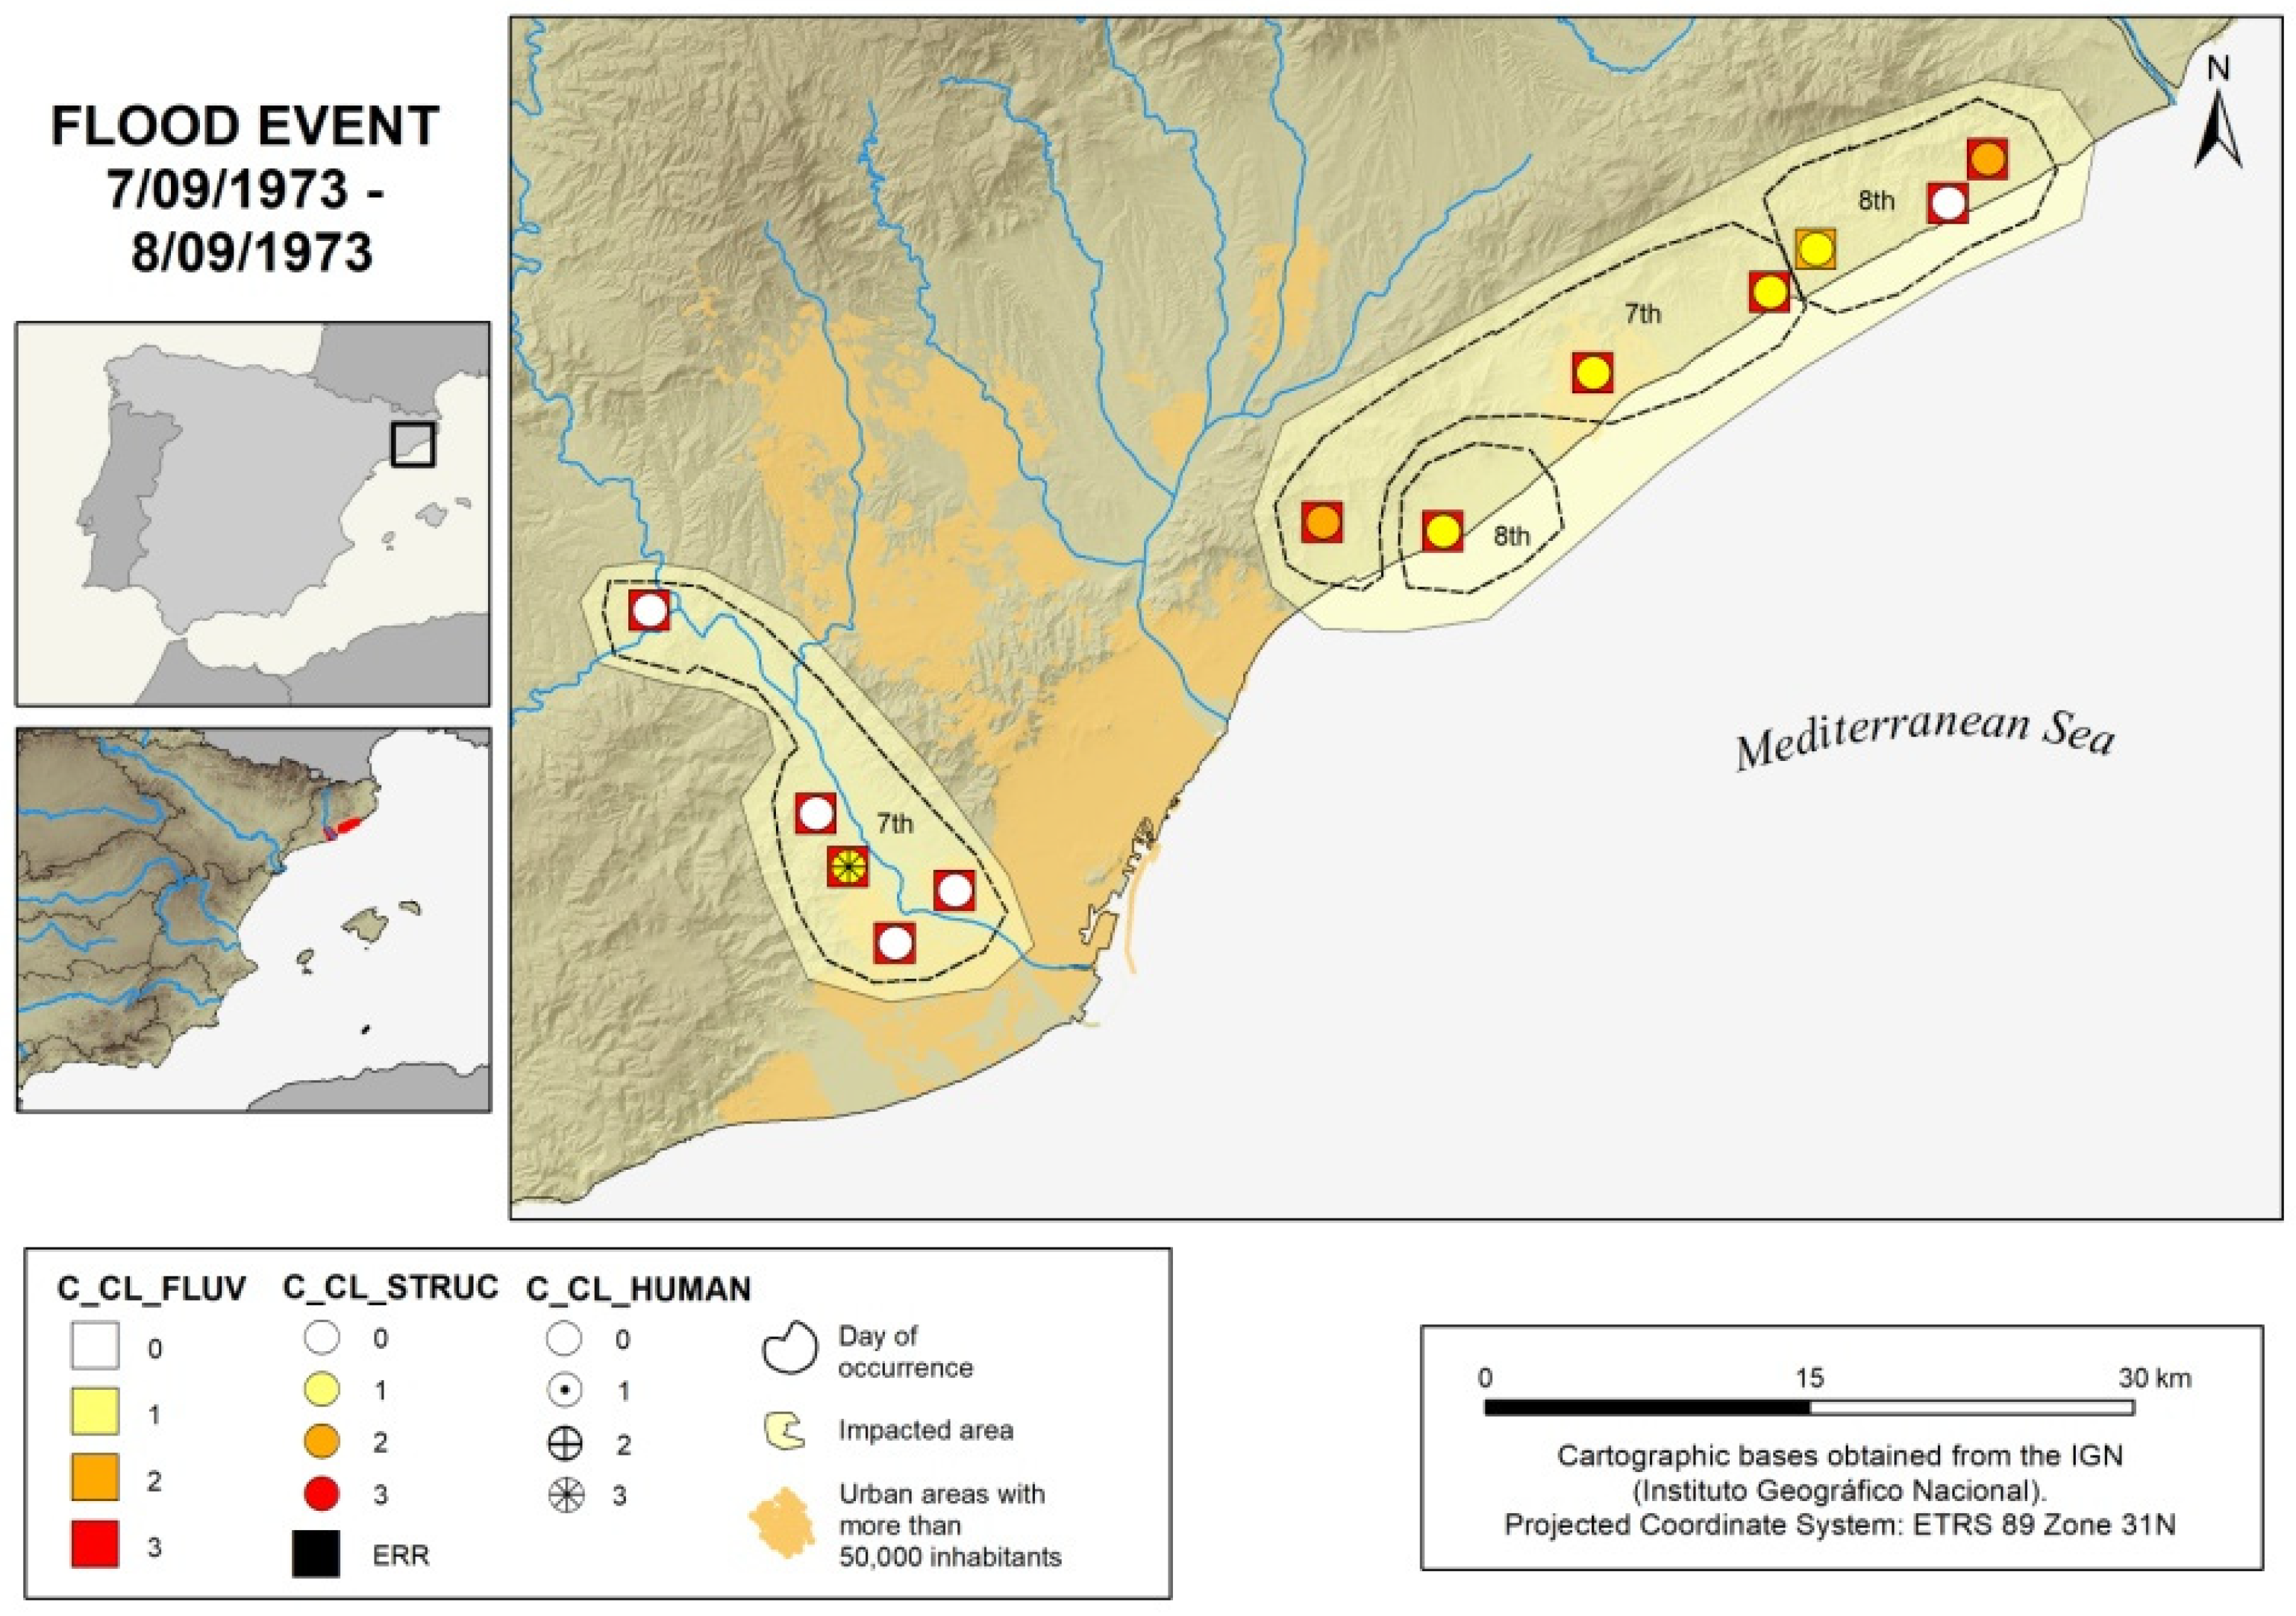
The fifth episode selected is that of the floods of 7 and 8 September 1973. This episode affected a single Hydrographic Demarcation, the Internal Catalan Basins, and caused 15 flood cases. The effects of this episode were concentrated in two specific areas. On the one hand, the mouth of the Llobregat river, where the river overflow was severe but caused little structural damage. On the other hand, the coastal area north of the city of Barcelona, the major urban area, was equally affected by floods but these caused more structural damage (
Figure 4). The impact on the population was limited, focusing on the area of the mouth of the Llobregat river.
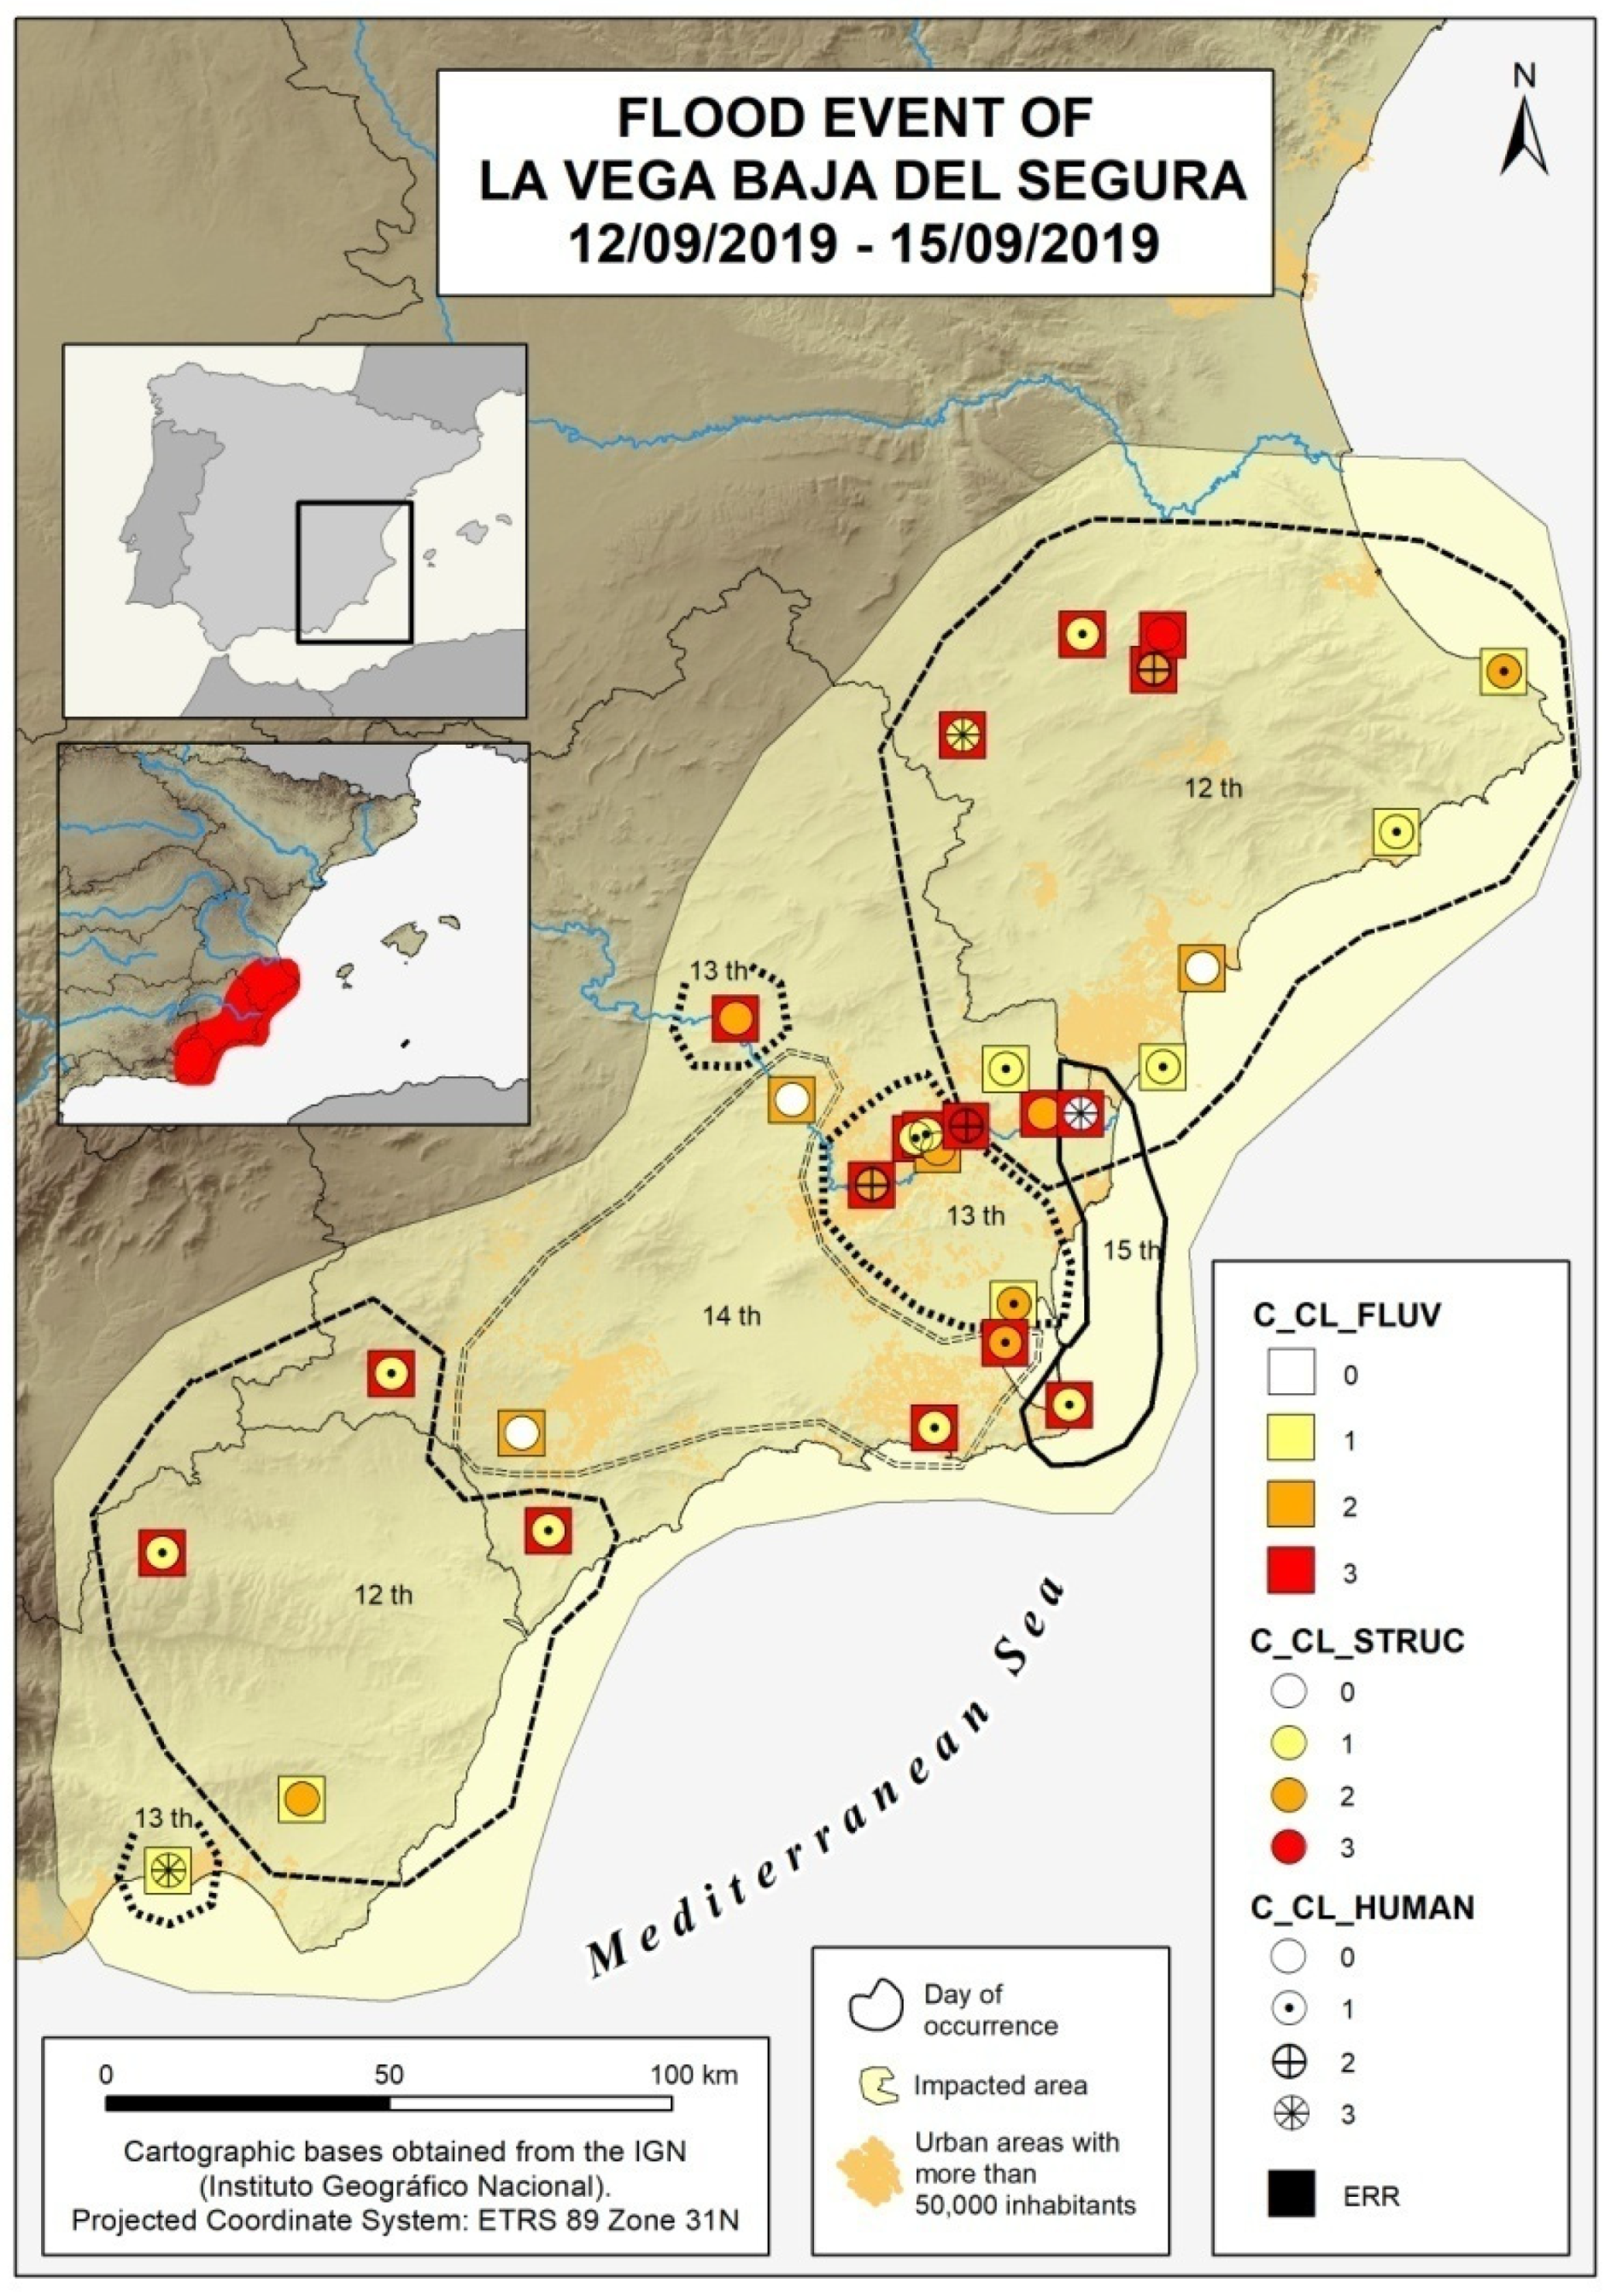
The last selected episode belongs to the 21st century. It is related to a DANA (Cut–Off Low, or Cold Drop. In Spanish: Depresión Aislada en Niveles Altos) that mainly affected the county of La Vega Baja del Segura in September 2019. This episode affected a total of three Hydrographic Demarcations causing 35 flood cases (
Figure 5).
The effects of the DANA had a great media impact due to its repercussions, with various affectations on the urban areas of La Vega Baja del Segura. The river floods were intense, with widespread effects on the population, although the impact on infrastructure was moderate.
3.2. Numerical Characterisation of Flood Cases
This section shows the results obtained from the application of the proposed flood episode classification system mentioned above. Numerical values are shown for different episodes in which the information relating to the 3 variables used to calculate the Case Index (I
c) is synthesised, as well as the resulting values themselves (
Table 3). The table shows the episodes represented in
Section 3.1 and other significant ones have been added to provide more casuistry to give more richness to the application test. The aim was to compare the performance of the index with episodes of the greatest possible diversity, from episodes with a large number of cases, such as November 1982, to others with only a single case, a common feature in the oldest historical episodes.
4. Conclusions
In view of the information on extreme historical flood events potentially available in documentary and bibliographic sources, a series of preparatory phases are proposed in this paper. Firstly, the original information must be treated with historiographic criteria to make it as reliable and complete as possible [
10]. The next step proposed in this paper consists of the development and application of methodological criteria for the generation, cataloguing and classification of historical information in formats that allow subsequent meteorological/climatic and hydraulic/hydrological analysis. It also provides a starting point for future analysis on the social dimension of flood episodes.
The application of new methodological proposals will not in any case allow the data generated to be assimilated to quantitative instrumental information. However, the general objective of this paper is to facilitate the use of qualitative historical information with maximum efficiency in the analysis of severe flood episodes.
The quantitative classification systems by cases and episodes presented in this paper have been tested in the AMICME database with satisfactory results. Despite being applied to episodes with considerably different characteristics, both systems generate indices without spurious or conflicting values. Consequently, their use in large historical flood databases is feasible.
A relevant aspect of the case indexing system (Ic) is that it allows the information on the different variables (multivariable) involved in its definition to be kept segregated. This prevents the loss of detailed information for subsequent research or analysis. This segregation is not easy to manage, but its usefulness takes precedence. The proof of this complexity is the cartographic representations generated for specific episodes. The amount and diversity of information presented has required the design of a rather complex to read symbology. However, it preserves and shows nuances for each of the variables, a positive factor in the overall analysis of the flood episodes.


