
Study on the Spatial Differences in Land-Use Change and Driving Factors in Tibet


Abstract
1. Introduction
2. Materials and Methods
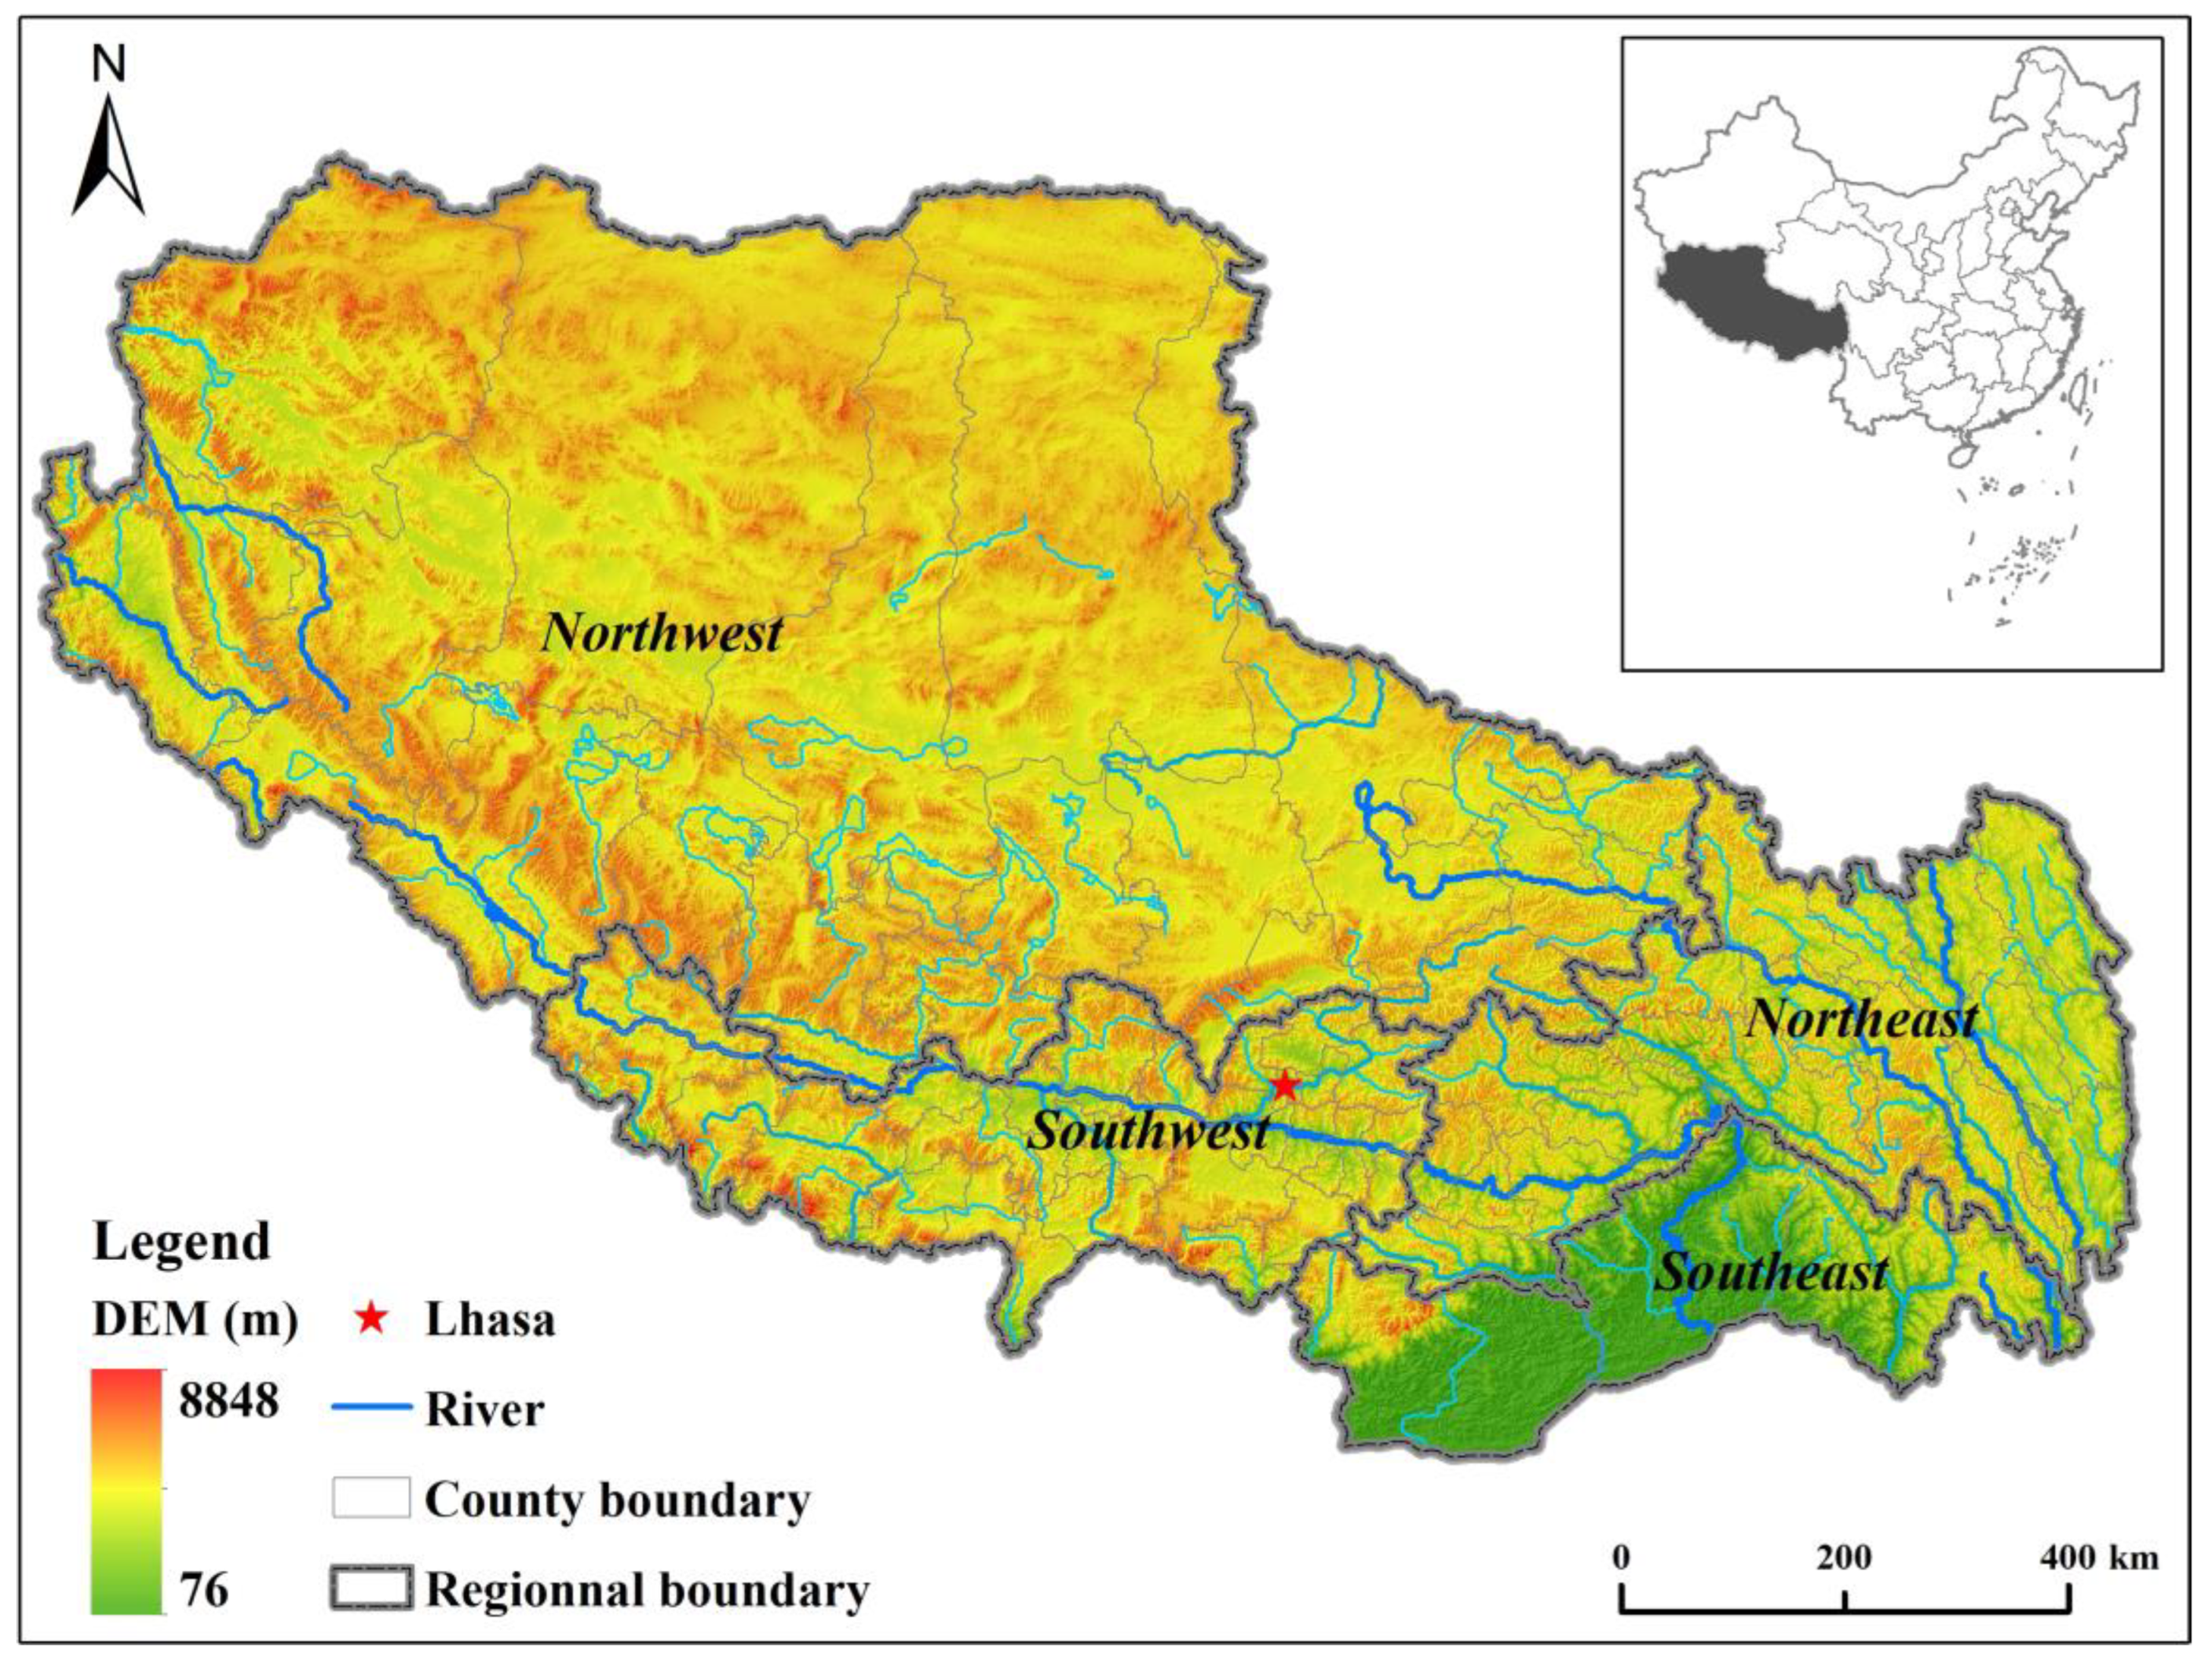
2.1. Study Area
2.2. Data Source and Processing
2.3. Methodology
2.3.1. Land-Use Change
2.3.2. Driving Factor Analysis of Land-Use Change
3. Results
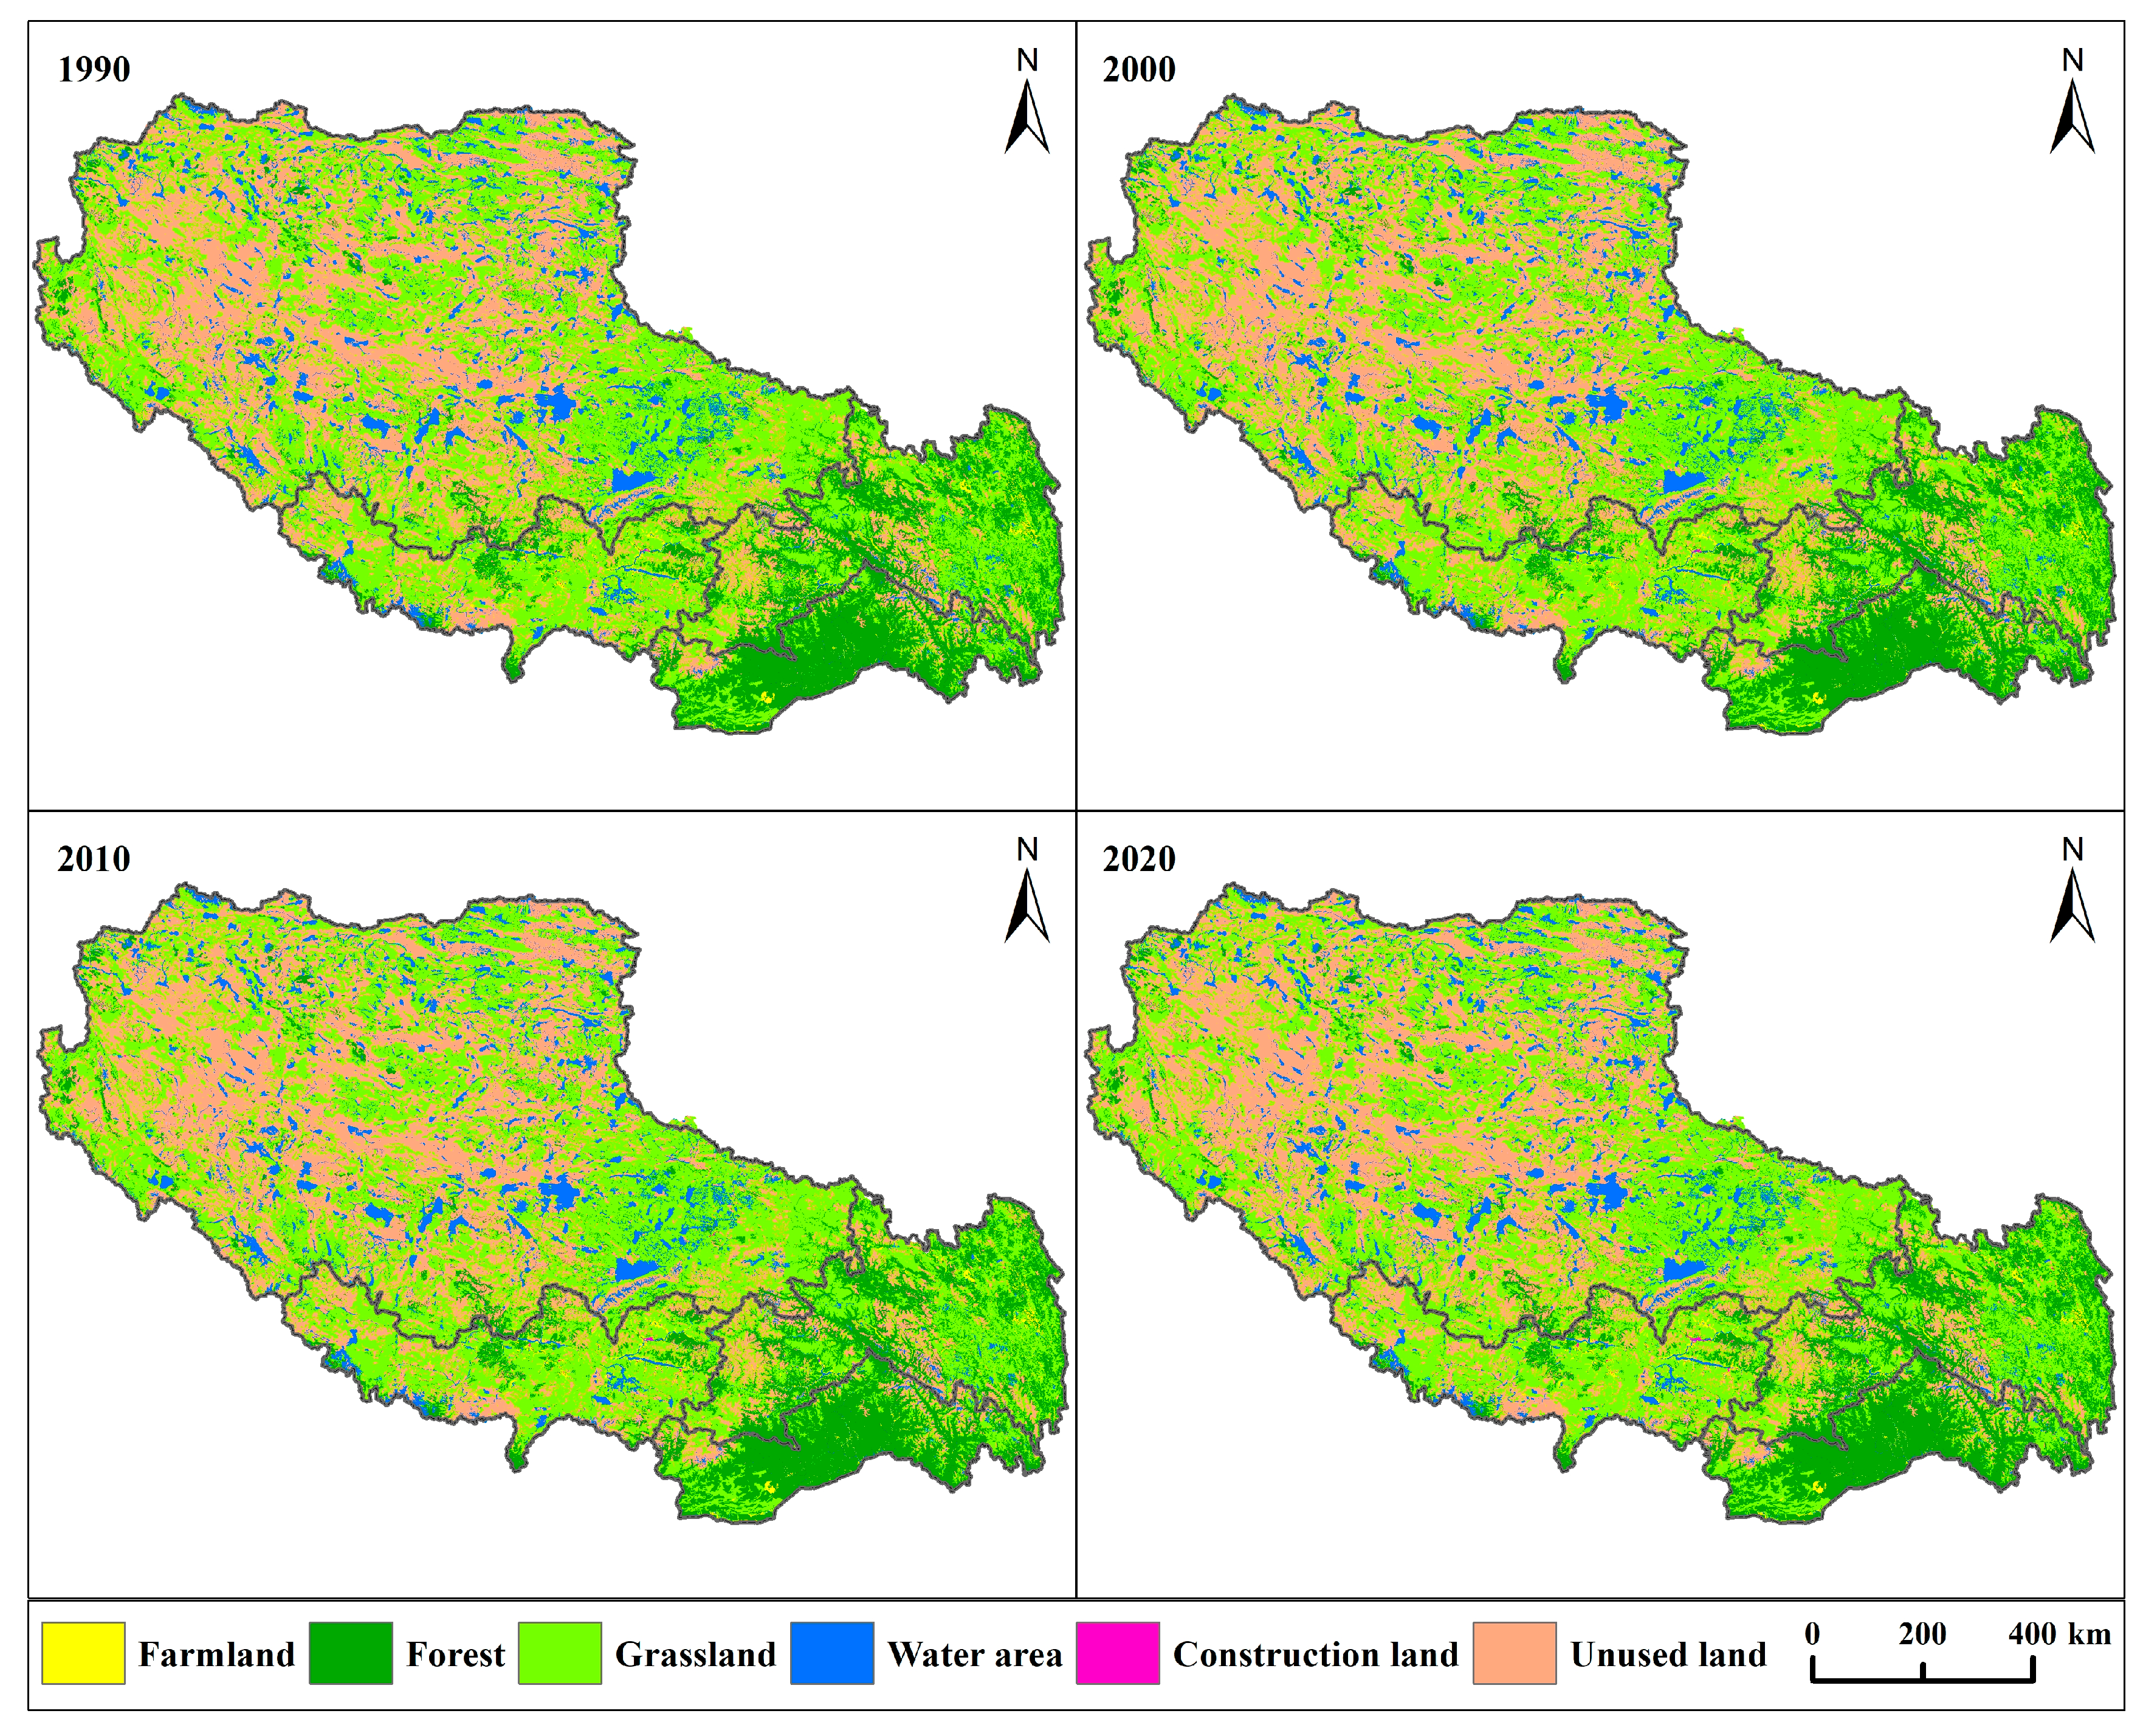
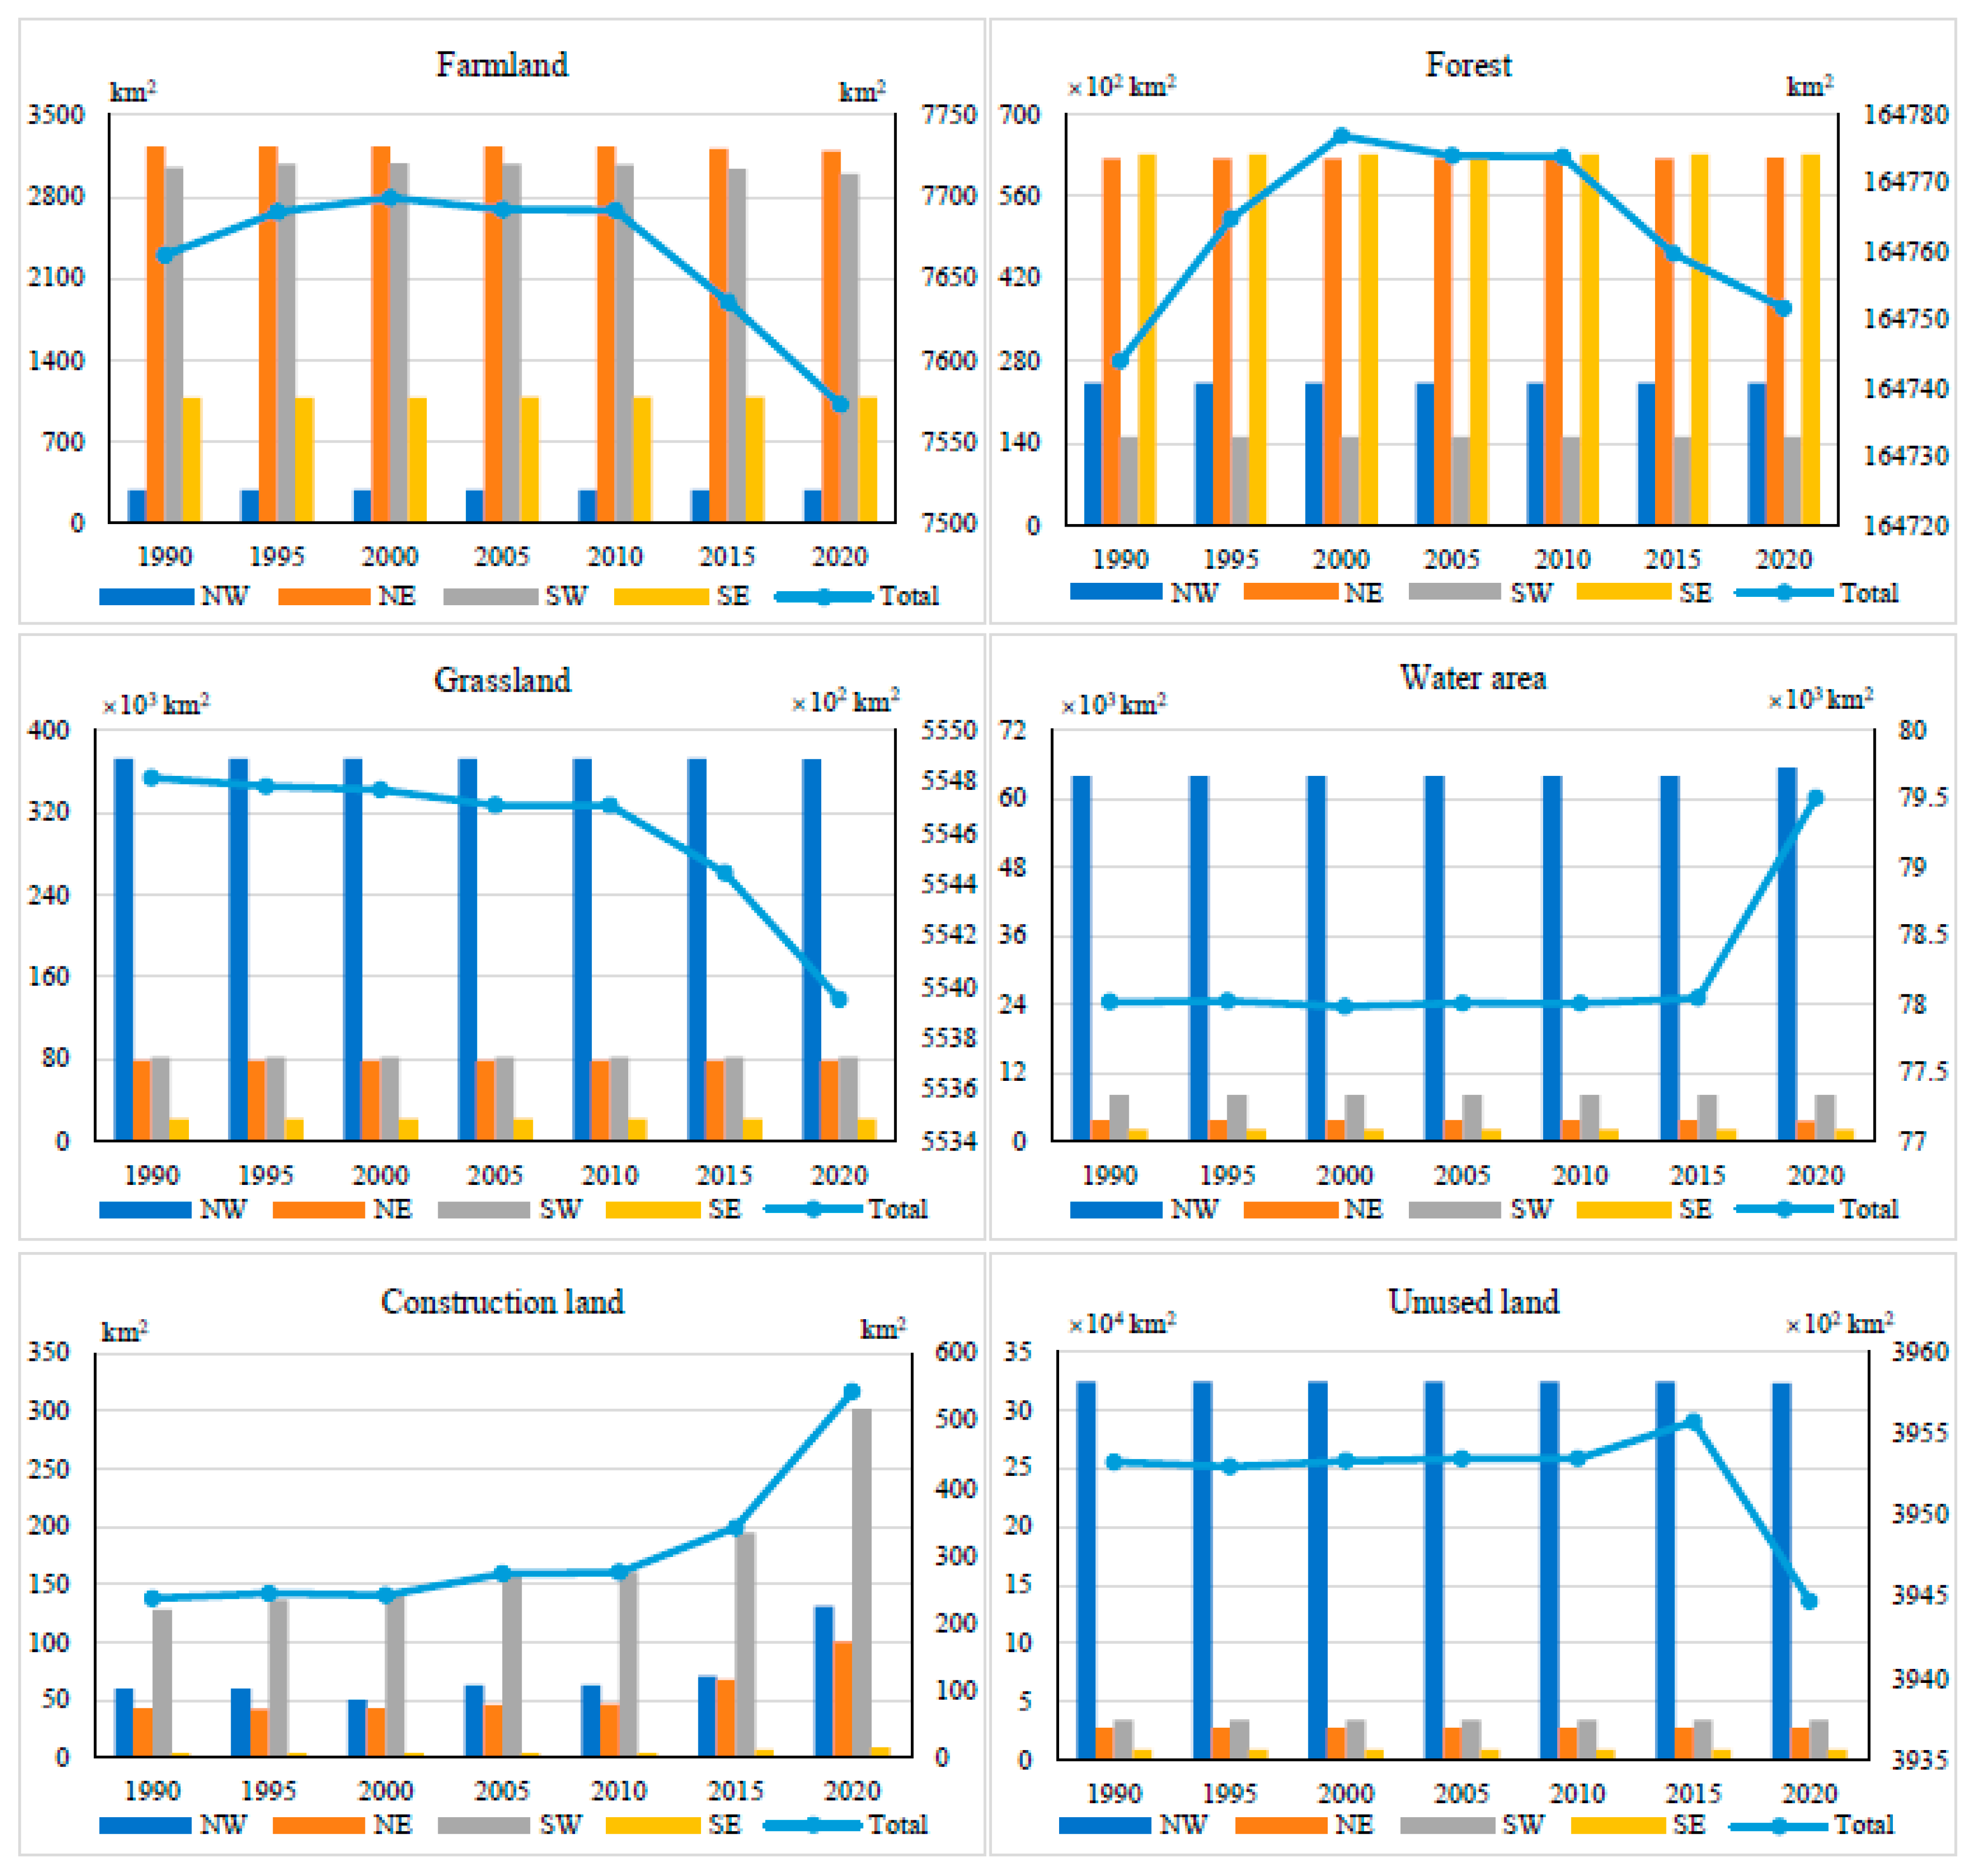
3.1. Land-Use Change
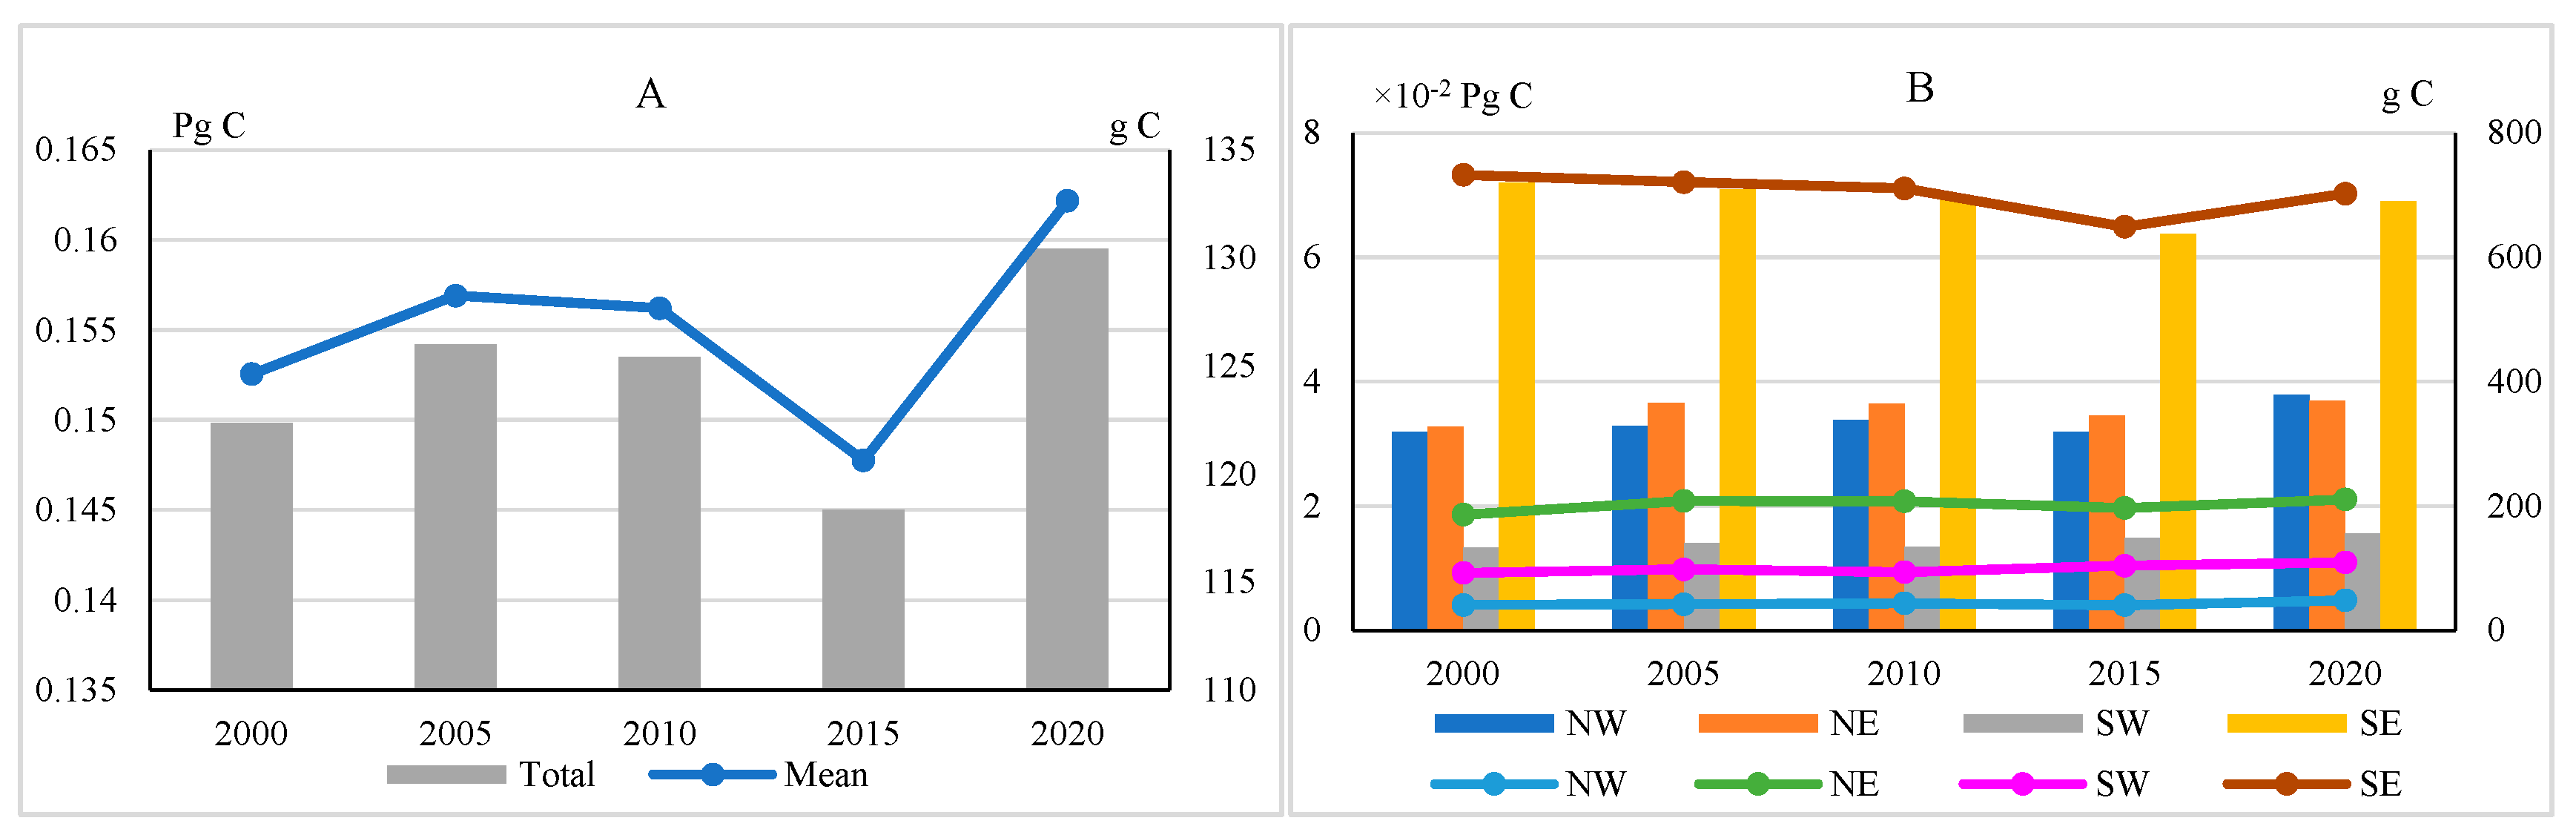
3.2. NPP
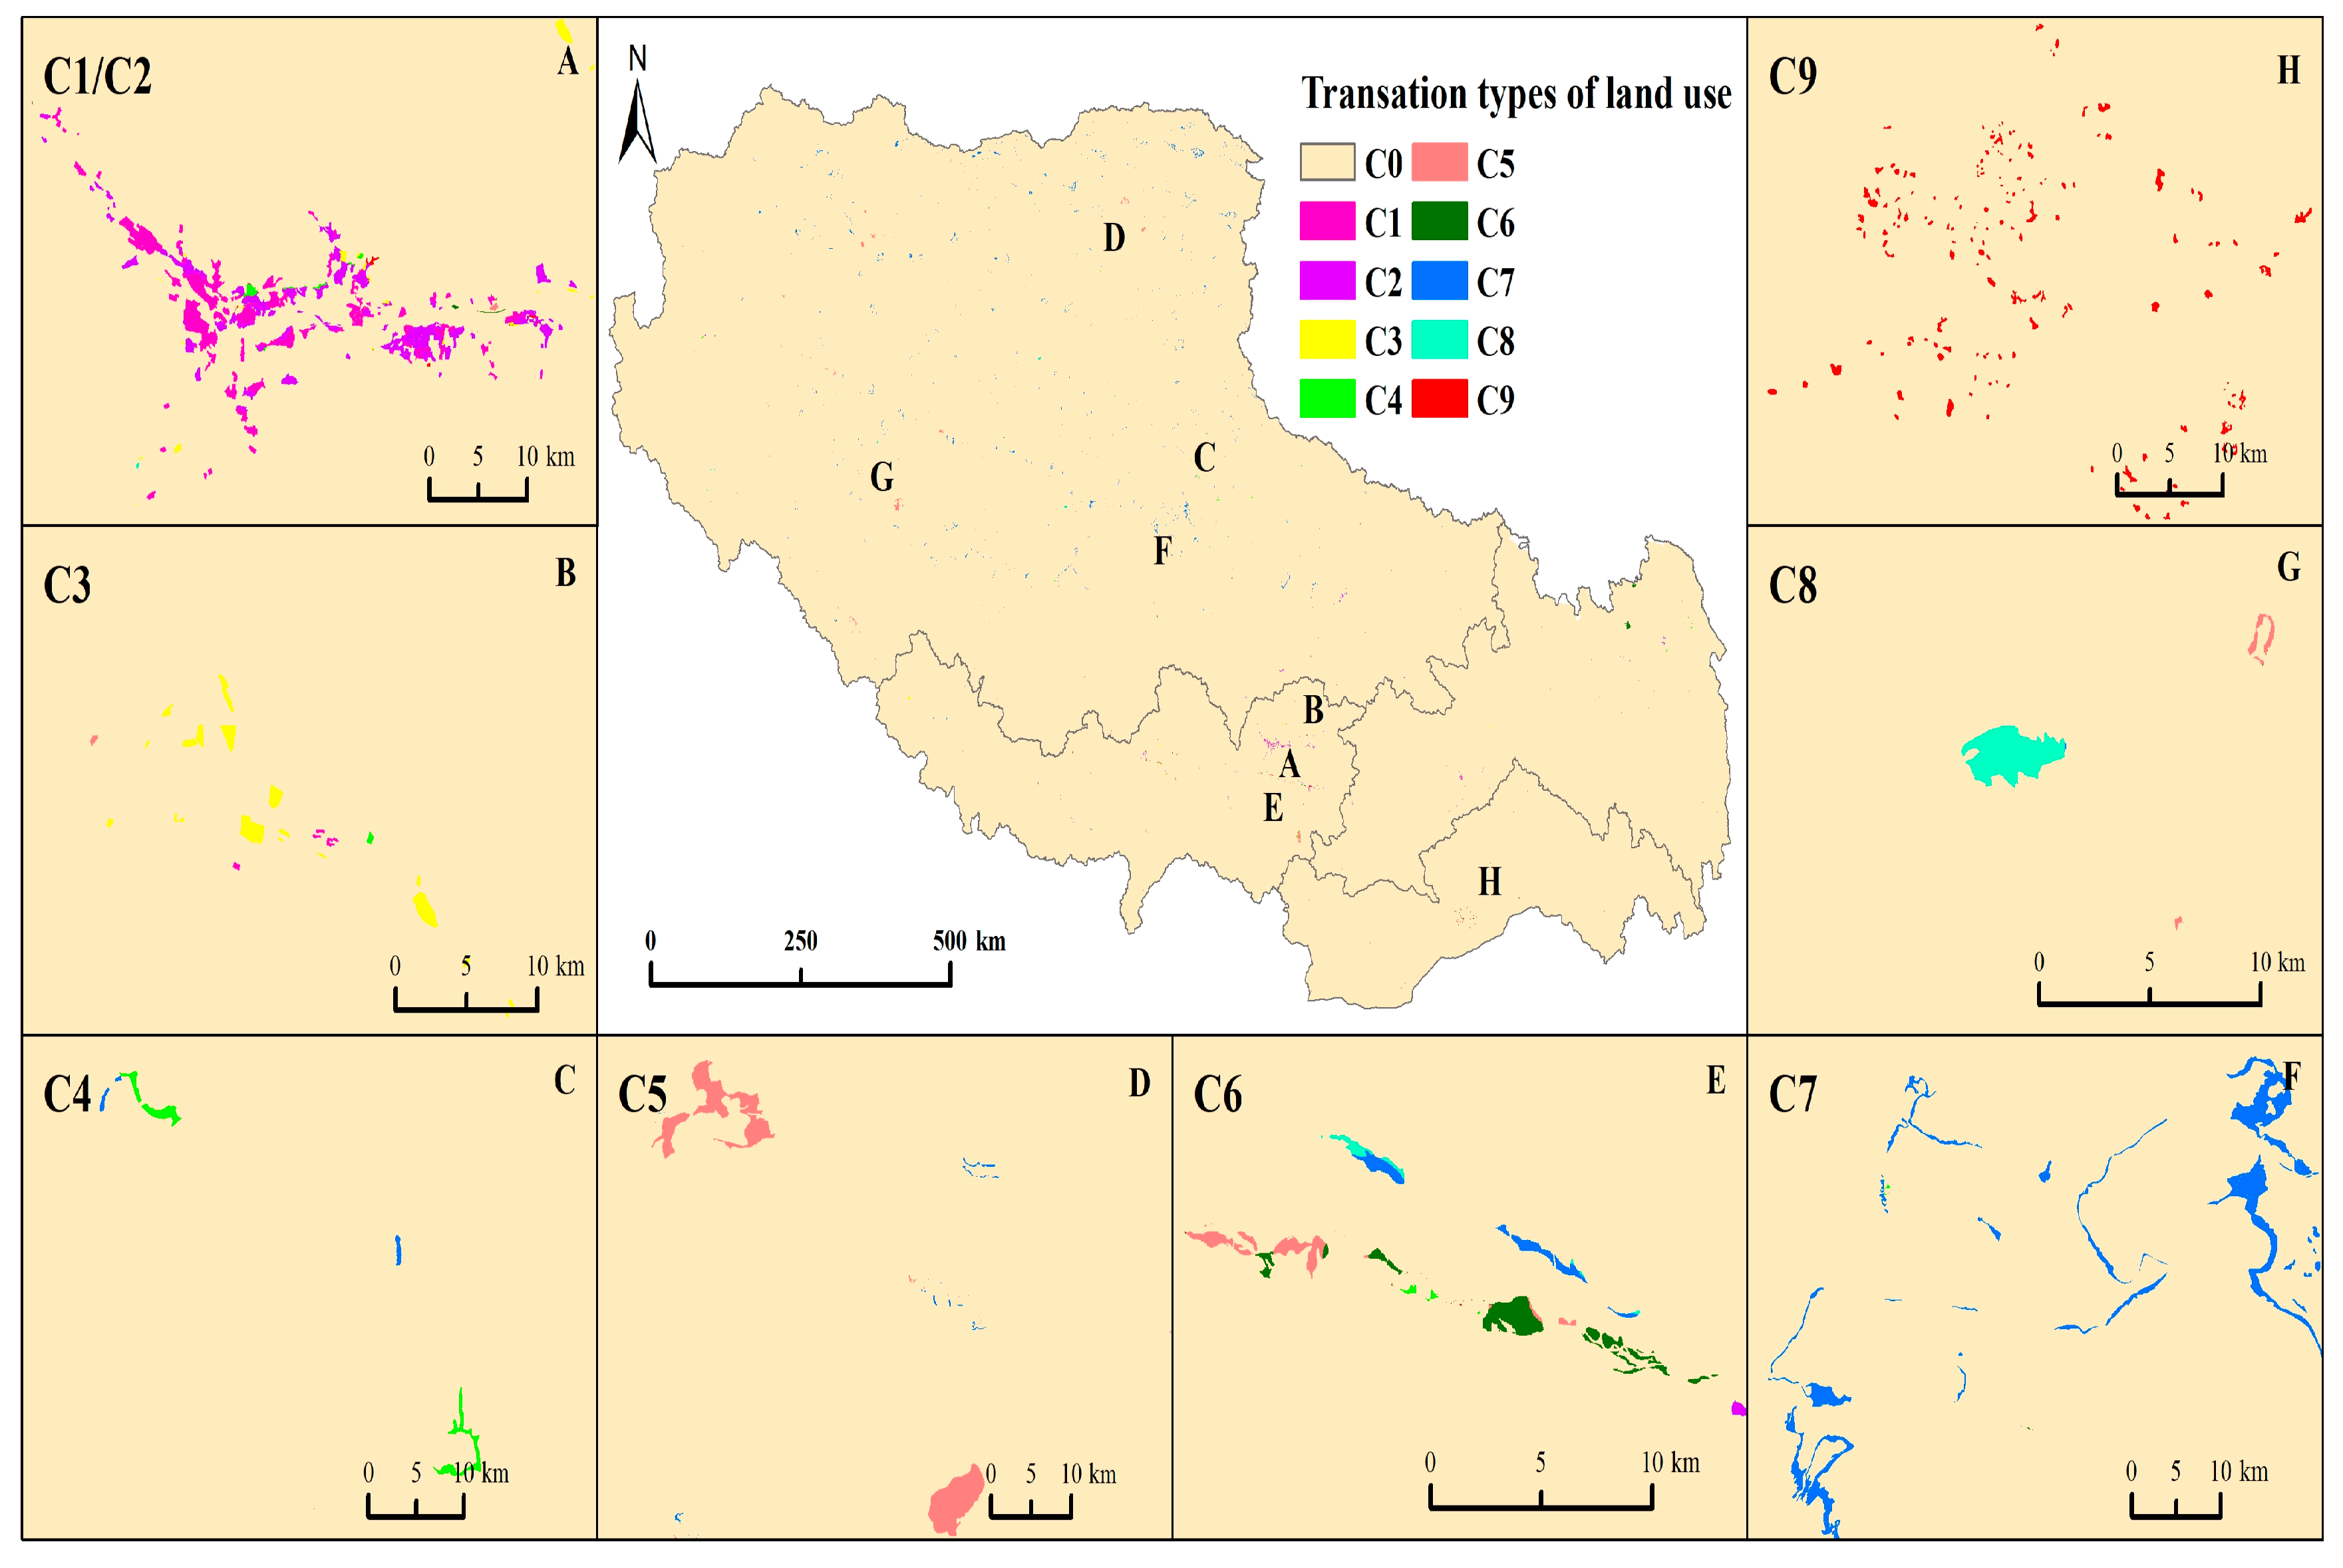
3.3. Driving Force Analysis of Land-Use Type Conversions
3.3.1. At the Whole Region Level
3.3.2. In the Subregions
4. Discussion
5. Conclusions
Funding
Institutional Review Board Statement
Informed Consent Statement
Data Availability Statement
Conflicts of Interest
Declaration of Competing Interest
References
- Rounsevell, M.D.; Pedroli, B.; Erb, K.-H.; Gramberger, M.; Busck, A.G.; Haberl, H.; Kristensen, S.; Kuemmerle, T.; Lavorel, S.; Lindner, M.; et al. Challenges for land system science. Land Use Policy 2012, 29, 899–910. [Google Scholar] [CrossRef]
- Li, X.; Yang, Y.; Liu, Y. Research progress in man-land relationship evolution and its resource-environment base in China. J. Geogr. Sci. 2017, 27, 899–924. [Google Scholar] [CrossRef]
- Gao, L.; Bryan, B.A. Finding pathways to national-scale land-sector sustainability. Nature 2017, 544, 217–222. [Google Scholar] [CrossRef]
- Verburg, P.H.; Erb, K.-H.; Mertz, O.; Espindola, G. Land System Science: Between global challenges and local realities. Curr. Opin. Environ. Sustain. 2013, 5, 433–437. [Google Scholar] [CrossRef] [PubMed]
- Foley, J.A.; DeFries, R.; Asner, G.P.; Barford, C.; Bonan, G.; Carpenter, S.R.; Chapin, F.S.; Coe, M.T.; Daily, G.C.; Gibbs, H.K.; et al. Global consequences of land use. Science 2005, 309, 570–574. [Google Scholar] [CrossRef] [PubMed]
- Meyfroidt, P.; de Bremond, A.; Ryan, C.M.; Archer, E.; Aspinall, R.; Chhabra, A.; Camara, G.; Corbera, E.; DeFries, R.; Díaz, S.; et al. Ten facts about land systems for sustainability. Proc. Natl. Acad. Sci. USA 2022, 119, e2109217118. [Google Scholar] [CrossRef]
- Li, H.; Zhang, X.; Zhang, X.; Wu, Y. Utilization benefit of cultivated land and land institution reforms: Economy, society and ecology. Habitat Int. 2018, 77, 64–70. [Google Scholar] [CrossRef]
- Liu, J.; Jin, X.; Xu, W.; Gu, Z.; Yang, X.; Ren, J.; Fan, Y.; Zhou, Y. A new framework of land use efficiency for the coordination among food, economy and ecology in regional development. Sci. Total Environ. 2019, 710, 135670. [Google Scholar] [CrossRef]
- Grimm, N.B.; Faeth, S.H.; Golubiewski, N.E.; Redman, C.L.; Wu, J.; Bai, X.; Briggs, J.M. Global Change and the Ecology of Cities. Science 2008, 319, 756–760. [Google Scholar] [CrossRef]
- Pielke, R.A. Land use and climate change. Science 2005, 310, 1625–1626. [Google Scholar] [CrossRef]
- Powers, R.P.; Jetz, W. Global habitat loss and extinction risk of terrestrial vertebrates under future land-use-change scenarios. Nat. Clim. Chang. 2019, 9, 323–329. [Google Scholar] [CrossRef]
- Newbold, T.; Hudson, L.N.; Hill, S.L.L.; Contu, S.; Lysenko, I.; Senior, R.A.; Börger, L.; Bennett, D.J.; Choimes, A.; Collen, B.; et al. Global effects of land use on local terrestrial biodiversity. Nature 2015, 520, 45. [Google Scholar] [CrossRef] [PubMed]
- Newbold, T.; Hudson, L.N.; Arnell, A.P.; Contu, S.; De Palma, A.; Ferrier, S.; Hill, S.L.L.; Hoskins, A.J.; Lysenko, I.; Phillips, H.R.P.; et al. Has land use pushed terrestrial biodiversity beyond the planetary boundary? A global assessment. Science 2016, 353, 288–291. [Google Scholar] [CrossRef] [PubMed]
- Seto, K.C.; Güneralp, B.; Hutyra, L.R. Global forecasts of urban expansion to 2030 and direct impacts on biodiversity and carbon pools. Proc. Natl. Acad. Sci. USA 2012, 109, 16083–16088. [Google Scholar] [CrossRef]
- Creutzig, F. Govern land as a global commons. Nature 2017, 546, 28–29. [Google Scholar] [CrossRef]
- Pretty, J.; Benton, T.G.; Bharucha, Z.P.; Dicks, L.V.; Flora, C.B.; Godfray, H.C.J.; Goulson, D.; Hartley, S.; Nic Lampkin, N.; Morris, C.; et al. Global assessment of agricultural system redesign for sustainable intensification. Nat. Sustain. 2018, 1, 441–446. [Google Scholar] [CrossRef]
- Nagendra, H.; Bai, X.; Brondizio, E.; Lwasa, S. The urban south and the predicament of global sustainability. Nat. Sustain. 2018, 1, 341–349. [Google Scholar] [CrossRef]
- Seto, K.C.; Golden, J.S.; Alberti, M.; Turner, B.L. Sustainability in an urbanizing planet. Proc. Natl. Acad. Sci. USA 2017, 114, 8935–8938. [Google Scholar] [CrossRef]
- Liu, J.; Zhang, Z.; Xu, X.; Kuang, W.; Zhou, W.; Zhang, S.; Li, R.; Yan, C.; Yu, D.; Wu, S.; et al. Spatial patterns and driving forces of land use change in China during the early 21st century. J. Geogr. Sci. 2010, 20, 483–494. [Google Scholar] [CrossRef]
- Liu, J.-Y.; Deng, X.-Z.; Liu, M.-L.; Zhang, S.-W. Study on the spatial patterns of land-use change and analyses of driving forces in Northeastern China during 1990–2000. Chin. Geogr. Sci. 2002, 12, 299–308. [Google Scholar] [CrossRef]
- He, C.; Zhang, J.; Liu, Z.; Huang, Q. Characteristics and progress of land use/cover change research during 1990–2018. J. Geogr. Sci. 2022, 32, 537–559. [Google Scholar] [CrossRef]
- Deng, J.S.; Wang, K.; Hong, Y.; Qi, J.G. Spatio-temporal dynamics and evolution of land use change and landscape pattern in response to rapid urbanization. Landsc. Urban Plan. 2009, 92, 187–198. [Google Scholar] [CrossRef]
- Bell, K.; Irwin, E.G. Spatially explicit micro-level modelling of land use change at the rural-urban interface. Agric. Econ. 2002, 27, 217–232. [Google Scholar] [CrossRef]
- Krausmann, F.; Haberl, H.; Schulz, N.B.; Erb, K.; Darge, E.; Gaube, V. Land-use change and socio-economic metabolism in Austria—Part I: Driving forces of land-use change: 1950–1995. Land Use Policy 2003, 20, 1–20. [Google Scholar] [CrossRef]
- Li, M.; Liu, S.; Wang, F.; Liu, H.; Liu, Y.; Wang, Q. Cost-benefit analysis of ecological restoration based on land use scenario simulation and ecosystem service on the Qinghai-Tibet Plateau. Glob. Ecol. Conserv. 2022, 34, e02006. [Google Scholar] [CrossRef]
- Liao, G.; He, P.; Gao, X.; Lin, Z.; Huang, C.; Zhou, W.; Deng, O.; Xu, C.; Deng, L. Land use optimization of rural production-living-ecological space at different scales based on the BP-ANN and CLUE-S models. Ecol. Indic. 2022, 137, 108710. [Google Scholar] [CrossRef]
- Abijith, D.; Saravanan, S. Assessment of land use and land cover change detection and prediction using remote sensing and CA Markov in the northern coastal districts of Tamil Nadu, India. Environ. Sci. Pollut. Res. 2021, 1–13. [Google Scholar] [CrossRef]
- Li, X.; Yeh, A.G.-O. Modelling sustainable urban development by the integration of constrained cellular automata and GIS. Int. J. Geogr. Inf. Sci. 2000, 14, 131–152. [Google Scholar] [CrossRef]
- An, L.; Linderman, M.; Qi, J.; Shortridge, A.; Liu, J. Exploring Complexity in a Human–Environment System: An Agent-Based Spatial Model for Multidisciplinary and Multiscale Integration. Ann. Assoc. Am. Geogr. 2005, 95, 54–79. [Google Scholar] [CrossRef]
- Jia, Z.; Ma, B.; Zhang, J.; Zeng, W. Simulating Spatial-Temporal Changes of Land-Use Based on Ecological Redline Restrictions and Landscape Driving Factors: A Case Study in Beijing. Sustainability 2018, 10, 1299. [Google Scholar] [CrossRef]
- Liu, Y.; Sun, H.; Shi, L.; Wang, H.; Xiu, Z.; Qiu, X.; Chang, H.; Xie, Y.; Wang, Y.; Wang, C. Spatial-Temporal Changes and Driving Factors of Land-Use Eco-Efficiency Incorporating Ecosystem Services in China. Sustainability 2021, 13, 728. [Google Scholar] [CrossRef]
- Ren, Y.; Lü, Y.; Fu, B.; Comber, A.; Li, T.; Hu, J. Driving Factors of Land Change in China’s Loess Plateau: Quantification Using Geographically Weighted Regression and Management Implications. Remote Sens. 2020, 12, 453. [Google Scholar] [CrossRef]
- Liu, J.; Jin, X.; Li, H.; Zhang, X.; Xu, W.; Fan, Y.; Zhou, Y. Spatial-temporal changes and driving factors of the coordinated relationship among multiple land use efficiencies integrating stakeholders’ vision in eastern China. J. Clean. Prod. 2022, 336, 130406. [Google Scholar] [CrossRef]
- Wang, F.; Yuan, X.; Xie, X. Dynamic change of land use/land cover patterns and driving factors of Nansihu Lake Basin in Shandong Province, China. Environ. Earth Sci. 2021, 80, 1–15. [Google Scholar] [CrossRef]
- Peng, W. Waste on the roof of the world. Science 2019, 365, 1090. [Google Scholar] [CrossRef]
- Qiu, J. The third pole. Nature 2008, 454, 393–396. [Google Scholar] [CrossRef]
- Kandel, P.; Chettri, N.; Chaudhary, S.; Sharma, P.; Uddin, K. Ecosystem services research trends in the water tower of Asia: A bibliometric analysis from the Hindu Kush Himalaya. Ecol. Indic. 2020, 121, 107152. [Google Scholar] [CrossRef]
- Sun, H.L.; Zheng, D.; Yao, T.D.; Zhang, Y. Protection and construction of the National Ecological Security Shelter Zone on Tibetan Plateau. Acta Geogr. Sin. 2012, 67, 3–12. [Google Scholar]
- Zhang, H.; Gao, Y. Projected changes in precipitation recycling over the Tibetan Plateau based on a global and regional climate model. J. Hydrometeorol. 2021, 22, 2633–2644. [Google Scholar] [CrossRef]
- Lehnert, L.; Wesche, K.; Trachte, K.; Reudenbach, C.; Bendix, J. Climate variability rather than overstocking causes recent large scale cover changes of Tibetan pastures. Sci. Rep. 2016, 6, 24367. [Google Scholar] [CrossRef]
- Zhao, H.; Liu, S.; Dong, S.; Su, X.; Wang, X.; Wu, X.; Wu, L.; Zhang, X. Analysis of vegetation change associated with human disturbance using MODIS data on the rangelands of the Qinghai-Tibet Plateau. Rangel. J. 2015, 37, 77–87. [Google Scholar] [CrossRef]
- Chen, J.; Yan, F.; Lu, Q. Spatiotemporal Variation of Vegetation on the Qinghai–Tibet Plateau and the Influence of Climatic Factors and Human Activities on Vegetation Trend (2000–2019). Remote Sens. 2020, 12, 3150. [Google Scholar] [CrossRef]
- Wang, T.; Zhao, Y.; Xu, C.; Ciais, P.; Liu, D.; Yang, H.; Piao, S.; Yao, T. Atmospheric dynamic constraints on Tibetan Plateau freshwater under Paris climate targets. Nat. Clim. Chang. 2021, 11, 219–225. [Google Scholar] [CrossRef]
- Wang, Z.; Zhang, X.; Niu, B.; Zheng, Y.; He, Y.; Cao, Y.; Feng, Y.; Wu, J. Divergent Climate Sensitivities of the Alpine Grasslands to Early Growing Season Precipitation on the Tibetan Plateau. Remote Sens. 2022, 14, 2484. [Google Scholar] [CrossRef]
- Guo, B.; Han, B.; Yang, F.; Chen, S.; Liu, Y.; Yang, W. Determining the contributions of climate change and human activities to the vegetation NPP dynamics in the Qinghai-Tibet Plateau, China, from 2000 to 2015. Environ. Monit. Assess. 2020, 192, 1–18. [Google Scholar] [CrossRef]
- Fu, S.; Zhang, X.; Kuang, W.; Guo, C. Characteristics of Changes in Urban Land Use and Efficiency Evaluation in the Qinghai–Tibet Plateau from 1990 to 2020. Land 2022, 11, 757. [Google Scholar] [CrossRef]
- Wang, X.; Zhang, Y.; Wu, X.; Zheng, D.; Wang, Z.; Yan, J.; Liu, L.; Zhang, B.; Zhao, Z.; Bai, W.; et al. Spatial and temporal characteristics of land use and cover changes in the Tibetan Plateau. Chin. Sci. Bull. 2019, 64, 2865–2875. [Google Scholar] [CrossRef]
- Li, P.; Zuo, D.; Xu, Z.; Zhang, R.; Han, Y.; Sun, W.; Pang, B.; Ban, C.; Kan, G.; Yang, H. Dynamic changes of land use/cover and landscape pattern in a typical alpine river basin of the Qinghai-Tibet Plateau, China. Land Degrad. Dev. 2021, 32, 4327–4339. [Google Scholar] [CrossRef]
- Luo, J.; Xin, L.; Liu, F.; Chen, Q.; Zhou, Q.; Zhang, Y. Study of the intensity and driving factors of land use/cover change in the Yarlung Zangbo River, Nyang Qu River, and Lhasa River region, Qinghai-Tibet Plateau of China. J. Arid Land 2022, 14, 411–425. [Google Scholar] [CrossRef]
- Zhou, Y.; Zhang, X.; Yu, H.; Liu, Q.; Xu, L. Land Use-Driven Changes in Ecosystem Service Values and Simulation of Future Scenarios: A Case Study of the Qinghai–Tibet Plateau. Sustainability 2021, 13, 4079. [Google Scholar] [CrossRef]
- Xu, Z.; Zhao, Z.; Lu, C. The Contribution of Land Use and Land Cover on Carbon Storage in the North Tibet Plateau, China. J. Anim. Plant Sci. Japs 2021, 31, 1598–1609. [Google Scholar]
- Zhou, Y.; Li, X.; Liu, Y. Land use change and driving factors in rural China during the period 1995–2015. Land Use Policy 2020, 99, 105048. [Google Scholar] [CrossRef]
- Wu, J.; Hobbs, R. Key issues and research priorities in landscape ecology: An idiosyncratic synthesis. Landsc. Ecol. 2002, 17, 355–365. [Google Scholar] [CrossRef]
- Van Asselen, S.; Verburg, P.H. Land cover change or land-use intensification: Simulating land system change with a global-scale land change model. Glob. Chang. Biol. 2013, 19, 3648–3667. [Google Scholar] [CrossRef]
- Dang, A.N.; Kawasaki, A. Integrating biophysical and socio-economic factors for land-use and land-cover change projection in agricultural economic regions. Ecol. Model. 2017, 344, 29–37. [Google Scholar] [CrossRef]
- Zheng, D. The system of physico-geographical regions of the Qinghai-Xizang (Tibet) plateau. Sci. China Ser. D-Earth Sci. 1996, 39, 410–417. [Google Scholar]
- Liao, X.; Chen, Z.; Wang, H.; Luo, C. The research about comprehensive division of Tibet land utilization. J. Mt. Sci. 2009, 27, 96–101. [Google Scholar]
- Kuang, W.H.; Zhang, S.W.; Du, G.M.; Yan, C.Z.; Wu, S.X.; Li, R.D.; Lu, D.S.; Pan, T.; Ning, J.; Guo, C.Q. Remotely sensed mapping and analysis of spatio-temporal patterns of land use change across China in 2015-2020. Acta Geogr. Sin. 2022, 77, 1056–1071. [Google Scholar]
- Ning, J.; Liu, J.; Kuang, W.; Xu, X.; Zhang, S.; Yan, C.; Li, R.; Wu, S.; Hu, Y.; Du, G.; et al. Spatio-temporal patterns and characteristics of land-use change in China during 2010-2015. Acta Geogr. Sin. 2018, 73, 789–802. [Google Scholar]
- Wang, J.-F.; Li, X.-H.; Christakos, G.; Liao, Y.-L.; Zhang, T.; Gu, X.; Zheng, X.-Y. Geographical detectors-based health risk assessment and its application in the neural tube defects study of the Heshun region, China. Int. J. Geogr. Inf. Sci. 2010, 24, 107–127. [Google Scholar] [CrossRef]
- Wang, J.F.; Xu, C.D. Geodetector: Principle and prospective. Acta Geogr. Sin. 2017, 72, 116–134. [Google Scholar]
- Zhong, Z.; Fu, G. Response of soil fungal species, phylogenetic and functional diversity to diurnal asymmetric warming in an alpine agricultural ecosystem. Agric. Ecosyst. Environ. 2022, 335, 107993. [Google Scholar] [CrossRef]


| Grade | Slope (°) | DEM (m) | Pre (mm) | Tem (℃) | GDP (Yuan/km2) | Pop (Persons/km2) |
|---|---|---|---|---|---|---|
| 1 | <5 | <1800 | <−150 | <0.5 | <0 | <0 |
| 2 | [5, 10) | [1800, 3200) | [−150, −80) | [0.5−0.8) | [0, 10) | [0, 0.5) |
| 3 | [10, 15) | [3200, 4200) | [−80, −30) | [0.8−1) | [10, 150) | [0.5, 1) |
| 4 | [15, 25) | [4200, 4800) | [−30, 20) | [1, 1.2) | [150, 1000) | [1, 2) |
| 5 | [25, 35) | [4800, 5300) | [20, 80) | [1.2, 1.5) | [1000, 3000) | [2, 4) |
| 6 | ≥35 | ≥5300 | ≥80 | ≥1.5 | ≥3000 | ≥4 |
| Codes | Conversions between Land-Use Types | Code | Conversions between Land-Use Types |
|---|---|---|---|
| C1 | FL→CL | C6 | WA→FT/GL |
| C2 | FT/GL→CL | C7 | UL/GL→WA |
| C3 | FT/GL→FL | C8 | UL→GL |
| C4 | GL→UL | C9 | GL→FT |
| C5 | WA→UL | C0 | Others |
| Types | 1990 | 1995 | 2000 | 2005 | 2010 | 2015 | 2020 |
|---|---|---|---|---|---|---|---|
| FL | 7664.82 | 7691.23 | 7699.82 | 7692.62 | 7692.34 | 7636.28 | 7573.29 |
| FT | 164,746.60 | 164,767.38 | 164,779.42 | 164,776.50 | 164,776.36 | 164,762.25 | 164,754.27 |
| GL | 554,815.51 | 554,782.79 | 554,769.66 | 554,709.54 | 554,708.42 | 554,446.39 | 553,954.63 |
| WA | 78,020.98 | 78,026.86 | 77,986.37 | 78,011.70 | 78,009.96 | 78,049.47 | 79,508.35 |
| CL | 236.56 | 244.45 | 241.72 | 273.65 | 275.66 | 341.86 | 543.24 |
| UL | 395,327.51 | 395,299.27 | 395,334.94 | 395,347.96 | 395,349.19 | 395,575.68 | 394,478.16 |
| Regions | 2020 | FL | FT | GL | WA | CL | UL | Total | |
|---|---|---|---|---|---|---|---|---|---|
| 1990 | |||||||||
| Whole Tibet | FL | 7509.63 | 0.89 | 1.62 | 35.02 | 117.11 | 0.37 | 7664.64 | |
| FT | 7.10 | 164,637.02 | 23.12 | 30.32 | 44.49 | 1.93 | 164,743.99 | ||
| GL | 42.70 | 46.17 | 553,867.29 | 689.37 | 104.99 | 62.69 | 554,813.22 | ||
| WA | 8.91 | 64.20 | 34.42 | 77,470.48 | 15.08 | 425.32 | 78,018.41 | ||
| CL | 2.19 | 0.06 | 0.91 | 0.05 | 233.33 | 0.01 | 236.56 | ||
| UL | 2.54 | 3.34 | 25.02 | 1280.52 | 28.22 | 393,984.95 | 395,324.60 | ||
| Total | 7573.08 | 164,751.69 | 553,952.37 | 79,505.77 | 543.24 | 394,475.27 | 1,200,801.42 | ||
| NW | FL | 288.24 | 0.00 | 0.06 | 3.36 | 0.10 | 291.76 | ||
| FT | 0.47 | 24,159.10 | 0.02 | 19.11 | 2.99 | 1.07 | 24,182.76 | ||
| GL | 0.18 | 2.00 | 371,474.16 | 658.23 | 46.55 | 36.01 | 372,217.14 | ||
| WA | 0.04 | 10.35 | 63,535.56 | 1.85 | 345.70 | 63,893.50 | |||
| CL | 0.00 | 60.11 | 60.11 | ||||||
| UL | 2.60 | 22.00 | 1262.05 | 16.24 | 322,880.10 | 324,182.99 | |||
| Total | 288.89 | 24,163.75 | 371,506.58 | 65,474.95 | 131.10 | 323,262.99 | 784,828.26 | ||
| NE | FL | 3193.51 | 0.41 | 0.65 | 11.58 | 25.43 | 3231.58 | ||
| FT | 62,399.46 | 9.43 | 7.23 | 9.18 | 0.86 | 62,426.15 | |||
| GL | 2.94 | 1.29 | 78,259.31 | 8.72 | 20.19 | 15.23 | 78,307.69 | ||
| WA | 0.02 | 54.05 | 15.27 | 3609.20 | 2.46 | 4.24 | 3685.25 | ||
| CL | 2.12 | 0.00 | 0.04 | 0.05 | 41.03 | 43.24 | |||
| UL | 0.00 | 0.00 | 2.32 | 2.57 | 27,414.36 | 27,419.25 | |||
| Total | 3198.60 | 62455.21 | 78284.70 | 3639.09 | 100.86 | 27,434.69 | 175,113.15 | ||
| SW | FL | 2945.58 | 0.23 | 0.91 | 23.42 | 87.85 | 0.27 | 3058.26 | |
| FT | 2.53 | 14,979.33 | 0.01 | 1.60 | 28.86 | 15,012.33 | |||
| GL | 39.58 | 17.30 | 81,935.08 | 22.15 | 37.21 | 11.44 | 82,062.76 | ||
| WA | 8.89 | 10.07 | 8.30 | 8114.28 | 10.77 | 75.37 | 8227.68 | ||
| CL | 0.01 | 0.06 | 0.86 | 0.00 | 127.70 | 0.01 | 128.65 | ||
| UL | 2.54 | 0.74 | 3.02 | 15.66 | 9.42 | 34,275.70 | 34,307.09 | ||
| Total | 2999.13 | 15,007.73 | 81,948.19 | 8177.12 | 301.81 | 34,362.80 | 142,796.77 | ||
| SE | FL | 1082.30 | 0.25 | 0.01 | 0.02 | 0.47 | 1083.05 | ||
| FT | 4.10 | 63,099.14 | 13.66 | 2.39 | 3.46 | 63,122.75 | |||
| GL | 25.58 | 22,198.74 | 0.27 | 1.04 | 22,225.63 | ||||
| WA | 0.03 | 0.49 | 2211.45 | 2211.98 | |||||
| CL | 0.06 | 4.50 | 4.56 | ||||||
| UL | 0.49 | 9414.79 | 9415.28 | ||||||
| Total | 1086.46 | 63,125.00 | 22,212.90 | 2214.61 | 9.47 | 9414.79 | 98,063.24 | ||
| DEM | Slope | Pre | Tem | GDP | Pop | |
|---|---|---|---|---|---|---|
| C1 | 0.0172 | 0.0013 | 0.0103 | 0.0078 | 0.2483 | 0.0223 |
| C2 | 0.0096 | 0.0007 | 0.0059 | 0.0100 | 0.2646 | 0.0181 |
| C3 | 0.0061 | 0.0004 | 0.0022 | 0.0012 | 0.0057 | 0.0019 |
| C4 | 0.0029 | 0.0011 | 0.0019 | 0.0029 | 0.0031 | 0.0006 |
| C5 | 0.0023 | 0.0051 | 0.0015 | 0.0007 | 0.0011 | 0.0010 |
| C6 | 0.0032 | 0.0007 | 0.0003 | 0.0037 | 0.0034 | 0.0088 |
| C7 | 0.0057 | 0.0356 | 0.0124 | 0.0011 | 0.0134 | 0.0093 |
| C8 | 0.0002 | 0.0004 | 0.0002 | 0.0008 | 0.0002 | 0.0002 |
| C9 | 0.0309 | 0.0013 | 0.0046 | 0.0025 | 0.0141 | 0.0026 |
| DEM | Slop | Pre | Tem | GDP | Pop | DEM | Slop | Pre | Tem | GDP | Pop | DEM | Slop | Pre | Tem | GDP | Pop | |
|---|---|---|---|---|---|---|---|---|---|---|---|---|---|---|---|---|---|---|
| C1 | C2 | C3 | ||||||||||||||||
| DEM | 0.0172 | 0.0096 | 0.0061 | |||||||||||||||
| Slop | 0.0785 | 0.0013 | 0.0458 | 0.0007 | 0.0586 | 0.0004 | ||||||||||||
| Pre | 0.0345 | 0.0592 | 0.0103 | 0.0214 | 0.0423 | 0.0059 | 0.0120 | 0.0145 | 0.0022 | |||||||||
| Tem | 0.0364 | 0.0249 | 0.0596 | 0.0078 | 0.0284 | 0.0320 | 0.0557 | 0.0100 | 0.0177 | 0.0052 | 0.0140 | 0.0012 | ||||||
| GDP | 0.4382 | 0.4591 | 0.2783 | 0.2729 | 0.2483 | 0.4279 | 0.4309 | 0.2734 | 0.2732 | 0.2646 | 0.0251 | 0.0150 | 0.0147 | 0.0097 | 0.0057 | |||
| Pop | 0.0904 | 0.0745 | 0.0671 | 0.0360 | 0.2499 | 0.0223 | 0.0473 | 0.0651 | 0.0437 | 0.0395 | 0.2678 | 0.0181 | 0.0165 | 0.0140 | 0.0095 | 0.0085 | 0.0121 | 0.0019 |
| C4 | C5 | C6 | ||||||||||||||||
| DEM | 0.0029 | 0.0023 | 0.0032 | |||||||||||||||
| Slop | 0.0057 | 0.0011 | 0.0104 | 0.0051 | 0.0069 | 0.0007 | ||||||||||||
| Pre | 0.0087 | 0.0182 | 0.0019 | 0.0066 | 0.0432 | 0.0015 | 0.0059 | 0.0028 | 0.0003 | |||||||||
| Tem | 0.0072 | 0.0068 | 0.0278 | 0.0029 | 0.0058 | 0.0067 | 0.0080 | 0.0007 | 0.0090 | 0.0087 | 0.0132 | 0.0037 | ||||||
| GDP | 0.0086 | 0.0134 | 0.0106 | 0.0105 | 0.0031 | 0.0045 | 0.0112 | 0.0043 | 0.0081 | 0.0011 | 0.0118 | 0.0049 | 0.0049 | 0.0138 | 0.0034 | |||
| Pop | 0.0051 | 0.0037 | 0.0048 | 0.0134 | 0.0110 | 0.0006 | 0.0056 | 0.0064 | 0.0041 | 0.0035 | 0.0033 | 0.0010 | 0.0220 | 0.0108 | 0.0126 | 0.0171 | 0.0121 | 0.0088 |
| C7 | C8 | C9 | ||||||||||||||||
| DEM | 0.0057 | 0.0002 | 0.0309 | |||||||||||||||
| Slop | 0.0381 | 0.0356 | 0.0013 | 0.0004 | 0.0772 | 0.0013 | ||||||||||||
| Pre | 0.0224 | 0.0415 | 0.0124 | 0.0009 | 0.0019 | 0.0002 | 0.0438 | 0.0079 | 0.0046 | |||||||||
| Tem | 0.0121 | 0.0384 | 0.0156 | 0.0011 | 0.0018 | 0.0023 | 0.0021 | 0.0008 | 0.0615 | 0.0107 | 0.0121 | 0.0025 | ||||||
| GDP | 0.0215 | 0.0412 | 0.0200 | 0.0154 | 0.0134 | 0.0008 | 0.0010 | 0.0011 | 0.0019 | 0.0002 | 0.0793 | 0.0480 | 0.0226 | 0.0212 | 0.0141 | |||
| Pop | 0.0220 | 0.0400 | 0.0209 | 0.0136 | 0.0164 | 0.0093 | 0.0012 | 0.0014 | 0.0013 | 0.0020 | 0.0007 | 0.0002 | 0.0497 | 0.0256 | 0.0111 | 0.0087 | 0.0161 | 0.0026 |
| DEM | Slop | Pre | Tem | GDP | Pop | DEM | Slop | Pre | Tem | GDP | Pop | |
|---|---|---|---|---|---|---|---|---|---|---|---|---|
| NW | NE | |||||||||||
| C1 | 0.0065 | 0.0007 | 0.0014 | 0.0013 | 0.0078 | 0.0022 | 0.0179 | 0.0050 | 0.0024 | 0.0115 | 0.0068 | 0.0128 |
| C2 | 0.0049 | 0.0003 | 0.0054 | 0.0007 | 0.0217 | 0.0100 | 0.0040 | 0.0033 | 0.0017 | 0.0137 | 0.0053 | 0.0136 |
| C3 | 0.0254 | 0.0003 | 0.0000 | 0.0004 | 0.0003 | 0.0000 | 0.0279 | 0.0003 | 0.0012 | 0.0009 | 0.0010 | 0.0033 |
| C4 | 0.0033 | 0.0018 | 0.0020 | 0.0003 | 0.0000 | 0.0005 | 0.0020 | 0.0014 | 0.0056 | 0.0103 | 0.0125 | 0.0022 |
| C5 | 0.0037 | 0.0039 | 0.0013 | 0.0004 | 0.0012 | 0.0012 | 0.0021 | 0.0979 | 0.0051 | 0.0028 | 0.0016 | 0.0120 |
| C6 | 0.0002 | 0.0003 | 0.0000 | 0.0003 | 0.0001 | 0.0004 | 0.0019 | 0.0012 | 0.0020 | 0.0050 | 0.0036 | 0.0138 |
| C7 | 0.0074 | 0.0282 | 0.0082 | 0.0029 | 0.0089 | 0.0075 | 0.0013 | 0.0002 | 0.0014 | 0.0026 | 0.0007 | 0.0032 |
| C8 | 0.0003 | 0.0002 | 0.0000 | 0.0008 | 0.0001 | 0.0003 | 0.0172 | 0.0013 | 0.0103 | 0.0078 | 0.2483 | 0.0223 |
| C9 | 0.0317 | 0.0006 | 0.0004 | 0.0005 | 0.1209 | 0.0088 | 0.0232 | 0.0002 | 0.0014 | 0.0009 | 0.0003 | 0.0043 |
| SW | SE | |||||||||||
| C1 | 0.0722 | 0.0072 | 0.0379 | 0.0830 | 0.2687 | 0.0389 | 0.0022 | 0.0044 | 0.0121 | 0.0304 | 0.0005 | 0.0007 |
| C2 | 0.0550 | 0.0039 | 0.0404 | 0.1304 | 0.4325 | 0.0276 | 0.0023 | 0.0015 | 0.0107 | 0.0273 | 0.0016 | 0.0003 |
| C3 | 0.0407 | 0.0158 | 0.0050 | 0.0300 | 0.0115 | 0.0035 | 0.0087 | 0.0539 | 0.0112 | 0.0099 | 0.0006 | 0.0010 |
| C4 | 0.0045 | 0.0188 | 0.0094 | 0.0157 | 0.0242 | 0.0027 | 0.0172 | 0.0013 | 0.0103 | 0.0078 | 0.2483 | 0.0223 |
| C5 | 0.0033 | 0.0289 | 0.0073 | 0.0130 | 0.0054 | 0.0033 | 0.0172 | 0.0013 | 0.0103 | 0.0078 | 0.2483 | 0.0223 |
| C6 | 0.0646 | 0.0100 | 0.0207 | 0.0213 | 0.0133 | 0.0183 | 0.0302 | 0.0341 | 0.0105 | 0.0158 | 0.0081 | 0.0059 |
| C7 | 0.0034 | 0.0215 | 0.0042 | 0.0038 | 0.0006 | 0.0032 | 0.0074 | 0.0011 | 0.0036 | 0.0023 | 0.0002 | 0.0002 |
| C8 | 0.0274 | 0.0042 | 0.0262 | 0.0149 | 0.0059 | 0.0085 | 0.0172 | 0.0013 | 0.0103 | 0.0078 | 0.2483 | 0.0223 |
| C9 | 0.0733 | 0.0102 | 0.0083 | 0.0158 | 0.0270 | 0.0135 | 0.0322 | 0.0145 | 0.0219 | 0.0255 | 0.0025 | 0.0033 |
Publisher’s Note: MDPI stays neutral with regard to jurisdictional claims in published maps and institutional affiliations. |
© 2022 by the author. Licensee MDPI, Basel, Switzerland. This article is an open access article distributed under the terms and conditions of the Creative Commons Attribution (CC BY) license (https://creativecommons.org/licenses/by/4.0/).
Share and Cite
Wu, C. Study on the Spatial Differences in Land-Use Change and Driving Factors in Tibet. Land 2022, 11, 1584. https://doi.org/10.3390/land11091584
Wu C. Study on the Spatial Differences in Land-Use Change and Driving Factors in Tibet. Land. 2022; 11(9):1584. https://doi.org/10.3390/land11091584
Chicago/Turabian StyleWu, Chunsheng. 2022. "Study on the Spatial Differences in Land-Use Change and Driving Factors in Tibet" Land 11, no. 9: 1584. https://doi.org/10.3390/land11091584
APA StyleWu, C. (2022). Study on the Spatial Differences in Land-Use Change and Driving Factors in Tibet. Land, 11(9), 1584. https://doi.org/10.3390/land11091584