Article

NDVI-Based Greening of Alpine Steppe and Its Relationships with Climatic Change and Grazing Intensity in the Southwestern Tibetan Plateau

Key Laboratory of Western China’s Environmental Systems (Ministry of Education), College of Earth and Environmental Sciences, Lanzhou University, Lanzhou 730000, China
*
Author to whom correspondence should be addressed.
Land 2022, 11(7), 975; https://doi.org/10.3390/land11070975
Submission received: 15 May 2022 / Revised: 13 June 2022 / Accepted: 23 June 2022 / Published: 26 June 2022

Abstract

:
Alpine vegetation on the Southwestern Tibetan Plateau (SWTP) is sensitive and vulnerable to climate change and human activities. Climate warming and human actions (mainly ecological restoration, social-economic development, and grazing) have already caused the degradation of alpine grasslands on the Tibetan Plateau (TP) to some extent. However, it remains unclear how human activities (mainly grazing) have regulated vegetation variation under climate change and ecological restoration since 2000. This study used the normalized difference vegetation index (NDVI) and social statistic data to explore the spatiotemporal changes and the relationship between the NDVI and climatic change, human activities, and grazing intensity. The results revealed that the NDVI increased by 0.006/10a from 2000 to 2020. Significant greening, mainly distributed in Rikaze, with partial browning, has been found in the SWTP. The correlation analysis results showed that precipitation is the most critical factor affecting the spatial distribution of NDVI, and the NDVI is correlated positively with temperature and precipitation in most parts of the SWTP. We found that climate change and human activities co-affected the vegetation change in the SWTP, and human activities leading to vegetation greening since 2000. The NDVI and grazing intensity were mainly negatively correlated, and the grazing caused vegetation degradation to some extent. This study provides practical support for grassland use, grazing management, ecological restoration, and regional sustainable development for the TP and similar alpine areas.

1. Introduction

Vegetation is a crucial part of the terrestrial ecosystem and plays a vital role in regulating ecological balance, water, energy cycle, and climate change [1,2]. Long-term climate change, topography, and other natural factors determine the formation of vegetation spatial patterns (e.g., earthquakes, species introduction, utilization strategies, and ways) [3,4,5]. Meanwhile, human activities such as land use, urban expansion, agriculture and animal husbandry, and tourism also affect vegetation growth and the natural environment, thus changing the distribution pattern of vegetation [6,7,8]. On the contrary, the dynamic evolution of vegetation will also affect climate change and human activities [9]. Therefore, vegetation dynamics have attracted extensive attention to scientists and governors in global warming and have become one of the research hotspots of global change, with essential scientific and practical significance [10,11,12].
The analysis of vegetation cover and its correlation with environmental change is one of the research hotspots in recent decades [13,14]. The continuous innovation of remote sensing observation technology and modern analysis methods provides strong theoretical and technical support for studying vegetation cover change and its influencing factors at large-scale and longtime series [15,16]. Remote sensing data has been widely applied to reveal vegetation, ecological and environmental change at the global or regional scale [17,18]. The Normalized Difference Vegetation Index (NDVI), one of the valuable indicators, is widely applied to reflect the characteristics of vegetation cover and its dynamic changes at the global, national or regional scales [19,20,21]. The NDVI value ranges from −1.0 to 1.0 [22]. Generally, people take the NDVI value less than 0.1 as a non-vegetation area by default, e.g., water, bare land, and other land-use types [23]. The NDVI value greater than 0.1 is regarded as the area covered by vegetation, and the larger the value is, the better the vegetation growth [23].
The Tibetan plateau (TP) is an alpine region sensitive to climate change, with complex and diverse vegetation types and fluctuating terrain [24,25]. The TP is an ideal place to study the change of vegetation cover and its response to climate change because it is relatively concentrated and less disturbed by human activities [26,27]. The applications of NDVI in the TP are mainly focusing on the vegetation change [28,29], the relationship between vegetation and climatic change [30], elevation gradient [31,32], vegetation types [33,34], and human activities [35,36]. Some research showed that the vegetation of the TP changed with a trend of “overall increase and local decrease”. There were significant differences in vegetation change characteristics in different regions. Li et al. (2018) found that NDVI increased significantly in the growing season of the TP, with 70.37% of the TP showing a greening trend, and the southwest of the TP showing a browning trend [37]. In addition, some scholars found that temperature and precipitation are two significant climate factors affecting NDVI and its change, but the main factors affecting vegetation growth in different subregions of the TP have great spatial heterogeneity. For example, Bai et al. (2020) found that temperature is the main driving factor promoting vegetation growth and restoration in the Three-River Headwaters region [38]. Li et al. (2020) found that precipitation was more sensitive to vegetation growth in the southwestern Tibetan Plateau [39].
Some research results have explored the relationship between vegetation and climate change, which found that climate change has a direct impact on vegetation on the TP [40]. Nevertheless, vegetation is not only related to climate change, but the impact of human activities on vegetation is also crucial and cannot be ignored. The results indicated that in addition to the natural factors, the urban expansion, population increase, and other disturbances like grazing and farming caused by human activities have significantly impacted the ecosystem in the TP [41]. The impact of human activities on vegetation has enhanced the effects of climate change and vegetation greening in some parts of the TP [42]. Meanwhile, vegetation degradation partly occurred under global warming and grazing pressure, and overgrazing is one of the main reasons that caused local vegetation degradation [43]. Although the Chinese government has implemented some ecological construction projects, such as the Natural Forest Conservation Program (2000–2020), the Grain for Green Program (1999–2020), the Wildlife Conservation and Nature Protection Program (2001–2050), and the Grassland Ecological Protection Program (2011–2020), from the perspective of banning grazing and reducing the number of livestock, to reduce the grazing pressure and human disturbance to improve the ecological quality of the TP [44]. Recent studies have shown that short-term fencing and banning grazing have improved the ecological environment, but long-term fencing and grazing banning have not only led to increased grazing pressure outside the fences, but also have exacerbated the conflict between ecological conservation and economic development [45]. There is an urgent need to comprehensively explore the relationship between vegetation change, climate change, and human activities, and to adjust grassland management policies on the TP in accordance with the Sustainable Development Goals (SDGs) [46].
The Southwestern Tibetan Plateau (SWTP), located in the southwestern TP, is the intersection and transitional zone of the Karakoram Mt., Himalayas, and Gangdise. The SWTP is also the river source of the Yarlung Zangbo River, Indus River, and Ganges River [47]. The SWTP is a famous fragile area of the “water towers” on the earth with vital water conservation and other ecosystem services [48]. Meanwhile, it is an essential transitional ecotone among China, India, Bhutan, and Nepal, with a unique natural environment and geographical location [25]. Affected by climate change and human activities, the SWTP faces massive pressure from agricultural and animal husbandry production, ecological protection, and social and economic development due to glacier retreat, vegetation degradation, and desertification. Although several conservation projects have improved the ecological quality of the SWTP [49]. However, the results and effects of these ecological protection projects appeared slowly due to the fragile natural systems and sparse vegetation. Besides, more efforts are needed to keep up with the current environment, to adjust and refine the restoration plan, and to efficiently and effectively manage the alpine ecosystem for sustainable development in the TP. Therefore, it is necessary to quantify the relative influence of climate change and human activities on vegetation cover and clarify the relationship between climate, human activities, grazing intensity, and vegetation growth to better protect the natural environment and ecological security in the TP. In this study, based on the remote sensing data like NDVI, climatic data, livestock number, and spatial analysis methods, we aimed to: (1) investigate the spatiotemporal variation in vegetation cover in the SWTP from 2000 to 2020; (2) identify the effect of climate change and human activities on the NDVI; (3) explore the correlation between grazing intensity and the NDVI; and (4) bring forward suggestions for grazing management and steppe restoration. The results are expected to provide some useful scientific information for safe utilization of the high-altitude alpine vegetations with good grazing and animal husbandry, ecological protection and restoration, and sustainable development in the TP.

2. Materials and Methods

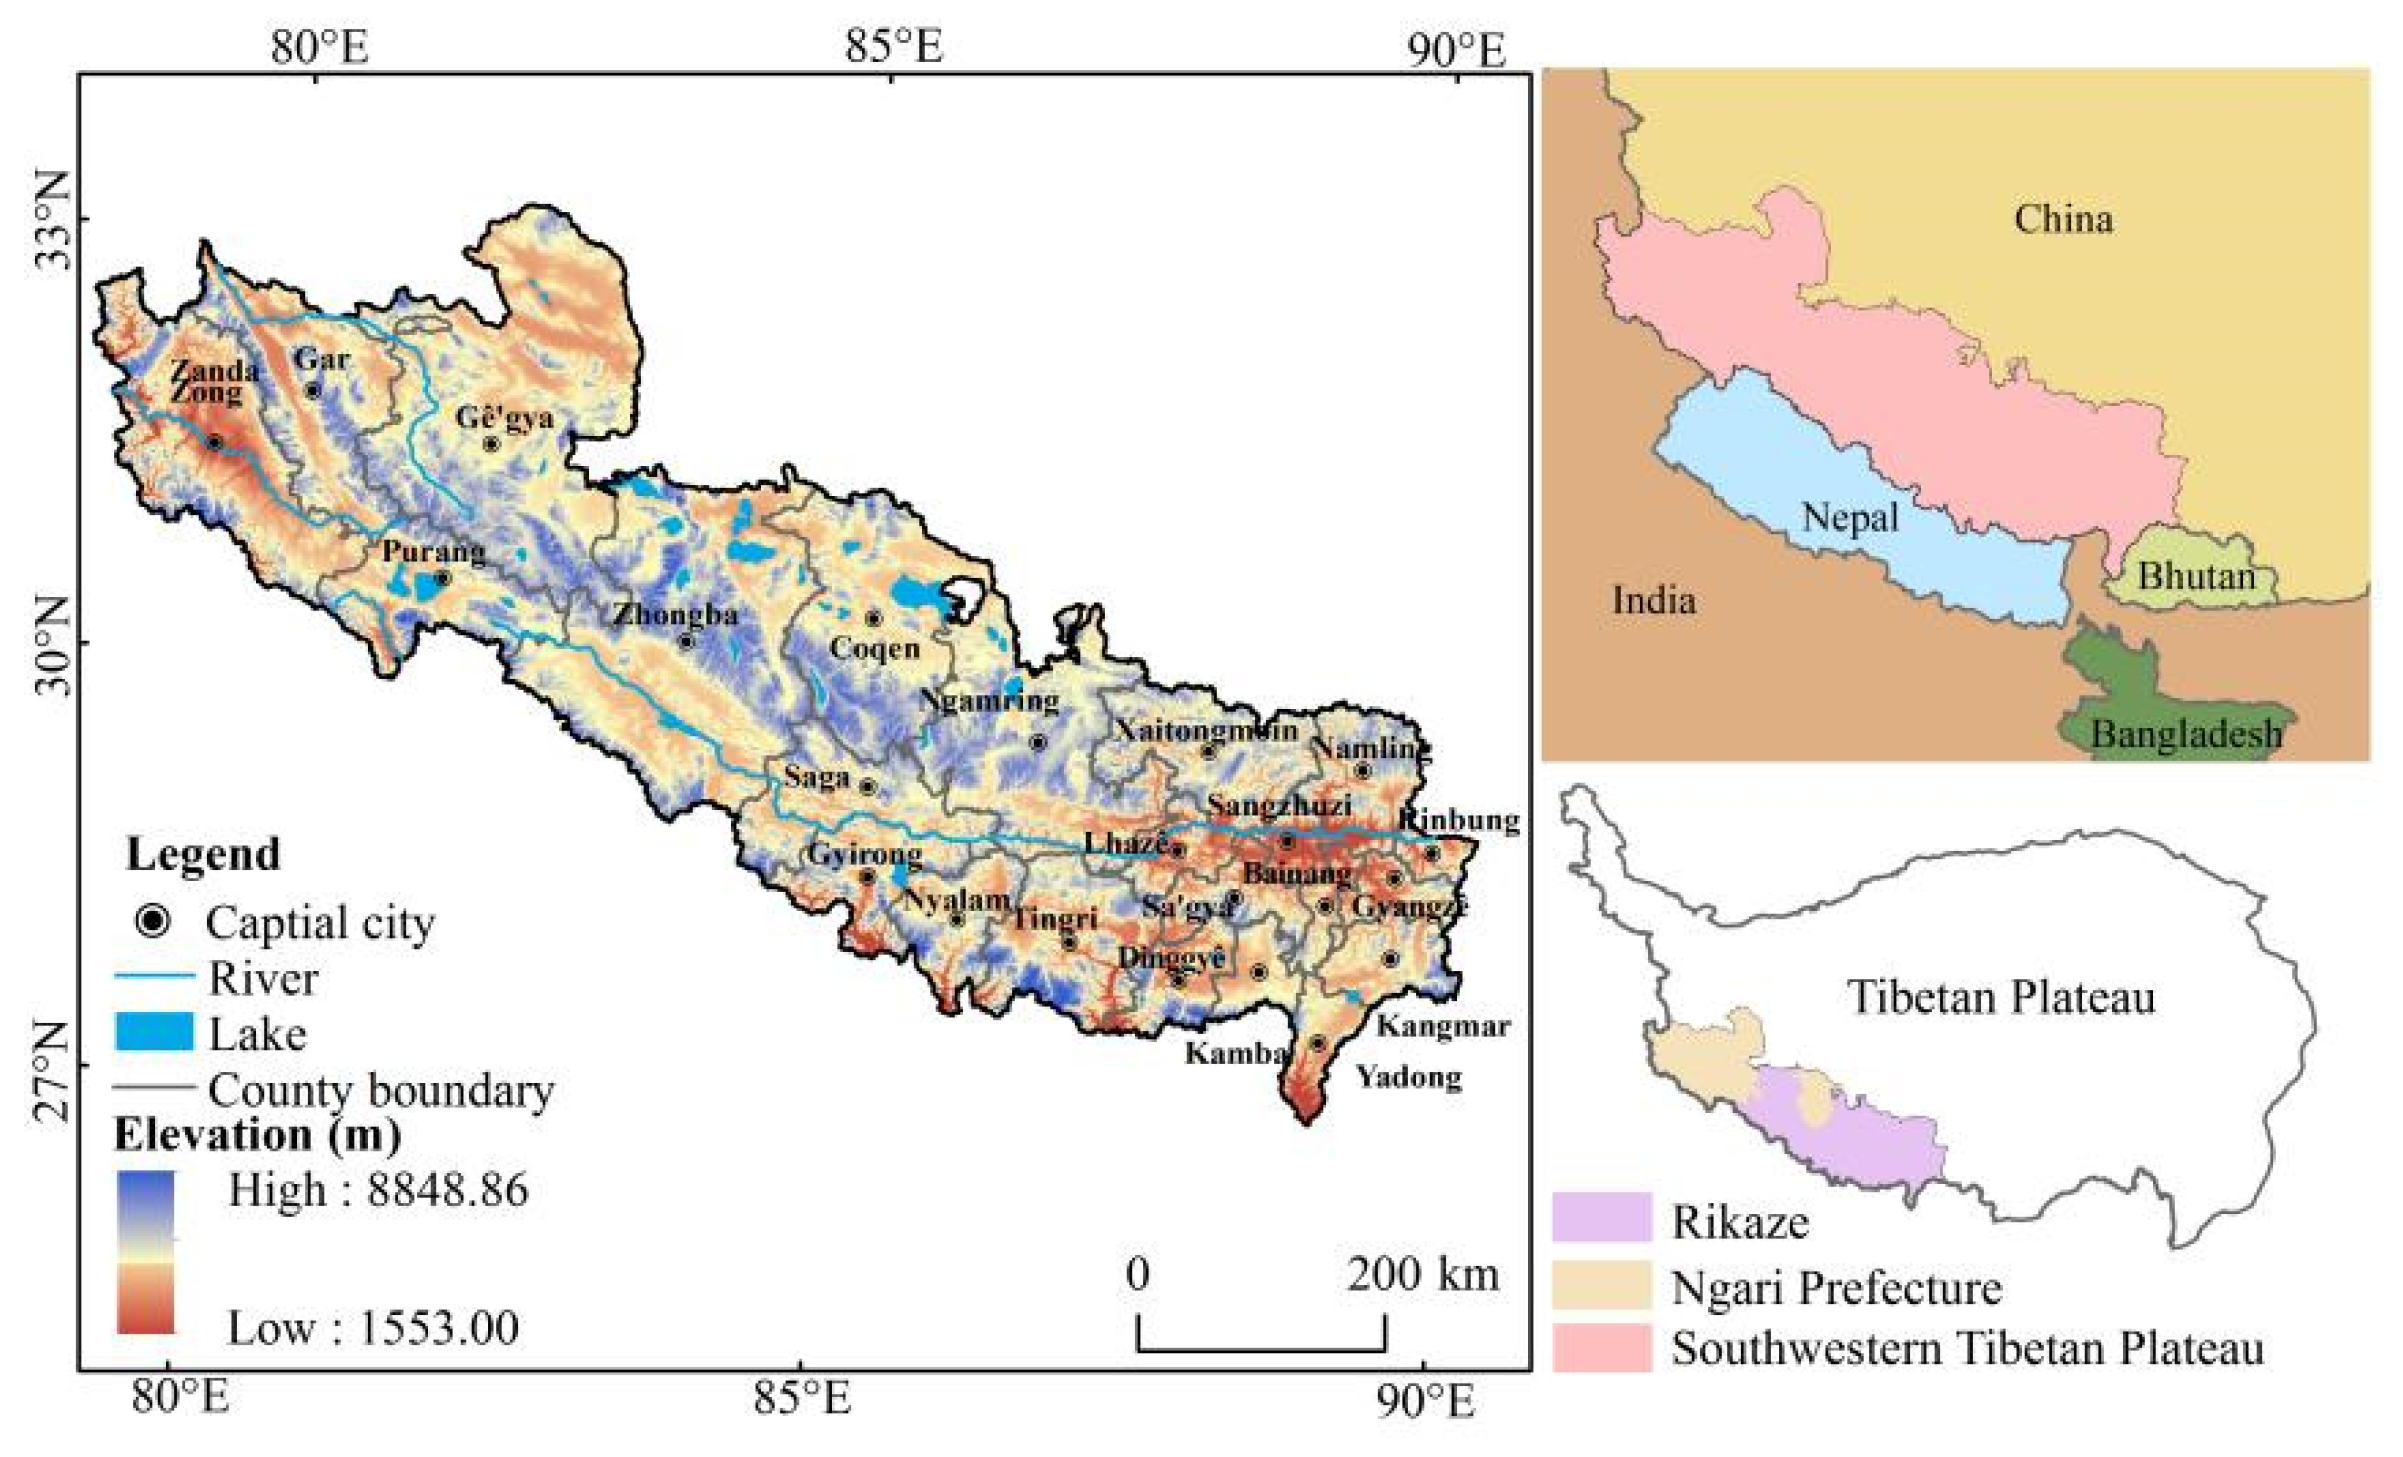
2.1. Case Study Area

The Southwestern Tibetan Plateau (SWTP), with an area of 308.9 thousand km2, is located in the southwest part of the Tibetan Plateau (26°59′–33°97′ N, 78°28′–90°40′ E). The SWTP is situated in the mountainous areas, including the Himalayas and Gangdise, and is an essential transitional belt between China, India, Bhutan, and Nepal (Figure 1). The SWTP is a fragile area characterized by a high relief, generally ranging from 1553 to 8848.86 m (an average elevation of more than 4000 m), a cold and dry climate, less rainfall, and substantial solar isolation. The main landscapes are desert steppe, alpine steppe/grassland, alpine brush, rivers, lakes, urban and rural settlements, glaciers and snow cover, and rocky mountains [37]. The SWTP is the river source of Shiquan, Xiangquan, Kongque, and Maquan (upper parts of the Yarlung Zangbo River), with essential water conservation and ecological services. The SWTP includes Rikaze and Ngari Prefecture, and is one of the typical pastoral areas in the TP. The economic type of the SWTP is relatively simple, and the residents largely depend on the grazing of the Capra hircus, Bos mutus, and Ovis aries.

2.2. Data

The information on the data used can be found in Table 1. This study used Google Earth Engine (GEE) (https://earthengine.google.com/) (accessed on 10 December 2021)) to obtain the 16-day 250 m MOD13Q1 data sets of the growing season (May to September) for the period from 2000 to 2020. To eliminate the negative effects of cloudy and atmospheric change, we used the maximum value composite (MVC) to select a higher value for each pixel during the two images. Then, we calculated the NDVI value from May to September from 2000 to 2020 [50]. To obtain more accurate results of the alpine vegetation, the pixels with NDVI value less than 0.1 for consecutive 15 years are taken as non-vegetation areas by default, and vegetation areas after mask processing were selected as the primary research areas [51,52]. Based on ArcGIS software, we performed basic operations such as projection, clipping, and format conversion on monthly mean temperature and precipitation to generate data sets of annual mean temperature and precipitation in the growing season of the study area. The statistical data were obtained from the statistical yearbooks of Rikaze and Ngari Prefecture. The socio-economic statistical data at the township scale before 2010 were not good and standardized and comprehensive enough due to some departments like the statistical bureau of the local government being established late. Therefore, we used the statistics at the county scale, especially the number of livestock and the available grassland area from 2000 to 2020.

2.3. Methods

2.3.1. Linear Trend Analysis Method

Linear trend analysis mainly uses the ordinary least squares (OLS) to simulate the dynamic variation trend of NDVI in each pixel [34]. This method can eliminate the influence of extreme data in individual years to reflect the spatial change characteristics of NDVI in the study area [54,55]. The calculation formula is [56]:
θ slope = n × i = 1 n i × X ¯ i i = 1 n i i = 1 n X ¯ i n × i = 1 n i 2 ( i = 1 n i ) 2
where n is the time series, n = 21, X ¯ i is the NDVI value of the year i. If θ slope < 0 , indicates that NDVI has a decreasing trend, and if θ slope > 0 , it has an increasing trend. In addition, we use the F test to determine the significance level of vegetation change. According to the results of the significance test, the trend change can be divided into four grades: significant increase (θ > 0, p ≤ 0.05), no significant increase (θ > 0, p > 0.05), significant decrease (θ < 0, p ≤ 0.05), no significant decrease (θ < 0, p > 0.05).

2.3.2. Correlation Analysis Method

To further quantitatively analyze the relationship between NDVI and climate factors, the correlation analysis method is adopted to calculate the correlation coefficient of NDVI, annual average temperature, and precipitation data pixel by pixel [57,58]. The calculation formula is:
r = i = 1 n [ ( x i x ¯ ) ( y i y ¯ ) ] i = 1 n ( x i x ¯ ) 2 i = 1 n ( y i y ¯ ) 2
where n is time series, X i is the average annual temperature or precipitation in i year, and x ¯ is the average yearly temperature or precipitation in the research period, y i  is the NDVI value of i year, y ¯ represents the mean value of NDVI in the research period. r is the correlation coefficient between variables, and its value range is [−1, 1]. If r > 0, indicates a positive correlation between variables, if r < 0 m there is a negative correlation between variables, and the closer the absolute value is to 1, the stronger the correlation is. We use the F test to determine the significance level of vegetation change, and according to the test results, the trend change can be divided into four grades: significant positive correlation (r > 0, p ≤ 0.05), significantly negative correlation (r > 0, p > 0.05), no significant positive correlation (r < 0, p ≤ 0.05), and no significant negative correlation (r < 0, p > 0.05).

2.3.3. Residuals Analysis

Without considering other factors, the residual analysis can be used to distinguish the influence of climate change and human activities on the NDVI, by modeling the regression between NDVI data and annual mean temperature and precipitation for long time series. The residual between the predicted NDVI value and the actual NDVI value, obtained from the simulation is the anthropogenic influence on NDVI [59,60]. The formula is [61]:
NDVI CC = a × T + b × P + c
NDVI HA = NDVI OBS N D V I CC
where, a, b, and c is the model parameter, T and P are the mean annual temperature and precipitation, NDVI HA is the difference between the actual NDVI value and the predicted value in i year, N D V I O B S is the actual value of NDVI in i year, NDVI CC is the predicted value of NDVI in i year. When NDVI HA > 0 indicates that human activities have a positive impact on vegetation growth. NDVI HA < 0 means that human activities have a negative impact on vegetation growth, and NDVI HA = 0 means that human activities have no significant impact.

2.3.4. Calculation of Grazing Intensity

Yak and sheep were the main types of grazing livestock in the study area. During the calculation, we converted the number of the large livestock uniformly to the equivalent unit of five sheep [62]. Then, the domestic livestock was used to calculate grazing intensity based on the county scale [63]. The formula is [37]:
GI = GL / G A
where GI represents grazing intensity (head/hm2), GL represents number of livestock (head), and GA represents the available grassland area (hm2) for grazing in county units.

3. Results

3.1. Spatial Distribution Characteristics of NDVI in the SWTP

The climatic conditions determined the spatial distribution characteristics of the annual mean vegetation NDVI in the SWTP from 2000 to 2020. The value of NDVI was generally low but with apparent spatial differentiation and regional imbalance and showed an increasing trend from the northwest of the SWTP to the southeast. With the decrease in latitude, the NDVI value increased gradually (Figure 2).
The statistical results showed that the vegetation cover in the study area is relatively poor. The SWTP is sparsely vegetated and non-vegetated (NDVI < 0.1), and the low vegetation cover (0.1 < NDVI ≤ 0.2) accounted for 11.88% and 59.08% of the total area of the SWTP, respectively, mainly includes the Ngari Prefecture and the Himalayan Mountainous region. The areas with 0.2 < NDVI ≤ 0.3 are distributed in east Zhongba, accounting for 19.59%. The higher vegetation cover area (NDVI > 0.3) is distributed primarily in the southeast and northeast of the SWTP, accounting for 9.44% of the SWTP (Figure 2).

3.2. Temporal and Spatial Distribution Characteristics of NDVI in the SWTP

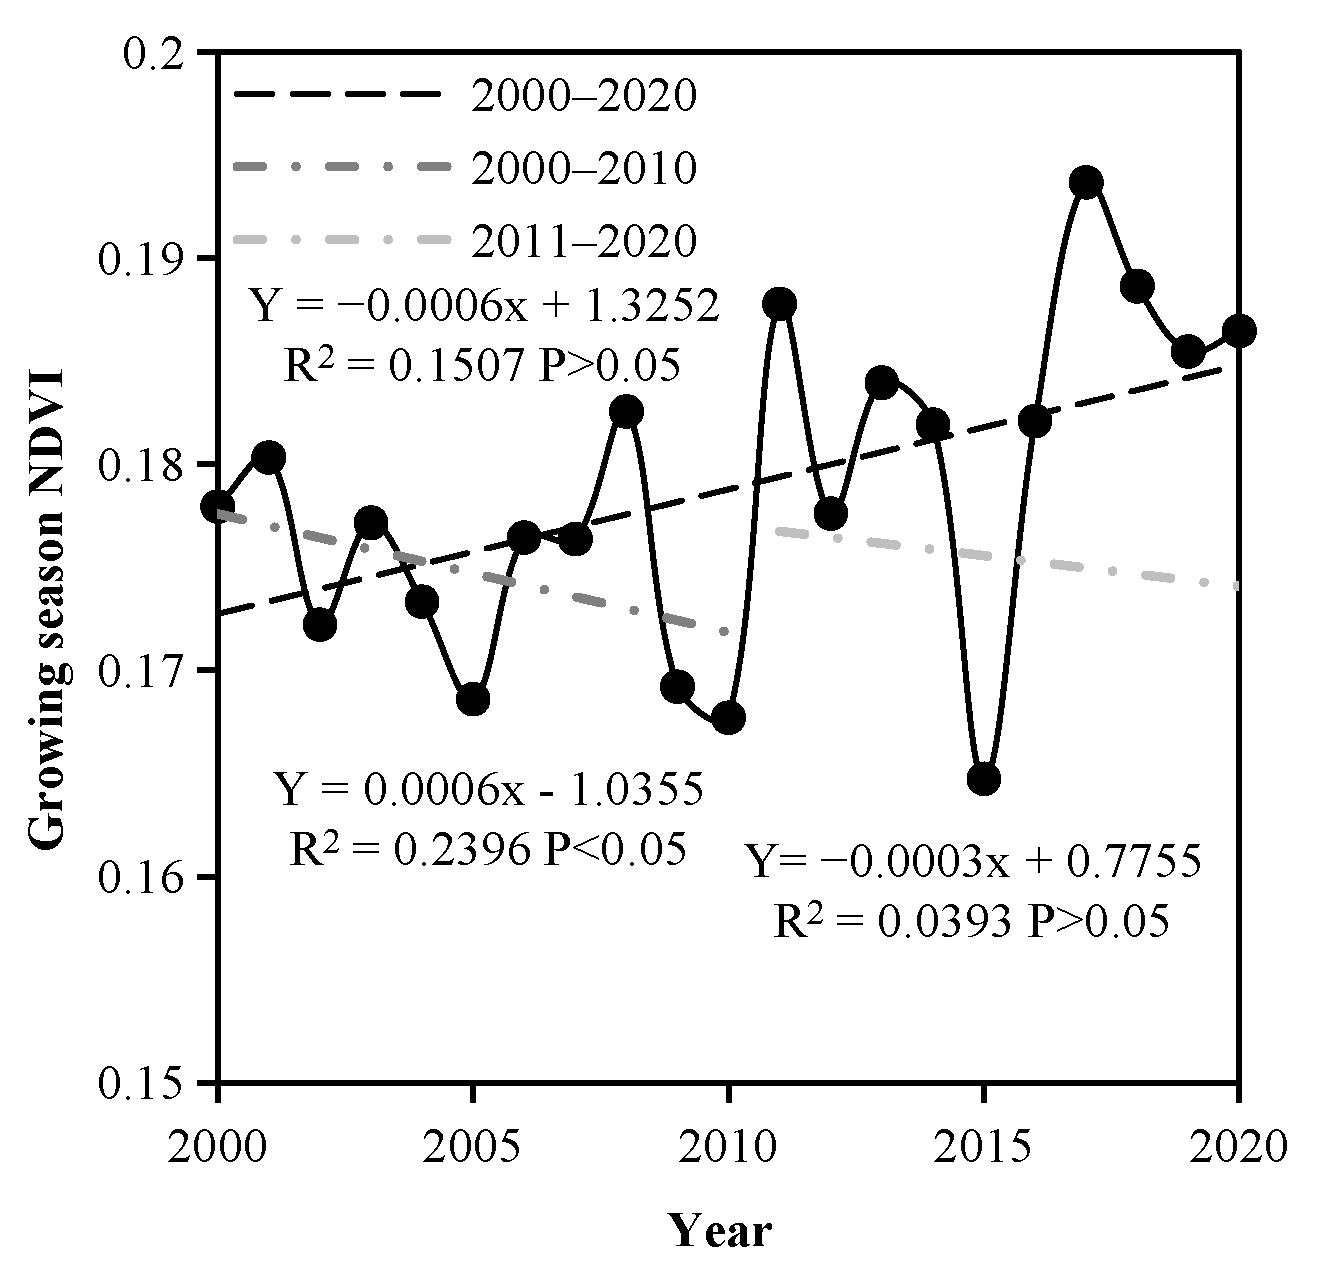
3.2.1. Temporal Variation of NDVI

The change rate of NDVI in the SWTP was 0.006/10a, increasing with fluctuations (p < 0.05) over the last two decades (Figure 3). The maximum value of NDVI appeared in 2017 (0.194). The minimum NDVI value was 0.165 in 2015, and the maximum amplitude of NDVI value in the whole study area was 0.029. From the perspective of 2000–2010 and 2011–2020, there is no significant decrease/increase trend in these two periods, and the average rate of NDVI is −0.006/10a and −0.003/10a. The fluctuation trend of NDVI indicates that vegetation cover in this region is more susceptible to external factors, and the ecosystem is fragile, facing the risk of functional changes like the ecological security barriers [26].

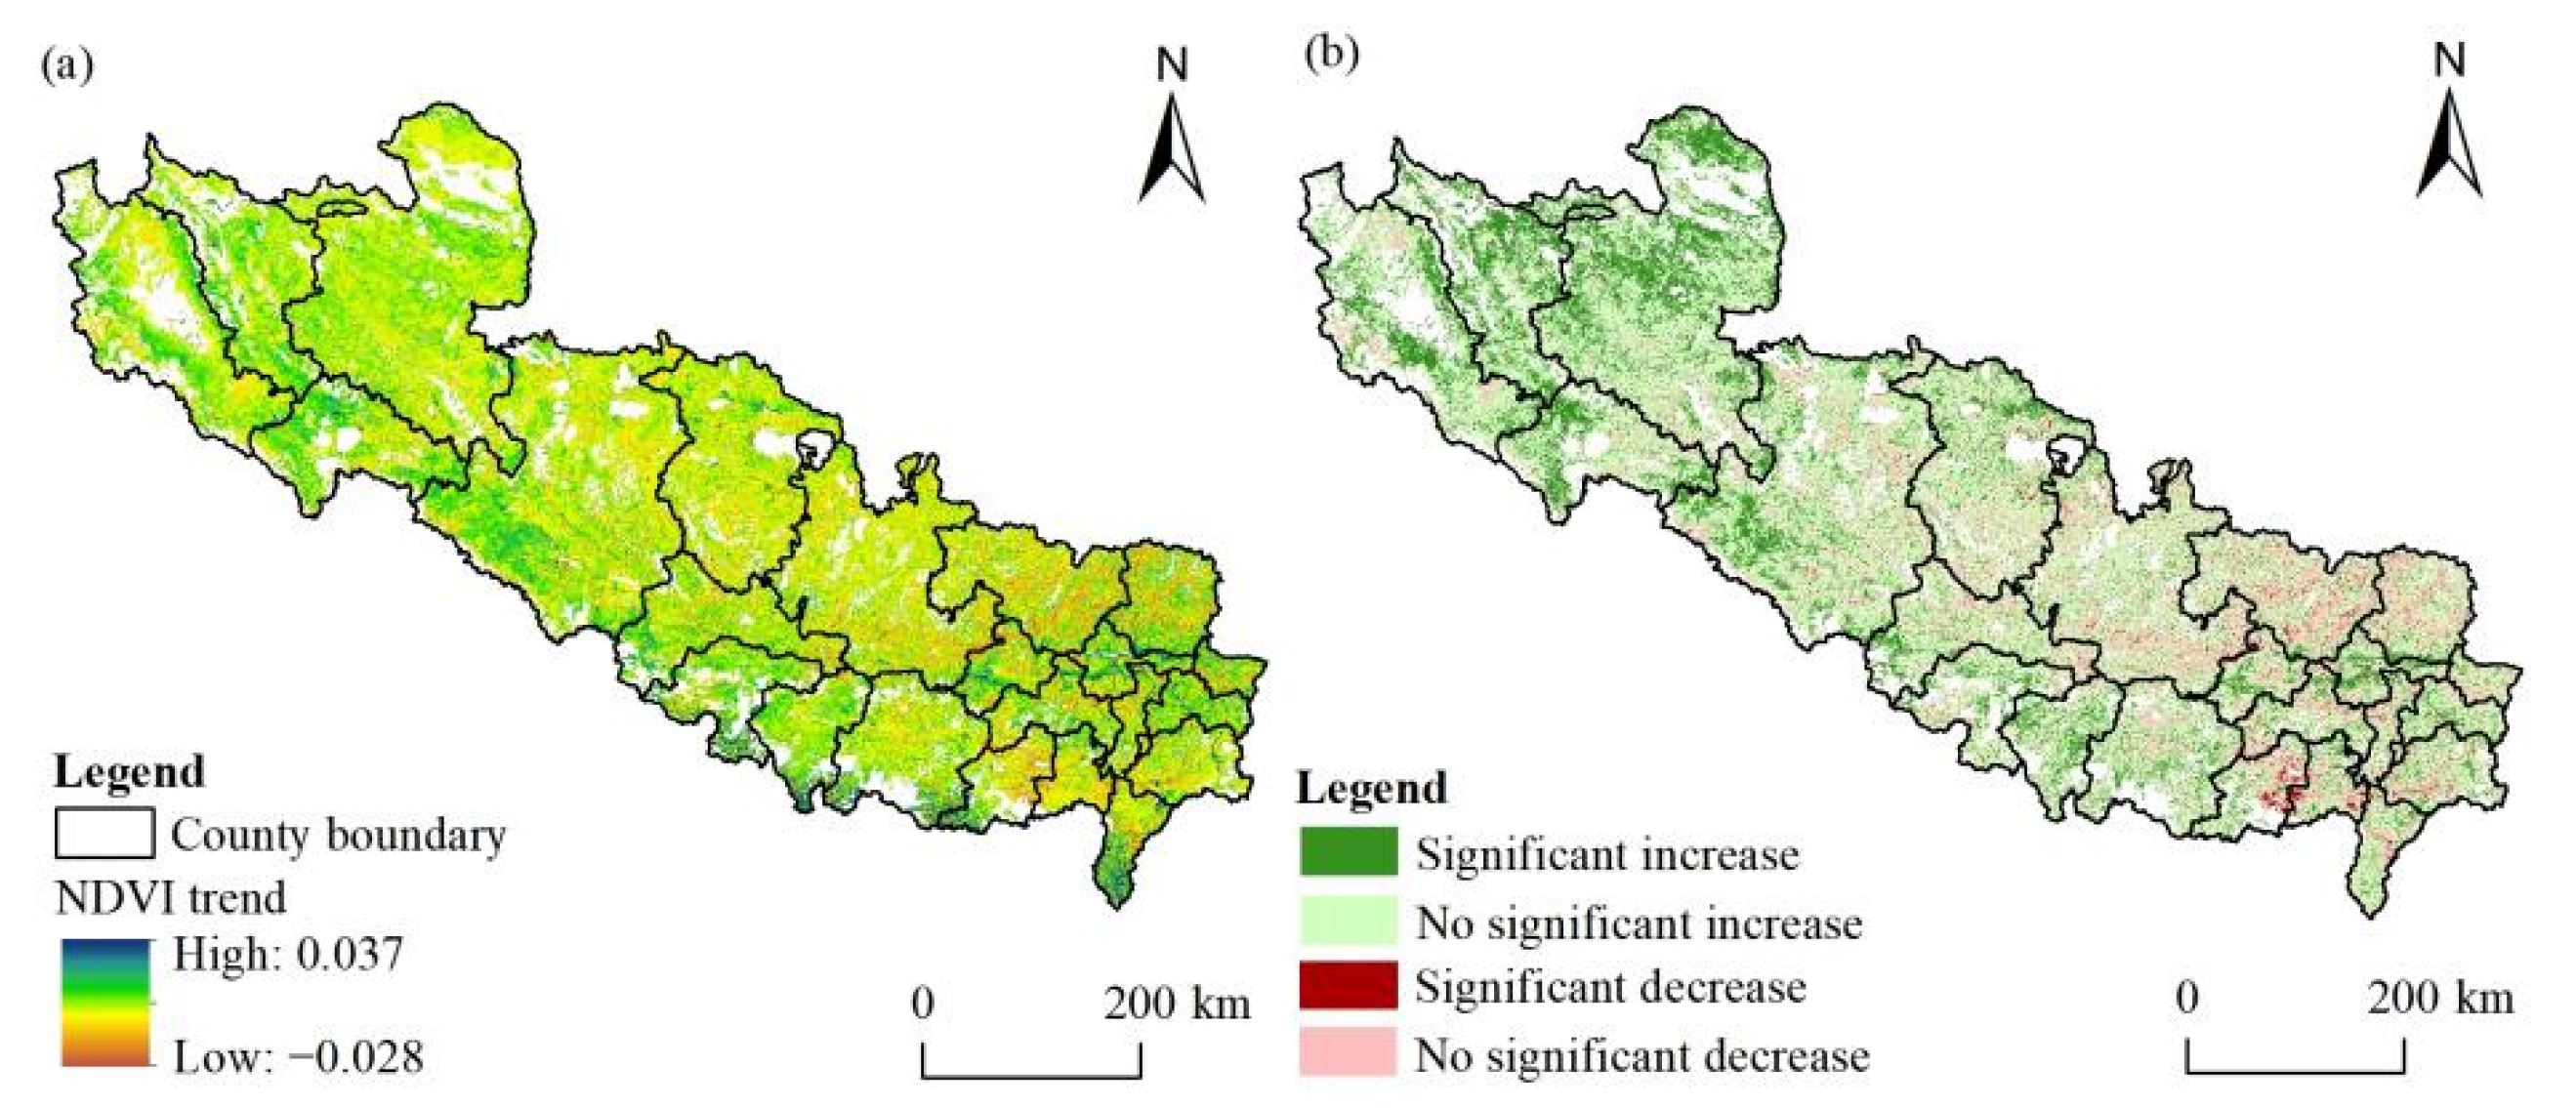
3.2.2. Spatial Variation of the NDVI

Figure 4 shows the changing trend of the vegetation in the SWTP from 2000 to 2020. The vegetation change in the SWTP has both greenness and brownness, with obvious spatial imbalance. The increasing trend is apparent in the western part of the SWTP, and the decrease mainly happens in the eastern of the SWTP, like Rikaze City. The main reason may be that most of the counties in Rikaze are primarily farming and grazing. Crop harvest may lead to a significant decrease in the NDVI (Figure 4a). Figure 4b reveals the significance of NDVI variation in the growing season. The results show that the area with an increasing trend accounted for 77.09% of the total area. The areas with a significant increase of NDVI accounted for 21.47% of the SWTP, mainly distributed in the Ngari Prefecture. The areas with a substantial and non-significant decrease of NDVI during the growing season, respectively, accounted for 1.34% and 21.57% of the SWTP, mainly distributed in the eastern parts. The reason may be that the western part of the SWTP is greater and sparsely populated. In contrast, the east part of the SWTP is small but densely populated, and human activities lead to a decrease in the NDVI (Figure 4b).

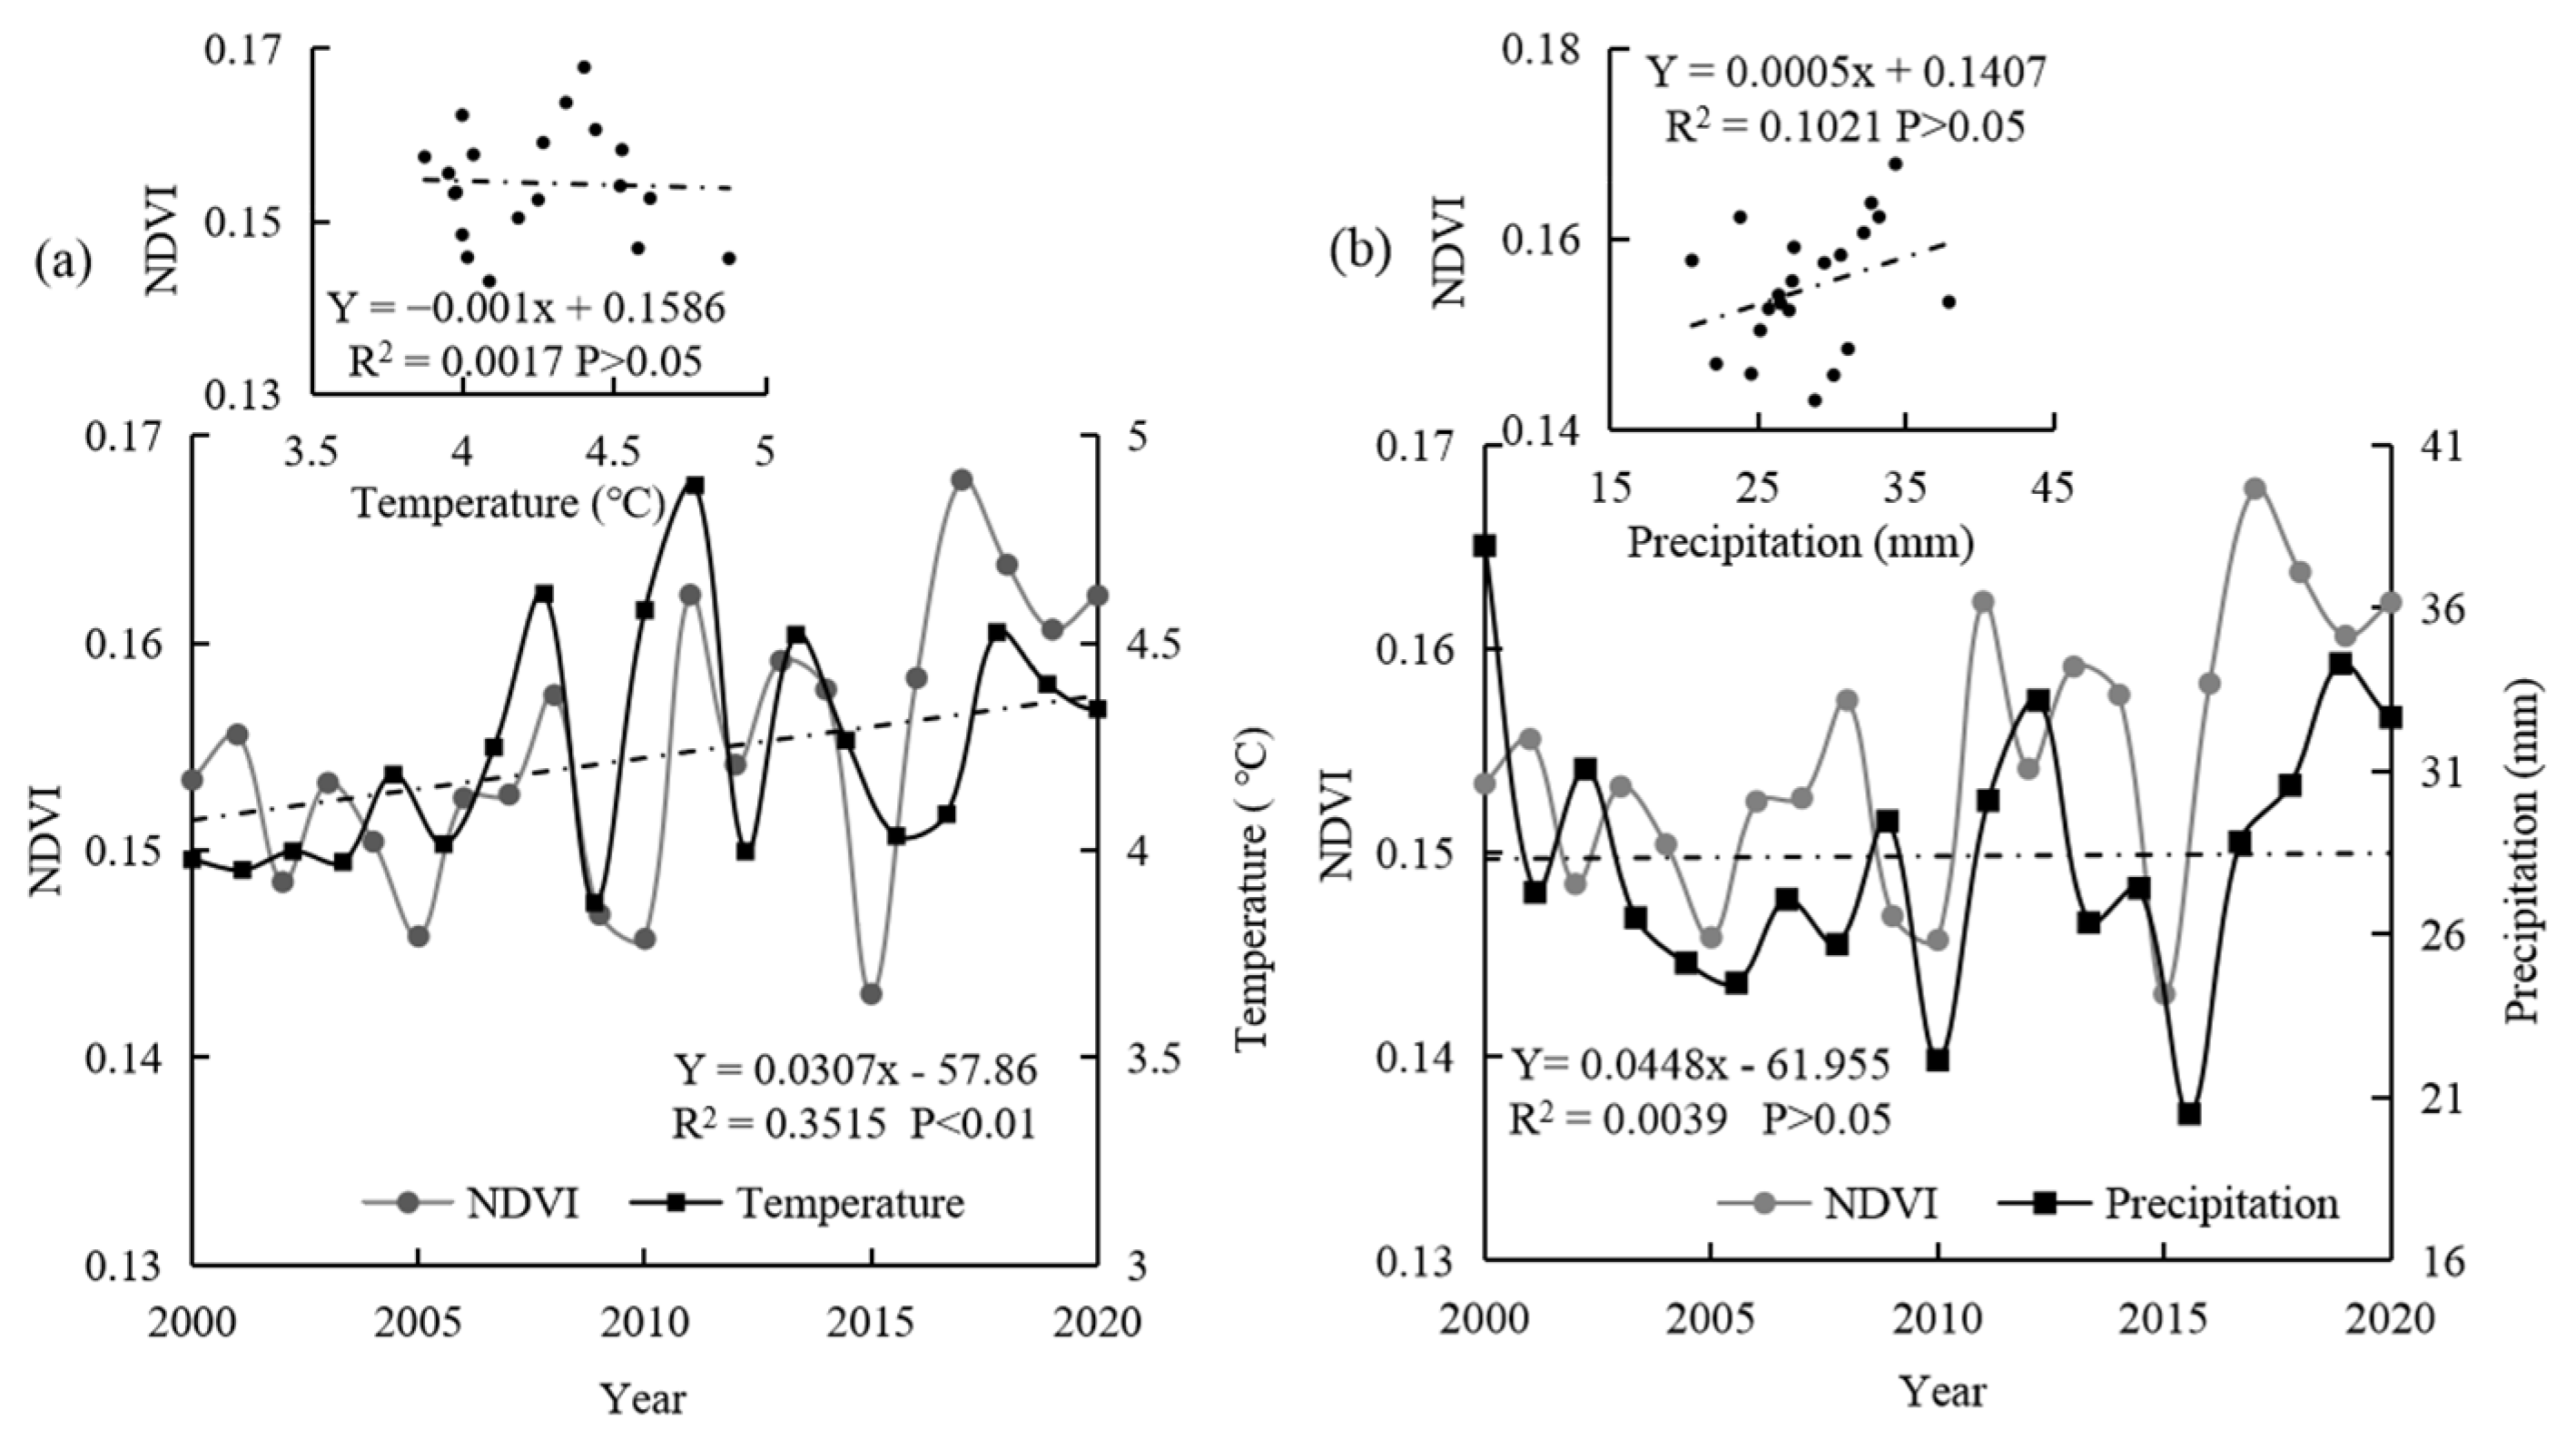
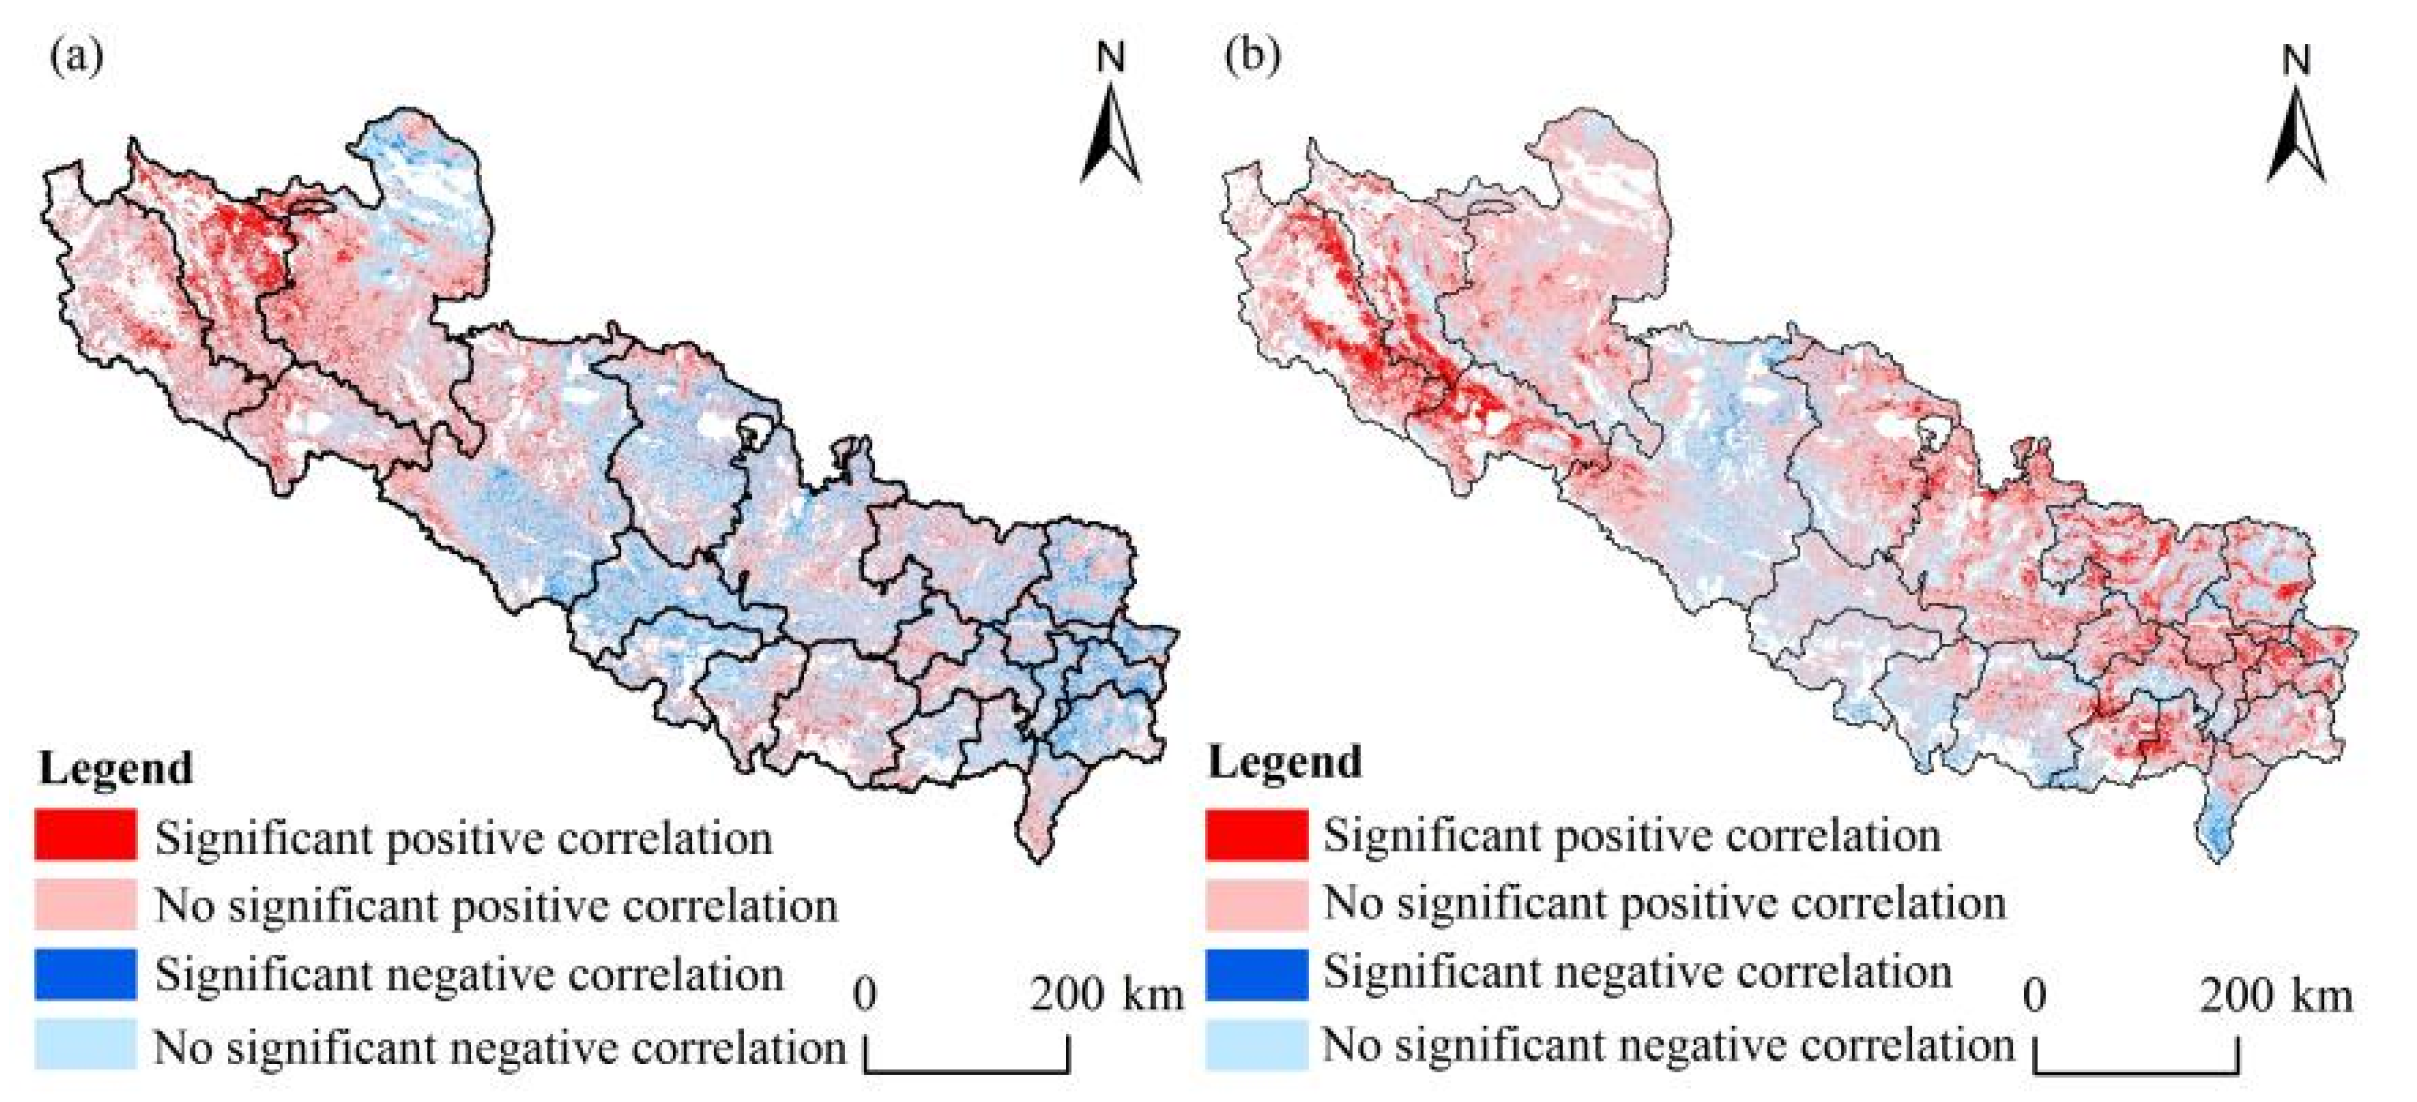
3.3. Relationships between the Vegetation Dynamics and Climate Factors

During the last 20 years, the average annual temperature of the SWTP has increased (p < 0.01), with an average rate of 0.307 °C/10a (Figure 5a), the maximum temperature occurred in 2010 (4.88 °C) and the minimum temperature occurred in 2008 (3.87 °C). The fluctuation of annual precipitation showed no significant increase trend (Figure 5b), the maximum precipitation occurred in 2000 (37.92 mm), and the minimum precipitation occurred in 2014 (20.50 mm). The results of the Pearson correlation analysis showed that the fluctuation trend of NDVI and annual mean temperature and annual mean precipitation in the SWTP in the last 20 years have a certain similarity, showing a positive correlation (Figure 5). The reason may be that there are spatial differences in climatic conditions in the SWTP, and there is a time lag effect between NDVI and temperature and precipitation. Therefore, a simple linear relationship may be difficult to clearly characterize the correlation between NDVI and climate change.
To further reveal the correlation between NDVI and the average temperature and rainfall in the growing season of the SWTP from 2000 to 2020, the spatial distribution pattern of correlation coefficients was calculated pixel by pixel by the correlation analysis (Figure 6). There is a positive correlation between NDVI and the average yearly temperature in the growing season of the SWTP (51.16%), 7.25% of which is characterized by a significant positive correlation, mainly distributed in Gar. The areas with no significant positive correlation, 43.91% of the SWTP, distributed primarily in Ngari Prefecture and Ngamring, Xaitongmoin, Yadong, and Tingri (Figure 6a). The NDVI in the growing season was negatively correlated with the average annual temperature, accounted for 48.84%, and was mainly distributed in the central and northeastern of the SWTP (Figure 6a). The NDVI in the growing season of the SWTP mostly positively correlated with the annual average precipitation (65.76%), 9.16% of which is characterized by a significant positive correlation, was mainly distributed in the western parts of Gar, Zanda, and Purang. The precipitation in these areas was slight, and the local vegetation was easily affected by the drought. The areas with no significant positive correlation, accounted for 56.60% and were mainly distributed in Ngari Prefecture and the northeastern SWTP. The negative correlation between NDVI and annual precipitation in the growing season accounted for 34.24%, mainly in Zhongba (Figure 6b).

3.4. Relationships between Vegetation Dynamics and Human Activities

The residual analysis method was applied to explore the effects of human activities and climate change on the NDVI in the growing season. The results showed that human activities had affected the alpine vegetation (Figure 7). The effect of human activities on the NDVI is mainly positive (residual > 0), accounting for 69.15% from 2000 to 2020, and the adverse effects (residual < 0) accounted for 30.85%. In the last 20 years, 12.07% of the NDVI was primarily affected by human activities (residual > 0.001) and mainly distributed in the southern slope area of the Himalayas. The improvement of surrounding vegetation was relatively small due to human activities (residual value of 0.0005~0.001), accounting for 20.00%. The eastern parts of the SWTP, such as Xaitongmoin, Namling, Rinbung, Bainang, and Dinggyê, were mainly affected by human activities (residual < −0.001), accounting for 4.46%. The vegetation degradation was less affected by human activities (residual values of −0.001~−0.00005), accounting for 6.92%. In addition, 59.56% of the SWTP were least affected by human activities (residual values of −0.0005~0.0005), 19.47% belonged to the residual values of −0.0005~0, and 37.09% had their residual values of 0~0.0005, mainly distributed in the western and central SWTP, where the vegetation is more affected by the precipitation and temperature.

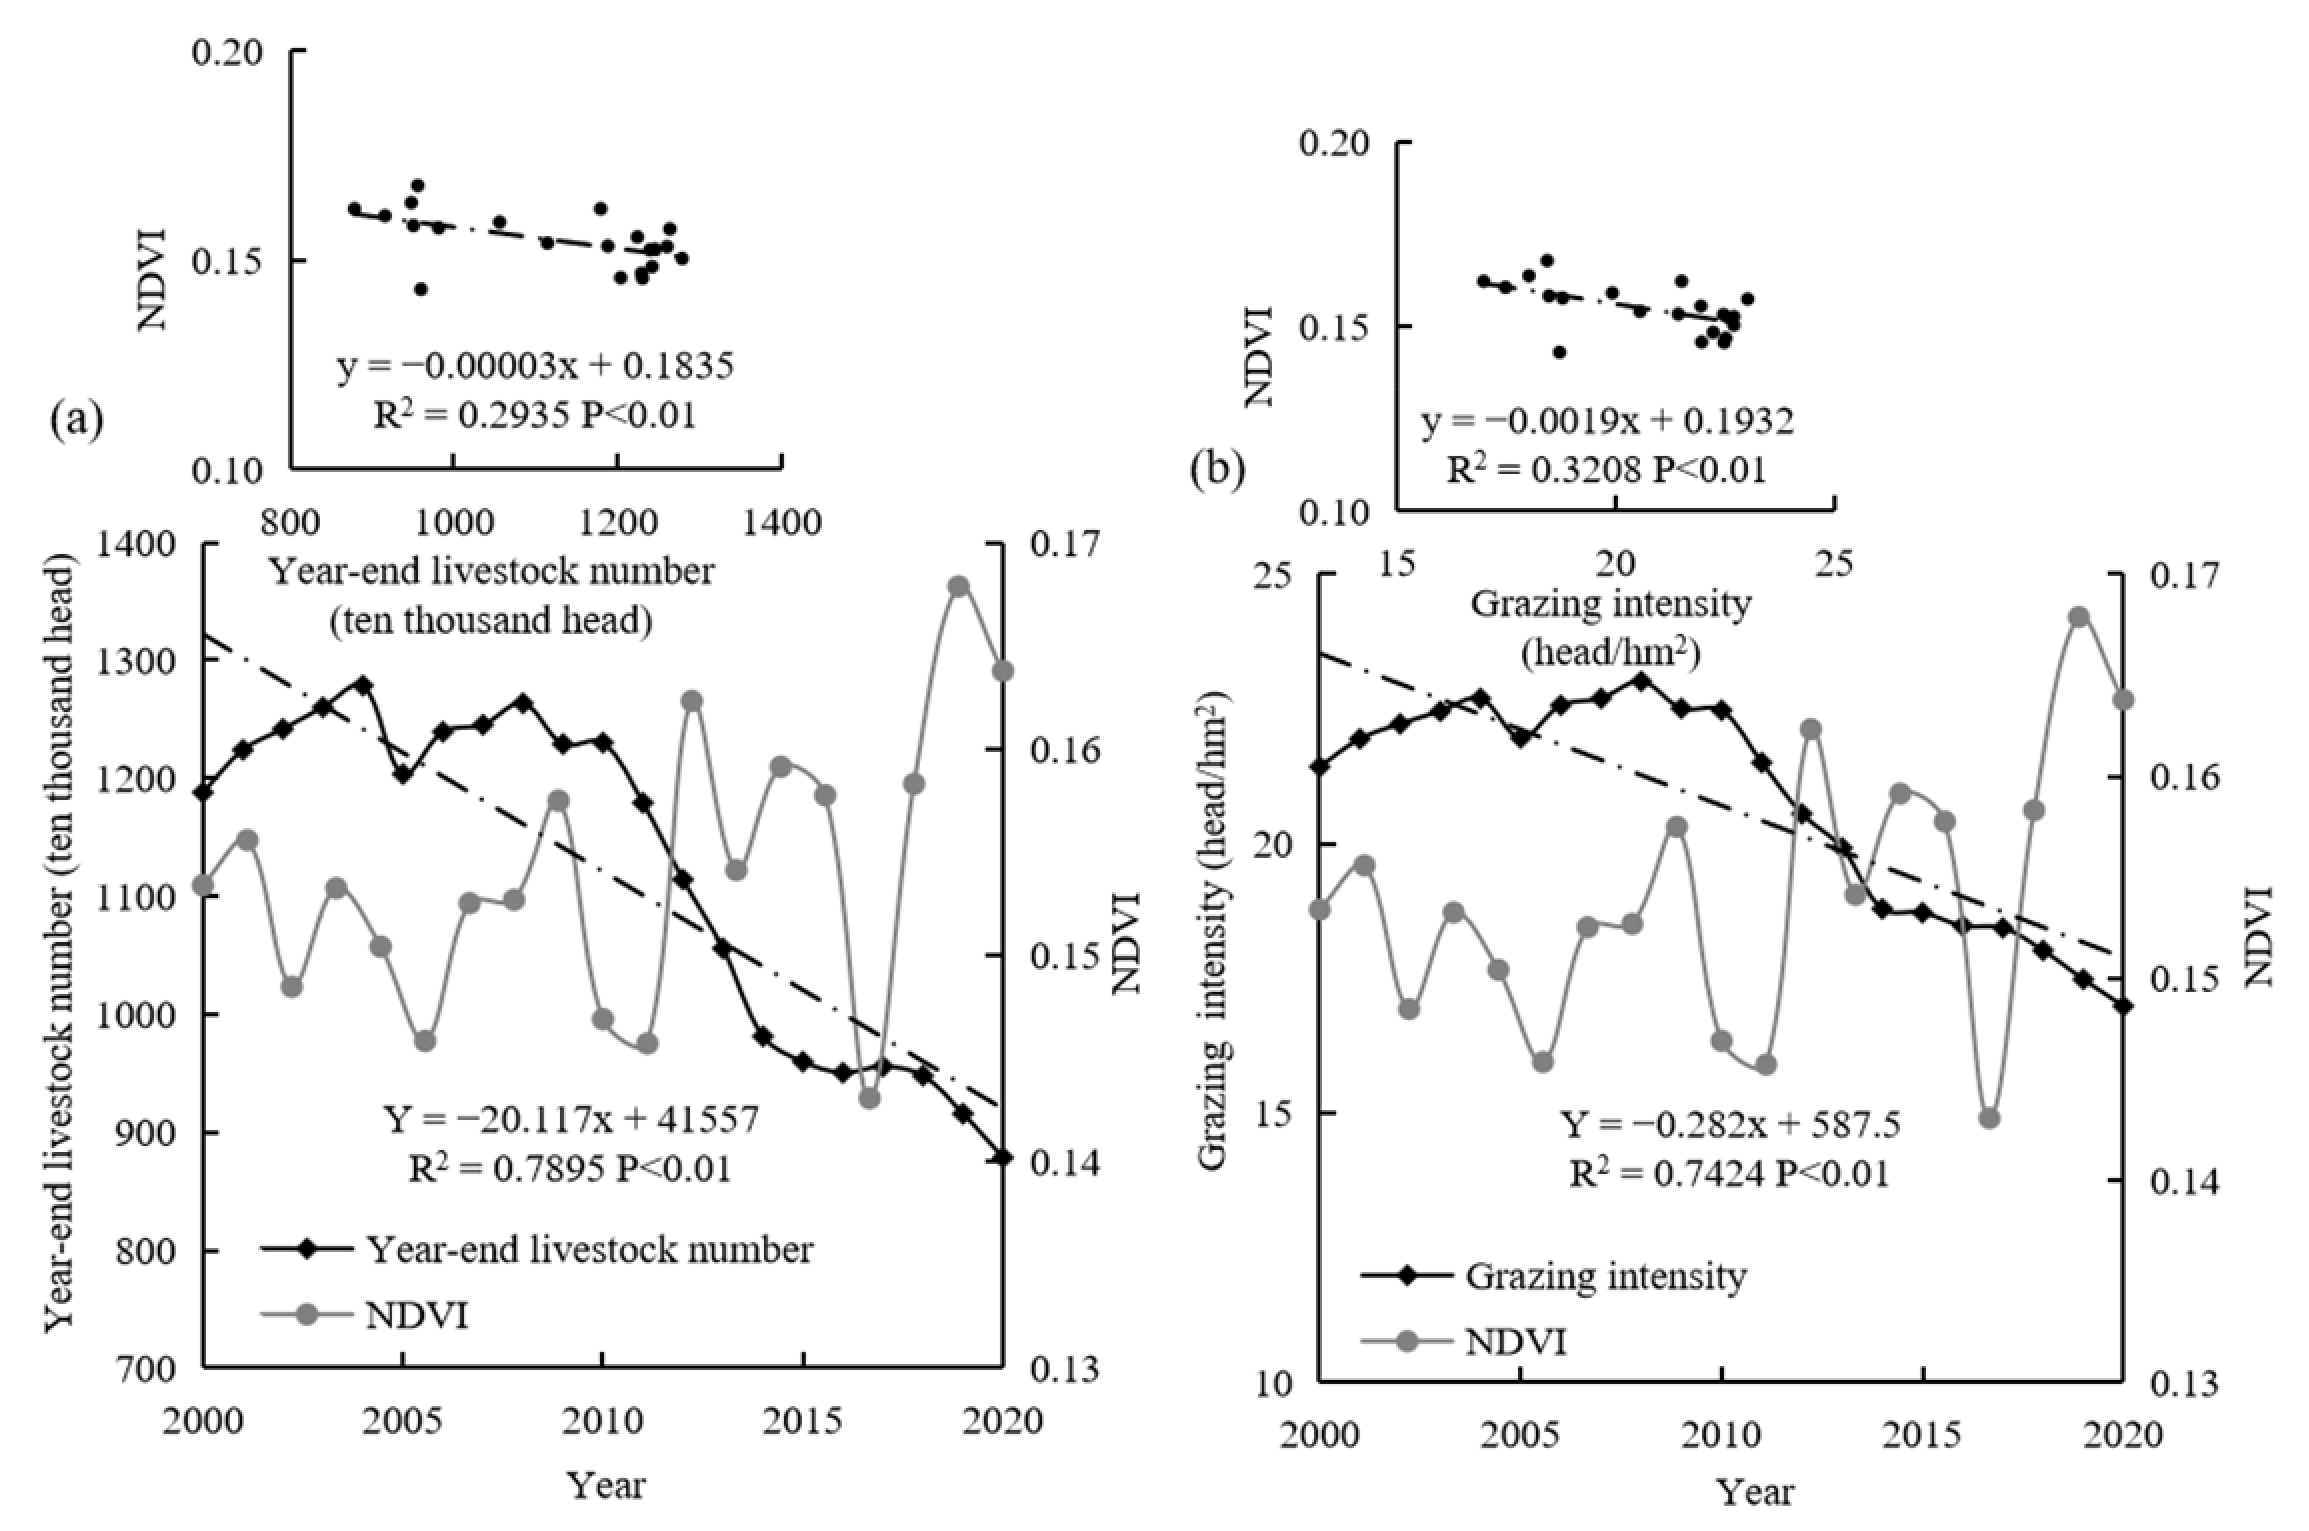
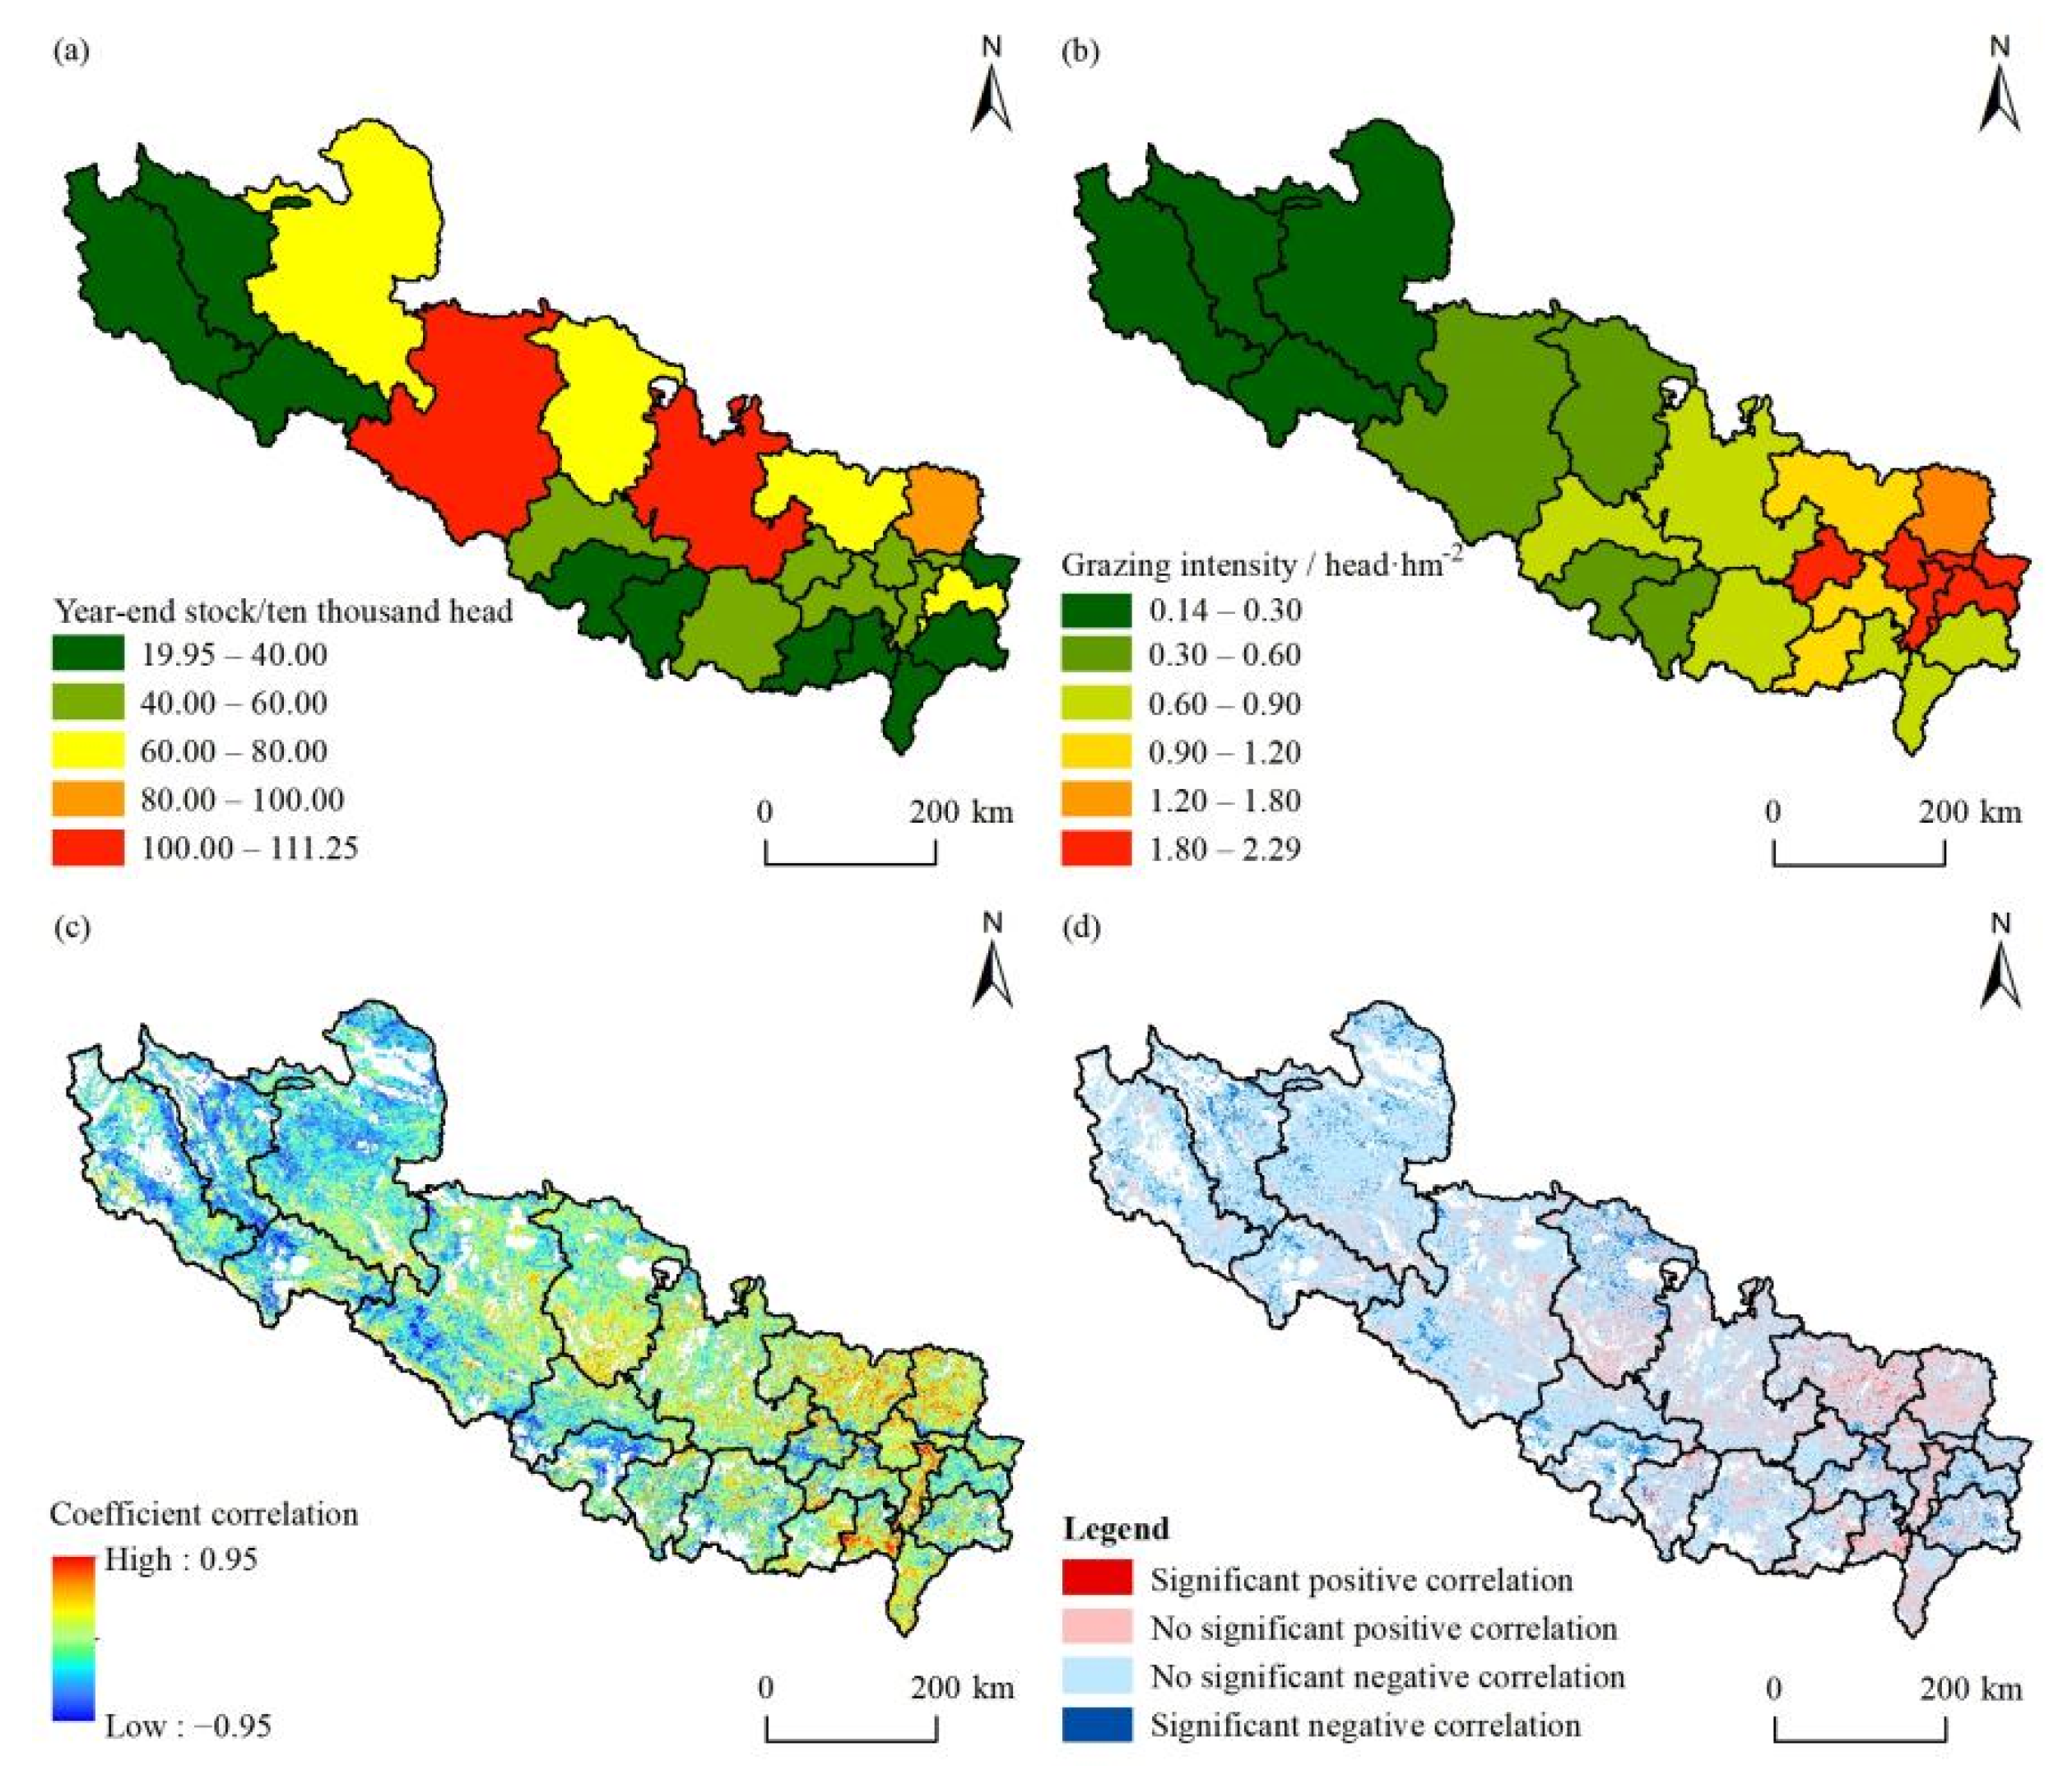
3.5. Relationships between the Vegetation Dynamics and Grazing Intensity

The number of year-end livestock declined significantly at an average rate of 2017 million standard sheep per 10 years, and the rate declined dramatically after 2010 (Figure 8a). There is a linear correlation between NDVI and livestock number (p < 0.01). The NDVI decreased with the increase of the livestock quantity. The grazing intensity of the SWTP also showed a decreasing trend, with an average rate of 28,200 head/square hectare per 10 years (Figure 8b). The NDVI also had a linear correlation with grazing intensity (p < 0.01). With the increase in grazing intensity, the NDVI decreased gradually. The simple linear relationship results showed that the NDVI has a certain correlation with the number of livestock and grazing intensity, but grazing intensity has significant spatial differences, so it is necessary to further explore the spatial correlation between NDVI and grazing intensity.
Due to the sparsely populated and vast desert steppe, the main human activities are herders grazing and livestock, which resulted in vegetation degradation in the SWTP. Based on the spatial distribution of the statistical data, the spatial distribution of year-end livestock number and grazing intensity on the county scales in the SWTP changed apparently from 2000 to 2020 (Figure 9a,b). The year-end livestock number was high in the north and low in the south from 2000 to 2020. The grazing intensity was high in the east and low in the west, with an obvious imbalance in the spatial distribution. In the past 20 years, the year-end number of the domestic livestock in the SWTP ranged from 199,500 to 1112,500. The grazing intensity ranged from 0.14 to 2.29 in the SWTP. The grazing capacities of Zhongba and Ongren were larger than one million sheep equivalent units (Figure 9a). The grazing intensity in most counties was lower than 0.90, mainly concentrated in the west SWTP, like Zhada, Gar, Gê’gya, and Purang (Figure 9b).
To further determine the spatial relationship between grazing intensity and the residual NDVI, we converted grazing intensity data into 250 m raster types, and then conducted a correlation analysis between grazing intensity and the residual NDVI (Figure 9c,d). The results showed that the residual NDVI was correlated negatively with grazing intensity in the SWTP. The negative correlation pixel area accounted for 77.80% of the study area, mainly distributed in the western and central of the SWTP. The positive correlation pixel area accounted for 22.19% of the study area, distributed primarily in Xaitongmoin, Namling, Bainang, and Kamba (Figure 9c). The significance test verified the correlation coefficients, and the results showed that the subregions with significant negative correlation (p < 0.05), accounting for 5.99%, were mainly distributed in Zhada, Gar, Gê’gya, Zhongba, Cuqen, and Gyirong, with a significant positive correlation of only 0.43% of the SWTP (Figure 9d).

4. Discussion

4.1. Spatiotemporal Change Characteristics of NDVI in the SWTP in the Last Two Decades

In this study, we found that the spatial distribution pattern of NDVI in the SWTP gradually increased from the northwest to the southeast (Figure 2), which was consistent with the climatic conditions of the SWTP. Compared with the eastern part, the climate conditions in the west were unfavorable to vegetation growth [24]. We found that the vegetation cover in the SWTP showed an overall upward trend in the time series (Figure 3), consistent with the previous research results on the dynamic changes of vegetation in the TP [9,37]. Besides, we found an opposite trend in the vegetation cover change in the past two decades. The NDVI decreased significantly from 2000 to 2010 and increased substantially from 2011 to 2020. These results are consistent with Gillespie et al. (2019) [36] and Li et al. (2020) [9], who found that the southwest of the Tibetan Plateau became browning from 2000 to 2010. This result may be related to the implementation of ecological projects such as the Grassland Ecological Protection Program (2011–2020). To sum up, the SWTP is generally becoming greener but browner in some parts, which is consistent with the study results of the TP [64,65]. It is worth noting that the vegetation mainly greening in the western SWTP, while the vegetation is browning partly in the eastern, which may be due to the intensity of human activities in eastern SWTP being significantly higher than that in the west [66].

4.2. Effects of Temperature and Precipitation on the NDVI in the Growing Season

Climate change and human activities determine the dynamic change of alpine vegetation in the TP, and climate change is the dominant factor [66,67]. Under the background of global warming, the temperature in SWTP increased apparently, while the precipitation fluctuated (Figure 5) [68]. We found that the NDVI correlates positively with temperature and rainfall during the growing season in most SWTP. Precipitation is positively correlated significantly with rains in the southwest and northeast of the SWTP. Still, the temperature is correlated positively in the western of the SWTP, which indicates that water resources are the main limiting factor of vegetation change in this region (Figure 6) [69]. However, the study area belongs to the semi-arid alpine climate, and the main vegetation types are desert steppe and alpine steppe [68]. Therefore, the browning in the northeast of the SWTP may be due to the decrease in precipitation, and temperature increase may cause the greening in the west of the SWTP. Although many scholars believe that the Tibetan Plateau will be warm and humid in the future, the southwest part of the TP will be warmer and drier [9]. Suppose the climate continues to warm in the SWTP in the future. In that case, the drought will increase, and soil moisture will challenge vegetation growth, thus inhibiting vegetation growth and aggravating desertification in the SWTP [67]. Therefore, the ability to combat climate drought risk should be improved in the future, such as the development of water-saving agriculture, the use of underground drip irrigation, and other water-saving irrigation technologies to reduce the impact of drought and rain shortage, and effectively improve the utilization efficiency of irrigation water and crop yield.

4.3. Effects of Human Activities on the NDVI in the Growing Season

In this study, we found that the impact of human activities on vegetation was mainly positive, accounting for 69.94% in the SWTP, and the negative implications accounting for 30.06% (Figure 7). To sum up, human activities promoted the growth of vegetation. However, from the perspective of spatial distribution, the area of brown vegetation caused by human activities is mainly concentrated in the northeast part of the SWTP with a dense population and more cultivated land. As a result, although the government has implemented ecological protection measures and the ecological environment has been improved to a certain extent [70]. There is still browning in densely populated towns and settlements and their surrounding areas [64,71]. Thus, human activity is a double-edged sword. Therefore, the future work should not only focus on the environmental protection policy, but also to improve people’s awareness of environmental protection, for a win-win of regional economic development and environmental protection.

4.4. Effects of Grazing Intensity on the NDVI in the Growing Season

We found differences in the grazing intensity and spatial distribution of livestock, possibly because animal husbandry is the primary economic source in the western SWTP. The livestock number is significantly higher in the west of the SWTP than in the eastern part. The available grassland area is more extensive, so the distribution characteristics of the western regions are large livestock carrying capacity but low grazing intensity (Figure 9). Meanwhile, the eastern parts of the SWTP belong to the farming and pastoral areas with a higher population density. With the rapid development of the economy, people’s demand for meat products, and a series of significant external reasons for livestock number increase, the Rinbung performance significantly, the livestock is less than 400,000. Still, its grazing intensity is 1.8~2.29 per hectare.
However, the effect of grazing intensity on vegetation is still unclear. Therefore, we calculated the correlation analysis between grazing intensity and the residual NDVI only affected by human activities and obtained the correlation between the grazing intensity and residual NDVI at the pixel scale from 2000 to 2020 (Figure 9). We found that the grazing intensity in the Ngari Prefecture was not high, but there was a strong negative correlation on the pixe scales. This result may be due to the poor climatic conditions in the western region, and the precipitation is difficult to achieve the vegetation growth conditions. Although the available grassland area in the SWTP was larger, it belonged to desert alpine grassland with less aboveground biomass. The local grassland cannot afford domestic livestock [72]. The relationship between grazing intensity and residual NDVI in the eastern SWTP is complicated. The results showed that the negative correlation coefficient between NDVI and grazing intensity was low in most areas, and positive correlation was found between NDVI and grazing intensity in some areas. This spatial distribution pattern may be due to the apparent advantages of agriculture and animal husbandry in the eastern SWTP, which provides supplementary feed for some livestock. In addition, the climatic conditions in the east of China are relatively good, which is suitable for vegetation growth. The vegetation condition is better than that in the western, and the aboveground biomass is more, which makes NDVI in this region meet the demand of livestock quantity. Therefore, the negative correlation coefficient between NDVI and grazing intensity is small or shows a positive correlation. Human activities significantly impact the vegetation in the SWTP. Within them, grazing is one of the main factors. In the future, it is necessary to link land use and residential location data together to reveal the impact of human activities on the NDVI change, such as land use pattern and its change, agricultural production and life ways, and grazing behavior in the winter and summer, and so on.

4.5. Limitations and Outlook

This study aimed to explore the spatiotemporal changes of the alpine vegetation and its influencing factors, like climatic change, human activities, and grazing intensity in the SWTP. Our study obtained some preliminary findings, which are helpful in the understanding of the vegetation variation and its influencing factors in the SWTP.
However, this study still has some uncertainties and limitations. Firstly, the climate conditions of the SWTP have substantial spatial heterogeneity, and it isn’t easy to interpolate temperature and precipitation that more satisfy the study accuracy by the meteorological station data. Therefore, we chose a climate data set of 1km. Although it can represent the response of vegetation to climate change in space, there are still some limitations. Secondly, when exploring the effect of grazing intensity on the NDVI, we used the live-stock number to get the grazing intensity at the county scale (the only data source of the domestic livestock). It was found that the correlation between grazing intensity and NDVI could be revealed using correlation analysis, but it was still difficult to reveal grazing behavior. In the future, it is needed to use NDVI and grazing intensity data to refine the study scale (i.e., from the county scale to the residential level, or smaller pixel scale) to explore the impact of grazing intensity on vegetation. Thirdly, the Residual Analysis Method is useful to separate the effects of climate change and human activities on the NVDI change. However, the regression model using temperature and precipitation simulation is still not good enough, which will amplify the impact of human activities on the NDVI to a certain extent. Therefore, more efforts are still needed to further refine the model and consider more influencing factors, such as topography, solar radiation, soil moisture, soil nutrients, etc. Fourthly, the implementation of ecological conservation projects has a certain impact on the NDVI. However, it is very difficult to quantitatively analyze the effect of every single ecological restoration projects/policy due to the variety of the implementation duration and areas. In the future, more efforts are still needed to explore the impact of ecological projects on the NDVI for ecological conservation in different time and spatial scales, and to provide a reference basis for future ecological environmental protection and human well-being.

5. Conclusions

This study used the NDVI, climate data, and social statistic data to explore the spatiotemporal changes and their relationship with climatic change, human activities, and grazing intensity. We found that the NDVI of the SWTP increased at a rate of 0.006/10a from 2000 to 2020, with partial browner which was mainly distributed in Rikaze. The correlation analysis between NDVI and climate change shows that precipitation is the most critical climate factor affecting the spatial distribution of NDVI in the SWTP, and NDVI is correlated positively with temperature and precipitation in most areas. We found that climate change and human activities combined impact vegetation change in the SWTP, and human activities have led to vegetation greening in the last two decades. We also found that NDVI and grazing intensity were mainly negatively correlated, and the grazing damaged vegetation cover to some extent. This study quantitatively analyzes the effects of climate change and human factors on the spatial and temporal distribution pattern of NDVI. It supports alpine grassland use and grazing, ecological restoration, and management.

Author Contributions

Conceptualization, Y.L. and J.G.; methodology, Y.L.; software, Y.L.; validation, Y.L.; formal analysis, Y.L.; investigation, Y.L., J.G., Y.Z. and B.G.; data curation, Y.L.; writing—original draft preparation, Y.L.; writing—review and editing, Y.L. and J.G.; visualization, Y.L.; project administration, J.G.; funding acquisition, J.G. All authors have read and agreed to the published version of the manuscript.

Funding

This research was funded by the Second Tibetan Plateau Scientific Expedition and Research (Grant No. 2019QZKK0603).

Data Availability Statement

Not applicable.

Conflicts of Interest

The authors declare no conflict of interest.

References

  1. Li, J.J.; Peng, S.Z.; Li, Z. Detecting and attributing vegetation changes on China’s Loess Plateau. Agric. For. Meteorol. 2017, 247, 260–270. [Google Scholar] [CrossRef]
  2. Lou, J.P.; Xu, G.Y.; Wang, Z.J.; Yang, Z.G.; Ni, S.C. Multi-year NDVI values as indicator of the relationship between spatiotemporal vegetation dynamics and environmental factors in the Qaidam Basin, China. Remote Sens. 2021, 13, 1240. [Google Scholar] [CrossRef]
  3. Parmesan, C.; Yohe, G. A globally coherent fingerprint of climate change impacts across natural systems. Nature 2003, 421, 37–42. [Google Scholar] [CrossRef] [PubMed]
  4. Wang, X.L.; Zhang, G.H. Vegetation pattern formation in seminal systems due to internal competition reaction between plants. J. Theor. Biol. 2018, 458, 10–14. [Google Scholar] [CrossRef] [PubMed]
  5. Zhang, X.L.; Huang, X.R. Human disturbance caused stronger influences on global vegetation change than climate change. PeerJ 2019, 25, e7763. [Google Scholar] [CrossRef]
  6. Hao, L.; Pan, C.; Fang, D.; Zhang, X.Y.; Zhou, D.C.; Liu, P.L.; Liu, Y.Q.; Sun, G. Quantifying the effects of overgrazing on mountainous watershed vegetation dynamics under a changing climate. Sci. Total Environ. 2018, 639, 1408–1420. [Google Scholar] [CrossRef]
  7. Adepoju, K.; Adelabu, S.; Fashae, O. Vegetation response to recent trends in climate and land-use dynamics in a typical humid and dry tropical region under Global Change. Adv. Meteorol. 2019, 2019, 1–15. [Google Scholar] [CrossRef] [Green Version]
  8. Wang, Y.; Peng, D.L.; Shen, M.G.; Xu, X.Y.; Yang, X.H.; Huang, W.J.; Yu, L.; Liu, L.Y.; Li, X.W.; Zheng, S.J.; et al. Contrasting effects of temperature and precipitation on vegetation greenness along elevation gradients of the Tibetan Plateau. Remote Sens. 2020, 12, 2751. [Google Scholar] [CrossRef]
  9. Li, D.; Luo, H.Y.; Hu, T.S.; Shao, D.G.; Cui, Y.L.; Khan, S.; Luo, Y.F. Identification of the roles of climate factors; engineering construction; and agricultural practices in vegetation dynamics in the Lhasa River Basin, Tibetan Plateau. Remote Sens. 2020, 12, 1883. [Google Scholar] [CrossRef]
  10. Pang, G.J.; Wang, X.J.; Yang, M.X. Using the NDVI to identify variations in and responses of vegetation to climate change on the Tibetan Plateau from 1982 to 2012. Quat. Int. 2017, 444, 87–96. [Google Scholar] [CrossRef]
  11. Moradi, H.; Attar, F.; Oldeland, J. Plant functional type approach for a functional interpretation of altitudinal vegetation zones in the Alborz Mts., Iran. J. Mt. Sci. 2017, 14, 2257–2269. [Google Scholar] [CrossRef]
  12. Wan, Z.J.; Wang, C.J.; Qu, H.; Liu, R.; Zhang, X.Z. Vulnerability of forest vegetation to anthropogenic climate change in China. Sci. Total Environ. 2018, 621, 1633–1641. [Google Scholar] [CrossRef]
  13. John, R.; Chen, J.Q.; Kim, Y.W.; Ou-yang, Z.T.; Xiao, J.F.; Park, H.Q.; Shao, C.L.; Zhang, Y.Q.; Amarjargal, A.; Batkhshig, C. Differentiating anthropogenic modification and precipitation-driven change on vegetation productivity on the Mongolian Plateau. Landsc. Ecol. 2016, 31, 547–566. [Google Scholar] [CrossRef]
  14. Sun, W.C.; Wang, Y.Y.; Fu, Y.S.; Xue, B.L.; Wang, G.Q.; Yu, J.S.; Zuo, D.P.; Xu, Z.X. Spatial heterogeneity of changes in vegetation growth and their driving forces based on satellite observations of the Yarlung Zangbo River Basin in the Tibetan Plateau. J. Hydrol. 2019, 574, 324–332. [Google Scholar] [CrossRef]
  15. Li, S.S.; Yang, S.N.; Liu, X.F.; Liu, Y.X.; Shi, M.M. NDVI-Based analysis on the influence of climate change and human activities on vegetation restoration in the Shaanxi-Gansu-Ningxia region; Central China. Remote Sens. 2015, 7, 11163–11182. [Google Scholar] [CrossRef] [Green Version]
  16. Yang, J.; Wan, Z.Q.; Borjign, S.; Zhang, D.; Yan, Y.L.; Chen, Y.L.; Gu, R.; Gao, Q.Z. Changing trends of NDVI and their responses to climatic variation in different types of grassland in Inner Mongolia from 1982 to 2011. Sustainability 2019, 11, 3256. [Google Scholar] [CrossRef] [Green Version]
  17. Wang, J.; Meng, J.J.; Cai, Y.L. Assessing vegetation dynamics impacted by climate change in the southwestern karst region of China with AVHRR NDVI and AVHRR NPP time-series. Environ. Geol. 2008, 54, 1185–1195. [Google Scholar] [CrossRef]
  18. Mao, D.H.; Wang, Z.M.; Luo, L.; Ren, C.Y. Integrating AVHRR and MODIS data to monitor NDVI changes and their relationships with climatic parameters in Northeast China. Int. J. Appl. Earth Obs. Geoinf. 2012, 18, 528–536. [Google Scholar] [CrossRef]
  19. Sun, Y.L.; Yang, Y.L.; Zhang, Y.; Wang, Z.L. Assessing vegetation dynamics and their relationships with climatic variability in northern China. Phys. Chem. Earth 2015, 87, 79–86. [Google Scholar] [CrossRef]
  20. Pan, N.Q.; Feng, X.M.; Fu, B.J.; Wang, S.; Ji, F.; Pan, S.F. Increasing global vegetation browning hidden in overall vegetation greening: Insights from time- varying trends. Remote Sens. Environ. 2018, 214, 59–72. [Google Scholar] [CrossRef]
  21. Wang, L.; Qiu, Y.N.; Han, Z.Y.; Xu, C.; Wu, S.Y.; Wang, Y.; Holmgren, M.; Xu, Z.W. Climate; topography and anthropogenic effects on desert greening: A 40-year satellite monitoring in the Tengger Desert, northern China. Catena 2022, 209, 105851. [Google Scholar] [CrossRef]
  22. Ding, M.J.; Zhang, Y.L.; Liu, L.S.; Zhang, W.; Wang, Z.F.; Bai, W.Q. The relationship between NDVI and precipitation on the Tibetan Plateau. J. Geog. Sci. 2007, 17, 259–268. [Google Scholar] [CrossRef]
  23. Chen, J.H.; Yan, F.; Lu, Q. Spatiotemporal variation of vegetation on the Qinghai-Tibet Plateau and the influence of climatic factors and human activities on vegetation trend (2000–2019). Remote Sens. 2020, 12, 3150. [Google Scholar] [CrossRef]
  24. Zhong, L.; Ma, Y.M.; Salama, S.; Su, Z.B. Assessment of vegetation dynamics and their response to variations in precipitation and temperature in the Tibetan Plateau. Clim. Change 2010, 103, 519–535. [Google Scholar] [CrossRef]
  25. Shrestha, U.B.; Gautam, S.; Bawa, S.K. Widespread climate change in the Himalayas and associated changes in local ecosystems. PLoS ONE 2012, 7, 36741. [Google Scholar] [CrossRef] [Green Version]
  26. Piao, S.L.; Cui, M.D.; Chen, A.P.; Wang, X.H.; Ciais, P.; Liu, J.; Tang, Y.H. Altitude and temperature dependence of change in the spring vegetation green-up date from 1982 to 2006 in the Qinghai-Xizang Plateau. Agric. For. Meteorol. 2011, 151, 1599–1608. [Google Scholar] [CrossRef]
  27. Liu, X.F.; Zhang, J.S.; Zhu, X.F.; Pan, Y.Z.; Liu, Y.X.; Zhang, D.H.; Lin, Z.H. Spatiotemporal changes in vegetation cover and its driving factors in the Three-River Headwaters Region during 2000–2011. J. Geogr. Sci. 2014, 24, 288–302. [Google Scholar] [CrossRef]
  28. Hua, T.; Wang, X.M. Temporal and spatial variations in the climate controls of vegetation dynamics on the Tibetan Plateau during 1982–2011. Adv. Atmos. Sci. 2018, 35, 1337–1346. [Google Scholar] [CrossRef]
  29. Fassnacht, F.E.; Schiller, C.; Kattenborn, T.; Zhao, X.Q.; Qu, J.P. A Landsat-based vegetation trend product of the Tibetan Plateau for the time-period 1990–2018. Sci. Data 2019, 6, 78. [Google Scholar] [CrossRef]
  30. Sun, J.; Qin, X.J. Precipitation and temperature regulate the seasonal changes of NDVI across the Tibetan Plateau. Environ. Earth Sci. 2016, 75, 291. [Google Scholar] [CrossRef]
  31. Jiang, Y.; Wang, P.; Xu, X.D.; Zhang, J.H. Dynamics of carbon fluxes with responses to vegetation, meteorological and terrain factors in the south-eastern Tibetan Plateau. Environ. Earth Sci. 2014, 72, 4551–4565. [Google Scholar] [CrossRef]
  32. Liu, L.B.; Wang, Y.; Wang, Z.; Li, D.L.; Zhang, Y.T.; Qin, D.H.; Li, S.C. Elevation-dependent decline in vegetation greening rate driven by increasing dryness based on three satellite NDVI datasets on the Tibetan Plateau. Ecol. Indic. 2019, 107, 105569. [Google Scholar] [CrossRef]
  33. Peng, D.L.; Zhou, B.; Li, C.J.; Huang, W.J.; Wu, Y.P.; Yang, X.H. Phenological characteristics of the main vegetation types on the Tibetan Plateau based on vegetation and water indices. IOP Conf. Ser. Earth Environ. Sci. 2014, 17, 012077. [Google Scholar] [CrossRef] [Green Version]
  34. Duan, H.C.; Xue, X.; Wang, T.; Kang, W.P.; Liao, J.; Liu, S.L. Spatial and temporal differences in alpine meadow, alpine steppe and all vegetation of the Qinghai-Tibetan Plateau and their responses to Climate Change. Remote Sens. 2021, 13, 669. [Google Scholar] [CrossRef]
  35. Cai, H.Y.; Yang, X.H.; Xu, X.L. Human-induced grassland degradation/restoration in the central Tibetan Plateau: The effects of ecological protection and restoration projects. Ecol. Eng. 2015, 83, 112–119. [Google Scholar] [CrossRef]
  36. Gillespie, T.W.; Madson, A.; Cusack, C.F.; Xue, Y.K. Changes in NDVI and human population in protected areas on the Tibetan Plateau. Arct. Antarct. Alp. Res. 2019, 51, 428–439. [Google Scholar] [CrossRef] [Green Version]
  37. Li, L.H.; Zhang, Y.L.; Liu, L.S.; Wu, J.S.; Wang, Z.F.; Li, S.C.; Zhang, H.M.; Zu, J.X.; Ding, M.J.; Paudel, B. Spatiotemporal patterns of vegetation greenness change and associated climatic and anthropogenic drivers on the Tibetan Plateau during 2000–2015. Remote Sens. 2018, 10, 1525. [Google Scholar] [CrossRef] [Green Version]
  38. Bai, Y.F.; Guo, C.C.; Degen, A.; Ahmad, A.A.; Wang, W.Y.; Zhang, T.; Li, W.Y.; Ma, L. Climate warming benefits alpine vegetation growth in Three-River Headwater Region, China. Sci. Total Environ. 2020, 742, 140574. [Google Scholar] [CrossRef]
  39. Li, P.L.; Hu, Z.M.; Liu, Y.W. Shift in the trend of browning in Southwestern Tibetan plateau in the past two decades. Agric. For. Meteorol. 2020, 287, 107950. [Google Scholar] [CrossRef]
  40. Ran, Q.W.; Hao, Y.B.; Xia, A.Q.; Liu, W.J.; Hu, R.H.; Cui, X.Y.; Xue, K.; Song, X.N.; Xu, C.; Ding, B.Y.; et al. Quantitative assessment of the impact of physical and anthropogenic factors on vegetation spatial-temporal variation in Northern Tibet. Remote Sens. 2019, 11, 1183. [Google Scholar] [CrossRef] [Green Version]
  41. Cao, J.; Adamowski, J.F.; Deo, R.C.; Xu, X.; Gong, Y.; Feng, Q. Grassland degradation on the Qinghai-Tibetan plateau: Reevaluation of causative factors. Rangel. Ecol. Manag. 2019, 72, 988–995. [Google Scholar] [CrossRef]
  42. Fang, Y.P.; Qin, D.H.; Ding, Y.J.; Yang, J.P.; Xu, K.Y. The impacts of permafrost change on NPP and implications: A case of the source regions of Yangtze and Yellow Rivers. J. Mt. Sci. 2011, 8, 437–447. [Google Scholar] [CrossRef]
  43. Guo, N.; Li, Y.H.; Han, L.Y.; Yang, S.P. The effects of climate change on different types of grassland in Maqu county in northeast Tibetan Plateau. In Proceedings of the 2012 IEEE International Geoscience and Remote Sensing Symposium, Munich, Germany, 22 July 2012; pp. 1139–1142. [Google Scholar] [CrossRef]
  44. Li, C.J.; Fu, B.J.; Wang, S.; Stringer, L.C.; Wang, Y.P.; Li, Z.D.; Liu, Y.X.; Zhou, W.X. Drivers and impacts of changes in China’s drylands. Nat. Rev. Earth Environ. 2021, 2, 858–873. [Google Scholar] [CrossRef]
  45. Sun, J.; Liu, M.; Fu, B.J.; Kemp, D.; Zhao, W.W.; Liu, G.H.; Han, G.D.; Wilkes, A.; Lu, X.Y.; Chen, C.Y.; et al. Reconsidering the efficiency of grazing exclusion using fences on the Tibetan Plateau. Sci. Bull. 2020, 65, 1405–1414. [Google Scholar] [CrossRef]
  46. Sun, J.; Fu, B.J.; Zhao, W.W.; Liu, L.S.; Liu, G.H.; Zhou, H.K.; Shao, X.Q.; Chen, Y.C.; Zhang, Y.; Deng, Y.F. Optimizing grazing exclusion practices to achieve Goal 15 of the sustainable development goals in the Tibetan Plateau. Sci. Bull. 2021, 66, 1493–1496. [Google Scholar] [CrossRef]
  47. Li, Y.; Jin, T.T.; Gao, B.L.; Zhang, Y.X.; Gong, J. Spatiotemporal variation of climate and its potential productivity in the SW Tibet Plateau during 1901 to 2017. J. Nat. Resour. 2022, 37, 1–17. [Google Scholar] [CrossRef]
  48. Sun, H.L.; Zheng, D.; Yao, T.D.; Zhang, Y.L. Protection and construction of the national ecological security shelter zone on Tibetan Plateau. Acta Geogr. Sin. 2012, 67, 3–12. [Google Scholar] [CrossRef]
  49. Li, Y.; Dai, R.; Zhang, Y.X.; Gong, J. Spatiotemporal variation of vegetation NDVI and its relationship with altitude gradient in Southwest Tibet Plateau. Res. Soil and Water Conserv. 2021, 29, 215–222. [Google Scholar] [CrossRef]
  50. Hu, Y.F.; Dao, R.N.; Hu, Y. Vegetation change and driving factors: Contribution analysis in the Loess Plateau of China during 2000–2015. Sustainability 2019, 11, 1320. [Google Scholar] [CrossRef] [Green Version]
  51. Cong, N.; Shen, M.G.; Yang, W.; Yang, Z.Y.; Zhang, G.X.; Piao, S.L. Varying responses of vegetation activity to climate changes on the Tibetan Plateau grassland. Int. J. Biometeorol. 2017, 61, 1433–1444. [Google Scholar] [CrossRef]
  52. Zhang, Y.; Liang, S.; Xiao, Z. Observed vegetation greening and its relationships with cropland changes and climate in China. Land 2020, 9, 274. [Google Scholar] [CrossRef]
  53. Peng, S.Z.; Ding, Y.X.; Liu, W.Z.; Li, Z. 1 km monthly temperature and precipitation dataset for China from 1901 to 2017. Earth Syst. Sci. Data 2019, 11, 1931–1946. [Google Scholar] [CrossRef] [Green Version]
  54. Meng, M.; Huang, N.; Wu, M.Q.; Pei, J.; Wang, J.; Niu, Z. Vegetation change in response to climate factors and human activities on the Mongolian Plateau. PeerJ 2019, 7, e7735. [Google Scholar] [CrossRef] [PubMed]
  55. He, D.; Huang, X.L.; Tian, Q.J.; Zhang, Z.C. Changes in vegetation growth dynamics and relations with climate in Inner Mongolia under more strict multiple pre-processing (2000-2018). Sustainability 2020, 12, 2534. [Google Scholar] [CrossRef] [Green Version]
  56. Luo, N.; Mao, D.; Wen, B.; Liu, X. Climate change effected vegetation dynamics in the Northern Xinjiang of China: Evaluation by SPEI and NDVI. Land 2020, 9, 90. [Google Scholar] [CrossRef] [Green Version]
  57. Zhang, B.; Zhou, W. Spatial-temporal characteristics of precipitation and its relationship with Land Use/Cover Change on the Qinghai-Tibet Plateau, China. Land 2021, 10, 269. [Google Scholar] [CrossRef]
  58. Duo, W.; Ni, X.N.; Jing, D.Y.; Li, S.H. Spatial-temporal patterns of vegetation dynamics and their relationships to climate variations in Qinghai Lake Basin using MODIS time-series data. J. Geogr. Sci. 2014, 24, 1009–1021. [Google Scholar] [CrossRef]
  59. Sun, Y.L.; Yang, Y.L.; Zhang, L.; Wang, Z.L. The relative roles of climate variations and human activities in vegetation change in North China. Phys. Chem. Earth 2015, 87, 67–78. [Google Scholar] [CrossRef]
  60. Li, R.H.; Li, X.B.; Li, G.Q.; Wen, W.Y. Simulation of soil nitrogen storage of the typical steppe with the DNDC model: A case study in Inner Mongolia, China. Ecol. Indic. 2014, 41, 155–164. [Google Scholar] [CrossRef]
  61. Ji, G.; Song, H.; Wei, H.; Wu, L. Attribution analysis of climate and anthropic factors on runoff and vegetation changes in the Source Area of the Yangtze River from 1982 to 2016. Land 2021, 10, 612. [Google Scholar] [CrossRef]
  62. Ma, C.H.; Xie, Y.W.; Duan, H.M.; Wang, X.Y.; Bie, Q.; Guo, Z.C.; He, L.; Qin, W.H. Spatial quantification method of grassland utilization intensity on the Qinghai-Tibetan Plateau: A case study on the Selinco basin. J. Environ. Manag. 2022, 302, 114073. [Google Scholar] [CrossRef] [PubMed]
  63. Yu, L.; Zhou, L.; Liu, W.; Zhou, H.K. Using remote sensing and GIS technologies to estimate grass yield and livestock carrying capacity of alpine grasslands in Golog Prefecture, China. Pedosphere 2010, 20, 342–351. [Google Scholar] [CrossRef]
  64. Cai, S.H.; Song, X.N.; Hu, R.H.; Guo, D. Ecosystem-dependent responses of vegetation cover on the Tibetan Plateau to climate factors and their lag periods. ISPRS Int. J. Geo-Inf. 2021, 10, 394. [Google Scholar] [CrossRef]
  65. Zhang, Y.L.; Qi, W.; Zhou, C.P.; Ding, M.J.; Liu, L.S.; Gao, J.G.; Bai, W.Q.; Wang, Z.F.; Zheng, D. Spatial and temporal variability in the net primary production of alpine grassland on the Tibetan Plateau since 1982. J. Geogr. Sci. 2014, 24, 269–287. [Google Scholar] [CrossRef]
  66. Shen, M.G.; Piao, S.L.; Jeong, S.J.; Zhou, L.M.; Zeng, Z.Z.; Ciais, P.; Chen, D.; Huang, M.; Jin, C.S.; Li, L. Evaporative cooling over the Tibetan plateau induced by vegetation growth. Proc. Natl. Acad. Sci. USA 2015, 112, 9299–9304. [Google Scholar] [CrossRef] [Green Version]
  67. Ganjurjav, H.; Gao, Q.Z.; Gornish, E.S.; Schwartz, M.W.; Liang, Y.; Cao, X.J.; Zhang, E.N.; Zhang, Y.; Li, W.H.; Wan, Y.F. Differential response of alpine steppe and alpine meadow to climate warming in the central Qinghai-Tibetan Plateau. Agric. For. Meteorol. 2016, 223, 233–240. [Google Scholar] [CrossRef] [Green Version]
  68. Huang, J.P.; Ji, M.X.; Xie, Y.K.; Wang, S.S.; He, Y.L.; Ran, J.J. Global semi-arid climate change over last 60 years. Clim. Dyn. 2016, 46, 1131–1150. [Google Scholar] [CrossRef] [Green Version]
  69. Zhang, L.; Guo, H.D.; Ji, L.; Lei, L.P.; Wang, C.Z.; Yan, D.M.; Li, B.; Li, J. Vegetation greenness trend (2000 to 2009) and the climate controls in the Qinghai-Tibetan Plateau. J. Appl. Remote Sens. 2013, 7, 073572. [Google Scholar] [CrossRef]
  70. Yan, Y.; Lu, X. Is grazing exclusion effective in restoring vegetation in degraded alpine grasslands in Tibet, China? PeerJ 2015, 3, e1020. [Google Scholar] [CrossRef] [Green Version]
  71. Chen, B.X.; Zhang, X.Z.; Tao, J.; Wu, J.S.; Wang, J.S.; Shi, P.L.; Zhang, Y.J.; Yu, C.Q. The impact of climate change and anthropogenic activities on alpine grassland over the Qinghai-Tibet Plateau. Agric. For. Meteorol. 2014, 189–190, 11–18. [Google Scholar] [CrossRef]
  72. Xu, Z.R.; Wei, Z.Q.; Jin, M.M. Causes of domestic livestock-wild herbivore conflicts in the alpine ecosystem of the Chang Tang Plateau. Environ. Dev. 2020, 34, 100945. [Google Scholar] [CrossRef]
Figure 1. Location of the study area of the SWTP.
Land 11 00975 g001
Figure 2. The spatial distribution of the NDVI (a) and areal proportion (b) in the average growing season from 2000 to 2020.
Land 11 00975 g002
Figure 3. The variation of the NDVI in the SWTP.
Land 11 00975 g003
Figure 4. NDVI variation trend (a) and significance test (b) in the SWTP from 2000 to 2020.
Land 11 00975 g004
Figure 5. Interannual variation and correlation of NDVI with mean temperature (a) and precipitation (b) in the SWTP from 2000 to 2020.
Land 11 00975 g005
Figure 6. Correlation between NDVI and annual mean temperature (a) and precipitation (b) in the growing season of the SWTP from 2000 to 2020.
Land 11 00975 g006
Figure 7. Spatial distribution of human activities on the vegetation change (a) and area proportion (b) in the SWTP from 2000 to 2020.
Land 11 00975 g007
Figure 8. Interannual variation of the year-end livestock number (a) and grazing intensity (b) in the SWTP from 2000 to 2020.
Land 11 00975 g008
Figure 9. Spatial distribution of the year-end livestock number (a), grazing intensity (b), correlation coefficient between grazing intensity and the residual NDVI (c), and their significance (d) at pixel scale in the SWTP from 2000 to 2020.
Land 11 00975 g009
Table 1. Sources of the fundamental data used.
DatasetTime and Spatial ScaleSource of Data
NDVI2000–2020, 250 mMOD13Q1, Google Earth Engine
(https://earthengine.google.com/
(accessed on 10 December 2021))
Climate dataset2000–2020, 1kmNational Earth System Science Data Center, National Science & Technology
Infrastructure of China [53]
Statistical data2000–2020Statistics Bureau of Rikaze and Ngari Prefecture
Publisher’s Note: MDPI stays neutral with regard to jurisdictional claims in published maps and institutional affiliations.

