Article

Application of Infrared Spectroscopy Techniques for Identification of Ancient Vegetation and Soil Change on Loess Areas

Institute of Soil Science, Plant Nutrition and Environmental Protection, Wroclaw University of Environmental and Life Sciences, Grunwaldzka 53 St., 50-375 Wroclaw, Poland
*
Author to whom correspondence should be addressed.
Land 2022, 11(8), 1294; https://doi.org/10.3390/land11081294
Submission received: 29 June 2022 / Revised: 28 July 2022 / Accepted: 9 August 2022 / Published: 11 August 2022
(This article belongs to the Special Issue Land Use in Archaeology)

Abstract

:
The discussion on the formation of Chernozems still has no consensus, and one of the outstanding questions is the type of the vegetation that supported the persistence of these soils in Central Europe over the Holocene period. The transformation of Chernozems and related soil types may be clarified by paleoenvironmental studies, which integrate different investigation techniques and proxy data. We propose a procedure based on infrared reflectance spectroscopy of soil organic matter, that presumably contains specific fingerprints from land use and plant cover. A database of spectra for 337 samples representing vegetation classes (grassland, woodland and arable) and loess soil types (Chernozem, Phaeozem, Luvisol) was created to build a mathematical model, which allows to identify the origin of buried soils with unknown history. The comparison confirmed the applicability of both near-infrared and mid-infrared spectroscopy, with higher statistical affinity of MIR. A clear disjunction of land use/vegetation classes was proven and allowed reliable association of the samples from buried soils with grassland/woodland and episodes of arable land use, followed by prevailing forest vegetation after burial. The findings are consistent with proposed models in Poland and Czechia, and confirm the potential of spectroscopy techniques in identification of soil types and their evolution.

1. Introduction

Chernozems are described as the most fertile soils developed from loess and characterized by the presence of a thick, black humus horizon and secondary carbonates [1,2,3]. They are located typically in continental climate zones and under steppe vegetation, which promotes the development of their characteristic features [4]. Such conditions prevail in the Eurasian Chernozem Belt, mostly situated in the territory of Russia, Ukraine, Moldova, and Hungary, although small areas of Chernozems are also known in central and western Europe [5,6,7]. Presently, European Chernozems are mostly arable soils due to their particularly high productivity [8,9,10,11], and only minor areas of these soils are still maintained in the form of pastures or woodland, consisting mainly of oak and oak-hornbeam [12,13,14,15]. The presence of Chernozems in the temperate humid climate zone of Central Europe generates a discussion about the formation and further evolution of these soils [16]. The original concepts presumed the presence of Central European Chernozems in areas where steppe vegetation persisted the longest during the Holocene period [17]. These concepts considered the succession of deciduous forests as the main factor leading to degradation of Chernozems [18,19]. Some researchers related the development of Chernozems with large-scale forest burning in the Neolithic period and accumulation of black carbon in topsoil horizons [6]. Presently, the most common concepts assume Chernozems development in Central Europe under open-canopy broadleaf forests or in an open woodland-grassland landscape created in the course of anthropogenic activity during the Neolithic [12,20,21]. Studies focused on the origin and transformation of soils in relation to covering vegetation, may also offer useful proxy information for the identification of agricultural practices, what has large importance for archeological reconstructions of ancient human activity and its impact on the environment [22,23]. Typically, reconstructions of environmental conditions of Chernozem development and existence are based on analyses of vegetation residues, such as pollen grains, phytoliths and charcoal particles preserved in soil [24]. However, the high biological activity in Chernozems may result in a decomposition of pollen grains [17,21]. Phytoliths are more resistant for biological decomposition, but relating the phytolith morphotypes to botanical taxa remains a challenge, therefore the reliability of the conclusions is severely reduced [25].
A new research possibility was achieved with the development of spectroscopic techniques based on libraries which allows for the prediction of some of soil properties [26,27]. Those models’ functionality is based on techniques such as multiple regression statistics or machine learning [28]. The performance of those models relies on creating database calibrated with certain properties and applying it on samples with unknown parameters. Related techniques are presently used in the area of environmental reconstructions [29,30,31]. One of the recently proposed and still developing approaches is the use of spectroscopy in order to determine the evolution of soils in relation to the environment. The main subject of these analyses is soil organic matter (SOM), inherited from the above-ground vegetation and soil organisms after their transformation, including humification [29]. The concept exploits an assumption that SOM contains specific fingerprints originating from past vegetation that persisted for a long time [32], and thus differentiates the organic matter developed under various vegetation and environmental conditions. For a detailed insight into SOM composition, relatively rapid and non-destructive spectroscopic techniques can be applied [33,34] as complementary or substitutive to chemical fractionation [35,36]. The first attempts allowed for successful discrimination between various types of organic matter in similar soils, that may suggest different vegetation cover [31]. Particularly for Chernozems, the models for vegetation reconstruction in the context of pedogenic processes, based on spectroscopic methods, have already been published [23,30]. Preliminary studies applied only the near-infrared (NIR) spectra and explored the paleoenvironmental history of buried Chernozems based on two referenced vegetation groups: woodland and grassland. Later approaches extended the analyzed spectrum range, tested the usefulness of mid-infrared (MIR) spectroscopy and have added a third group of arable land spectra [30]. Although many reports are available that support the applicability of NIR or MIR techniques in soil studies, neither of these methods is developed and validated enough to be clearly considered as an international standard [37].
The aim of this study was to compare the applicability of two spectral ranges: MIR (4000–525 cm−1) and NIR (10000–4000 cm−1) for the identification of soil organic matter origin, in modern and buried chernozemic and related soils developed from loess. We suppose that the identification of organic matter origin in the subsequent horizons of soils buried beneath prehistoric barrows may reveal the circumstances of past soil cover formation, including changes in vegetation, as well as possible ancient agricultural practices. The study of SOM origins in the mound-forming material may give new insights into environmental conditions that prevailed after the construction of the barrows.

2. Materials and Methods
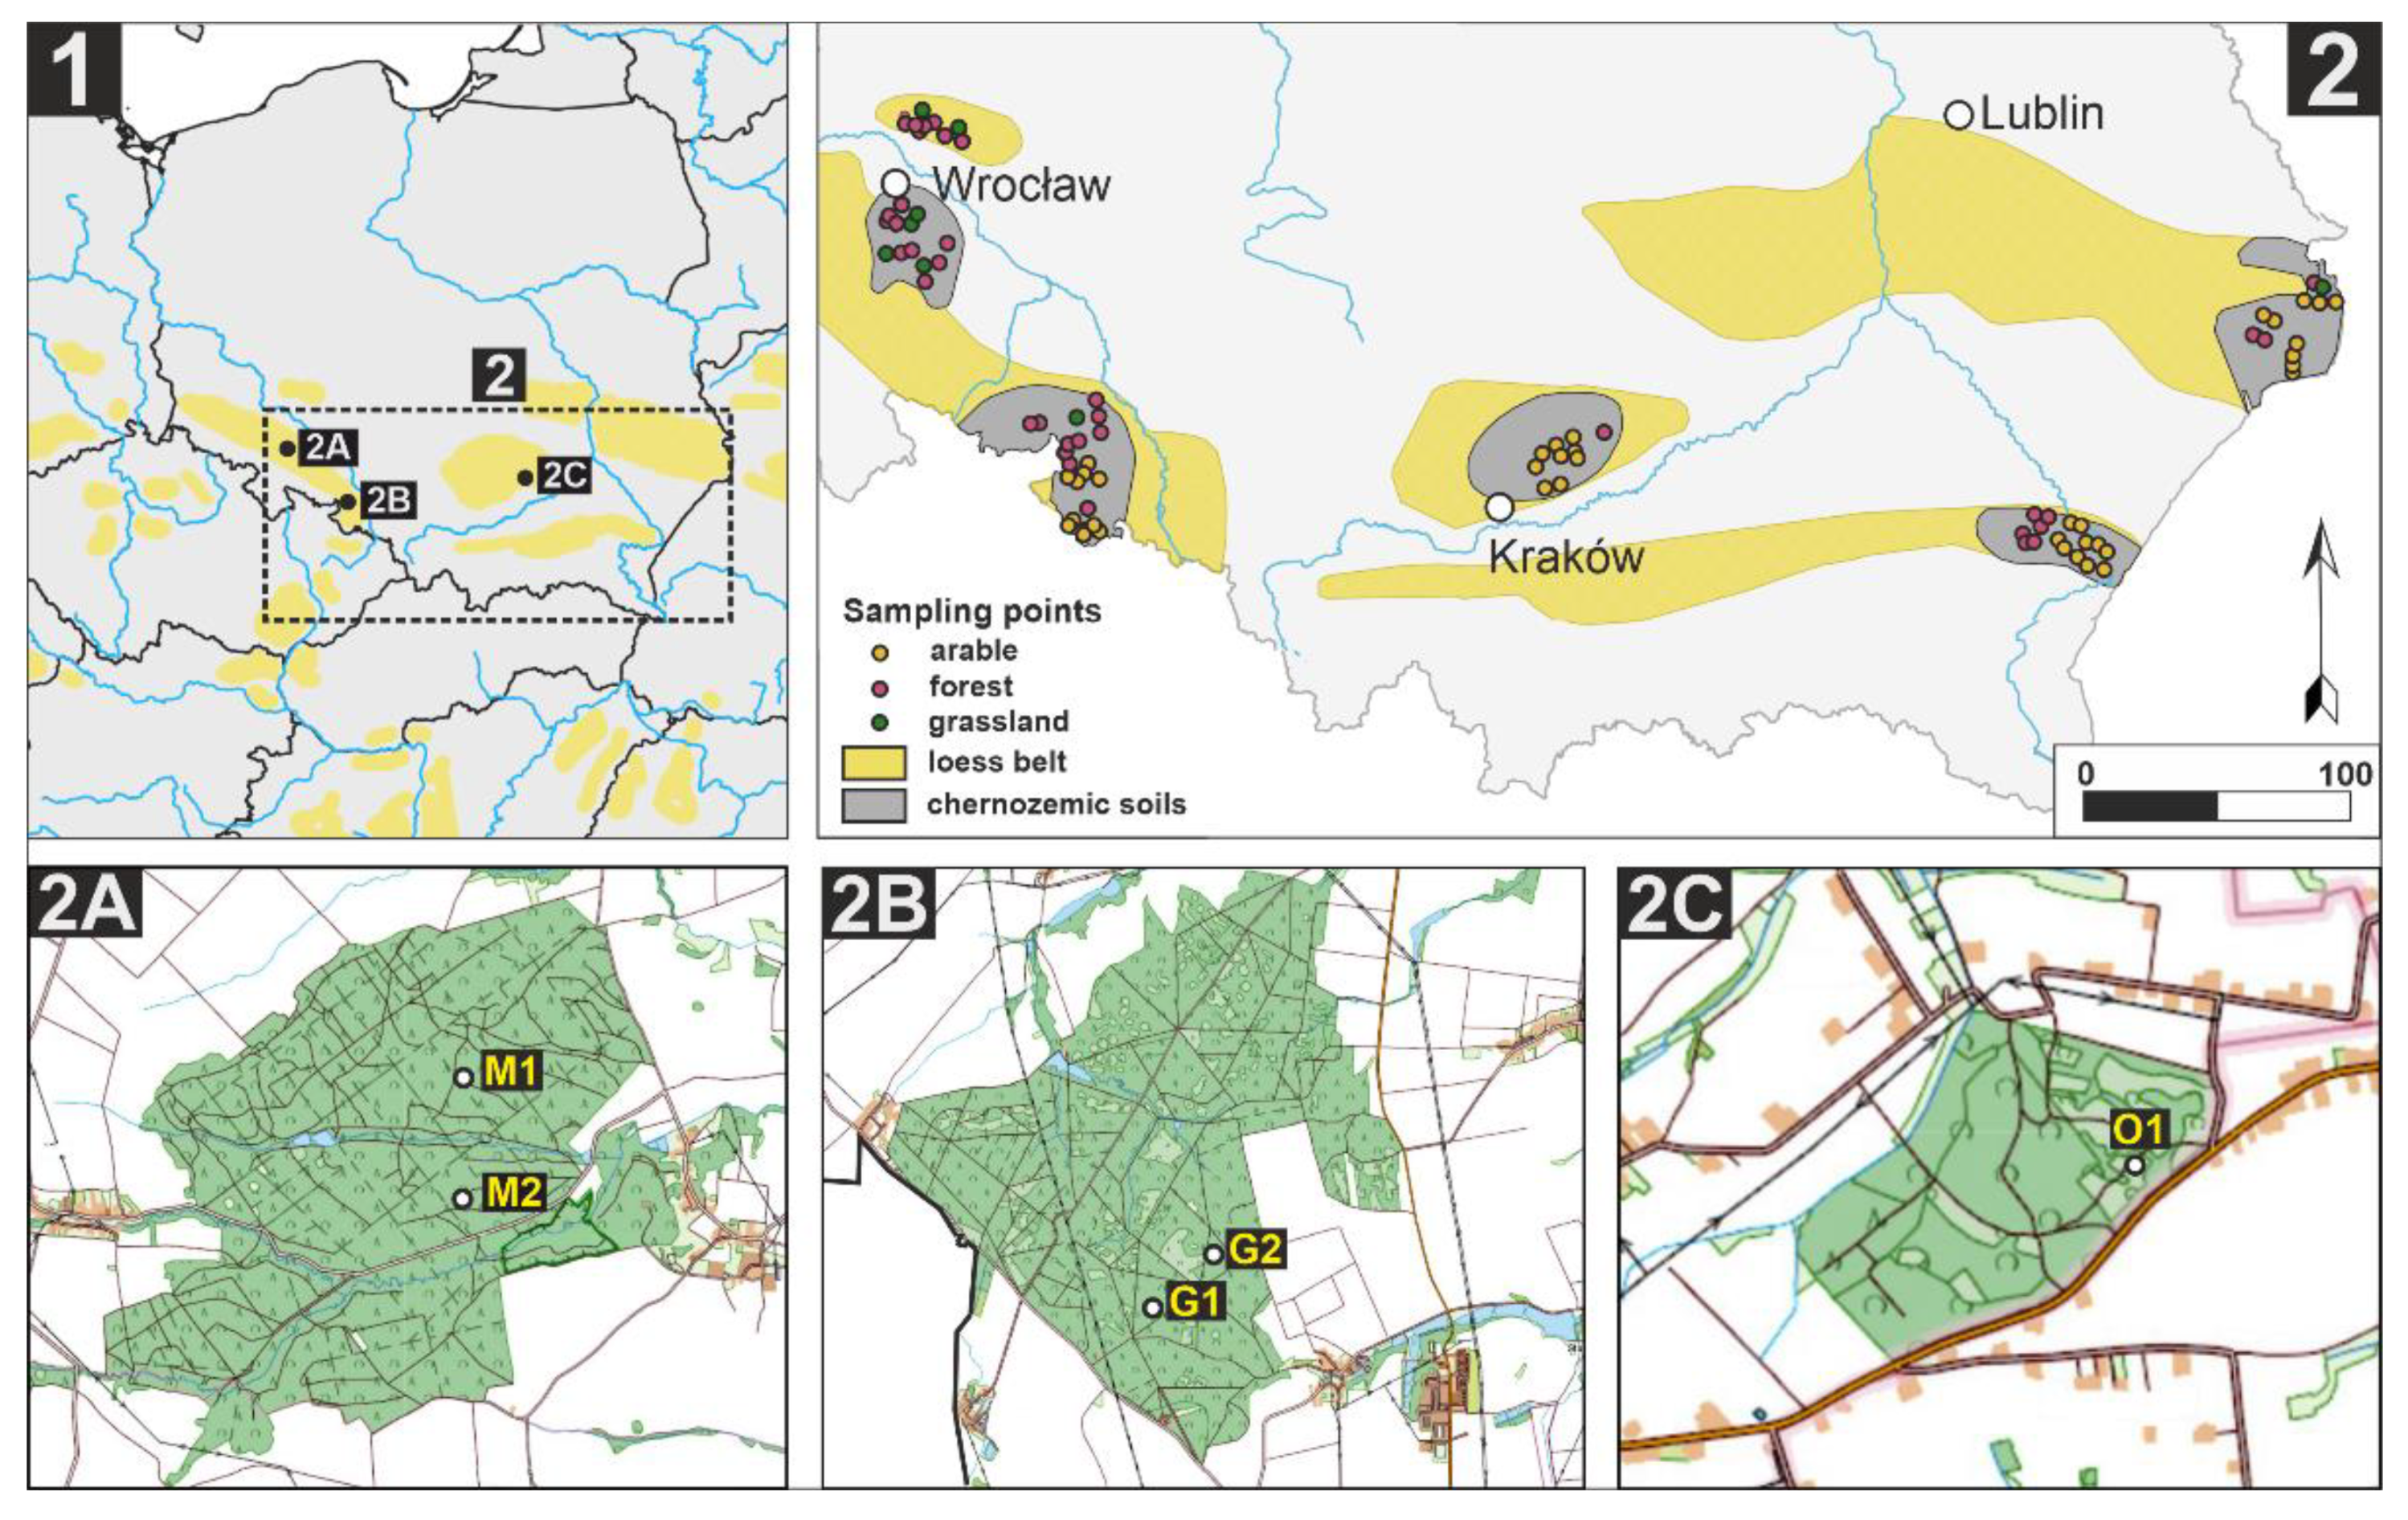
2.1. Soil Sampling

To ensure a proper identification of SOM origins in buried soils by NIR/MIR techniques, a library of spectral data for topsoil samples of modern (surface) soils with known land use and known source of soil organic matter was created. The soils buried under the studied Neolithic barrows preserved the morphological and physicochemical features of Chernozems/Phaeozems [38] developed from loess, so the investigation was concentrated in areas where surface Chernozems/Phaeozems occur, within the loess belt in southern Poland (Figure 1). The objective of the sampling conducted in years 2019–2021 was to collect a large quantity of topsoil samples in three types of the present-day land use/vegetation, including grasslands, forests, and arable lands. The sampling areas were located in the Wrocław Plain (south-west Poland), the Miechów Upland (south-central Poland), the Przemyśl Foothills and the Hrubieszów Basin (south-east Poland) (Figure 1). The loess belt area in south Poland is characterized by temperate humid climate, with a mean annual precipitation of 500–780 mm, increasing from the east towards the west [39]. Due to leaching, some of the forest soils in areas dominated by chernozemic soils lost their chernozemic characteristics (in particular, their topsoil is too light-colored to meet the criteria for chernic/mollic horizons), thus samples of afforested Luvisols [38] developed from loess were also included in the database, if they retained a humus-rich topsoil horizon.
An important part of the sampling process was to ensure that the present vegetation occupied the studied area for a sufficiently long time. Therefore, the stability of land management during the last century was verified at the sites selected for sampling using historical topographic maps (Messtischblatt 1905–1944 on a scale of 1:25,000 and 1:10,000). This step allowed obtaining an accurate collection of samples with a strong signal from organic matter derived from presently identified plant cover [40,41]. The surface soil sampling focused on mineral topsoil layers, where soil has the closest relation to plant remains derived from the current vegetation. Samples were collected from the depth of 0–10 cm in 10–15 points at each sampling site. Typical cultivated species in arable sampled lands were wheat (Triticum aestivum L.), barley (Hordeum vulgare L.), corn (Zea mays L.) and potato (Solanum tuberosum L.). The multispecies grassland vegetation consisted mainly of meadow foxtail (Alopecurus pratensis), Kentucky bluegrass (Poa pratensis L.), perennial ryegrass (Lolium multiflorum Lam.), meadow fescue (Festuca pratensis Huds.), field brome grass (Bromus arvensis L.), and spikelets soft grass (Holcus mollis L.). Forest vegetation in the sampling sites was limited to deciduous species with a domination of oak (Quercus robur L.), beech (Fagus sylvatica L.) and hornbeam (Carpinus betulus L.).
Beneath the barrows selected for this study buried soils were present, with thick, dark horizons (mollic or chernic), thus classified as Chernozems or Phaeozems, depending on the presence and depth of the layer enriched with secondary carbonates. Barrows M1 and M2, located in the Muszkowice Forest in SW Poland (Figure 1(2A)), are associated with the Late Neolithic Funnel Beaker culture (ca 3500 years BC) [21]. Barrows G1 and G2 located in the Głubczyce Forest (SW Poland) (Figure 1(2B)) [20] along with kurgan O1 in Ostrów in south central Poland (Figure 1(2C)) are also dated to the Funnel Beaker culture (4th millennium BC). Samples for analyses were taken from the humus horizons of buried soils. In some cases (barrows M1, G1, G2 and O1) samples were also collected from the mound horizons, with the exception of the uppermost eluvial layers. These mounds were built using ancient topsoil gathered (heaped) from the immediate vicinity, thus may provide additional information about land use/vegetation at the time of the barrow construction and in subsequent time periods [21].

2.2. Sample Preparation and Statistical Analysis

In total, 337 topsoil samples of arable, forest and grassland soils were included in the database and used to develop the statistical model which consist of 164 samples from forest, 38 samples from grassland and 135 samples from arable location. From the buried soils, 26 samples were collected. After air drying, samples were crushed to pass a 2 mm mesh. Particle size distribution was determined using sieve and hydrometer method. Soil pH was measured in water suspension at a ratio 1:5 (v/v) using Mettler Toledo SevenMulti pH-meter (Greifensee, Switzerland). Calcium carbonate content (as a CaCO3 equivalent) was estimated by gravimetric method with Scheibler apparatus [42,43]. The content of soil organic carbon (SOC) was measured using dry-combustion method with CS-MAT analyzer (Ströhlein, Kaarst, Germany) after carbonate removal with 10% HCl solution [44].
For the spectral analyses, all samples were additionally ground and dried at 37 °C for one day, to avoid interference signals from variable soil moisture. Scanning of samples was performed in two spectral ranges: mid-infrared (MIR) and near-infrared (NIR). MIR spectra were recorded in the spectral range 4000–400 cm−1 with a Nicolet iZ10 FT-IR spectrometer (Thermo Fisher Scientific, Waltham, MA, USA). For the NIR analysis, samples were scanned in the spectral range 10000–4000 cm−1 with Cary 5000 UV-Vis-NIR spectrophotometer (Agilent, Santa Clara, CA, USA). The resolution of recorded spectra was 2 cm−1 in case of MIR and 4 cm−1 for NIR. It allowed to create a data matrix with 1800 and 1500 columns for MIR and NIR spectral ranges, respectively. The number of variables (columns) in the databases was reduced down to 359 and 376 columns for MIR and NIR, respectively. The process of database reduction assumed rejecting every n-th column, until their number has been reduced to the level comparable with the number of cases (rows). This pretreatment was necessary for Canonical Variate Analysis (CVA), which requires the number of variables to be similar or lower than the number of samples [23,41].

2.3. Preparing the Reference Library of MIR/NIR Samples

The obtained MIR and NIR datasets required preprocessing before application of statistical analysis. Mathematical pretreatment was carried out using Unscrambler 10.4 software (CAMO Software, Oslo, Norway) in order to increase the differentiation between analyzed groups [30]. All spectra were treated with standard normal variation procedure (SNV) to standardize data (zero mean, variance = 1) and to reduce the influence of soil variables, such as particle size distribution or SOC content. Then, to maximize the amount of available information and to enhance discrimination between groups of samples, the derivative operation was applied on datasets. For both sets of data the 1st and 2nd derivative order was applied, based on recommendations from other authors [31,41]. Finally, the transformed spectra were processed by Canonical Variate Analysis (CVA) using the Systat 13.2 (Cranes Software, Chicago, IL, USA), separately in MIR and NIR datasets. It resulted in a transformation of multi-variable spectra into single values of canonical scores. Additionally, it enabled to allocate samples into groups/classes based on the scores calculated from the multiple variables recorded in MIR and NIR spectra. The disjunctions between classes were determined based on Mahalanobis distance, which is often used to determine the distance between discriminated groups [45]. Moreover, after the application of CVA analysis, the transformed MIR and NIR datasets were statistically described by coefficient of variation parameter (CV) (Table 2). Coefficient of variation was calculated as standard deviation of datasets, divided by its mean values and expressed as percentage [46].

3. Results and Discussion

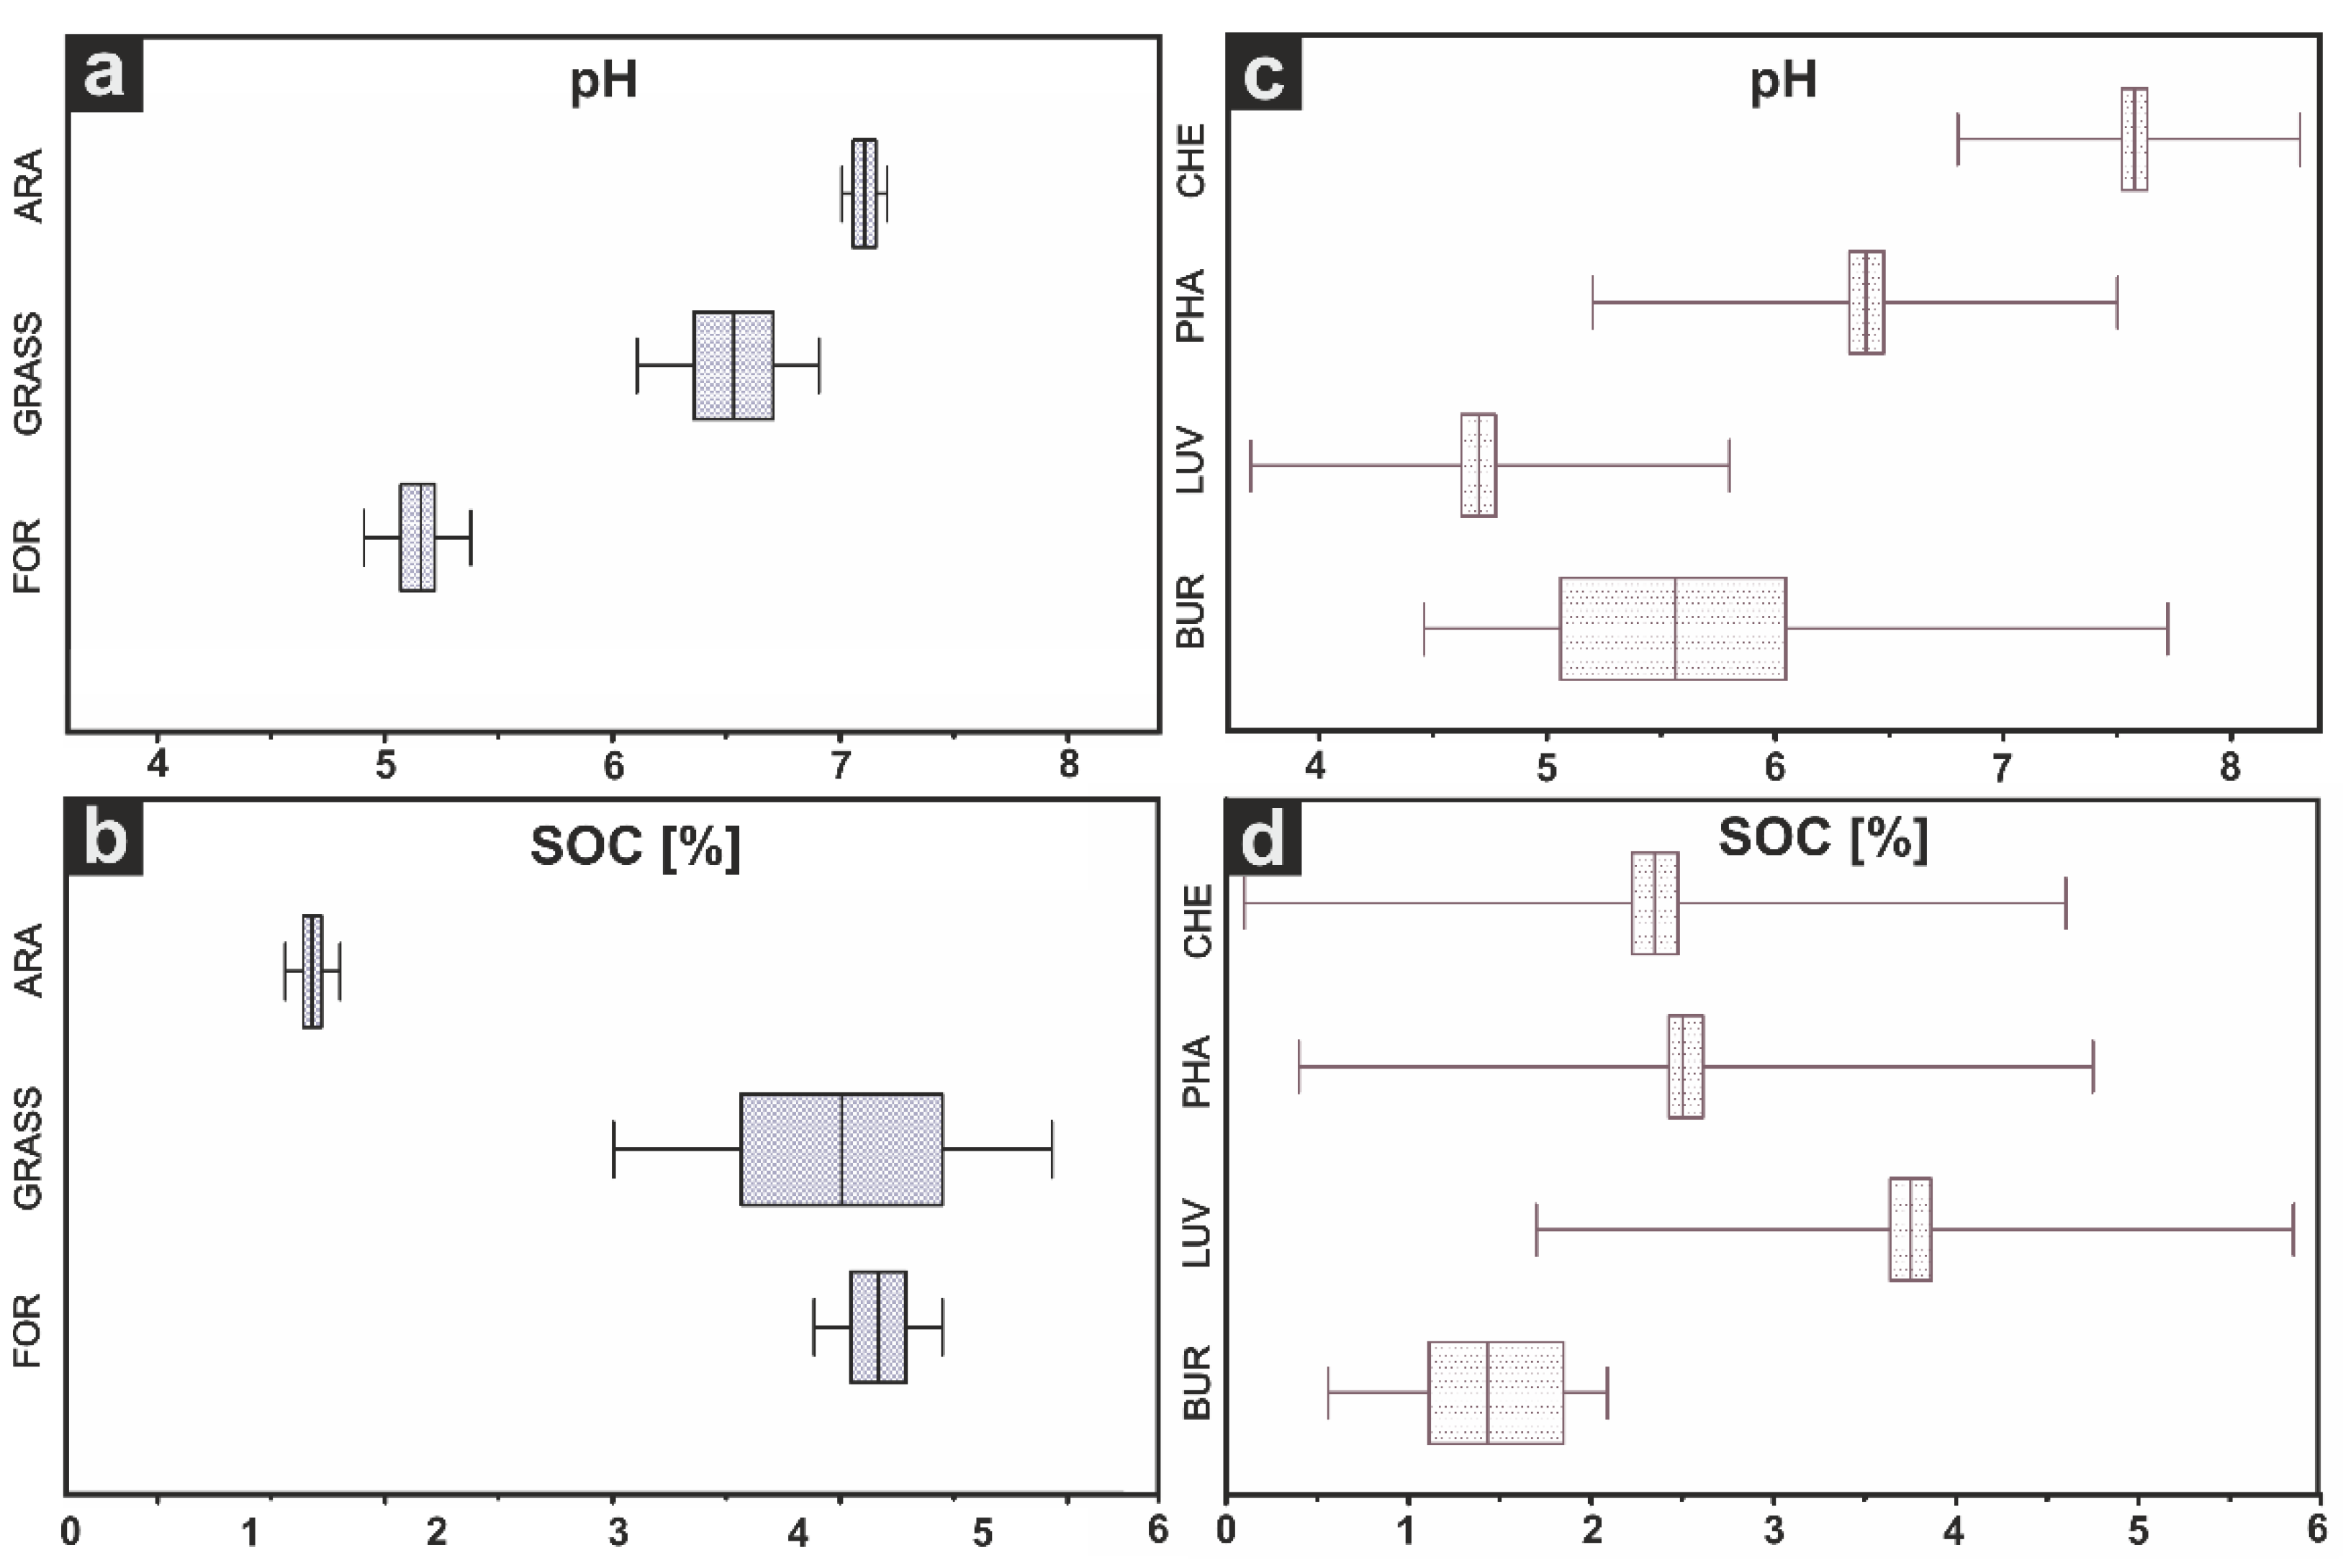
3.1. Standard Soil Properties

The basics soil parameters were measured in samples according to land use and soil type. The lowest pH of topsoil layers was identified in the forest soils (mean 5.1), while the highest in arable soils (mean 7.1) (Figure 2a). In turn, the SOC content was significantly lower in arable soils (mean 1.4%) than in forest and grassland soils (mean 4.2–4.3%) (Figure 2b). Considering soil types, the highest pH values were recorded for Chernozems with mean value 7.5, while the most acidic conditions occurred in Luvisols (mean 4.7). Chernozems and Phaeozems contained on average 2.4–2.5% of SOC, while Luvisols had considerably higher SOC content with mean value of 3.8%. The findings of other authors confirm similar trends in arable and forest chernozemic soils in south-east Poland [14,47]. The pH of the buried soils fell between the pH reported for modern Luvisols and Phaeozems (Figure 2c) and was close to topsoil pH of the modern forest soils. SOC content in the buried soils was significantly lower than in other soil types (Chernozem, Phaeozem and Luvisol) (Figure 2d); however, it was similar to SOC content in arable soils (Figure 2b).

3.2. Mahalanobis Distances for NIR and MIR Spectral Range

Figure 3 illustrates clearly higher scores of Mahalanobis distances for samples with different land use in MIR spectral range (Figure 3a,b) in comparison to NIR (Figure 3c,d) for respective derivates. Mahalanobis distances for examined samples of the CVA analysis on MIR and NIR spectra are summarized in Table 1. Comparing the values of Mahalanobis distance for MIR spectra between the 1st and 2nd derivative, it can be noticed that, in general, higher values were obtained after application of the 2nd derivative (up to 59.2 for canonical score 1 and 35.9 for canonical score 2), whereas for the 1st derivative the Mahalanobis distance did not exceed 25.7 for canonical score 1 and 25.1 for canonical score 2. The same dataset analysed in NIR range revealed remarkably lower distances that did not exceed 9.4–13.1, depending on the applied 1st or 2nd derivative. Those observations suggest that under the same conditions and with identical treatment, the NIR range seems to be less accurate to classify samples into groups, based on the land use that greatly influences the kind of SOM. Studies of other authors on NIR datasets provide similar values of Mahalanobis distances [23,29,41]. Using a methodology similar to applied in this paper (standardization and 1st derivative), Strouhalova obtained the Mahalanobis distances around 9.4 [29] and 17.5 [23] in the grassland and forest Chernozems, respectively, and she did not record significant differences after data transformation to the 2nd derivative. Ertlen [27], in turn, for more heterogeneous forest and meadow soils obtained a Mahalanobis distance around 12.2 for the NIR dataset. Considering these results, the MIR range seems to be more suitable, in mathematical terms, for the discrimination of samples based on land use.
Discrimination of samples using CVA statistics was also conducted according to the reference soil groups (Phaeozem, Chernozem, Luvisol) (Table 1, Figure 4). This is new approach implemented in recent peloenvironmental reconstructions based on spectral libraries [30]. In case of MIR, the highest values of Mahalanobis distances were obtained for Chernozems-Luvisols classes, up to 49.2 for the 2nd derivative and 19.4 for the 1st derivative. The discrimination between examined groups was not that clear in case of the NIR range, as the distances between sample groups according to the soil type did not exceed 11.0–12.2, although the results were higher for the 2nd derivative order. Considering these findings and remembering that high Mahalanobis distance is essential for reliable sample differentiation, the second derivative order provides better disjunction of classes for both spectral ranges. However, it is worth mentioning that for the MIR range also the 1st derivative provides good disjunction between sample groups. The other authors [23,29] preferred the 1st derivative for NIR spectra, but as shown in Figure 3 and Figure 4, the differences between the 1st and 2nd derivative for NIR are much smaller than those for MIR. Summarizing the results for soil types, the obtained data indicate, in mathematical terms, an overall advantage of MIR spectra over NIR.

3.3. Coefficient of Variation for NIR and MIR Spectral Range

In addition to the aforementioned distances between the groups of examined samples, the dispersion of the samples within the groups may be another important parameter that potentially influences the reliability of discrimination. Coefficient of variation (CV) is a statistic used to show the variability of results [48]. In general, high values of CV indicate large variability within the sample group [49,50]. Overall, the CV values for NIR are remarkably higher, compared with MIR for respective derivates (Table 2). For the NIR 1st derivative the values were up to 774% and for the 2nd derivative up to 369%. This indicates a particularly high dispersion of samples around their mean values, which may adversely affect the efficiency of the model in determining the past vegetation in samples of unknown origin. On the contrary, low values of CV were recorded for the MIR spectral range, particularly in case of the 2nd derivative, where the values did not exceed 20%. Although in some cases the 1st derivative MIR has better performance than the second one (e.g., canonical score 1 for arable land or canonical score 2 for Chernozems), the general tendency is in favor of the 2nd derivative order, where most of the CV values were lower than their 1st derivative counterparts, indicating less dispersion of the samples.

3.4. Selection of Recommended Analytical Approach

Considering the parameters mentioned above, it can be noticed that all of the proposed treatments allowed to distinguish clear groups of samples, both for soil type and land use. However, the most suitable variants seem to be MIR 2nd and 1st derivatives, because of the highest Mahalanobis distances between obtained classes of land use and soil types, what permits clearer disjunction of examined samples. A similar conclusion can be drawn considering the coefficient of variation, where the lowest values and thus the lowest variability of results were observed in the mentioned variants which were MIR 2nd and 1st derivatives. However, there is difficulty in a clear indication which MIR derivative order should be recommended as a standard approach—the majority of results confirm the advantage of the 2nd derivative order, but in some cases the 1st derivative had better performance. Due to the lack of clarity which derivative order is preferable as a standard, we followed the suggestions of other authors [23,29,41] that the best discrimination of samples may be obtained after application of the 1st derivative, and we choose this variant for further conclusions.

3.5. Land Use of Buried Soils

Consequently, the discrimination of samples from buried soils with unknown origin of organic matter was performed with the MIR dataset and application of the 1st derivative order. The analysis allowed to plot these samples on a workspace, with groups clustered according to land use (Figure 3) and soil type (Figure 4). For a clear presentation of data and in order to avoid overlapped results on the graphs, the canonical scores were presented in Table 3. Following the CVA analysis, it seems that most of the buried soils have grassland or arable origin. Malacological analyses performed on buried Chernozems indicate steppe vegetation as a main type of environment for Chernozems [51]. The deepest layers of buried humus horizons have signals of arable vegetation (G1, M1 and O1) or grassland (G2). The only signal from forest vegetation was recorded in profile M2, however it was allocated between forest-grassland groups. On the other hand, the upper layers of all the buried topsoils have mostly clear signals from either grassland or arable vegetation, although in some cases the signal was beyond the space of prediction and there was no possibility to assign the sample unequivocally to any of the three classes (O1). Moreover, the analysis allowed to identify vegetation types for some layers of the barrow mounds covering the buried soils. In the majority of cases these samples reproduced the signals from the buried parts of the profiles and indicated grassland vegetation (G1, G2 and O1), forest vegetation (in the upper layers of barrow mound G1) or the samples were beyond the space of prediction to draw any conclusions (data not included). The presence of forest vegetation in close distance to kurgans might have influence on their physical and chemical properties what is also reflected on spectral images [52,53]. The obtained results are consistent with the recently proposed models of Chernozem development in Poland and Czechia [20,21] and evidence of landscape ‘openness’ during the Neolithic period in Central Europe [54,55,56,57,58]. Theories concerning the origins and development of Chernozems assumed that they are generally associated with grassland or mixed grassland-woodland types of vegetation [59]. The proposed model was refined by expanding the Chernozem database with samples collected from arable soils [30], since prehistoric cultivation can also be expected in buried chernozemic soils [58] and tillage may provide different organic matter. Furthermore, of particular interest is that all investigated buried soils show an episode of cultivation, recorded typically ‘above’ the grassland stage. Recent findings suggest that in SW Poland, the formation of chernozemic soils may have started in the early Holocene and past human activity (from the Neolithic onwards) played an important role in enabling their patchy preservation until the present-day [20,21]. Although, investigation of these anthropogenic treatments and determination of their role in preservation of Chernozems or their transformation into other types of soil is still not fully explained [60,61]. Our evidence of agricultural practices in the buried soils requires further corroboration; however, the fragments of charcoal found in the Ab horizon beneath the Neolithic barrow in Muszkowice (here: M2) link with vegetation clearance practices for agricultural purposes [21].

3.6. Identified Type of Buried Soils

Moreover, it was suggested in other study to supplement the interpretation of soil transformation by identifying the most probable soil type (Chernozem, Phaeozem or Luvisol) [33]. However, for soil types, the CVA analysis was not as precise as it was for land use, and some soil horizons were difficult to include in any class (Table 3). In general, the deepest buried horizons tended to have indications typical of Chernozems or Phaeozems, or the signal was derived from both of them (G1, G2, M2 and O1). This also corresponds with grassland or arable type of land use. The signal of grasslands derived from steppe vegetation is considered as typical in case of Chernozems as a main factor of their origin [62]. Moreover, the possibility of Chernozems transformation into Phaeozems or Luvisols during Holocene period was considered by some authors [6,14,63]. The upper parts of buried soils in these profiles usually belonged to Phaeozems or had a mixed Phaeozems/Luvisol signal. However, in profile M1 the deepest horizons were assigned to Luvisol, with an arable land use signal, while the overlying layers had either Phaeozem or even Chernozem signals (Table 3). For the lowermost barrow mound layers, it was possible to identify signals similar to those obtained for the buried horizons: Phaeozem (G1), Phaeozem and Chernozem (G2) and Luvisol (M1). The upper horizons of the barrow mounds almost exclusively have signals characteristic for Luvisols. Presence of this type of soil is typical for forest environments, where the samples of upper parts of barrow mound were collected [64].

4. Conclusions

The concept of Chernozems origin is related to the assumption that this soil group develops under steppe vegetation while afforestation should initiate processes of their degradation. As a result, the recent reconstructions of Chernozems in pedological studies usually lead only to theoretical conclusions about their past. Only direct insight into SOM using spectroscopic techniques allowed to provide analytical results and thus confirm the applicability of this methodology in paleopedological reconstruction of past land use and vegetation cover in buried soils. A comparative analysis of data obtained from NIR and MIR spectroscopies for chernozemic soils based on Mahalanobis distances and CV approaches indicated that higher affinity of MIR spectroscopy and the 1st or 2nd derivative order of data transformation was found for sample discrimination. The analysis was successfully extended from binary (grassland/forest) to a tri-component scheme (grassland/forest/arable). The results showed that the origin of the studied Neolithic buried chernozemic soils, is mostly related to grassland or grassland/arable vegetation. Moreover, a reliable discrimination among three soil types (Chernozems, Phaeozems, and Luvisols) was obtained, which confirms a large potential of MIR and NIR spectroscopies in the non-destructive identification and classification of soils. In case of soil types, the discrimination analysis assigned the deepest horizons of buried soils to either Chernozem/Phaeozem class or in some cases to Luvisol, while the uppermost layers of the barrow mounds were almost exclusively assigned to Luvisols. Overall, spectroscopy techniques seem to be useful tools for the identification of organic matter origins in buried soils. In combination with other methods (such as archaeobotany and micromorphology) they can be applied to study ancient vegetation cover not only in pedological research, but also in archeology.

Author Contributions

All authors contributed to the development of the ideas and authoring of the paper. Conceptualization, M.D., C.K. and B.Ł.; methodology, M.D. and C.K.; software, M.D.; formal analysis, M.D., M.K. and B.Ł.; investigation, M.D. and M.K.; resources, M.D., M.K. and B.Ł.; data curation, M.D., C.K. and B.Ł.; writing—original draft preparation, M.D. and M.K.; writing—review and editing, C.K. and B.Ł.; visualization, M.D. and C.K.; supervision, C.K. and B.Ł.; project administration, M.D. and B.Ł.; funding acquisition, M.D., M.K. and B.Ł. All authors have read and agreed to the published version of the manuscript.

Funding

This work was supported by the Wrocław University of Environmental and Life Sciences (Poland) as the Ph.D. research program “Innowacyjny Doktorat”, no. N070/0007/21 and partly from the project: “Origin and transformation of chernozemic soils in Poland in relation to the climatic changes and influence of settlement and human activity since the beginning of the Neolithic period” (grant no. 2018/29/B/ST10/00610, National Science Centre of Poland). Archaeological fieldwork in the Muszkowice Forest (at site Muszkowice 18) was financed from grant no. 2017/25/B/HS3/01442 (National Science Centre of Poland) directed by Agnieszka Przybył (University of Wrocław). The archaeopedological fieldwork in the Głubczyce Forest was supported by grant no. 2020/36/C/HS3/00080 (National Science Centre of Poland) directed by Mateusz Krupski.

Data Availability Statement

All field and analytical data will be available from public repository after project finalizing and data completing.

Acknowledgments

We thank Agnieszka Przybył (University of Wrocław) and Paweł Jarosz (Polish Academy of Sciences) for the opportunity to sample the barrows at sites Muszkowice 18 and Ostrów.

Conflicts of Interest

The authors declare no conflict of interest.

References

  1. Lal, R. Managing Chernozem for Reducing Global Warming. In Regenerative Agriculture; Dent, D., Boincean, B., Eds.; Springer International Publishing: Cham, Switzerland, 2021; pp. 81–93. ISBN 978-3-030-72223-4. [Google Scholar]
  2. Pozniak, S.P.; Havrysh, N.S. Soils in the Memory of World Nations. Pol. J. Soil Sci. 2019, 52, 13. [Google Scholar] [CrossRef]
  3. Vysloužilová, B.; Ertlen, D.; Schwartz, D.; Šefrna, L. Chernozem. From Concept to Classification: A Review. AUC Geogr. 2016, 51, 85–95. [Google Scholar] [CrossRef]
  4. Altermann, M.; Rinklebe, J.; Merbach, I.; Körschens, M.; Langer, U.; Hofmann, B. Chernozem—Soil of the Year 2005. J. Plant Nutr. Soil Sci. 2005, 168, 725–740. [Google Scholar] [CrossRef]
  5. Dreibrodt, S.; Hofmann, R.; Dal Corso, M.; Bork, H.-R.; Duttmann, R.; Martini, S.; Saggau, P.; Schwark, L.; Shatilo, L.; Videiko, M.; et al. Earthworms, Darwin and Prehistoric Agriculture-Chernozem Genesis Reconsidered. Geoderma 2022, 409, 115607. [Google Scholar] [CrossRef]
  6. Eckmeier, E.; Gerlach, R.; Gehrt, E.; Schmidt, M.W.I. Pedogenesis of Chernozems in Central Europe—A Review. Geoderma 2007, 139, 288–299. [Google Scholar] [CrossRef]
  7. Kabała, C.; Charzyński, P.; Czigány, S.; Novák, T.J.; Saksa, M.; Świtoniak, M. Suitability of World Reference Base for Soil Resources (WRB) to Describe and Classify Chernozemic Soils in Central Europe. Soil Sci. Annu. 2019, 70, 244–257. [Google Scholar] [CrossRef]
  8. Kondrateva, M.A.; Chashchin, A.N. Analysis and Assessment of the Use of Chernozems of the Kungur Forest-Steppe Based on Remote Sensing Data. IOP Conf. Ser. Earth Environ. Sci. 2021, 862, 012099. [Google Scholar] [CrossRef]
  9. Bulgakov, V.; Gadzalo, I.; Adamchuk, V.; Demydenko, O.; Velichko, V.; Nowak, J.; Ivanovs, S. Dynamics of the Humus Content under Different Chernozem Treatment Conditions. J. Ecol. Eng. 2022, 23, 118–128. [Google Scholar] [CrossRef]
  10. Drewnik, M.; Żyła, M. Properties and Classification of Heavily Eroded Post-Chernozem Soils in Proszowice Plateau (Southern Poland). Soil Sci. Annu. 2019, 70, 225–233. [Google Scholar] [CrossRef]
  11. Baltruschat, H.; Santos, V.M.; da Silva, D.K.A.; Schellenberg, I.; Deubel, A.; Sieverding, E.; Oehl, F. Unexpectedly High Diversity of Arbuscular Mycorrhizal Fungi in Fertile Chernozem Croplands in Central Europe. Catena 2019, 182, 104135. [Google Scholar] [CrossRef]
  12. Vysloužilová, B.; Danková, L.; Ertlen, D.; Novák, J.; Schwartz, D.; Šefrna, L.; Delhon, C.; Berger, J.-F. Vegetation History of Chernozems in the Czech Republic. Veg. Hist. Archaeobotany 2014, 23, 97–108. [Google Scholar] [CrossRef]
  13. Lasota, J.; Błońska, E.; Łyszczarz, S.; Sadowy, A. Forest Habitats and Forest Types on Chernozems in South-Eastern Poland. Soil Sci. Annu. 2019, 70, 234–243. [Google Scholar] [CrossRef]
  14. Łabaz, B.; Kabała, C.; Waroszewski, J.; Dudek, M.; Bogacz, A.; Gruszka, D.; Młynek, S. Medium-Term Transformation of Chernozems under Broadleaf Forests in the Temperate Climate of South-East Poland. Geoderma Reg. 2022, 30, 00535. [Google Scholar] [CrossRef]
  15. Łabaz, B.; Waroszewski, J.; Dudek, M.; Bogacz, A.; Kabała, C. Persistence of Arable Chernozems and Chernic Rendzic Phaeozems in the Eroded Undulating Loess Plateau in Central Europe. Catena 2022, 216, 106417. [Google Scholar] [CrossRef]
  16. Kabała, C. Chernozem (Czarnoziem)—Soil of the Year 2019 in Poland. Origin, Classification and Use of Chernozems in Poland. Soil Sci. Annu. 2019, 70, 184–192. [Google Scholar] [CrossRef]
  17. Łabaz, B.; Musztyfaga, E.; Waroszewski, J.; Bogacz, A.; Jezierski, P.; Kabała, C. Landscape-Related Transformation and Differentiation of Chernozems—Catenary Approach in the Silesian Lowland, SW Poland. Catena 2018, 161, 63–76. [Google Scholar] [CrossRef]
  18. Messager, E.; Nomade, S.; Wilhelm, B.; Joannin, S.; Scao, V.; Von Grafenstein, U.; Martkoplishvili, I.; Ollivier, V.; Mgeladze, A.; Dumoulin, J.-P.; et al. New Pollen Evidence from Nariani (Georgia) for Delayed Postglacial Forest Expansion in the South Caucasus. Quat. Res. 2017, 87, 121–132. [Google Scholar] [CrossRef]
  19. Joannin, S.; Ali, A.A.; Ollivier, V.; Roiron, P.; Peyron, O.; Chevaux, S.; Nahapetyan, S.; Tozalakyan, P.; Karakhanyan, A.; Chataigner, C. Vegetation, Fire and Climate History of the Lesser Caucasus: A New Holocene Record from Zarishat Fen (Armenia): Paleoenvironment and Paleoclimate in Armenia. J. Quat. Sci. 2014, 29, 70–82. [Google Scholar] [CrossRef]
  20. Krupski, M.; Mackiewicz, M.; Kabała, C.; Ehlert, M.; Cendrowska, M. Earthen Mounds in the Głubczyce Forest (SW Poland)—Are They Prehistoric Long-Barrows? Geoarchaeology of the Silesian Soil Record and Human-Environment Interplay in the Holocene. Praehistorische. Z. 2021, 96, 413–433. [Google Scholar] [CrossRef]
  21. Kabała, C.; Przybył, A.; Krupski, M.; Łabaz, B.; Waroszewski, J. Origin, Age and Transformation of Chernozems in Northern Central Europe—New Data from Neolithic Earthen Barrows in SW Poland. Catena 2019, 180, 83–102. [Google Scholar] [CrossRef]
  22. Krupski, M.; Kruczkowska, B.; Kittel, P.; Jakubczak, M.; Skrzyński, G.; Golyeva, A.; Niedziółka, K.; Urbańczyk, P. Evidence of Prehistoric and Early Medieval Agriculture and Its Impact on Soil and Land Relief Transformation in the Białowieża Natural Forest (NE Poland). Geoderma 2022, 410, 115668. [Google Scholar] [CrossRef]
  23. Strouhalová, B.; Ertlen, D.; Šefrna, L.; Novák, T.J.; Virágh, K.; Schwartz, D. Assessing the Vegetation History of European Chernozems through Qualitative near Infrared Spectroscopy. Quaternaire 2019, 30, 227–241. [Google Scholar] [CrossRef]
  24. Räsänen, S.; Suutari, H.; Nielsen, A.B. A Step Further towards Quantitative Reconstruction of Past Vegetation in Fennoscandian Boreal Forests: Pollen Productivity Estimates for Six Dominant Taxa. Rev. Palaeobot. Palynol. 2007, 146, 208–220. [Google Scholar] [CrossRef]
  25. Vrydaghs, L.; Ball, T.B.; Devos, Y. Beyond Redundancy and Multiplicity. Integrating Phytolith Analysis and Micromorphology to the Study of Brussels Dark Earth. J. Archaeol. Sci. 2016, 68, 79–88. [Google Scholar] [CrossRef]
  26. Zhao, D.; Arshad, M.; Li, N.; Triantafilis, J. Predicting Soil Physical and Chemical Properties Using Vis-NIR in Australian Cotton Areas. Catena 2021, 196, 104938. [Google Scholar] [CrossRef]
  27. Zhao, D.; Zhao, X.; Khongnawang, T.; Arshad, M.; Triantafilis, J. A Vis-NIR Spectral Library to Predict Clay in Australian Cotton Growing Soil. Soil Sci. Soc. Am. J. 2018, 82, 1347–1357. [Google Scholar] [CrossRef]
  28. Zhao, D.; Arshad, M.; Wang, J.; Triantafilis, J. Soil Exchangeable Cations Estimation Using Vis-NIR Spectroscopy in Different Depths: Effects of Multiple Calibration Models and Spiking. Comput. Electron. Agric. 2021, 182, 105990. [Google Scholar] [CrossRef]
  29. Vysloužilová, B.; Ertlen, D.; Šefrna, L.; Novák, T.; Virágh, K.; Rué, M.; Campaner, A.; Dreslerová, D.; Schwartz, D. Investigation of Vegetation History of Buried Chernozem Soils Using Near-Infrared Spectroscopy (NIRS). Quat. Int. 2015, 365, 203–211. [Google Scholar] [CrossRef]
  30. Dudek, M.; Kabała, C.; Łabaz, B.; Mituła, P.; Bednik, M.; Medyńska-Juraszek, A. Mid-Infrared Spectroscopy Supports Identification of the Origin of Organic Matter in Soils. Land 2021, 10, 215. [Google Scholar] [CrossRef]
  31. Palmborg, C.; Nordgren, A. Partitioning the Variation of Microbial Measurements in Forest Soils into Heavy Metal and Substrate Quality Dependent Parts by Use of near Infrared Spectroscopy and Multivariate Statistics. Soil Biol. Biochem. 1996, 28, 711–720. [Google Scholar] [CrossRef]
  32. Ertlen, D.; Schwartz, D.; Trautmann, M.; Webster, R.; Brunet, D. Discriminating between Organic Matter in Soil from Grass and Forest by Near-Infrared Spectroscopy. Eur. J. Soil Sci. 2010, 61, 207–216. [Google Scholar] [CrossRef]
  33. Ng, W.; Minasny, B.; Jeon, S.H.; McBratney, A. Mid-Infrared Spectroscopy for Accurate Measurement of an Extensive Set of Soil Properties for Assessing Soil Functions. Soil Secur. 2022, 6, 100043. [Google Scholar] [CrossRef]
  34. Waruru, B.K.; Shepherd, K.D.; Ndegwa, G.M.; Sila, A.; Kamoni, P.T. Application of Mid-Infrared Spectroscopy for Rapid Characterization of Key Soil Properties for Engineering Land Use. Soils Found. 2015, 55, 1181–1195. [Google Scholar] [CrossRef]
  35. Dudek, M.; Łabaz, B.; Kabała, C. Comparison of Sequential Extraction Techniques and Fractional Composition of Humic Substances in Chernozems and Phaeozems of Poland—A Review. Soil Sci. Annu. 2021, 72, 132235. [Google Scholar] [CrossRef]
  36. Dudek, M.; Łabaz, B.; Bednik, M.; Medyńska-Juraszek, A. Humic Substances as Indicator of Degradation Rate of Chernozems in South-Eastern Poland. Agronomy 2022, 12, 733. [Google Scholar] [CrossRef]
  37. Zhang, Y.; Hartemink, A.E.; Huang, J. Spectral Signatures of Soil Horizons and Soil Orders—An Exploratory Study of 270 Soil Profiles. Geoderma 2021, 389, 114961. [Google Scholar] [CrossRef]
  38. IUSS Working Group WRB. World Reference Base for Soil Resources 2014, Update 2015. In International Soil Classification System for Naming Soil and Creating Legends for Soil Maps; Food and Agriculture Organization of the United Nations: Rome, Italy, 2014; ISBN 9789251083697. [Google Scholar]
  39. Blażejczyk, K. Climate and Bioclimate of Poland. In Natural and Human Environment of Poland. A geographical Overview; Degórski, M., Ed.; Polish Academy of Sciences: Warsaw, Poland, 2006; Volume 19, pp. 31–48. [Google Scholar]
  40. Huang, J.; Rinnan, Å.; Bruun, T.B.; Engedal, T.; Bruun, S. Identifying the Fingerprint of Permanganate Oxidizable Carbon as a Measure of Labile Soil Organic Carbon Using Fourier Transform Mid-infrared Photoacoustic Spectroscopy. Eur. J. Soil Sci. 2021, 72, 1831–1841. [Google Scholar] [CrossRef]
  41. Ertlen, D.; Schwartz, D.; Brunet, D.; Trendel, J.-M.; Adam, P.; Schaeffer, P. Qualitative near Infrared Spectroscopy, a New Tool to Recognize Past Vegetation Signature in Soil Organic Matter. Soil Biol. Biochem. 2015, 82, 127–134. [Google Scholar] [CrossRef]
  42. Sparks, D.L. Methods of Soil Analysis. In Chemical Methods, Part 3; Soil Science Society of America and American Society of Agronomy: Madison, WI, USA, 1996; ISBN 978-0-89118-825-4. [Google Scholar]
  43. Kobierski, M.; Kondratowicz-Maciejewska, K.; Banach-Szott, M.; Wojewódzki, P.; Peñas Castejón, J.M. Humic Substances and Aggregate Stability in Rhizospheric and Non-Rhizospheric Soil. J. Soils Sediments 2018, 18, 2777–2789. [Google Scholar] [CrossRef]
  44. Bojko, O.; Kabała, C. Loss-on-Ignition as an Estimate of Total Organic Carbon in the Mountain Soils. Pol. J. Soil Sci. 2014, 47, 71–79. [Google Scholar]
  45. De Maesschalck, R.; Jouan-Rimbaud, D.; Massart, D.L. The Mahalanobis Distance. Chemom. Intell. Lab. Syst. 2000, 50, 1–18. [Google Scholar] [CrossRef]
  46. Webster, R.; Oliver, M.A.; Webster, R. Statistical Methods in Soil and Land Resource Survey. In Spatial Information Systems; Oxford University Press: Oxford, UK; New York, NY, USA, 1990; ISBN 978-0-19-823317-6. [Google Scholar]
  47. Chodorowski, J.; Bartmiński, P.; Plak, A.; Dębicki, R. Chernozems of Lubelszczyzna (Eastern Poland). Soil Sci. Annu. 2019, 70, 258–269. [Google Scholar] [CrossRef]
  48. Cohen, J. Statistical Methods in Soil and Land Resource Survey. Technometrics 1992, 34, 497–498. [Google Scholar] [CrossRef]
  49. Leone, A.P.; Viscarra-Rossel, R.A.; Amenta, P.; Buondonno, A. Prediction of Soil Properties with PLSR and Vis-NIR Spectroscopy: Application to Mediterranean Soils from Southern Italy. Curr. Anal. Chem. 2012, 8, 283–299. [Google Scholar] [CrossRef]
  50. Viscarra, R.R.A.; Behrens, T.; Ben-Dor, E.; Brown, D.J.; Demattê, J.A.M.; Shepherd, K.D.; Shi, Z.; Stenberg, B.; Stevens, A.; Adamchuk, V.; et al. A Global Spectral Library to Characterize the World’s Soil. Earth-Sci. Rev. 2016, 155, 198–230. [Google Scholar] [CrossRef]
  51. Ložek, V. Středoevropské Bezlesí v Čase a Prostoru III. Historie Lesa a Bezlesí v Kvartéru. Ochr. Přírody 2004, 59, 71–79. [Google Scholar]
  52. Błońska, E.; Lasota, J.; Gruba, P. Effect of Temperate Forest Tree Species on Soil Dehydrogenase and Urease Activities in Relation to Other Properties of Soil Derived from Loess and Glaciofluvial Sand. Ecol. Res. 2016, 31, 655–664. [Google Scholar] [CrossRef]
  53. Błońska, E.; Kacprzyk, M.; Spólnik, A. Effect of Deadwood of Different Tree Species in Various Stages of Decomposition on Biochemical Soil Properties and Carbon Storage. Ecol. Res. 2017, 32, 193–203. [Google Scholar] [CrossRef]
  54. Baumann, W.; Fritzsche, C.; Coblenz, W.; Fiedler, H.J.; Brückner, H.P. Stratigraphische Befunde Zur Schnurkeramik in Einem Grabhügel Bei Werben. Kr. Leipz. Ausgrab. Funde 1983, 28, 1–10. [Google Scholar]
  55. Hejcman, M.; Součková, K.; Krištuf, P.; Peška, J. What Questions Can Be Answered by Chemical Analysis of Recent and Paleosols from the Bell Beaker Barrow (2500–2200 BC), Central Moravia, Czech Republic? Quat. Int. 2013, 316, 179–189. [Google Scholar] [CrossRef]
  56. Jamrichová, E.; Hédl, R.; Kolář, J.; Tóth, P.; Bobek, P.; Hajnalová, M.; Procházka, J.; Kadlec, J.; Szabó, P. Human Impact on Open Temperate Woodlands during the Middle Holocene in Central Europe. Rev. Palaeobot. Palynol. 2017, 245, 55–68. [Google Scholar] [CrossRef]
  57. Moskal-del Hoyo, M.; Mueller-Bieniek, A.; Alexandrowicz, W.P.; Wilczyński, J.; Wędzicha, S.; Kapcia, M.; Przybyła, M.M. The Continuous Persistence of Open Oak Forests in the Miechów Upland (Poland) in the Second Half of the Holocene. Quat. Int. 2017, 458, 14–27. [Google Scholar] [CrossRef]
  58. Vostrovská, I.; Bíšková, J.; Lukšíková, H.; Kočár, P.; Kočárová, R. The Environment and Subsistence of the Early Neolithic Settlement Area at Těšetice-Kyjovice, Czech Republic. Environ. Archaeol. 2019, 24, 248–262. [Google Scholar] [CrossRef]
  59. Johnson, D.L.; Schaetzl, R.J. Differing Views of Soil and Pedogenesis by Two Masters: Darwin and Dokuchaev. Geoderma 2015, 237–238, 176–189. [Google Scholar] [CrossRef]
  60. Kleber, M.; Röner, J.; Chenu, C.; Glaser, B.; Knicker, H.; Jahn, R. Prehistoric Alteration of Soil Properties in A Central German Chernozemic Soil: In Search of Pedologic Indicators for Prehistoric Activity. Soil Sci. 2003, 168, 292–306. [Google Scholar] [CrossRef]
  61. Lorz, C.; Saile, T. Anthropogenic Pedogenesis of Chernozems in Germany?—A Critical Review. Quat. Int. 2011, 243, 273–279. [Google Scholar] [CrossRef]
  62. Jeleńska, M.; Hasso-Agopsowicz, A.; Kądziałko-Hofmokl, M.; Sukhorada, A.; Bondar, K.; Matviishina, Z. Magnetic Iron Oxides Occurring in Chernozem Soil from Ukraine and Poland as Indicators of Pedogenic Processes. Stud. Geophys. Geod. 2008, 52, 255–270. [Google Scholar] [CrossRef]
  63. Gerlach, R.; Baumewerd-Schmidt, H.; van den Borg, K.; Eckmeier, E.; Schmidt, M.W.I. Prehistoric Alteration of Soil in the Lower Rhine Basin, Northwest Germany—Archaeological, 14C and Geochemical Evidence. Geoderma 2006, 136, 38–50. [Google Scholar] [CrossRef]
  64. Strouhalová, B.; Gebhardt, A.; Ertlen, D.; Šefrna, L.; Flašarová, K.; Kolařík, P.; Schwartz, D. From Chernozem to Luvisol or from Luvisol to Chernozem? A Discussion about the Relationships and Limits of the Two Types of Soils. A Case Study of the Soil Catena of Hrušov, Czechia. Geografie 2020, 125, 473–500. [Google Scholar] [CrossRef]
Figure 1. (1) Map of the study area in south Poland with: (2) sampling points of arable, grassland and forest locations, used to create the spectral database, (2A) sampled barrows in the Muszkowice Forest: M1 (site: Muszkowice 18), M2 (site: Muszkowice 45), (2B) sampled barrows in the Głubczyce Forest: G1 (site: Lwowiany 22) and G2 (site: Lwowiany 23), and (2C) the sampled barrow (O1) in Ostrów near the Proszowice Plateau (site: Ostrów 1).
Land 11 01294 g001
Figure 2. Basic properties of the soils under study sorted according to land use: (a) pH, (b) SOC, and soil type: (c) pH, (d) SOC. Boxes: standard error, central line: mean values, whiskers: standard deviation. Land use: ARA—arable, GRASS—grassland, FOR—forest. Soil type: CHE—Chernozem, PHA—Phaeozem, LUV—Luvisol, BUR—buried soils.
Land 11 01294 g002
Figure 3. Comparison of canonical scores of MIR: (a) 1st derivative, (b) 2nd derivative, and NIR (c) 1st derivative, (d) 2nd derivative. Soil management: red—arable, blue—forest, green—grassland.
Land 11 01294 g003
Figure 4. Comparison of canonical scores of MIR: (a) 1st derivative, (b) 2nd derivative, and NIR (c) 1st derivative, (d) 2nd derivative. Soil type: black—Chernozem, brown—Phaeozem, orange—Luvisol.
Land 11 01294 g004
Table 1. Mahalanobis distance for various variants of the CVA analysis.
MIR 1st
Derivative
MIR 2nd
Derivative
NIR 1st
Derivative
NIR 2nd
Derivative
Canonical ScoresScore 1Score 2Score 1Score 2Score 1Score 2Score 1Score 2
Land Use
Arable-grassland20.623.137.335.93.39.412.010.9
Arable-forest25.72.021.914.07.61.09.62.2
Forest-grassland5.125.159.221.94.59.42.413.1
Soil type
Chernozem-Phaeozem12.516.225.015.04.46.30.98.3
Chernozem-Luvisol5.919.449.25.511.03.111.36.9
Luvisol-Phaeozem18.43.224.29.56.63.212.21.4
Table 2. Coefficient of variation (CV) for land use and soil groups after CVA analysis, based on Figure 3 and Figure 4.
MIR 1st
Derivative
MIR 2nd
Derivative
NIR 1st
Derivative
NIR 2nd
Derivative
Canonical ScoresScore 1Score 2Score 1Score 2Score 1Score 2Score 1Score 2
Arable9.324315143019722369
Forest6.3376.314231952052
Grassland114.52.52.877413107.1
Chernozem216.83.712202822369
Luvisol1481242065512052
Phaeozem8.4224.7201875107.1
Table 3. Mid-infrared canonical scores for studied buried soils and barrow mound horizons, according to predicted past land use and soil type.
HorizonDepth (cm)Position in BarrowVegetation Cover Canonical ScoresSoil Type
Canonical Scores
Predicted VegetationPredicted Soil Type
Score 1Score 2Score 1Score 2
Głubczyce Forest G1
A(E)b60–70barrow mound18.07.21.316.4FOR/GRASSPHA/LUV
Ab170–80buried soil18.16.8−29.47.6FOR/GRASSLUV
Ab280–90−9.231.019.821.1GRASSPHA
Ab390–1005.838.435.05.0GRASSPHA
AB1100–110−16.749.0−48.214.6n.i.n.i.
AB2110–123−15.0−22.718.47.6ARAPHA
Głubczyce Forest G2
A110–120barrow mound16.662.0−22.516.2n.i.LUV
AB120–13415.539.120.0−7.8GRASSPHA/CHER
Ab1140–150buried soil42.426.426.927.3GRASSPHA
Ab2150–160−15.0−5.58.8−3.7ARAPHA
Ab2/Abw160–170−17.9−8.556.511.8ARAn.i.
ABw170–18012.230.764.575.8GRASSn.i.
BA180–19029.018.316.7−13.7GRASSPHA/CHER
Muszkowice Forest M1
BC52–54barrow mound31.357.6−7.46.0n.i.LUV
Ab54–75buried soil−22.4−25.3−10.1−13.7ARALUV/CHER
ABw175–842.28.99.813.2ARA/GRASSPHA
ABw284–94−17.7−5.3−8.64.7ARALUV
Muszkowice Forest M2
Abt188–100buried soil9.425.557.524.3GRASSn.i.
Abt2100–110−1.8−4.01.414.1ARAPHA/LUV
ABbt1110–1153.426.837.910.2GRASSn.i.
ABbt2115–12010.714.415.67.9GRASS/FORPHA
BAbt1120–125−40.50.79.5−6.0n.i.PHA/CHER
Ostrów O1
Ah230–45barrow mound41.038.034.950.5GRASSn.i.
Ahb150–70buried soil−36.9−14.2−64.8−10.4n.i.n.i.
Ahb270–85−25.515.148.4−48.5GRASS/ARAn.i.
ABwk85–100−27.91.9−35.3−24.1ARACHER
Canonical scores for vegetation cover are pictured in Figure 3, for soil type in Figure 4. Land use: ARA—arable, GRASS—grassland, FOR—forest, Soil types: CHER—Chernozem, PHA—Phaeozem, LUV—Luvisol, n.i.—not identified. Grey color in table—barrow mound, white color—buried soil.
Publisher’s Note: MDPI stays neutral with regard to jurisdictional claims in published maps and institutional affiliations.

