Abstract
As one of the main driving forces for the change in surface energy balance, land use and cover change affects the ecological climate through different levels of biogeochemical and physical processes. However, many studies on the surface energy balance are conducted from the perspective of biogeochemistry, ignoring biogeochemical processes. By using core methods such as the surface energy balance algorithm and Mann-Kendall trend test, we analyzed the surface energy balance mechanism and ecological climate effects of five land use types in the Huang-Huai-Hai Basin in China. The results showed that: (1) the net radiation and latent heat flux in the five land use types increased significantly, and their highest values were located in cropland areas and urban expansion areas, respectively. (2) The influence of net radiation on surface energy absorption was greater than latent heat flux. This relationship was more obvious in land use types that were greatly influenced by human activities. (3) The net surface energy intake in the Huang-Huai-Hai River Basin showed a decreasing trend and decreased with the increase in human influence intensity, indicating that human activities weakened the positive trend in net surface energy intake and increased the warming effect. This study reveals the difference in energy budgets of different land use types under the influence of human activities. It is helpful for understanding how to formulate sustainable land management strategies, and it also provides a theoretical basis for judging the climate change trends and urban heat island effects in the Huang-Huai-Hai River Basin from a biogeophysical perspective.
1. Introduction
The concentration of surface energy exchange reflects the energy link function of the coupling process between the earth and the atmosphere, which is a link in the land surface process. It is a process of surface heat balance and radiation balance, which is closely related to solar radiation, ecological changes and human activities [1,2]. These natural or man-made factors affect the energy exchange between land and atmosphere, which are reflected in the radiation process between soil, vegetation and atmosphere [2]. Surface albedo and latent heat flux both represented the radiative forcing process in the interaction between earth and air and the change of surface radiant energy [3]. They have an influence on the surface radiant energy balance [4,5]. In each component of the radiation balance, the net radiation is the key part of the surface energy balance. It is also the physical and ecological parameters that affect the process of land-atmosphere energy exchange and redistribution [6,7].
Owing to the complexity of surface energy mechanisms, other influence factors are required to reflect the effects of surface albedo and latent heat flux (LH) [8,9] when estimating surface energy revenue and expenditure processes under various land-use types or conditions, such as land use and cover changes (LUCC) and surface temperature (LST). Therefore, studying the effects of LUCC on energy balance is important for understanding the effects of human activities on climate [10,11]. In addition, LST is considered a key variable in many applications such as agriculture, hydrology, and meteorology, and is also an important parameter in the study of surface energy balance and water cycle processes [12,13,14,15].
The study of radiation balance of various types of surface cover is the basis and premise of surface energy research. The integration of remote sensing and GIS have been frequently used by many types of research, and have been identified as an indispensable tool and method for evaluating LUCC changes [7,14,16]. At present, many studies on surface energy balance have been conducted from the perspective of biogeochemistry, which ignores the biogeochemical processes [3,5,17,18]. Therefore, appropriate research into dynamic change of land use and surface energy balance can have a positive effect on the ecological climate research and formulate relevant policies [19]. By reflecting the influence of LUCC induced land-air interface process change on climate warming, it also provides an important scientific basis for human society to slow down climate warming by regulating its own land use behavior [20].
The ecological climate effect could be considered as a way that the climate influences a variety of ecological processes. These effects operate through local weather parameters such as temperature, wind, etc., as well as interactions among these. Since ecosystems may influence climate change in a variety of ways, various ecological factors may have climatic effects, such as changes in land use types and changes in surface energy [21]. In this paper, the Huang-Huai-Hai River Basin in China was taken as the study area. Based on the surface energy balance algorithm, the changes in the land energy budget caused by land use changes in various regions were quantified and the radiation factors (longwave radiation, shortwave radiation, and net radiation), latent heat flux (LH), and other related variables affecting the surface energy balance were calculated [22,23]. This study used a variety of spatial analysis methods such as spatial statistical analysis, region extraction and superposition analysis and other methods to explore the changes in the surface energy budget under various land use types in the Huang-Huai-Hai River Basin. Classical linear regression, regression tests, and Mann-Kendall trend tests were used to analyze the changes in different energy factors of different land use types from 2000 to 2015, which provided a new perspective for exploring the eco-climatic effects of land use change. The research results can be used as a guide for the study of urban temperature change and also help to understand the energy balance effects of climate change and land cover types [24,25].
2. Materials and Methods
2.1. Study Area
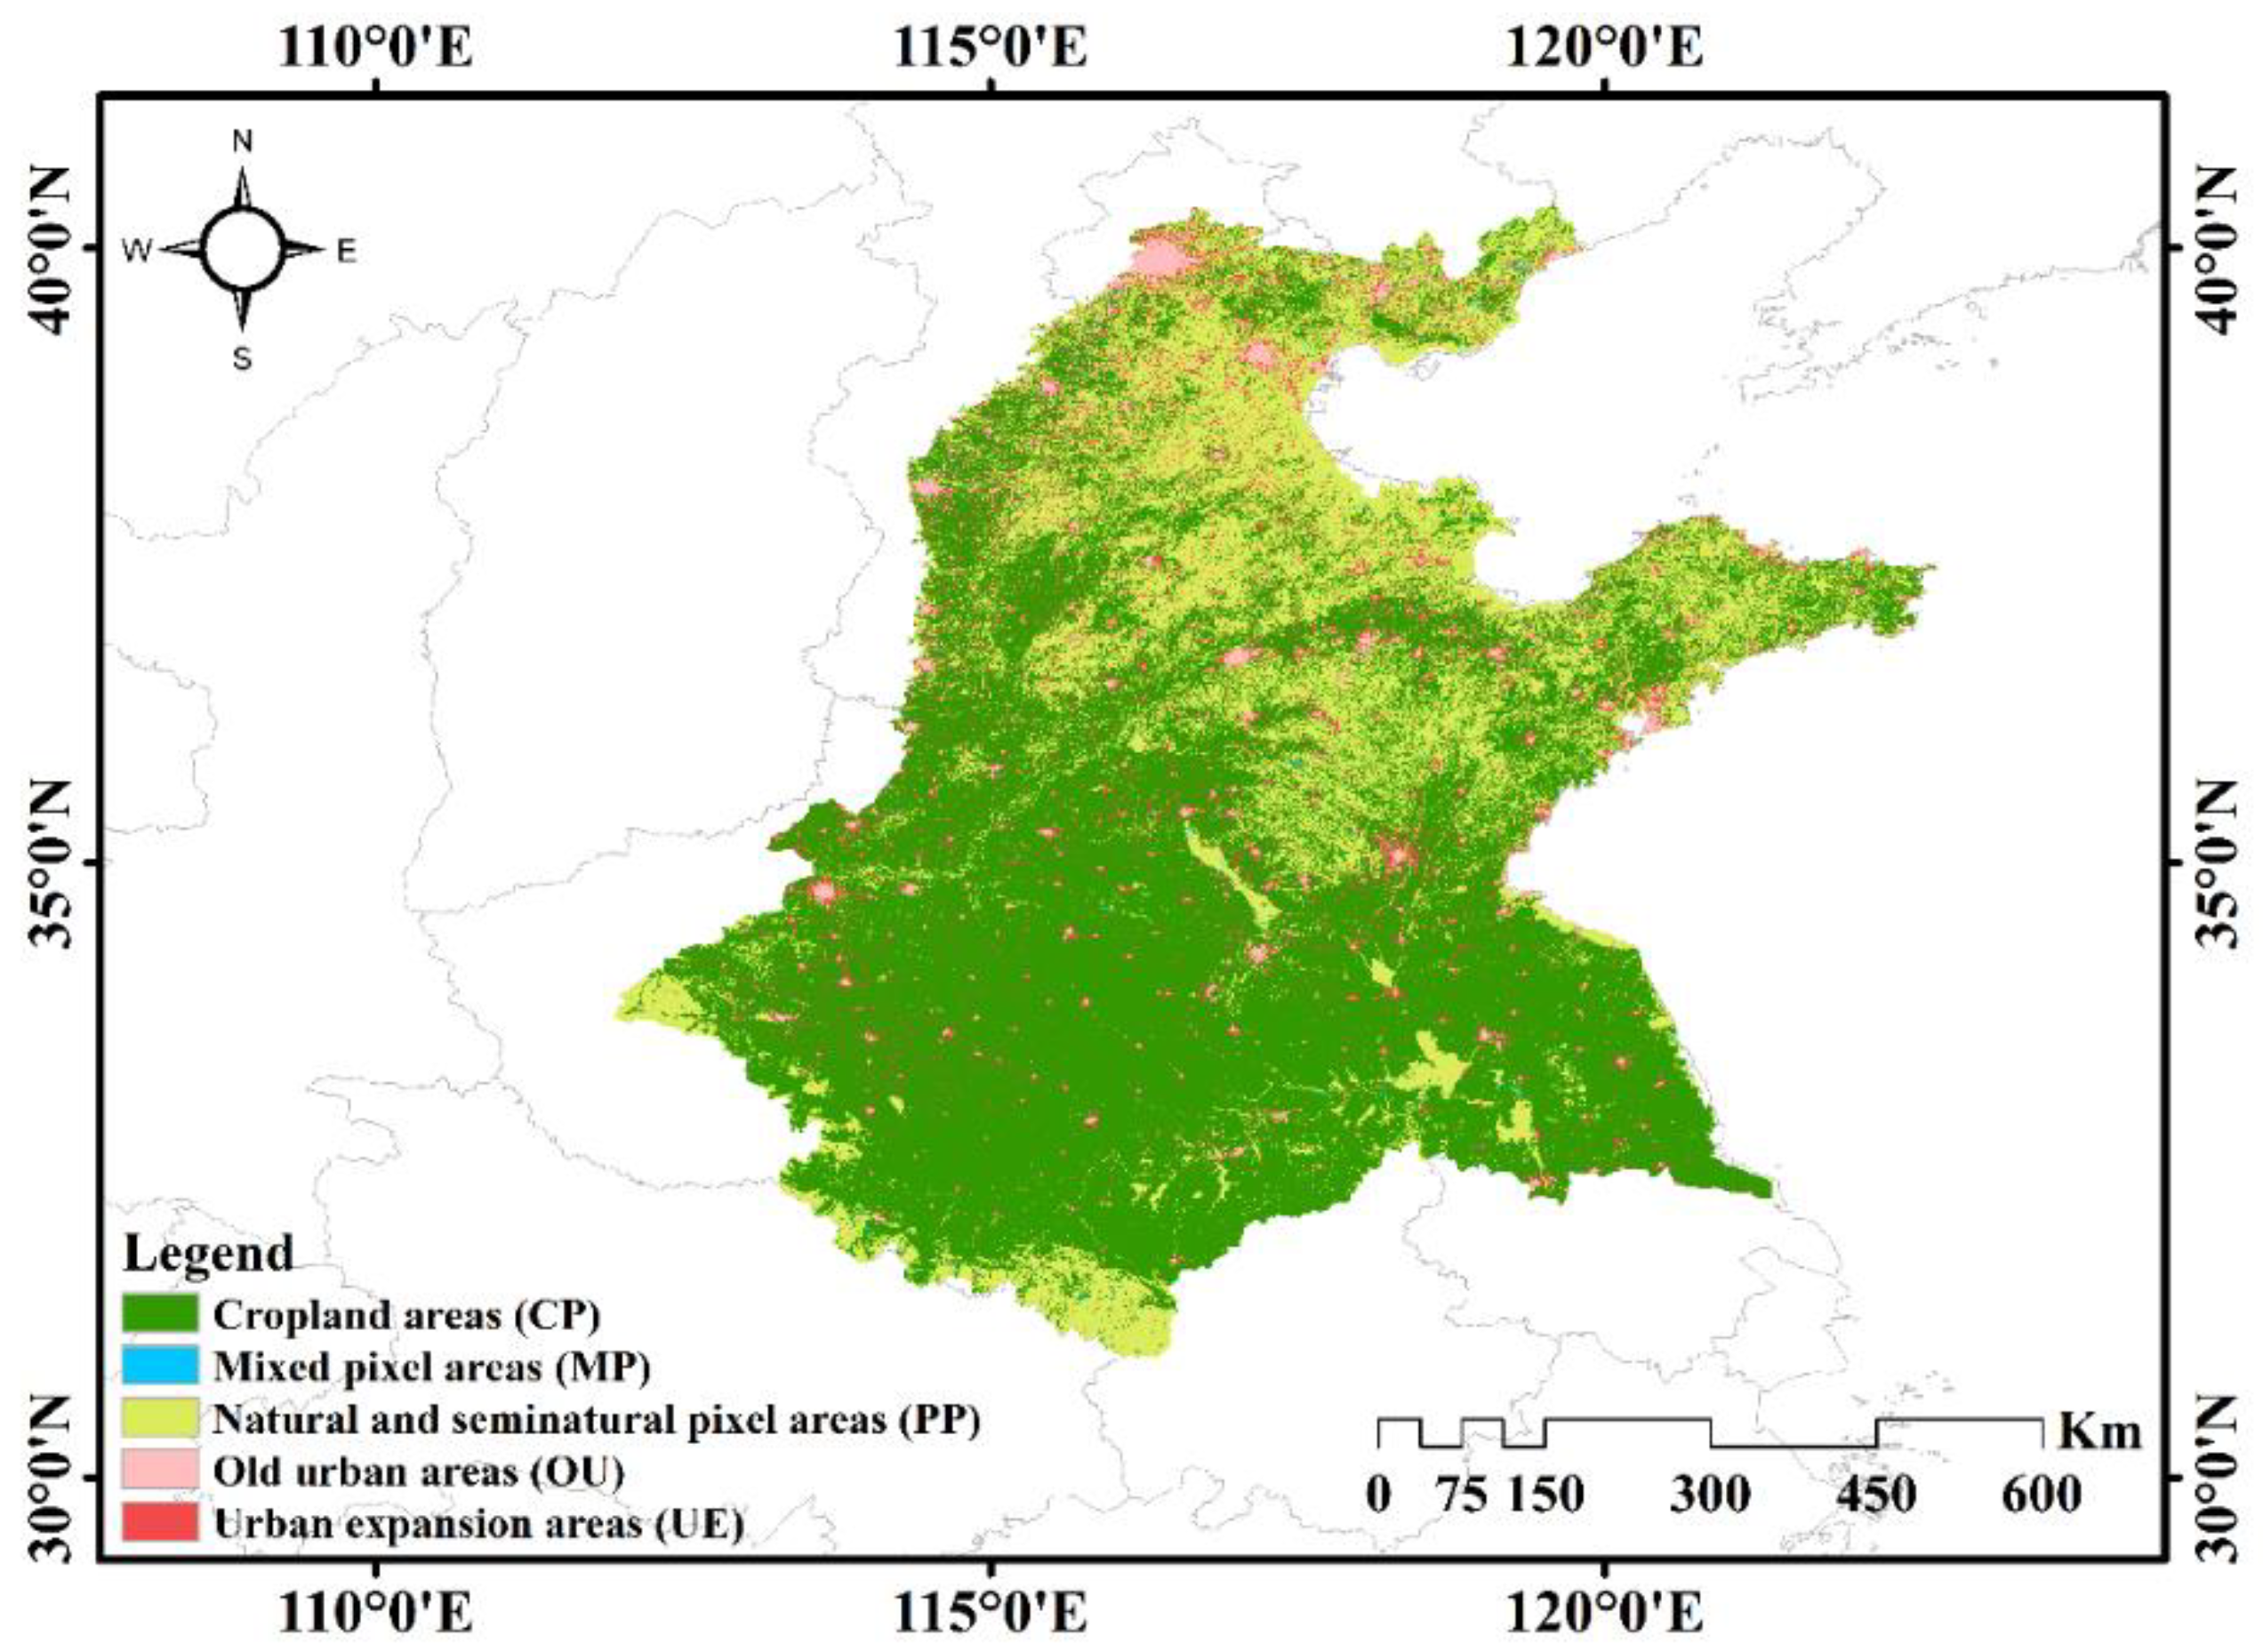
The Huang-Huai-Hai River Basin is located in the eastern coastal area of China (111°9′ N–122°7′ N, 30°9′ E–40°4′ E). As shown in Figure 1, the Huang-Huai-Hai River Basin flows through seven provinces, including Liaoning, Hebei, Shandong, Henan, Jiangsu, Anhui and Hubei, as well as Beijing and Tianjin municipalities directly under the Central Government. The Huang-Huai-Hai River Basin consists of Haihe River, Huaihe River, the lower reaches of the Yellow River and their tributaries, and it is also an important grain producing area in China. The Huang-Huai-Hai River Basin covers an area of about 5.6 × 10⁵ km2, with arable land accounting for about 70% of the total area, of which dry land accounts for about 65% and water field for about 4%. Construction land is the second largest type of land use in this area, accounting for about 14% of the total area, and it is increasing continuously [26,27].
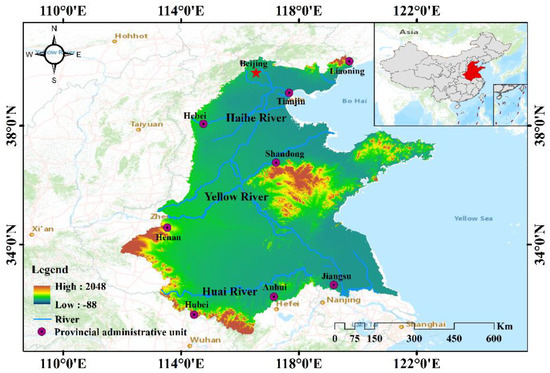
Figure 1.
Location map of the Huang-Huai-Hai River Basin.
2.2. Data Resource
Land cover data were from the European Space Agency (http://www.esa-landcover-cci.org, accessed on 20 May 2021) and have a spatial resolution of 300 m. Temperature interpolation data were selected from the grid data of the Resource and Environmental Science Data Center of the Chinese Academy of Sciences (http://www.resdc.cn, accessed on 20 May 2021). The water vapor pressure data were from the European Centre for Medium-Range Weather Forecasts (https://climate.copernicus.eu/, accessed on 20 May 2021), with a horizontal resolution of 0.1° × 0.1°. We obtained solar radiation data downloaded from the Laboratory of Environmental Ecology, Seoul National University (Seoul, Korea; http://environment.snu.ac.kr, accessed on 20 May 2021). Remote sensing factor data that affect the energy balance of the surface come from NASA’s Medium Resolution Imaging Spectrometer (MODIS) data products (https://modis.gsfc.nasa.gov, accessed on 20 May 2021). The MODIS data information is shown in Table 1. At the end of this study, all data were converted to 1 km spatial resolution for processing analysis.

Table 1.
Moderate Resolution Imaging Spectroradiometer (MODIS) data items and descriptions.
2.3. Research Methodology
2.3.1. Land Use Reclassification
We reclassified the types of land cover as follows. Areas that had been a city during 2000–2015 were classified as old urban areas (OU). The portion of the city extension was classified as urban expansion areas (UE). Natural and seminatural pixel areas were classified as mixed pixel areas (MP) where cropland was transformed into each other. The natural and seminatural pixel areas and cropland areas that did not change from 2000 to 2015 were divided into (PP) and (CP). Overall, the area of land use change was 3.6 × 10⁴ km2, accounting for 6.33% of the total area (Table 2). The order of the proportion of the five land use types from high to low was CP > PP > UE > OU > MP. As shown in Figure 2, most of the land in the Huang-Huai-Hai River Basin was CP and PP, which covered 3.6 × 10⁵ km2 and 1.6 × 10⁵ km2, respectively, followed by UE and OU. The smallest area was MP, which covered 700.83 Km2.
Table 2.
Statistics on the proportion of land type change.

Figure 2.
Spatial distribution of land use types in the Huang-Huai-Hai River Basin in 2015.
2.3.2. Calculation of Surface Energy Balance and Research Framework
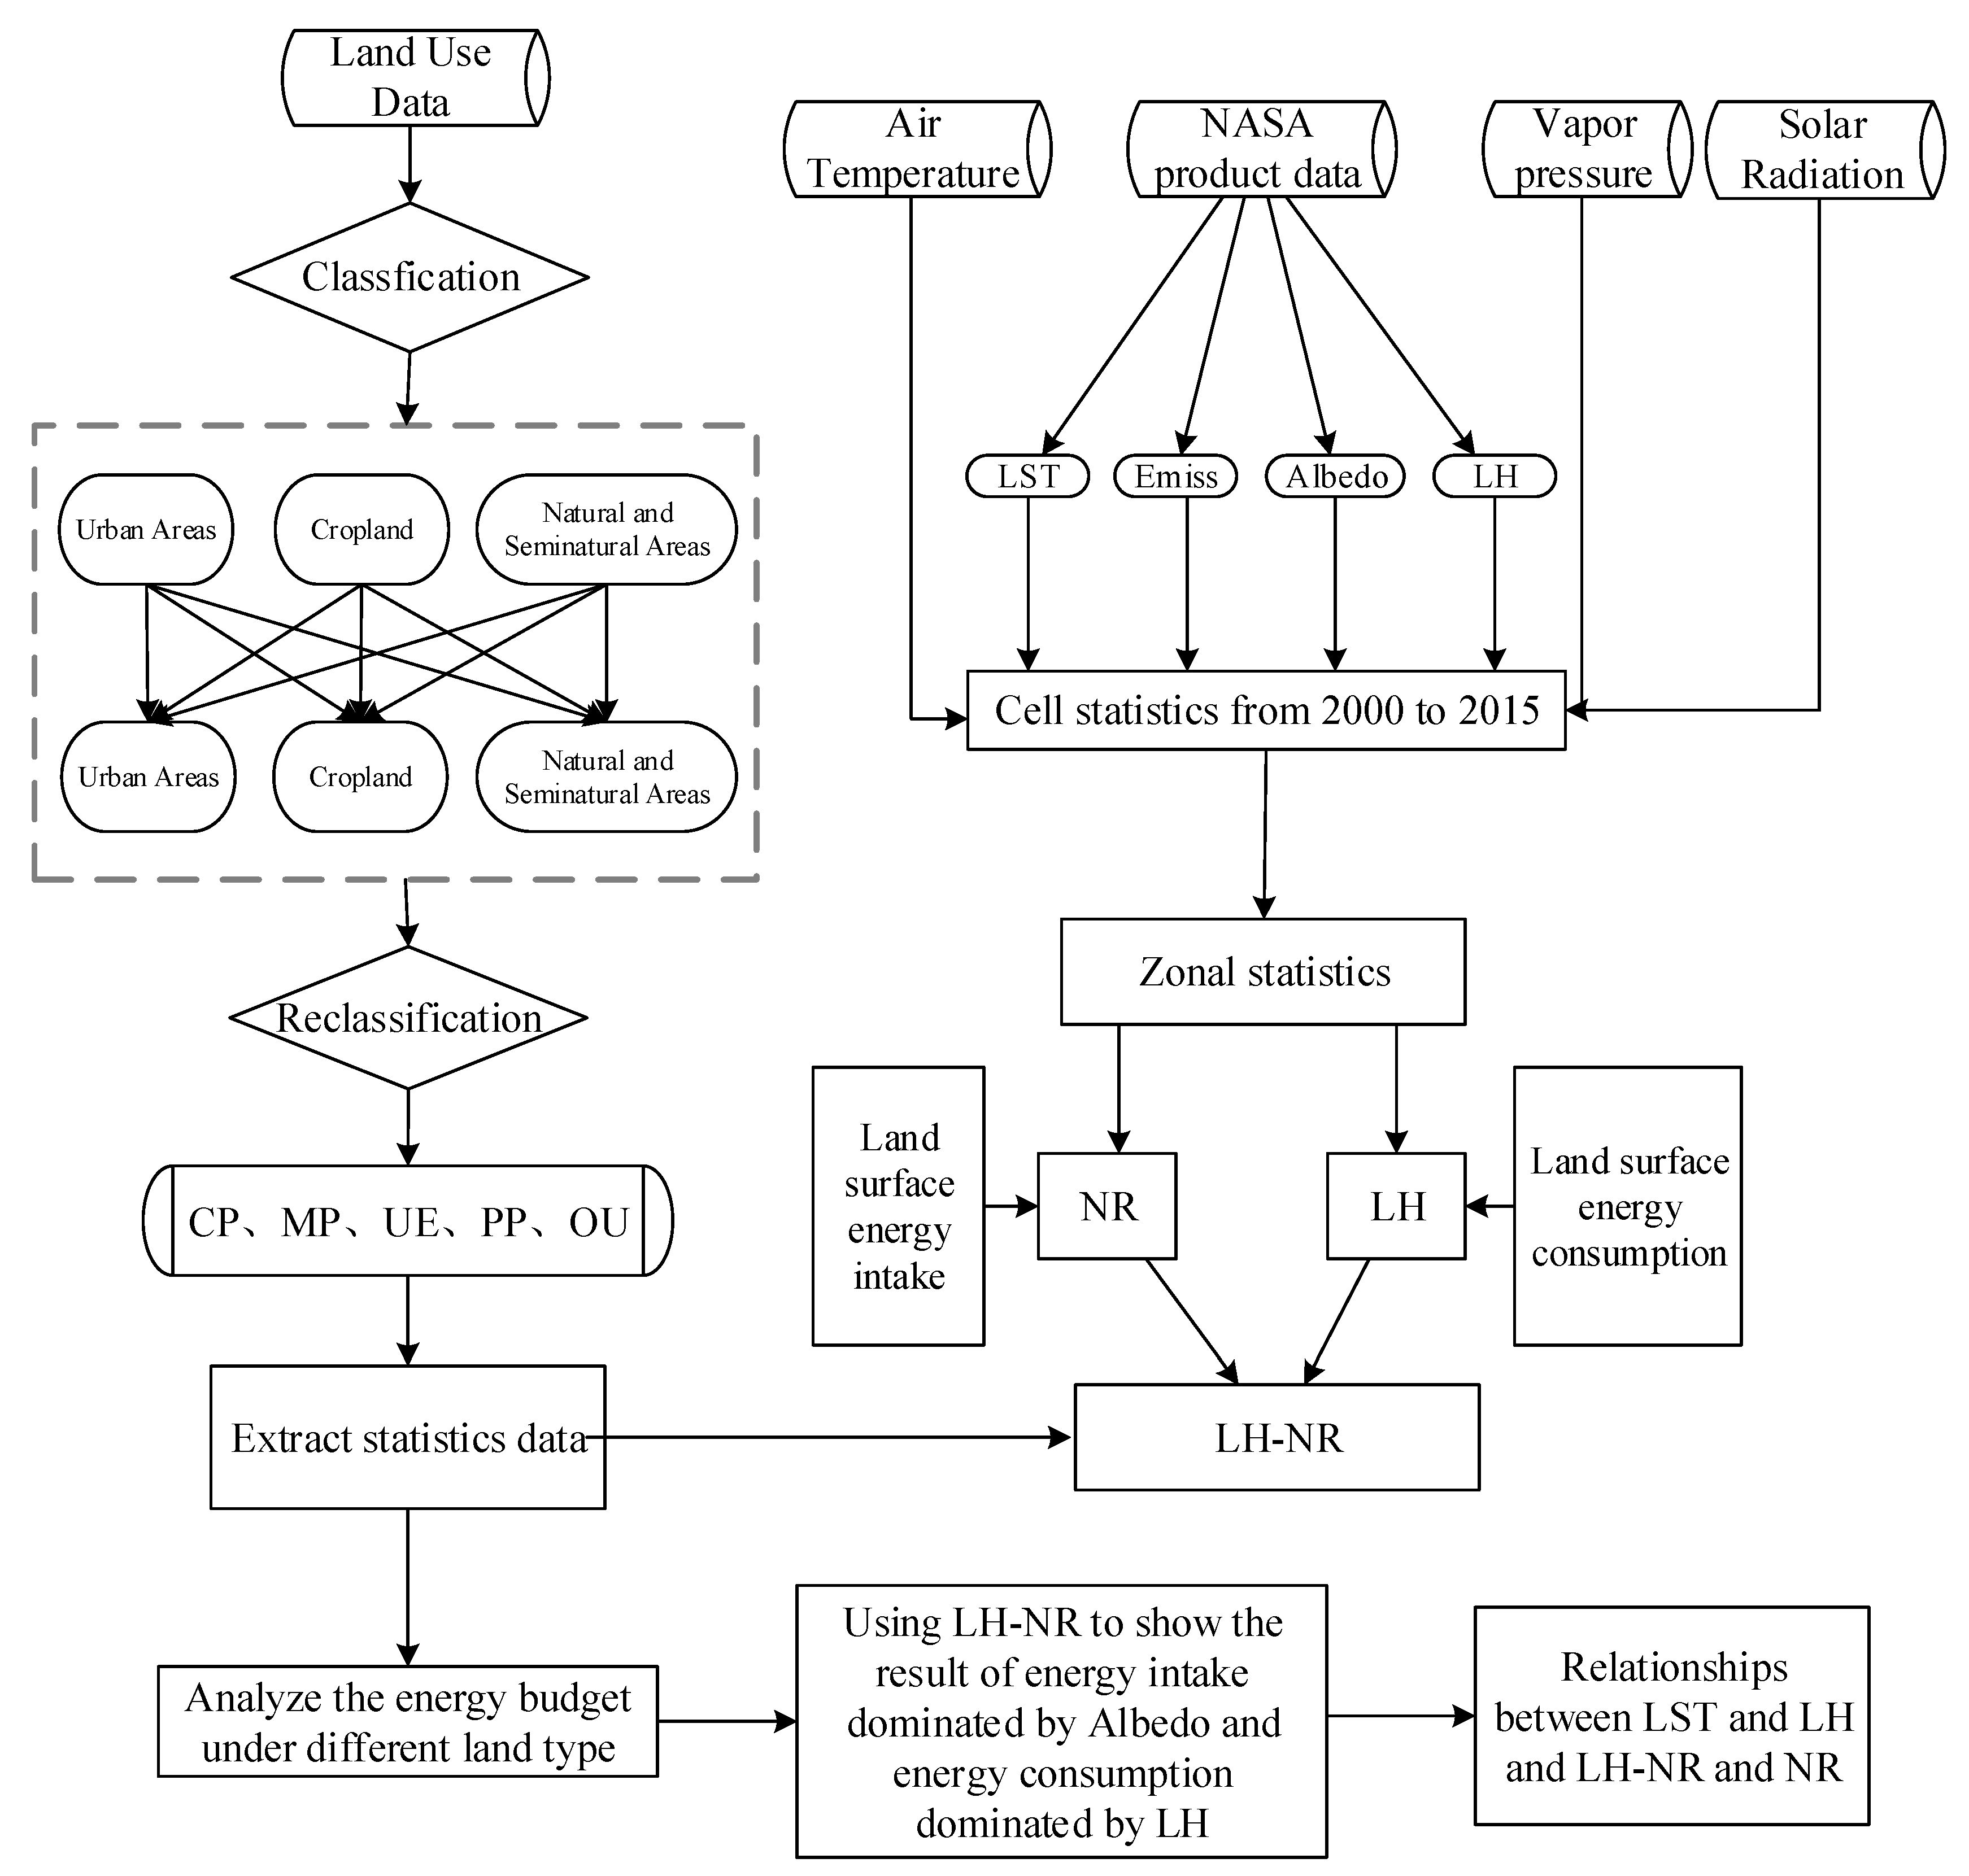
Because different land use patterns have different effects on the surface energy balance, we use the surface energy balance algorithm to calculate the change in surface energy under different land types. As shown in Figure 3, the differences and relationships between energy intake and consumption parameters under the five land use types (CP, MP, UE, PP, OU) were analyzed.

Figure 3.
Research framework of energy budget feedback of land use change.
The surface energy balance equations for each influencing factor are as follows:
where NR is the net radiation; is net shortwave radiation; is net longwave radiation; is the decreasing shortwave radiation; is the upward shortwave radiation; is decreasing longwave radiation; is upward longwave radiation, and its unit of radiation is W/m2; and is the surface albedo. is the surface emissivity; is the Boltzmann constant, which is 5.67 × 10⁻⁸ W/m2/K4; is the air temperature; and is the land surface temperature and its unit is K; is the emissivity of air; VAP is the saturated water vapor pressure and its unit is hpa.
In this study, –NR was used to represent factors such as energy uptake forcing caused by biogeophysical factors, and a negative sign indicates that NR decreases with the increase of albedo. Meanwhile, LH represents the forcing of NR consumption on energy consumption and represents the final result of the forced balance of energy intake and expenditure caused by LUCC [28]. In terms of forced balance, the larger value reduces the energy of sensible heat flux and soil heat flux. If less energy was used to heat the atmosphere and surface temperature, corresponding to a cooling feedback or a weak warming feedback. In contrast, a lower value means a stronger temperature rise feedback.
2.3.3. Nonparametric Mann-Kendall Trend Test
Classical linear regression and the nonparametric Mann-Kendall trend test (M-K test for short) [29,30,31,32,33], as well as other statistical methods, were used to examine changes in various energy factors of different land use types over time from 2000 to 2015. The trend test principle of different energy factors are as follows:
- (1)
- Suppose the time series X1, X2, …, Xn, represents the cumulative number of the ith sample Xi > Xj (1 j i), define the statistics:
- (2)
- The mean and variance of is:
- (3)
- Standardize :
Including , given the significance level , if , indicating that time series X has an obvious change trend. Invert the X-Series samples to obtain a new time series, namely Xn, Xn−1, …, X1, perform the same operation on the new time series and there is a new order column , where , k = n, n − 1, …, 1.
3. Results
3.1. Changes of Surface Energy Intake
3.1.1. Net Shortwave and Longwave Radiation
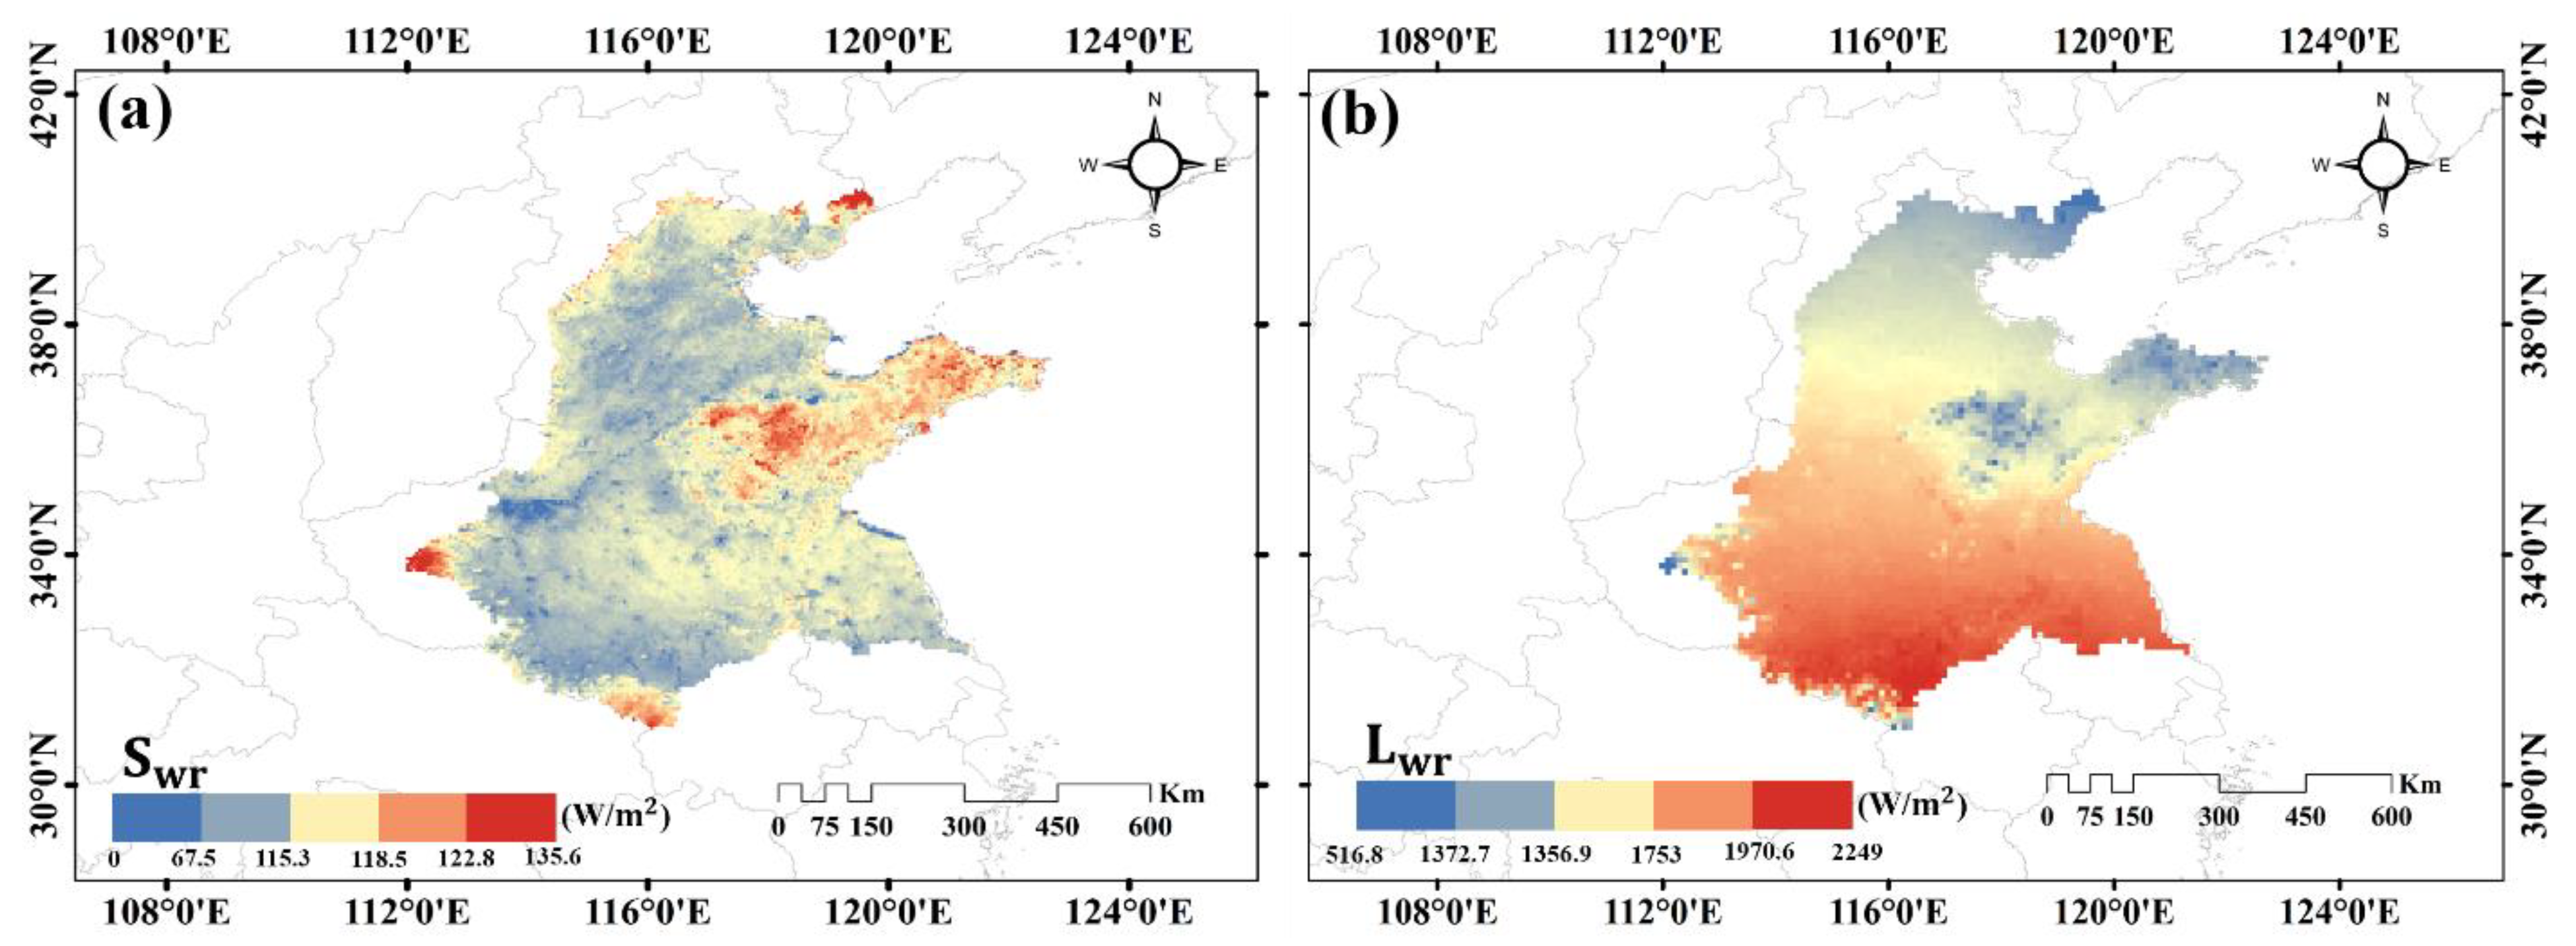
Spatial changes in net short wave () and net long wave radiation () during the study period was calculated on the basis of difference in surface energy intake data from 2000 to 2015. As shown in Figure 4, the and variation values in most of the study area were positive, the multi-year trend values of and were −0.245 and 0.1916 , and multi-year averages of and were 119.43 and 1693.74 , respectively.
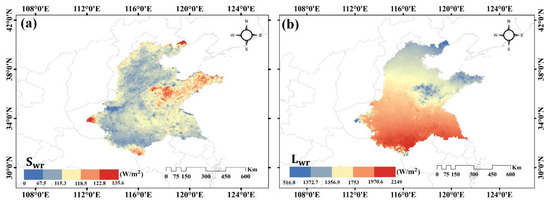
Figure 4.
Spatial differences of (a) net shortwave radiation () and (b) net long-wave radiation () in the Huang-Huai-Hai River Basin from 2000 to 2015.
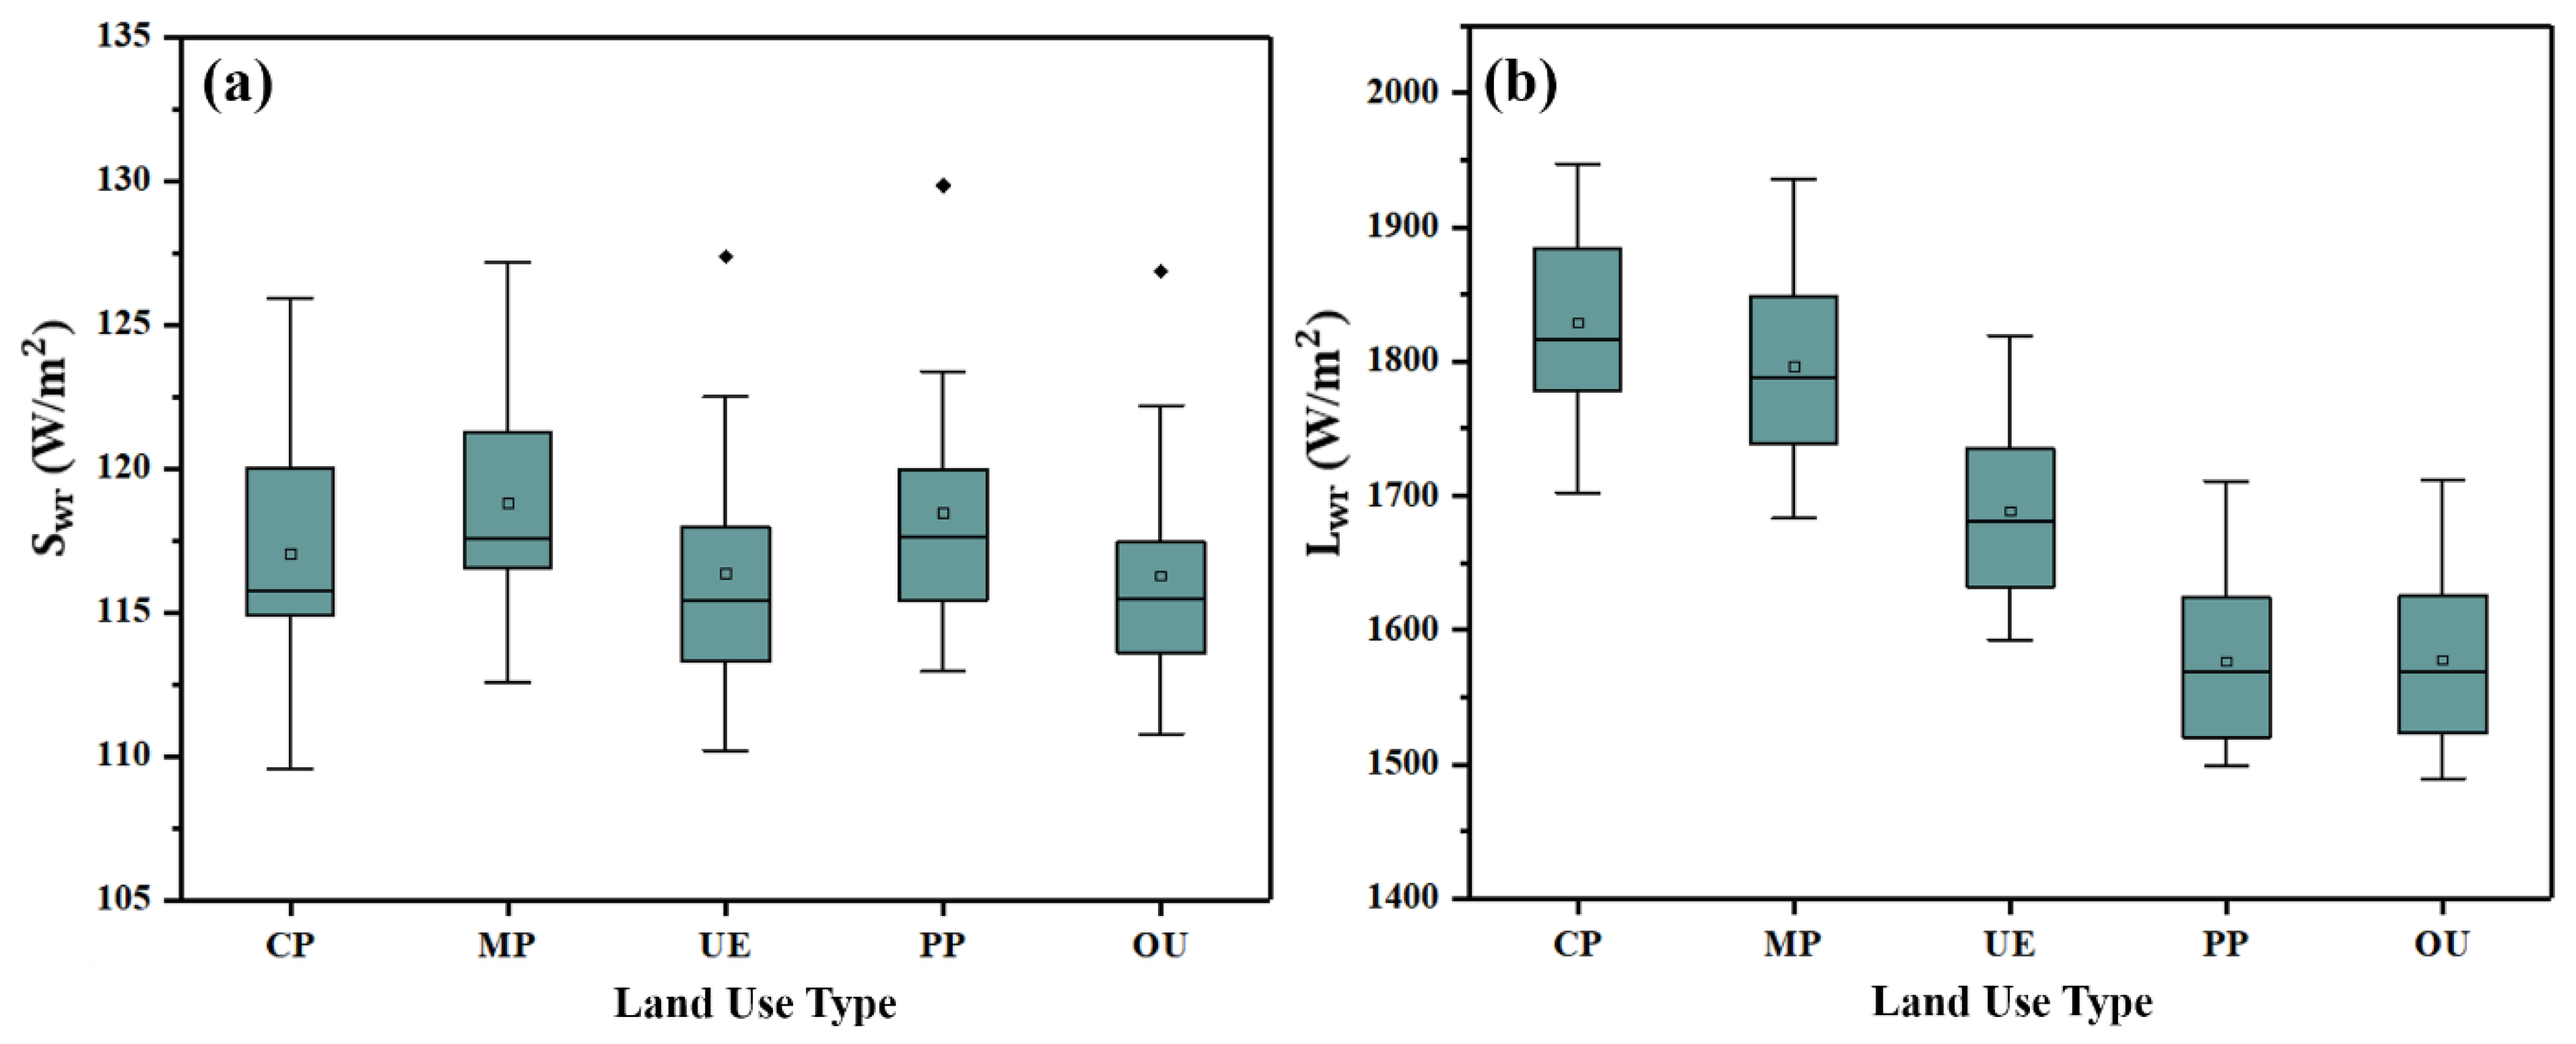
In terms of spatial distribution, had increased significantly in Henan, Anhui, Jiangsu and Hubei provinces, mainly in CP region. Regional negative differences were mainly concentrated in the eastern and northern regions (Shandong, Hebei, Tianjin, Beijing and Liaoning), mainly distributed in PP and CP regions. In contrast, the increment of was generally small, with individual regions larger (Shandong province). The region with the largest increase in was mainly the PP region, while the smallest area was the CP region.
According to Figure 5, the highest values of were mainly located in the MP, CP and UE areas, where the multi-year average maximum value was 1828.17 , the lower value was located in the PP and OU regions, they were 1576.96 and 1577.98 , respectively. The results of showed that the multi-year average in the CP region was 125.27 , followed by the OU, PP, UE and MP, which were 122.75 , 119.84 , 119.62 , 118.34 , respectively.
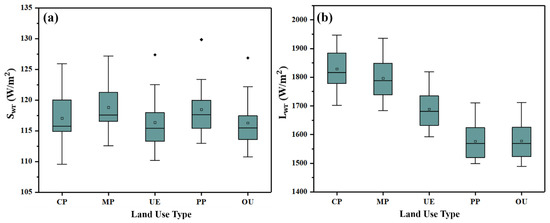
Figure 5.
Statistical values of (a) net shortwave radiation () and (b) net long-wave radiation ( ) based on five land types in the Huang-Huai-Hai River Basin from 2000 to 2015.
3.1.2. Changes of Net Radiation
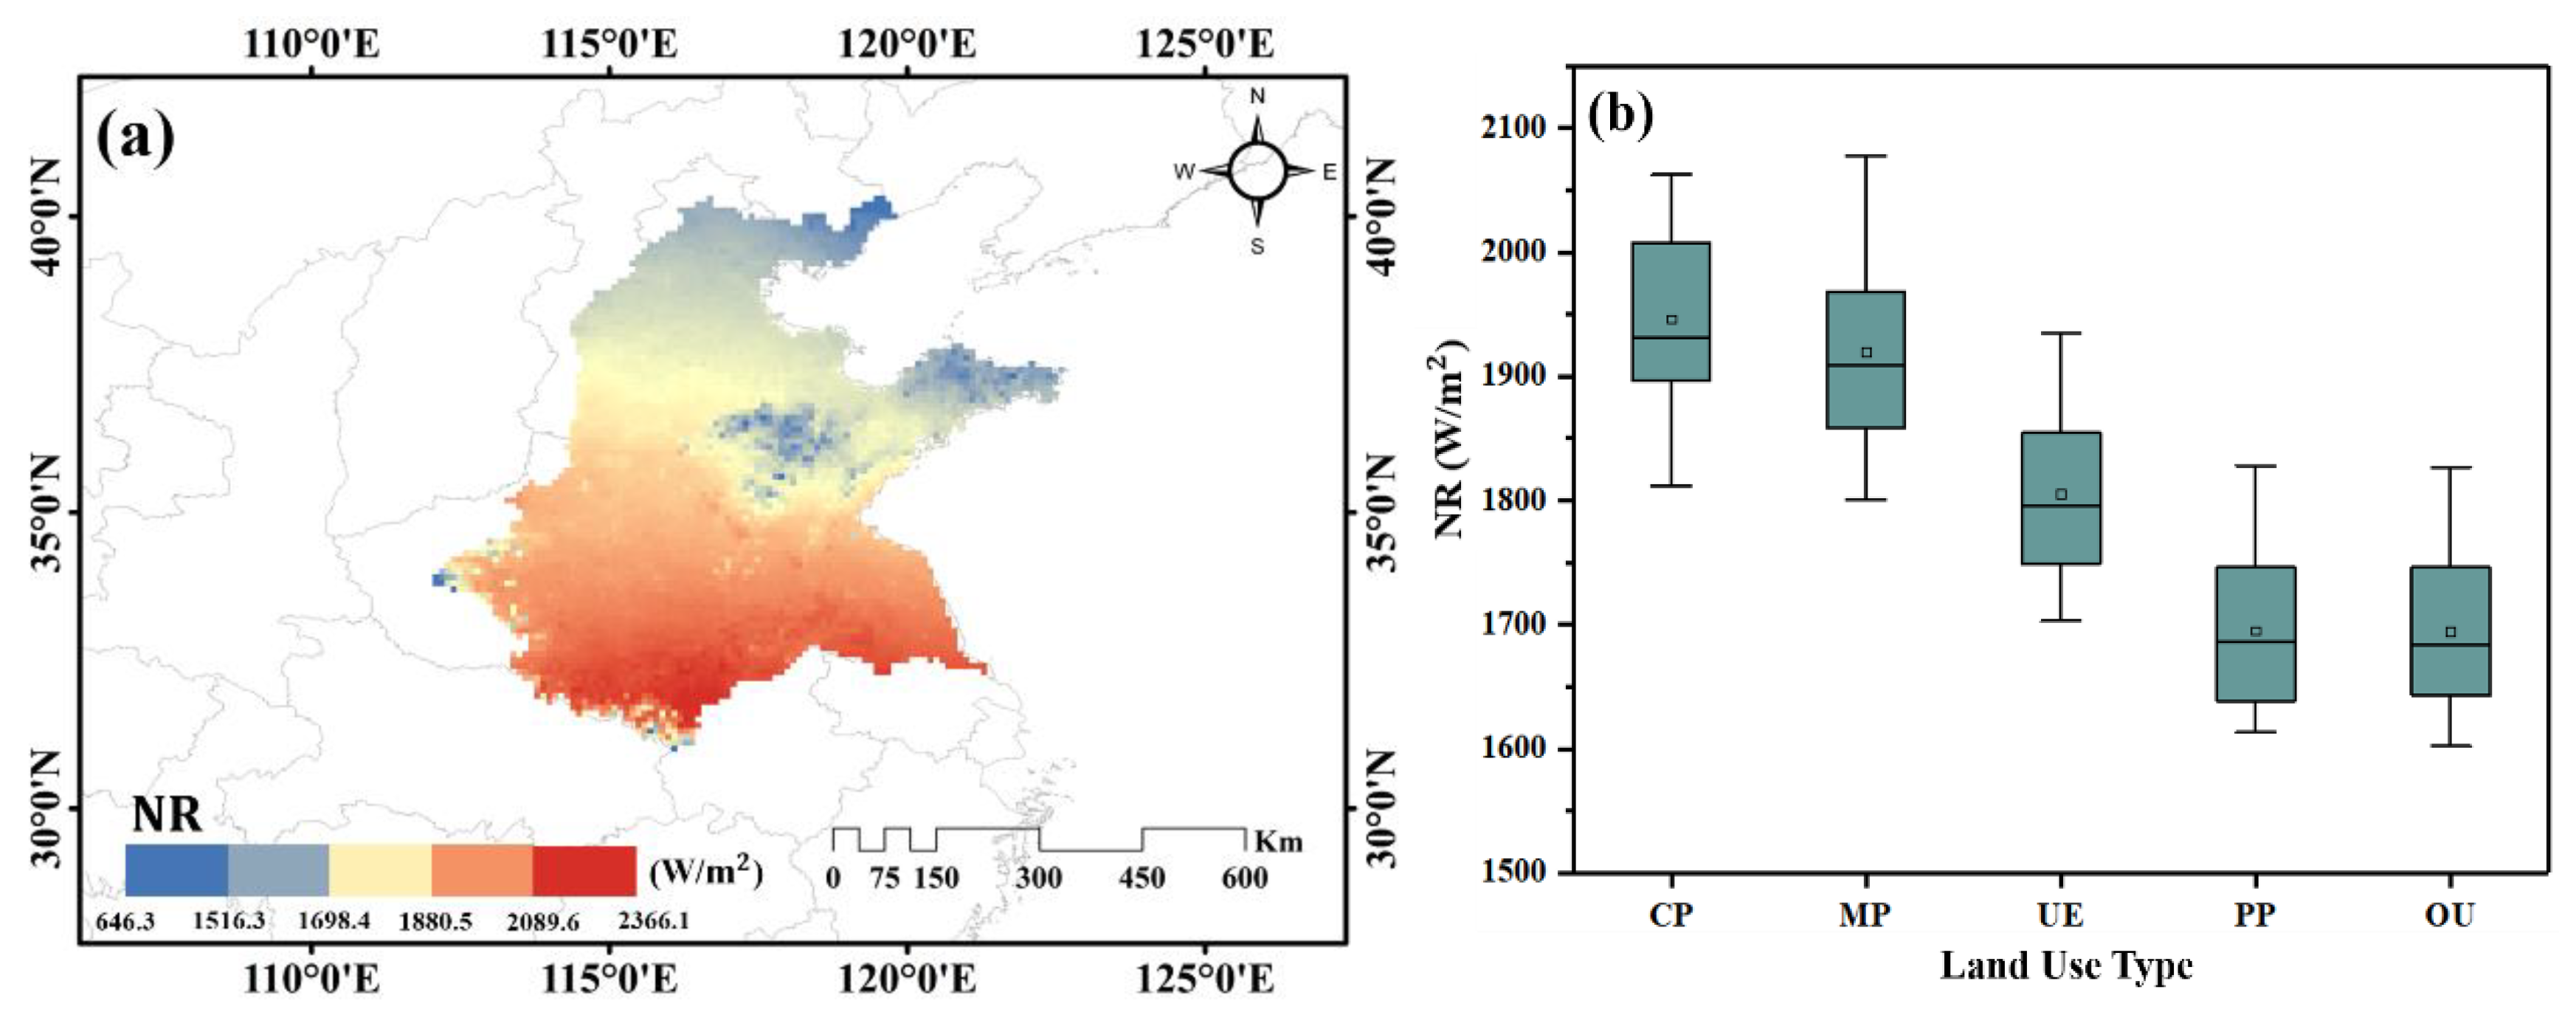
Net radiation is an important index of regional energy absorption and an important physical and ecological parameter that can affect the geo-gas energy exchange and redistribution process [7]. The change in NR was obtained by using and data. The average surface radiation in the Huang-Huai-Hai River Basin from 2000 to 2015 was 1812.16 , with a multi-year trend value of −0.22 . Figure 6a showed an increasing trend in the south and a decrease in the north in NR. In addition, the value of NR in 2015 was higher than 2000 and generally showed an upward trend, but the changes over the years were small.

Figure 6.
(a) Spatial variation in net radiation (NR) in the Huang-Huai-Hai River Basin for 2000–2015 and (b) statistical values for the five use types.
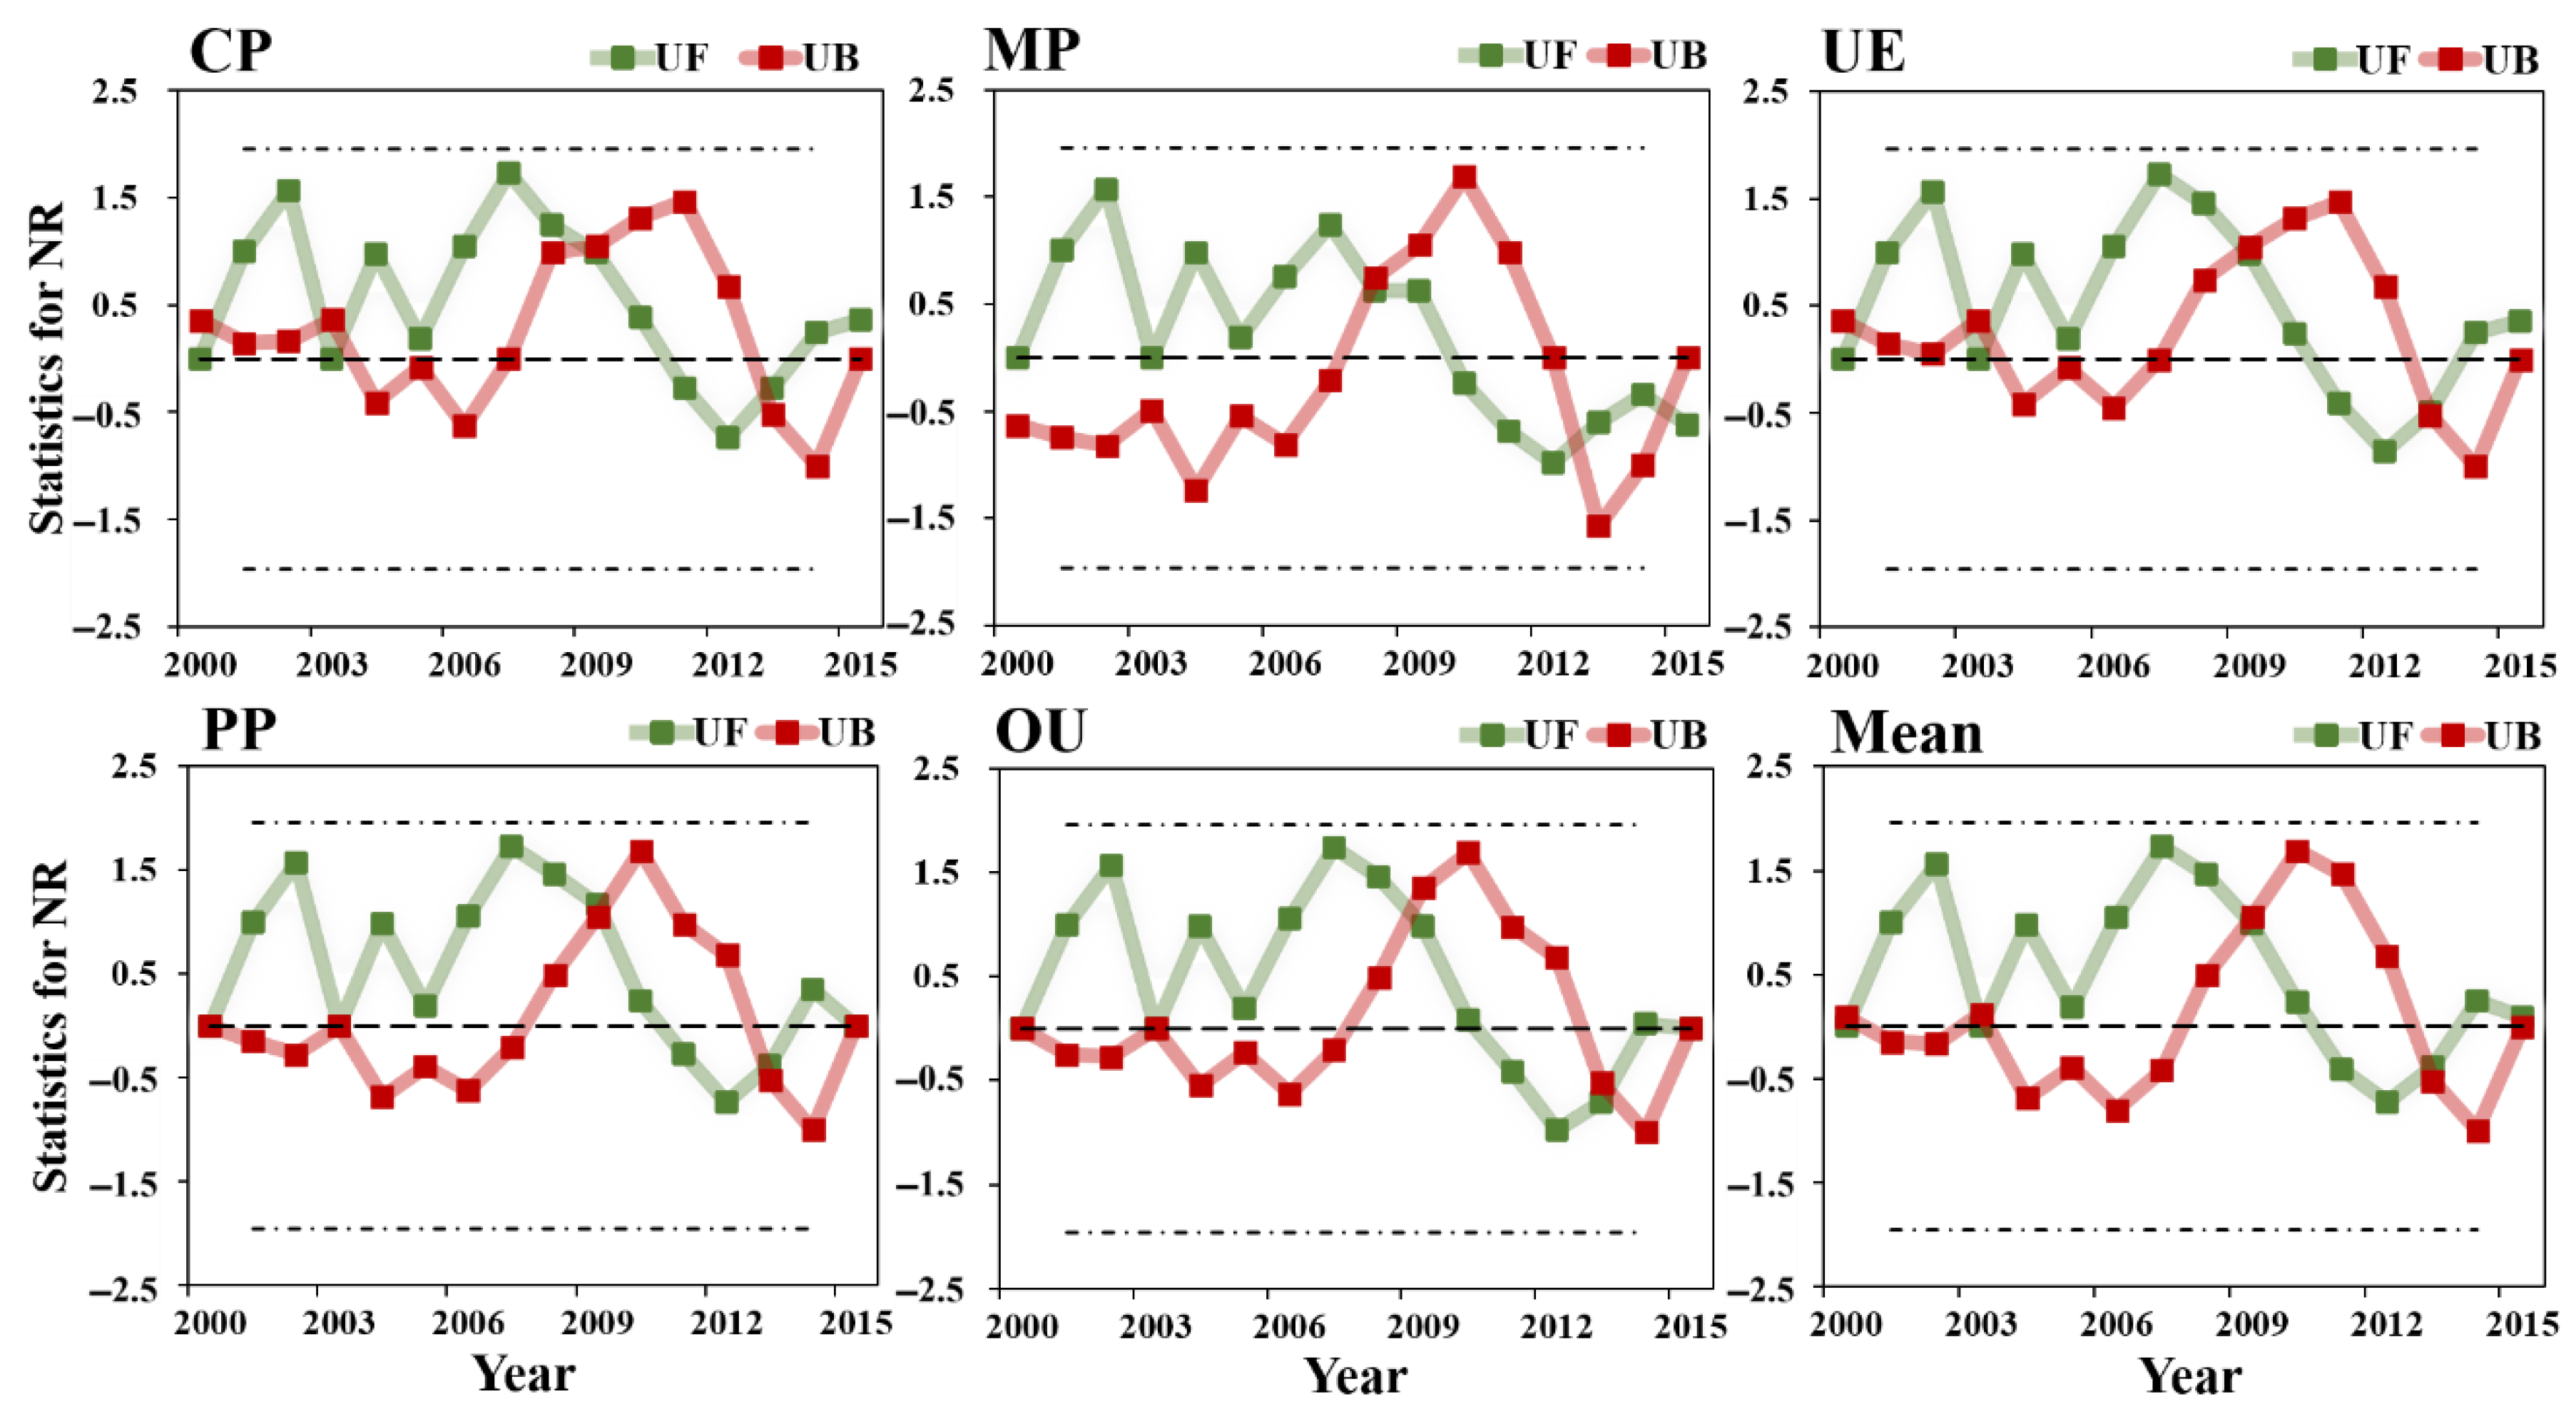
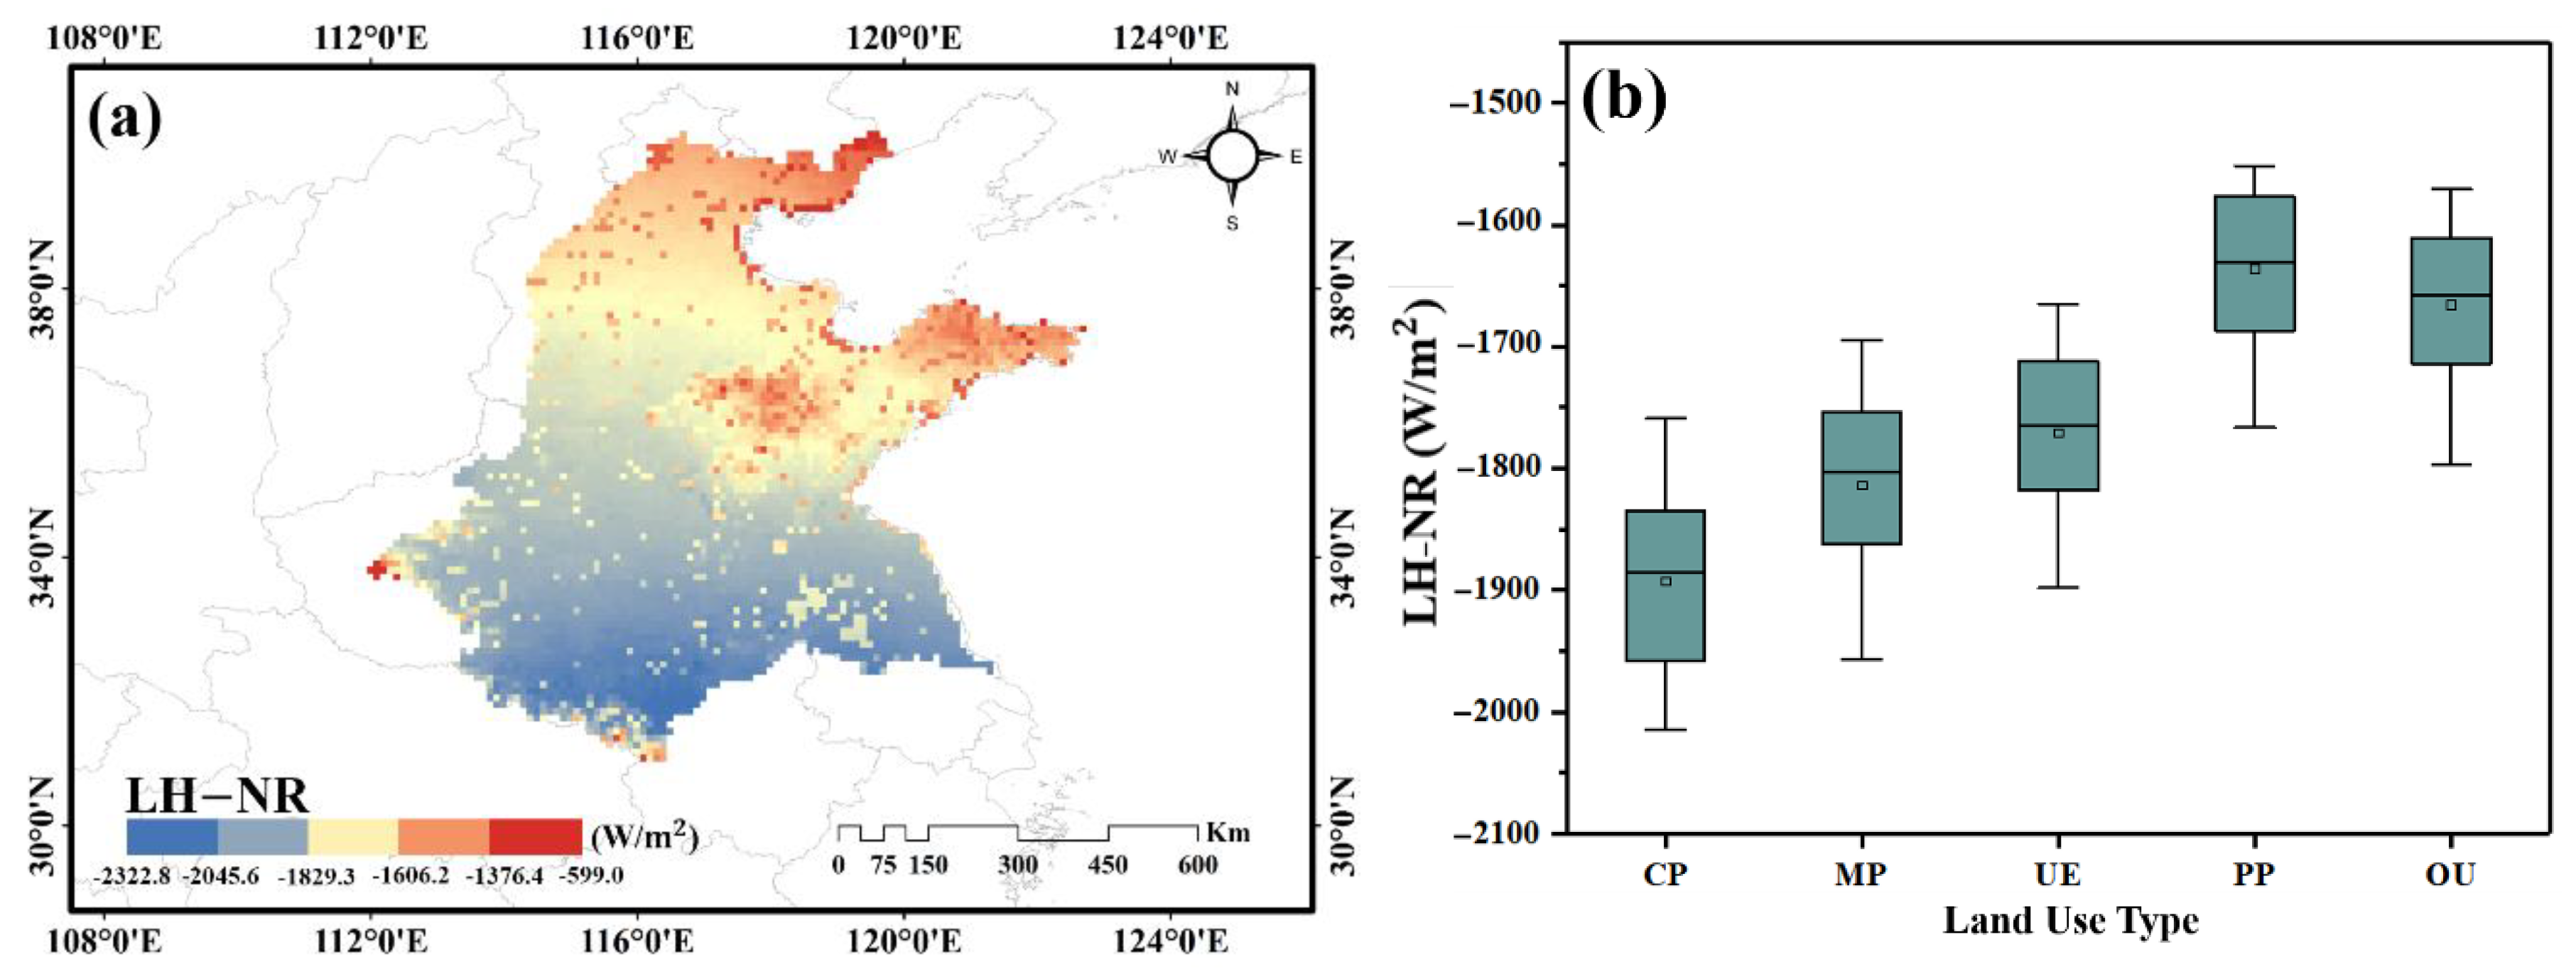
The variation trend of NR of different land use types showed that there were significant differences among the five land use types (Figure 7). The multi-year averages of CP and MP regions of NR were 1946.2 and 1919.4 , respectively, much higher than UE, PP and OU. The multi-year average value of PP was the lowest (1694.7 ). Combining with the Figure 8, the UF > 0 of the five land-use types indicated an upward trend in NR. Although mutations began to decline in 2009, there was a marked sudden increase in 2013, with the overall upward trend in NR in line with the global warming climate context.
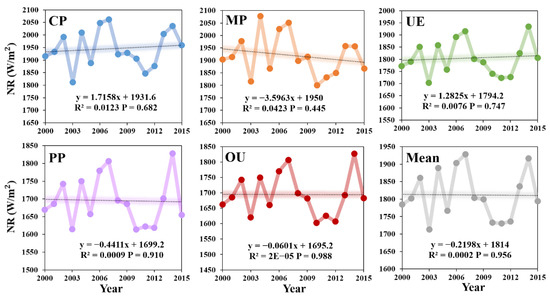
Figure 7.
Net radiation (NR) trend of different land use types in the Huang-Huai-Hai River Basin from 2000 to 2015.
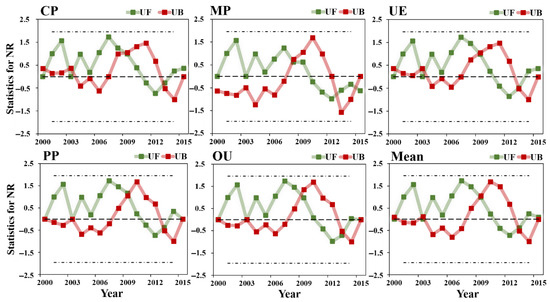
Figure 8.
Mann-Kendall test of net radiation (NR) for different land use types in the Huang-Huai-Hai River Basin from 2000 to 2015.
3.2. Analysis of Surface Energy Balance
3.2.1. Changes in Surface Energy Consumption
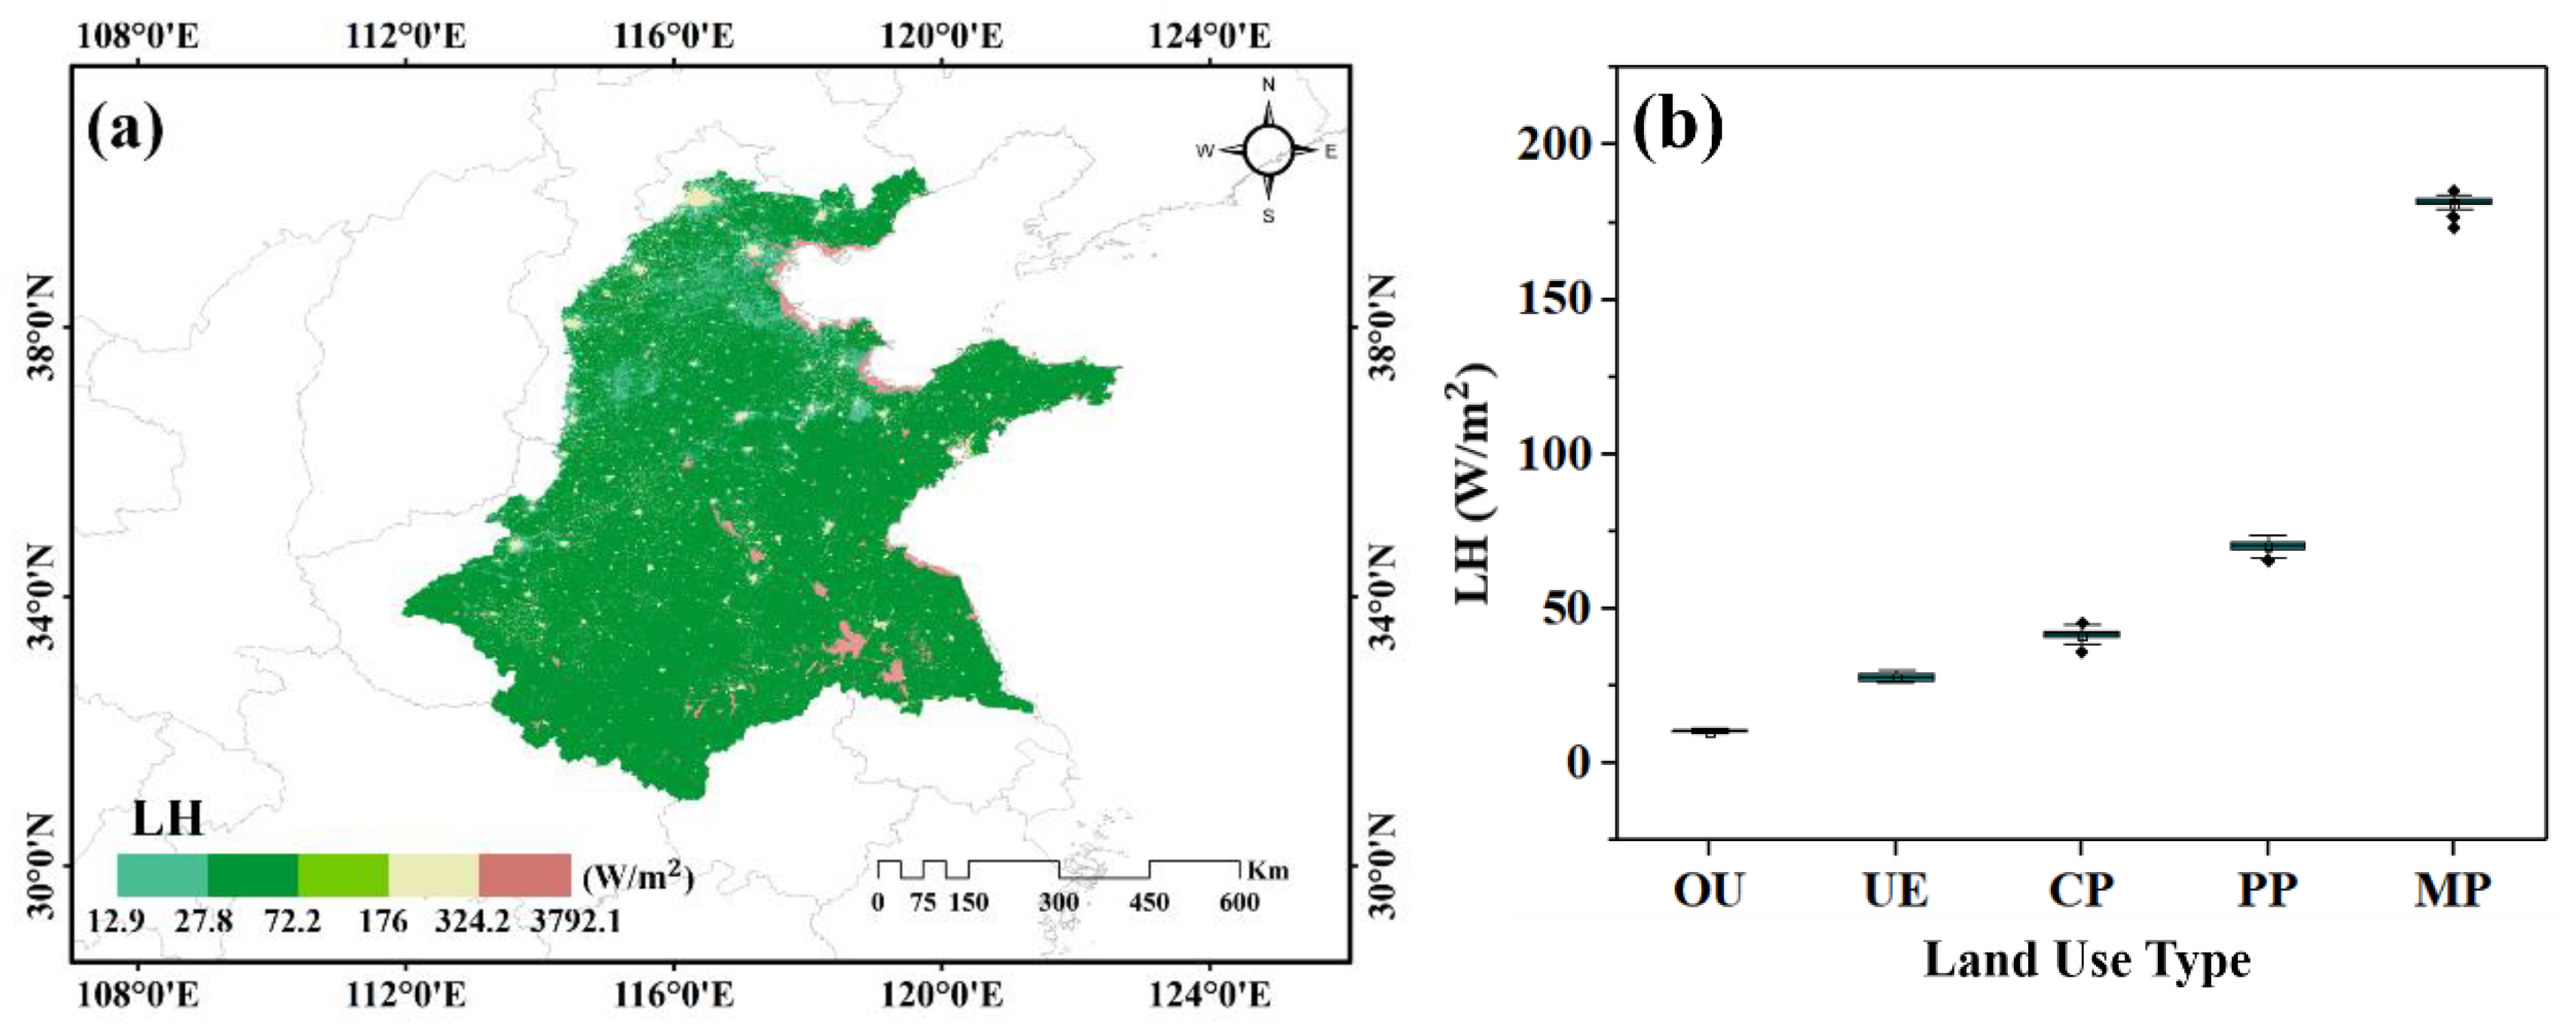
It can be seen from Figure 9b, the change values of LH in the Huang-Huai-Hai Basin from 2000 to 2015 was positive. From the spatial distribution point of view, the overall LH distribution was different, the LH values corresponding to land use types ranged from 27.8~72.2 in a large area. In the five land-use types, the largest multi-year mean was found in MP region, with 181.2 , PP, CP, UE and OU, followed by 70.1 , 41.4 , 27.7 , 10.3 .

Figure 9.
(a) Spatial variation of latent heat flux (LH) and (b) statistical values for the five land use types in the Huang-Huai-Hai River Basin from 2000 to 2015.
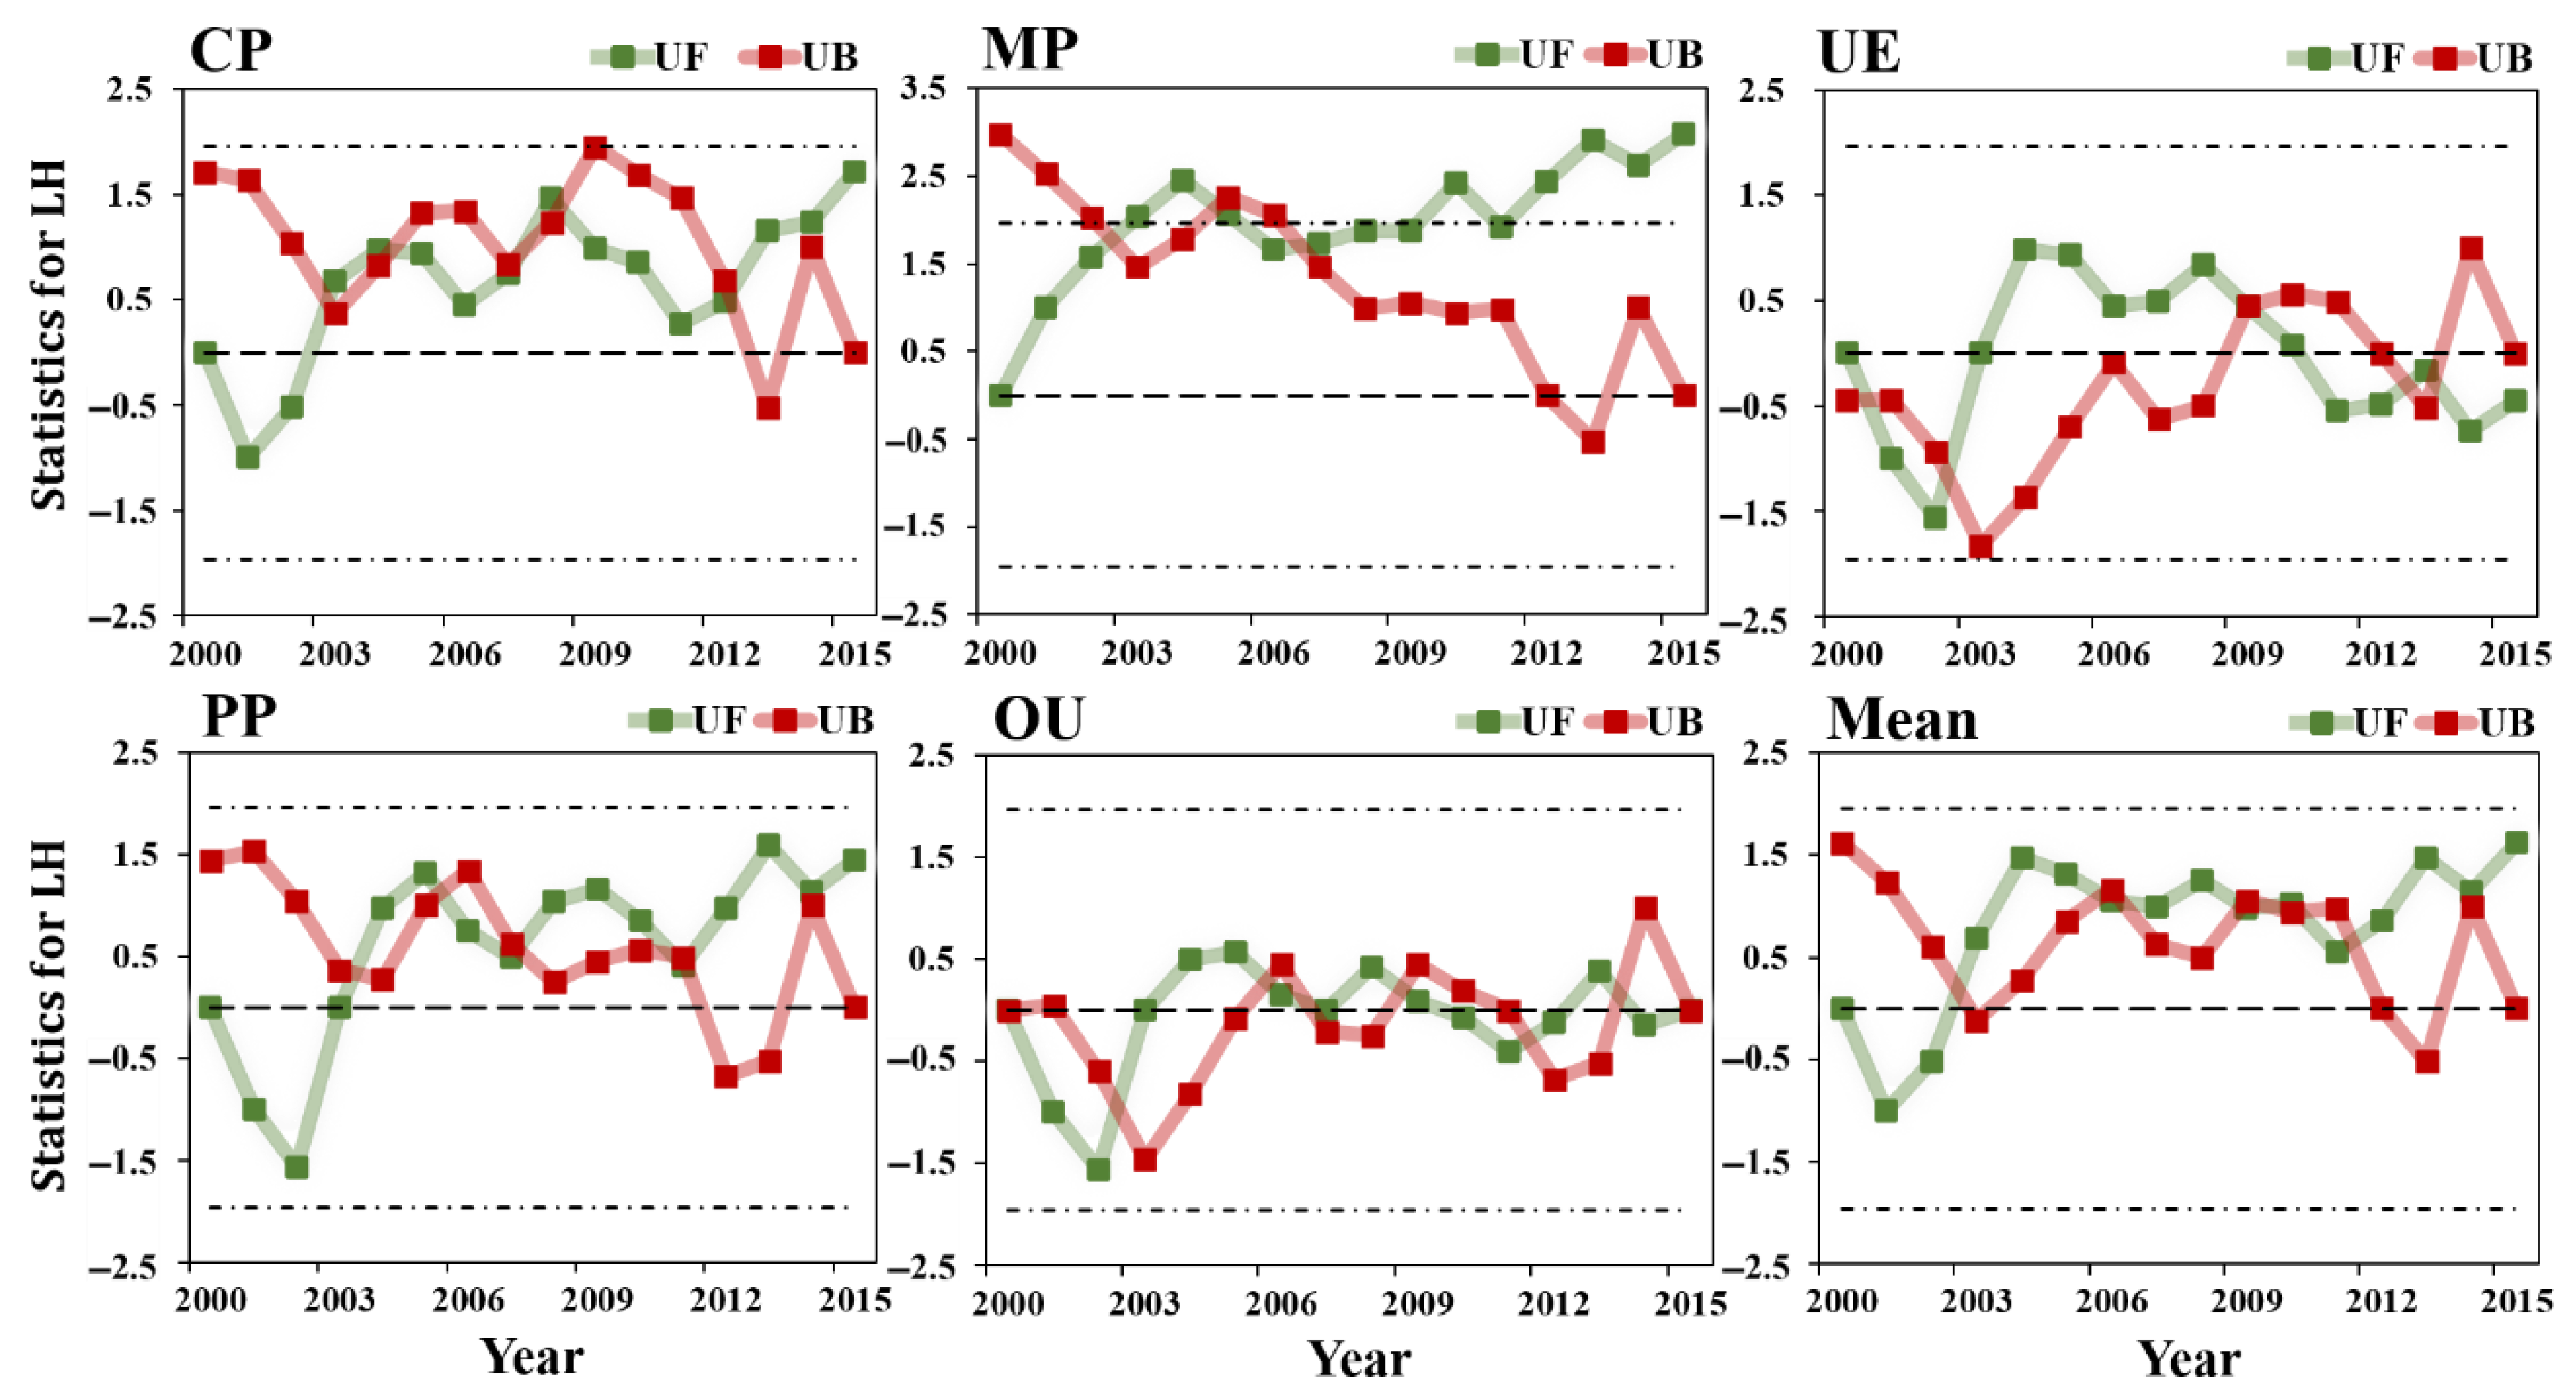
The trend of LH in various land use types in Huang-Huai-Hai River Basin from 2000 to 2015 as shown in Figure 10, with a multi-year average of LH was 66.2 and a multi-year LH trend of 0.18 . The LH trend of OU and UE were smaller than 0.1 , while the LH trend of CP, PP and MP were greater than 0.1 . An overall upward trend in the UF curve over a 16-year period as shown in Figure 11, and the UF and UB of MP intersected in 2005 outside the confidence line , indicating that significant mutations began in 2005, and the LH value of the MP region had been increasing continuously since then. The UE mutation trend characteristics differ from the annual average LH, with the mutation appearing in 2009 and showing a decreasing trend, which was related to the increase in impermeable area. In general, the LH values of OU and UE, which were more affected by human intervention, were always smaller than that of other land use types, and the LH values decreases with the increase of human activities influence on the surface, indicating that human activity has a negative impact on the value and trend of LH.
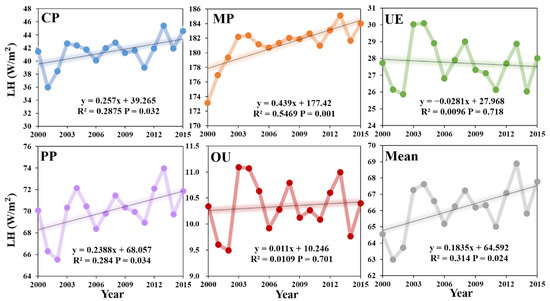
Figure 10.
Latent heat flux (LH) trend of different land use types in the Huang-Huai-Hai River Basin from 2000 to 2015.
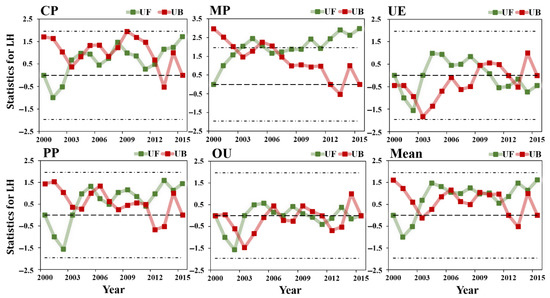
Figure 11.
Mann-Kendall test of latent heat flux (LH) for different land use types in the Huang-Huai-Hai River Basin from 2000 to 2015.
3.2.2. Comparison of Net Radiation and Latent Heat Fluxes
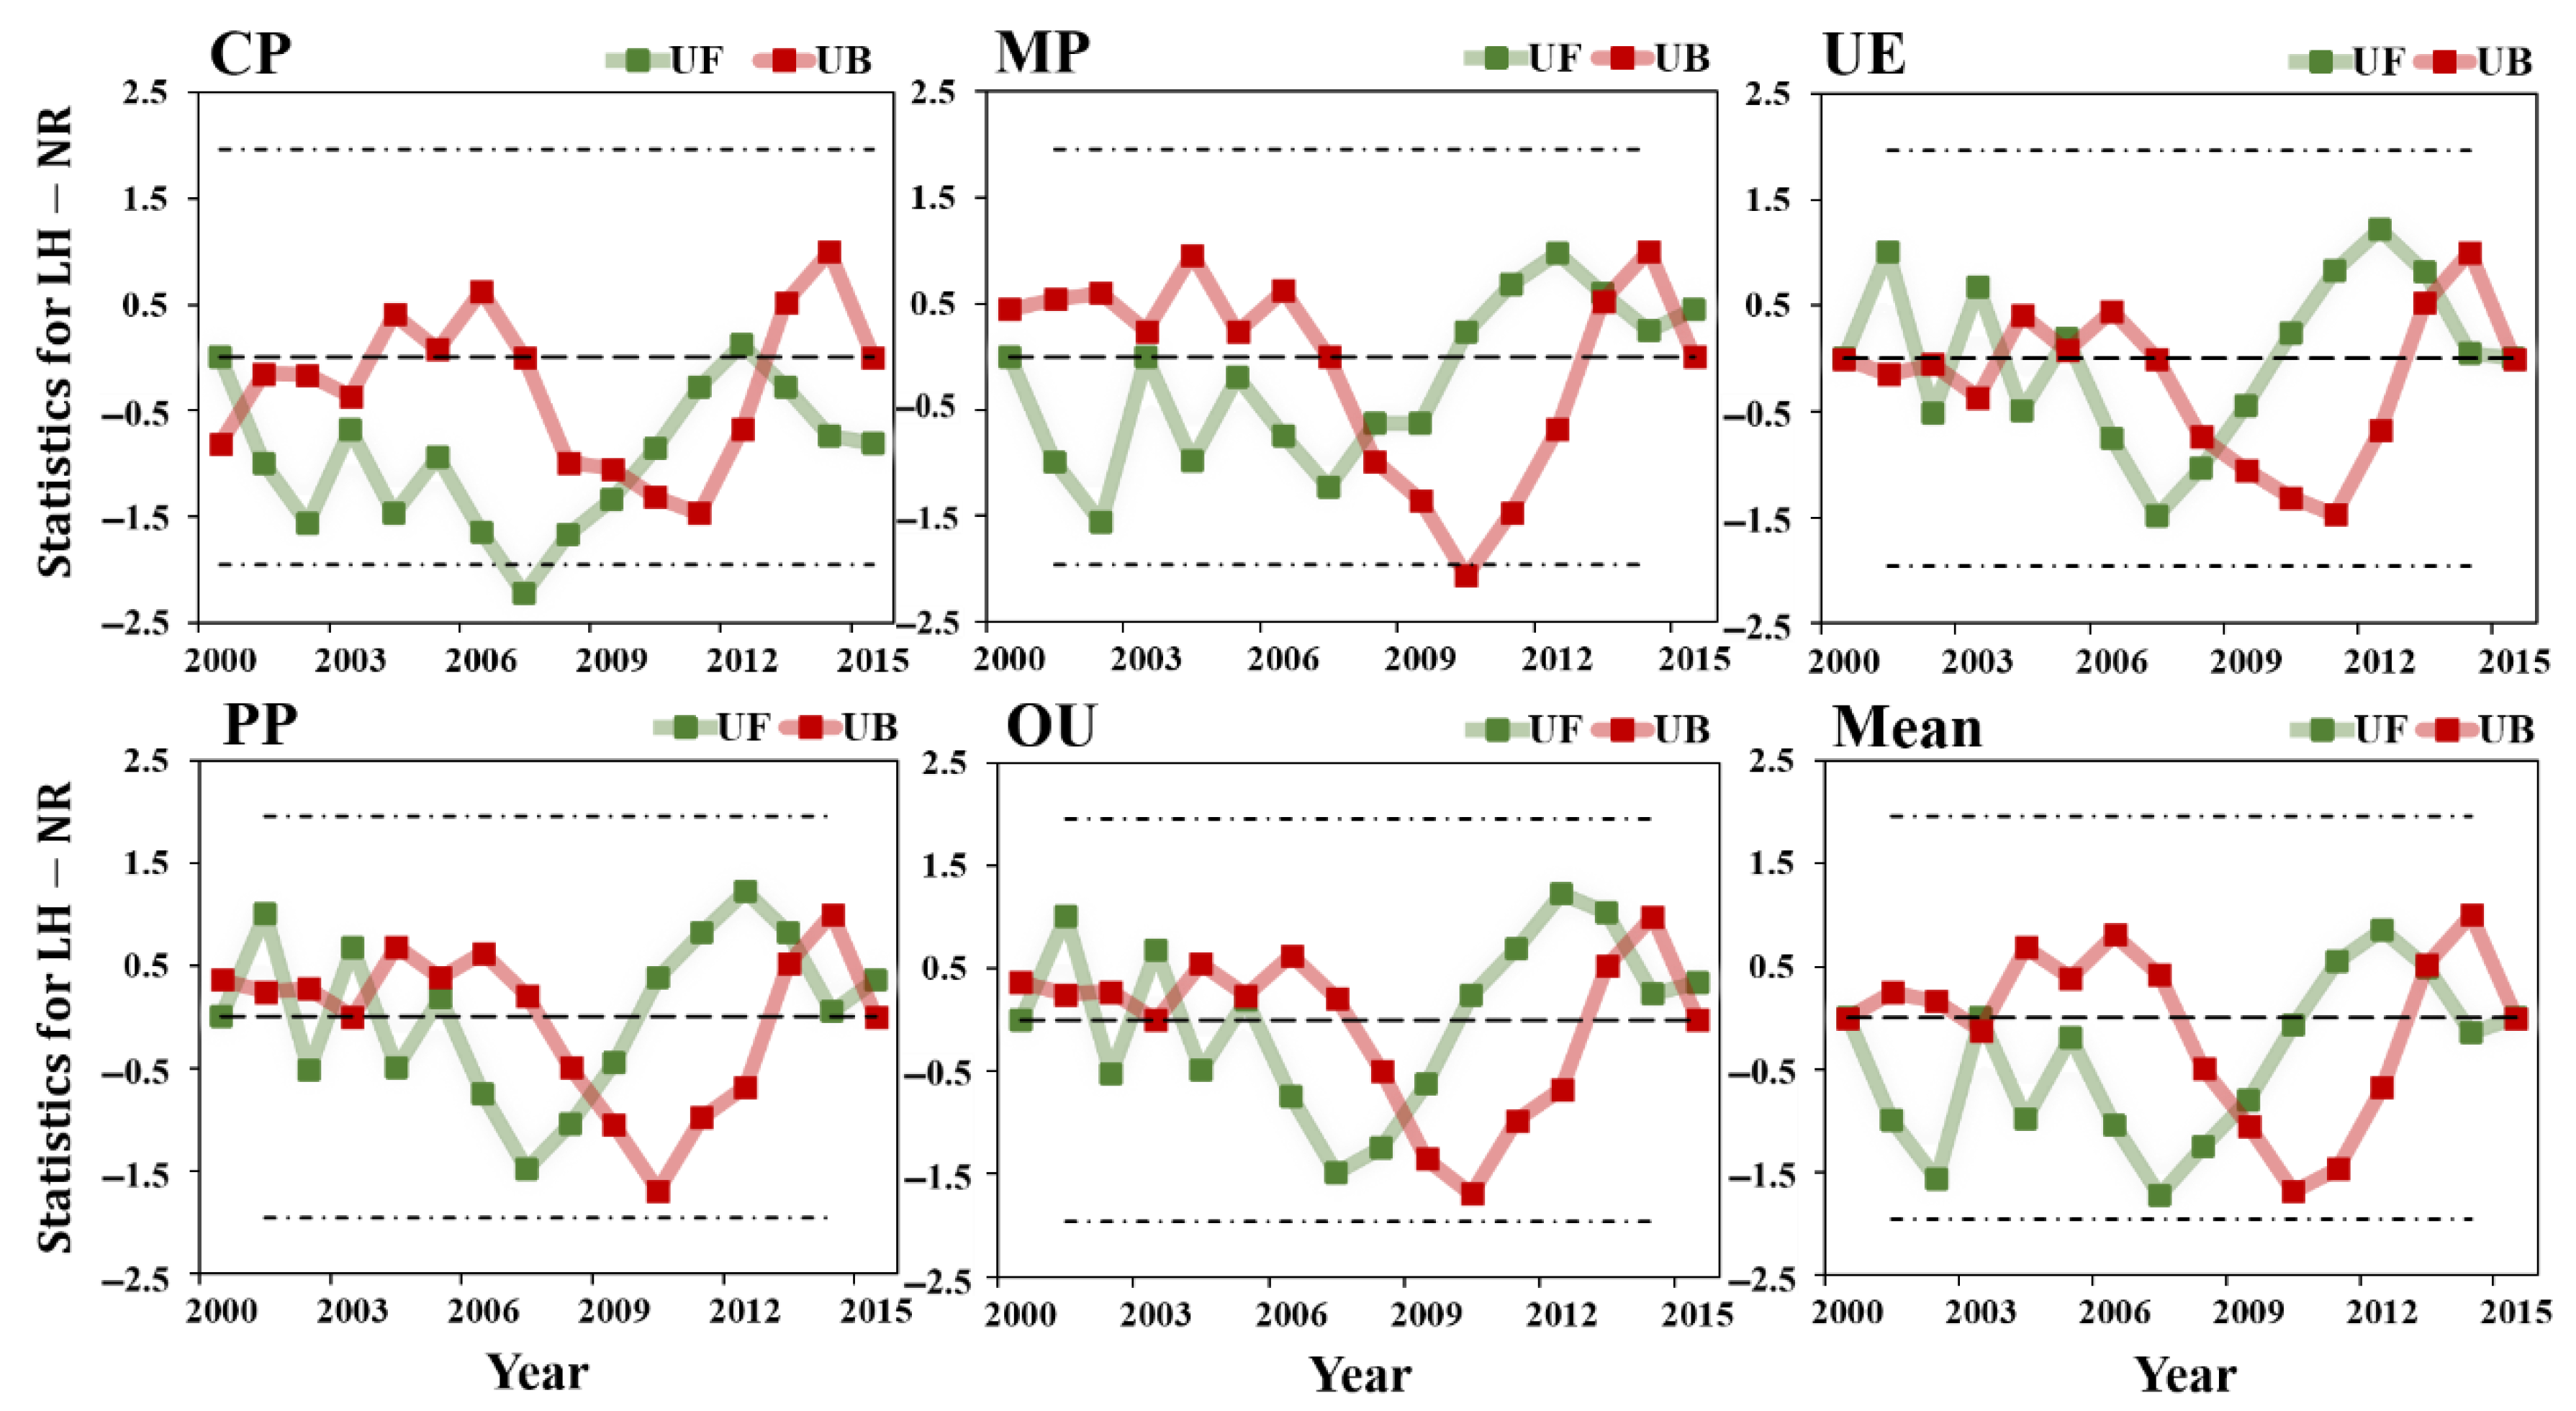
spatial distribution was different from LH, as can be seen from Figure 12 that the value was all negative. The high value area was mainly located in the north, the multi-year average of was −1755.5 , and the five land use types of multi-year average from high to low order were: PP > OU > UE > MP > CP. As shown in Figure 13, the values of the five land-use types showed an upward trend in 2000–2015, with a multi-year trend value of 0.26 for in 2000–2015. Figure 14 showed that the values of in the CP region had been on a brief upward trend since the mutation occurred in 2009, but the UF < 0 was on a decreasing trend, indicating that human activities have a stronger effect on regional warming. Furthermore, the values of in CP and UE areas showed a decreasing trend, while under the influence of irrigation impervious water surface in urban areas increased, indicating that the feedback effect of land use change brought by human activities on regional warming was enhanced.
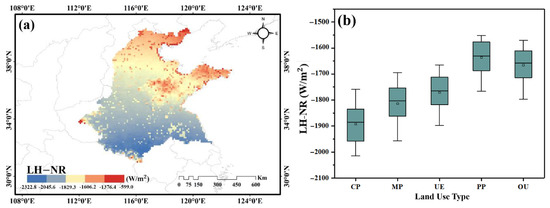
Figure 12.
(a) Spatial variation () and (b) statistical values for the five land use types in the Huang-Huai-Hai River Basin from 2000 to 2015.
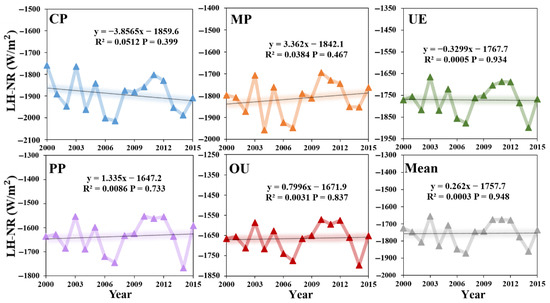
Figure 13.
Variation trends of net radiation () under different land use types in the Huang-Huai-Hai River Basin from 2000 to 2015.
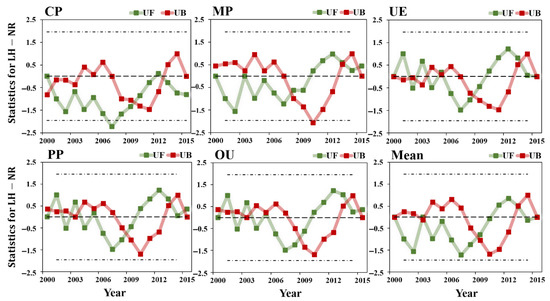
Figure 14.
Mann-Kendall test of net radiation () for different land use types in the Huang-Huai-Hai River Basin from 2000 to 2015.
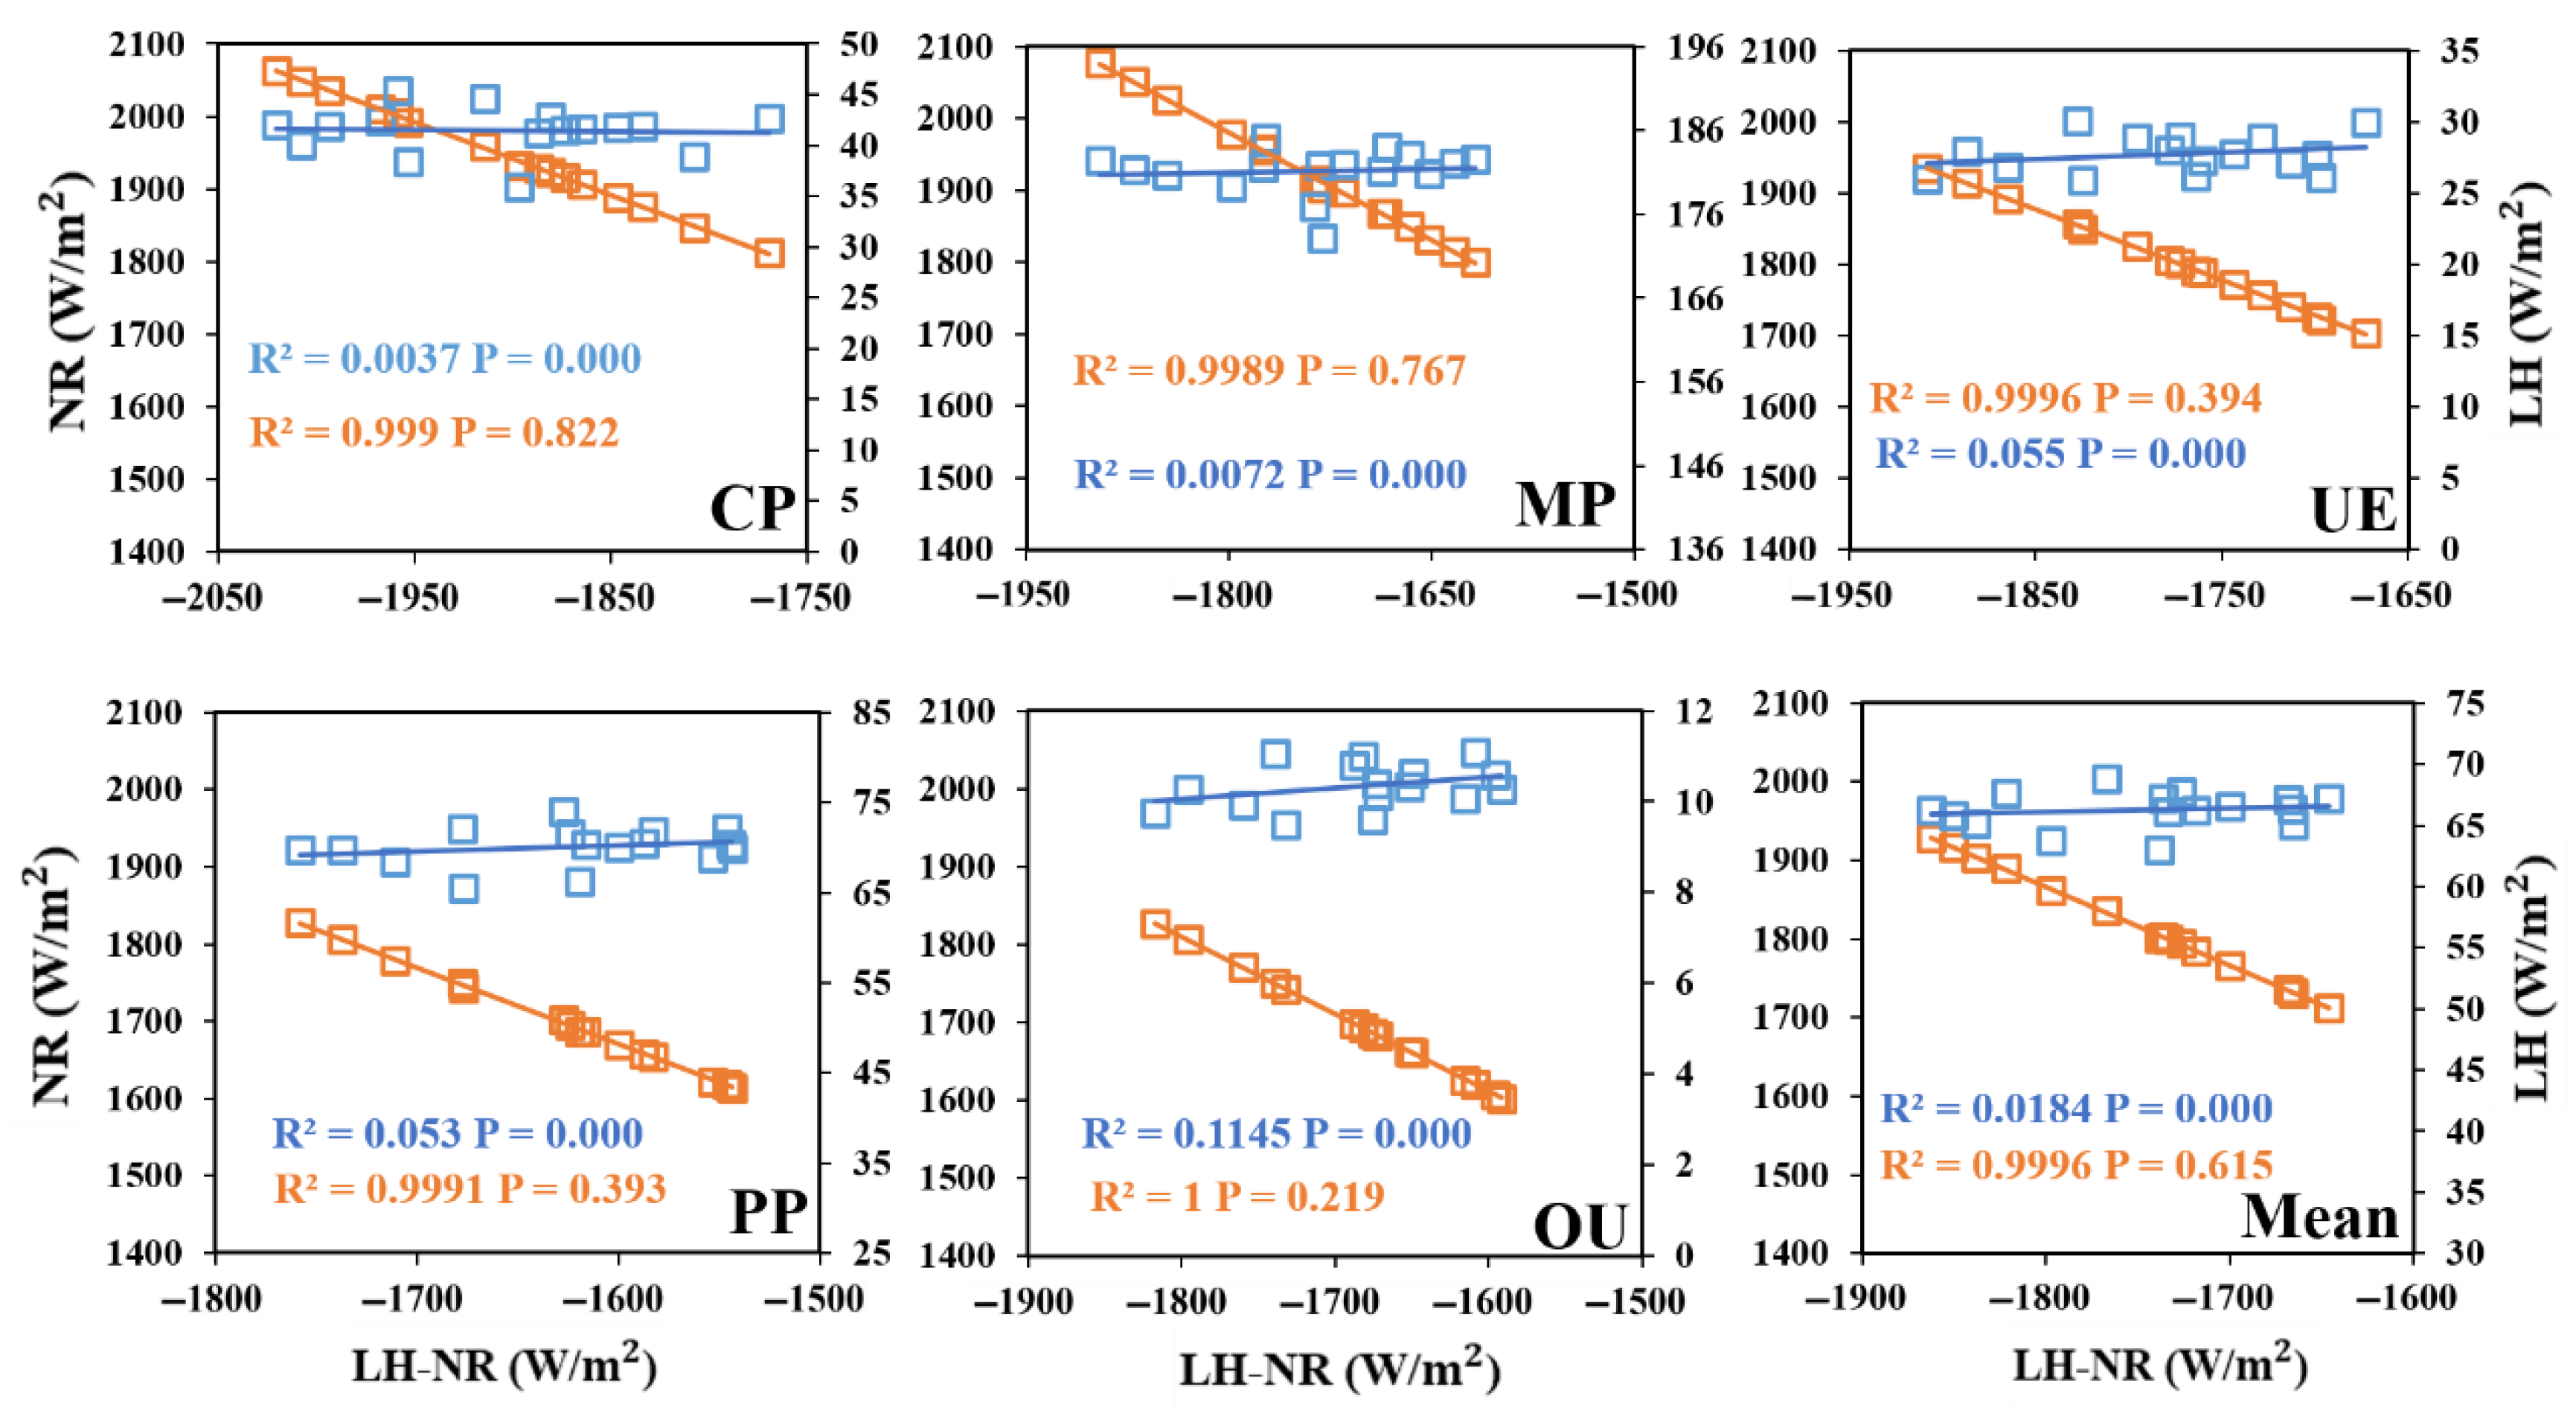
To further clarify the effect of LH or NR on , we compared the relationships between three energy factors. During the study period, the correlation between NR and in the five land use types was greater than that of LH and (Figure 15). and NR were consistent in MP, CP, UE, PP, and OU regions, while and LH were more relevant in OU and PP regions, followed by UE, MP, and CP regions.
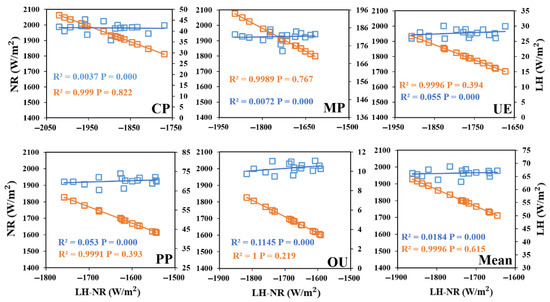
Figure 15.
Correlation between and LH, NR and under the five land types in the Huang-Huai-Hai River Basin from 2000 to 2015 (blue dots and blue lines represent scatter plots with , with LH, orange dots and orange lines represent scatter plots with NR).
In terms of radiation balance, under different land use types was more sensitive to changes in NR and more obvious. Therefore, when considering the results of energy intake and expenditure forced balance caused by LUCC, the importance of factors such as energy absorption caused by biogeophysical factors to the cooling effect cannot be ignored. In other words, adjusting the net radiation factor may have a greater effect on changing the energy intake and expenditure forced balance in the Huang-Huai-Hai River Basin [3].
4. Discussion
With rapid economic development, the land use patterns in the Huang-Huai-Hai River Basin have undergone tremendous changes. These natural processes were disturbed by land reclamation, which was determined by local geophysical processes and socio-economic driving factors [34,35,36]. Besides natural and semi-natural land use, the most obvious change in land use in the study area was the transformation from agricultural land to urban land. Owing to the different vegetation growth conditions among different land use types, the differences between land use types are reflected in biophysical parameters such as albedo, thus resulting in different energy balance effects [37,38]. When discussing the climate effect of land use change from the perspective of radiation balance, we should consider not only the radiation force of albedo, but also the corresponding radiation force of ground and atmosphere [39]. The results show that changes in short-wave radiation associated with patterns of change in the five land use types are not obvious, but with the increase in human activity intensity and after the superposition of long-wave radiation, the NR of each land use type shows a clear pattern of change.
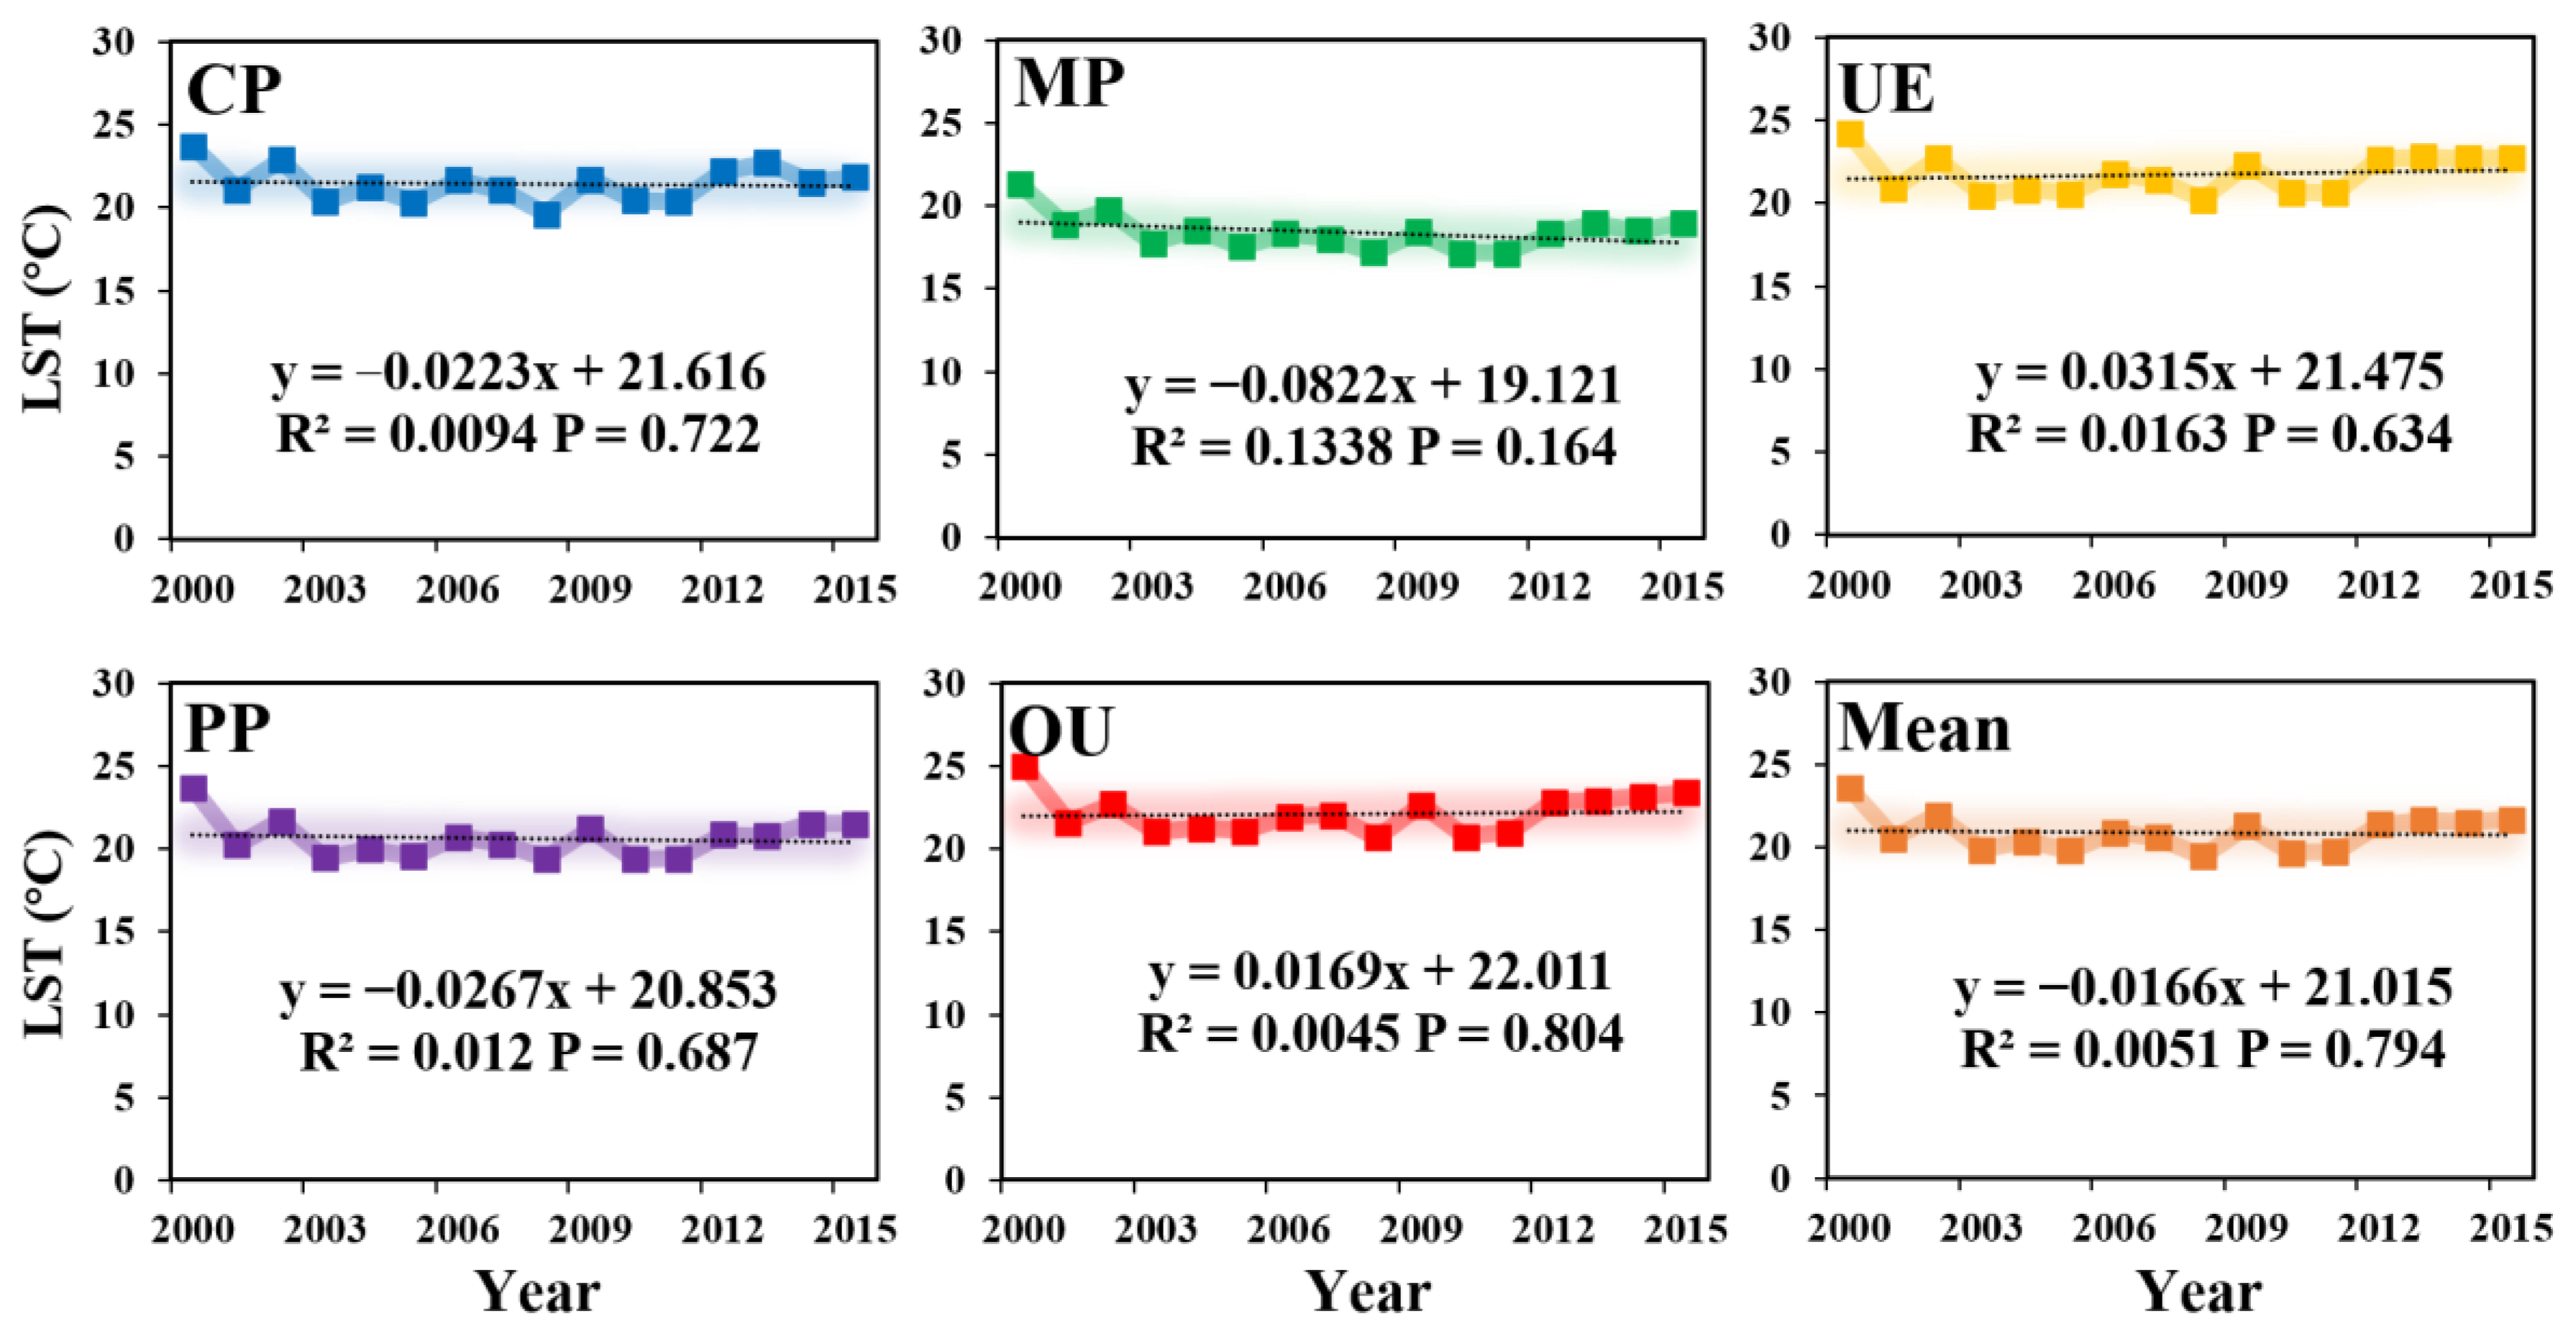
According to the changes in land use types and land surface temperature in the Huang-Huai-Hai River Basin from 2000 to 2015, it can be concluded that the average LST in this area from high to low was: OU > UE > CP > PP > MP (Figure 16). Because of the high surface temperature in the urban conversion areas of the Huang-Huai-Hai River Basin, which are naturally affected by human activities, the temperature in cropland areas occupying a large area was low. From 2000 to 2015, with the feedback of the impact of land use change on regional climate warming, there were also large areas of low temperature, such as the CP areas (Figure 17).
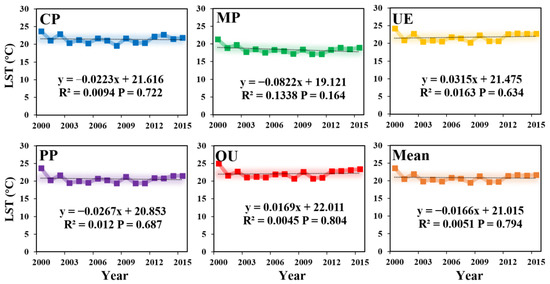
Figure 16.
The trend in land surface temperature (LST) of different land use types in the Huang-Huai-Hai River Basin from 2000 to 2015.
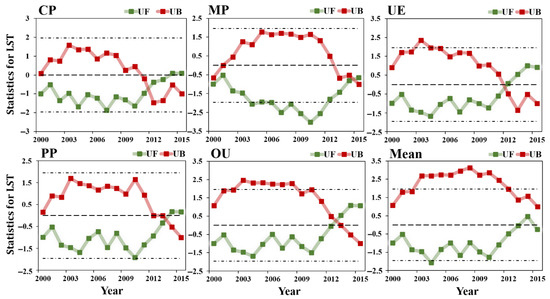
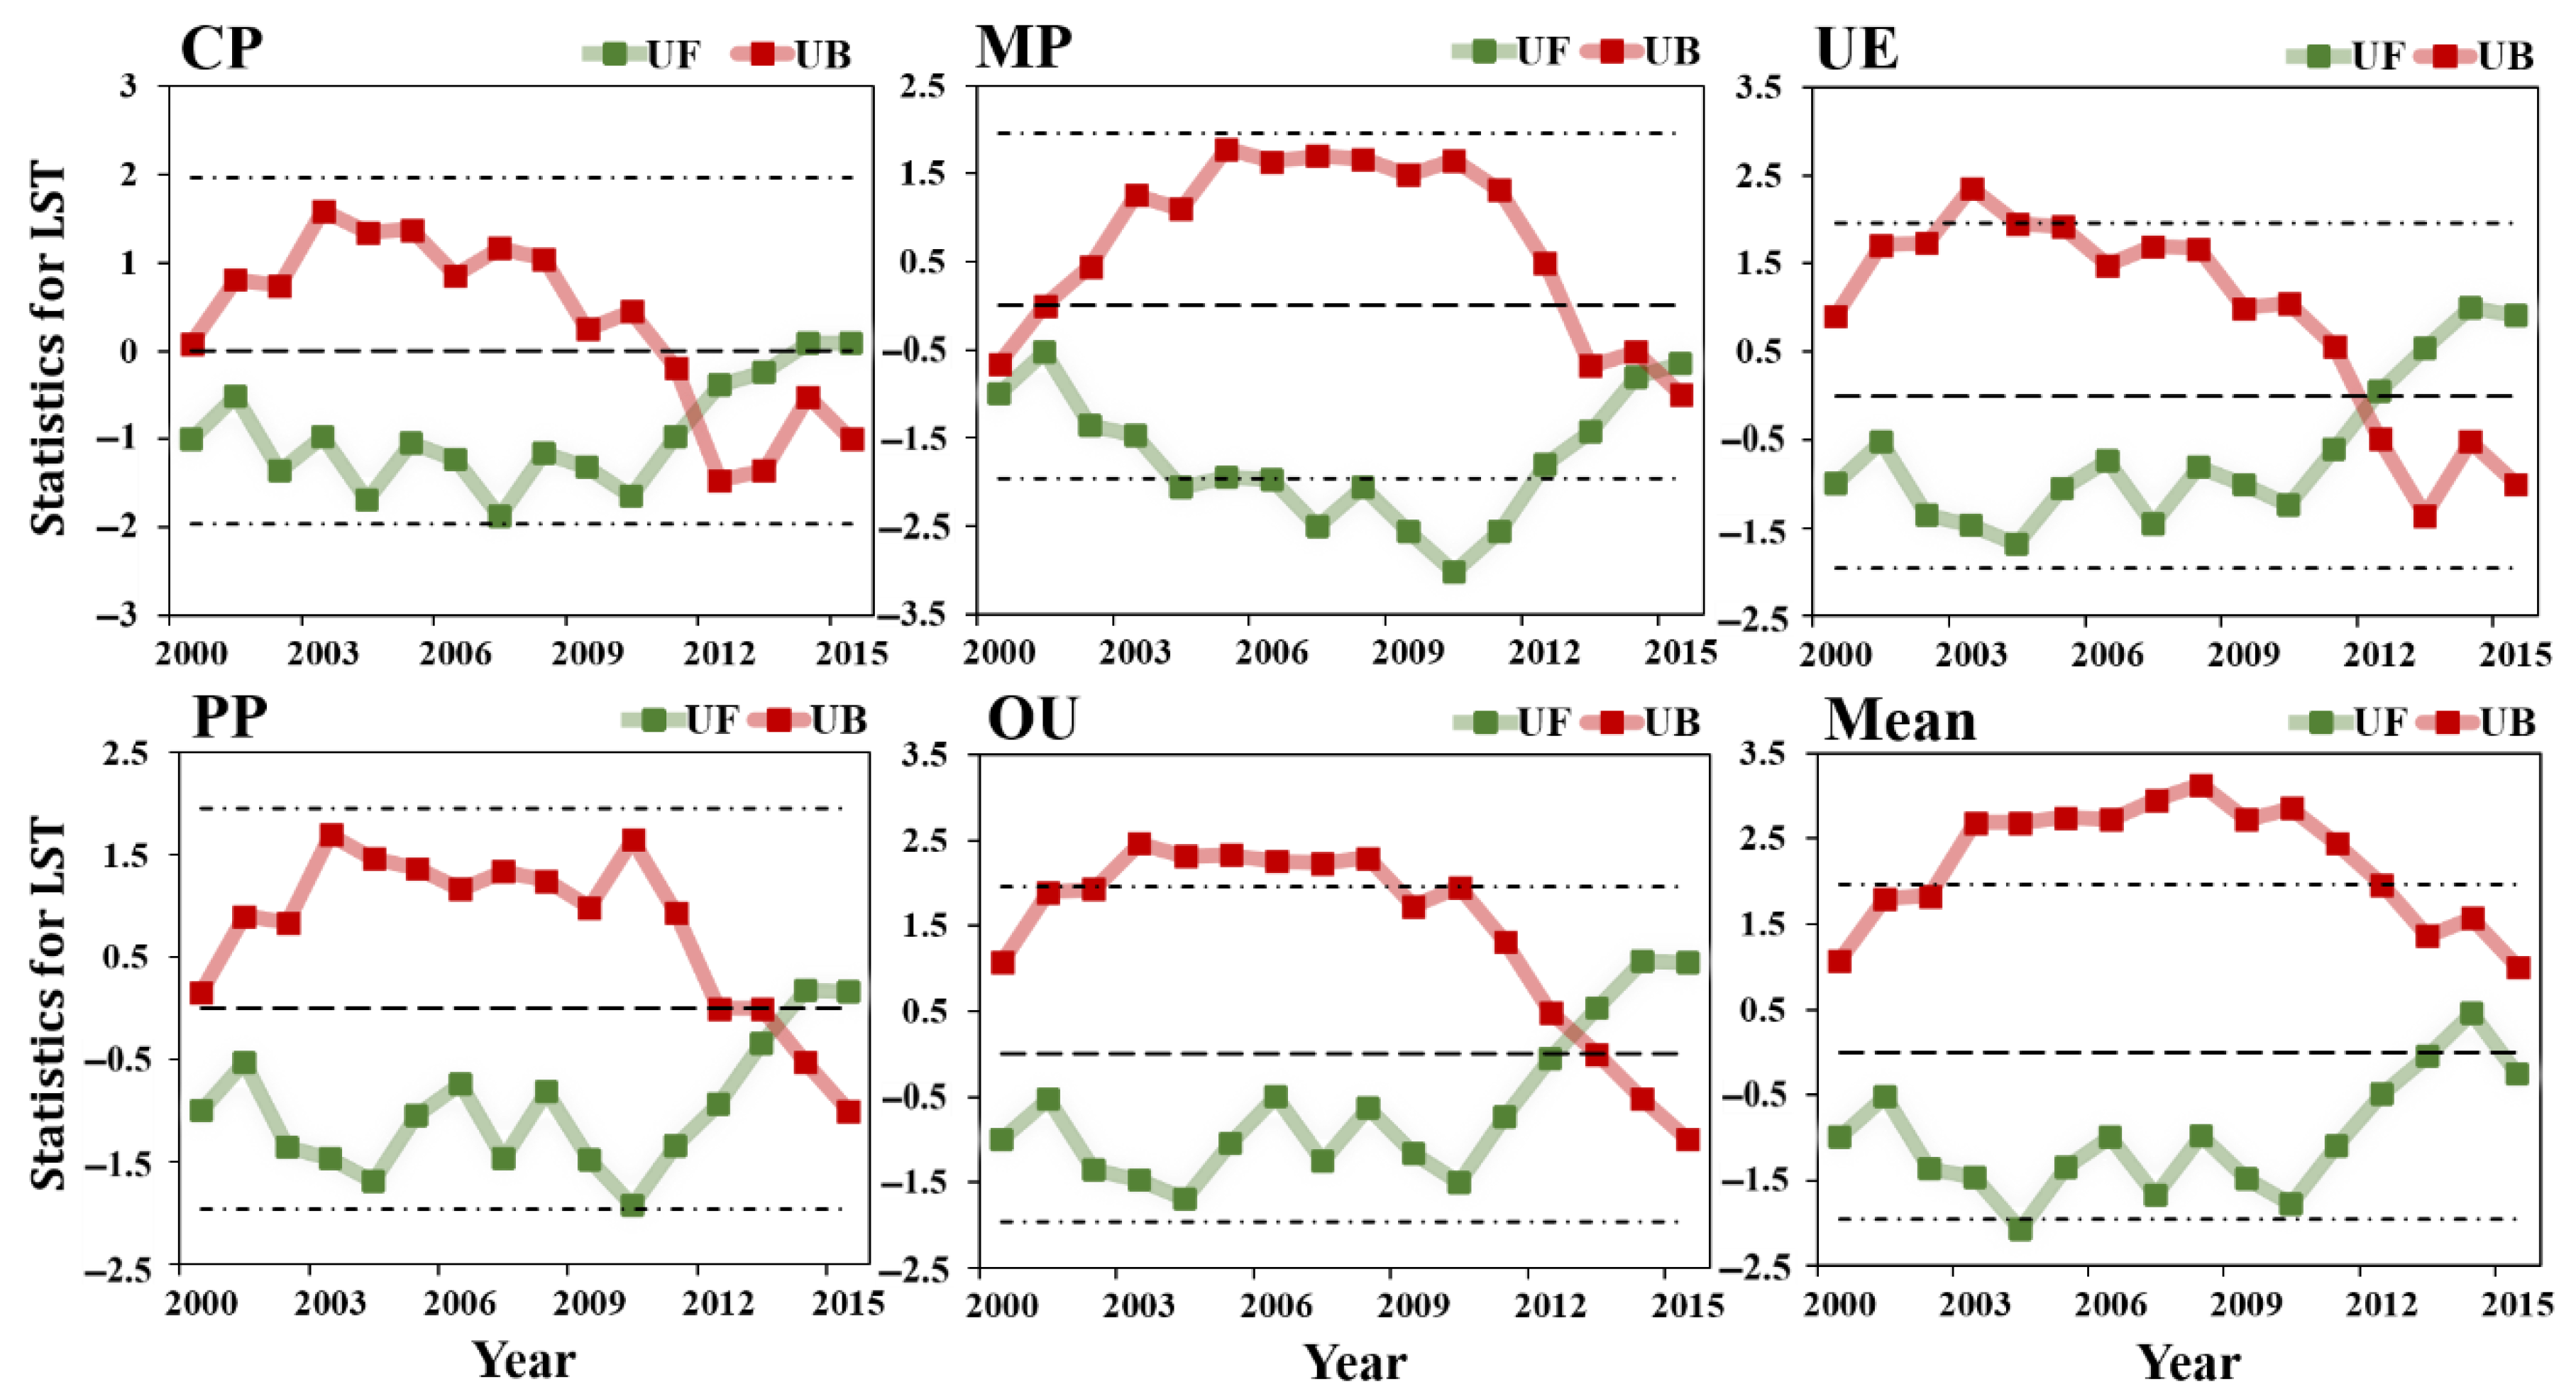
Figure 17.
Mann-Kendall test of land surface temperature (LST) of different land use types in the Huang-Huai-Hai River Basin from 2000 to 2015.
According to the abrupt change test result of land surface temperature (Figure 17), we found that five land types have fewer years of mutation, and the UF of five land use types was less than zero. Although CP, MP, UE, PP, and OU all showed an upward trend to different degrees in 2010, the overall trend showed a decreasing trend. The large area of Huang-Huai-Hai River Basin was cropland (Table 2), indicating that land use change had a great feedback effect on regional climate warming, which was conducive to controlling the rapid increase in surface temperature. Therefore, on the regional scale, it should firstly promote ecological land protection, scientific use of land, rational planning of vegetation land, and then promote the process of urbanization in an orderly manner. From a biogeophysical perspective, it would be helpful for understanding how to formulate sustainable land management strategies.
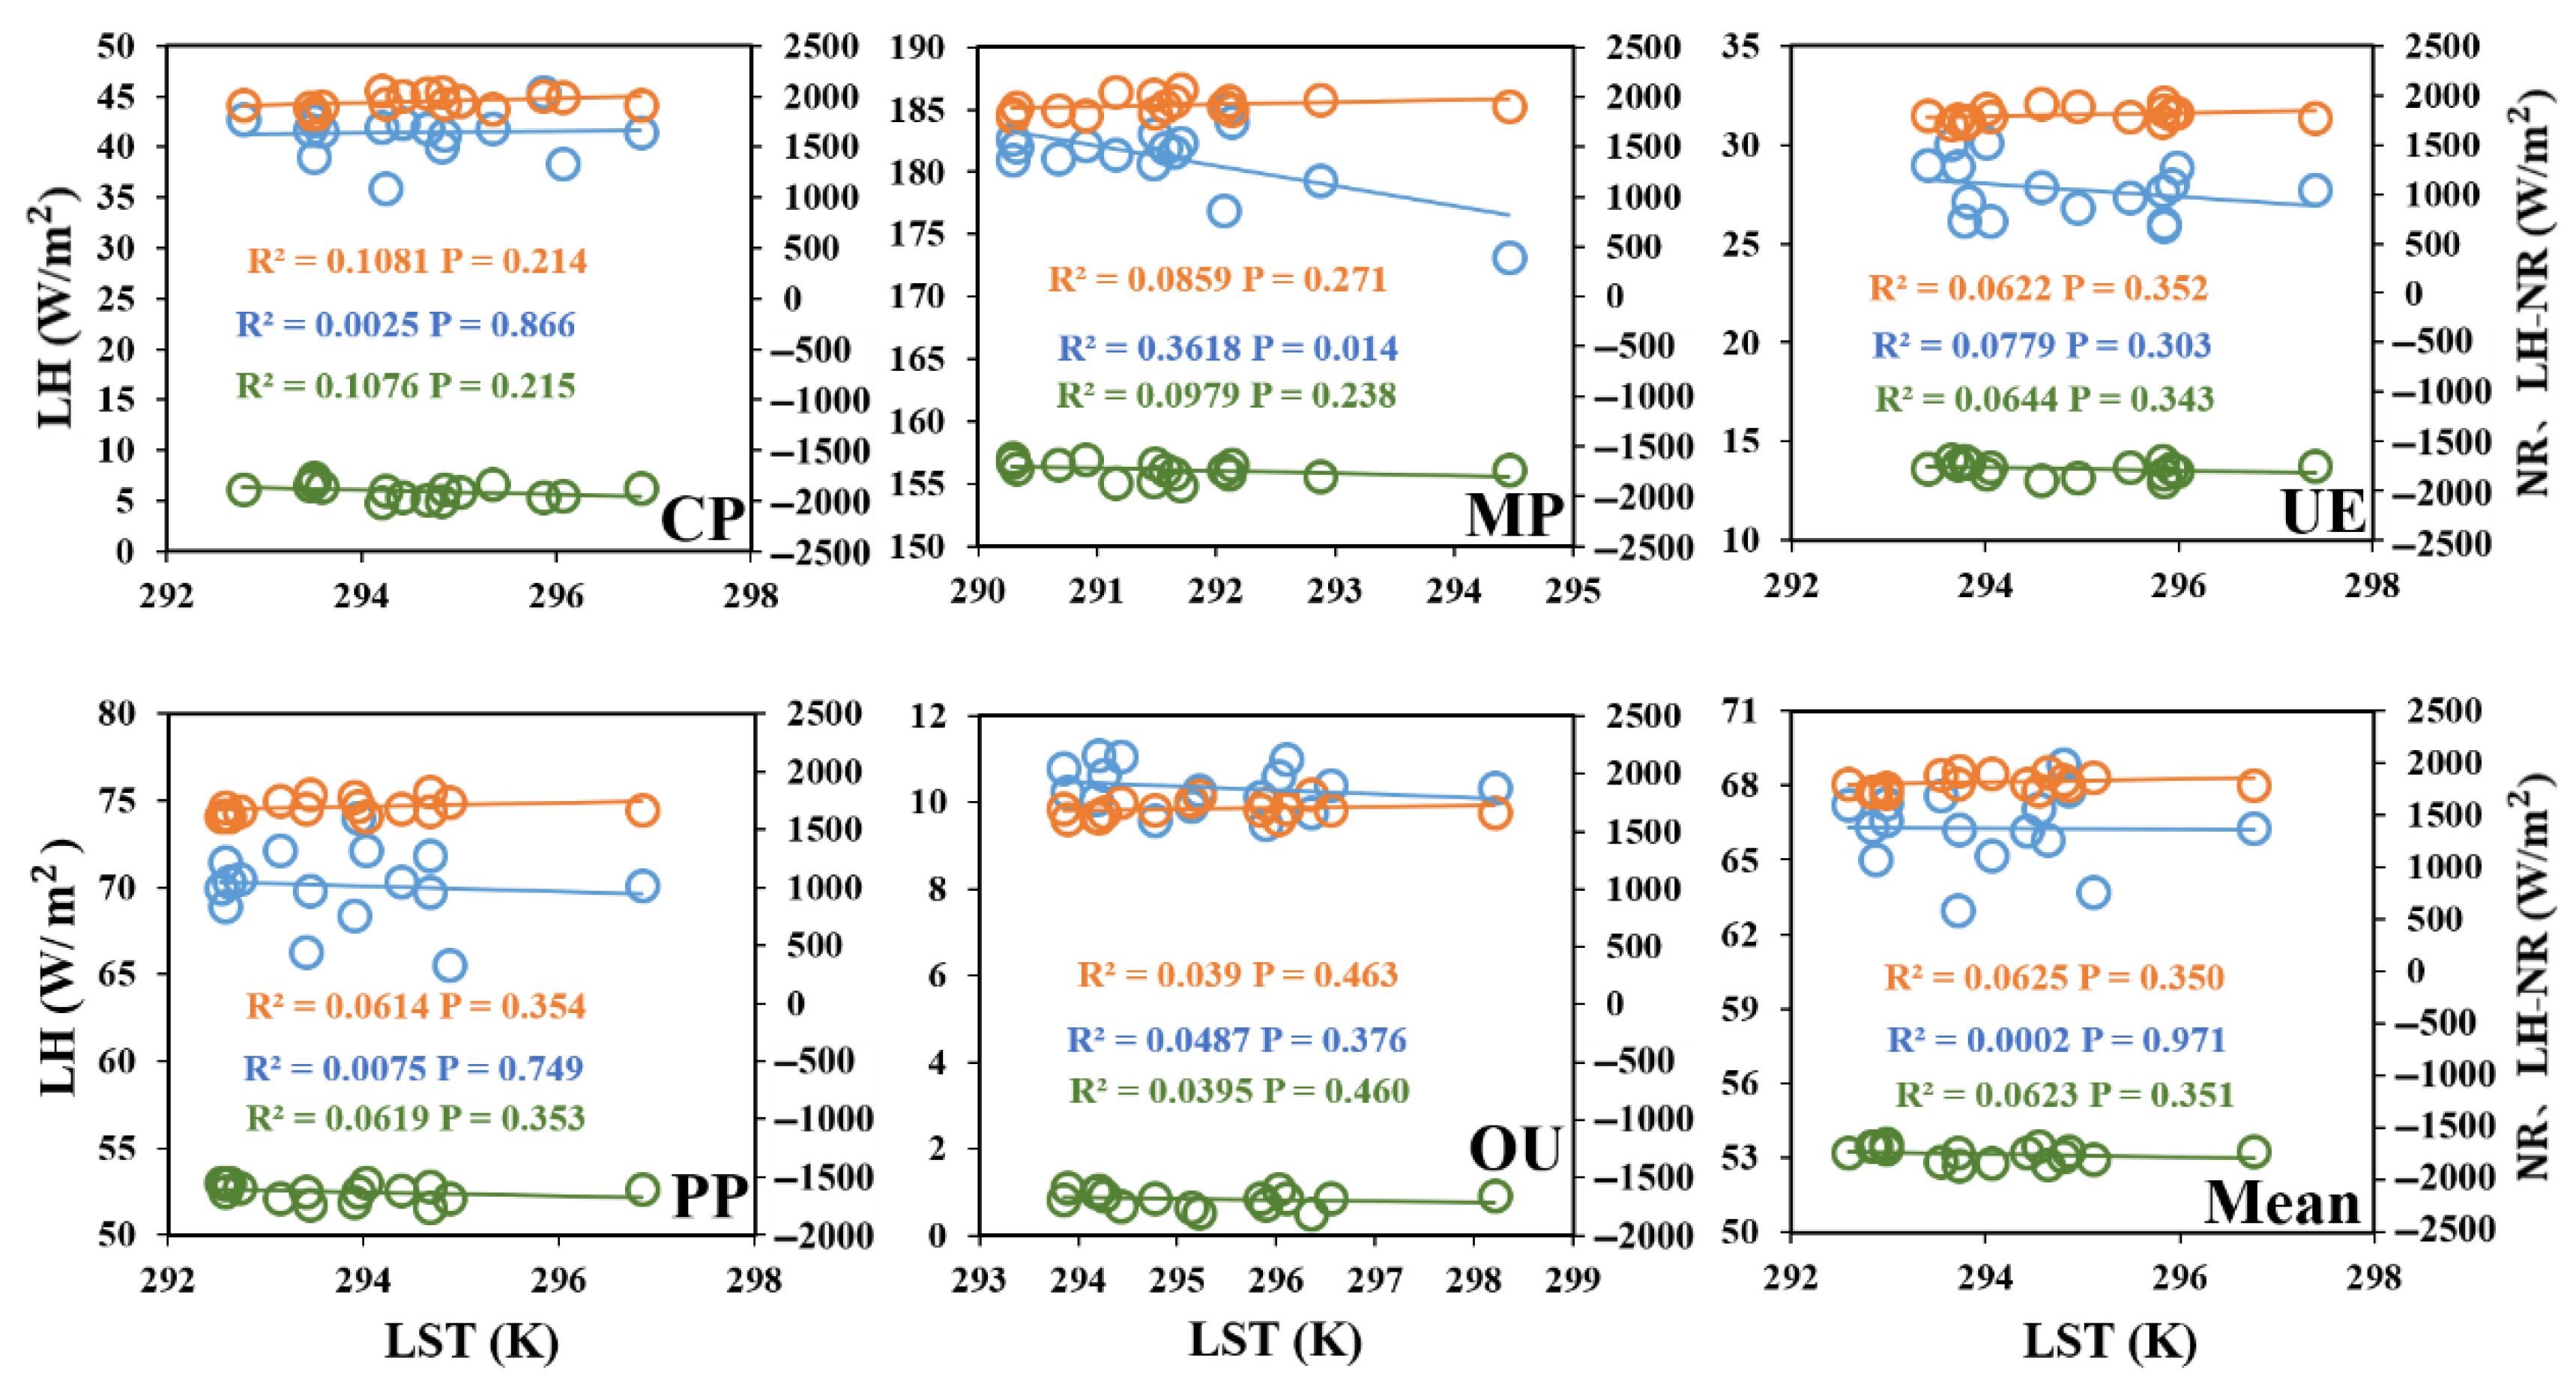
Furthermore, the results showed that was more sensitive to NR than LH in the Huang-Huai-Hai River Basin, which means that energy regulation of NR was greater than LH in this region. By comparing the correlation between LST and NR, LH, , the relationship between energy and temperature were discussed (Figure 18).

Figure 18.
Correlation between LST, NR and in the Huang-Huai-Hai River Basin from 2000 to 2015 (blue dots and blue lines represent LST and NR scatter plots, red dots and red lines represent LST and LH scatter plots, and green dots and green lines represent LST and scatter plots).
As shown in Figure 18, LST and were negatively correlated with NR in five land types. In general, the relationship between LST and was closer, followed by NR and LH, but this relationship did not pass the significance test (p = 0.1). It is worth noting that in the CP, OU and UE regions, the relationship between LST and NR was more significant, indicating that in areas where human activities are dense, the regulatory effect on LST of NR was more pronounced, whereas in the area of natural cropland interoperability, such as MP, the relationship was relatively weak.
Therefore, when analyzing the urban heat island effect, the influence of LH and NR on LST or various land use patterns cannot be ignored. For different types of land use, the spatial scale and scope of the study area may lead to different results. When analyzing the spatial difference of urban thermal environment, the setting of boundary range and land use type will not only affect the intensity of the heat island but also affect the corresponding change in surface temperature of the heat island [14]. Some previous studies have confirmed that compared with climate change, the implementation of ecological projects can promote better vegetation restoration and improve the regional ecological environment [40,41,42,43]. Research shows that land use management is the main driving force for greening the earth [44,45].
5. Summary
The Huang-Huai-Hai River Basin consists of the lower reaches of the Yellow River, Haihe River, Huaihe River and their tributaries, and it is also an important grain producing area in China. According to the different impacts of human activities, the land use types in the Huang-Huai-Hai River Basin were divided into five categories: OU, CP, PP, UE and MP. The differences of NR and LH corresponding to different land use types and changes from 2000 to 2015 were analyzed. Draw the following conclusions:
- (1)
- From 2000 to 2015, the change trend of LH in five land use types was: MP > PP > CP > UE > OU. The NR values of UE and OU areas, which were greatly affected by human activities, were always lower than those of other land use types, and the NR values of CP and MP areas were much higher than those of UE, OU and PP areas. The NR values were generally on the rise, which was in line with the climate background of global warming.
- (2)
- The in different land types of underlying surface showed a decreasing trend, with the OU, PP and UE regions showing a smaller trend than the CP and MP regions. The values of the five land-use types decreased with the increase in intensity of human activities, indicating that human activities weakened the positive trend of and increased the warming effect. The main energy regulation factors of surface temperature of different land use types were also different. With the increase in the intensity of human activities related to land use, the cooling effect of gradually increases.
- (3)
- The change trend of LST in five land use types was: OU > UE > CP > PP > MP. The values of LST in five land use types was higher in OU and UE, while the values of LST was lower in MP. MP refers to the area of mutual transformation between natural and seminatural pixel area and cropland, which is affected by certain human activities, indicating that land use change had a strong feedback effect on regional climate warming, which was conducive to controlling the rapid increase of land surface temperature.
In this study, the surface energy balance mechanism and ecological climate effects of five land use types in the Huang-Huai-Hai Basin in China were analyzed, by using the core methods such as surface energy balance algorithm and Mann-Kendall trend test. The difference in land surface temperature under different LUCC is explained from the point of view of energy budget. And the research shows that there is an obvious difference between energy revenue and expenditure under the influence of human activities. With the increase in the intensity of human activities related to land use, the cooling effect of LH-NR gradually increases. It has reference value for discussing the trend in climate change and the urban heat island effect from the perspective of biogeography. At present, the data and methods based on this study are all obtained on a large regional scale, so it is necessary to quantitatively study its mechanism process on a finer regional scale, which has more concrete practical value for future urban planning.
Author Contributions
Conceptualization, M.Z. and S.Z.; methodology, M.Z., S.Z. and Y.C.; software, M.Z., Q.C. and Y.W.; validation, M.Z., D.L., W.T., X.Z., S.X., S.Y. and Y.W.; formal analysis, Q.C. and S.Z.; investigation, Q.C. and S.Z.; resources, S.Z. and Y.C.; data curation, S.Z. and Y.C.; writing—original draft preparation, M.Z. and S.Z.; writing—review and editing, S.Z. and Y.C.; visualization, Q.C., D.L., W.T., X.Z., S.X. and S.Y.; supervision, S.Z.; project administration, S.Z.; funding acquisition, S.Z. and Y.C. All authors have read and agreed to the published version of the manuscript.
Funding
This research was funded by National Natural Science Foundation of China, grant number 42005102, 42071415. The Second Tibetan Plateau Comprehensive Scientific Expedition, grant number 2019QZKK0104. The Qinghai Science and Technology Department Project, grant number 2020-ZJ-711. The Henan Science & Technology Think Tank Project, grant number HNKJZK-2021-35C. Outstanding Youth Foundation of Henan Natural Science Foundation, grant number 202300410049. National Key Research and Development Program of China, grant number 2021YFE0106700.
Data Availability Statement
The land cover data from ESA with 300 m spatial resolution were used, and the download ad-dress is (http://maps.elie.ucl.ac.be/CCI/viewer/download.php, accessed on 20 May 2021). Solar radiation data is obtained from BESS short-wave radiation products released from the Korean Seoul National University Environmental Ecological Lab. (http://environment.snu.ac.kr, accessed on 20 May 2021). The remote sensing data for albedo, LST, land surface emissivity and LE are all from MODIS data products, provided by NASA, from 2000 to 2015 (https://modis.gsfc.nasa.gov, accessed on 20 May 2021). Temperature interpolation data were obtained from the Resource and Environmental Science Data Centre of the Chinese Academy of Science (http://www.resdc.cn, accessed on 20 May 2021), data link is https://www.resdc.cn/data.aspx?DATAID=228. Water vapor pressure data were obtained from the European Centre for Medium-Range Weather Fore-casts (https://climate.copernicus.eu/, accessed on 20 May 2021).
Acknowledgments
This platform depends on the establishment of Henan University, the Ministry of Education “Yellow River Civilization and Sustainable Development Center” provides sustained support. Thanks also go to reviewers who provided valuable comments to improve the paper.
Conflicts of Interest
The authors declare no conflict of interest.
References
- Chen, S.; Lv, S.; Ao, Y.; Zhang, Y.; Li, S.; Shang, L.; Ma, D. Characteristics of Radiation and Energy Budget over an Oasis under Different Synoptic and Irrigation Conditions in Summer. J. Glaciol. Geocryol. 2011, 33, 532–538. [Google Scholar]
- Zhu, D.; Chen, W.; Liu, H.; Huang, R. Comparison of Characteristics of Surface Radiation Energy Budget between Typical Arid Area and Plateau in Northwest my country. Clim. Environ. Res. 2006, 6, 683–690. [Google Scholar]
- Chi, Q.; Zhou, S.; Wang, L.; Zhu, M.; Liu, D.; Tang, W.; Cui, Y.; Lee, J. Exploring on the Eco-Climatic Effects of Land Use Changes in the Influence Area of the Yellow River Basin from 2000 to 2015. Land 2021, 10, 601. [Google Scholar] [CrossRef]
- Huang, L.; Zhai, J.; Sun, C.Y.; Liu, J.Y.; Ning, J.; Zhao, G.S. Biogeophysical Forcing of Land-Use Changes on Local Temperatures across Different Climate Regimes in China. J. Clim. 2018, 31, 7053–7068. [Google Scholar] [CrossRef]
- Qiu, L.; Wu, Y.; Yu, M.; Shi, Z.; Yin, X.; Song, Y.; Sun, K. Contributions of vegetation restoration and climate change to spatiotemporal variation in the energy budget in the loess plateau of china. Ecol. Indic. 2021, 127, 107780. [Google Scholar] [CrossRef]
- Bazame, R.; Tanrvermis, H.; Kapusuz, Y.E. Land management and sustainable use of land resources in the case of Burkina Faso. Land Degrad. Dev. 2019, 30, 608–621. [Google Scholar] [CrossRef]
- Zhao, W.; Liu, X.; Deng, Q.; Li, D.; Xu, J.; Li, M.; Cui, Y. Spatial Association of Urbanization in the Yangtze River Delta, China. Int. J. Environ. Res. Public Health 2020, 17, 7276. [Google Scholar] [CrossRef] [PubMed]
- Cui, Y.; Liu, J.; Hu, Y.; Wang, J.; Kuang, W. Modeling the radiation balance of different urban underlying surfaces. Chin. Sci. Bull. 2012, 57, 1046–1054. [Google Scholar] [CrossRef] [Green Version]
- Zhang, X.; Zheng, J.; He, F.; Wang, Z. Application of MODIS BRDF/Albedo data in temperature simulation in China. Acta Geogr. Sin. 2011, 66, 356–366. [Google Scholar]
- Wang, Z.; Zhao, T.; Hou, M.; Yan, X. Analysis on the Characteristics of Vegetation Changes in Northern China at the Beginning of the 21st Century. Clim. Environ. Res. 2013, 2, 156–164. [Google Scholar]
- Zheng, Y.; Huang, L.; Zhai, J. Comparison of the influence of land surface cover changes on the surface albedo in four countries. J. Remote Sens. 2020, 24, 917–932. [Google Scholar]
- Zhang, G.; Zhang, J.; Meng, P. Estimation of kilometer-scale heat fluxes over a hilly area in Northern China using an optical-microwave scintillometer. Agric. Water Manag. 2021, 244, 106582. [Google Scholar] [CrossRef]
- Bian, Z.; Roujean, J.; Cao, B.; Du, Y.; Li, H.; Gamet, P.; Fang, J.; Xiao, Q.; Liu, Q. Modeling the directional anisotropy of fine-scale TIR emissions over tree and crop canopies based on UAV measurements. Remote Sens. Environ. 2021, 252, 112150. [Google Scholar] [CrossRef]
- Cao, J.; Zhou, W.; Zheng, Z.; Ren, T.; Wang, W. Within-city spatial and temporal heterogeneity of air temperature and its relationship with land surface temperature. Landsc. Urban Plan. 2021, 206, 103979. [Google Scholar] [CrossRef]
- Tang, X.; Cui, Y.; Li, N.; Fu, Y.; Liu, X.; Run, Y.; Li, M.; Zhao, G.; Dong, J. Human Activities Enhance Radiation Forcing through Surface Albedo Associated with Vegetation in Beijing. Remote Sens. 2020, 12, 837. [Google Scholar] [CrossRef] [Green Version]
- Moges, D.M.; Bhat, H.G. An insight into land use/cover changes and their impacts in Rib watershed, North-western highland Ethiopia. Land Degrad. Dev. 2018, 29, 3317–3330. [Google Scholar] [CrossRef]
- Yao, Y.; Chen, X.; Qian, J. Research progress on the thermal environment of the urban surfaces. Acta Ecol. Sin. 2018, 38, 1134–1147. [Google Scholar]
- Hu, X.; Cai, M.; Yang, S.; Sergio, A.S. Air temperature feedback and its contribution to global warming. Sci. China Earth Sci. 2018, 61, 1491–1509. [Google Scholar] [CrossRef]
- Cui, Y.; Michael, M.E.; Li, N.; Fu, Y.; Zhao, G.; Dong, J. Land Cover Change Intensifies Actual and Potential Radiative Forcing through CO2 in South and Southeast Asia from 1992 to 2015. Int. J. Environ. Res. Public Health 2019, 16, 2460. [Google Scholar] [CrossRef] [PubMed] [Green Version]
- Wang, M.; Han, Z.; Zhang, Q. The Impact of Land Use Change on Surface Temperature in the Semi-arid Area of Northern China at the Beginning of the 21st Century. Clim. Environ. Res. 2016, 21, 65–77. [Google Scholar]
- Stenseth, N.C.; Mysterud, A.; Ottersen, G.; Hurrell, J.W.; Chan, K.; Lima, M. Ecological Effects of Climate Fluctuations. Science 2002, 297, 1292–1296. [Google Scholar] [CrossRef] [PubMed] [Green Version]
- Zhou, S.; Wang, K.; Yang, S.; Li, W.; Zhang, Y.; Zhang, B.; Fu, Y.; Liu, X.; Run, Y.; Chubwa, O.G.; et al. Warming Effort and Energy Budget Difference of Various Human Land Use Intensity: Case Study of Beijing, China. Land 2020, 9, 280. [Google Scholar] [CrossRef]
- Benali, A.; Carvalho, A.C.; Nunes, J.P.; Carvalhais, N.; Santos, A. Estimating air surface temperature in Portugal using MODIS LST data. Remote Sens. Environ. 2012, 124, 108–121. [Google Scholar] [CrossRef]
- Cao, Q.; Yu, D.; Sun, Y.; He, R.; Liu, Y.; Liu, Y. Research Progress on the Quantitative Relationship between Land-Use/Land-CoverChange and Climate Change. J. Nat. Resour. 2015, 30, 880–890. [Google Scholar]
- Ma, T.; Li, X.; Bai, J.; Cui, B. Tracking three decades of land use and land cover transformation trajectories in Chinese large river deltas. Land Degrad. Dev. 2019, 30, 799–810. [Google Scholar] [CrossRef]
- Liu, Y.; Long, H. Land use transitions and their dynamic mechanism: The case of the Huang-Huai-Hai Plain. J. Geogr. Sci. 2016, 26, 515–530. [Google Scholar] [CrossRef] [Green Version]
- Shi, S.; Han, Y.; Yu, W.; Cao, Y.; Cai, W.; Yang, P.; Wu, W.; Yu, Q. Spatio-temporal differences and factors influencing intensive cropland use in the Huang-Huai-Hai Plain. J. Geogr. Sci. 2018, 28, 1626–1640. [Google Scholar] [CrossRef] [Green Version]
- Chi, Q.; Zhou, S.; Wang, L.; Zhu, M.; Liu, D.; Tang, W.; Zhao, X.; Xu, S.; Ye, S.; Lee, J.; et al. Quantifying the Contribution of LUCC to Surface Energy Budget: A Case Study of Four Typical Cities in the Yellow River Basin in China. Atmosphere 2021, 12, 1374. [Google Scholar] [CrossRef]
- Geeta, S.J.; Payal, M. Assessment of seasonal climate transference and regional influential linkages to land cover–Investigation in a river basin. J. Atmos. Sol. Terr. Phys. 2020, 199, 105209. [Google Scholar]
- Mostafa, A.M.; Gamal, S.E.A.; Mohamed, E.E. Impact of climate change on rainfall variability in the Blue Nile basin. Alex Eng. J. 2021, 61, 3265–3275. [Google Scholar]
- Wang, J.; Liu, J.; Wang, Y.; Liao, Z.; Sun, P. Spatiotemporal variations and extreme value analysis of significant wave height in the South China Sea based on 71-year long ERA5 wave reanalysis. Appl. Ocean Res. 2021, 113, 102750. [Google Scholar] [CrossRef]
- Mann, H.B. Nonparametric Tests against Trend. Econometrica 2013, 3, 245–259. [Google Scholar] [CrossRef]
- Burak, A.; Berna, A. Spatial variability of long-term trends of significant wave heights in the Black Sea. Appl. Ocean Res. 2018, 79, 20–35. [Google Scholar]
- Wang, Y.; Zhao, X.; Xue, X.; Niu, J.; Wang, Y. Remote Sensing Retrieval Analysis of Surface Heat Flux in Nanjing Area. Ecol. Environ. Sci. 2016, 25, 636–646. [Google Scholar]
- Nayak, S.; Maity, S.; Singh, K.S.; Nayak, H.P.; Dutta, S. Influence of the Changes in Land-Use and Land Cover on Temperature over Northern and North-Eastern India. Land 2021, 10, 52. [Google Scholar] [CrossRef]
- Yang, L.; Ren, Q.; Zheng, K.; Jiao, Z.; Ruan, X.; Wang, Y. Migration of heavy metals in the soil-grape system and potential health risk assessment. Sci. Total Environ. 2022, 806, 150646. [Google Scholar] [CrossRef]
- Chen, W.; Meng, H.; Song, H.; Zheng, H. Progress in Dust Modelling, Global Dust Budgets, and Soil Organic Carbon Dynamics. Land 2022, 11, 176. [Google Scholar] [CrossRef]
- Liu, D.; Zhou, S.; Wang, L.; Chi, Q.; Zhu, M.; Tang, W.; Zhao, X.; Xu, S.; Ye, S.; Lee, J.; et al. Research on the Planning of an Urban Ventilation Corridor Based on the Urban Underlying Surface Taking Kaifeng City as an Example. Land 2022, 11, 206. [Google Scholar] [CrossRef]
- Javier, H.; Raúl, G.; Esteban, J.; Marcelo, N. Surface albedo raise in the South American Chaco: Combined effects of deforestation and agricultural changes. Agr. Forest Meteorol. 2017, 232, 118–127. [Google Scholar]
- Zhou, Y.; Yue, D.; Guo, J.; Chao, Z.; Meng, X. Assessing the impact of land conversion and management measures on the net primary productivity in the Bailong River Basin, in China. Catena 2021, 207, 105672. [Google Scholar] [CrossRef]
- Chen, W.; Xu, Q.; Zhao, K.; Zhou, X.; Li, S.; Wang, J.; Wang, X.; Xu, J. Spatial analysis of land-use management for gully land consolidation on the Loess Plateau in China. Ecol. Indic. 2020, 117, 106633. [Google Scholar] [CrossRef]
- Sadahisa, K.; Huang, W. Land use management recommendations for reducing the risk of downstream flooding based on a land use change analysis and the concept of ecosystem-based disaster risk reduction. J. Environ. Manag. 2021, 287, 112341. [Google Scholar]
- Qu, S.; Wang, L.C.; Lin, A.W.; Yu, D.Q.; Yuan, M.X.; Li, C.A. Distinguishing the impacts of climate change and anthropogenic factors on vegetation dynamics in the Yangtze River Basin. China. Ecol. Indic. 2020, 108, 105724. [Google Scholar] [CrossRef]
- Chen, C.; Park, T.; Wang, X.; Piao, S.; Xu, B.; Chaturvedi, R.K.; Fuchs, R.; Brovkin, V.; Ciais, P.; Fensholt, R.; et al. China and India lead in greening of the world through land-use management. Nat. Sustain. 2019, 2, 122–129. [Google Scholar] [CrossRef]
- Mendoza-Ponce, A.; Corona-Núñez, R.O.; Nava, L.F.; Estrada, F.; Calderón-Bustamante, O.; Martínez-Meyer, E.; Carabias, J.; Larralde-Corona, A.H.; Barrios, M.; Pardo-Villegas, P.D. Impacts of land management and climate change in a developing and socioenvironmental challenging transboundary region. J. Environ. Manag. 2021, 300, 113748. [Google Scholar] [CrossRef]


Publisher’s Note: MDPI stays neutral with regard to jurisdictional claims in published maps and institutional affiliations. |
© 2022 by the authors. Licensee MDPI, Basel, Switzerland. This article is an open access article distributed under the terms and conditions of the Creative Commons Attribution (CC BY) license (https://creativecommons.org/licenses/by/4.0/).