Article

Exploring on the Eco-Climatic Effects of Land Use Changes in the Influence Area of the Yellow River Basin from 2000 to 2015

1
Key Laboratory of Geospatial Technology for the Middle and Lower Yellow River Regions (Henan University), Ministry of Education, Kaifeng 475004, China
2
Key Laboratory of Integrative Prevention of Air Pollution and Ecological Security of Henan Province, Kaifeng 475004, China
3
Henan Key Laboratory of Earth System Observation and Modeling, Henan University, Kaifeng 475004, China
4
Weather Modiflcation Office of Qinghai Province, Xining 810001, China
5
Department of Geography, Kent State University, Kent, OH 44242, USA
*
Author to whom correspondence should be addressed.
Land 2021, 10(6), 601; https://doi.org/10.3390/land10060601
Submission received: 28 March 2021 / Revised: 11 May 2021 / Accepted: 28 May 2021 / Published: 5 June 2021
(This article belongs to the Special Issue Land Use and Climate Change)

Abstract

:
The Yellow River is the second largest river in China, and the provinces and cities affected by the Yellow River are called the Yellow River Basin influence area. The relationship between land use and surface thermal effects in the influence area of the Yellow River Basin from 2000 to 2015 was analyzed using MODIS remote sensing data and an energy balance algorithm. The results showed that: (1) net radiation and latent heat flux both increased, and the high value areas were located in the urban expansion areas and natural and seminatural areas, respectively; (2) net surface energy intake showed a upward trend, and increased as the intensity of human influence increased, indicating that human activities had strengthed the positive trend of net surface energy intake and increased the warming effect; (3) net radiation had a greater impact on surface energy intake than latent heat flux, and this relationship was more obvious in land use types that were greatly affected by human activities. This study emphasizes the difference in energy budgets of different land use types under the influence of human activities. It provides a theoretical basis for judging the climate change trend and urban heat island effect in the influence area of the Yellow River Basin from the perspective of biogeophysics.

1. Introduction

The surface energy exchange process is a link between land–air energy conversions and is characterized by surface radiation and the thermal balance which are closely related to solar radiation, ecological change and human activities [1,2]. The impact of these natural or anthropogenic factors on climate change is mainly realized through variations in surface radiation and the energy balance. Moreover, their responses to climate change are reflected in the surface radiation and energy balance processes [3]. Thus, factors that represent the forcing process in these mechanisms, such as the surface albedo and latent heat flux, play an important role in the surface energy balance.
Since the mechanism of the surface energy balance is complicated, to estimate the surface energy budget processes under various land use types or conditions, other variables are needed that can reflect the effect caused by surface albedo and the latent heat flux (LE) [4], such as the land use and cover change (LUCC) and land surface temperature (LST). Because surface albedo can directly alter the solar radiation absorbed by the surface, it can cause changes in the long-wave radiation and latent heat from the surface to the atmosphere and sequentially influence the temperature in other regions through atmospheric advection processes [5]. As one of the important parameters of land surface process models and climate models [6], small changes in surface albedo, such as a global planetary albedo change of 5%, can profoundly affect the surface energy balance and global surface temperature [7,8].
However, if extra energy is used in evapotranspiration when the solar radiation absorption is increased by more vegetation, a cooling effect may appear [9]. Therefore, the LE, which is proportional to evapotranspiration and determines the local and global water balance [10], is also an important component of the surface energy balance. Furthermore, LUCC can influence climate locally, regionally, and globally by altering biogeophysical processes (such as surface albedo and evapotranspiration) and biogeochemical processes (such as carbon cycling and greenhouse gas emissions) [11,12,13,14,15], exploring the effect of LUCC is helpful to understand the biogeophysical and biogeophysical mechanism of the surface energy balance, urban heat island, and climate systems. In addition, the LST, which is considered as a key variable in many applications, including agriculture, hydrology, and meteorology, and it is an important parameter in the study of surface energy balance and water cycle processes [16,17,18,19].
The proposed land surface energy balance algorithm is based on the physics of heat transfer and energy conservation, and is mainly based on the physics of heat transfer and energy conservation, and is widely used in many studies with remote sensing data [20], including agricultural management, urbanization impact research, and water balance research. Furthermore, the main data products of these algorithms include radiation balance, soil heat flux, LE and evapo-transpiration, which can achieve calculations for each pixel of the image [1]. Based on the algorithm of land energy balance, the changes of land energy budget caused by land use change in individual areas could be quantified, which provided a new perspective for exploring on the eco-climatic effects of land use changes [21,22,23].
The Yellow River is the second largest river in China, with a total length of about 5464 km. From the late 1980s to the present, grassland and forest land have decreased in the Yellow River Basin (YRB), but arable land, urban land, and unused land increased in this region [24]. The provinces and cities affected by the run of the Yellow River through the eastern, central, and western parts of China, are called the influence area of the YRB. The influence area of the YRB has important ecological functions in China and also represents a major contributor to the national economic and social development [25,26,27]. In recent years, the Chinese government has emphasized the need to adhere to ecological protection practices and encouraged high-quality development in the influence area of the YRB [28,29]. Thus, appropriate land use planning can play a significant role in the economic and social development of the region and can also play a positive role in the ecology and climate of the region [30]. Its high-quality development is of great significance to China’s social and economic development and the construction of ecological security pattern. Therefore, to reflect the effect of LUCC on the ecological environment and regional climate, it is necessary to characterize changes in the effect size [31].
In this paper, we take the influence area of the YRB as the study topic. Based on the surface albedo, surface temperature, solar radiation and latent heat flux, the surface radiation balance and energy balance were studied. In addition, from the perspective of spatial variability of land use types, we analyzed the changes in surface energy balance brought about by changes in land types, it can expand the understanding of studying temperature based on LST, and assess the LUCC’s potential impact on climate. These results would have important theoretical and managerial implications [32], which can serve as a guide for studies of urban temperature variability, and also help to understand the climate change and energy balance effects of land cover types [33,34].

2. Materials and Methods
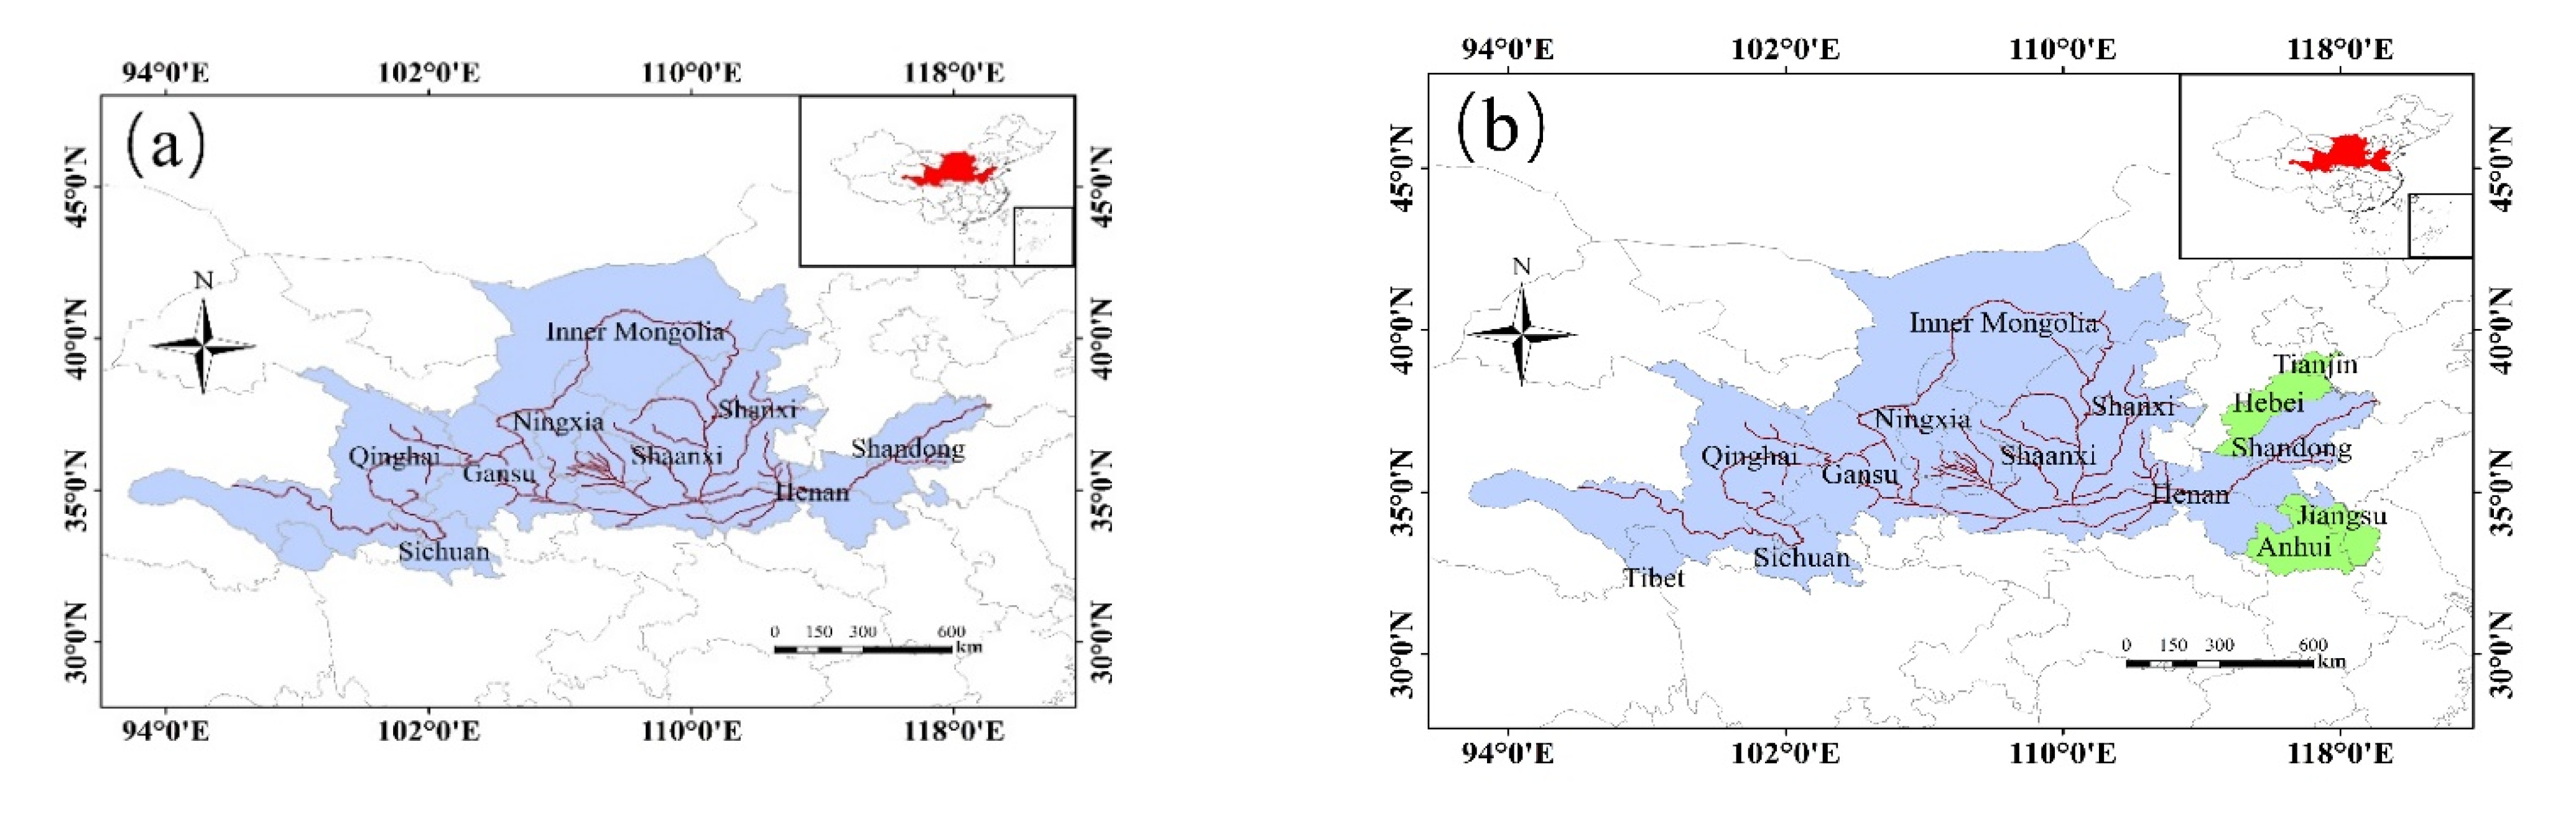
2.1. Study Area

The Yellow River originates on the Qinghai-Tibet Plateau and flows through nine provinces: Qinghai, Sichuan, Gansu, Ningxia, Inner Mongolia, Shaanxi, Shanxi, Henan and Shandong. The Yellow River Basin is an ecological corridor connecting the Qinghai-Tibet Plateau, Loess Plateau and North China Plain, and it is also an important ecological barrier and economic zone in China. The influence area of the YRB, which refers to the provinces and cities affected by the Yellow River, involves 14 provinces and cities (municipalities) in the east, middle and west of China, including the nine provinces mentioned above, and mainly extends to the four provinces of Tianjin, Hebei, Jiangsu and Anhui. As shown in Figure 1, the total land area of the influence area of YRB is 1.4 × 10⁶ km2.

2.2. Data Resource

This study used European Space Agency 300 m spatial resolution land cover data from 2000–2015, which can be downloaded at (http://www.esa-landcover-cci.org/, accessed on 15 May 2021). Temperature interpolation data were obtained from the Resource and Environmental Science Data Centre of the Chinese Academy of Science (http://www.resdc.cn, accessed on 15 May 2021). Water vapor pressure data were obtained from the Scientific Data Sharing Centre of the China Meteorological Administration (http://data.cma.cn/, accessed on 15 May 2021). Solar radiation data were downloaded from the Laboratory of Environmental Ecology, Seoul National University (Seoul, Korea; http://environment.snu.ac.kr, accessed on 15 May 2021). Remote sensing data for surface albedo (albedo), LST, surface specific emissivity (emissivity), and LE were obtained from the Moderate Resolution Imaging Spectro radiometer (MODIS) data products provided by NASA for the years 2000–2015 (https://modis.gsfc.nasa.gov/, accessed on 15 May 2021). The MODIS data information is shown in Table 1. In this paper, all MODIS remote sensing data were converted to annual average data with a spatial resolution of 1 km.

2.3. Research Methodolgy

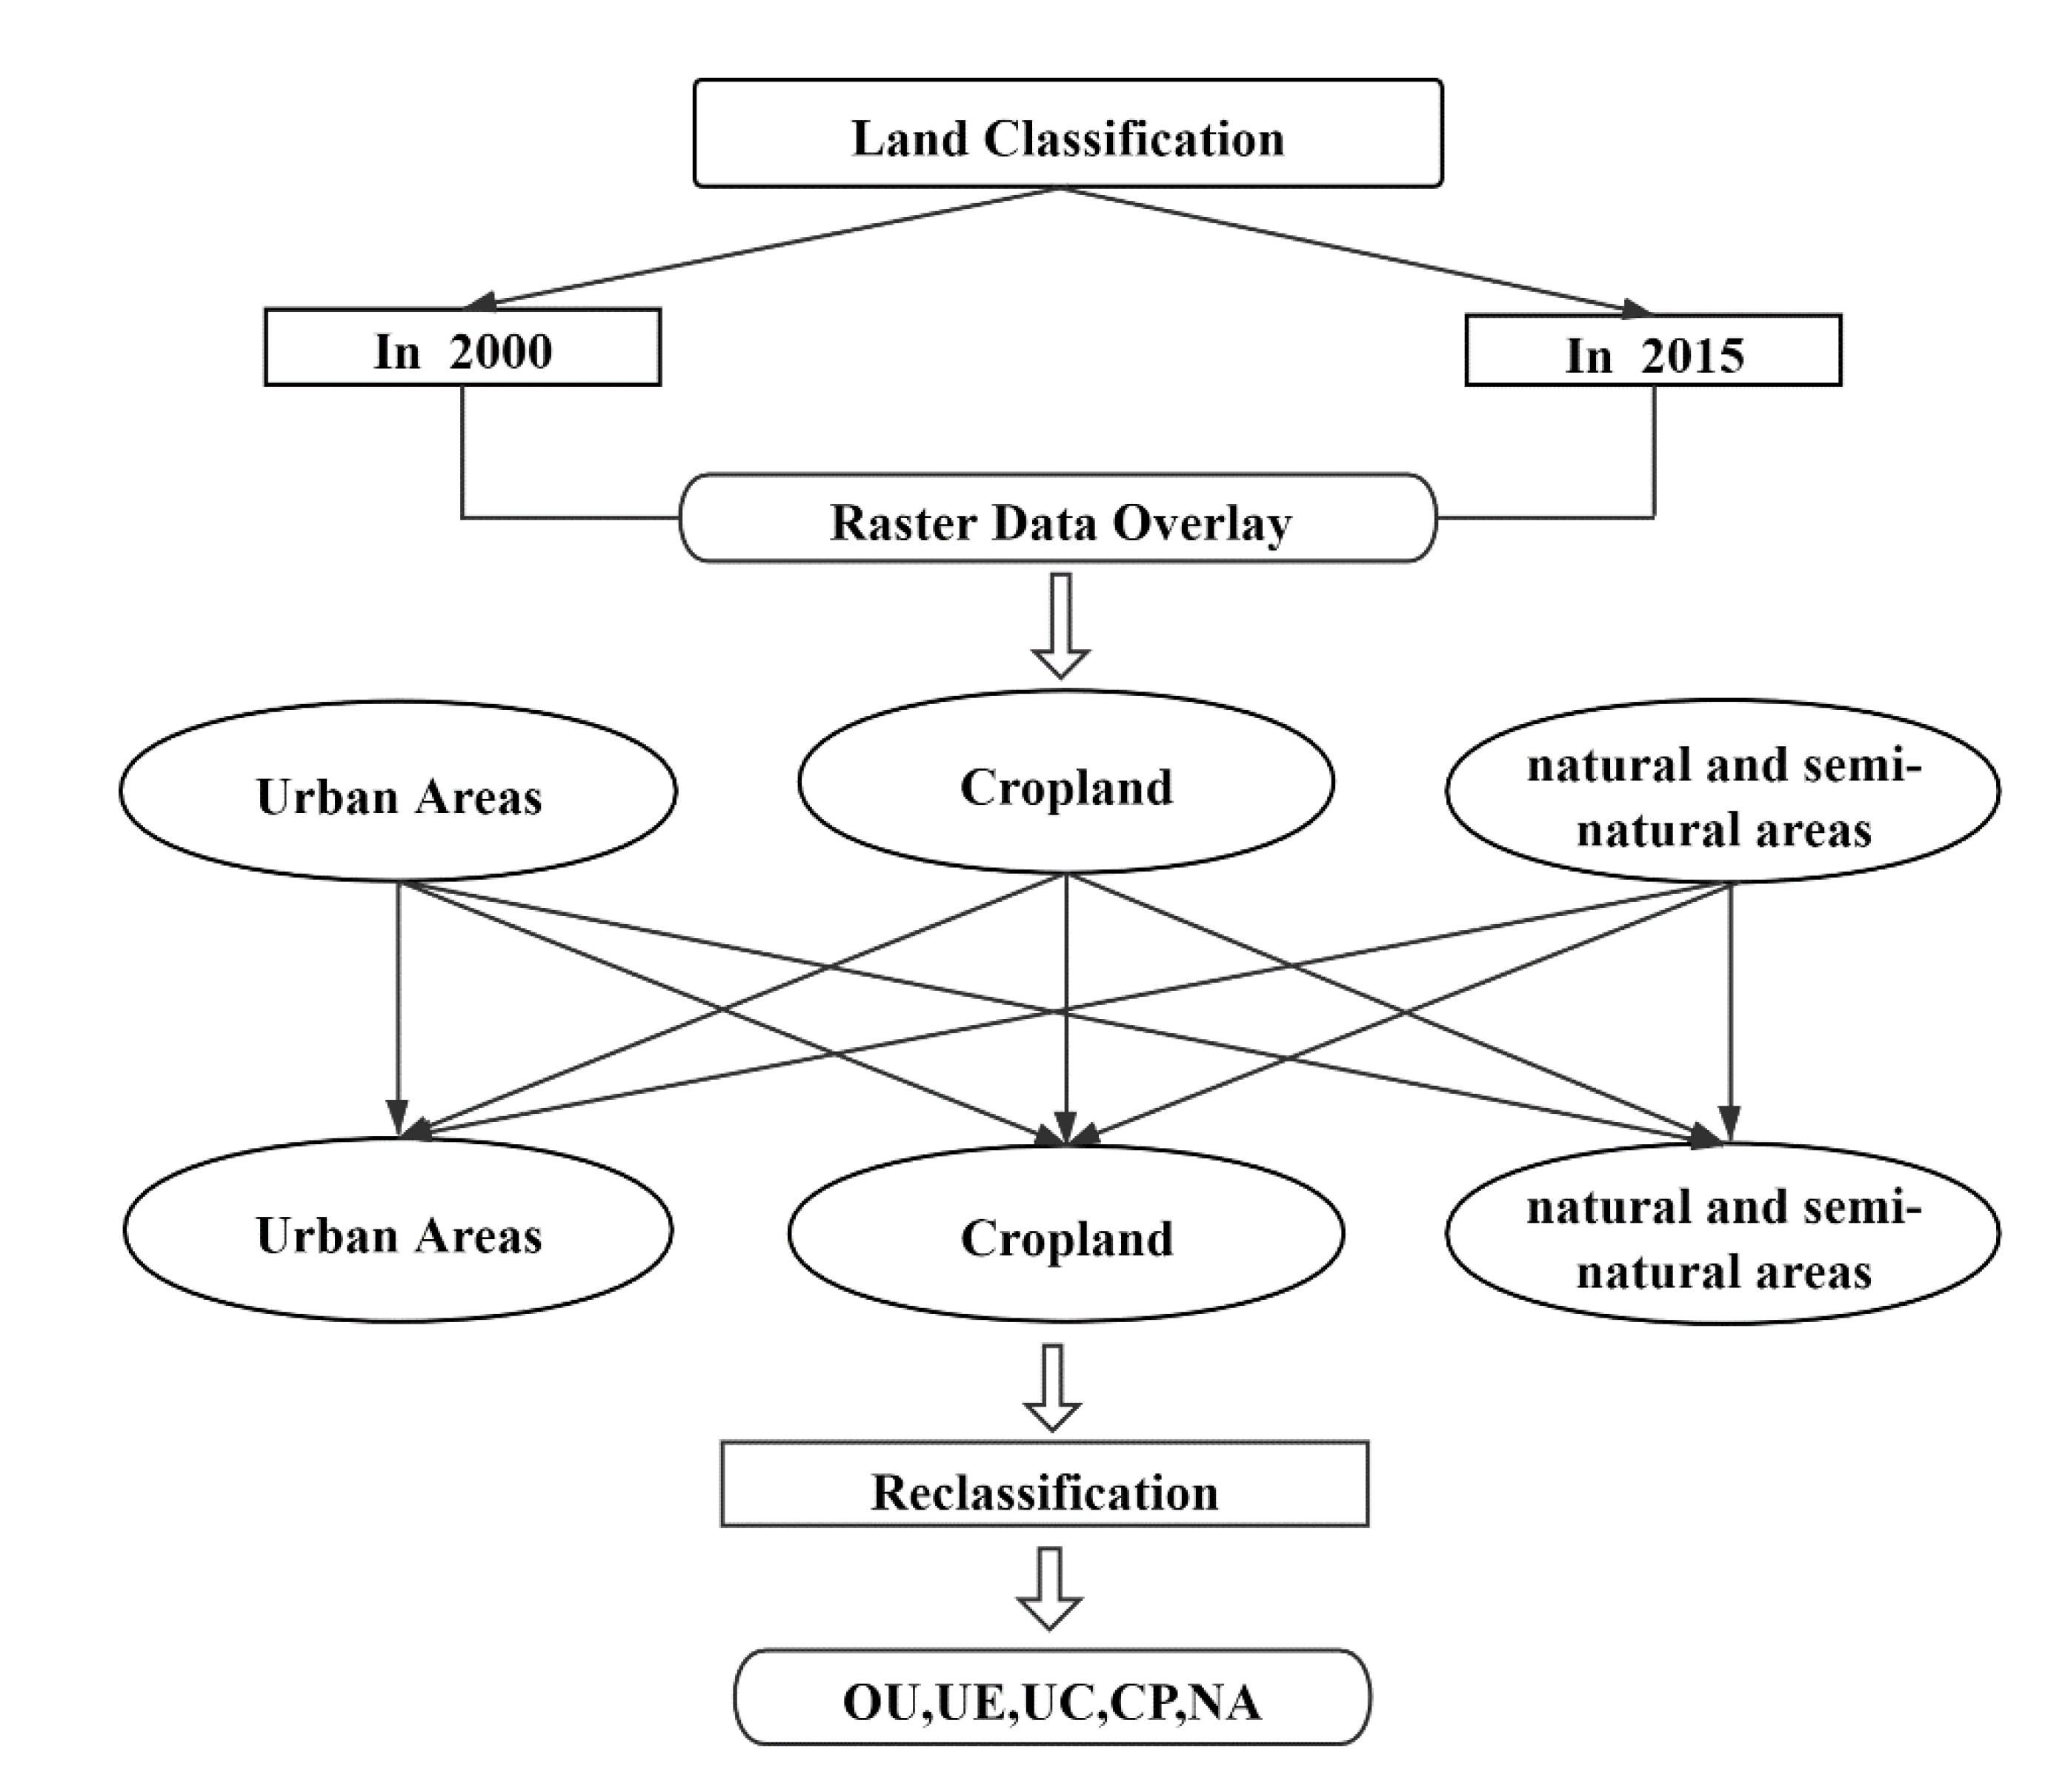
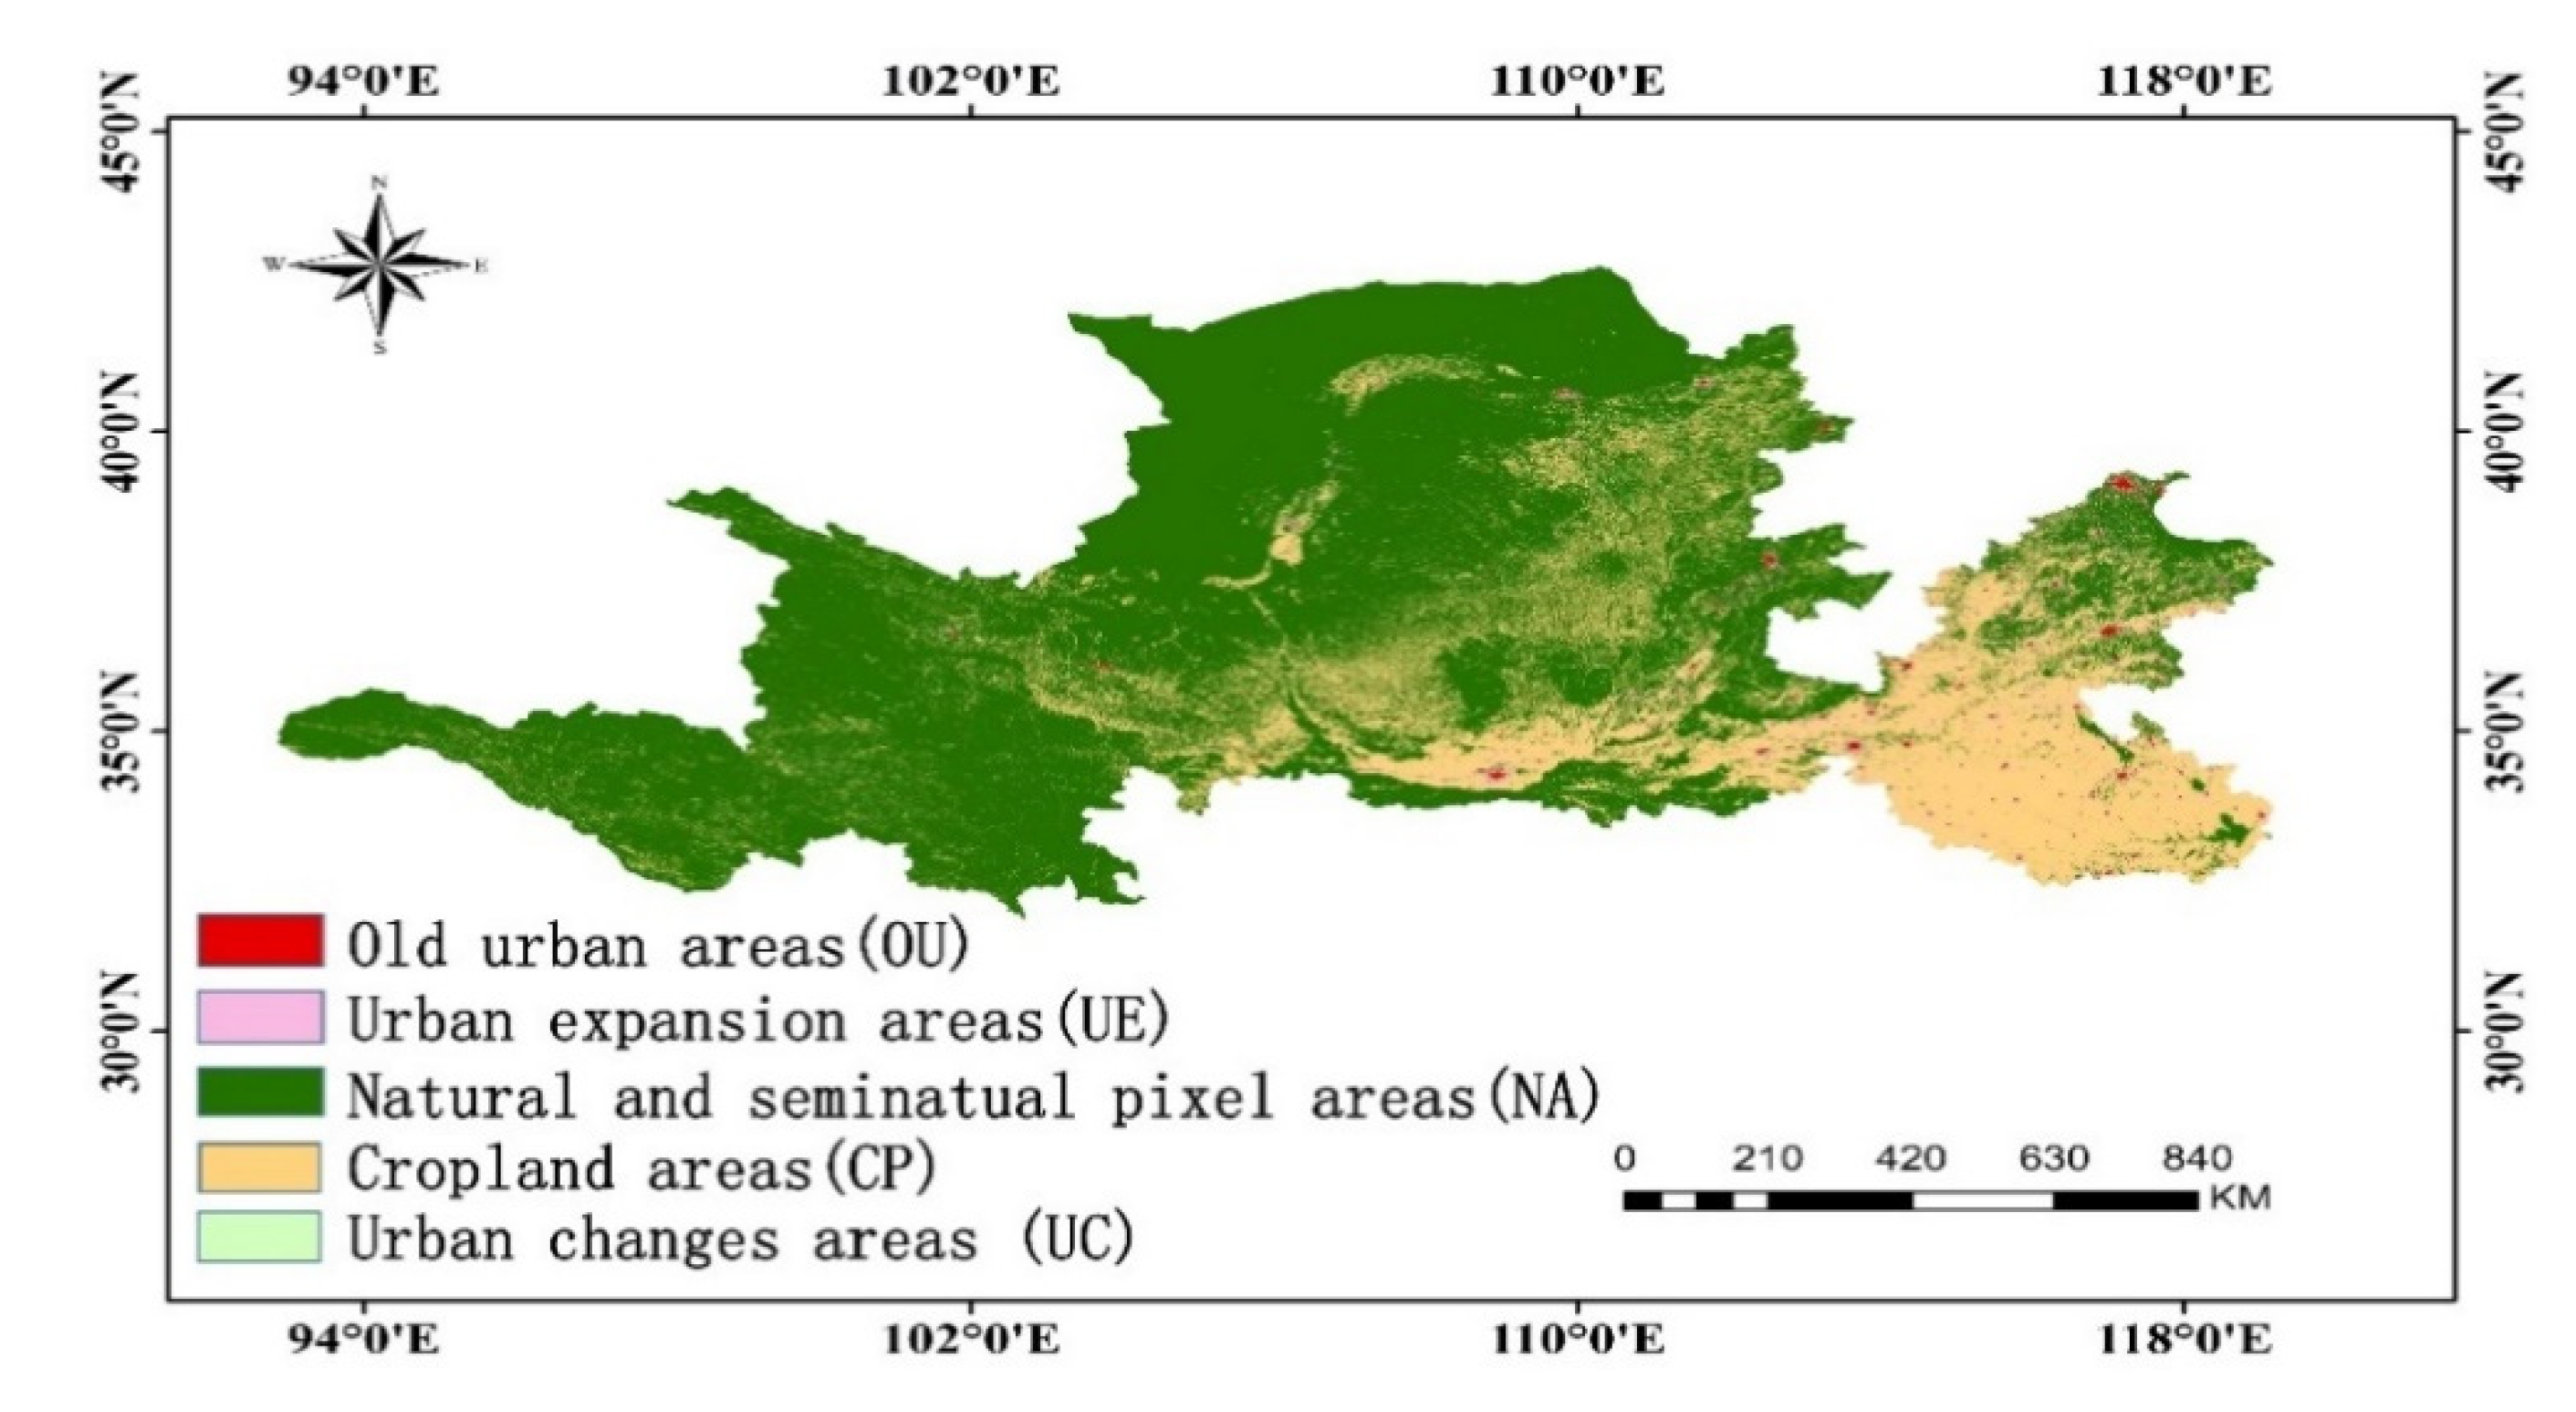
2.3.1. Land Use Reclassification

On the basis of the land use data of the study area in 2000 and 2015, the three land use types with significant differences in coverage were classified as: urban areas, cropland, and natural and semi-natural areas (Figure 2). After overlaying the data of the two periods, the following change permutations were obtained (Table 2), namely, old urban areas, cropland, areas where cropland became urban areas, natural and semi-natural areas, areas where natural or semi-natural land became urban areas, areas where cropland became natural or semi-natural areas, and areas where natural or semi-natural areas became cropland. As shown in Table 2, from 2000 to 2015, the land changes in the influence area of the YRB mainly involved the expansion of urban land. Urban expansion made up most of the changed area (1.8%), accounting for 72% of the changed land types. Unchanged cropland and natural and semi-natural areas account for 25% and 72% of the total area, respectively. During the study period, 0.3% of natural and semi-natural areas were transformed into cropland, and 0.4% of cropland was transformed into natural and semi-natural areas.
From 2000 to 2015, most cropland and natural and semi-natural areas in the influence area of the YRB remained unchanged, although some was converted to urban land. It can be seen that the urban expansion area accounts for the largest proportion of the total land conversion. In urban areas, the under-lying surface is composed of impermeable surfaces, with low surface evapotranspiration capacity and small heat capacity. Therefore, it is important to discuss changes of surface energy budget brought about by urban expansion in this study. There was also a mutual transformation between cropland and natural and semi-natural areas, which can be classified into one category in this study.
Here, the land use types after coverage were reclassified. Areas that were cities during 2000–2015 were classified as old urban areas (OU). Urban expansion areas were classified as (UE), and urban change areas (land use types changed, but urban expansion does not occur) were classified as (UC). Natural or semi-natural areas and cropland areas that had not changed between 2000 and 2015 were classified as (NA) and (CP) respectively. The process of land classification is shown in Figure 2, and the land use types after reclassification are shown in Figure 3. Overall, the area of land use change was 2.99 × 10⁴ km2 accounting for 2.5% of the total area. The order of the proportion of the five land use types from high to low was NA > CP > UE > OU > UC. As shown in Figure 3, most of the land in the influence area of the YRB was NA and CP, which covered 1.13 × 10⁶ km2 and 3.95 × 10⁵ km2, respectively, followed by UE and OU. The smallest area was MP, which covered 4.18 × 10⁴ km2.

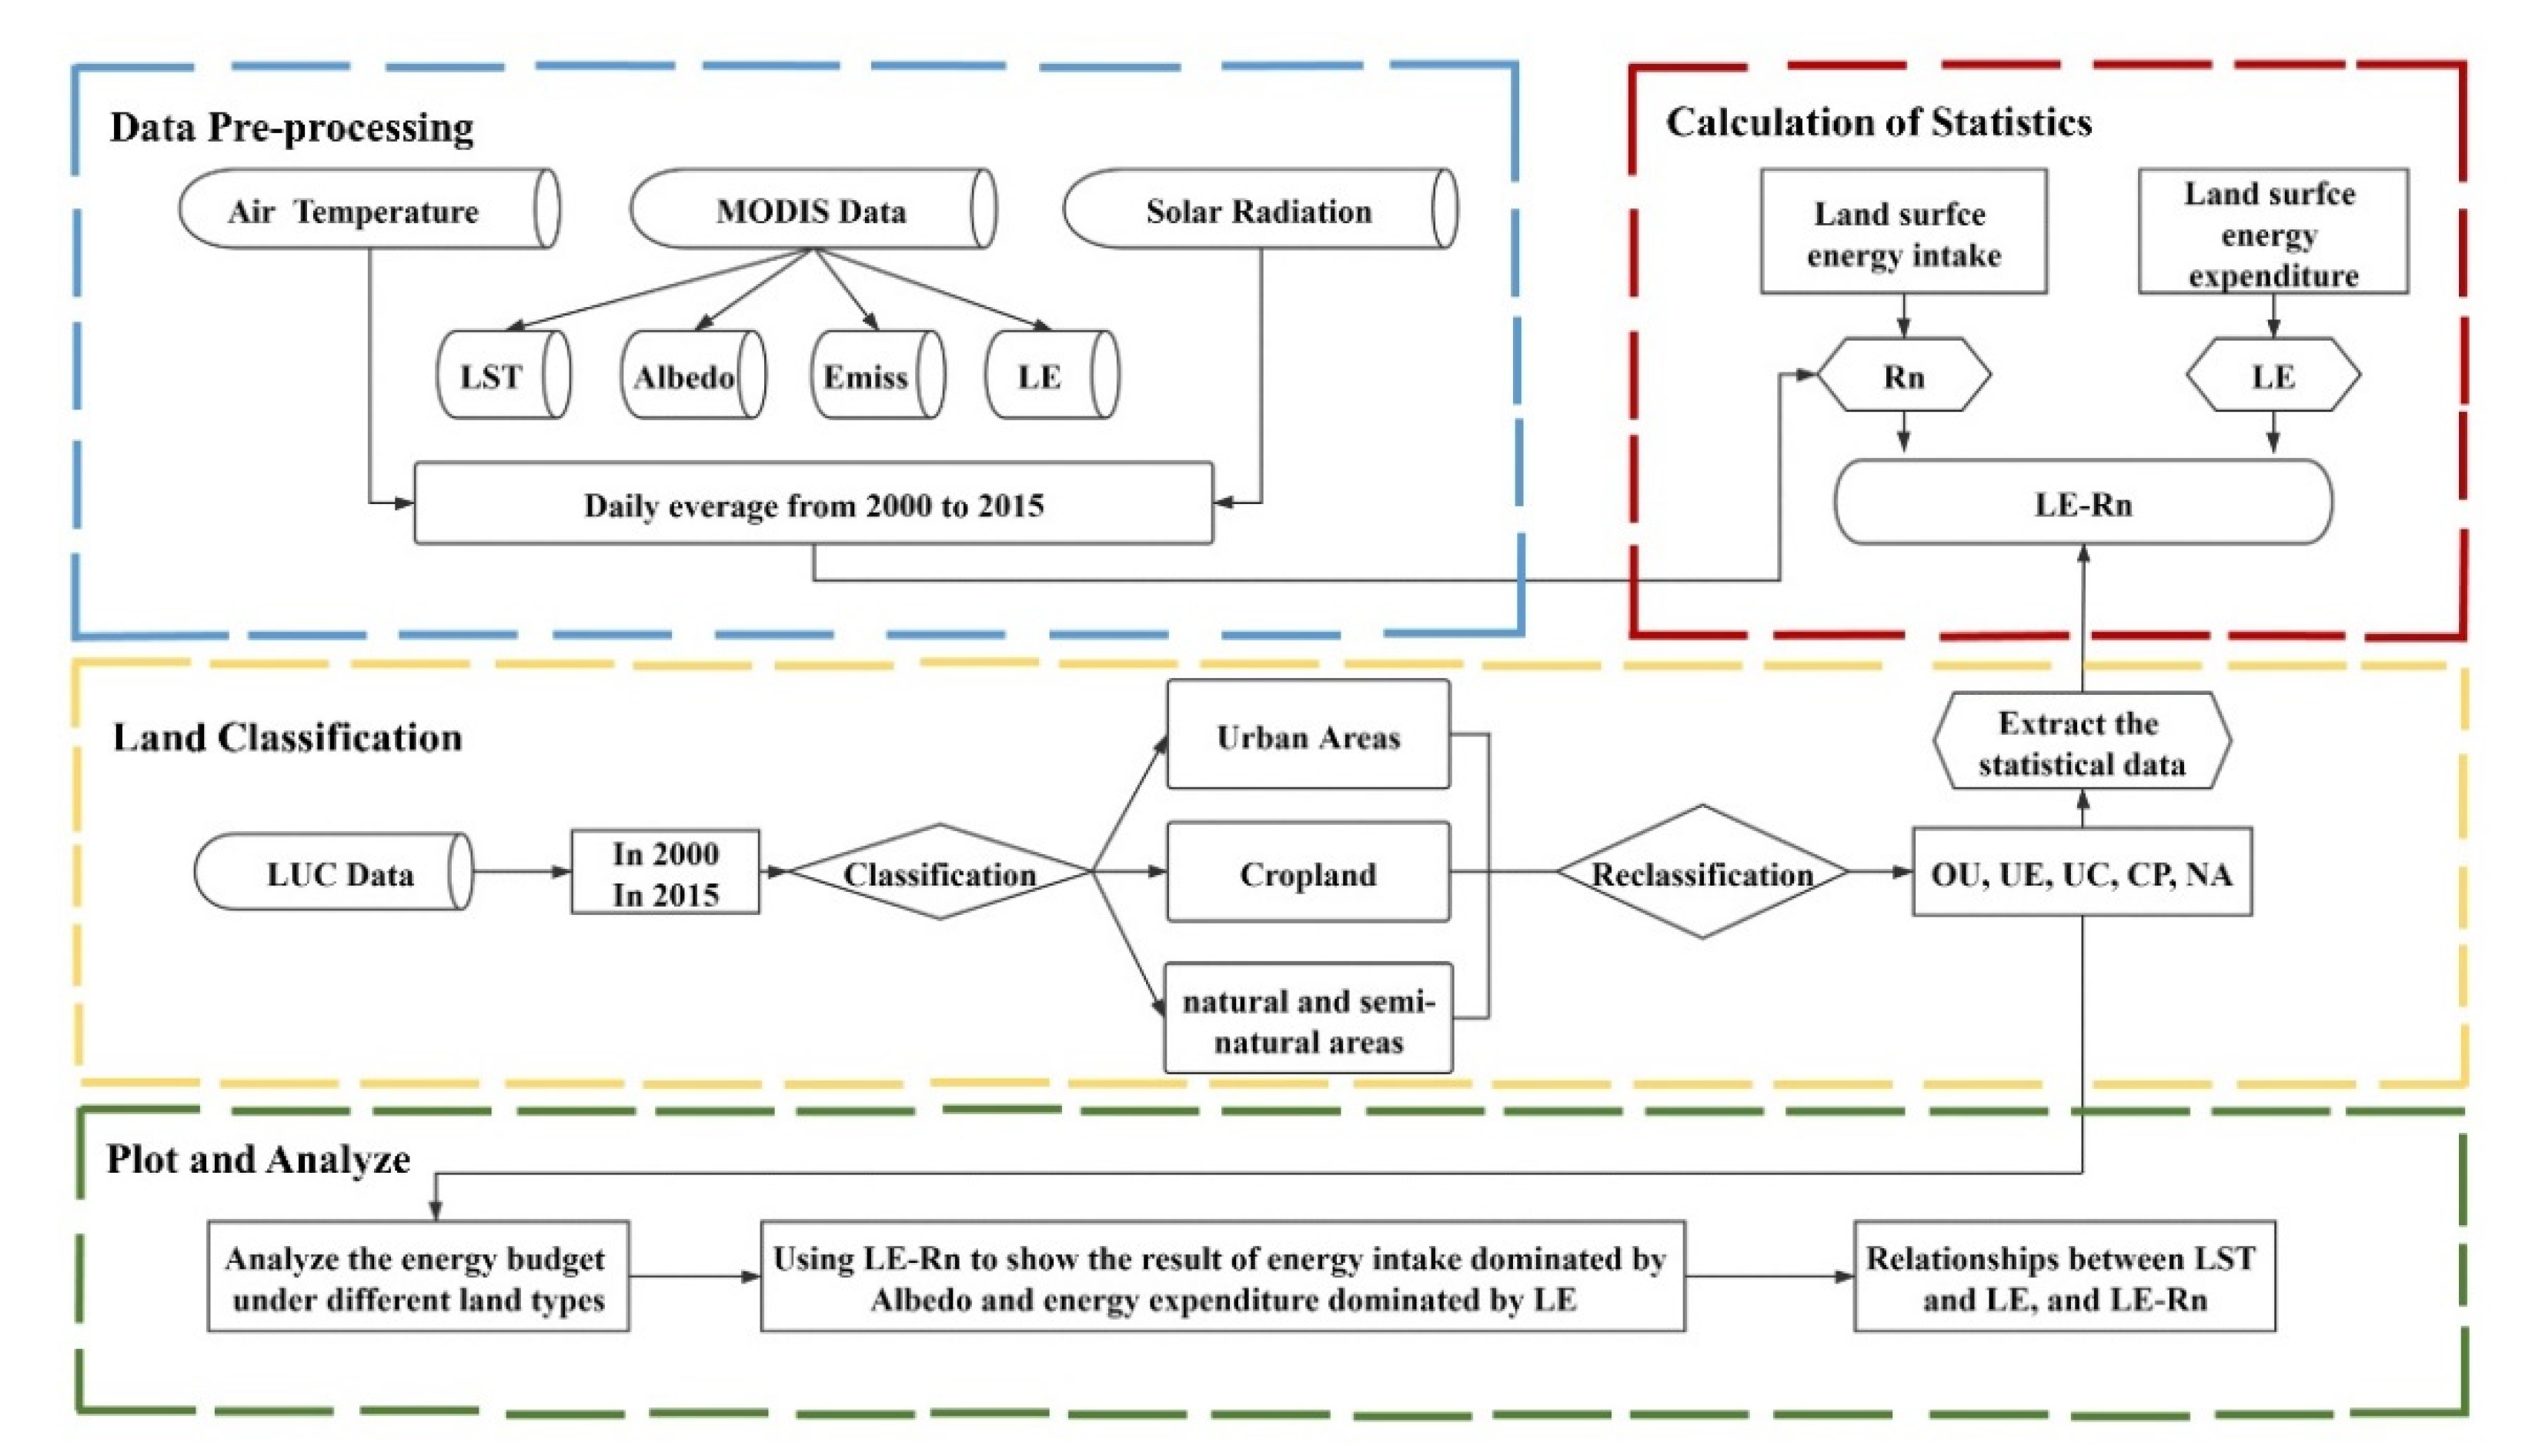
2.3.2. Calculation of Surface Energy Balance and Warming Effects

As different land use patterns have different impacts on the surface energy balance, we calculated the changes in surface energy under the land types with the surface energy balance algorithm. As shown in Figure 4, the differences and relationships between energy intake and expenditure parameters under the five land use types (OU, UE, NA, CP, UC) were analyzed.
The surface energy balance equations of various influencing factors are as follows [20,35,36]:
R n = S w + L w
S w = S w ( d ) S w ( u ) = ( 1 ɑ ) S w ( d )
L w = L w ( d ) L w ( u ) = E l L w ( d ) ( T a , E a ) L w ( u ) ( T l , E l ) = E l δ E a T a 4 δ E l T l 4
E a = 1.24 ( P / T l ) 1 7
where δ = 5.67 × 10 8 w / m 2 / K 4 , R n is the net radiation, S w is the net short-wave radiation, S w ( d ) is the downward short-wave radiation, S w ( u ) is the upward short-wave radiation, L w is the net long-wave radiation, L w ( d ) is the downward long-wave radiation, L w ( u ) is the upward long-wave radiation, and the radiation unit is w / m 2 . ɑ is surface albedo. E l is surface emissivity, E a is air specific emissivity. T a is air temperature, T l is land surface temperature, and the unit of temperature is K . P is the water pressure, unit is hPa.
In this paper, R n is used to represent the energy absorption forced by biophysical factors. The negative sign indicates that R n decreases as the increase of albedo. At the same time, LE stands for the forcing of R n ’s consumption on energy consumption. Therefore, LE R n in this study represents the final result of the forced balance of energy intake and expenditure caused by LUCC [37,38]. Under the condition of forced equilibrium, the energy of sensible heat flux and soil heat flux decreased due to the larger LE R n value. Therefore, less energy is used for heating the atmosphere and surface temperature, which corresponds to cooling feedback or weak heating feedback. On the contrary, a lower LE R n value is equal to stronger heating feedback.

2.3.3. Analytical Method

On the basis of the surface energy balance algorithm, the radiation factors (long wave radiation, short wave radiation and net radiation), latent heat flux (LE) and other related variables affecting the surface energy balance were calculated. Using the regional statistical method of spatial statistics, the average value of all pixels in a certain land use type was calculated. The variation of different energy factors of different land use types over time from 2000 to 2015 was analyzed by classical linear regression, significance test and trend analysis statistical techniques.
The MODIS images are available daily, so it is easy to quantify the monthly, quarterly, and annual changes of radiation factors and latent heat flux. In this study, we chose to analyze the interannual variation of radiation factors (mainly R n ), LE and LE R n from 2000 to 2015. We used correlation analysis to identify the relationship among LE, R n and LE R n and to explore their contribution to regional warming and cooling. The LST is an important parameter that should be accounted for in the study of the land surface energy balance, so we also explored the response of LST to various factors; that is, the correlation among LE, Rn, LE R n and LST was discussed.

3. Results

3.1. Changes in Surface Energy Intake

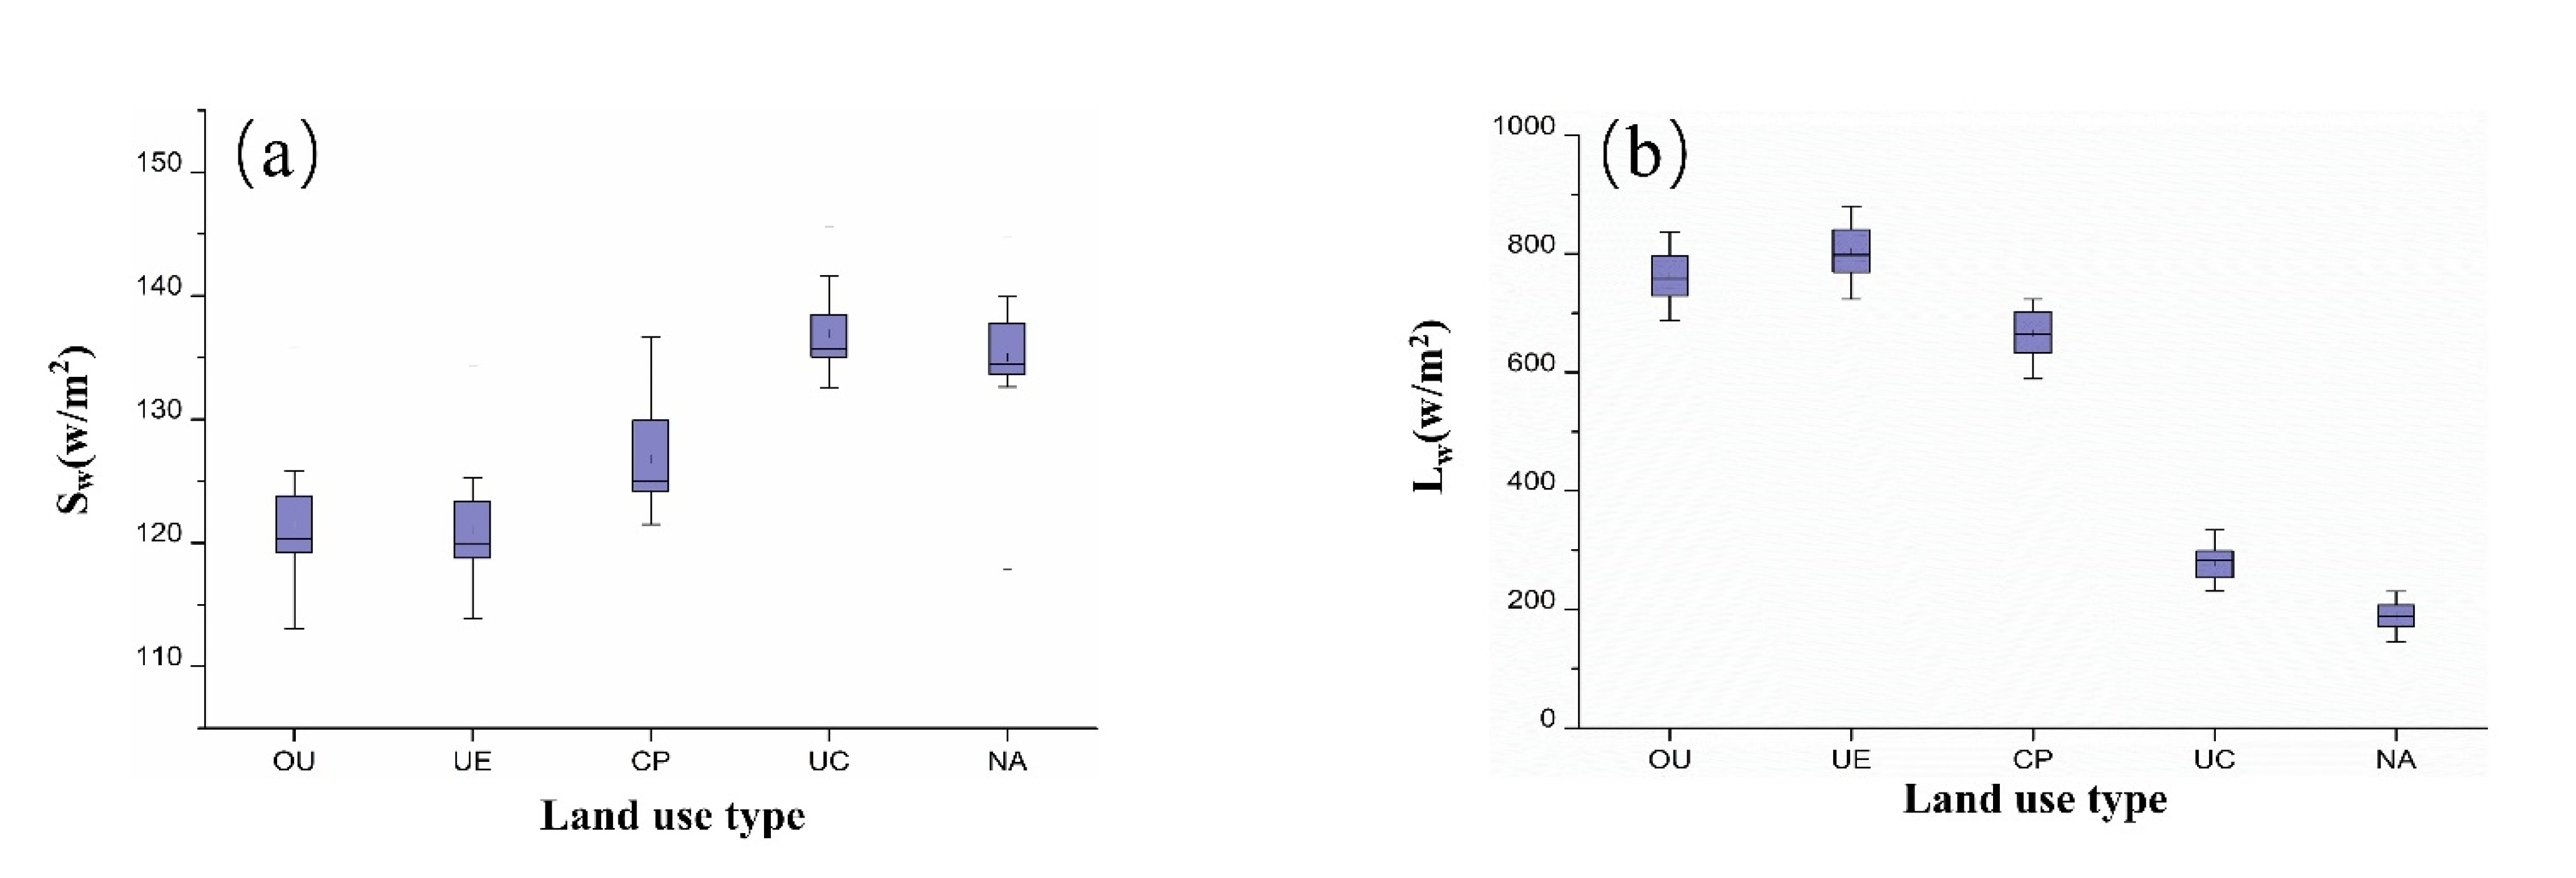
3.1.1. Net Shortwave and Longwave Radiation

The spatial variation of net shortwave ( S w ) and net longwave radiation ( L w ) over the study period was calculated on the basis of the difference between the data in 2000 and 2015. As shown in Figure 5, the S w and L w changes were positive over most of the study area, with multi-year trend values of 1.67 w/(m2∙year) and −0.23 w/(m2∙year) for L w and S w , and multi-year averages of 540.2 w/(m2∙year) and 128.3 w/(m2∙year) for L w and S w , respectively.
In terms of spatial distribution, L w increased greatly in the three southeast provinces (Jiangsu, Anhui and Henan), mainly distributed in the CP area, while the regional distribution of negative differences was concentrated in the southwest region (Tibet and Qinghai), mainly distributed in the NA area and CP area. In contrast, the increment of S w was generally larger in the west and smaller in the east. The largest increment of S w was mainly in the NA region, while the smallest increment was mainly in the CP region.
According to the statistical values of S w and L w for the five land types from 2000 to 2015 in Figure 6, the highest values of L w were mainly located in the OU, UE and CP areas, with the maximum value of multi-year average of 804.3 w/m2, while the lowest values of L w were located in the UC and NA areas, which are 278.7 w/m2 and 188.3 w/m2 respectively. The results of S w showed that the multi-year average of the UC area was the highest (137.0 w/m2), followed by the NA, CP, OU and UE, which were 135.0 w/m2, 127.0 w/m2,122.0 w/m2 and 121.0 w/m2, respectively.

3.1.2. Net Radiation Change

Net radiation is an important index of regional energy absorption [10], and is a key physical and ecological parameter that affects the process of land-atmosphere energy exchange and redistribution. Using the results of L w and S w data, the change of net radiation ( R n ) was inferred. From 2000 to 2015, the average surface radiation in the influence area of the YRB was 664.2 w/m2, and the multiyear average was 1.6 w/(m2 year). Figure 7 shows that the R n values in the east increased, while those in the west decreased. In addition, the R n in 2015 was higher than that in 2000, and there was an increasing trend on the whole, although the increase was not significant (Figure 8).
The changing trend of R n under different land use types showed that there are significant differences among the five land use types. The highest values of R n   were concentrated in the OU and UE areas, and the multi-year average values were 878.4 w/m2 and 913.1 w/m2, respectively, which were much higher than those of CP, NA and UC. The multi-year average value of NA was the lowest (323.7 w/m2). As OU and UE are strongly affected by human intervention, this indicates that these values will increase with the increase in human LUCC.

3.2. Analysis of Surface Energy Balance

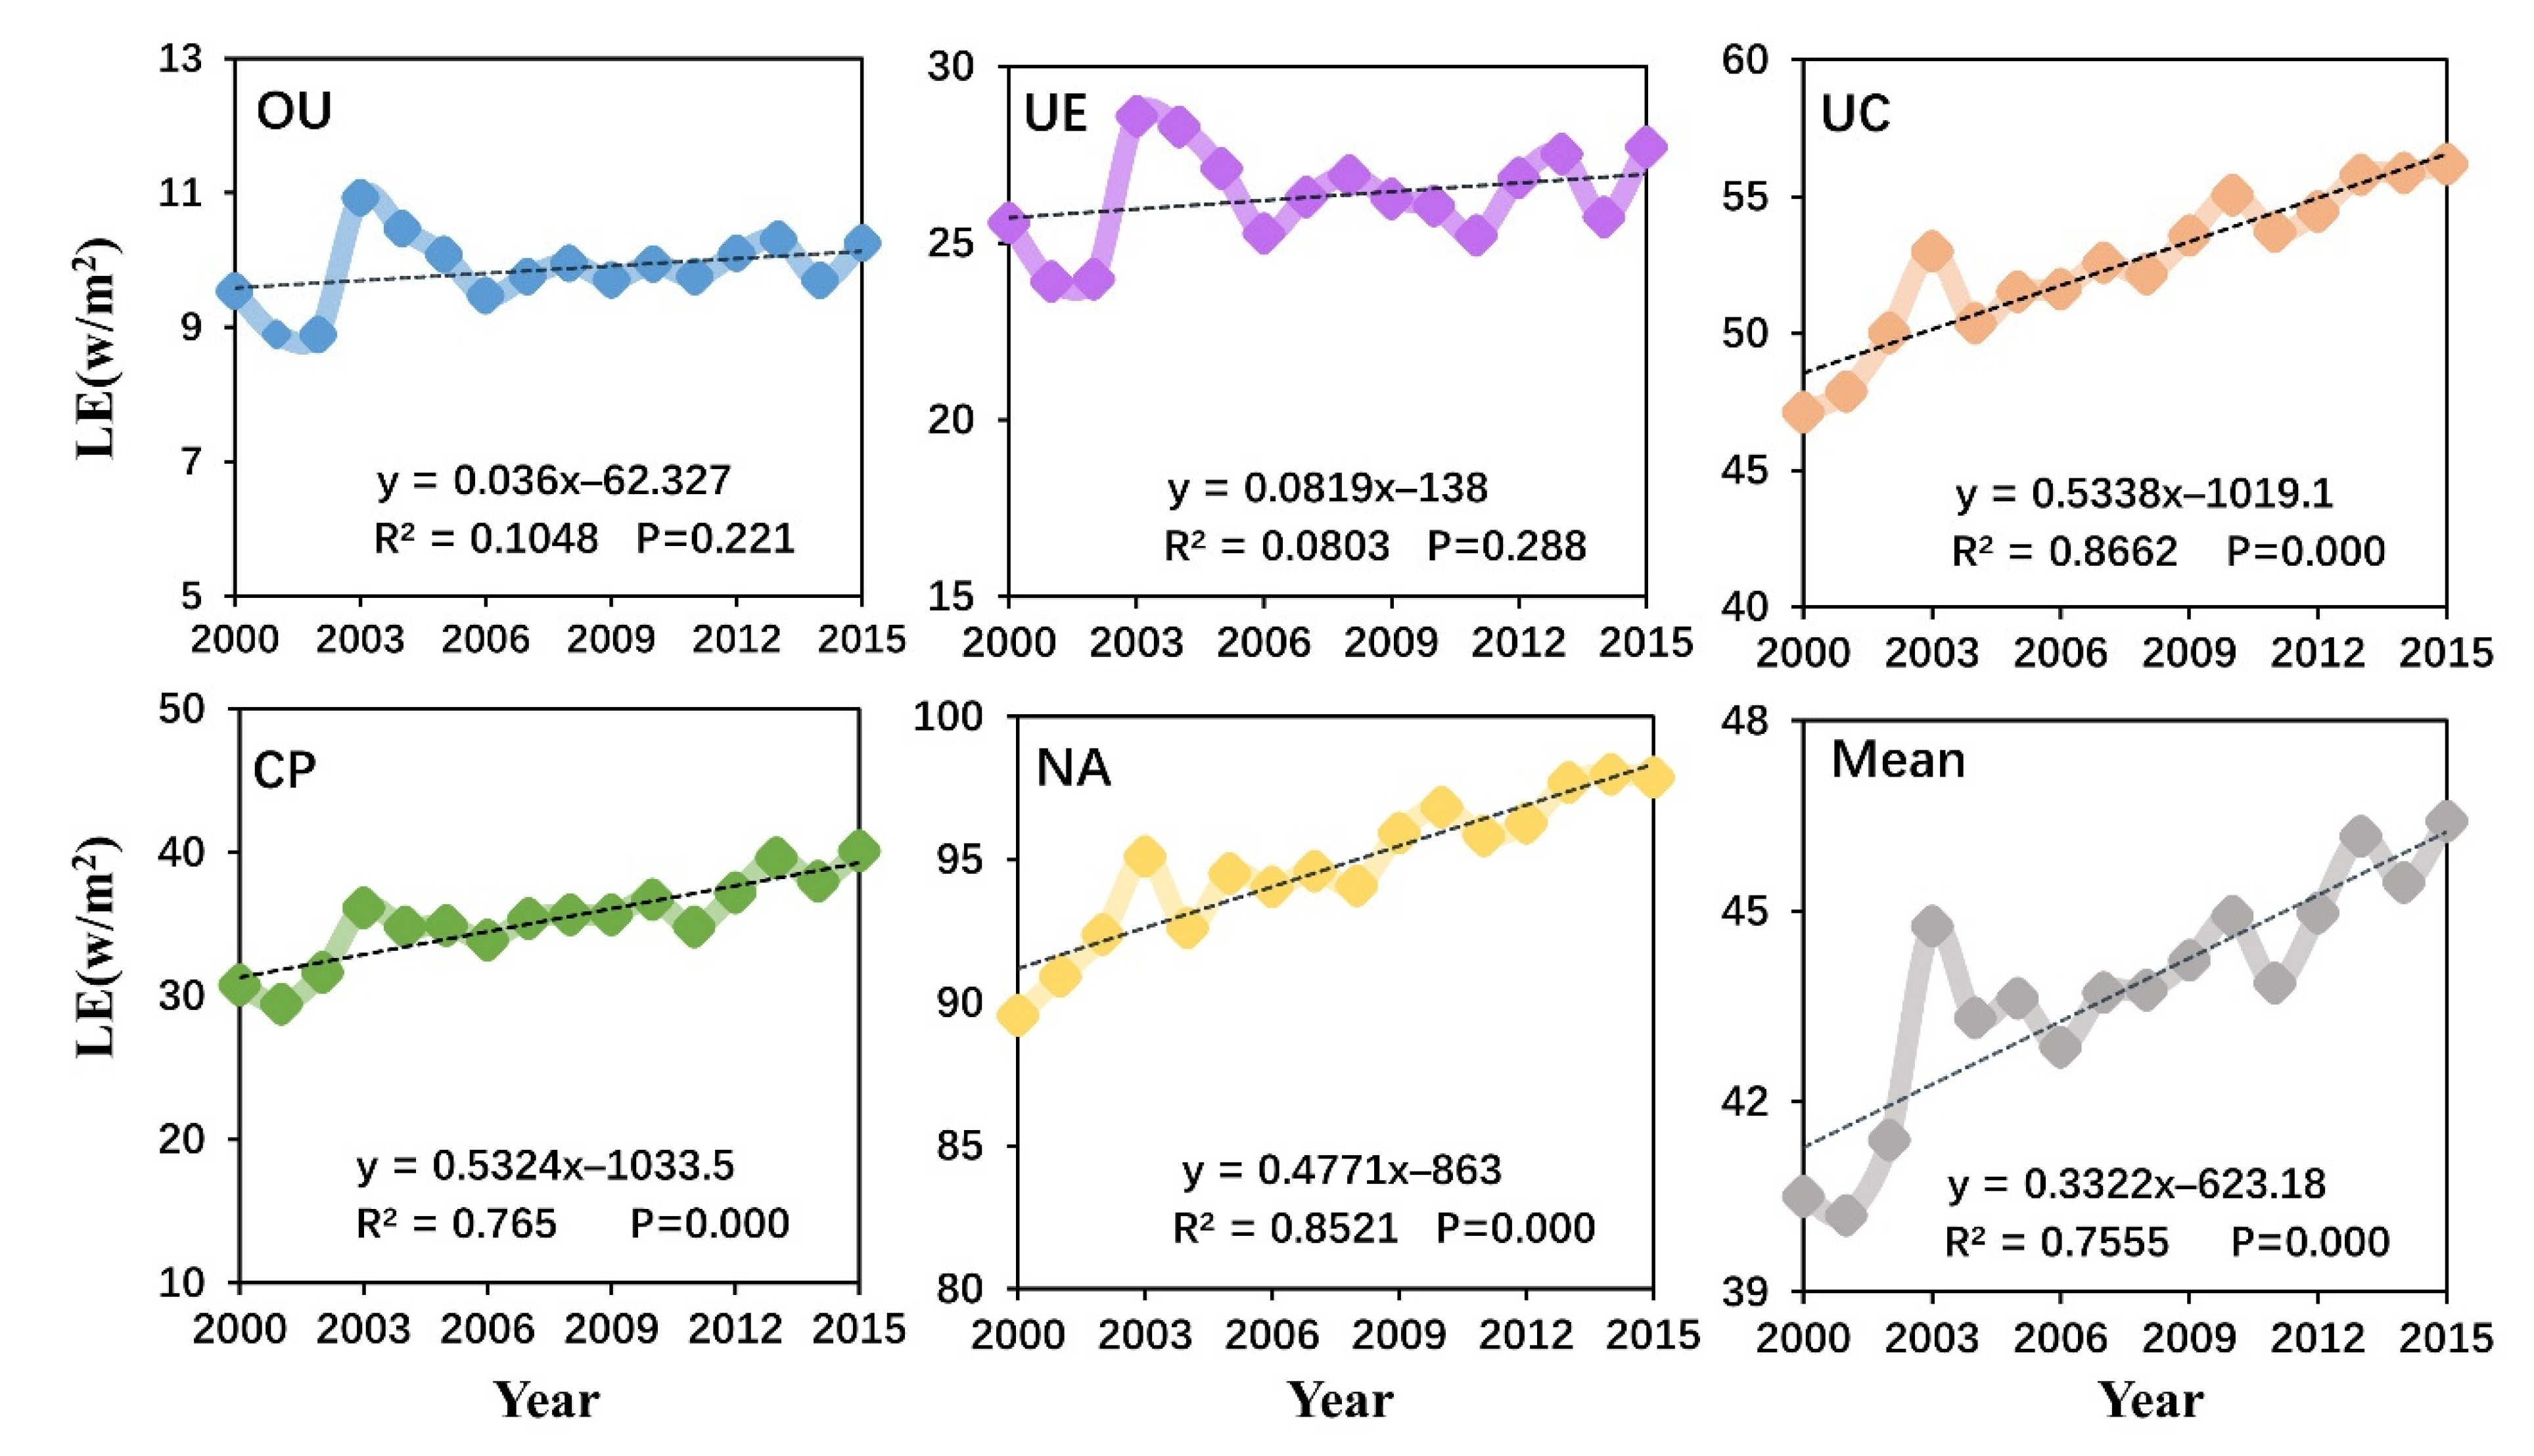
3.2.1. Changes in Surface Energy Consumption

It can be seen from Figure 9 that from 2000 to 2015, the LE in YRB influence area showed a positive change. Under the influence of human activities, there were significant differences in the range of LE values corresponding to land use types. In terms of spatial distribution, LE values were higher in the northern region, with the highest multi-year mean value among the five land types being NA with a value of 94.8 w/m2, followed by UC, CP, UE and OU with 52.6 w/m2, 35.3 w/m2, 26.3 w/m2 and 9.9 w/m2, respectively.
Figure 10 shows the trend of LE under different land use types in the YRB from 2000 to 2015. The multi-year LE value was 43.8 w/m2, and the multi-year LE trend was 0.33 w/(m2∙year). For OU and UE, the trend of LE were smaller, less than 0.1 w/(m2∙year), while those of CP, NA and UC were all greater than 0.1. The LE values of OU and UE, which were greatly affected by human intervention, are always smaller than those of other land use types, which indicated that LE decreased with the increase of human activities. Furthermore, it is worth noting that the growth trend of LE in OU and UE was much slower than that in UC, CP and NA, which indicated that human activities had a negative impact on the value and trend of LE.

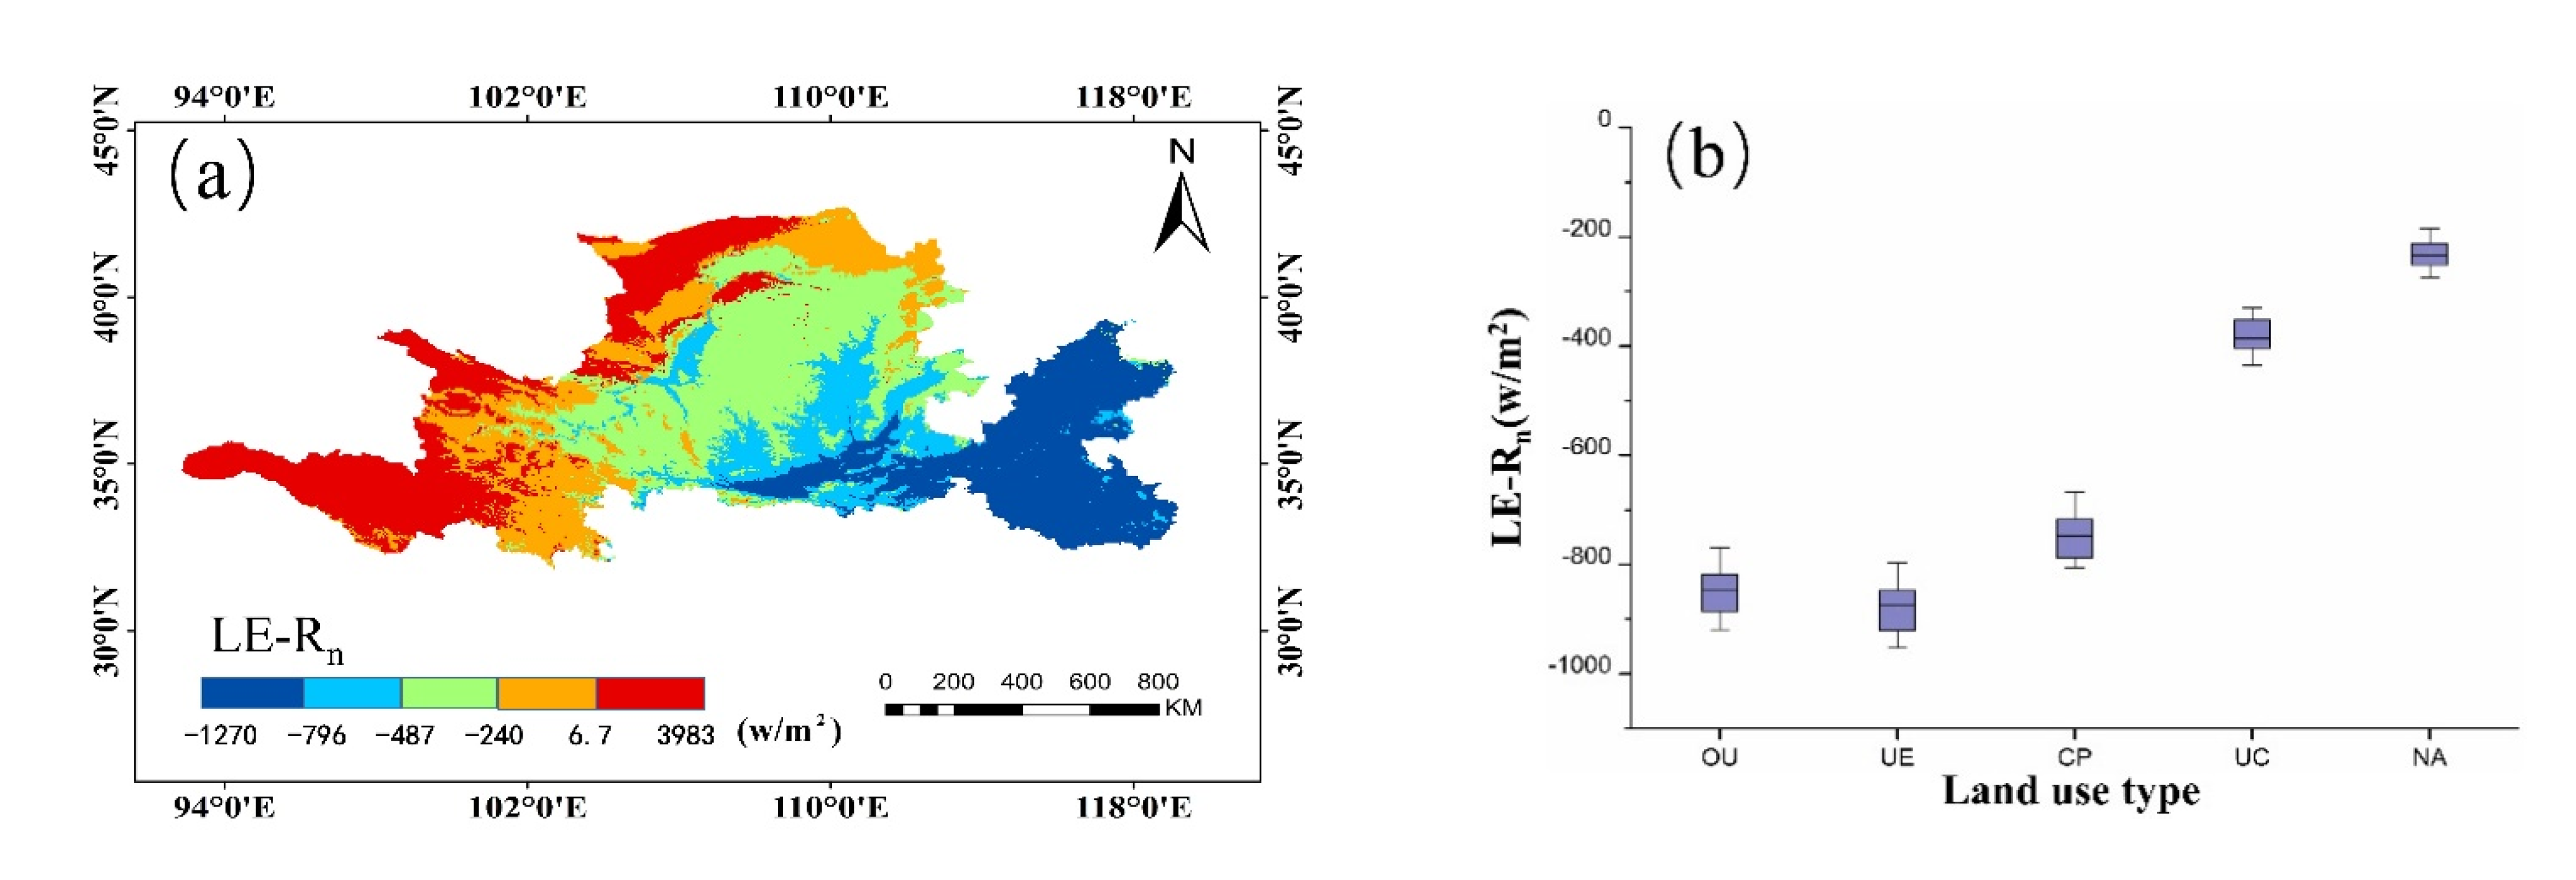
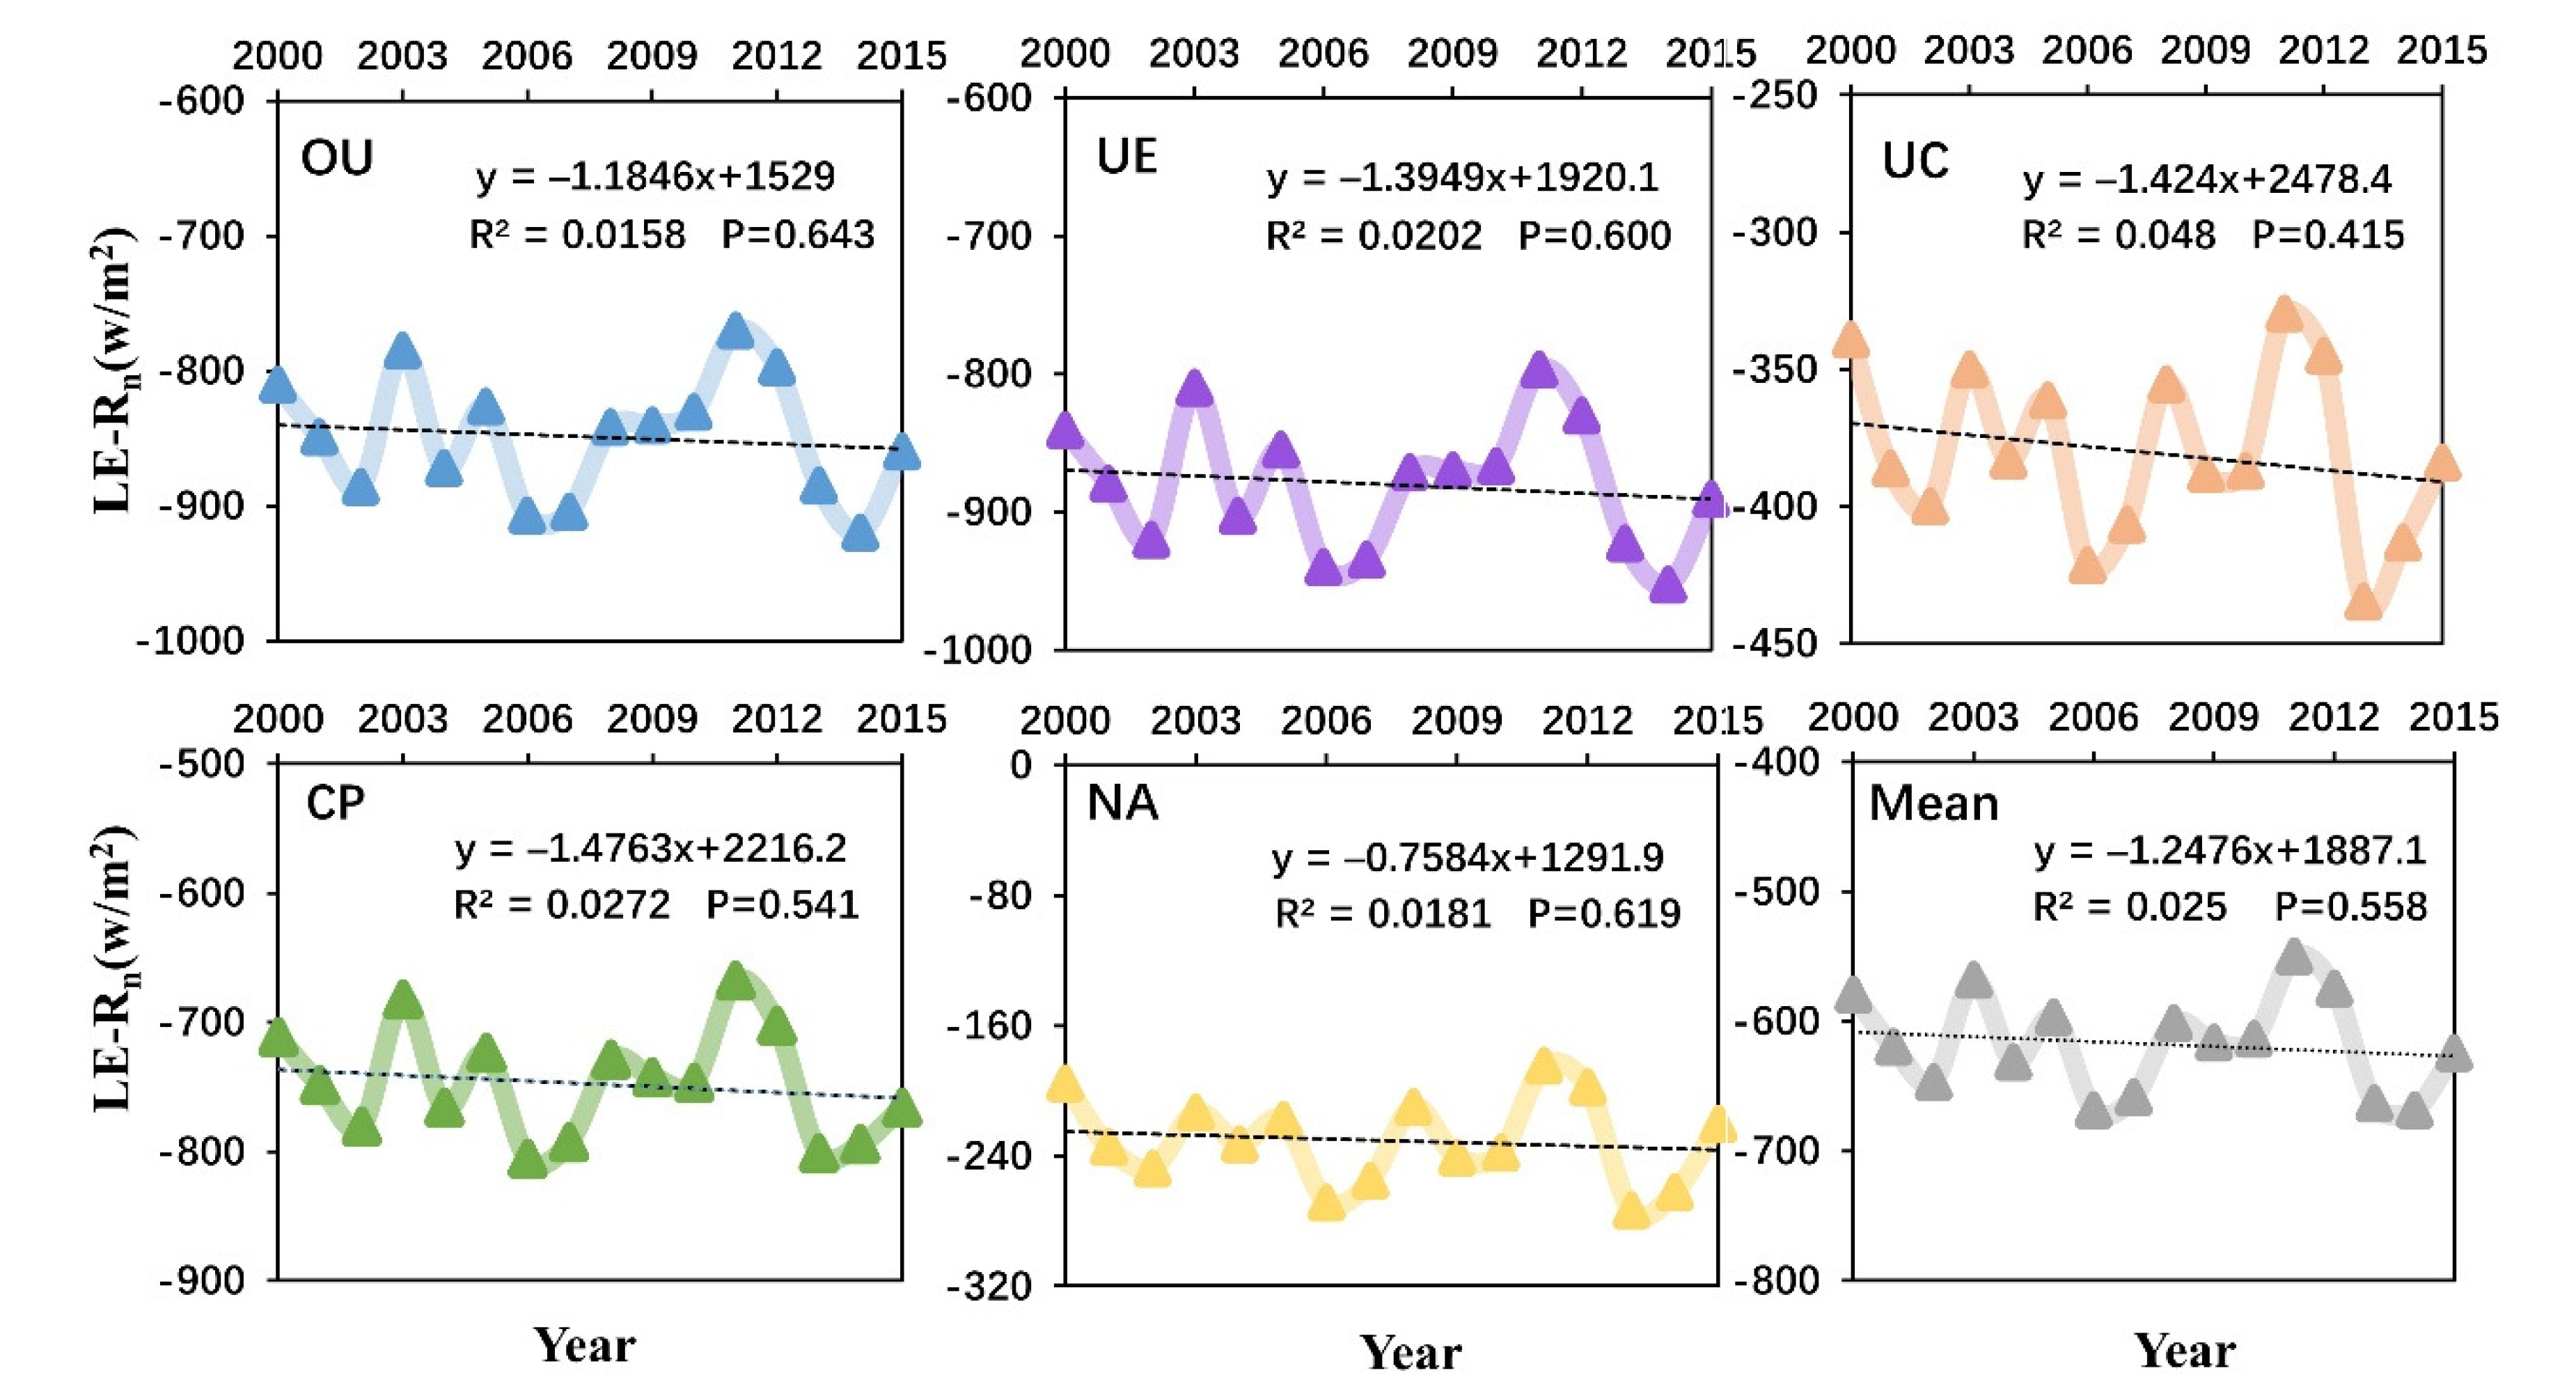
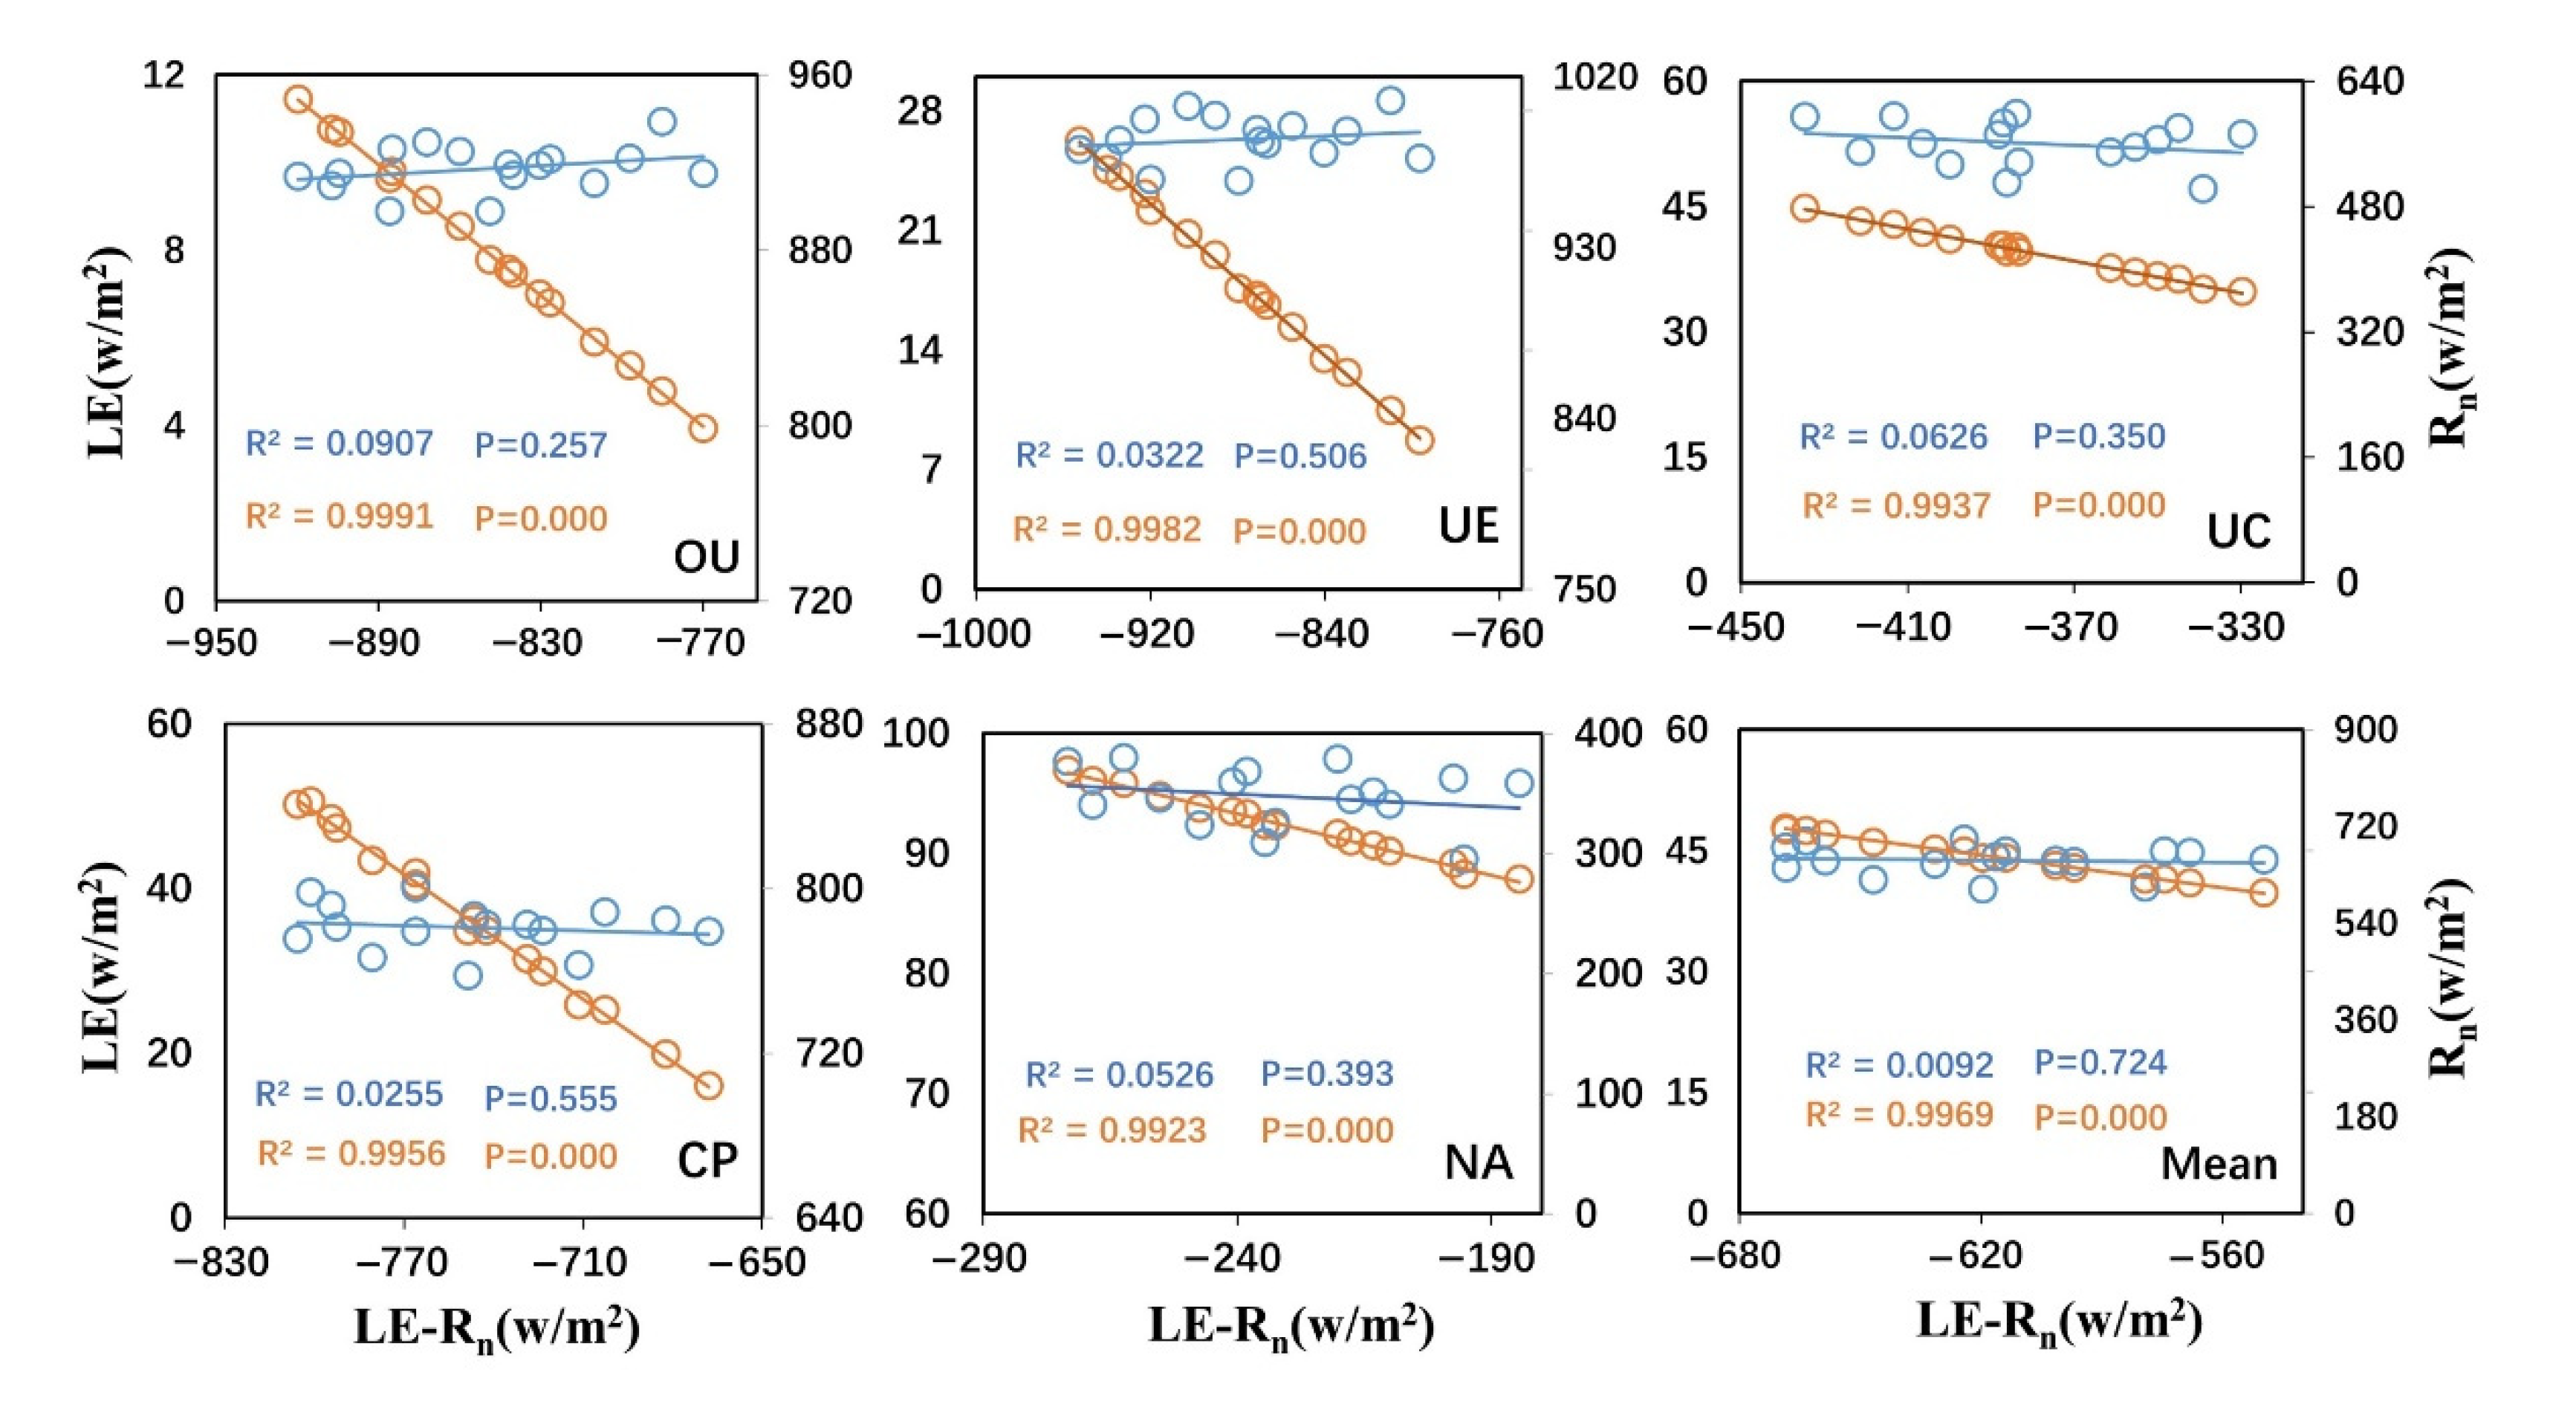
3.2.2. Comparison of Net Radiation and Latent Heat Fluxes

By comparison, it can be seen intuitively that the spatial distribution of LE R n is different from that of LE. As shown in Figure 11, the values of LE R n in most parts of the east were almost negative, while those in other parts were mainly positive. The high value area was mainly located in the northwest, with a multi-year average of −617.5 w/m2. The order of the multi-year average value of five land types from high to low was NA > UC > CP > OU > UE. Figure 12 indicates that the values of LE R n from 2000 to 2015 under five land types all showed a downward trend, and the multi-year trend value of LE R n was −1.2 w/(m2∙year), indicating that the feedback effect of land use change on regional warming was enhanced.
To further clarify the influence of LE and R n on   LE R n , we compared their relationships. The correlation between R n and   LE R n , in all five land types during the study period was greater than that between LE and LE R n (Figure 13). The correlation between LE R n and R n was greater in the OU and UE areas than that in the CP, UC, and NA regions. In contrast, the regions with greater correlation between LE R n and LE were distributed in the OU and UC regions, followed by the NA, UE, and CP regions.
As far as the forcing balance is concerned, LE R n under different land use types was more sensitive to changes of R n , and this relationship was more obvious in the areas more affected by human activities (OU and UE). Therefore, the importance of factors such as energy uptake caused by biogeophysical factors for warming or cooling effects cannot be ignored when considering the results of LUCC-induced energy uptake and expenditure forcing balance. In other words, adjusting the net radiation coefficient may have a more significant effort on changing the balance of energy intake and expenditure in the influence area of the YRB.

4. Discussion

Since the 20th century, land use patterns in YRB in China have undergone tremendous changes with the acceleration of economic development and urbanization. Besides natural and semi-natural land use, the most obvious land use change in the study area was the transformation from agricultural land into urban land. Because of the different vegetation growth conditions among different land use types, the differences between land use types are reflected in biophysical parameters such as albedo, resulting in different energy balance effects [10]. When exploring the climate effects of land use change from the perspective of radiation force, it is important to consider not only the radiation force corresponding to albedo, but also the radiation force corresponding to the ground and atmosphere [19], because the radiation force considering albedo only includes shortwave radiation, which has a limited influence on the overall energy balance and the parameter changes in the mechanism for regulating local energy [10]. The results of the study show that the shortwave pattern of change is not obvious in the five land-use types, but the increasing intensity of human activity, after the superimposition of long-wave radiation, shows a clear pattern of change of R n for each land-use type. Especially, areas with intensive human activities (OU and UE) showed much higher values than other areas.
On the basis of the changes in land use types and surface temperature in the YRB influence area from 2000 to 2015, it can be concluded that the land use types in this area with the high to low average multi-year temperature (LST) were in the order: OU > UE > CP > NA > UC (Figure 14). Areas that are more affected by human activities had higher temperatures, while lower temperatures were found in natural and semi-natural areas with less human activities. From 2000 to 2015, with the increasing feedback effect of land use change on regional warming, there were also a large number of small areas with a low temperature in the influnence area of the YRB, such as UC areas (Figure 14), which was conducive to controlling the rapid surface temperature increase.
Our results further reveal that LE R n is more sensitive to R n than to LE in the influence area of the YRB, which means thst the energy regulation of R n is greater than that of LE in this area. In this paper, we explored the relationship between energy and temperature by comparing the correlation between LST and R n , LE and LE R n (see Figure 15).
Among the five land types, the relationship between LST and LE R n was negative, and the relationship with R n was positive. Generally speaking, the relationship between LST and LE R n was closer, followed by R n and LE, but this relationship did not passed the significance test (p = 0.1). It is worth noting that the relationship between LST and R n was more significant in the OU, UE, and CP regions, which indicated that R n had a more obvious regulatory effect on LST in areas with intensive human activities, while in the natural NA region, this relationship was relatively weak.
Therefore, when analyzing the urban heat island effect, the impact of LE and R n on LST or various types of land use cannot be ignored. For different types of land use, the spatial scale and scope of the study area may lead to different results. In addition, the impact of urban heat islands is far greater than the impact of urban physical boundaries [38,39]. That is to say, when analyzing the spatial difference of urban thermal environments, the setting of boundary range and land use type will not only affect the intensity of heat island, but also the corresponding LST changes within it.

5. Conclusions

According to the different levels of human influences, the land use types in the influence area of the YRB were divided into five categories: old urban areas, cultivated lands, natural and semi-natural areas, urban expansion areas and mixed pixel areas. The differences of R n and LE corresponding to different land use types and changes from 2000 to 2015 were analyzed. On the basis of the difference between LE and R n , the change scale of warming and cooling was measured, and the differences in the relationship between LST and energy consumption in the different subsurface was explored. The conclusions are as follows:
From 2000 to 2015, under the influence of different intensities of human activity and natural resilience, the energy budget of different land use types showed significant differences. The R n values in OU and UE areas were much higher than those in CP, NA and UC. The change trend of LE under the five land use types was ranked as UC > CP > NA > UE > OU. The LE values in OU and UE areas which were greatly affected by human intervention were always smaller than those in other land use types, and the rising trend of LE in OU and UE was much slower than that in UC, CP and NA.
The LE R n in different types of underlying surface showed a decreasing trend, and the change trends in OU, UE, CP and NA areas were smaller than that in UC areas. The LE R n values decreased with the increase of human impact intensity under the five land use types, indicating that human activities weakened the positive trend of LE R n and increased the warming effect. In addition, the main energy regulating factors of LST were different in different land use types. With the increase of human activity intensity related to land use, the warming/cooling effect of LE R n was gradually enhanced.
This study reveals the obvious differences in the energy budget under the impact of human activities. This could help to understand how to formulating a sustainable land management strategy to reduce the degradation of mountain forests, the rapid reduction of agricultural land area and uncontrolled urban development, which would help protect mountain forests and reduce local warming in low-altitude mountainous areas by maintaining land vegetation [40,41]. In addition, in the process of urban planning and design, urban vegetation or water can be used to regulate evaporation, thus reducing the urban heat island effect. Meanwhile, the adjustment of R n may have a more obvious effect on reducing the heat island effect [21].
In this study, we explained the difference of surface temperature under different LUCC from the perspective of energy budget, which has reference value for discussing climate change trend and urban heat island effect from the perspective of biogeography. At present, the data and method on which this study based are obtained at a large regional scale, so it is necessary to carry out quantitative research on the mechanism process on a finer regional scale, which will have more concrete practical value for future urban planning.

Author Contributions

Conceptualization, S.Z. and Y.C.; methodology, Q.C., S.Z. L.W., Y.C. and J.L.; software, Q.C., M.Z.; validation, M.Z., D.L. and W.T.; formal analysis, Q.C., L.W. and S.Z.; investigation, Q.C. and S.Z.; resources, S.Z. and Y.C.; data curation, S.Z. and Y.C.; writing—original draft preparation, Q.C. and S.Z.; writing—review and editing, S.Z., L.W., J.L. and Y.C.; visualization, M.Z., D.L. and W.T.; supervision, S.Z.; project administration, S.Z.; funding acquisition, S.Z. and Y.C. All authors have read and agreed to the published version of the manuscript.

Funding

This research was funded by National Natural Science Foundation of China, grant number 42005102, 41565008, 42071415. The Qinghai Science and Technology Department Project, grant number 2020-ZJ-711. The Second Tibetan Plateau Comprehensive Scientific Expedition, grant number 2019QZKK0104. The Henan Science & Technology Think Tank Project, grant number HNKJZK-2021-35C. Outstanding Youth Foundation of Henan Natural Science Foundation, grant number 202300410049. National Key Research and Development Program of China, grant number 2021YFE0106700.

Data Availability Statement

The Land Cover CCI Climate Research Data Package (CRDP) contains the land use data products used in the research: from 1992 to 2015, a new time series of consistent global LC maps drawn with a spatial resolution of 300 m each year. It can be downloaded in http://www.esa-landcover-cci.org/.Solar radiation data is obtained from BESS short-wave radiation products released from the Korean Seoul National University Environmental Ecological Lab (http://environment.snu.ac.kr, accessed on 15 May 2021), data download links are ftp://147.46.64.183/BessraDiation/005D/SW/ (accessed on 15 May 2021). Remote sensing data is from NASA MODIS data products (https: //modis.gsfc.nasa.gov/, accessed on 15 May 2021), they can be obtained from https://lpdaacsvc.cr.usgs.gov/appeears/task/area. Temperature interpolation data were obtained from the Resource and Environmental Science Data Centre of the Chinese Academy of Science (http://www.resdc.cn, accessed on 15 May 2021), data link is https://www.resdc.cn/data.aspx?DATAID=228. Water vapor pressure data were obtained from the Scientific Data Sharing Centre of the China Meteorological Administration (http://data.cma.cn/, accessed on 15 May 2021), it can be obtained from http://data.cma.cn/data/cdcdetail/dataCode/A.0012.0001.html (accessed on 15 May 2021).

Acknowledgments

The interval range vector data of this study is from the downstream scientific data sharing platform of the Yellow River, website address: http://henu.geodata.cn (accessed on 15 May 2021). This platform depends on the establishment of Henan University, the key laboratory of the Ministry of Education “Yellow River Middle and Digital Geography Laboratory” and the Ministry of Education “Yellow River Civilization and Sustainable Development Center” provides sustained support. Thanks also go to reviewers who provided valuable comments to improve the paper.

Conflicts of Interest

The authors declare no conflict of interest.

References

  1. Silva, A.M.; Da Silva, R.M.; Santos, C.A.G. Automated surface energy balance algorithm for land (ASEBAL) based on automating endmember pixel selection for evapotranspiration calculation in MODIS orbital images. Int. J. Appl. Earth Obs. 2019, 79, 1–11. [Google Scholar] [CrossRef]
  2. Zhang, W.; Dong, C.; Li, G.; Zhao, B.; Zhu, Y. Monitoring Radiation Budget over East Asia Using HIRS/2 Measure-Ments of NOAA Satellite. Acta Meteor Ainica 1997, 55, 42–52. [Google Scholar]
  3. Wang, S.; Zhang, Y.; Lv, S.; Shang, L.; Zhang, S. Seasonal Variation Characteristics of Radiation and Energy Budgets in Alpine Meadow Ecosystem in Maqu Grassland. Plateau Meteor. 2012, 31, 605–614. [Google Scholar]
  4. Cui, Y.; Liu, J.; Hu, Y.; Wang, J.; Kuang, W. Modeling the radiation balance of different urban underlying surfaces. Sci. Bull. 2012, 57, 465–473. [Google Scholar] [CrossRef] [Green Version]
  5. Zhang, X.; Zheng, J.; He, F.; Wang, Z. Application of MODIS BRDF/Albedo Dataset in the Regional Temperature Simulation of China. Acta Geogr. Sin. 2011, 66, 356–366. [Google Scholar]
  6. Xu, Z.; Qiu, X.; Li, S.; Shi, G.; He, Y. Analysis of surface albedo over China based on MODIS. J. Arid Land Resour. Environ. 2020, 34, 9–105. [Google Scholar]
  7. Xiao, D.; Tao, F.; Moiwo, J.P. Research Progress on Surface Albedo under Global Change. Adv. Earth Sci. 2011, 26, 217–1224. [Google Scholar]
  8. Twomey, S. Pollution and the Planetary Albedo. Atmos Environ. 2007, 41, 120–125. [Google Scholar] [CrossRef]
  9. Zheng, Y.; Huang, L.; Zhai, J. Impacts of land cover changes on surface albedo in China, the United States, India and Brazil. J. Remote Sens. 2020, 24, 917–932. [Google Scholar]
  10. Wang, Y.; Zhao, X.; Xu, X.; Niu, J.; Wang, Y. Analysis and Inversion on Surface Heat Flux with Remote Sensing in Nanjing Area. Ecol. Environ. 2016, 25, 636–646. [Google Scholar]
  11. Wang, M.; Han, Z.; Zhang, Q. Impact of land use and cover change in the semi-arid regions of China on the temperature in the early 21st century. Clim. Environ. Res. 2016, 21, 65–77. [Google Scholar]
  12. Liu, J.; Kuang, W.; Zhang, Z.; Xu, X.; Qin, Y.; Ning, J.; Zhou, W.; Zhang, S.; Li, R.; Yan, C.; et al. Spatiotemporal characteristics, patterns, and causes of land-use changes in China since the late 1980s. J. Geogr. Sci. 2014, 24, 195–210. [Google Scholar] [CrossRef]
  13. Liu, J.; Shao, Q.; Yan, X.; Fan, J.; Zhan, J.; Deng, X.; Kuang, W.; Huang, L. Geobiophysical effects of land use change on climate change. Chin. J. Nat. 2014, 36, 356–363. [Google Scholar]
  14. Li, N.; Cui, Y.; Fu, Y.; Liu, X.; Run, Y.; Li, M.; Chen, L.; Xia, H.; Lu, H. Contribution of anthropogenic CO2 in China to global radiative forcing and its offset by the ecosystem during 2000–2015. Ann. N. Y. Acad. Sci. 2021, 1488, 55–56. [Google Scholar] [CrossRef] [PubMed]
  15. Jones, A.D.; Collins, W.D.; Torn, M.S. On the additivity of radiative forcing between land use change and greenhouse gases. Geophys. Res. Lett. 2013, 40, 4036–4041. [Google Scholar] [CrossRef]
  16. Zhang, G.; Zhang, J.; Meng, P. Estimation of kilometer-scale heat fluxes over a hilly area in Northern China using an optical-microwave scintillometer. Agric. Water Manag. 2021, 244, 106582. [Google Scholar] [CrossRef]
  17. Bian, Z.; Roujean, J.; Cao, B.; Du, Y.; Li, H.; Gamet, P.; Fang, J.; Xiao, Q.; Liu, Q. Modeling the directional anisotropy of fi-ne-scale TIR emissions over tree and crop canopies based on UAV measurements. Remote Sens Environ. 2021, 252, 112150. [Google Scholar] [CrossRef]
  18. Cao, J.; Zhou, W.; Zheng, Z.; Ren, T.; Wang, W. Within-city spatial and temporal heterogeneity of air temperature and its relationship with land surface temperature. Landsc. Urban Plan. 2021, 206, 103979. [Google Scholar] [CrossRef]
  19. Tang, X.; Cui, Y.; Li, N.; Fu, Y.; Liu, X.; Run, Y.; Li, M.; Zhao, G.; Dong, J. Human Activities Enhance Radiation Forcing through Surface Albedo Associated with Vegetation in Beijing. Remote Sens. 2020, 12, 837. [Google Scholar] [CrossRef] [Green Version]
  20. Bastiaanssen, W.G.M.; Menenti, M.; Feddes, R.A.; Holtslag, A.A.M. A remote sensing surface energy balance algorithm for land (SEBAL).1. Formulation. J. Hydrol. 1998, 212–213, 198–212. [Google Scholar] [CrossRef]
  21. Zhou, S.; Wang, K.; Yang, S.; Li, W.; Zhang, Y.; Zhang, B.; Fu, Y.; Liu, X.; Run, Y.; Chubwa, O.G.; et al. Warming Effort and Energy Budget Difference of Various Human Land Use Intensity: Case Study of Beijing, China. Land 2020, 9, 280. [Google Scholar] [CrossRef]
  22. Fall, S.; Niyogi, D.; Gluhovsky, A.; Pielke Sr, R.A.; Kalnay, E.; Rochon, G. Impacts of land use land cover on temperature trends over the continental United States: Assessment using the North American Regional Reanalysis. Int. J. Climatol. 2010, 30, 1980–1993. [Google Scholar] [CrossRef] [Green Version]
  23. Benali, A.; Carvalho, A.C.; Nunes, J.P.; Carvalhais, N.; Santos, A. Estimating air surface temperature in portugal using modis lst data. Remote Sens Environ. 2012, 124, 108–121. [Google Scholar] [CrossRef]
  24. Zhang, B.; Miao, C. Spatiotemporal changes and driving forces of land use in the Yellow River Basin. Resour. Sci. 2020, 42, 460–473. [Google Scholar] [CrossRef]
  25. Shi, H.; Yu, X.; Su, Z. Research progress and prospect of ecological compensation in the Yellow River Basin. Environ. Sustain. Dev. 2021, 46, 56–60. [Google Scholar]
  26. Wang, Y.; Zheng, K.; Zhan, W.; Huang, L.; Liu, Y.; Li, T.; Yang, Z.; Liao, Q.; Chen, R.; Zhang, C.; et al. Highly effective stabilization of Cd and Cu in two different soils and improvement of soil properties by multiple-modified biochar. Ecotox Environ Safe. 2021, 207, 111294. [Google Scholar] [CrossRef]
  27. Zhang, Q.; Zhang, Z.; Shi, P.; Singh, V.P.; Gu, X. Evaluation of ecological instream flow considering hydrological alterations in the Yellow River basin, China. Glob. Planet Chang. 2017, 160, 61–74. [Google Scholar] [CrossRef]
  28. Wang, W.; Zhang, Y.; Tang, Q. Impact assessment of climate change and human activities on streamflow signatures in the Yellow River Basin using the Budyko hypothesis and derived differential equation. J. Hydrol. 2020, 591, 125460. [Google Scholar] [CrossRef]
  29. Xiao, F.; Xu, Y.; Huang, D.; Liao, Y.; Yu, L. Impact of Climate Change on Ecological Security of the Yellow River Basin and Its Adaptation Countermeasures. Yellow River 2021, 43, 10–14. [Google Scholar]
  30. Zhao, H.; He, H.; Bai, C.; Zhang, C. Spatial-Temporal Characteristics of Land Use Change in the Loess Plateau and Its Envi-ronmental Effects. China Land Sci. 2018, 32, 49–57. [Google Scholar]
  31. Wang, J.; Dun, Y. A Review on the Effects of Land Use Change on Ecosystem Services. Resour. Environ. Yangtze Basin 2015, 24, 798–808. [Google Scholar]
  32. Cui, Y.; Michael, M.E.; Li, N.; Fu, Y.; Zhao, G.; Dong, J. Land Cover Change Intensifies Actual and Potential Radiative Forcing through CO2 in South and Southeast Asia from 1992 to 2015. Int. J. Environ. Res. Public Health 2019, 16, 2460. [Google Scholar] [CrossRef] [PubMed] [Green Version]
  33. Yao, Y.; Chen, X.; Qian, J. Research progress on the thermal environment of the urban surfaces. Acta Ecol. Sin. 2018, 38, 1134–1147. [Google Scholar]
  34. Cao, Q.; Yu, D.; Sun, Y.; He, R.; Liu, Y.; Liu, Y. Research Progress on the Quantitative Relationship between Land-Use/Land-Cover Change and Climate Change. J. Nat. Resour. 2015, 30, 880–890. [Google Scholar]
  35. Roerink, G.J.; Su, Z.; Menenti, M. S-SEBI: A simple remote sensing algorithm to estimate the surface energy balance. Phys. Chem. Earth 2000, 25, 147–157. [Google Scholar] [CrossRef]
  36. Huang, L.; Zhai, J.; Sun, C.; Liu, Y.; Ning, J.; Zhao, G. Biogeophysical forcing of land use changes on local temperatures across different climate regimes in China. J. Clim. 2018, 31, 7053–7068. [Google Scholar] [CrossRef]
  37. Anderson-Teixeira, K.J.; Snyder, P.K.; Twine, T.E.; Cuadra, S.V.; Costa, M.H.; DeLucia, E.H. Climate-regulation services of natural and agricultural ecoregions of the Americas. Nat. Clim. Chang. 2012, 2, 177–181. [Google Scholar] [CrossRef]
  38. Zhou, D.; Zhao, S.; Zhang, L.; Sun, G.; Liu, Y. The footprint of urban heat island effect in China. Sci. Rep. 2015, 5, 11160. [Google Scholar] [CrossRef]
  39. Cui, Y.; Xiao, X.; Zhang, Y.; Dong, J.; Qin, Y.; Doughty, R.B.; Zhang, G.; Wang, J.; Wu, X.; Qin, Y.; et al. Temporal consistency between gross primary production and solar-induced chlorophyll fluorescence in the ten most populous megacity areas over years. Sci Rep. 2017, 7, 14963. [Google Scholar] [CrossRef]
  40. Zeng, Z.; Wang, D.; Yang, L.; Wu, J.; Ziegler, A.D.; Liu, M.; Ciais, P.; Searchinger, T.D.; Yang, Z.; Chen, D.; et al. Deforestation-induced warming over tropical mountain regions regulated by elevation. Nat Geosci. 2020, 14, 7. [Google Scholar]
  41. Ding, Z.; Zheng, H.; Li, H.; Yu, P.; Man, W.; Liu, M.; Tang, X.; Liu, Y. Afforestation-driven increases in terrestrial gross primary productivity are partly offset by urban expansion in Southwest China. Ecol Indic. 2021, 127, 107641. [Google Scholar] [CrossRef]
Figure 1. (a): The location of the nine provinces and regions in the Yellow River Basin. (b): The location of 14 provinces and regions influenced by the Yellow River Basin.
Land 10 00601 g001
Figure 2. Flow chart of land type classification.
Land 10 00601 g002
Figure 3. Spatial distribution of land use types in the influence area of the Yellow River Basin in 2015.
Land 10 00601 g003
Figure 4. Research framework of energy budget feedback of land use change.
Land 10 00601 g004
Figure 5. Spatial differences of (a) net shortwave radiation ( S w ) and (b) net long-wave radiation ( L w ) in the influence area of the YRB from 2000 to 2015.
Land 10 00601 g005
Figure 6. Statistical values of (a) net shortwave radiation ( S w ) and (b) net long-wave radiation ( L w ) based on five land types from 2000 to 2015.
Land 10 00601 g006
Figure 7. (a) Spatial variation in net radiation ( R n ) in the influence area of the YRB for 2000–2015 and (b) statistical values for the five use types.
Land 10 00601 g007
Figure 8. Net radiation ( R n ) trend of different land use types in the influence area of the YRB from 2000 to 2015.
Land 10 00601 g008
Figure 9. (a) Spatial variation of latent heat flux (LE) and (b) statistical values for the five land use types in the influence area of the YRB from 2000 to 2015.
Land 10 00601 g009
Figure 10. Latent heat flux (LE) trend under different land use types in the influence area of the YRB from 2000 to 2015.
Land 10 00601 g010
Figure 11. (a) Spatial variation ( LE R n ) and (b) statistical values for the five land use types in the influence area of the YRB from 2000 to 2015.
Land 10 00601 g011
Figure 12. Variation trends of net radiation ( LE R n ) under different land use types in the influence area of the YRB from 2000 to 2015.
Land 10 00601 g012
Figure 13. Correlation between and LE, R n and LE R n under the five land types in the influence area of the YRB from 2000 to 2015 (blue dots and blue lines represent scatter plots with LE R n , with LE, orange dots and orange lines represent LE R n scatter plots with R n ).
Land 10 00601 g013
Figure 14. The trend of land surface temperature (LST) of different land use types in the influence area of the YRB from 2000 to 2015.
Land 10 00601 g014
Figure 15. Correlation between LST,   R n and LE R n in the influence area of theYRB from 2000 to 2015 (blue dots and blue lines represent LST and R n scatter plots, red dots and red lines represent LST and LE scatter plots, and green dots and green lines represent LST and LE R n scatter plots).
Land 10 00601 g015
Table 1. Moderate Resolution Imaging Spectro radiometer (MODIS) data items and descriptions.
Data ItemsTime ResolutionSpatial ResolutionData Resource
Albedodaily500 mMCD43A3
Temperature (LST)daily1 kmMOD11A1
Latent heat flux (LE)8 daily500 mMOD16A1
Emissivitydaily1 kmMOD11A1
Table 2. Statistics on the proportion of land type change.
Land Use Change from 2000 to 2015 Unchanged Land Types from 2000 to 2015
CategoriesPercentageCategoriesPercentage
cropland to urban areas0.8%urban areas0.5%
natural and semi-natural areas to urban areas1%cropland25%
natural and semi-natural areas to cropland0.3%natural and semi-natural areas72%
cropland to natural and semi-natural areas0.4%
Publisher’s Note: MDPI stays neutral with regard to jurisdictional claims in published maps and institutional affiliations.

