Article

Changes in Coastal Agricultural Land Use in Response to Climate Change: An Assessment Using Satellite Remote Sensing and Household Survey Data in Tien Hai District, Thai Binh Province, Vietnam

1
Faculty of Natural Resources and Environment, Vietnam National University of Agriculture, Trau Quy, Gia Lam, Hanoi 131001, Vietnam
2
Department of National Remote Sensing, Ministry of Natural Resources and Environment, 83 Nguyen Chi Thanh, Dong Da, Hanoi 117000, Vietnam
3
East–West Center, 1601 East–West Road, Honolulu, HI 96848, USA
*
Author to whom correspondence should be addressed.
Land 2021, 10(6), 627; https://doi.org/10.3390/land10060627
Submission received: 6 May 2021 / Revised: 5 June 2021 / Accepted: 9 June 2021 / Published: 11 June 2021
(This article belongs to the Special Issue Land Use and Climate Change)

Abstract

:
We analyzed the agricultural land-use changes in the coastal areas of Tien Hai district, Thai Binh province, in 2005, 2010, 2015, and 2020, using Landsat 5 and Landsat 8 data. We used the object-oriented classification method with the maximum likelihood algorithm to classify six types of land uses. The series of land-use maps we produced had an overall accuracy of more than 80%. We then conducted a spatial analysis of the 5-year land-use change using ArcGIS software. In addition, we surveyed 150 farm households using a structured questionnaire regarding the impacts of climate change on agricultural productivity and land uses, as well as farmers’ adaptation and responses. The results showed that from 2005 to 2020, cropland decreased, while aquaculture land and forest land increased. We observed that the most remarkable decreases were in the area of rice (485.58 ha), the area of perennial crops (109.7 ha), and the area of non-agricultural land (747.35 ha). The area of land used for aquaculture and forest increased by 566.88 ha and 772.60 ha, respectively. We found that the manifestations of climate change, such as extreme weather events, saltwater intrusion, drought, and floods, have had a profound impact on agricultural production and land uses in the district, especially for annual crops and aquaculture. The results provide useful information for state authorities to design land-management strategies and solutions that are economic and effective in adapting to climate change.

1. Introduction

Land cover, which is shaped by land-use practices, greatly impacts the local and global climate by altering the flow of energy, water, and greenhouse gases between the land and the atmosphere [1,2]. The Intergovernmental Panel on Climate Change (IPCC) has estimated that about 24% of greenhouse gas emissions are from agriculture, forestry, and other types of land use [3]. In Vietnam, about 49.4% of the total greenhouse gas (GHG) emissions come from rice cultivation, followed by emissions from agriculture soils (26.7%), enteric fermentation (11.4%), and other sources [4]. Conversely, climate change could shrink global arable land by up to 21%, especially in some equatorial and southern hemisphere regions [5]. Vietnam is among the countries most vulnerable to climate change impacts such as sea-level rise, abnormal temperature change, and extreme weather events (floods and storms) [6,7,8]. Climate change impacts could cause a loss of agricultural land up to 14% in the Red River Delta and 24% in the Mekong River Delta [9].
Climate change also strongly impacts crop productivity and diseases [10]. The productivity of rice and corn has been predicted to decrease, and the damage due to pests and diseases will likely increase under severe weather and climate [11]. Climate change was projected to significantly reduce the yield of wheat (−17%), maize (−5%), sorghum (−15%), and millet (−10%) in Africa, and maize (−16%) and sorghum (−11%) in South Asia [12]. Coakley et al. [13] showed that rising temperature has potential impacts on plant disease through both the host crop plant and the pathogen. Host plants such as wheat and oats become more susceptible to rust diseases with increased temperature, while some forage species become more resistant to fungi with increasing temperature. Changes in moisture will also affect both host plant and pathogen organisms. Some pathogens such as apple scab, late blight, and other vegetable root pathogens are more likely to infect plants with increased moisture. The average climate change scenario for Vietnam predicts that spring rice crop productivity could decrease by 717 kg ha−1 by 2050, while summer–autumn rice crop could decrease by 795 kg ha−1. This will reduce total rice production by 1,475,000 tons. Maize production could be reduced by 782 kg ha−1, resulting in a total yield decrease of 880,000 tons [14]. Several aspects of climate change, such as rising temperatures, sea-level rise, changes in rainfall patterns, the uncertainty of supply of external inputs, changes in water salinity, and extreme climatic events, are predicted to impact aquaculture production [15]. Temperature rise, combined with poor water quality, will stress the cultured fish, which will then be susceptible to disease infection. Rising temperatures will also cause algae to bloom, thereby depleting oxygen in the water [16,17]. Climate change also has significant impacts on infrastructure such as fishing ports, storm shelters or oil and gas stations along the coastlines, and fishing boats [18].
Climate change and its impacts are already visible in many parts of the world and coastal zones are highly vulnerable to these changes [19,20,21,22]. Coastal communities around the world have developed several physical, ecological and social measures to adapt to climate change [23,24,25]. Additionally, coastal zone resources management is a critical part of Blue Economy management, especially for countries such as Vietnam [26]. In general, adaptation responses to increasing risks in coastal zones can be grouped into five categories as follows: avoidance, managed retreat, accommodation, hold the line, and loss acceptance [27]. The Vietnamese government had foreseen the impacts of climate change and had already put in place various measures to control the impacts of coastal hazards. However, with 3200 km of coastline [28], Vietnam still greatly suffers from damages caused by floods, erosion and typhoons annually [20]. In addition, most of the coastal zones of Vietnam have an elevation below 1 m, making them particularly prone to the impacts of climate change and the associated sea-level rise [20]. Recently, the National plan on adaptation to climate change during 2021 - 2030 for Vietnam was approved by the Prime Minister under Decision 1055/QD-TTg dated July 20, 2020. The plan aims to minimize the vulnerability and risks of climate change impacts by strengthening the adaptability of the communities, economic sectors, and ecosystems. Characteristics of local demographic and cultural systems play important roles in defining adaptation options. Furthermore, climate risks are location-specific and differ by region. Choosing an adaptation plan for coastal areas depends on the specific risks, the resources available, and the values that are important to the relevant stakeholder groups [27]. However, there are only a few studies of the Red River Delta regarding the impact of climate change on agricultural land use and how people have learnt to adapt to these changes.
Geographical Information Systems (GIS) and Remote Sensing have been widely applied in land-cover and land-use change analyses at different scales for decades [29]. Studying land-use/cover change often involves combining social science data with remotely sensed and other spatial data to better understand how human behavior and land cover are interrelated [30,31,32,33]. In this study, we analyzed land-use changes in the Tien Hai district from 2005 till present using the Landsat satellite data combined with household surveys regarding the impacts of climate change on agriculture productions and land uses, as well as farmers’ responses. By bridging these datasets, we aim to examine the connection between land-use change and climate change in Tien Hai district, Thai Binh province. Understanding agricultural land-use changes and farmers’ response to climate change is a necessary step in designing land-management strategies and solutions that are economical and effective in adapting to climate change in the future. This study will also contribute to existing literature that seeks to understand the dynamics of land cover and land use as a coupled human–environment system [34].

2. Materials and Methods
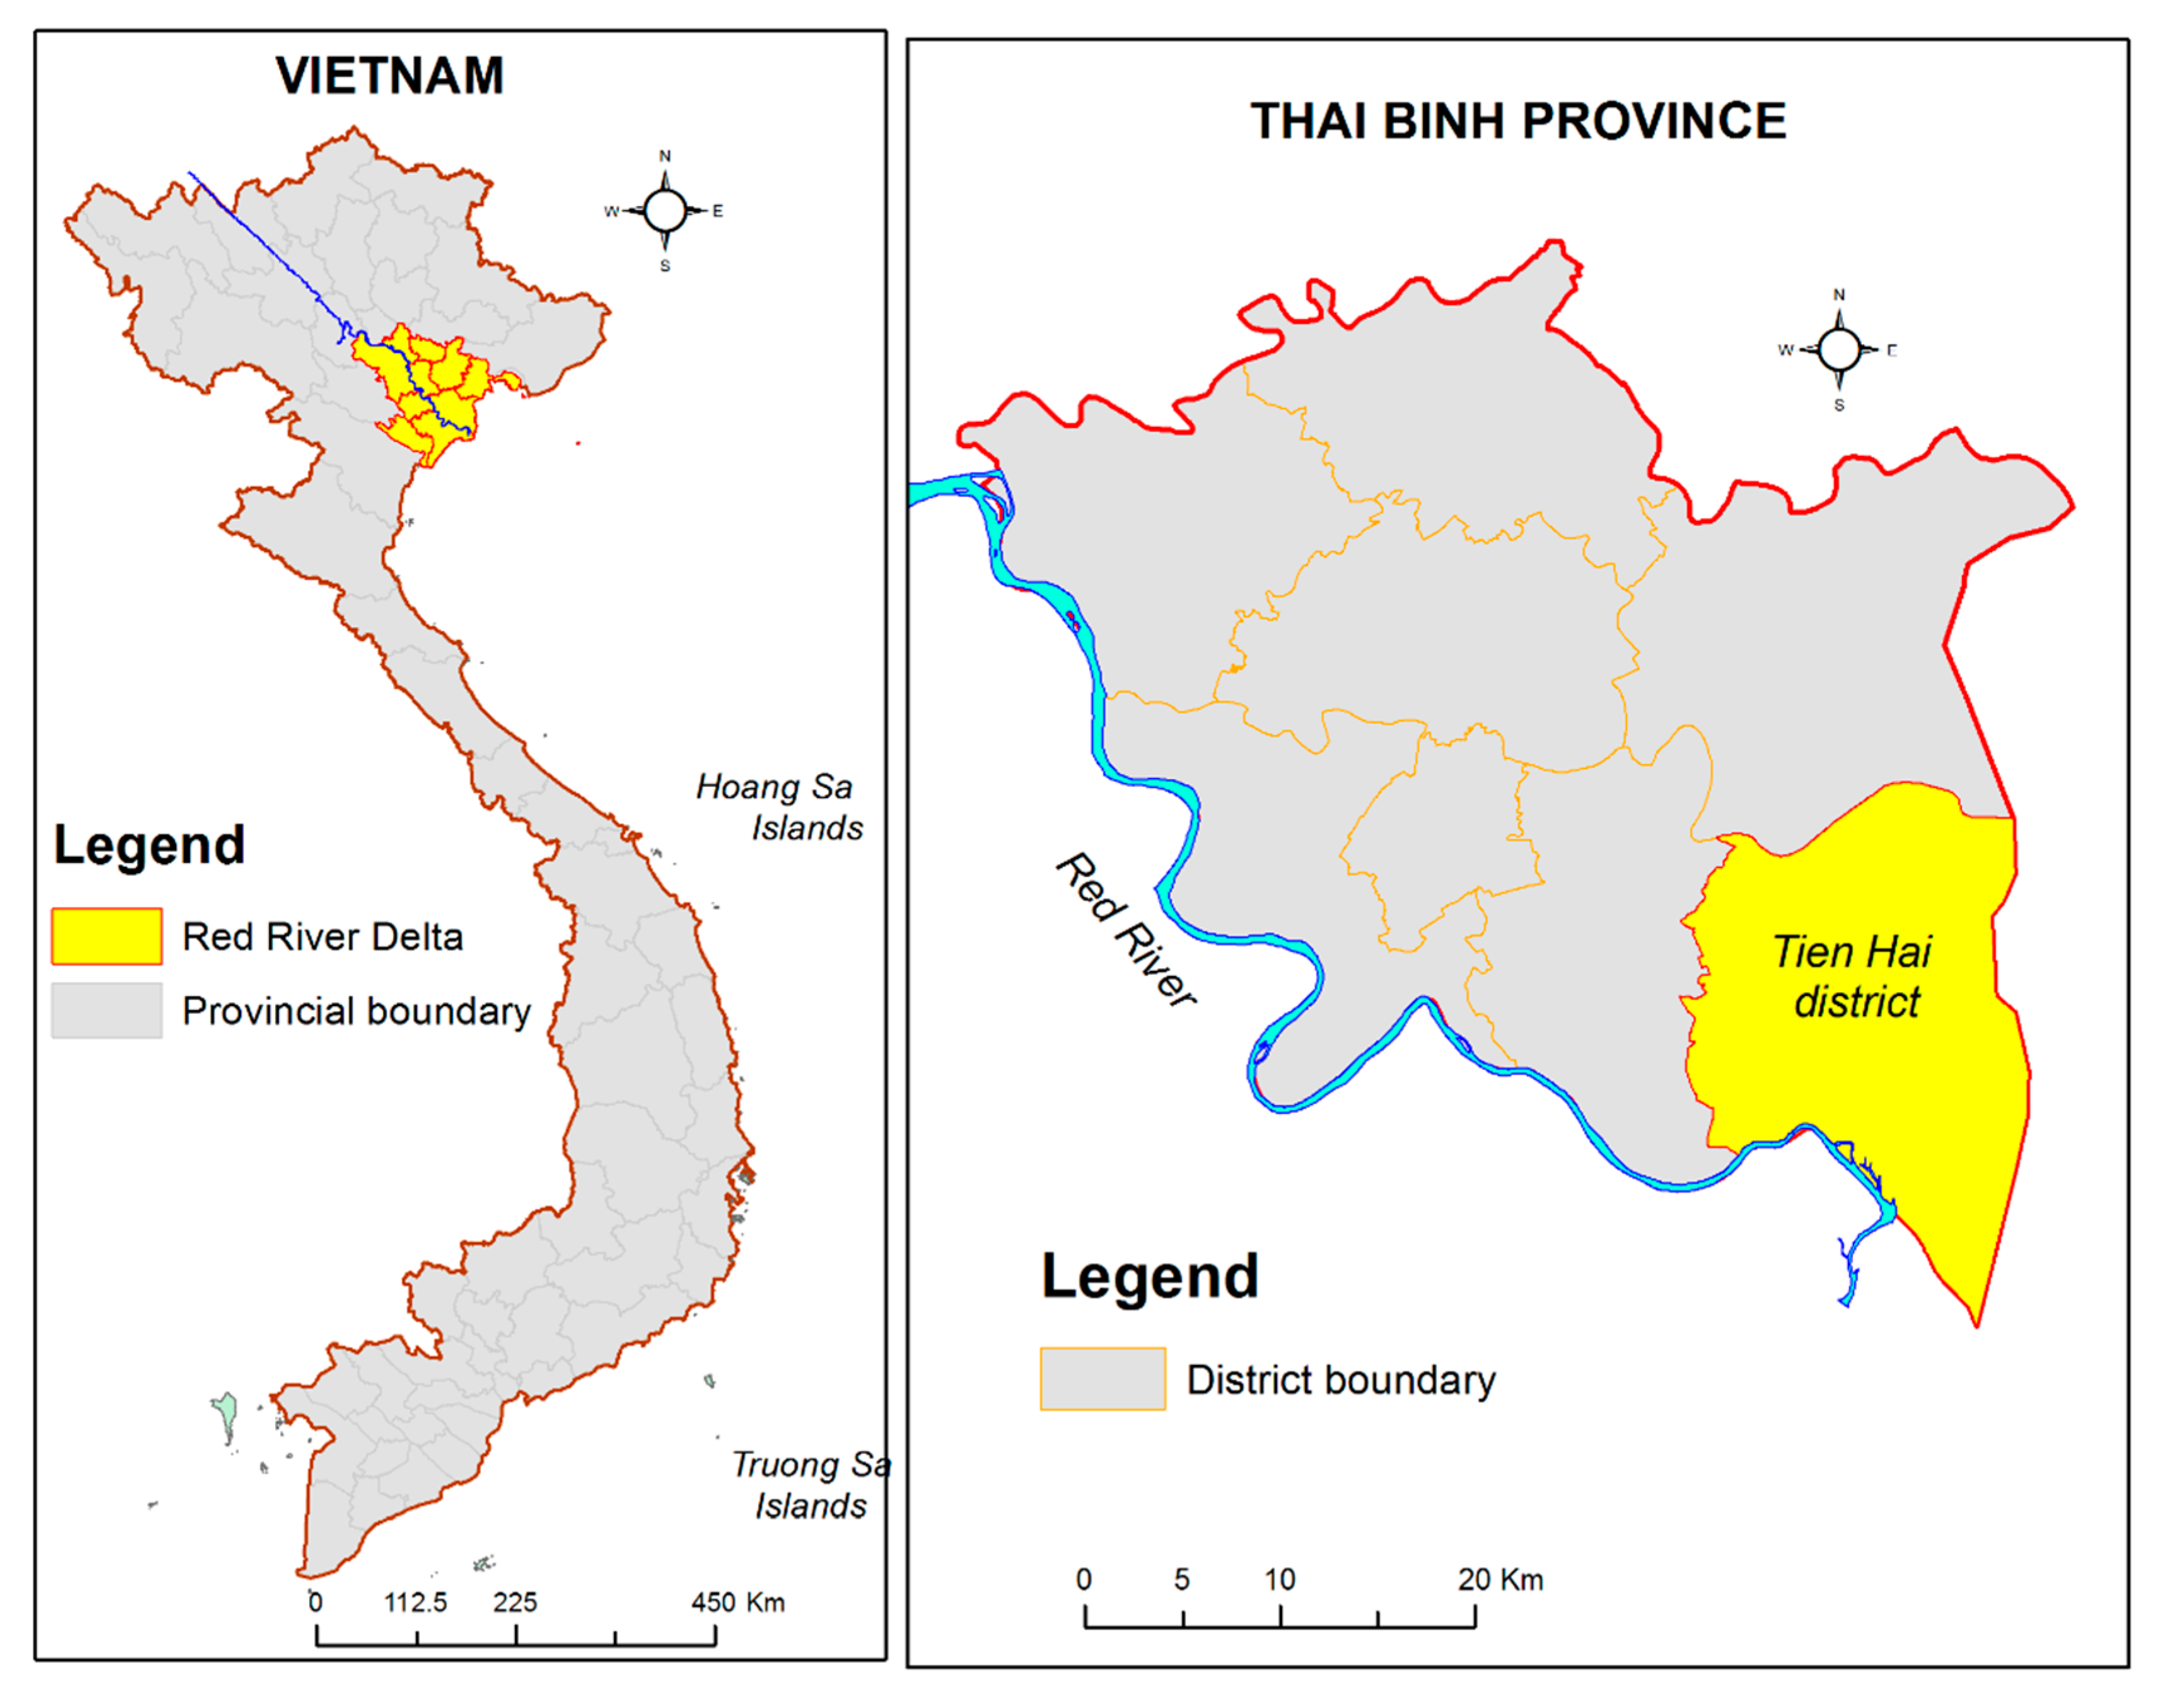
2.1. Study Area

We conducted this study in Tien Hai district, Thai Binh province, in the Red River Delta (Figure 1). Tien Hai is a district that has 23 km of coastline. There are three large estuaries named Ba Lat, Tra Ly, and Lan that form a wetland area of 6000 ha with diverse fauna and flora species [35]. The wetland in the Tien Hai district also plays an important role as it is in the core of the bio-reserves of the Red River Delta. In recent years, the Tien Hai district has been more frequently affected by unprecedented severe natural disasters and weather events such as tropical depressions, storms, floods, and cyclones. Some of the most serious storms hitting Thai Binh province in the last 10 years were storm No. 8 in 2012, storm No. 1 in 2016, and storm No. 7 in 2020, causing heavy rains and storm wind, and subsequent floods. These storms have damaged the coastal ecosystem and impacted agricultural production activities. Considering the increasing impacts of climate change in the coastal region, the socio-economic development planning of the Tien Hai district would need to estimate and integrate these impacts in planning for better land use and land management.

2.2. Data Sources

We downloaded the Landsat 5 and Landsat 8 images covering Tien Hai district, Thai Binh province in 2005, 2010, 2015, and 2020 from the United States Geological Survey (USGS) with a spatial resolution of 30 m and cloud coverage of less than 1% (Table 1). We used images acquired in the same month (July) of each year to ensure the uniformity of surface reflectance.
Six land-use categories were identified, including paddy land, annual crop, perennial crop, forest, aquaculture, and other land uses. We used both random and strategic sampling methods to generate points and labeled each one with an appropriate land-use class based on predefined image interpetation keys (Table 2). The random sampling method allowed us to generate a set of points distributed randomly in the study area. However, a shortcoming of this method is that it results in a disproportional number of points among land-use classes due to the difference in land proportion. In this case, a strategic sampling method was applied to generate additional points for classes where reference points were insufficient. For 2005, 2010, and 2015 satellite images, the ground-truthing was performed by visually interpreting both current and historical high-spatial-resolution imagery from Google Earth and labeling each point with an appropriate class. For 2020 satellite images, we collected reference points by a combination of a field survey in July 2020 and visual interpretation of high-spatial-resolution imagery from Google Earth. For each class, we collected 60 sampling points and used 30 samples for supervised classification and the remaining 30 samples for accuracy assessment.
To understand the underlying causes of land-use changes in the district, we also collected primary data through structured interviews with local farmers on the status of land uses, crop patterns, impacts of climate change on agriculture productions, and farmers’ responses. For the impact of climate change on agricultural production, we asked questions for the last 10-year period. We used the stratified random sampling method to select 150 households from two different groups for conducting structured interviews. Each group consisted of 75 households, in which one group had mainly crop production activity, and the other group had mainly aquaculture production activity.

2.3. Image Processing

Satellite images obtained from USGS had already been atmospheric- and topographic-corrected by the producer. Therefore, the image only needed to be converted from the original coordinate system (WGS-84) to the Vietnam national coordinate reference system (VN-2000) (zone 3°, meridian 105.5°) using the coefficients according to the decision of the Vietnam Ministry of Natural Resources and Environment (No. 05/2007/QD-BTNMT). The satellite image interpretation was performed in eCognition Developer and ArcGIS 10.3. Six land-use types were mapped, including paddy, annual crop, perennial crop, forest, aquaculture, and others. We used the Kappa statistic to measure the difference between the true agreement of the classified map and the chance agreement of the random classifier compared to the reference data [36]. Conventionally, Kappa values of more than 0.80 indicate good classification performance. Kappa values between 0.40 and 0.80 indicate moderate classification performance, and Kappa values of less than 0.40 indicate poor classification performance [36,37].

3. Results and Discussion

3.1. Satellite Image Classification

Based on the classification results, land-use maps for each year were produced with six land-use categories such as paddy, annual crop, perennial crop, aquaculture, forest, and other land uses (Figure 2).
The overall accuracy and Kappa coefficient were obtained for each classified image. The overall accuracy of the classification results ranges from 84.44% to 87.22%, and the Kappa Coefficient ranges from 0.7901 to 0.8217 (Table 3, Appendix A).
Areas of each land-use category for each year were calculated (Table 4). In general, paddy land was the major agricultural land-use type with 11045.42 ha in 2020, occupying more than 40% in all periods, and it slightly decreased over time. The second-largest agricultural land-use type was aquaculture with 3115.91 ha in 2020, and it increased by 566.88 ha between 2005 and 2020. Mangrove forest plays an important role in coastal line protection in the district. There was a positive change in the mangrove forest area in the district from 547.75 ha in 2005 to 1320.35 ha in 2020. The annual crop area was relatively stable during the study period, with 464.93 ha in 2020. The perennial crop area had the smallest area, and it decreased over time from 200.2 ha in 2005 to about 90.5 ha in 2020.

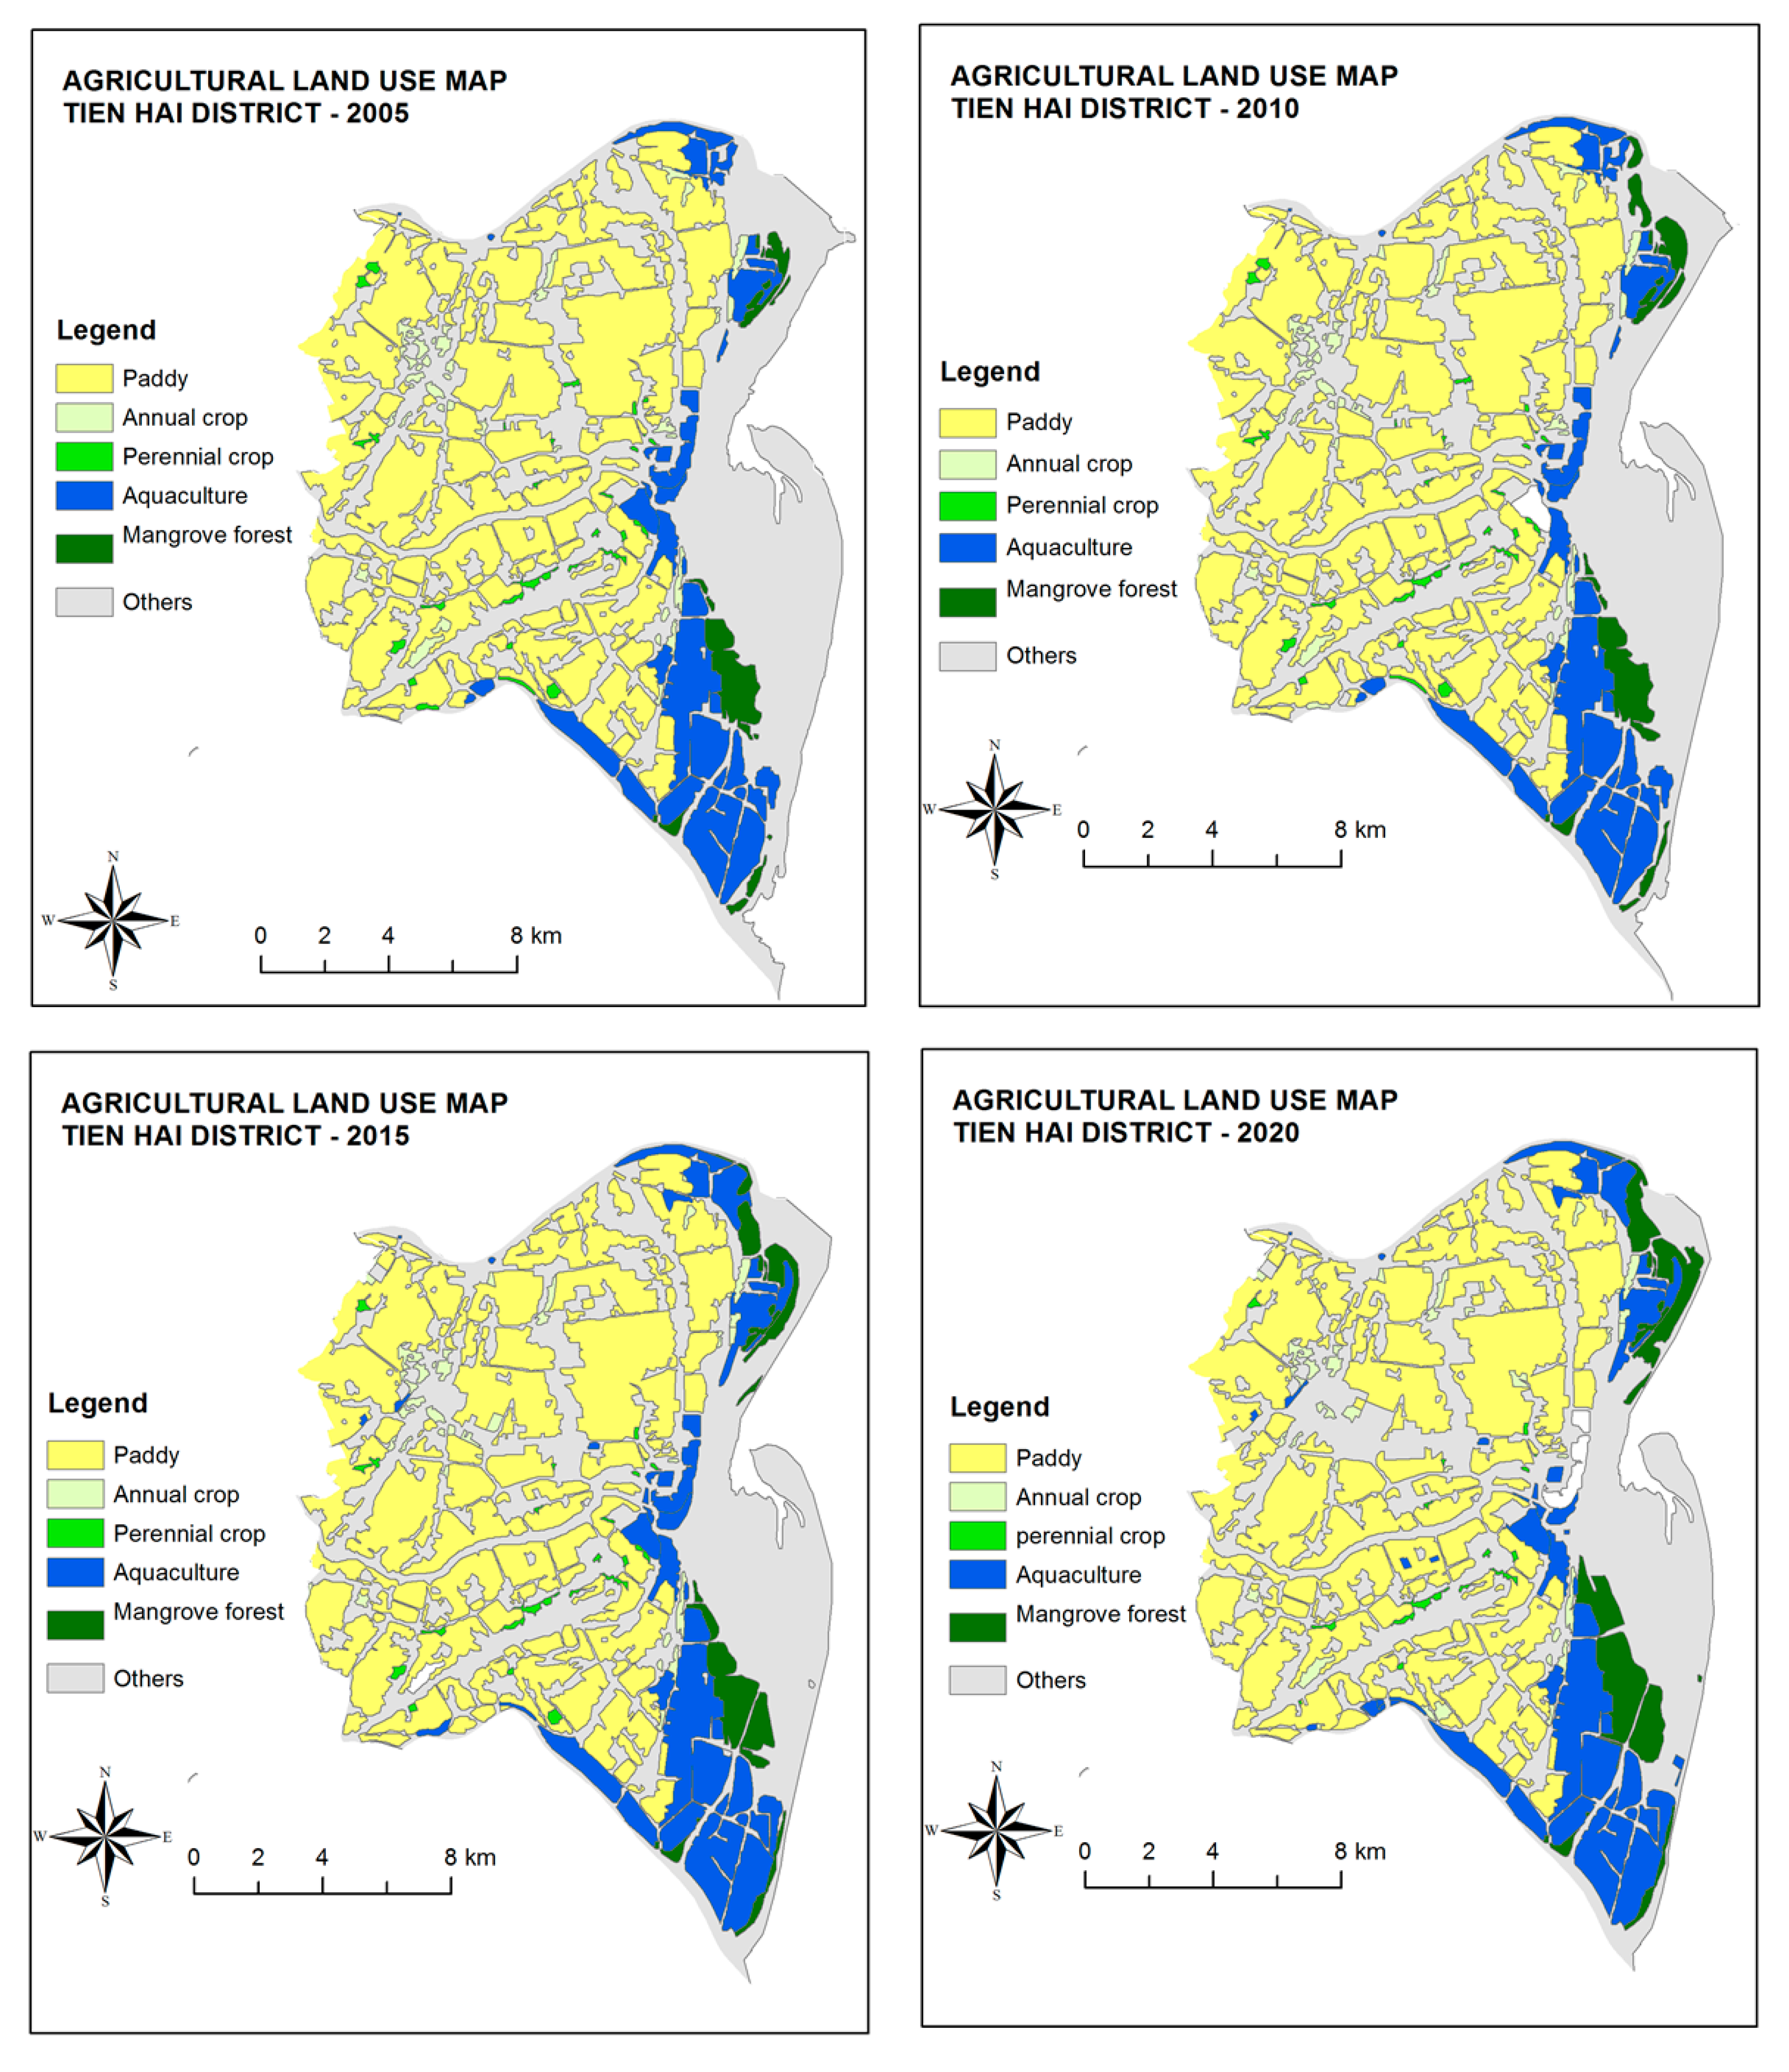
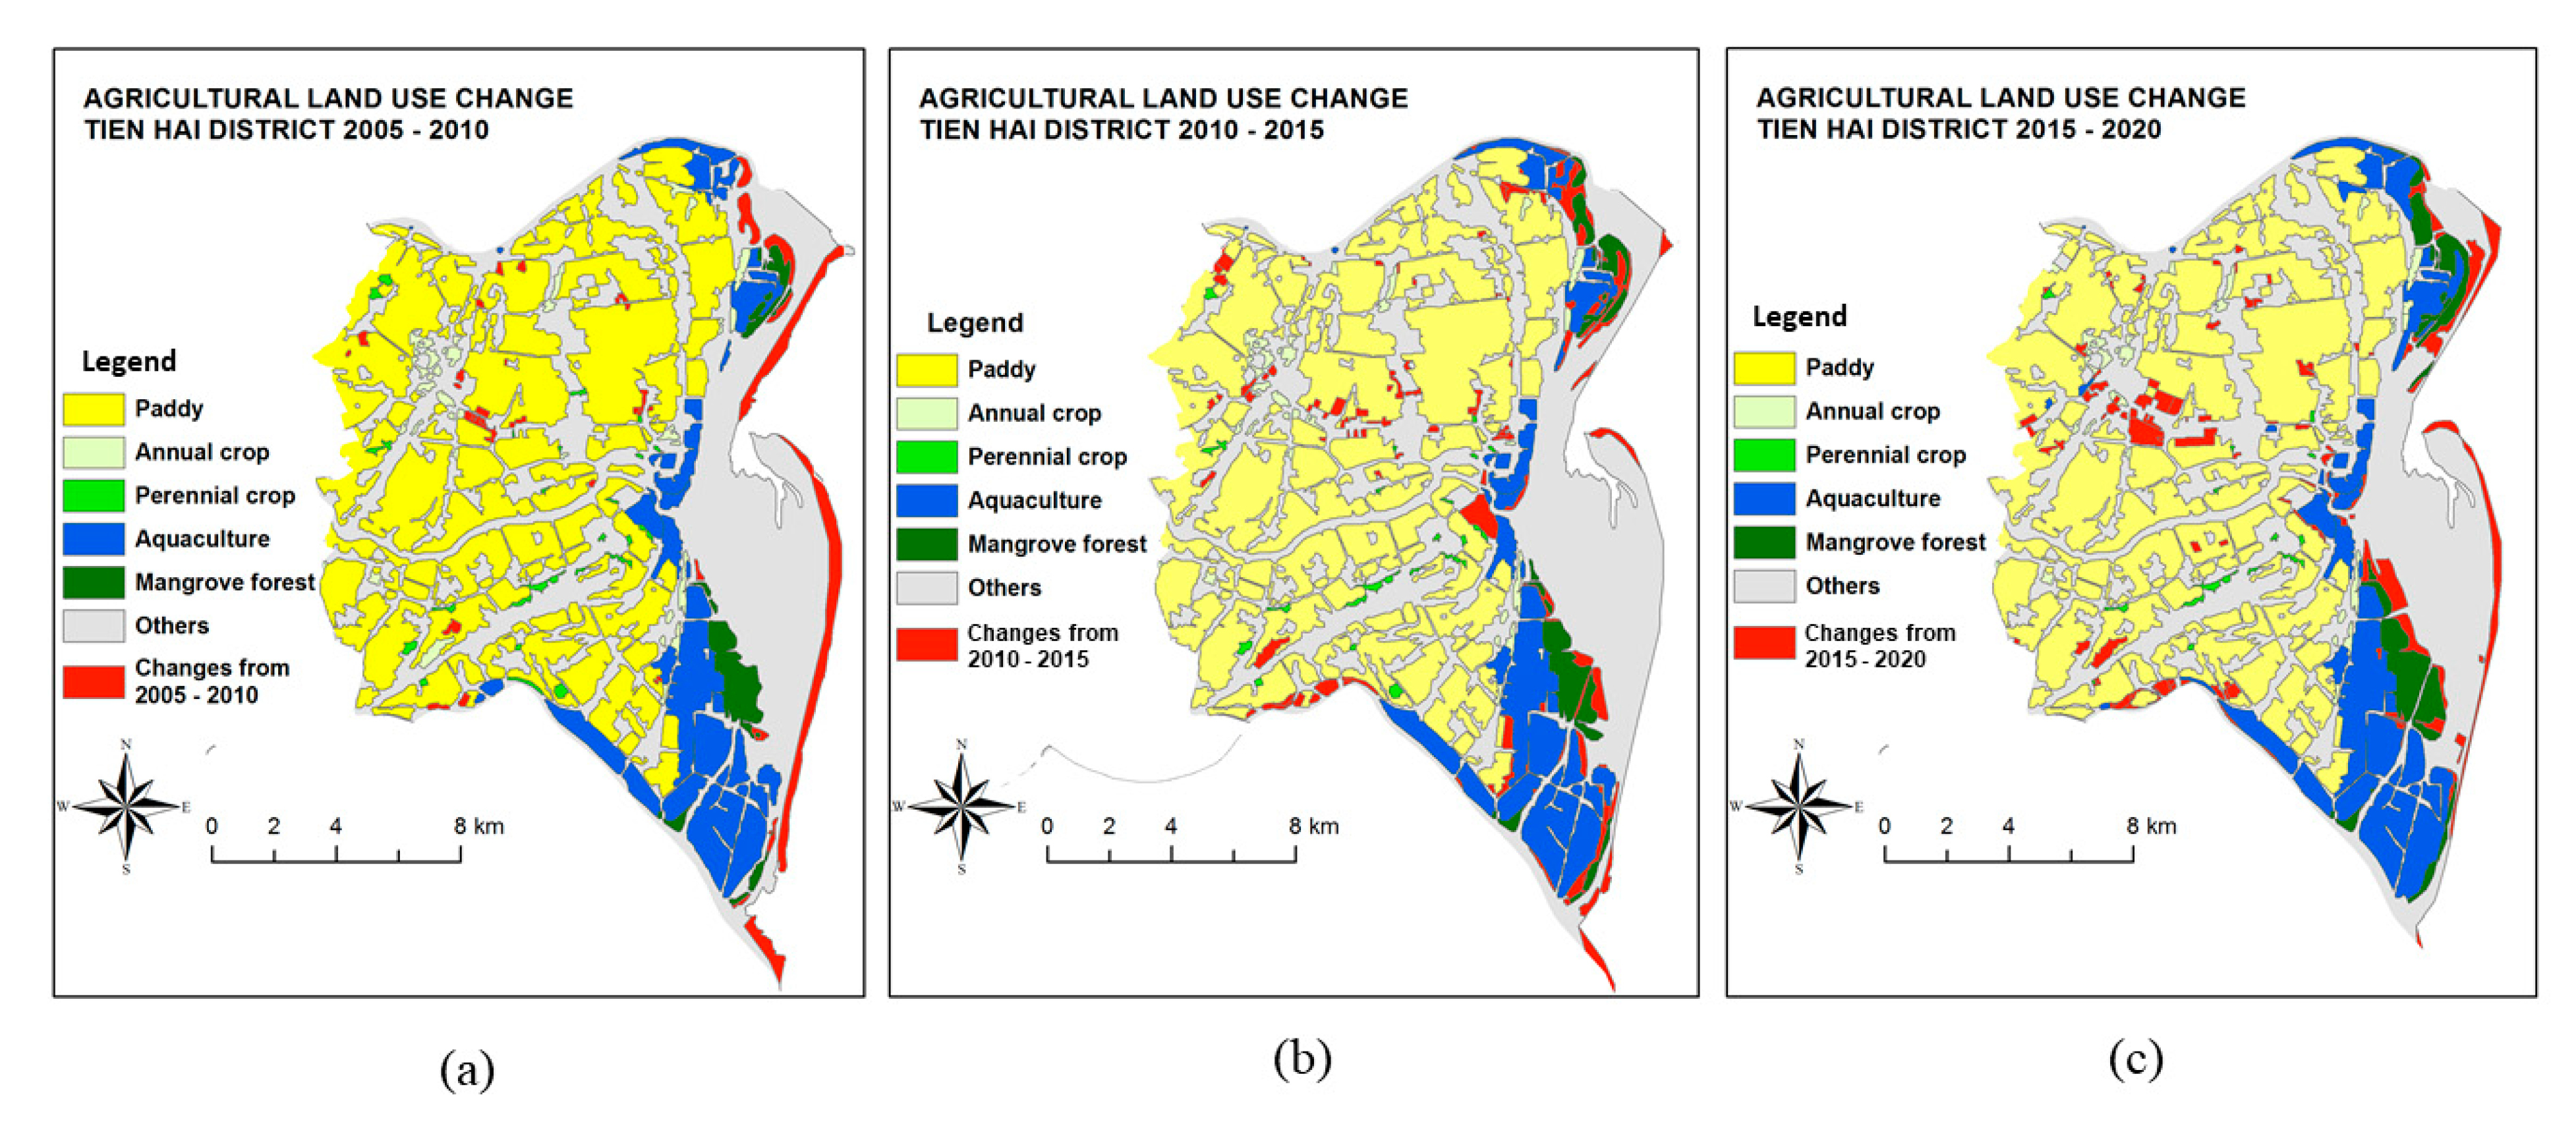
3.2. Land-Use Changes Over Time

We performed an overlay analysis in ArcGIS to identify the change in areas across three time periods: 2005–2010, 2010–2015, and 2015–2020 (Figure 3). Analyzing change in different time periods helps us to understand when and where changes happen.
Period 2005–2010: From 2005 to 2010, aquaculture and forest area increased by 247.53 ha and 189.05 ha, respectively. Meanwhile, annual crop and perennial crop reduced by 8.15 ha and 14.83 ha, respectively. Other land-use types (non-agricultural land) shrunk by 374.53 ha. In Figure 3, we show that the largest change occurred along the coast, including the aquacultural and forest areas. According to the land-use change matrix between 2005 and 2010, about 247.53 ha, mostly mudflat and unused land, was converted to aquaculture, 196.23 ha was converted forest, and 38.43 ha was converted to paddy land. There were losses of paddy land to annual crop and other land-use types as well. The perennial crop experienced the least change (Table 5).
Period 2010–2015: This period continued to see a fast growth of aquaculture and forest areas. The increasing trend in forest areas implied that the local authority had given special attention to the role of mangrove forests in protecting coastal areas, especially the agricultural systems. Paddy, perennial crop, annual crop, and other land uses continued to shrink.
The land-use change trajectory between 2010 and 2015 showed that most of the land-use change occurred on paddy, aquaculture, forest land, and other land uses (Table 6). The aquaculture area increased sharply, of which 82.63 ha was from paddy, and 238.4 ha from other land uses (mostly mudflat). About 15.57 ha of forest was lost due to the effect of storm No. 8 in 2012 and some illegal conversion of forest land to aquaculture during this period, but overall, the forest area still increased by 193.55 ha, thanks to the reforestation project. Specifically, about 112.32 ha of paddy land was converted to other land uses such as for development projects (residential areas, industrial parks, government offices, roads, etc.). Some of the paddy areas were also converted to vegetable production and aquaculture production. The conversion of paddy land to other uses often strictly follows the local and state land-use planning and the directives of government agencies.
Period 2015–2020: Land use change trajectory in this period is mainly in the form of a decrease in paddy and perennial crops and the increase in aquaculture land and forest land. Specifically, mangrove forests increased faster than in the last two periods (390 ha). Of this, about 16.14 ha of unproductive and aquaculture farms in violation were converted for mangrove reforestation. The remaining mangrove plantation area was on coastal mudflats. The aquaculture still increased about 36.45 ha, mostly from the conversion of paddy land and the expansion of mudflats along the coast. In addition, another 239.6 ha of paddy was converted to development projects. This period also witnessed an increase in annual cropland, mainly from the conversion of paddy (70.45 ha) (Table 7).
Overall, the land-use change analysis over three time periods showed that paddy-land and land under perennial crops decreased by 485.58 ha and 109.7 ha, respectively. Meanwhile, aquaculture and forest increased by 566.88 ha and 772.6 ha, respectively. The land under annual crops experienced the least change.
The major land-use changes occurred on paddy land and other land-use types. The first trajectory was the shifting from paddy to aquaculture and development projects. The second trajectory was the shifting from other land-use types (mudflats, unused land) to aquaculture, mangrove forest, and paddy.

3.3. Impact of Climate Change on Agriculture Production

In the last 2 decades, the agriculture production of the Tien Hai district has been affected more frequently and severely by climate change, especially in terms of crop and aquaculture productions. Results from the survey of households showed that the most commonly perceived impacts of climate change on agricultural production included extreme weather events (hot and cold), salinization, drought, and the impact of storms on rice, vegetable crops, and aquatic animals (fish, shrimp, clams).

3.3.1. Impacts of Climate Change on Crop Production

Based on the household interviews, we found that extreme cold events had the strongest damaging effect on crops in the Tien Hai district. Out of 75 respondents, 69.33% believed that extreme cold events caused their crops to die off, especially for leafy vegetables and rice. Sixty-four percent of the farmers said that their crops grew poorly, and 37.33% of them noticed lower productivity (Table 8). The spring rice crop in Tien Hai starts in January and ends in May (according to the lunar calendar). In the spring rice crop in 2011, the number of cold days lasted up to 47 days, of which there were 30 damaging cold days causing rice to grow slowly; some farmers had to replant their fields due to the damage to rice seedlings. The spring rice crop in 2011 was prolonged, and flowering was late. As a result, farmers had a lower harvest. The damaging cold in February 2014 also caused 851 hectares of rice in the Tien Hai district to be re-cultivated.
Saltwater intrusion has been a common problem in the Tien Hai district as well. The highest salinity level at monitoring stations during 2003–2012 in Thai Binh rivers ranged from 21 to 27 ppt. Saltwater intrusion extended 20–25 km into rivers and canals with a salinity rate up to 31.8 ppt recorded at Ba Lat estuary in Tien Hai district [38]. The survey results in three communes showed that 74.67% of surveyed households had their fields affected by saltwater intrusion, which caused their fields to be abandoned for a certain period, especially in paddy fields. Saltwater intrusion was therefore identified as the major cause of paddy area reduction over the study period. Sixty-four percent of the surveyed households said that their crop productivity was reduced. Nguyen et al. [39] found that the yield of paddy rice was strongly decreased in the fields close to dyke or salt fields. Considering the survival rate of paddy rice to the salt concentrations, Lien et al. [40] evaluated the survival of some rice varieties such as Doc Phung, CTUS4, CTUS1, CTUS7, and IR28, and found that if the salt concentration was higher than 0.5 ppt, the survival rate was 78.33%, and if it was higher than 10 ppt, the survival rate was reduced to 46.67%. In this study, 33.33% of the surveyed households said that their crops were destroyed by saltwater intrusion (Table 8).
For the extremely high-temperature effect, during the period 1960–2010, the average annual temperature increased by 0.8 °C in Thai Binh [41]. Meteorological data in Thai Binh province showed that in 2016, the province faced a prolonged period of extremely hot days that lasted over 40 days. This was the highest recorded level since 1988, with the average temperature ranging from 35 to 39 °C. In 2017, the temperature increased to an unprecedented high, which was 40 °C. As the temperature increased, 62.67% of the surveyed households experienced water shortages for irrigation. As much as 45.33% of the surveyed households believed that high temperatures affected the incubation period and disease severity of their crops. About 40% of the surveyed households claimed lower productivity due to extremely high temperatures, and another 40% of respondents said that some of their crops were destroyed as well (Table 8).
Regarding the storm effects, it is estimated that Vietnam is hit by 4.3 storms per year. The government’s official data show that between 1990 and 2010, Vietnam experienced 74 flood catastrophes [42]. Tien Hai district is located near the coast, and the agricultural activities are often severely affected by storms. In 2012, Tien Hai district was seriously damaged by a super typhoon No. 8 named “Son Tinh”, the biggest storm recorded in the past 10 years. Farm’s properties and thousands of hectares of crops were damaged. The summer rice crop in Tien Hai starts in June and ends in late October (according to the lunar calendar). Tien Hai district often has rice harvesting time 1 or 2 weeks later than other districts in the region. Therefore, it suffers more from damage by storms and typhoons. Typhoon No. 7 in October 2020, with heavy rains and floods, came before the harvesting time, affecting a large production area of the district. According to the survey, 86.67% of the households experienced property damage, and 69.33% of the households experienced lower crop productivity. About 33.33% of respondents reported that their farms were affected by soil erosion due to floods (Table 8).

3.3.2. Impacts of Climate Change on Aquaculture

Impacts of climate change on aquaculture are reflected by temperature changes in both water and air and other alterations in oceanographic conditions, including currents, wind speed, and waves. Extreme weather events are important effects, such as storms causing material damage or flooding of freshwater farms. Fish or shellfish will suffer from different stresses and physiological effects, which may further increase their susceptibility to diseases and infections [43,44]. Temperature is one of the most important environmental variables influencing the growth and metabolism of fish [45], and water temperature in most culture systems is under the control of the climate [46].
For temperature effects, the temperature recorded in Thai Binh province in January 2016 was at 5–6 °C, the lowest level in the last 40 years. Out of 75 surveyed households, 70.67% of them reported that they had lower harvests due to the extreme cold event in January 2016. A quantity of 52.2% of households had their aquatic animals die of cold, and 35.5% of the households lost their harvest totally (Table 9). Statistics recorded in 1 day in the district showed that about 62.33 ha of aquaculture was affected and caused the loss of more than 21 tons of striped bass—a high-economic-value fish. On the other hand, the extremely hot event also strongly affects aquatic animals. The high temperature often increases evaporation and therefore increases salinity in ponds. The dissolved oxygen level in ponds will decrease as the temperature increases. Dissolved oxygen is one of the most important water-quality indicators that pond owners need to be aware of. Oxygen dissolves in water at very low concentrations. Dissolved oxygen concentrations below 3 ppm put stress on most warm-water species of fish, and concentrations below 2 ppm will kill some species [47]. The temperature also affects the growth and survival of shrimps. The rate of growth increases with temperature; however, higher temperature causes mortality. Temperatures between 26 °C and 30 °C are considered ideal in terms of maximum production. Temperatures above 32 °C should be a cause of concern [48]. Tiger shrimps can withstand the temperature of 28 °C but grow relatively slowly. They grow faster with temperatures above 30 °C, but are more susceptible to disease, especially MBV (Monodon baculovirus). In this study, 65.33% of the surveyed households said that their aquatic animals were killed by excessive high-temperature events. It also negatively changes the water environment, as claimed by 85.33% of the surveyed households, and increases susceptibility to disease, as reported by 61.2% of surveyed households (Table 9).
Storms and tropical depressions can destroy the infrastructure of aquaculture areas such as irrigation canals, tents, supplies, and equipment, as well as through erosion of dikes, or greatly damage the infrastructure of aquatic resource exploitation. A percentage of 89.33 of surveyed households had farm properties damaged due to storms, and the most severe damage recently was observed in 2016. In the Red River Delta, floods usually occur primarily after storms or extreme rainfall events [49]. The water level that increases to a certain point and overflows into aquaculture ponds could alter the salinity level and affect water quality. About 70.67% of the surveyed households in the Tien Hai district reported that the water quality of their ponds had been affected by floods. As a result, floods increased the risk of water-borne diseases, as reported by 62.67% of households. Roughly, 37.3% of them lost almost all their income from aquaculture due to storm No. 1, named “Mirinae”, in July 2016 (Table 9). This was attributed to the fact that the floods often swept away the fish, causing the loss of not only the ability to sell the fish but also wiping out the investment that had been made in the farms.

3.4. Farmers’ Responses to Climate Change

Under the increasing occurrence of extreme weather events due to climate change in the Tien Hai district, farmers have adopted several practices to minimize agricultural production losses. We studied the farmers’ responses to climate change of two previously defined groups: crop production and aquaculture production (Table 10). We found some commonalities as well as differences between the two groups in terms of their responses to climate-change impacts. For both the groups, changing varieties of either crops or species was the most popular choice—77.33% for the crop-production group and 80% for the aquaculture-production group. The use of adapted crops and varieties is suggested by the United Nation’s Food and Agriculture Organization (FAO) among the climate-smart practices for risk reduction, soil and water conservation, and efficient water management [50]. Choosing adaptable crops and varieties helps to reduce the negative impacts of climate change on agricultural systems, and at the same time to ensure stable agricultural production.
For crop production, most farmers adopted new rice varieties such as BC15, RVT, CNR36, D-uu527, Thaixuyen111, and TH1 that have the characteristics of salt tolerance, disease resistance, short duration, hard stems, high quality, and productivity to replace the old rice varieties such as Tapgiao 838, 903, CT16. The second most common adaptation strategy, as reported by 74.67% of households, was adjusting the rice crop timing to avoid adverse effects from abnormal climatic events such as extreme temperature events, floods, and storms. The spring rice crop in Tien Hai often starts in January. This is also the coldest time of the year. If extremely cold weather is predicted by the National Centre for Hydro-Meteorological Forecasting, farmers often delay the rice transplanting to avoid any damage. Using short-duration rice varieties allows farmers to harvest their crops before the flooding season begins. Adjustments in cropping patterns were adopted by 33.33% of households, for example, diversified crops and different crop rotations. About 29.33% of the households converted their cropland to aquaculture, where plots had been affected by saltwater intrusion. The conversion to aquaculture often requires high capital investment; thus, only wealthy households can use this adoption approach. In addition, the conversion from paddy to other land uses in Vietnam must be approved by the provincial people’s committee when the area is less than 10 ha or by the Prime Minister when an area is more than 10 ha. Farmers are not allowed to convert their rice land to other land uses unless approved by government agencies. Therefore, areas affected by saltwater intrusion or unsuitable for rice should be evaluated and adjusted in the land-use planning at the district and provincial levels. About 21.33% of the surveyed households had gradually shifted their occupations from pure agricultural activities to more diversified income-generating activities such as working in garment factories and the assembling industry.
For aquaculture production, the most common adaptation strategy was changing aquatic species, as reported by 80% of households; for example, changing from red clams to white clams or from black tiger shrimps to white leg shrimps. The second most common strategy is adjusting cultivation techniques, with 72% of households applied. Especially, farmers pay more attention to the selection of high-quality breeding and technical requirements (pH, salinity level, temperature, density, pond size, and depth). Some large farms and wealthy households have hired specialized experts or employed high-tech equipment for the farm’s water quality monitoring. To increase resistance to floods and storms, 42.5% of the households had renovated their farms by raising the banks and fences and setting up water-regulation systems to avoid damages. Crop rotation in shrimp farming was also adopted by 32.4% of the surveyed households in the district. When more frequently hit by storms and floods, some farmers often reported a loss when raising two shrimp crops. High salinity, hot weather, and polluted water environment make shrimps susceptible to diseases and cause a low survival rate in the second crop. Therefore, some farmers choose to cultivate fish in the second crop or switch to raising fish and brackish water shrimp such as tilapia because of their ability to adapt to a wide range of salinity and the advantage of the presence of most natural food sources in ponds.

4. Conclusions

The land-use change analysis in the Tien Hai district over three time periods showed that the most significant changes occurred for paddy land, aquaculture land, and forest land. We identified the land-use change trajectories through change-detection analysis. Specifically, paddy land decreased, while forest land and aquaculture land increased. Most of the changes in paddy land result in increases in land under annual crops, aquaculture, and development projects. The aquaculture land expanded by 566.88 ha—mostly from changes in mudflat areas and paddy lands. The forest land expanded quickly from 547.75 ha in 2005 to 1320.35 ha in 2020, owing to reforestation projects. Climate change has had profound impacts on aquaculture production and is one of the major factors leading to land-use change. Owing to the impacts of saltwater intrusion and floods, a large area of paddy that is no longer suitable for rice has been converted to aquaculture production and other vegetable crops. Coastal protection, under the Blue Economy framework, has gained the special attention of authorities to minimize the impacts of sea-level rise, saltwater intrusion, and tropical storms. As a result, more than 700 ha of mangrove forests have been planted along the coast between 2005 and 2020. The agricultural land-use changes over the past few years have been driven by the impact of climate change. In addition, farmers have also adopted some strategies in response to climate change, such as adopting new plant varieties and animal species, applying new technologies, or adjusting crop patterns and calendars. However, agriculture production is still being affected by extreme weather events, storms, and floods, as reported by a large proportion of the farm households. Our study suggests that the agricultural land use in the Tien Hai district should continue to be evaluated and adjusted to be economical and effective in adapting to climate change. Findings of this study also added to existing knowledge of land-use change and climate change in the Red River Delta, which is essential for adaptation planning and integration at the national and sub-national levels. However, this study was limited to only assessing the land-use change and farmers’ response to climate change through remote-sensing analysis and the descriptive statistical analysis of data based on household surveys. Future studies could expand on this by conducting vulnerability assessments, cost–benefit analysis, and identification of adaptation priorities in the study area. These would be essential for the successful implementation of a National Adaption Plan for the 2021–2030 period and for Vietnam’s Blue Economy management. Meteorological factors based on remote sensing could also be included for the in-depth analysis and modeling of land-use change and climate change relationships.

Author Contributions

Conceptualization, A.T.N. and D.H.N.; methodology, A.T.N. and D.H.N.; formal analysis, A.T.N., D.H.N. and H.P.T.N.; writing original draft, A.T.N., D.H.N., T.T.N., L.T.N. and S.S.; funding acquisition, A.T.N. and D.H.N. All authors have read and agreed to the published version of the manuscript.

Funding

This research was supported by the SAHEP-VNUA project, under grant code ĐTKHCN.WB.03/20/SAHEP-VNUA.

Institutional Review Board Statement

Not applicable.

Informed Consent Statement

Not applicable.

Data Availability Statement

Not applicable.

Conflicts of Interest

The authors declare no conflict of interest.

Appendix A

Table A1. Accuracy assessment for land-use map in 2005, 2010, 2015, and 2020.
Reference Points 2005
PaddyAnnual CropPerennial CropAquacultureForestOtherColumn Total
Classified image 2005 (LT51260462005195BJC00)Paddy263020031
Annual crop225200231
Perennial crop002312228
Aquaculture110261231
Forest003025028
Others112122431
Row total303030303030180
Producer’s Accuracy86.6783.3376.6786.6783.3380.00
User’s Accuracy83.8780.6582.1483.8789.2977.42
Overall Accuracy82.77
Kappa Coefficient0.7901
Reference Points 2010
PaddyAnnual CropPerennial CropAquacultureForestOtherColumn Total
Classified image 2010 (LT51260462010193BKT00)Paddy272020132
Annual crop126201131
Perennial crop002402228
Aquaculture201250129
Forest002227233
Others021102327
Row total303030303030180
Producer’s Accuracy90.0086.6780.0083.3390.0076.67
User’s Accuracy84.3883.8785.7186.2181.8285.19
Overall Accuracy84.44
Kappa Coefficient0.8023
Reference Points 2015
PaddyAnnual CropPerennial CropAquacultureForestOtherColumn Total
Classified image 2015 (LC81260462015191LGN01)Paddy282010031
Annual crop025200027
Perennial crop022500128
Aquaculture200262232
Forest003128234
Others010202528
Row total303030303030180
Producer’s Accuracy93.3383.3383.3386.6793.3383.33
User’s Accuracy90.3292.5989.2981.2582.3589.29
Overall Accuracy87.22
Kappa Coefficient0.8217
Reference Points 2020
PaddyAnnual CropPerennial CropAquacultureForestOtherColumn Total
Classified image 2020 (LC812604620200705L1TP)Paddy283020134
Annual crop125200028
Perennial crop002402228
Aquaculture111271132
Forest001027129
Others012102529
Row total303030303030180
Producer’s Accuracy93.3383.3380.0090.0090.0083.33
User’s Accuracy82.3589.2985.7184.3893.1086.21
Overall Accuracy86.67
Kappa Coefficient0.8115

References

  1. Bennett, L. Deforestation and Climate Change; Climate Institute: Washington, DC, USA, 2017; Volume 1400. [Google Scholar]
  2. Lawrence, D.; Vandecar, K. Effects of tropical deforestation on climate and agriculture. Nat. Clim. Chang. 2015, 5, 27–36. [Google Scholar] [CrossRef]
  3. Shukla, P.; Skea, J.; Calvo Buendia, E.; Masson-Delmotte, V.; Pörtner, H.; Roberts, D.; Zhai, P.; Slade, R.; Connors, S.; Van Diemen, R. Climate Change and Land: An IPCC Special Report on Climate change, Desertification, Land Degradation, Sustainable Land Management, Food Security, and Greenhouse Gas Fluxes in Terrestrial Ecosystems; IPCC: Geneva, Switzerland, 2019; p. 864. [Google Scholar]
  4. Crumpler, K.; Dasgupta, S.; Federici, S.; Meybeck, A.; Bloise, M.; Slivinska, V.; Salvatore, M.; Damen, B.; Loeben, S.V.; Wolf, J.; et al. Regional analysis of the nationally determined contributions in Asia–Gaps and opportunities in the agriculture and land use sectors. In Environment and Natural Resources Management Working Paper No. 78; FAO: Rome, Italy, 2020. [Google Scholar]
  5. Zhang, X.; Cai, X. Climate change impacts on global agricultural land availability. Environ. Res. Lett. 2011, 6, 014014. [Google Scholar] [CrossRef]
  6. ADB. Vietnam: Environment and Climate Change Assessment. Available online: https://www.adb.org/documents/viet-nam-environment-and-climate-change-assessment (accessed on 24 May 2021).
  7. Christoplos, I.; Ngoan, L.D.; Sen, L.T.H.; Huong, N.T.T.; Nguyen, H. Changing arenas for agricultural climate change adaptation in Vietnam. Dev. Pract. 2017, 27, 132–142. [Google Scholar] [CrossRef] [Green Version]
  8. Nguyen, T.A.; Vu, D.A.; Van Vu, P.; Nguyen, T.N.; Pham, T.M.; Nguyen, H.T.T.; Le, H.T.; Nguyen, T.V.; Hoang, L.K.; Vu, T.D. Human ecological effects of tropical storms in the coastal area of Ky Anh (Ha Tinh, Vietnam). Environ. Dev. Sustain. 2017, 19, 745–767. [Google Scholar] [CrossRef]
  9. WorldBank. Economics of Adaptation to Climate Change: Vietnam. Available online: https://openknowledge.worldbank.org/handle/10986/12747 (accessed on 5 February 2021).
  10. Chakraborty, S.; Tiedemann, A.; Teng, P.S. Climate change: Potential impact on plant diseases. Environ. Pollut. 2000, 108, 317–326. [Google Scholar] [CrossRef]
  11. Zhu, T.; Trinh, M. Climate change impacts on agriculture in Vietnam. In Proceedings of the International Conference on Agricultural Risk and Food Security, Beijing, China, 11–12 June 2010; pp. 11–12. [Google Scholar]
  12. Knox, J.; Hess, T.; Daccache, A.; Wheeler, T. Climate change impacts on crop productivity in Africa and South Asia. Environ. Res. Lett. 2012, 7, 034032. [Google Scholar] [CrossRef]
  13. Coakley, S.M.; Scherm, H.; Chakraborty, S. Climate change and plant disease management. Annu. Rev. Phytopathol. 1999, 37, 399–426. [Google Scholar] [CrossRef]
  14. Thanh, D.V.; Viet, N.V. Tác động của biến đổi khí hậu đến ngành nông nghiệp và giải pháp ứng phó [Impacts of Climate Change on Agriculture Sector and Response Measures]; Agricultural Publishing House: Hanoi, Vietnam, 2014. [Google Scholar]
  15. Maulu, S.; Hasimuna, O.J.; Haambiya, L.H.; Monde, C.; Musuka, C.G.; Makorwa, T.H.; Munganga, B.P.; Phiri, K.J.; Nsekanabo, J.D. Climate Change Effects on Aquaculture Production: Sustainability Implications, Mitigation, and Adaptations. Front. Sustain. Food Syst. 2021, 5, 70. [Google Scholar] [CrossRef]
  16. Mohanty, B.; Mohanty, S.; Sahoo, J.; Sharma, A. Climate change: Impacts on fisheries and aquaculture. In Climate Change and Variability; IntechOpen: Winchester, UK, 2010; pp. 119–138. [Google Scholar]
  17. Seggel, A.; De Young, C. Climate Change Implications for Fisheries and Aquaculture: Summary of the Findings of the Intergovernmental Panel on Climate Change Fifth Assessment Report. In FAO Fisheries and Aquaculture Circular No. C1122; FAO: Rome, Italy, 2016; p. 54. [Google Scholar]
  18. Pete, S.; Mark, H.; Thelma, K.; Valérie, M.-D.; Cheikh, M.; Hans-Otto, P.; Andy, R.; Josep, C.; Phillip, O.B. Special Report on Climate change, Desertification, Land Degradation, Sustainable Land Management, Food Security, and Greenhouse Gas Fluxes in Terrestrial Ecosystems (SR2); IPCC: Cambridge, UK, 2017; p. 32. [Google Scholar]
  19. Allison, E.H.; Perry, A.L.; Badjeck, M.C.; Neil Adger, W.; Brown, K.; Conway, D.; Halls, A.S.; Pilling, G.M.; Reynolds, J.D.; Andrew, N.L. Vulnerability of national economies to the impacts of climate change on fisheries. Fish Fish. 2009, 10, 173–196. [Google Scholar] [CrossRef] [Green Version]
  20. Boateng, I. GIS assessment of coastal vulnerability to climate change and coastal adaption planning in Vietnam. J. Coast. Conserv. 2012, 16, 25–36. [Google Scholar] [CrossRef]
  21. Nicholls, R.J.; Wong, P.P.; Burkett, V.; Codignotto, J.; Hay, J.; McLean, R.; Ragoonaden, S.; Woodroffe, C.D.; Abuodha, P.; Arblaster, J. Coastal Systems and Low-Lying Areas. Climate Change 2007: Impacts, Adaptation and Vulnerability. Contribution of Working Group II to the Fourth Assessment Report of the Intergovernmental Panel on Climate Change; Cambridge University Press: Cambridge, UK, 2007; pp. 315–356. [Google Scholar]
  22. Tobey, J.; Rubinoff, P.; Robadue, D.; Ricci, G.; Anderson, G.; Furlow, J.; Volk, R.; Squillante, L. Adapting to Coastal Climate Change: A Guidebook for Development Planners; Coastal Resources Center, University of Rhode Island: Narragansett, RI, USA, 2009; p. 164. [Google Scholar]
  23. Agrawal, A. Local institutions and adaptation to climate change. Soc. Dimens. Clim. Chang. Equity Vulnerability A Warm. World 2010, 2, 173–178. [Google Scholar]
  24. Baills, A.; Garcin, M.; Bulteau, T. Assessment of selected climate change adaptation measures for coastal areas. Ocean Coast. Manag. 2020, 185, 105059. [Google Scholar] [CrossRef]
  25. Sinay, L.; Carter, R. Climate change adaptation options for coastal communities and local governments. Climate 2020, 8, 7. [Google Scholar] [CrossRef] [Green Version]
  26. Chen, S.; De Bruyne, C.; Bollempalli, M. Blue Economy: Community Case Studies Addressing the Poverty–Environment Nexus in Ocean and Coastal Management. Sustainability 2020, 12, 4654. [Google Scholar] [CrossRef]
  27. CoastAdapt. Adaptation Options for Managing Coastal Risks under Climate Change. Available online: https://coastadapt.com.au/adaptation-options (accessed on 24 May 2021).
  28. Bangalore, M.; Smith, A.; Veldkamp, T. Exposure to floods, climate change, and poverty in Vietnam. Nat. Hazards Earth Syst. Sci. Discuss. 2017, 1–28. [Google Scholar] [CrossRef]
  29. Michalak, W. GIS in land use change analysis: Integration of remotely sensed data into GIS. Appl. Geogr. 1993, 13, 28–44. [Google Scholar] [CrossRef]
  30. Fox, J.; Krummel, J.; Yarnasarn, S.; Ekasingh, M.; Podger, N. Land-use and landscape dynamics in northern Thailand: Assessing change in three upland watersheds since 1954. Ambio 1995, 24, 328–334. [Google Scholar]
  31. Rindfuss, R.R.; Walsh, S.J.; Turner, B.; Moran, E.F.; Entwisle, B. Linking pixels and people. In Land Change Science; Springer: Berlin/Heidelberg, Germany, 2012; pp. 379–394. [Google Scholar]
  32. Turner, B.; Meyer, W.B. Land use and land cover in global environmental change: Considerations for study. Int. Soc. Sci. J. 1991, 43, 669–679. [Google Scholar]
  33. Walsh, S.J.; Evans, T.P.; Welsh, W.F.; Entwisle, B.; Rindfuss, R.R. Scale-dependent relationships between population and environment in northeastern Thailand. Photogramm. Eng. Remote Sens. 1999, 65, 97. [Google Scholar]
  34. Turner, B.L.; Lambin, E.F.; Reenberg, A. The emergence of land change science for global environmental change and sustainability. Proc. Natl. Acad. Sci. USA 2007, 104, 20666–20671. [Google Scholar] [CrossRef] [Green Version]
  35. Pedersen, A.; Thang, N.H. The Conservation of Key Coastal Wetland Sites in the Red River Delta; Hanoi BirdLife International Vietnam Programme: Hanoi, Vietnam, 1996; p. 97. [Google Scholar]
  36. Lillesand, T.; Kiefer, R.W.; Chipman, J. Remote Sensing and Image Interpretation; John Wiley & Sons: Hoboken, NJ, USA, 2015. [Google Scholar]
  37. Jensen, J.R. Introductory Digital Image Processing: A Remote Sensing Perspective; Prentice-Hall Inc.: Upper Saddle River, NJ, USA, 1996. [Google Scholar]
  38. Thang, D.D.; Thai, T.H.; Hoa, V.V. Đánh giá thực trạng và dự tính khả năng xâm nhập mặn cho khu vực ven biển tỉnh Thái Bình [Assessing the current situation and predicting the possibility of saline intrusion for the coastal area of Thai Binh province]. Vietnam J. Hydrometeorol. 2019, 9–16. [Google Scholar] [CrossRef]
  39. Nguyen, Y.T.B.; Kamoshita, A.; Matsuda, H.; Kurokura, H. Salinity intrusion and rice production in Red River Delta under changing climate conditions. Paddy Water Environ. 2017, 15, 37–48. [Google Scholar] [CrossRef]
  40. Quan, L.T.A.; Vo, T.C.; Nguyen, N.T.H. Đánh giá khả năng chịu mặn và phẩm chất của giống Lúa Sỏi, Một Bụi Hồng và Nàng Quớt Biển [Evaluation on saline tolerance ability and quality of Lua Soi, Mot Bui Hong, Nang Quot Bien varieties]. Can Tho Univ. J. Sci. 2012, 24a, 281–289. [Google Scholar]
  41. DONRE. Project Investigation and asSessment the Exploring and Using Statement of the Ground Water Resource in Thai Binh Up to 2011; Thai Binh Department of Natural Resources and Environment: Thai Binh, Vietnam, 2011. [Google Scholar]
  42. Trung, L.D. Economic and welfare impacts of disasters in East Asia and policy responses: The case of Vietnamese communities. In Resilience Recovery in Asian Disasters: Community Ties, Market Mechanisms, Governance; Economic Research Institute for ASEAN and East Asia: Jakarta, Indonesia, 2015; pp. 51–73. [Google Scholar]
  43. Cochrane, K.; De Young, C.; Soto, D.; Bahri, T. Climate change implications for fisheries and aquaculture. FAO Fish. Aquac. Tech. Pap. 2009, 530, 212. [Google Scholar]
  44. De Silva, S.S.; Soto, D. Climate change and aquaculture: Potential impacts, adaptation and mitigation. FAO Fish. Aquac. Tech. Pap. 2009, 530, 151–212. [Google Scholar]
  45. Islam, M.A.; Uddin, M.H.; Uddin, M.J.; Shahjahan, M. Temperature changes influenced the growth performance and physiological functions of Thai pangas Pangasianodon hypophthalmus. Aquac. Rep. 2019, 13, 100179. [Google Scholar] [CrossRef]
  46. Boyd, C.E. Effects of Weather and Climate on Aquaculture. Available online: https://www.aquaculturealliance.org/advocate/effects-of-weather-and-climate-on-aquaculture/ (accessed on 2 April 2021).
  47. Sallenave, R. Understanding Water Quality Parameters to Better Manage Your Pond; New Mexico State University, Cooperative Extension Service: Las Cruces, NM, USA, 2012. [Google Scholar]
  48. Kontara, E.K. Shrimp Culture Management Techniques. In Report of the Training Course on Shrimp Culture; FAO: Manila, Philippines, 1988; pp. 32–38. [Google Scholar]
  49. Pilarczyk, K.W.; Nuoi, N.S. Experience and practices on flood control in Vietnam. Water Int. 2005, 30, 114–122. [Google Scholar] [CrossRef]
  50. Jacobs, C.; Berglund, M.; Kurnik, B.; Dworak, T.; Marras, S.; Mereu, V.; Michetti, M. Climate Change Adaptation in the Agriculture Sector in Europe; European Environment Agency (EEA): Copenhagen, Denmark, 2019. [Google Scholar]
Figure 1. Study area. Tien Hai district is located in the coastal area of the Red River Delta, Vietnam, with 23 km of coastline. The district contributes an important role in agriculture production and biosphere reservation in the Red River Delta.
Land 10 00627 g001
Figure 2. Land-use classification of Tien Hai district in 2005, 2010, 2015, and 2020.
Land 10 00627 g002
Figure 3. Land-use change map of Tien Hai district in three time periods (a) 2005–2010; (b) 2010–2015; (c) 2015–2020.
Land 10 00627 g003
Table 1. Landsat data.
YearIDAcquisition DateResolutionParameters
2005LT51260462005195BJC0014 July 200530 mTypes: Level 1—Corrected
Output Format: Geo TIFF
Resampling Method: CC
Map Projection: UTM-WGS 84
2010LT51260462010193BKT0012 July 201030 m
2015LC81260462015191LGN0110 July 201530 m, 15 m
2020LC812604620200705L1TP5 July 202030 m, 15 m
Table 2. Satellite image interpretation keys.
NoLand-Use TypesSatellite ImageGround Photo
1Paddy Land 10 00627 i001 Land 10 00627 i002
2Annual crop Land 10 00627 i003 Land 10 00627 i004
3Perennial crop Land 10 00627 i005 Land 10 00627 i006
4Forests Land 10 00627 i007 Land 10 00627 i008
5Aquaculture Land 10 00627 i009 Land 10 00627 i010
6Others Land 10 00627 i011 Land 10 00627 i012
Table 3. Accuracy assessment of satellite image classification.
Classified ImagesTotal Number of PixelsNumber of Correct PixelsOverall Accuracy (%)Kappa Coefficient
LT51260462005195BJC0018014982.770.7901
LT51260462010193BKT0018015284.440.8023
LC81260462015191LGN0118015787.220.8217
LC812604620200705L1TP18015686.660.8115
Table 4. Areas of different land-use types in Tien Hai district over time.
Year2005201020152020
Land UsesHa%Ha%Ha%Ha%
Paddy11,531.0042.0611,491.9341.9211,357.2041.4211,045.4240.29
Annual Crop461.781.68453.631.65439.111.60464.931.70
Perennial Crop200.200.73185.370.68154.280.5690.500.33
Aquaculture2549.039.302796.5610.203079.4611.233115.9111.37
Forest547.752.00736.802.69930.353.391320.354.82
Others12,126.6844.2311,752.1542.8711,456.0441.7911,379.3341.51
Total27,416.44100.0027,416.44100.0027,416.44100.0027,416.44100.00
Table 5. Land-use change matrix between 2005 and 2010.
Land Use 2010Total
PaddyAnnual CropPerennial CropAquacultureForestOthers
Land use 2005Paddy11,451.3217.55 62.1311,531.00
Annual crop2.18424.53 35.07461.78
Perennial crop 10.98185.37 3.85200.20
Aquaculture 2549.03 2549.03
Forest 540.577.18547.75
Others38.430.57 247.53196.2311,643.9212,126.68
Total11,491.93453.63185.372796.56736.8011,752.1527,416.44
Unit: hectare.
Table 6. Land-use change matrix between 2010 and 2015.
Land Use 2015Total
PaddyAnnual CropPerennial CropAquacultureForestOther
Land use 2010Paddy11,254.7642.22 82.63 112.3211,491.93
Annual crop16.12390.07 30.77 16.67453.63
Perennial crop11.21 152.5513.22 8.39185.37
Aquaculture35.416.82 2712.118.3233.902796.56
Forest 2.33718.9015.57736.80
Others39.70 1.73238.40203.1311,269.1911,752.15
Total11,357.2439.11154.283079.46930.3511,456.0427,416.44
Unit: hectare.
Table 7. Land-use change matrix between 2015 and 2020.
Land Use 2020Total
PaddyAnnual CropPerennial CropAquacultureForestOther
Land use 2015Paddy10,998.1870.45 48.97 239.6011,357.20
Annual crop0.18369.36 2.85 66.72439.11
Perennial crop7.3415.1890.505.14 36.12154.28
Aquaculture13.172.95 3006.6016.1440.603079.46
Forest 930.35 930.35
Others26.556.99 52.35373.8610,996.2911,456.04
Total11,045.42464.9390.503115.911320.3511,379.3327,416.44
Unit: hectare.
Table 8. Impacts of climate change on crop production.
Impact of Extreme ColdFrequency N = 75Percentage *
Die-off5269.33
Poor crop growth4864.00
Reduce productivity2837.33
Impact of Saltwater IntrusionFrequency N = 75Percentage
Abandoned fields5674.67
Reduce productivity4864.00
Poor crop growth2229.33
Die-off2533.33
Impact of Extremely High TemperatureFrequency N = 75Percentage
Water shortage4762.67
Increase diseases3445.33
Reduce productivity3040.00
Die-off3040.00
Impact of StormFrequency N = 75Percentage
Property damaged6586.67
Reduce productivity5269.33
Soil erosion2533.33
* Questions on the impacts of climate change on crop production are multiple-response. Therefore, the summing-up of the percentages reported for each impact can exceed 100%.
Table 9. Impacts of climate change on aquaculture production.
Impact of Extreme Cold EventsFrequency
N = 75
Percentage **
Lower harvest5370.67
Mass die-off3952.00
Total production losses2736.00
Impact of Extreme Hot EventFrequency
N = 75
Percentage
Affects the water environment6485.33
Mass die-off4965.33
Susceptible to diseases4661.33
Impact of StormFrequency
N = 75
Percentage
Destroys farm facilities6789.33
Affects the water environment5370.67
Increases risk from water-borne pathogens4762.67
Total production losses2837.33
** Questions on the impacts of climate change on aquaculture production are multiple-response. Therefore, the summing-up of the percentages reported for each impact can exceed 100%.
Table 10. Farmers’ responses to climate change in crop and aquaculture productions.
Crop ProductionFrequency N = 75Percentage ***
Changing crop varieties5877.33
Adjusting crop timing5674.67
Adjusting cropping pattern2533.33
Converting cropland to aquaculture2229.33
Shifting occupation1621.33
Aquaculture ProductionFrequency N = 75Percentage
Changing aquatic species6080.00
Adjusting cultivation techniques5472.00
Renovating aquaculture farms3242.50
Applying aquaculture crop rotation2432.40
*** Questions on farmers’ responses to climate change on crop and aquaculture productions are multiple-response. Therefore, the summing-up of the percentages reported for each agriculture production activity can exceed 100%.
Publisher’s Note: MDPI stays neutral with regard to jurisdictional claims in published maps and institutional affiliations.

