
Model-Based Assessment of Giant Reed (Arundo donax L.) Energy Yield in the Form of Diverse Biofuels in Marginal Areas of Italy

 , , and
Abstract
1. Introduction
2. Materials and Methods
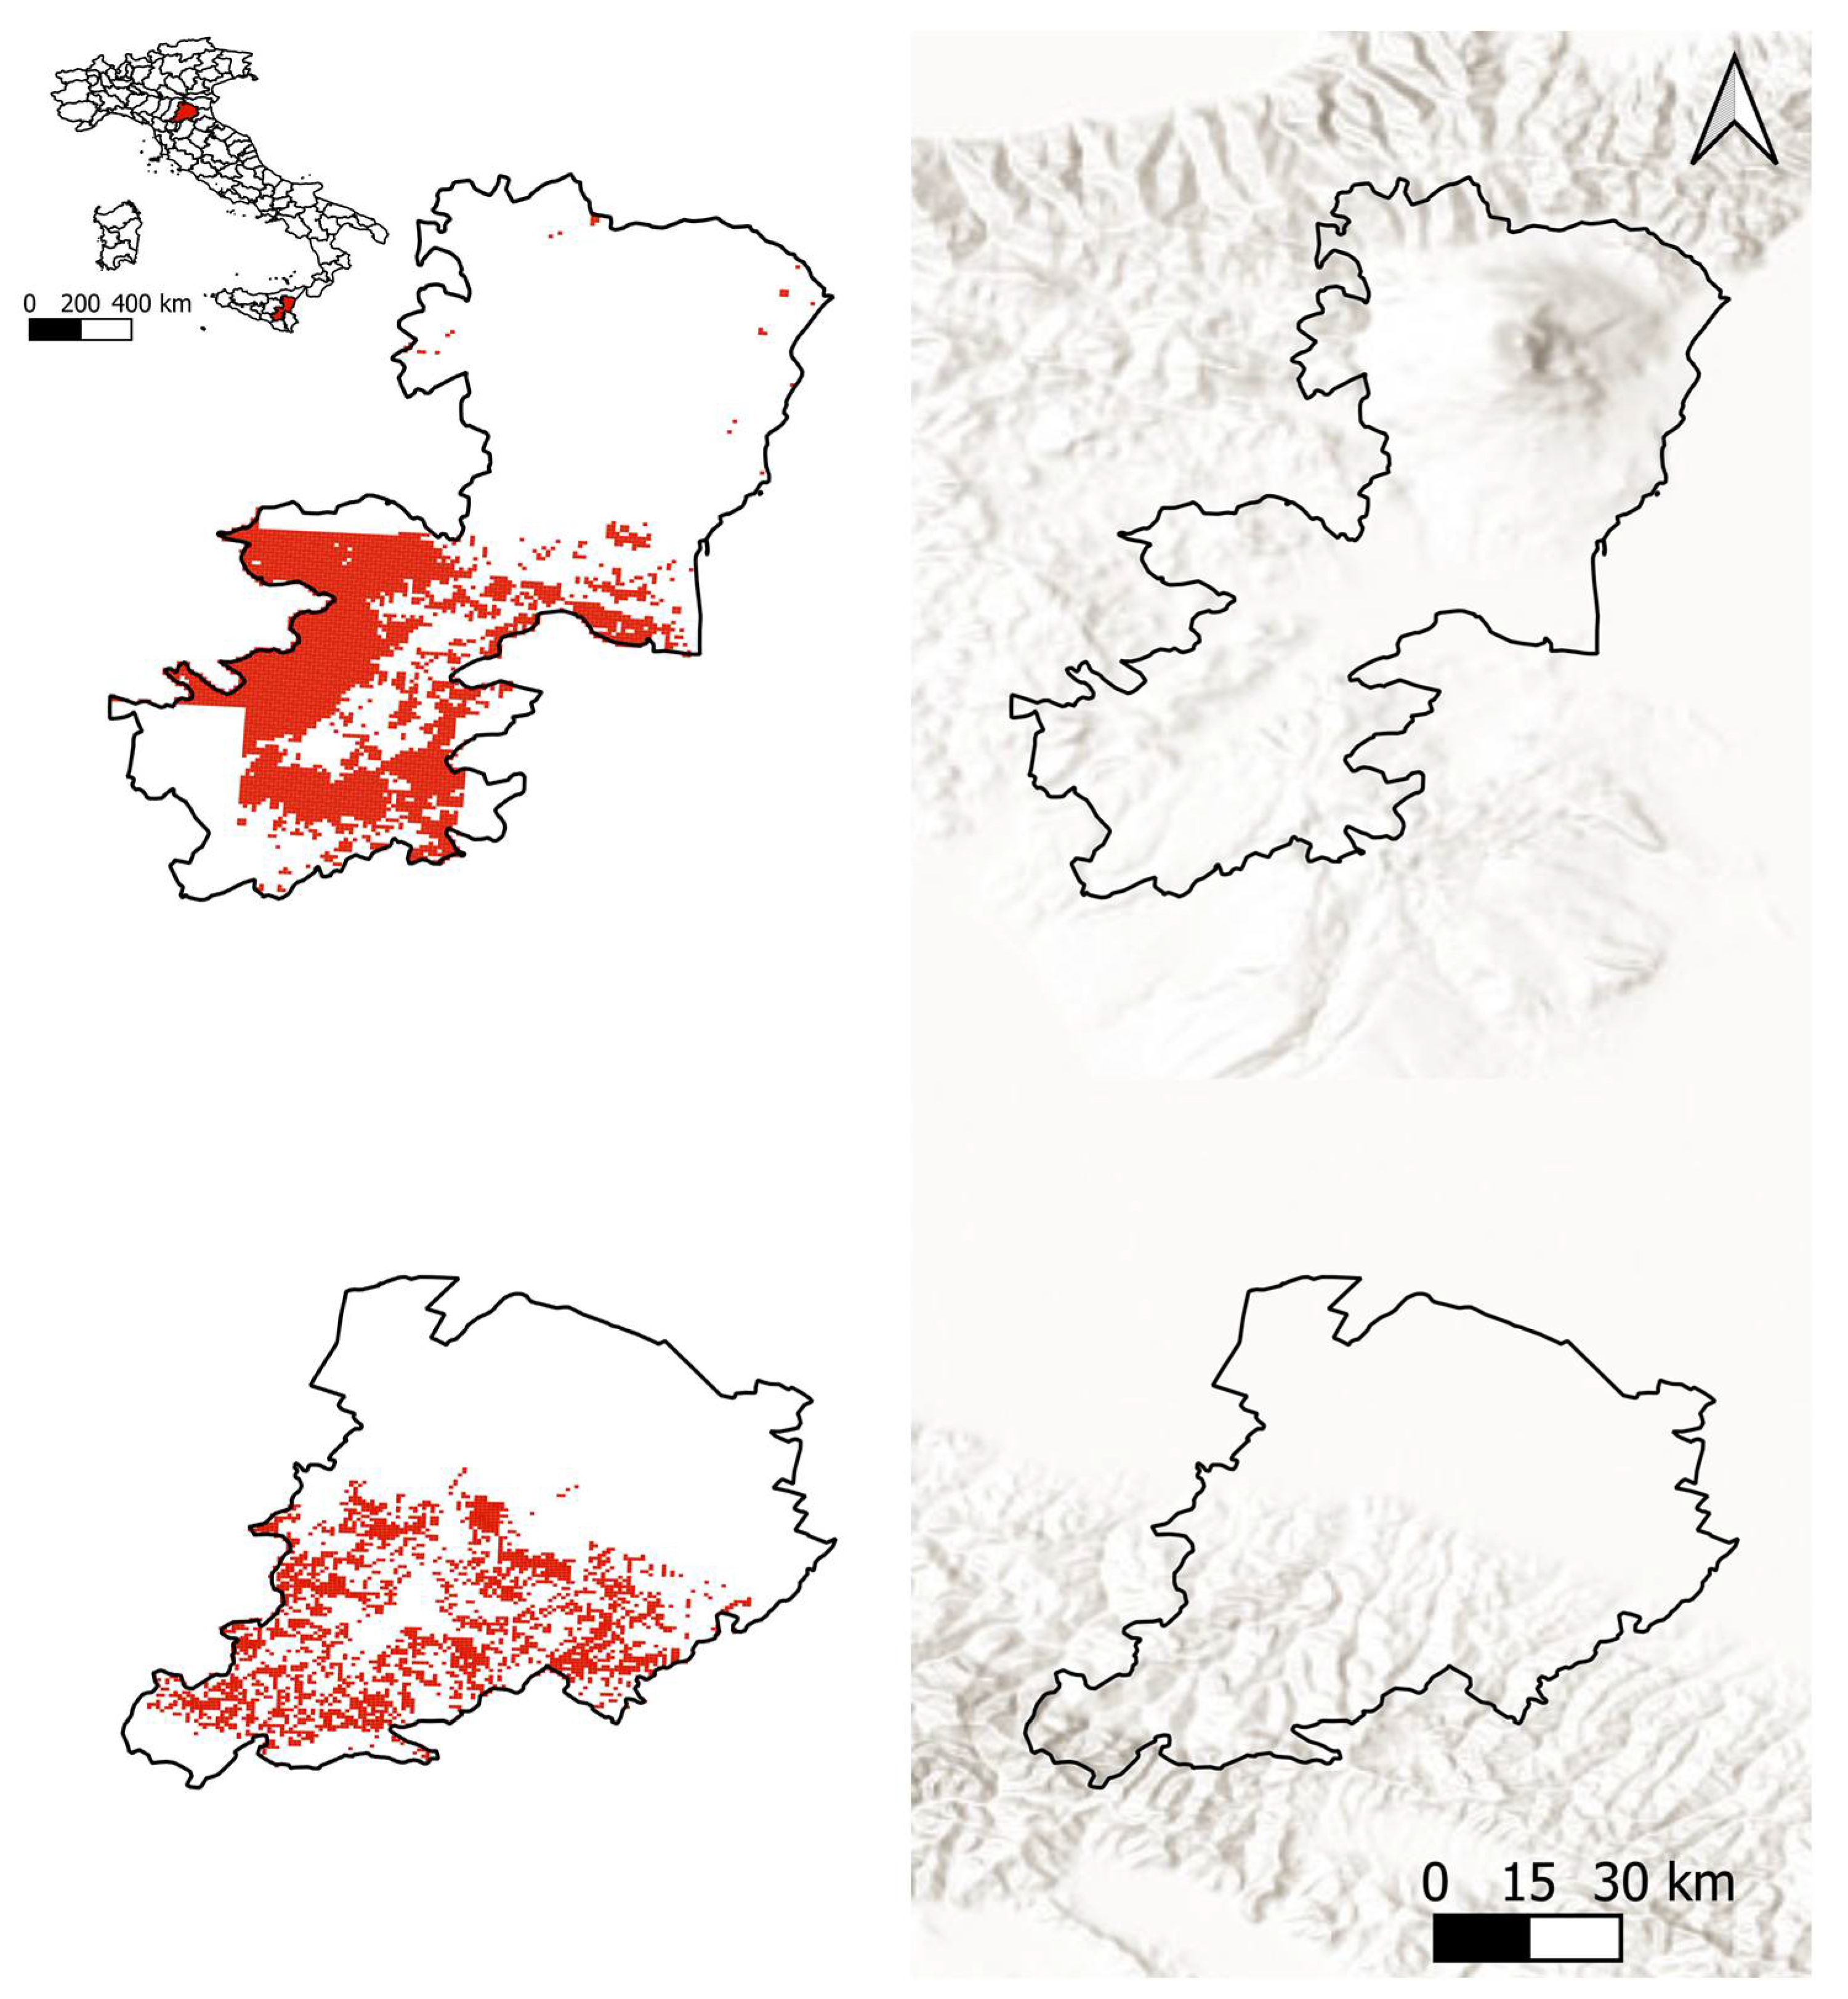
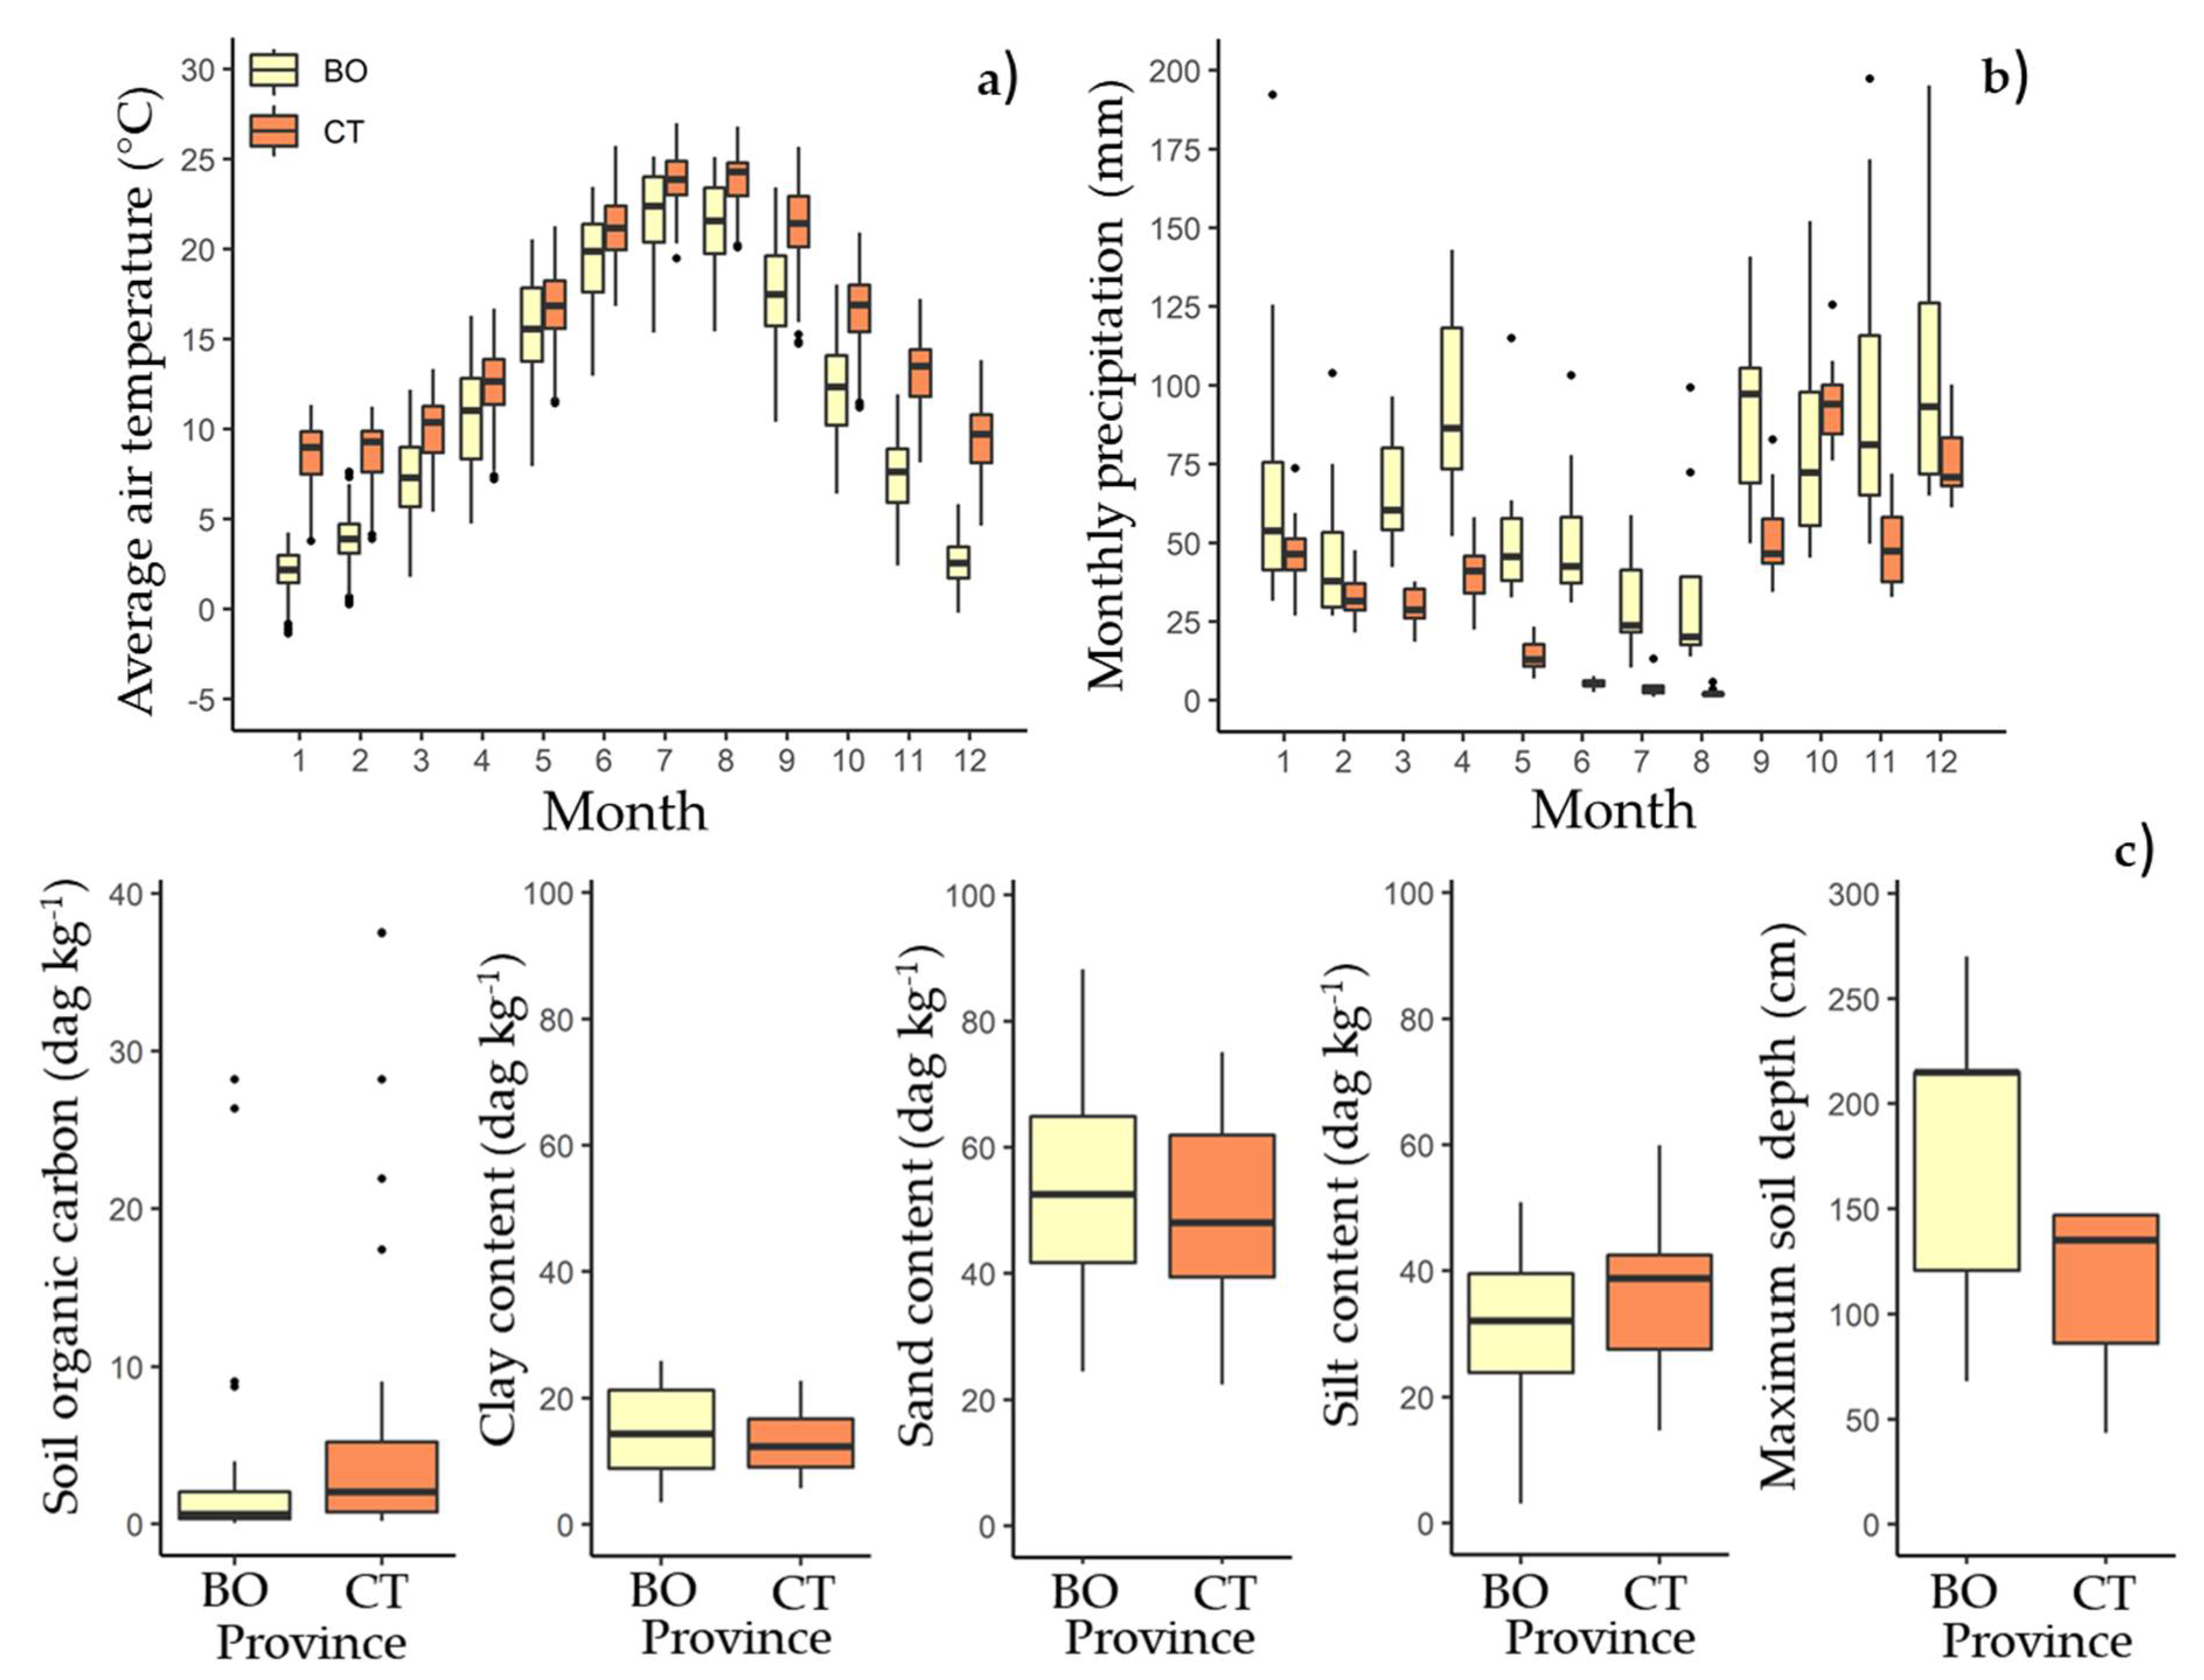
2.1. Study Area and Bionergy Sector Maturity
2.2. Model Description and Calibration
2.3. Spatially Distributed Simulation
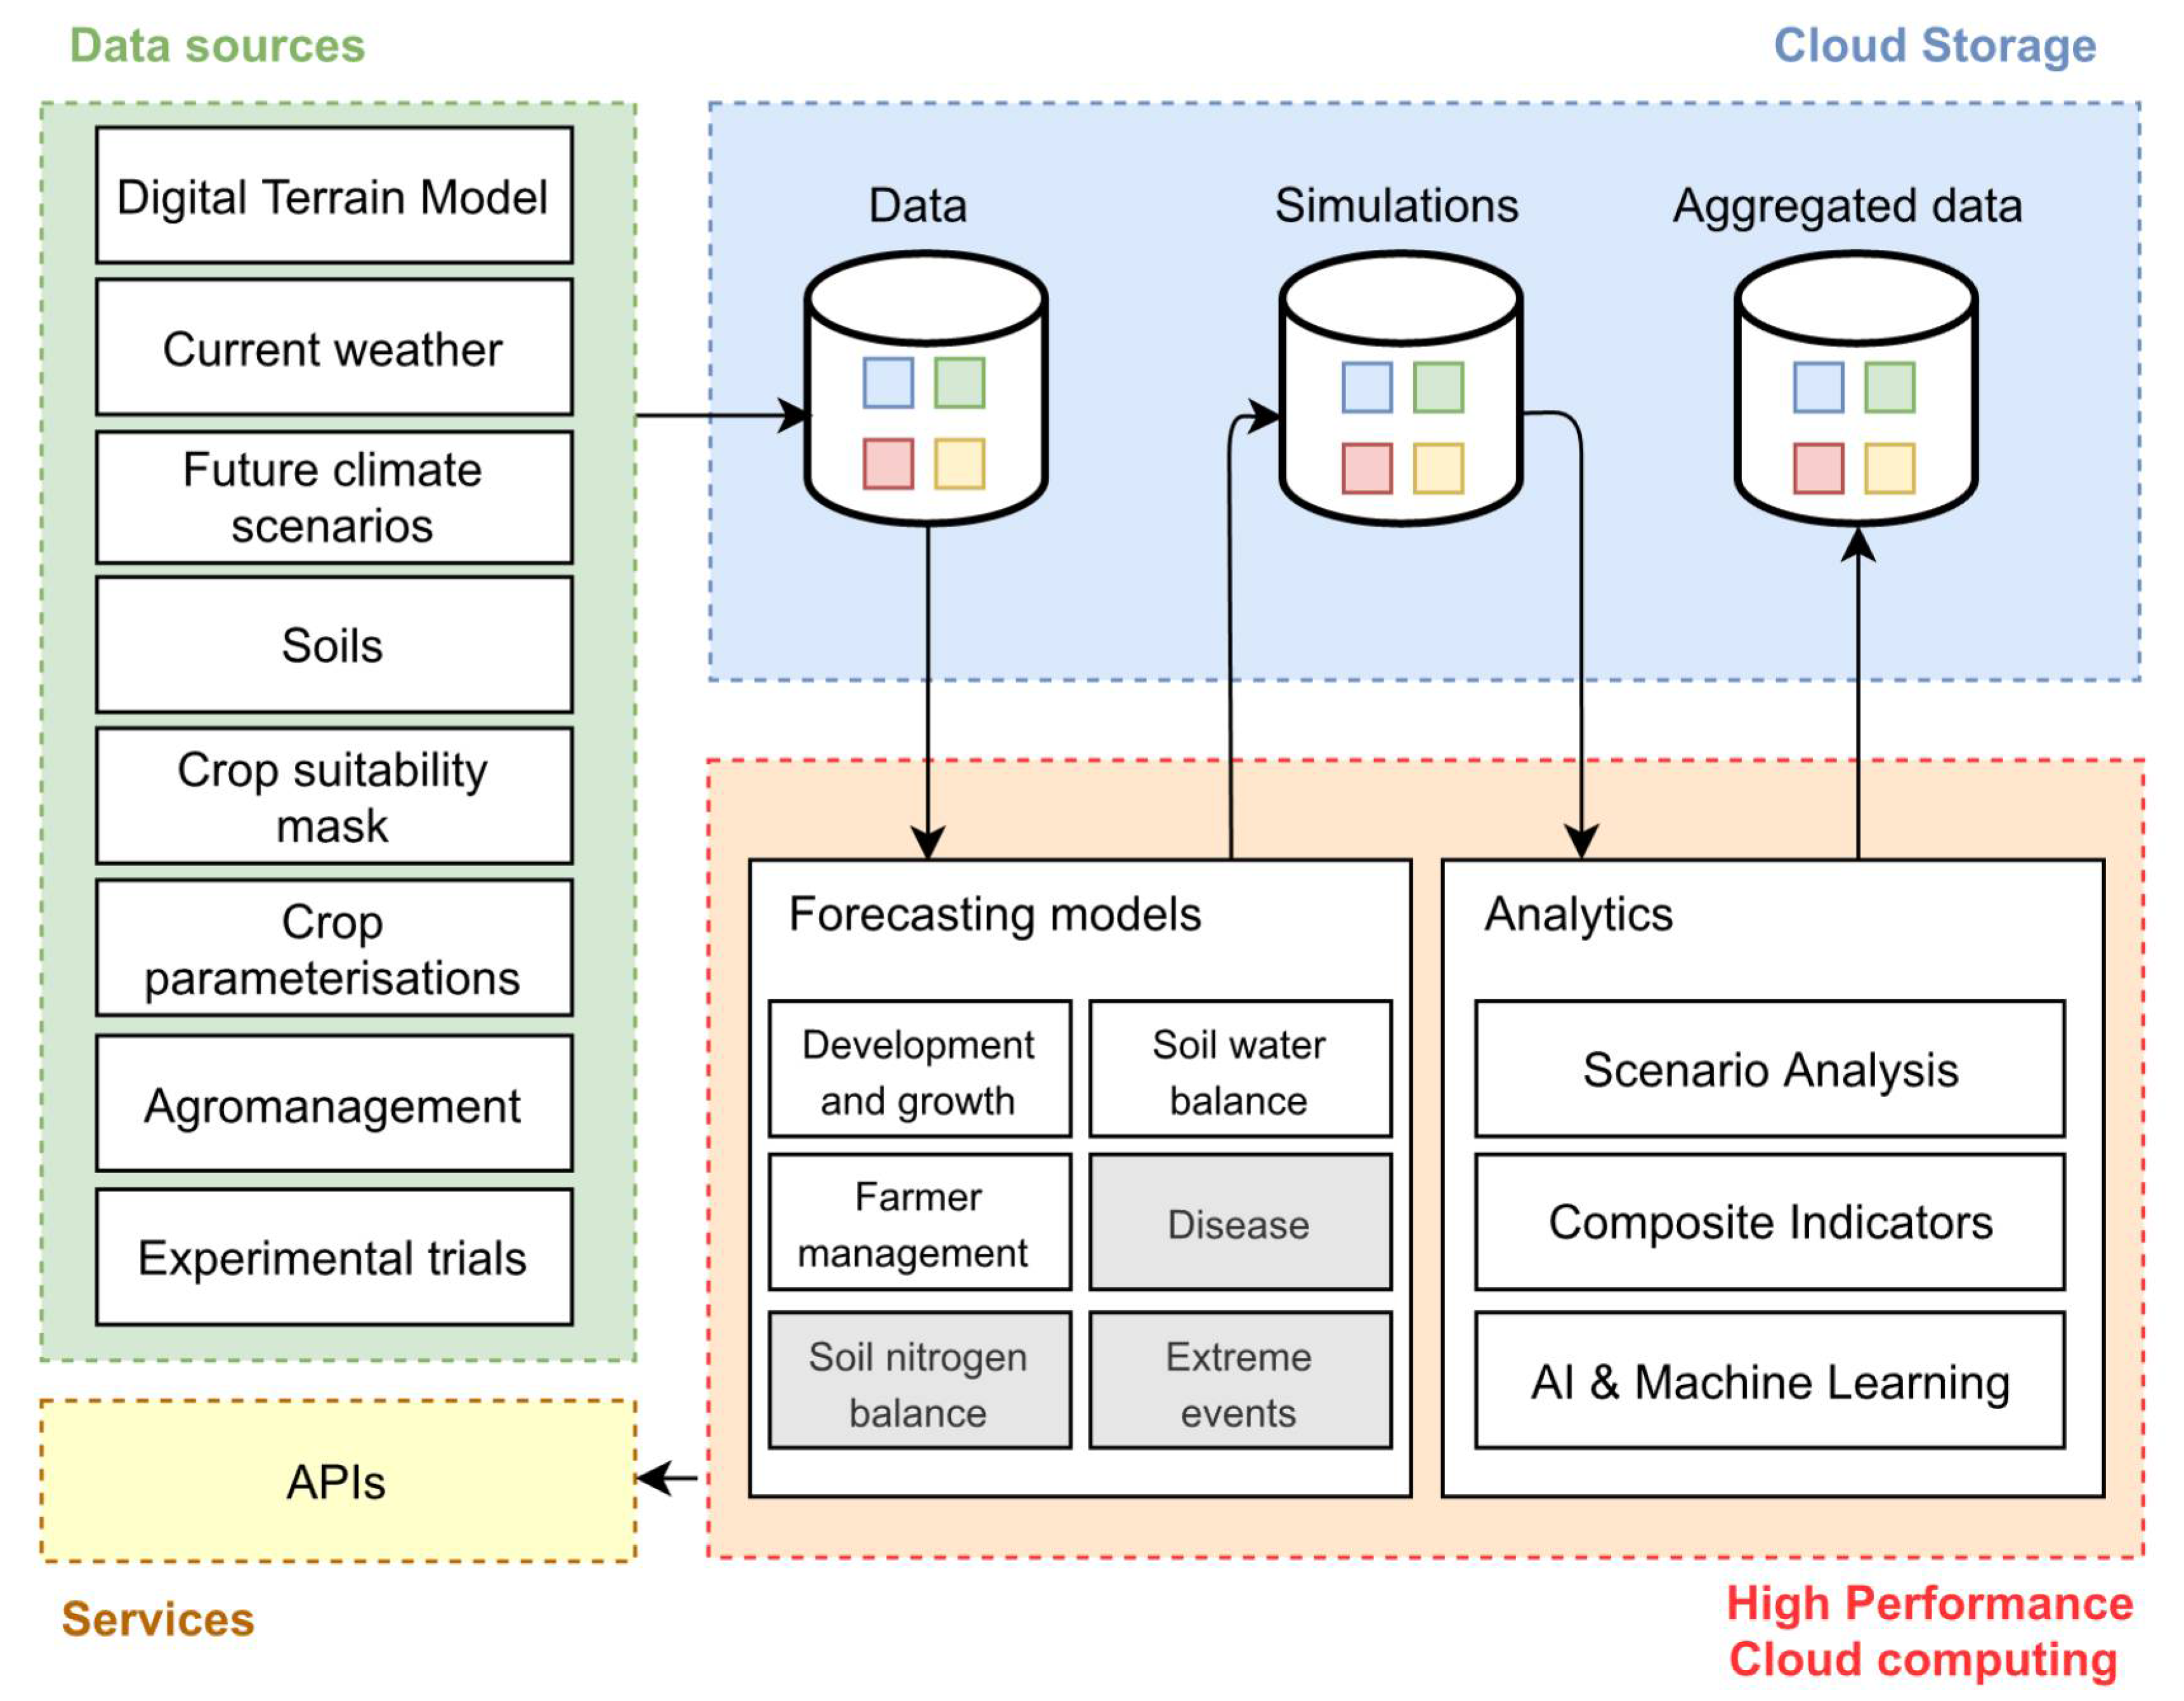
2.4. Software Infrastructure
2.5. Analysis of Results
3. Results
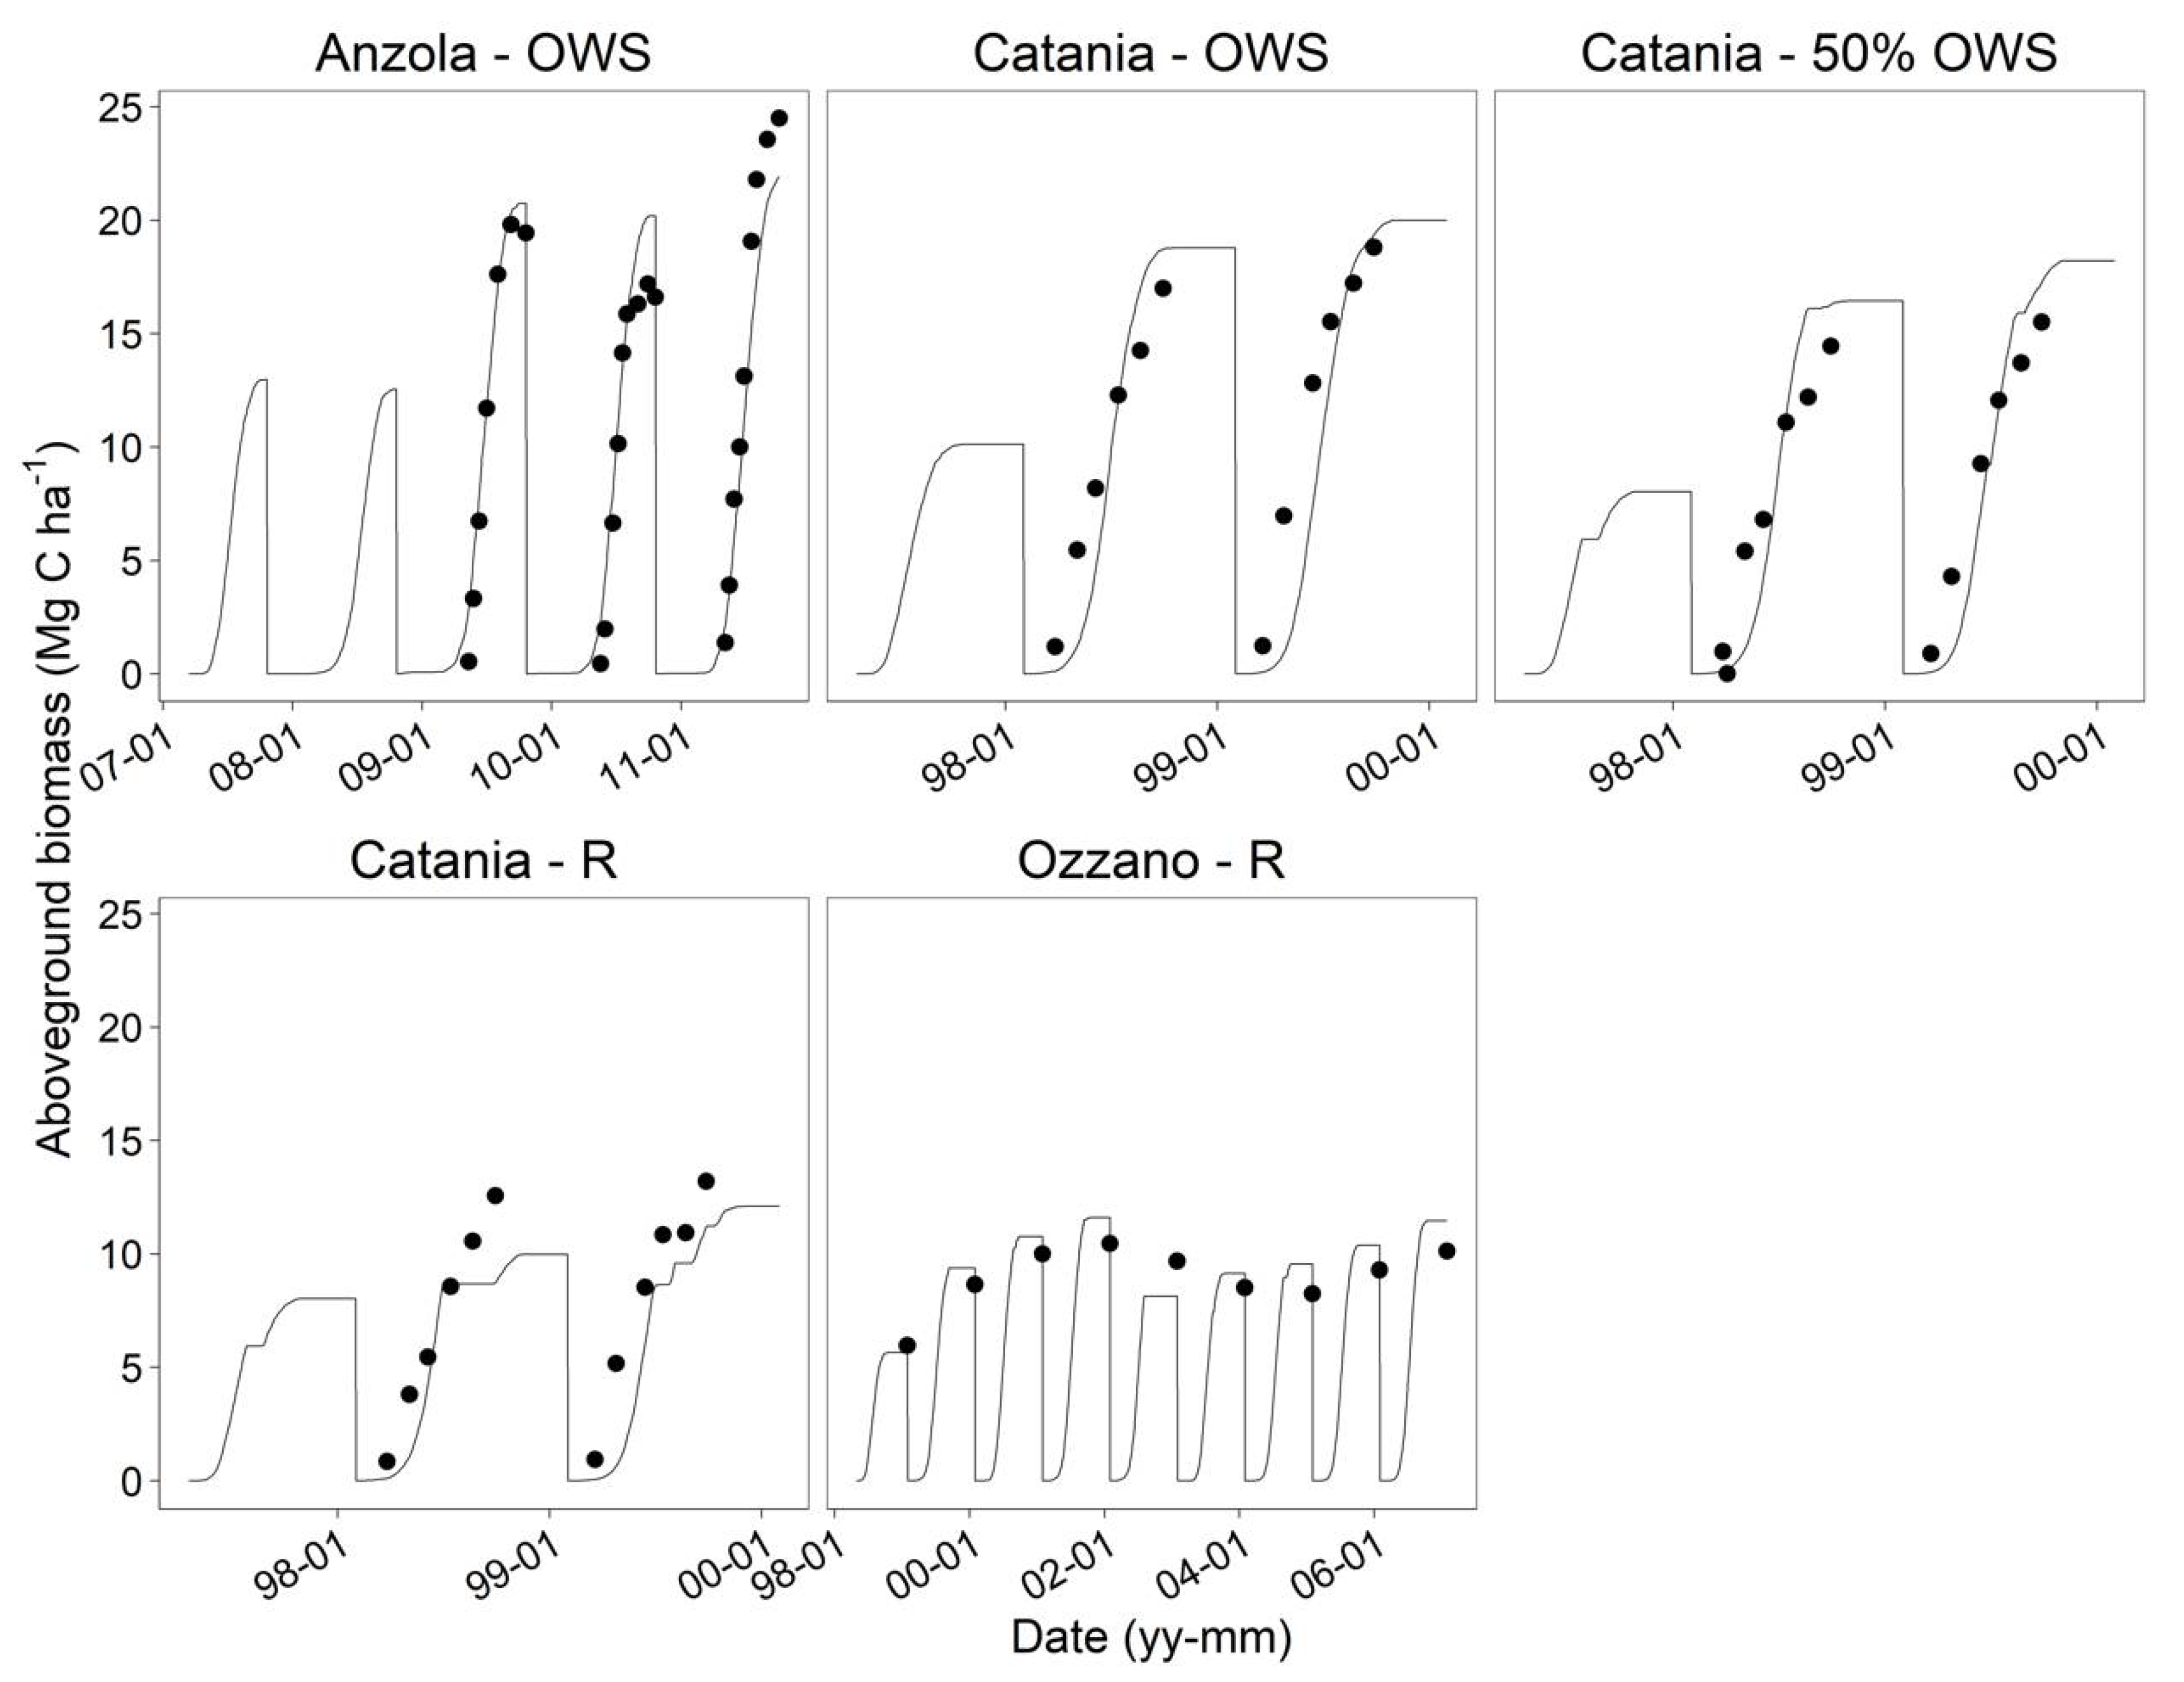
3.1. Calibration
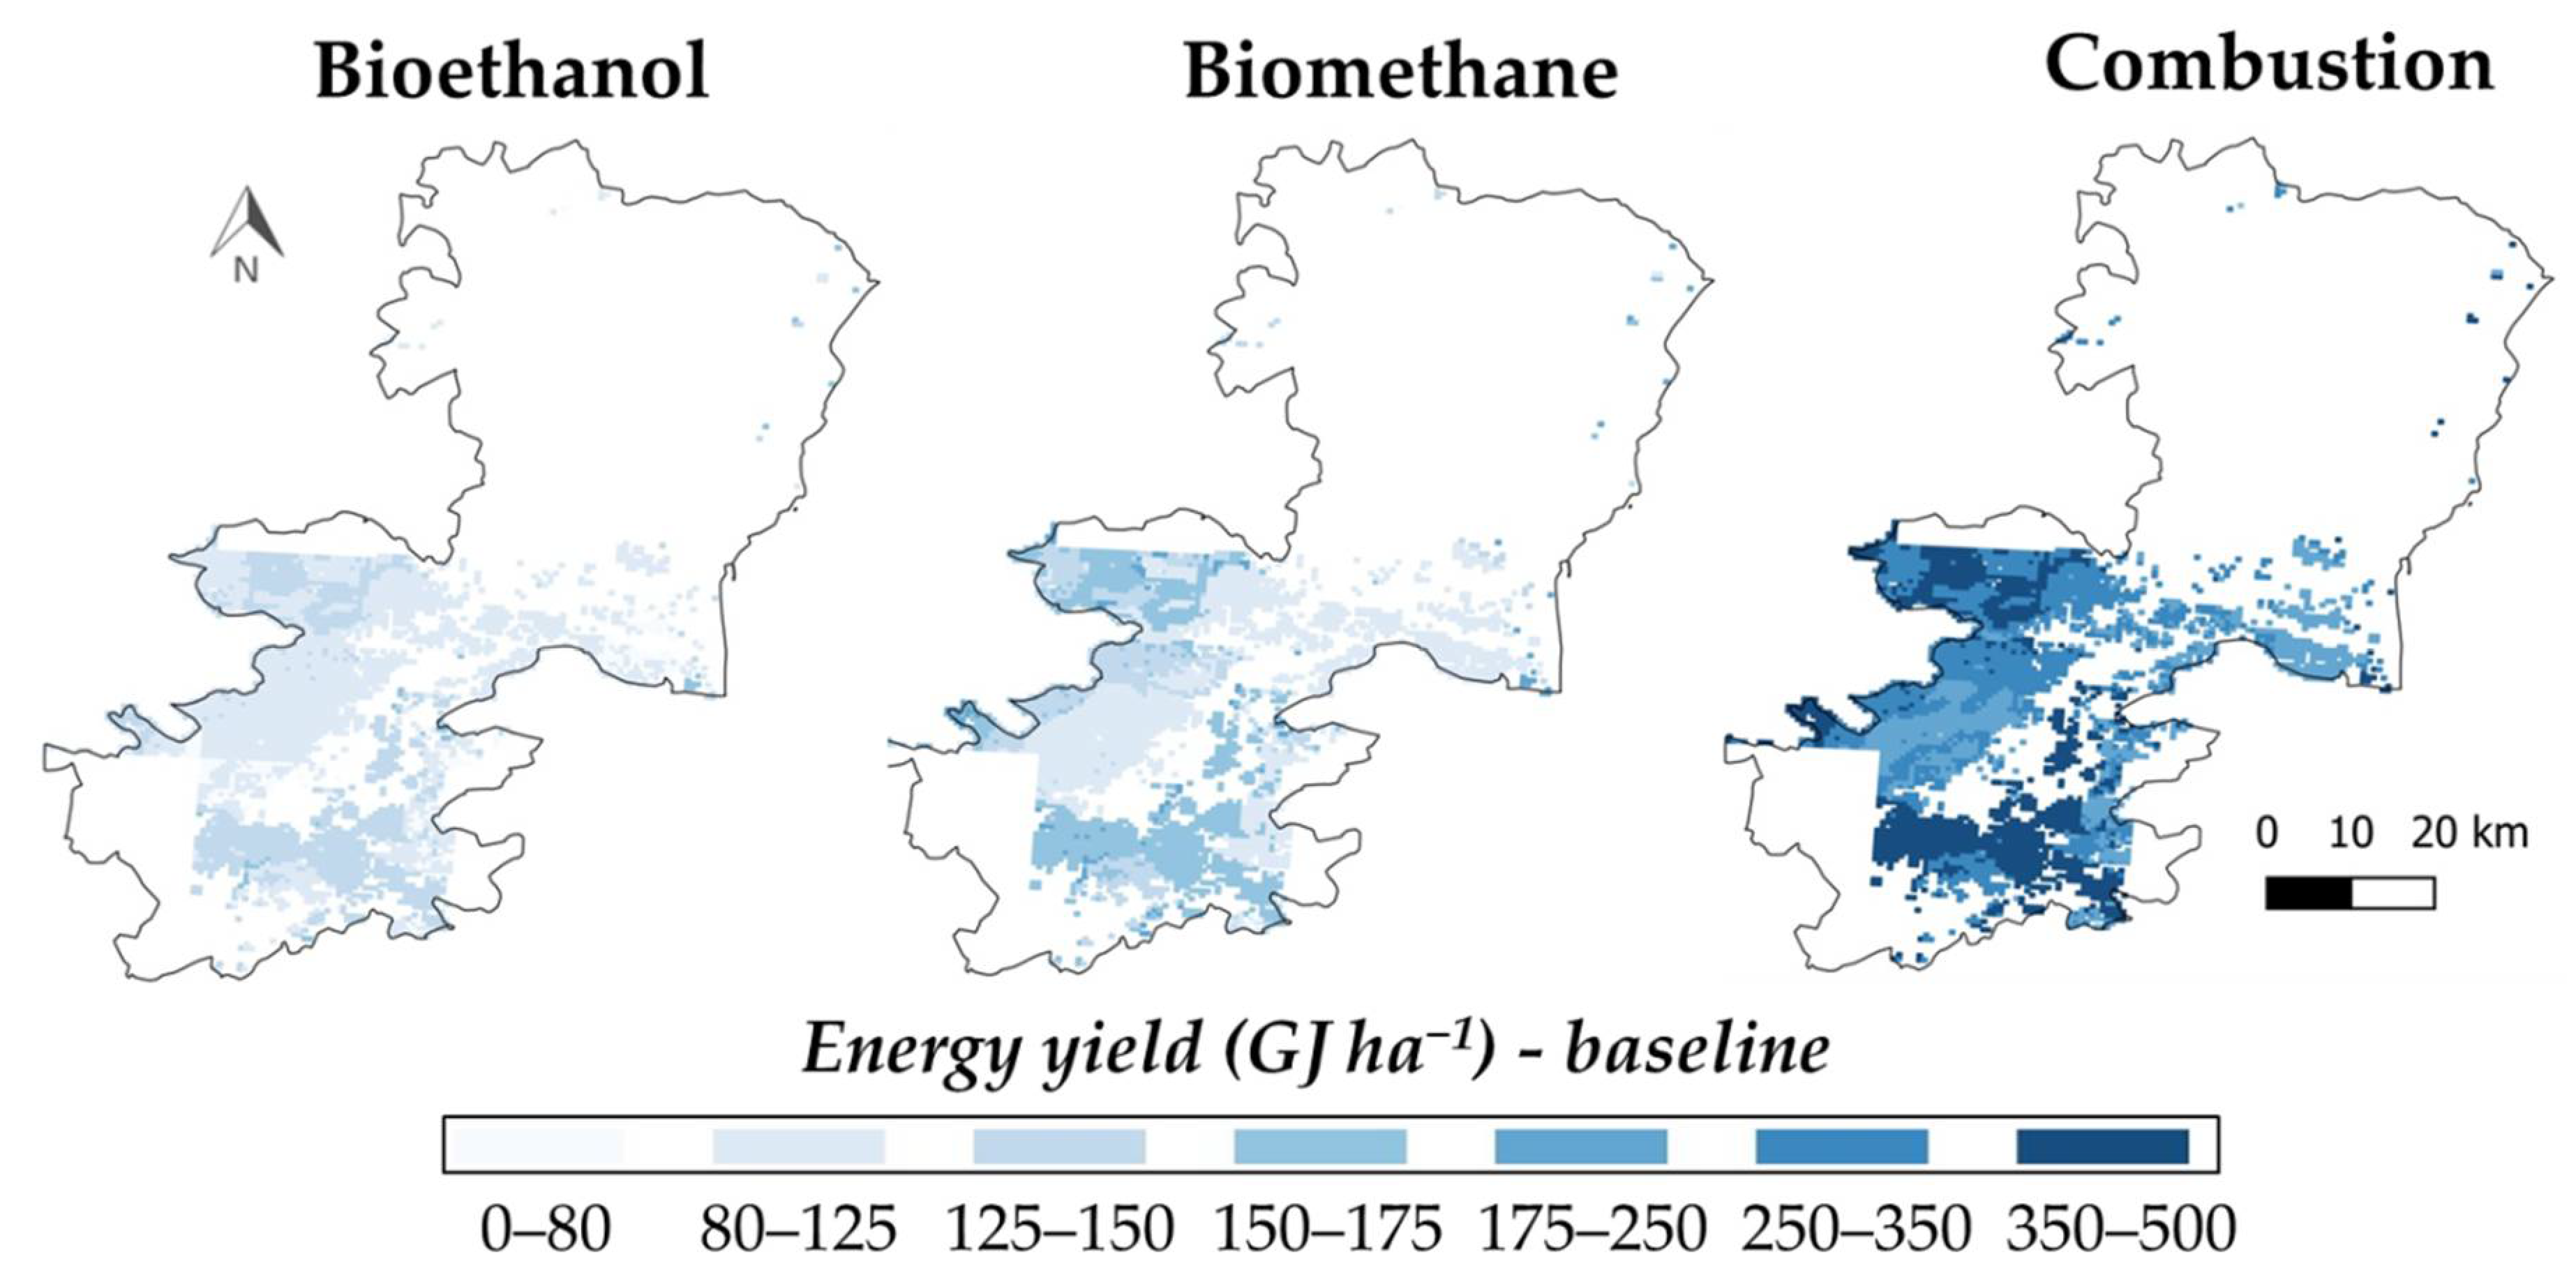
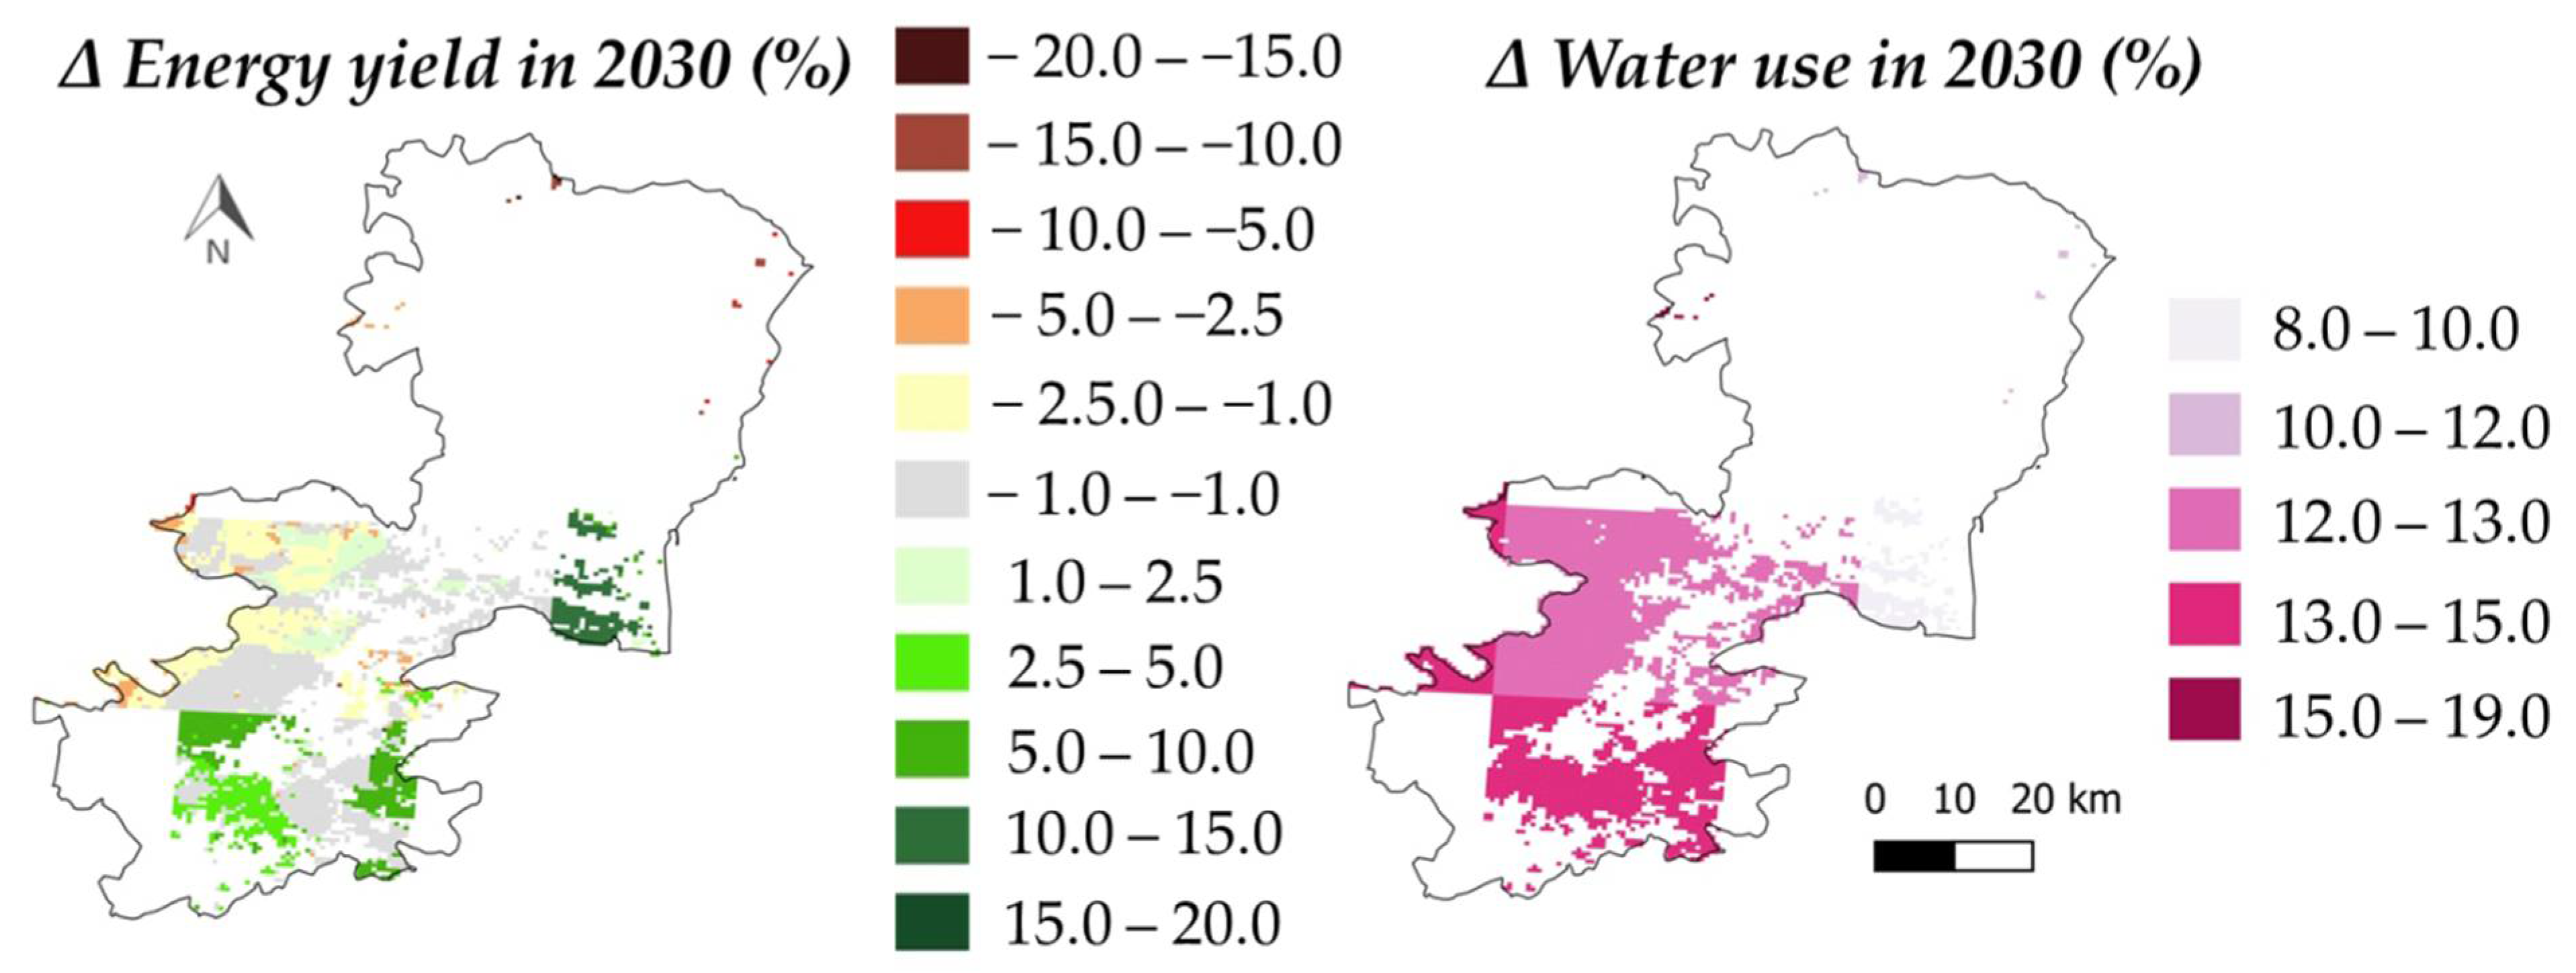
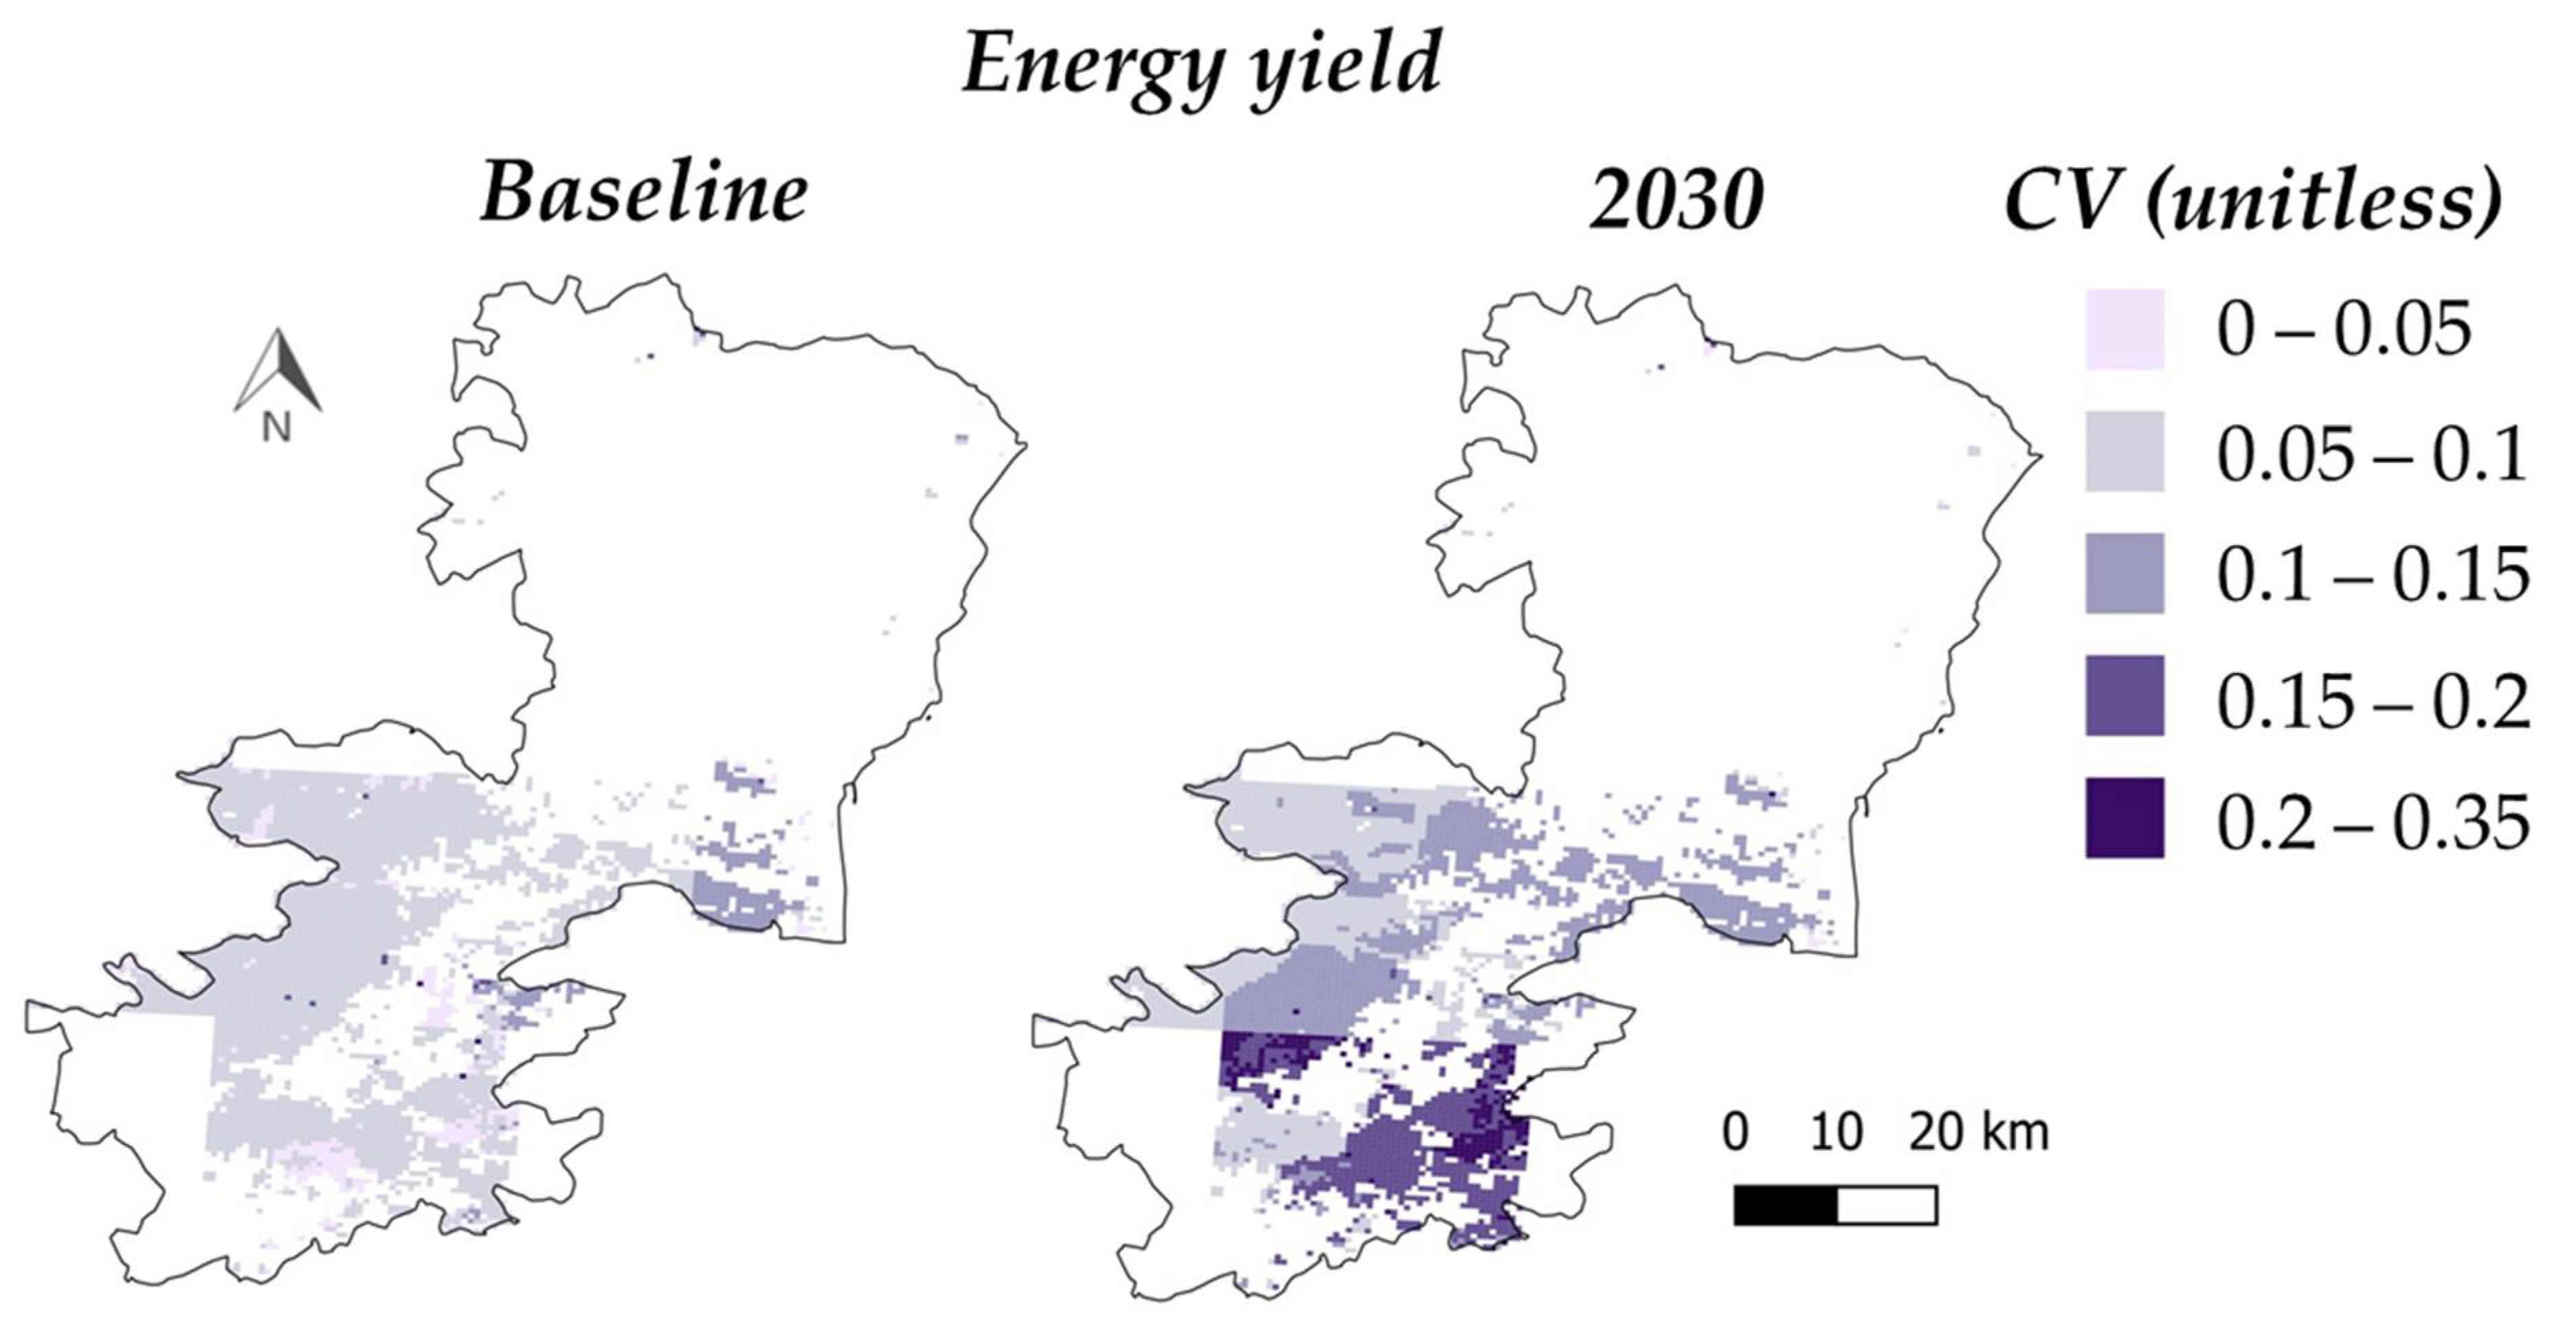
3.2. Spatially Distributed Simulations
4. Discussion
4.1. Modelling Perspective
4.2. Short- and Medium-Term Bioenergy Outlook
4.3. Final Remarks and Limitations of the Study
5. Conclusions
Supplementary Materials
Author Contributions
Funding
Data Availability Statement
Conflicts of Interest
Abbreviations
| API | application program interface |
| AVAL | average value of agricultural land |
| BioMA | Biophysical Model Applications platform |
| BO | Bologna |
| CAAB | carbon accumulation in the aerial biomass |
| CH4 | methane |
| CRM | coefficient of residual mass |
| CT | Catania |
| CV | coefficient of variation |
| DM | dry matter |
| DMI-HIRHAM5-ECHAM5 | climate projection generated by HIRHAM5 global circulation model coupled with ECHAM5 regional circulation model |
| EF | modelling efficiency |
| EPIC | Environmental Policy Integrated Climate model |
| ET | evapotranspiration |
| ETHZ-CLM-HadCM3Q0 | climate projection generated by CLM global circulation model coupled with HadCM3Q0 regional circulation model |
| GHG | greenhouse gas |
| GIS | geographic information system |
| HHV | high heating value |
| IPCC | Intergovernmental Panel on Climate Change |
| KOH | potassium hydroxide |
| LHW | lower heating value |
| METOHC-HadRM3Q0-HadCM3Q0 | climate projection generated by HadRM3Q0 global circulation model coupled with HadCM3Q0 regional circulation model |
| ML | marginal land |
| MS | modelling solution |
| NOx | nitrogen oxides |
| OWS | optimum water supply |
| R | rainfed |
| RESTful | representational state transfer |
| RMSE | root mean square error |
| RRMSE | relative root mean square error |
| SaaS | Software as a Service |
| SMY | specific methane yield |
| STP | standard temperature and pressure conditions |
| SU | simulation unit |
| VOCs | volatile organic compounds |
| VS | volatile solids |
References
- Jaeger, W.K.; Egelkraut, T.M.M. Biofuel Economics in a Setting of Multiple Objectives & Unintended Consequences. Renew. Sustain. Energy Rev. 2011, 15, 4320–4333. [Google Scholar]
- IRENA. Boosting Biofuels: Sustainable Paths to Greater Energy Security. 2016. Available online: https://www.irena.org/-/media/Files/IRENA/Agency/Publication/2016/IRENA_Boosting_Biofuels_2016.pdf (accessed on 19 May 2021).
- Searchinger, T.; Heimlich, R.; Houghton, R.A.; Dong, F.; Elobeid, A.; Fabiosa, J.; Tokgoz, S.; Hayes, D.; Yu, T.-H. Use of U.S. croplands for biofuels increases greenhouse gases through emissions from land-use change. Science 2008, 319, 1238–1240. [Google Scholar] [CrossRef]
- Sallustio, L.; Pettenella, D.; Merlini, P.; Romano, R.; Salvati, L.; Marchetti, M.; Corona, P. Assessing the economic marginality of agricultural lands in Italy to support land use planning. Land Use Policy 2016, 76, 526–534. [Google Scholar] [CrossRef]
- Supit, I.; Van Diepen, C.A.; De Wit, A.J.W.; Wolf, J.; Kabat, P.; Baruth, B.; Ludwig, F. Assessing climate change effects on European crop yields using the Crop Growth Monitoring System and a weather generator. Agric. For. Meteorol. 2012, 164, 96–111. [Google Scholar] [CrossRef]
- Donatelli, M.; Srivastava, A.K.; Duveiller, G.; Niemeyer, S.; Fumagalli, D. Climate change impact and potential adaptation strategies under alternate realizations of climate scenarios for three major crops in Europe. Environ. Res. Lett. 2015, 10, 075005. [Google Scholar] [CrossRef]
- Prasad, P.V.; Djanaguiraman, M. Response of floret fertility and individual grain weight of wheat to high temperature stress: Sensitive stages and thresholds for temperature and duration. Funct. Plant. Biol. 2014, 41, 1261–1269. [Google Scholar] [CrossRef]
- Sage, T.L.; Bagha, S.; Lundsgaard-Nielsen, V.; Branch, H.A.; Sultmanis, S.; Sage, R.F. The effect of high temperature stress on male and female reproduction in plants. Field Crops Res. 2015, 182, 30–42. [Google Scholar] [CrossRef]
- Flörke, M.; Schneider, C.; McDonald, R.I. Water competition between cities and agriculture driven by climate change and urban growth. Nat. Sustain. 2018, 1, 51–58. [Google Scholar] [CrossRef]
- Ginaldi, F.; Cappelli, G.A.; Ceotto, E. Modelling-based procedure to evaluate energy crops productivity in marginal humid areas of low po valley (Northern Italy). In Proceedings of the 26th EUBCE European Biomass Conference and Exhibition 2018, Copenhagen, Denmark, 14–17 May 2018; Persson, M., Scarlat, N., Grassi, A., Helm, P., Eds.; ETA-Florence Renewable Energies: Florence, Italy, 2018; pp. 259–262. [Google Scholar]
- O’Keeffe, S.; Majer, S.; Drache, C.; Franko, U.; Thrän, D. Modelling biodiesel production within a regional context–A comparison with RED Benchmark. Renew. Energy 2017, 108, 355–370. [Google Scholar] [CrossRef]
- Sołowski, G.; Konkol, I.; Cenian, A. Production of hydrogen and methane from lignocellulose waste by fermentation. A review of chemical pretreatment for enhancing the efficiency of the digestion process. J. Clean. Prod. 2020, 267, 121721. [Google Scholar] [CrossRef]
- Maletta, E.; Díaz-Ambrona, C.H. Lignocellulosic Crops as Sustainable Raw Materials for Bioenergy. In Green Energy to Sustainability: Strategies for Global Industries, 1st ed.; Vertès, A.A., Qureshi, N., Blaschek, H.P., Yukawa, H., Eds.; John Wiley & Sons Ltd.: Hoboken, NJ, USA, 2020; pp. 489–514. [Google Scholar]
- Liao, J.C.; Mi, L.; Pontrelli, S.; Luo, S. Fuelling the future: Microbial engineering for the production of sustainable biofuels. Nat. Rev. Microbiol. 2016, 14, 288–304. [Google Scholar] [CrossRef] [PubMed]
- Liu, Z.; Wang, K.; Chen, Y.; Tan, T.; Nielsen, J. Third-generation biorefineries as the means to produce fuels and chemicals from CO2. Nat. Catal. 2020, 3, 274–288. [Google Scholar] [CrossRef]
- Perdue, R.E. Arundo donax—source of musical reeds and industrial cellulose. Econ. Bot. 1958, 12, 368–404. [Google Scholar] [CrossRef]
- Ceotto, E.; Di Candilo, M.; Castelli, F.; Badeck, F.W.; Rizza, F.; Soave, C. Comparing solar radiation interception and use efficiency for the energy crops giant reed (Arundo donax L.) and sweet sorghum (Sorghum bicolor L. Moench). Field Crops Res. 2013, 149, 159–166. [Google Scholar] [CrossRef]
- Allesina, G.; Pedrazzi, S.; Ginaldi, F.; Cappelli, G.A.; Puglia, M.; Morselli, N.; Tartarini, P. Energy production and carbon sequestration in wet areas of Emilia Romagna region, the role of Arundo Donax. Adv. Model. Anal. A 2018, 55, 108–113. [Google Scholar]
- Lewandosky, I.; Scurlock, J.M.O.; Lindvall, E.; Christou, M. The development and current status of perennial rhizomatous grasses as energy crops in the US and Europe. Biomass Bioenergy 2003, 25, 335–361. [Google Scholar] [CrossRef]
- Webster, R.J.; Driever, S.M.; Kromdijk, J.; McGrath, J.; Leakey, A.D.B.; Siebke, K.; Demetriades-Shah, T.; Bonnage, S.; Peloe, T.; Lawson, T.; et al. High C3 photosynthetic capacity and high intrinsic water use efficiency underlies the high productivity of the bioenergy grass Arundo donax. Sci Rep. 2016, 6, 20694. [Google Scholar] [CrossRef] [PubMed]
- Nocentini, A.; Monti, A. Land-use change from poplar to switchgrass and giant reed increases soil organic carbon. Agron. Sustain. Dev. 2017, 37, 23. [Google Scholar] [CrossRef]
- Ceotto, E.; Castelli, F.; Moschella, A.; Diozzi, M.; Di Candilo, M. Cattle slurry fertilization to giant reed (Arundo donax L.): Biomass yield and nitrogen use efficiency. Bioenergy Res. 2015, 8, 1252–1262. [Google Scholar] [CrossRef]
- Ceotto, E.; Marchetti, R.; Castelli, F. Residual soil nitrate as affected by giant reed cultivation and cattle slurry fertilisation. Ital. J. Agron. 2018, 18, 317–323. [Google Scholar] [CrossRef]
- Corno, L.; Pilu, R.; Adani, F. Arundo donax L.: A non-food crop for bioenergy and bio-compound production. Biotechnol. Adv. 2014, 32, 1535–1549. [Google Scholar] [CrossRef] [PubMed]
- Ceotto, E.; Vasmara, C.; Marchetti, R.; Cianchetta, S.; Galletti, S. Biomass and methane yield of giant reed (Arundo donax L.) as affected by single and double annual harvest. GCB Bioenergy 2021, 13, 393–407. [Google Scholar] [CrossRef]
- Kheshgi, H.S.; Prince, R.C.; Marland, G. The potential of biomass fuels in the context of global climate change: Focus on transportation fuels. Annu. Rev. Energy Environ. 2000, 25, 199–244. [Google Scholar] [CrossRef]
- Cappelli, G.; Yamaç, S.S.; Stella, T.; Francone, C.; Paleari, L.; Negri, M.; Confalonieri, R. Are advantages from the partial replacement of corn with second-generation energy crops undermined by climate change? A case study for giant reed in northern Italy. Biomass Bioenergy 2015, 80, 85–93. [Google Scholar] [CrossRef]
- Vasmara, C.; Cianchetta, S.; Marchetti, R.; Ceotto, E.; Galletti, S. Potassium Hydroxyde Pre-treatment Enhances Methane Yield from Giant Reed (Arundo donax L.). Energies 2021, 14, 630. [Google Scholar] [CrossRef]
- Danelli, T.; Sepulcri, A.; Masetti, G.; Colombo, F.; Sangiorgio, S.; Cassani, E.; Anelli, S.; Adani, F.; Pilu, R. Arundo donax L. Biomass Production in a Polluted Area: Effects of Two Harvest Timings on Heavy Metals Uptake. Appl. Sci. 2021, 11, 1147. [Google Scholar] [CrossRef]
- Librenti, I.; Ceotto, E.; Di Candilo, M. Biomass characteristics and Energy contents of dedicated lignocellulosic crops. In Proceedings of the Third International Symposium on Energy from Biomass and Waste 2010, Venice, Italy, 8–11 November 2010; CISA, Environmental Sanitary Engineering Centre: Padova, Italy, 2010. 8p. ISBN 978-88-6265-008-3. [Google Scholar]
- Ginaldi, F.; Bajocco, S.; Bregaglio, S.; Cappelli, G. Spatializing Crop Models for Sustainable Agriculture. In Innovations in Sustainable Agriculture, 1st ed.; Farooq, M., Pisante, M., Eds.; Springer Nature: Cham, Swizerland, 2019; pp. 599–619. [Google Scholar]
- Pedrazzi, S.; Allesina, G.; Morselli, N.; Puglia, M.; Barbieri, L.; Lancellotti, I.; Ceotto, E.; Cappelli, G.A.; Ginaldi, F.; Giorgini, L.; et al. The energetic recover of biomass from river maintenance: The rebaf project. In Proceedings of the 25th EUBCE European Biomass Conference and Exhibition 2017, Stockholm, Sweden, 12–15 June 2017; Ek, L., Ehrnrooth, H., Persson, M., Scarlat, N., Grassi, A., Helm, P., Eds.; ETA-Florence Renewable Energies: Florence, Italy, 2017; pp. 52–57. [Google Scholar]
- Cappelli, G.A.; Ginaldi, F.; Corinzia, S.A.; Cosentino, S.L.; Fanchini, D.; Ceotto, E. Assessment of giant reed biomass potential (Arundo donax L.) in marginal areas of Italy via the application of Arungro simulation model. In Proceedings of the 28th EUBCE European Biomass Conference and Exhibition 2020, Virtual, 6–9 July 2020; Mauguin, P., Scarlat, N., Grassi, A., Helm, P., Eds.; ETA-Florence Renewable Energies: Florence, Italy, 2020; pp. 15–21. [Google Scholar]
- Ginaldi, F.; Danuso, F.; Rosa, F.; Rocca, A.; Bashanova, O.; Sossai, E. Agro-energy supply chain planning: A procedure to evaluate economic, energy and environmental sustainability. Ital. J. Agron. 2012, 7, 221–228. [Google Scholar] [CrossRef]
- Stella, T.; Francone, C.; Yamaç, S.S.; Ceotto, E.; Pagani, V.; Pilu, R.; Confalonieri, R. Reimplementation and reuse of the Canegro model: From sugarcane to giant reed. Comput. Electron. Agric. 2015, 113, 193–202. [Google Scholar] [CrossRef]
- Peel, M.C.; Finlayson, B.L.; McMahon, T.A. Updated world map of the Köppen-Geiger climate classification. Hydrol. Earth Syst. Sci. 2007, 11, 1633–1644. [Google Scholar] [CrossRef]
- Cosentino, S.L.; Scordia, D.; Sanzone, E.; Testa, G.; Copani, V. Response of Giant Reed (Arundo Donax L.) to Nitrogen Fertilization and Soil Water Availability in Semi-Arid Mediterranean Environment. Eur. J. Agron. 2014, 60, 22–32. [Google Scholar] [CrossRef]
- CREA—Council for Agricultural Research and Economics. Italian Agriculture in Figures; CREA—Agricultural Policies and Bioeconomy: Rome, Italy, 2017; p. 183. Available online: https://www.crea.gov.it/documents/68457/0/Itaconta+2017_+ING_DEF_WEB2.pdf/1218e51d-0bf5-03d0-3089-0a56af2e26d5?t=1559117850834 (accessed on 19 May 2021).
- Battista, F.; Frison, N.; Bolzonella, D. Energy and Nutrients’ Recovery in Anaerobic Digestion of Agricultural Biomass: An Italian Perspective for Future Applications. Energies 2019, 12, 3287. [Google Scholar] [CrossRef]
- Susmozas, A.; Martín-Sampedro, R.; Ibarra, D.; Eugenio, M.E.; Iglesias, R.; Manzanares, P.; Moreno, A.D. Process Strategies for the Transition of 1G to Advanced Bioethanol Production. Processes 2020, 8, 1310. [Google Scholar] [CrossRef]
- Williams, J.R.; Jones, C.A.; Kiniry, J.R.; Spanel, D.A. The EPIC crop growth model. Trans. ASAE 1989, 32, 497–511. [Google Scholar] [CrossRef]
- Ritchie, J.T.; Otter, S. Description and performance of CERES-wheat: A user- oriented wheat yield model. In ARS Wheat Yield Project; ARS-38; Willis, W.O., Ed.; U.S. Department of Agriculture, Agricultural Research Service: Washington, DC, USA, 1985; pp. 159–175. [Google Scholar]
- Scordia, D.; Cosentino, S.L.; Lee, J.W.; Jeffries, T.W. Bioconversion of giant reed (Arundo donax L.) hemicellulose hydrolysate to ethanol by Scheffersomyces stipitis CBS6054. Biomass Bioenergy 2012, 39, 296–305. [Google Scholar] [CrossRef]
- Jørgensen, S.E.; Kamp-Nielsen, L.; Christensen, T.; Windolf-Nielsen, J.; Westergaard, B. Validation of a prognosis based upon a eutrophication model. Ecol. Model. 1986, 32, 165–182. [Google Scholar] [CrossRef]
- Loague, K.; Green, R.E. Statistical and graphical methods for evaluating solute transport models: Overview and application. J. Contam. Hydrol. 1991, 7, 51–73. [Google Scholar] [CrossRef]
- Nash, J.E.; Sutcliffe, J.V. River flow forecasting through conceptual models, part I—A discussion of principles. J. Hydrol. 1970, 10, 282–290. [Google Scholar] [CrossRef]
- Moriasi, D.N.; Arnold, J.G.; van Liew, M.W.; Bingner, R.L.; Harmel, R.D.; Veith, T.L. Model evaluation guidelines for systematic quantification of accuracy in watershed simulations. Trans. ASABE 2007, 50, 885–900. [Google Scholar] [CrossRef]
- Duveiller, G.; Donatelli, M.; Fumagalli, D.; Zucchini, A.; Nelson, R.; Baruth, B. A dataset of future daily weather data for crop modelling over Europe derived from climate change scenarios. Theor. Appl. Climatol. 2017, 127, 573–585. [Google Scholar] [CrossRef]
- Wösten, J.H.M.; Lilly, A.; Nemes, A.; Le Bas, C. Development and use of a database of hydraulic properties of European soils. Geoderma 1999, 90, 169–185. [Google Scholar] [CrossRef]
- L’Abate, G.; Fantappie, M.; Priori, S.; D’Avino, L.; Barbetti, R.; Lorenzetti, R.; Costantini, E.A.C. Italian Derived Soil Profile’s Database. 1.0. Consiglio per la Ricerca in Agricoltura e L’analisi Dell’economia Agraria (CREA-AA), Online Database. Available online: https://www.crea.gov.it/web/agricoltura-e-ambiente (accessed on 19 May 2021).
- Sallustio, L.; Harfouche, A.; Marchetti, M.; Salvati, L.; Corona, P. Evaluating the potential of marginal lands available for sustainable cellulosic biofuel production in Italy. Renew. Sustain. Energy Rev. 2020. under review. [Google Scholar]
- Ivan, C.; Vasile, R.; Dadarlat, V. Serverless Computing: An Investigation of Deployment Environments for Web APIs. Computers 2019, 8, 50. [Google Scholar] [CrossRef]
- Di Girolamo, G.; Grigatti, M.; Barbanti, L.; Angelidaki, I. Effects of hydrothermal pre-treatments on Giant reed (Arundo donax) methane yield. Bioresour. Technol. 2013, 147, 152–159. [Google Scholar] [CrossRef] [PubMed]
- Di Girolamo, G.; Bertin, L.; Capecchi, L.; Ciavatta, C.; Barbanti, L. Mild alkaline pre-treatments loosen fibre structure enhancing methane production from biomass crops and residues. Biomass Bioenergy 2014, 71, 318–329. [Google Scholar] [CrossRef]
- Yang, L.; Li, Y. Anaerobic digestion of giant reed for methane production. Bioresour. Technol. 2014, 171, 233–239. [Google Scholar] [CrossRef]
- Liu, S.; Ge, X.; Liew, L.; Liu, Z.; Li, Y. Effect of urea addition on giant reed ensilage and subsequent methane production by anaerobic digestion. Bioresour. Technol. 2015, 192, 682–688. [Google Scholar] [CrossRef]
- Jiang, D.; Ge, X.; Zhang, Q.; Li, Y. Comparison of liquid hot water and alkaline pretreatments of giant reed for improved enzymatic digestibility and biogas energy production. Bioresour. Technol. 2016, 216, 60–68. [Google Scholar] [CrossRef]
- Shilpi, S.; Lamb, D.; Bolan, N.; Seshadri, B.; Choppala, G.; Naidu, R. Waste to watt: Anaerobic digestion of wastewater irrigated biomass for energy and fertiliser production. J. Environ. Manag. 2019, 239, 73–83. [Google Scholar] [CrossRef]
- Bura, R.; Ewanick, S.; Gustafson, R. Assessment of Arundo donax (giant reed) as feedstock for conversion to ethanol. Tappi J. 2012, 11, 59–66. [Google Scholar] [CrossRef]
- Scordia, D.; Testa, G.; Cosentino, S.L. Perennial grasses as lignocellulosic feedstock for second-generation bioethanol production in Mediterranean environment. Ital. J. Agron. 2014, 9, 84–92. [Google Scholar] [CrossRef]
- Viola, E.; Zimbardi, F.; Valerio, V.; Villone, A. Effect of ripeness and drying process on sugar and ethanol production from giant reed (Arundo donax L.). AIMS. Bioeng. 2015, 2, 29–39. [Google Scholar] [CrossRef]
- Angelini, L.G.; Ceccarini, L.; Bonari, E. Biomass yield and energy balance of giant reed (Arundo Donax L.) cropped in central Italy as related to different management practices. Eur. J. Agron. 2005, 22, 375–389. [Google Scholar] [CrossRef]
- Bracco, S.; Chinnici, G.; Longhitano, D.; Santeramo, F.G. Prime valutazioni sull’impatto delle produzioni agroenergetiche in Sicilia. Econ. Dirit. Agroaliment. 2008, 3, 159–192. [Google Scholar]
- Ginaldi, F.; Bindi, M.; Marta, A.D.; Ferrise, R.; Orlandini, S.; Danuso, F. Interoperability of Agronomic Long Term Experiment Databases and Crop Model Intercomparison: The Italian Experience. Eur. J. Agron. 2016, 77, 209–222. [Google Scholar] [CrossRef]
- Donatelli, M.; Bellocchi, G.; Carlini, L.; Colauzzi, M. CLIMA: A component-based weather generator. In Proceedings of the MODSIM International Congress on Modelling and Simulation 2005, Melbourne, Australia, 12–15 December 2005; Zerger, A., Argent, R.M., Eds.; Modelling and Simulation Society of Australia and New Zealand: Melbourne, Australia, 2005; pp. 627–633. [Google Scholar]
- Ju, J.; Ya, W.; Fu, J.; Wu, J.; Lin, Z. Research on Key Technology in SaaS. In Proceedings of the IEEE 2010 International Conference on Intelligent Computing and Cognitive Informatics, Kuala Lumpur, Malaysia, 22–23 June 2010; pp. 384–387. [Google Scholar]
- Caillat, S.; Vakkilainen, E. 9—Large-Scale Biomass Combustion Plants: An Overview. In Biomass Combustion Science, Technology and Engineering; Woodhead Publishing Series in Energy; Rosendahl, L., Ed.; Woodhead Publishing: Sawston, UK; Cambridge, UK, 2013; pp. 189–224. [Google Scholar]
- Appels, L.; Lauwers, J.; Degrève, J.; Helsen, L.; Lievens, B.; Willems, K.; Van Impe, J.; Dewil, R. Anaerobic digestion in global bio-energy production: Potential and research challenges. Renew. Sustain. Energy Rev. 2011, 15, 4295–4301. [Google Scholar] [CrossRef]
- Menon, V.; Rao, M. Trends in bioconversion of lignocellulose: Biofuels, platform chemicals & biorefinery concept. Prog. Energy Combust. Sci. 2012, 38, 522–550. [Google Scholar]
- Cosentino, S.L.; Patanè, C.; Sanzone, E.; Testa, G.; Scordia, D. Leaf Gas Exchange, Water Status and Radiation Use Efficiency of Giant Reed (Arundo Donax L.) in a Changing Soil Nitrogen Fertilization and Soil Water Availability in a Semi-Arid Mediterranean Area. Eur. J. Agron. 2016, 72, 56–69. [Google Scholar] [CrossRef]
- Di Nasso, N.N.; Roncucci, N.; Bonari, E. Seasonal dynamics of aboveground and belowground biomass and nutrient accumulation and remobilization in giant reed (Arundo donax L.): A three-year study on marginal land. BioEnergy Res. 2013, 6, 725–736. [Google Scholar] [CrossRef]
- Nackley, L.L.; Vogt, K.A.; Kim, S.H. Arundo donax water use and photosynthetic responses to drought and elevated CO2. Agric. Water Manag. 2014, 136, 13–22. [Google Scholar] [CrossRef]
- Barney, J.N.; DiTomaso, J.M. Global climate niche estimates for bioenergy crops and invasive species of agronomic origin: Potential problems and opportunities. PLoS ONE 2011, 6, e17222. [Google Scholar] [CrossRef]
- Batstone, D.J.; Puyol, D.; Flores-Alsina, X.; Rodríguez, J. Mathematical modelling of anaerobic digestion processes: Applications and future needs. Rev. Environ. Sci. Bio/Technol. 2015, 14, 595–613. [Google Scholar] [CrossRef]
- Nosrati-Ghods, N.; Harrison, S.T.L.; Isafiade, A.J.; Tai, S.L. Mathematical Modelling of Bioethanol Fermentation From Glucose, Xylose or Their Combination—A Review. ChemBioEng Rev. 2020, 7, 68–88. [Google Scholar] [CrossRef]
- Gabriel, K.J.; El-Halwagi, M.M. Modeling and optimization of a bioethanol production facility. Clean Technol. Environ. 2013, 15, 931–944. [Google Scholar] [CrossRef]
- Dutta, K.; Daverey, A.; Lin, J.-G. Evolution retrospective for alternative fuels: First to fourth generation. Renew. Energy 2014, 69, 114–122. [Google Scholar] [CrossRef]
- Oh, Y.K.; Hwang, K.-R.; Kim, C.; Kim, J.R.; Lee, J.-S. Recent developments and key barriers to advanced biofuels: A short review. Bioresour. Technol. 2018, 257, 320–333. [Google Scholar] [CrossRef]
- Ziolkowska, J.R. Biofuels technologies: An overview of feedstocks, processes, and technologies. In Biofuels for a More Sustainable Future: Life Cycle Sustainability Assessment and Multi-Criteria Decision Making, 1st ed.; Ren, J., Scipioni, A., Manzardo, A., Liang, H., Eds.; Elsevier B.V.: Amsterdam, The Netherlands, 2020; pp. 1–19. [Google Scholar]
- O’Keeffe, S.; Thrän, D. Energy crops in regional biogas systems: An integrative spatial LCA to assess the influence of crop mix and location on cultivation GHG emissions. Sustainability 2020, 12, 237. [Google Scholar] [CrossRef]
- Lee, M.; Cho, S.; Kim, J. A comprehensive model for design and analysis of bioethanol production and supply strategies from lignocellulosic biomass. Renew. Energy 2017, 112, 247–259. [Google Scholar] [CrossRef]


| ID | Parameter | Description | Unit | Max | Min | Value | Source |
|---|---|---|---|---|---|---|---|
| 1 | BaseRootBiomForTillerDev | Minimum root biomass value for tiller development | °C | 5 | 0 | 0 | D |
| 2 | BaseTempForConvEff | Base temperature for conversion efficiency | °C | 25 | 0 | 8.30 | C |
| 3 | BaseTempForEmerg | Base temperature for emergence from planting or ratooning | °C | 30 | 0 | 2.94 | C |
| 4 | BaseTempForLeafEm | Base temperature for leaf emission | °C | 25 | 5 | 6.44 | C |
| 5 | BaseTempForPhotos | Base temperature for photosynthesis | °C | 20 | 0 | 6.59 | C |
| 6 | BaseTempForPlantExt | Base temperature for plant extension | °C | 20 | 5 | 5.52 | C |
| 7 | BaseTempForRootExt | Base temperature for root extension | °C | 30 | 0 | 10 | D |
| 8 | BaseTempForStalkElo | Base temperature for stalk elongation | °C | 16 | 0 | 9.36 | C |
| 9 | BaseTempForTillerDev | Base temperature for tiller population development | °C | 20 | 10 | 10.32 | C |
| 10 | CropCoefficient | Crop coefficient | - | 10 | 0 | 1.15 | D |
| 11 | CutOffTempForLeafEm | Cutoff temperature for leaf emission | °C | 50 | 25 | 36.14 | C |
| 12 | CutOffTempForRootExt | Maximum temperature for root extension | °C | 40 | 25 | 30.96 | C |
| 13 | CutOffTempForStalkElo | Cutoff temperature for stalk elongation | °C | 40 | 25 | 40 | C |
| 14 | CutOffTempForTillerDev | Cutoff temperature for tiller population development | °C | 40 | 25 | 29.13 | C |
| 15 | FractionOfDyingTiller | Fraction of tillers above the future mature tiller population (at 1600 °Cd) that senesce per unit thermal time | (°Cd)−1 | 0.005 | 0.003 | 0.0024 | C |
| 16 | FractGrossPhotoGroResp | Fraction of gross photosynthesis lost for growth respiration | - | 1 | 0 | 0.18 | C |
| 17 | FracPlantEloDueToStalkElo | Fraction of plant elongation attributable to stalk elongation | - | 1 | 0 | 0.45 | D |
| 18 | LeafAngle | Leaf angle | ° | 90 | 0 | 25 | D |
| 19 | LeafIDForLeafAreaLimit | Leaf ID above which leaf area is limited | - | 40 | 0 | 15 | D |
| 20 | LeafNumAtPhylloSwitch | Leaf number at which the phyllocron changes | - | 500 | 0 | 18 | D |
| 21 | LeafNumForMaxLightExt | Leaf number at which maximum light extinction occurs | - | 100 | 0 | 20 | D |
| 22 | MaxRadConvEff | Maximum radiation conversion efficiency | g MJ−1 | 20 | 0 | 9.98 | C |
| 23 | MaxCanopyLightExtCoeff | Maximum canopy light extinction coefficient | - | 1 | 0 | 0.84 | C |
| 24 | MaxLeafArea | Maximum leaf area assigned to all leaves above LeafIDForLeafAreaLimit | cm2 | 650 | 50 | 354.71 | C |
| 25 | MaxLeafLength | Absolute maximum leaf length | cm | 110 | 50 | 52.53 | C |
| 26 | MaxLeafWidth | Absolute maximum leaf width | cm | 10 | 1 | 3.87 | C |
| 27 | MaxNumExpLeaves | Maximum number of expanding leaves on a tiller | - | 40 | 0 | 7 | C |
| 28 | MaxNumWellWaterGrLeaves | Maximum number of green leaves under well water conditions | - | 50 | 0 | 30 | C |
| 29 | MaxNumberOfLeavesPerTiller | Maximum number of leaves per tiller | - | 40 | 1 | 37 | C |
| 30 | MaxPartFractToAerialDryMass | Maximum partition fraction to aerial dry mass | t t−1 | 1 | 0 | 0.85 | C |
| 31 | MaxRootBiomForTillerDev | Maximum root biomass for tiller development | °C | 30 | 0 | 20 | D |
| 32 | MaxTempForConvEff | Maximum temperature for conversion efficiency | °C | 40 | 0 | 32.38 | C |
| 33 | MaxLeafArea1 | Cultivar parameter for quadratic equation for max leaf area | cm2 | 10 | −10 | 0 | D |
| 34 | MaxLeafArea2 | Cultivar parameter for quadratic equation for max leaf area | cm2 | 100 | −10 | 0 | D |
| 35 | MaxLeafArea3 | Cultivar parameter for quadratic equation for max leaf area | cm2 | 300 | −50 | 180 | D |
| 36 | MaxLeafLengthPerLeafN1 | Parameter for quadratic equation for max leaf length per leaf number | cm | 10 | −10 | 0 | D |
| 37 | MaxLeafLengthPerLeafN2 | Parameter for quadratic equation for max leaf length per leaf number | cm | 30 | −10 | 0 | D |
| 38 | MaxLeafLengthPerLeafN3 | Parameter for quadratic equation for max leaf length per leaf number | cm | 120 | −10 | 65 | D |
| 39 | MaxLeafWidthPerLeafN1 | Parameter for quadratic equation for max leaf width per leaf number | mm | 5 | −5 | 0 | D |
| 40 | MaxLeafWidthPerLeafN2 | Parameter for quadratic equation for max leaf width per leaf number | mm | 5 | −5 | 0 | D |
| 41 | MaxLeafWidthPerLeafN3 | Parameter for quadratic equation for max leaf width per leaf number | mm | 120 | −10 | 60 | D |
| 42 | MaxRootLengthDensity | Maximum root length density | cm cm−3 | 50 | 0 | 4.82 | C |
| 43 | MaxTillerPop | Maximum tiller population | tiller m−2 | 50 | 15 | 31 BO; 28 CT | C |
| 44 | MinCanopyExtinctionCoeff | Minimum canopy extinction coefficient | - | 1 | 0 | 0.57 | C |
| 45 | MinPartFractAerialDryMass | Minimum partition fraction to aerial dry mass | t t−1 | 1 | 0 | 0.086 | C |
| 46 | MinRootLengthDensity | Minimum root length density | cm cm−3 | 50 | 0 | 0.02 | D |
| 47 | OptRootBioForTillerDev | Optimum root biomass for tiller development | °C | 20 | 0 | 10 | D |
| 48 | OptTempForConvEff | Optimum temperature for conversion efficiency | °C | 30 | 0 | 18.39 | C |
| 49 | OptTempForEmergence | Optimum temperature for emergence from planting or ratooning | °C | 45 | 15 | 31.95 | C |
| 50 | PartFractionAtHighTemp | Fraction of aerial dry mass partitioned to stalk at high temperature | t t−1 | 1 | 0 | 0.76 | C |
| 51 | PartCoefficient | Partitioning Coefficient for aerial dry mass | - | 1 | 0 | 0.558 | C |
| 52 | PhylloInterAboveSwitchN | Phyllocron interval 2 (for leaf numbers below Pswitch,°C.d (base TTBASELFEX)) | °Cd | 500 | 0 | 90 | D |
| 53 | PhylloInterBelowSwitchN | Phyllocron interval 1 (for leaf numbers below Pswitch,°C.d (base TTBASELFEX)) | °Cd | 500 | 0 | 40 | D |
| 54 | Q10ForMaintenanceResp | Fractional increase in respiration rate per 10°C rise in temperature | - | 5 | 0 | 1.68 | D |
| 55 | ReferenceMaintenanceResp | Value of maintenance respiration at 10 °C | t t−1 d−1 | 1 | 0 | 0.004 | C |
| 56 | RootDepthIncrPerGDD | Root depth increase per growing degree day | cm (°Cd)−1 | 0.5 | 0 | 0.1 | C |
| 57 | RootLengthPerMassOfRoot | Root length per mass of root | cm g−1 | 10,000 | 0 | 500 | D |
| 58 | SoilWaterSupplyPotETCoeff1 | Soil water supply potential ET ratio. Thershold below which evaporation and photosynthesis are limited | - | 10 | 0 | 0.016 | C |
| 59 | SoilWaterSupplyPotETCoeff2 | Soil water supply potential evapotranspiration ratio. Thershold below which expansive growth is limited | - | 10 | 0 | 1 | C |
| 60 | ThermTimeForStalkElo | Thermal time after which stalk elongates | °C | 1800 | 800 | 1015.89 | C |
| 61 | ThermTimeToEmergFromPlant | Thermal time to emergence for a plant crop | °Cd | 900 | 10 | 14.81 | C |
| 62 | ThermTimeToEmergFromRatooning | Thermal time to emergence for a ratoon crop | °Cd | 500 | 0 | 15 | C |
| 63 | TillerPopulationAfter1600TT | Tiller population after 1600 thermal time | tiller m−2 | 30 | 1 | 13.39 | C |
| 64 | TTEmergenceToPeakTillerPop | Thermal time emergence to peak tiller population | °Cd | 900 | 300 | 632.8 | C |
| 65 | UnstressedPlantExtensionRate | Unstressed plant extension rate | mm °C−1h−1 | 5 | 0 | 0.215 | C |
| Province | CAAB (Mg C ha−1) | Biomethane (Nm3 ha−1) | Bioethanol (L ha−1) | |||
|---|---|---|---|---|---|---|
| 2000 | 2030 | 2000 | 2030 | 2000 | 2030 | |
| BO | 7.5 ± 1.4 | 7.4 ± 1.4 | 5140 ± 955 | 5098 ± 989 | 4060 ± 755 | 4027 ± 781 |
| CT | 8.5 ± 1.8 | 8.6 ± 1.7 | 5861 ± 1223 | 5923 ± 1145 | 4630 ± 966 | 4679 ± 904 |
Publisher’s Note: MDPI stays neutral with regard to jurisdictional claims in published maps and institutional affiliations. |
© 2021 by the authors. Licensee MDPI, Basel, Switzerland. This article is an open access article distributed under the terms and conditions of the Creative Commons Attribution (CC BY) license (https://creativecommons.org/licenses/by/4.0/).
Share and Cite
Cappelli, G.A.; Ginaldi, F.; Fanchini, D.; Corinzia, S.A.; Cosentino, S.L.; Ceotto, E. Model-Based Assessment of Giant Reed (Arundo donax L.) Energy Yield in the Form of Diverse Biofuels in Marginal Areas of Italy. Land 2021, 10, 548. https://doi.org/10.3390/land10060548
Cappelli GA, Ginaldi F, Fanchini D, Corinzia SA, Cosentino SL, Ceotto E. Model-Based Assessment of Giant Reed (Arundo donax L.) Energy Yield in the Form of Diverse Biofuels in Marginal Areas of Italy. Land. 2021; 10(6):548. https://doi.org/10.3390/land10060548
Chicago/Turabian StyleCappelli, Giovanni Alessandro, Fabrizio Ginaldi, Davide Fanchini, Sebastiano Andrea Corinzia, Salvatore Luciano Cosentino, and Enrico Ceotto. 2021. "Model-Based Assessment of Giant Reed (Arundo donax L.) Energy Yield in the Form of Diverse Biofuels in Marginal Areas of Italy" Land 10, no. 6: 548. https://doi.org/10.3390/land10060548
APA StyleCappelli, G. A., Ginaldi, F., Fanchini, D., Corinzia, S. A., Cosentino, S. L., & Ceotto, E. (2021). Model-Based Assessment of Giant Reed (Arundo donax L.) Energy Yield in the Form of Diverse Biofuels in Marginal Areas of Italy. Land, 10(6), 548. https://doi.org/10.3390/land10060548