Article

Energy Recovery Using Microturbines in Urban Water Distribution Systems: A Case Study of Busan, South Korea


1
Department of Environmental Engineering, Pusan National University, Busan 46241, Republic of Korea
2
Korea Institute of Civil Engineering and Building Technology, Goyang 10223, Republic of Korea
3
Busan Water Quality Research Institute, Busan 50873, Republic of Korea
*
Author to whom correspondence should be addressed.
Water 2026, 18(7), 847; https://doi.org/10.3390/w18070847
Submission received: 20 February 2026 / Revised: 17 March 2026 / Accepted: 30 March 2026 / Published: 1 April 2026
(This article belongs to the Special Issue Resilience and Risk Management in Urban Water Systems)

Abstract

Urban water distribution systems often dissipate excess hydraulic energy through pressure-reducing valves to maintain safe operating conditions, particularly in cities with complex topography. This study investigates the potential for sustainable energy recovery using microturbines in a large-scale urban water distribution system, with a focus on the city of Busan, South Korea. A digital twin of the Busan water transmission and distribution network was developed to analyze system-wide hydraulic characteristics, including elevation, hydraulic head, pressure, and flow. Candidate locations for microturbine installation were identified based on existing pressure regulation points and quantified using hydraulic simulation results. The recoverable power and energy potential were estimated by considering flow rate, available head difference, and turbine efficiency, and the model results were validated using operational data and field investigations at selected sites. The results show that significant recoverable energy is concentrated at pressure-reducing valve locations where excess pressure coincides with high flow rates and substantial pressure differentials under representative operating conditions. The maximum recoverable energy at a single site was estimated to be approximately 16.9 MWh/month, indicating that distributed microturbine installations can provide meaningful supplementary energy recovery. The findings demonstrate that digital twin–based analysis offers a systematic and practical approach for identifying energy recovery opportunities in urban water distribution systems and can support more energy-efficient and sustainable water utility operations.

1. Introduction

Water Supply Systems (WSSs) constitute the critical infrastructure designed to deliver water from sources—such as rivers, lakes, or groundwater—to consumers. These complex systems encompass water intake, conveyance, treatment, transmission, and distribution, with the primary objective of supplying adequate water quantity and quality while maintaining sufficient pressure at end-user points. Water is transported through pipelines using pressure energy generated via gravity or pumping stations. However, in distribution networks, this pressure must often be regulated using Pressure Reducing Valves (PRVs) to prevent leakage and pipe bursts. This is particularly critical in regions with significant topographical variations, such as South Korea, where high residual pressures are common and the role of PRVs is essential for system stability [1,2].
In the context of the global climate crisis and the energy transition, the hydraulic energy dissipated by PRVs represents a significant wasted resource. Microturbines and pumps operating as turbines (PATs) offer a sustainable solution by converting this excess hydraulic pressure into electrical energy. By installing microturbines in high-pressure zones or at pressure regulation points, water utilities can simultaneously maintain the pressure regulation function of PRVs and generate green energy [3,4]. Furthermore, efficient pressure management through PATs can reduce water losses and enhance the mechanical reliability of the pipeline network [2,3]. Recent advancements have expanded the scope of this water-energy nexus; for instance, Ma et al. [5] demonstrated that hydropower recovered from in-pipe systems can even power UV disinfection units, thereby enhancing microbial water quality management.
Despite these benefits, the feasibility of microturbine implementation is highly dependent on the specific hydraulic characteristics of the network. The efficiency and economic viability of these systems fluctuate with variations in flow rates and pressure heads. Consequently, selecting the optimal locations and capacities for microturbines is a complex decision-making process that necessitates advanced analytical tools, such as digital twins of water pipeline systems. To address these challenges, recent studies have proposed various optimization methodologies. Fernandez Garcia and McNabola [6] proposed a methodology to detect the number of PATs to maximize hydropower in gravity systems. Latifi et al. [7] investigated the optimal scheduling of PATs alongside PRVs to improve network performance. More recently, Marini et al. [8] introduced the HYPER tool for computer-assisted optimal PAT selection, while Kostner et al. [9] utilized digital hydraulic models to implement dynamic control algorithms that minimize leakage and maximize energy recovery.
However, a significant gap remains in the existing studies. Most existing studies focus primarily on theoretical optimization models or specific technological applications [4,8], often neglecting the practical complexities of real-world urban networks and the socio-economic factors influencing implementation. The success of energy recovery projects is not solely determined by hydraulic feasibility but also by economic viability and the acceptance of various stakeholders [10,11]. Few studies have demonstrated a screening and prioritization workflow supported by operational data for energy recovery installation in large, topographically complex urban networks.
This study aims to bridge this gap by investigating the role of hydropower within a real-world urban water distribution system. We provide a theoretical background on micro-power generation in pressurized water systems and apply this framework to the water distribution network of Busan, South Korea. A digital twin is implemented to identify and prioritize candidate locations based on quantified hydraulic energy potential, providing inputs for subsequent techno-economic evaluation. Additionally, we address the practical challenges associated with installation and operation, offering a comprehensive framework for sustainable energy recovery in urban water systems.

2. Microturbine-Based Energy Recovery in Water Supply Systems

2.1. Overview of Energy Recovery in Pressurized Water Pipelines

In pressurized water distribution networks, pressure-reducing valves (PRVs) are widely used to maintain safe and stable downstream pressure levels. While effective for pressure management, PRVs inherently dissipate excess hydraulic head as energy losses. Over the past two decades, this dissipated energy has increasingly been recognized as a recoverable resource, particularly in urban water networks characterized by large elevation differences and complex topography.
Previous studies have framed energy recovery in water distribution systems as part of the broader water–energy nexus, emphasizing that hydraulic energy recovery can contribute to improving the overall energy efficiency and sustainability of water utilities [12,13]. Rather than treating energy recovery as a standalone objective, recent research highlights its role as a byproduct of pressure management, where unavoidable pressure dissipation can be converted into useful electrical energy without compromising hydraulic performance or service reliability [3,14]. This conceptual shift—from energy generation to pressure-management-driven energy recovery—has motivated the integration of small-scale hydropower technologies directly into existing pressure control infrastructure. As a result, water distribution networks are increasingly viewed not only as consumers of energy but also as distributed energy recovery systems embedded within urban infrastructure.
Small-scale hydropower systems are generally classified based on installed capacity and available head, ranging from pico-hydropower (<5 kW), micro-hydropower (5 kW to 100 kW) and mini-hydropower (100 kW to 1 MW). Within water distribution networks, energy recovery applications typically fall within the micro-hydropower range, where available head is moderate (typically ranging from 20 to 100 m in topographically complex urban networks) and flow rates are constrained by system operating requirements. Two main technology groups have been widely investigated for this purpose: PATs and dedicated microturbines. PATs have received considerable attention due to their relatively low capital cost, widespread availability, and mechanical simplicity [12]. Numerous studies have demonstrated the feasibility of using PATs as cost-effective substitutes for PRVs, enabling simultaneous pressure regulation and energy recovery [2,3,13]. However, selecting the optimal PAT is challenging because manufacturers rarely provide characteristic curves for turbine modes. Consequently, the recent literature has focused on developing operative frameworks and computer-assisted selection methods to predict PAT performance under variable conditions [8,15]. Conversely, dedicated microturbines often offer higher hydraulic efficiency and better controllability, albeit at a higher initial cost. The choice between PATs and custom microturbines is increasingly guided by a trade-off between hydraulic efficiency, operational flexibility (e.g., variable speed control), and long-term economic returns [9].

2.2. Hydraulic and Operational Principles in Water Distribution Networks

Energy recovery using microturbines in water distribution networks is fundamentally based on the conversion of hydraulic potential energy, manifested as pressure, into mechanical energy through a turbine and subsequently into electrical energy via a generator. In pressurized pipeline systems, this hydraulic potential originates from elevation differences, storage tank levels, pumping operations, and pressure regulation requirements imposed to ensure a reliable water supply.
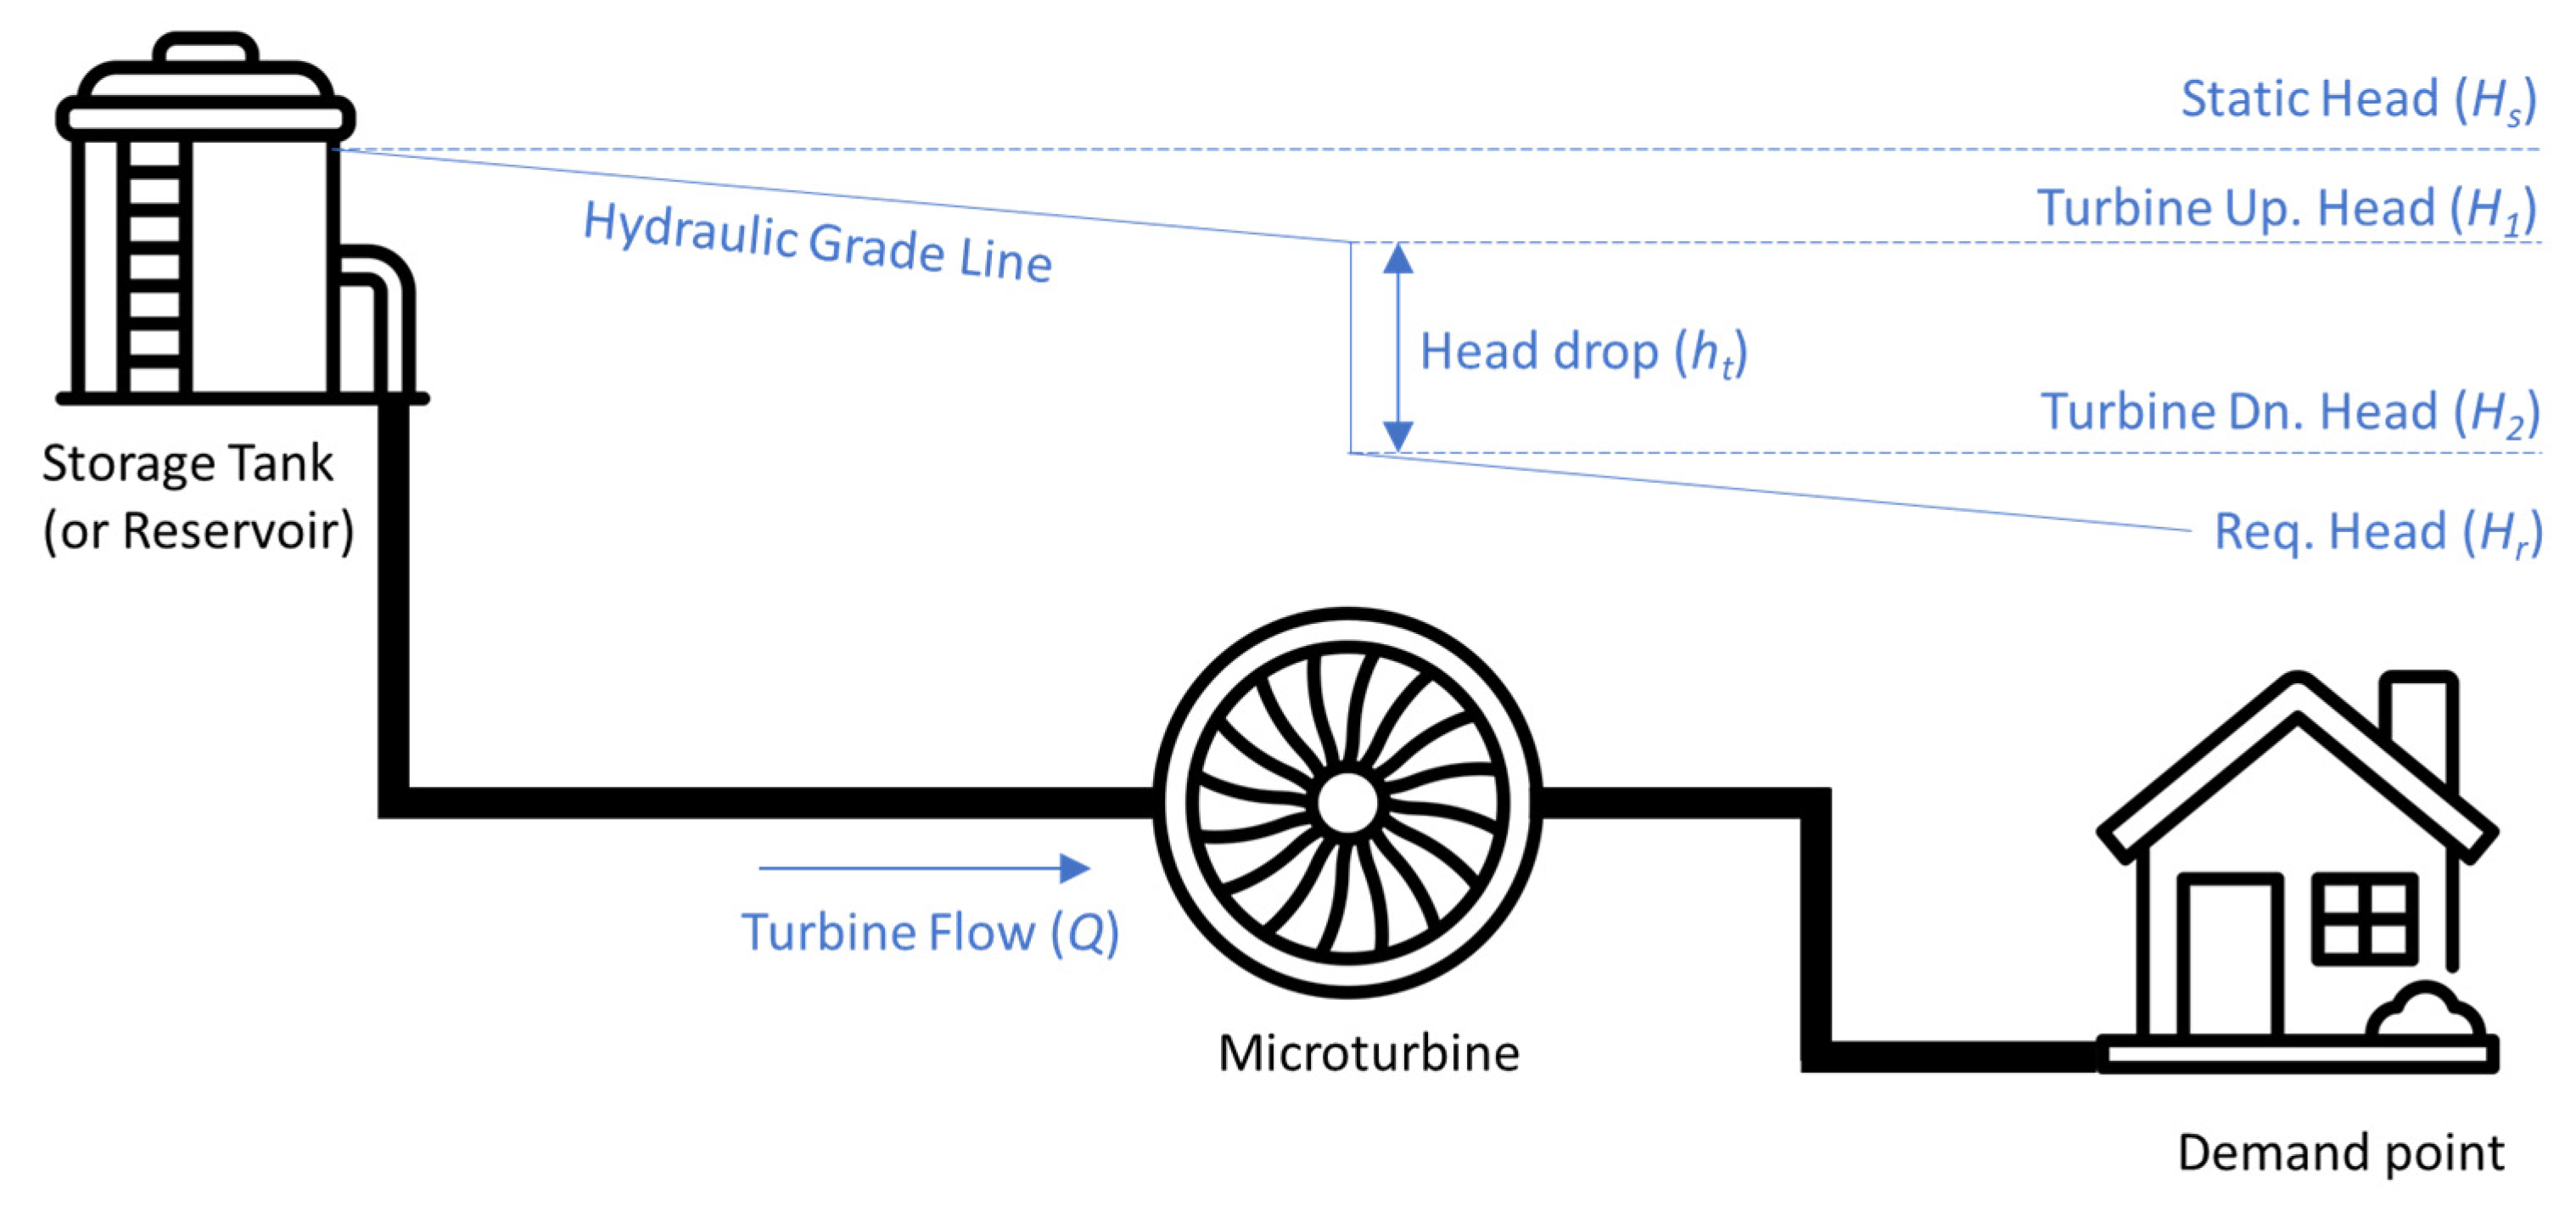
Figure 1 schematically illustrates the application of a microturbine in a water distribution pipeline and the corresponding head variation across the turbine. As water flows from an upstream storage tank or reservoir toward downstream demand points, excess pressure is often dissipated to meet required service pressure conditions. When a microturbine is installed in place of, or in parallel with, a pressure regulating device, part of this excess head can be recovered as useful energy without compromising downstream pressure requirements.
The recoverable power generated by a microturbine can be expressed as a function of the flow rate and the available head drop across the turbine. As shown in Figure 1, the power output P is calculated using Equation (1):
P = ηγQht = ηγQ(H1H2),
where η denotes the overall efficiency of the turbine–generator system, γ is the specific weight of water (9.81 kN/m3), Q is the flow rate through the turbine (m3/s), and H1 and H2 represent the upstream and downstream hydraulic heads of the turbine (m), respectively. Equation (1) indicates that the recoverable power increases linearly with both flow rate and head difference, highlighting the importance of identifying locations where stable flow and significant pressure drops coexist.
Although the energy recovery potential can be described using the relatively simple relationship given in Equation (1), practical implementation in real water distribution systems requires careful consideration of several hydraulic and operational factors. The flow rate through a turbine varies over time due to short-term demand fluctuations and long-term changes in water consumption patterns. Upstream hydraulic head is influenced by reservoir or tank water levels, pump operating conditions, and pipeline characteristics such as diameter and friction losses. Downstream head, in contrast, is constrained by required service pressure and local elevation at demand points. As a result, ensuring both hydraulic reliability and economic feasibility of microturbine installations necessitates a system-wide and quantitative understanding of network behavior. In complex urban environments, where transmission and distribution pipelines are intricately interconnected, such analysis cannot be achieved through local inspection alone.
Digital twin–based hydraulic modeling provides an effective means to capture the integrated characteristics of water distribution systems and to identify optimal locations for microturbine deployment. Several studies have highlighted the importance of modeling approaches in evaluating energy recovery potential. Demand-driven analysis (DDA) may overestimate recoverable energy by neglecting pressure-dependent demand behavior, whereas pressure-driven analysis (PDA) provides a more realistic representation of network performance under varying pressure conditions [3,7,9]. Furthermore, extended period simulations (EPS) over 24 h or longer horizons are widely recommended to capture diurnal variations in flow and pressure, which strongly influence energy recovery feasibility and device performance.

2.3. Location, Sizing, and Control Strategies

Identifying suitable locations for microturbine installation is a critical step in energy recovery planning. Most studies adopt a screening approach based on PRV locations, where excess pressure is already dissipated during normal operation. Candidate sites are commonly ranked using indicators such as the product of flow rate and head loss, which provides a first-order estimate of recoverable energy potential [2,13,16]. There are also advancements shifted towards multi-objective optimization approaches. Fecarotta and McNabola [17] and Fernández García and McNabola [6] proposed methodologies to optimize both the location and number of turbines to simultaneously recover energy and reduce leakage in gravity-fed networks.
Beyond site selection, appropriate sizing and control strategies are essential for stable and efficient operation. Previous research has explored fixed-speed and variable-speed turbine configurations, as well as bypass and parallel layouts that allow conventional PRVs to operate in conjunction with energy recovery devices [7,8,12]. Variable-speed operation, in particular, has been shown to improve adaptability to fluctuating hydraulic conditions, albeit at increased system complexity and cost [1,18].
A recurring challenge highlighted in the literature is the uncertainty associated with turbine performance curves, especially for PATs operated outside their design conditions. This uncertainty complicates device selection and motivates the development of computer-assisted selection and optimization tools that integrate hydraulic simulation with equipment databases [15,18]. More sophisticated tools have recently emerged to address the complexity of WSS. Marini et al. [8] developed the HYPER tool for computer-assisted PAT selection, while Bideris-Davos and Vovos [16] introduced a techno-economic design algorithm that optimizes the placement of pressure-regulating turbines in large-scale systems.

2.4. Techno-Economic Feasibility and Implementation Considerations

Techno-economic feasibility is a central theme in recent energy recovery studies. While hydraulic potential may be significant, economic viability depends on capital expenditure, operation and maintenance costs, equipment lifetime, and local energy prices. Commonly used evaluation metrics include payback period (PBP), net present value (NPV), and levelized cost of energy (LCOE) [6,13,16]. Several studies emphasize that energy recovery should be evaluated not only in terms of direct electricity generation but also in relation to indirect benefits. Replacing or supplementing PRVs with energy recovery devices can contribute to improved pressure management, potentially reducing leakage rates and pipe failure risks [7,19]. These secondary benefits, while difficult to quantify, can significantly influence overall project feasibility.
However, technical feasibility does not guarantee project success. Recent literature emphasizes the non-technical barriers to implementation, such as regulatory frameworks and stakeholder interests. Latifi et al. [10,11] pioneered the application of Stakeholder Analysis (SA) and Social Network Analysis (SNA) in this domain. Their work demonstrates that the optimal energy harvesting plan must consider not only hydraulic and economic factors but also the utilities and consensus of various stakeholders, including water companies, consumers, and power grid operators.
To provide an integrated overview of previous studies, Table 1 summarizes representative research on microturbine and pump-as-turbine (PAT) applications in water distribution systems. The table compares key aspects of existing studies, including application context, hydraulic conditions, modeling approaches, and evaluation criteria. This summary highlights both the diversity of methodological approaches and the common assumptions underlying energy recovery assessments, and it serves as a reference framework for positioning the present case study within the broader literature.
Generative AI (ChatGPT, GPT-5 based model) was used solely for English grammar checking and language refinement. No AI tools were used for data analysis, interpretation of results, or scientific content generation.

3. Case Study: Busan Water Distribution System and Methodology

3.1. Overview of Busan Water Distribution System

The Busan Metropolitan City operates a large-scale and complex water distribution system serving approximately 3.37 million residents, with a water supply coverage of 100%. The average daily water production is approximately 1.085 million m3/day, of which about 1.015 million m3/day is supplied for domestic use—including domestic, public, commercial, and small-business consumption—and 70,000 m3/day for industrial use. The average per capita daily water consumption is approximately 322 L.
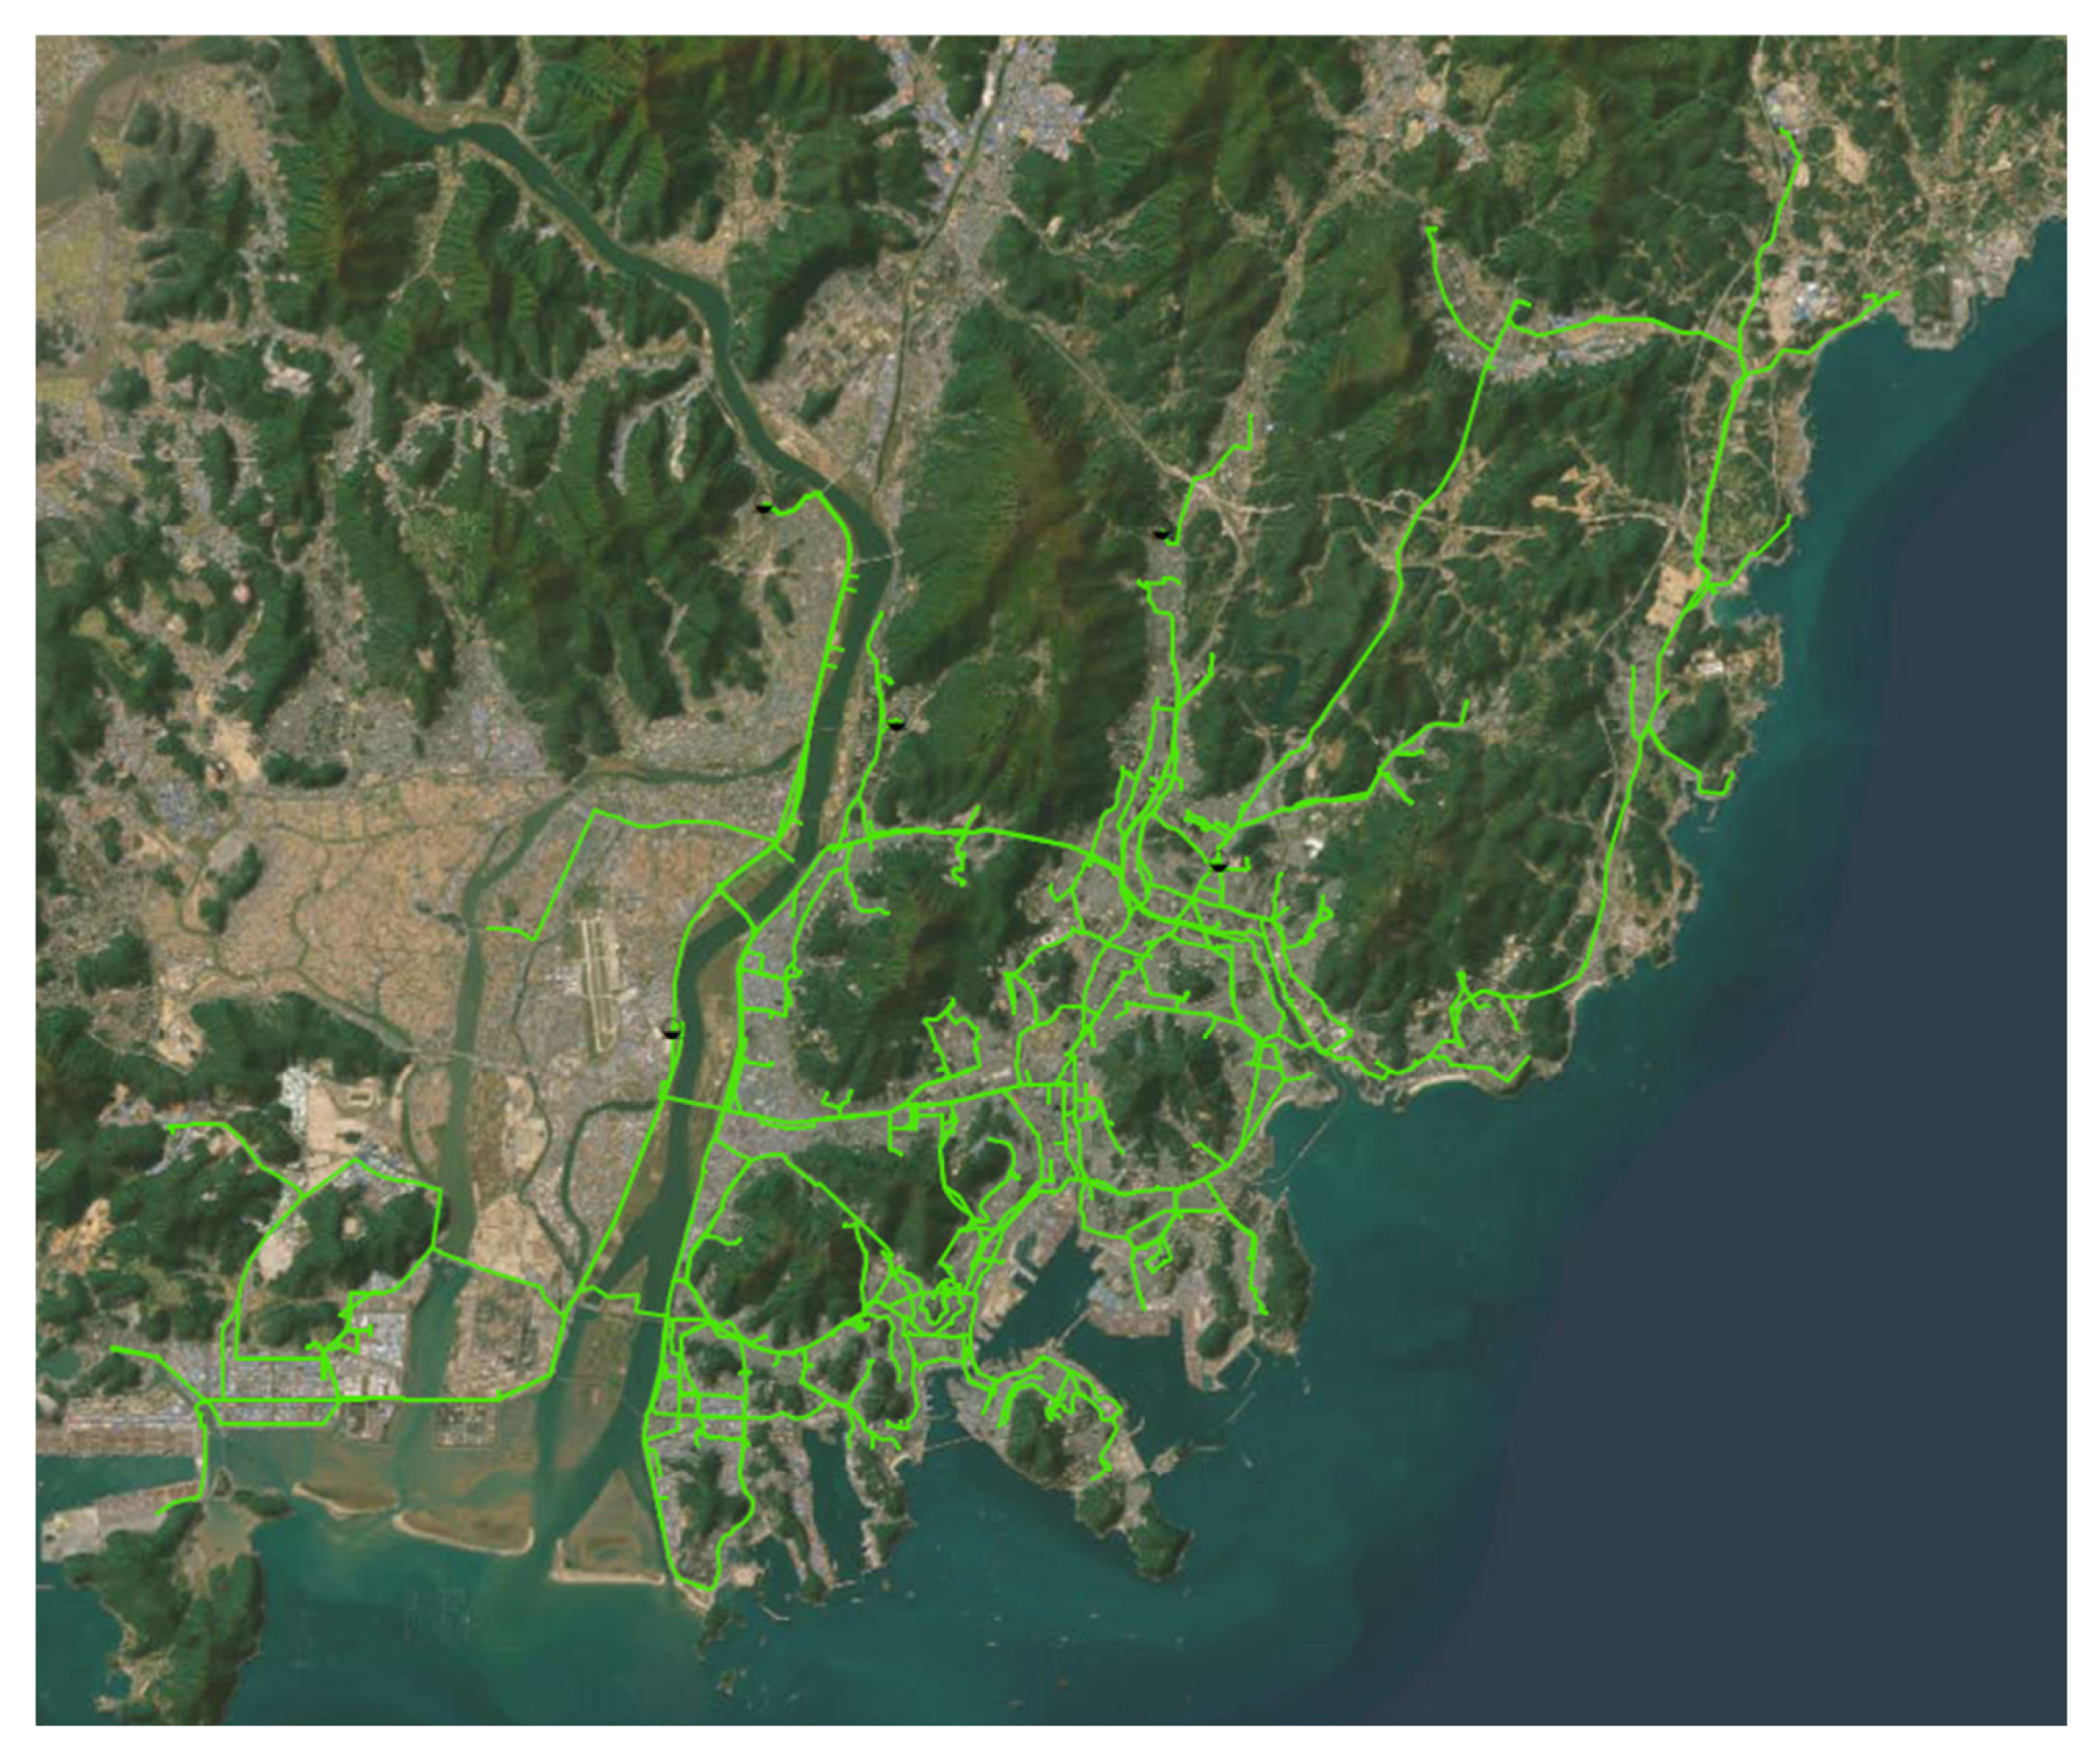
Busan’s water supply infrastructure consists of two water intake facilities with a combined capacity of 2.565 million m3/day and four water treatment plants with a total treatment capacity of 1.899 million m3/day. The system further includes 75 distribution reservoirs with a total storage volume of approximately 550,000 m3, 170 pumping stations and 630 pressure control facilities. The total length of water pipelines in Busan is approximately 8534 km, comprising 88 km of intake pipelines, 478 km of transmission pipelines, 3718 km of distribution mains, and 4250 km of service pipelines. Figure 2 presents the Busan water transmission system’s digital twin model.
As a coastal city with mountainous terrain, Busan exhibits significant elevation differences across its water distribution system, ranging from near sea level to approximately 194 m (Figure 3). These elevation variations inevitably result in large spatial differences in hydraulic head and pressure, creating favorable conditions for pressure dissipation and, consequently, opportunities for energy recovery using microturbines.
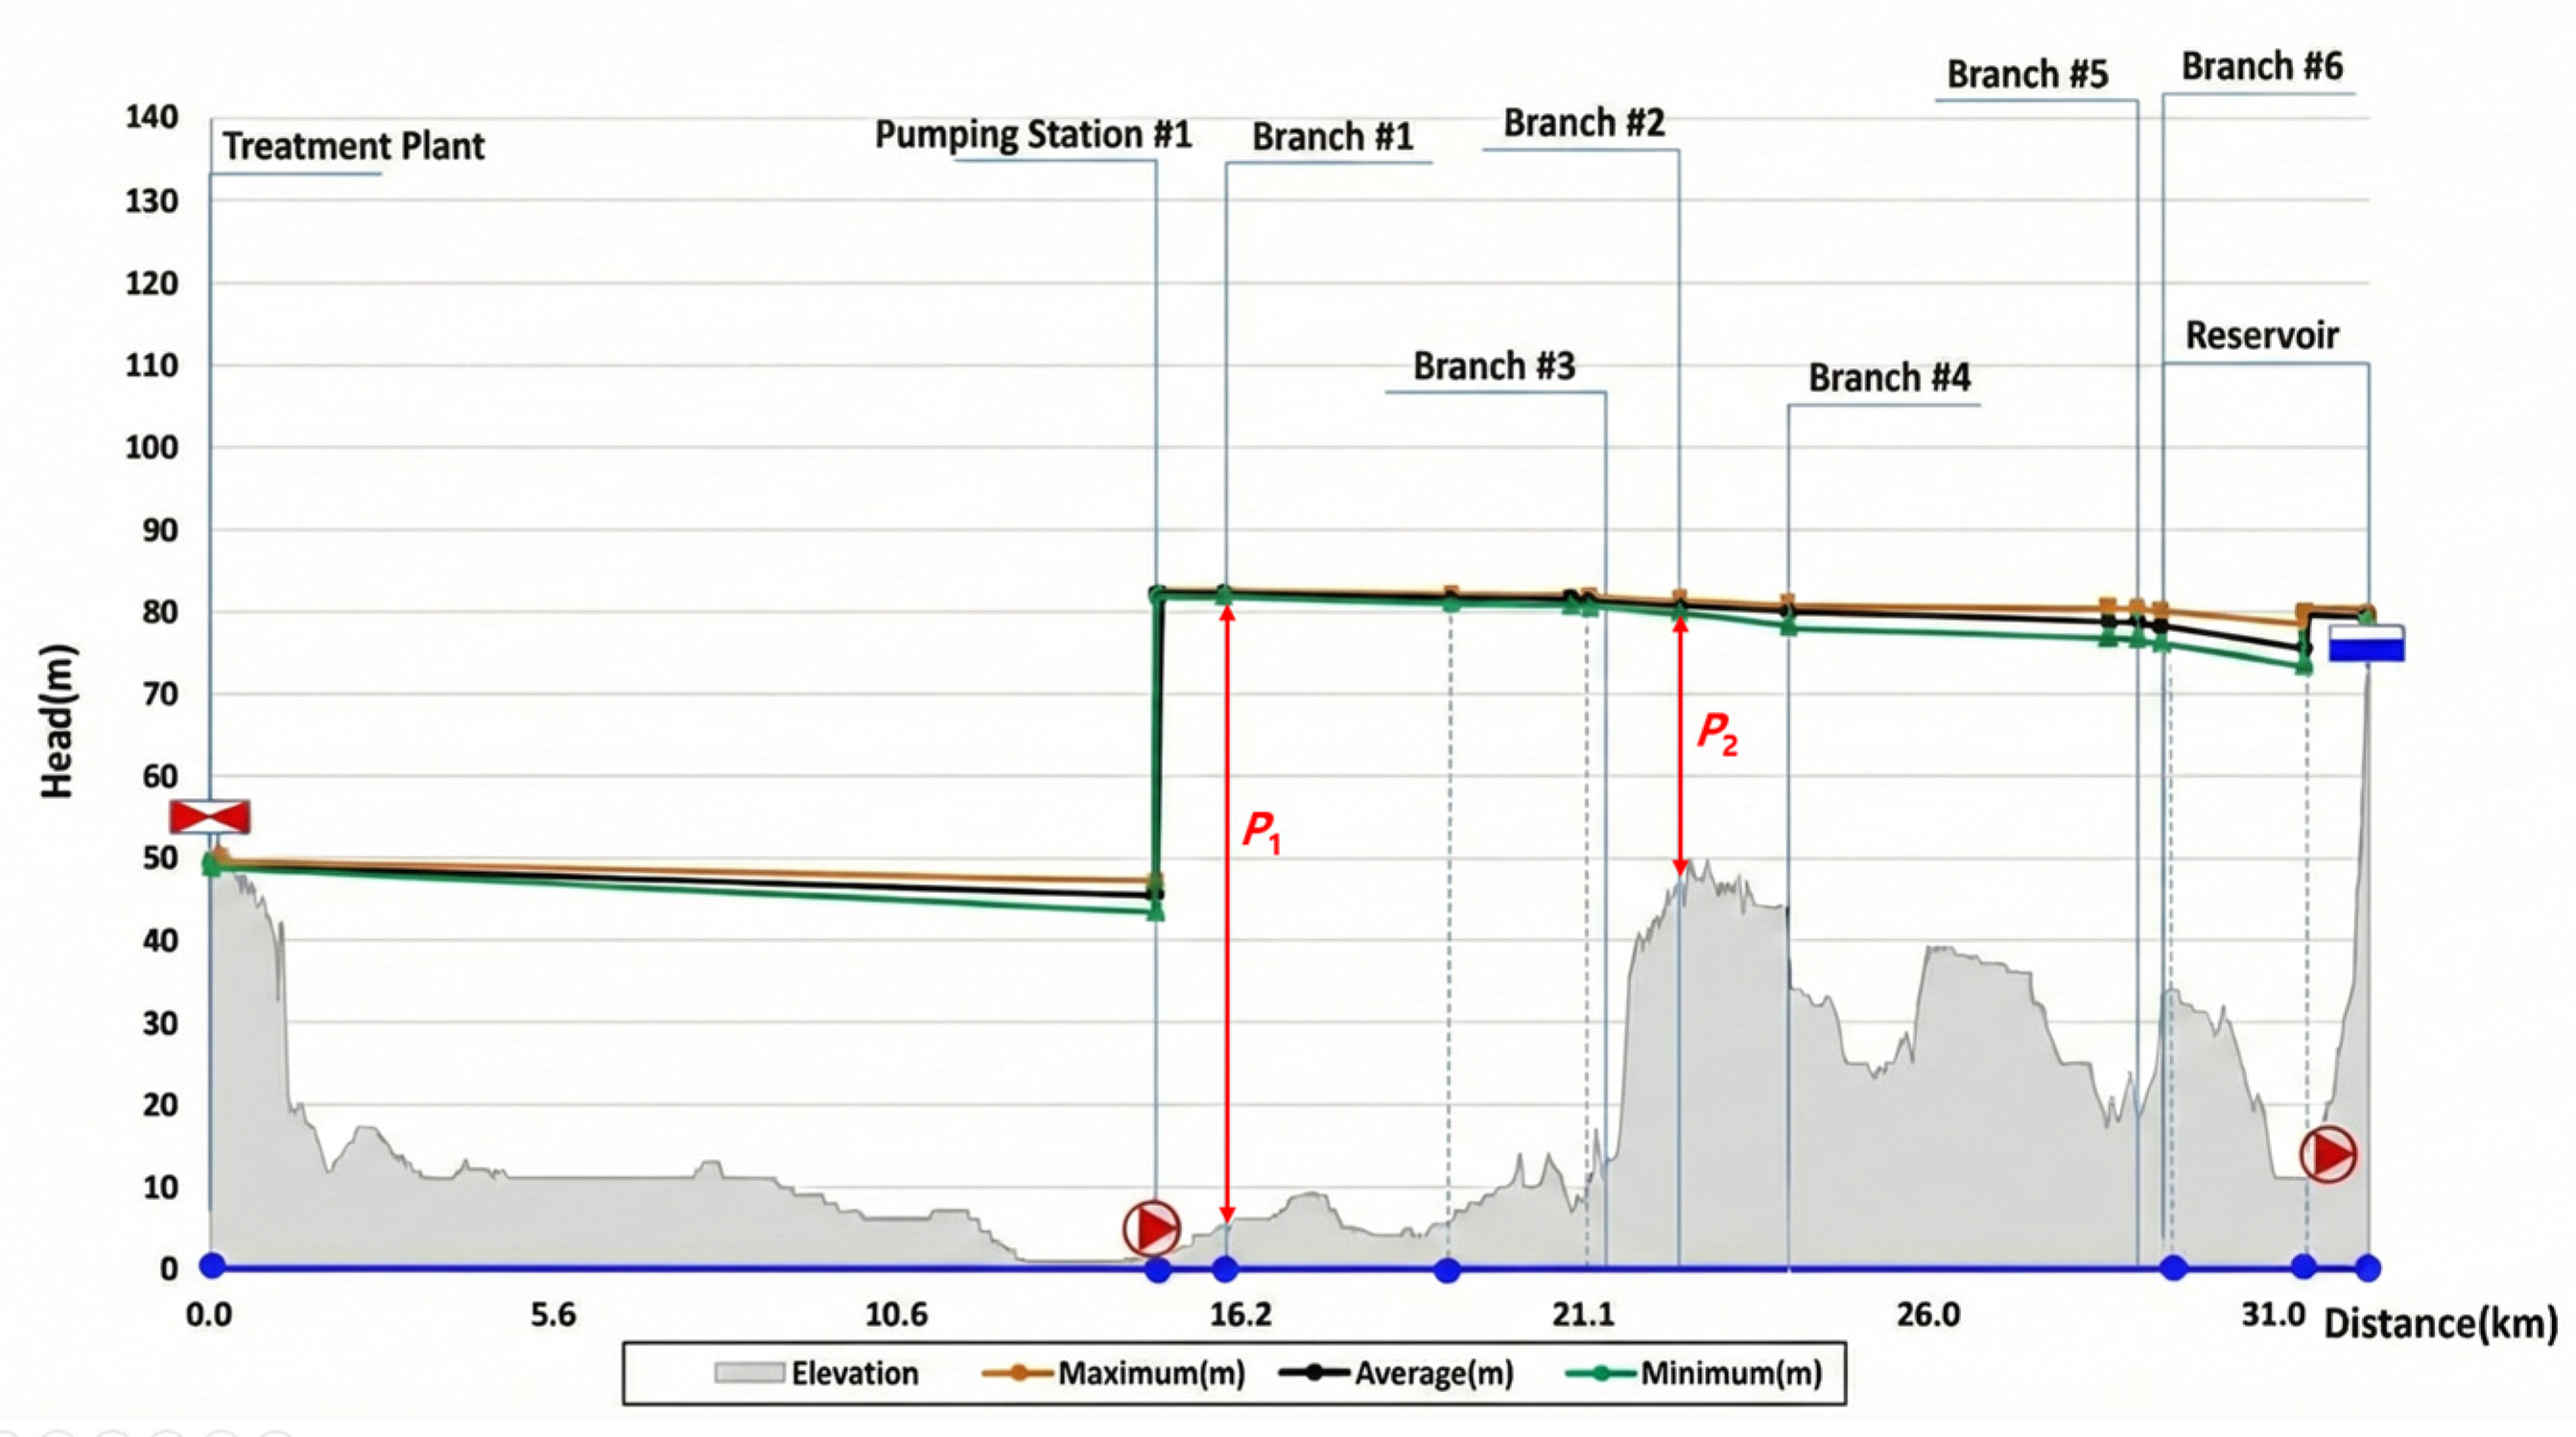
For instance, Figure 4 provides an example of the hydraulic grade line along a transmission pipeline. Due to the operational characteristics of transmission systems, the HGL generally maintains a relatively constant profile between pumping stations. However, pressures at nodes where transmission pipelines connect to downstream distribution networks vary significantly depending on local elevation. The pressure at point P1 is approximately 75 m, whereas the pressure at point P2 is approximately 30 m. The excess pressure at P1 is intentionally dissipated through a pressure-reducing valve to maintain appropriate pressure levels in the downstream distribution network. As a result, locations such as P1 exhibit substantially higher potential for energy recovery compared to locations like P2, where available pressure head is limited.

3.2. Digital Hydraulic Model Development

A digital hydraulic model of the Busan water distribution system was developed to quantitatively analyze system-wide hydraulic behavior and assess the feasibility of microturbine-based energy recovery. The digital model represents the major components of the water supply system, including transmission pipelines, distribution networks, reservoirs, pumping stations, and PRVs.
The digital twin was implemented using InfoWater Pro version 2026.1 (Autodesk), a hydraulic network modeling platform widely used for urban water distribution system analysis. The model integrates geographic information system (GIS) data, pipe attributes, elevation data, and operational information to reproduce the actual hydraulic conditions of the network. Simulation results were generated under representative operational conditions to capture spatial variations in hydraulic head, pressure, and flow rate throughout the system.
The model was calibrated at the macroscopic transmission-system level to ensure overall mass balance and consistency of the system-wide hydraulic grade lines. Calibration focused on reproducing overall pressure distribution and flow patterns across the network rather than detailed local calibration at individual nodes. To further ensure model reliability, the simulated hydraulic results were validated with operational data obtained from the supervisory control and data acquisition (SCADA) system at selected locations, particularly at PRV sites. This comparison confirmed that the digital twin model adequately represents the real-world hydraulic behavior of the Busan water distribution system.

3.3. Preliminary Economic Assessment

To evaluate the practical viability of microturbine installations at the identified high-potential PRV sites, a preliminary economic assessment was incorporated. The Payback Period (PBP) was selected as a straightforward economic indicator, calculated using the following equation:
P B P =   C C A P A X × P a v g E a n n u a l × C t a r i f f ,
where CCAPAX is the specific capital expenditure per unit of installed power (USD/kW), Pavg is the estimated average power output of the microturbine (kW), Eannual is the estimated annual electricity generation (kWh/year), and Ctariff is the industrial electricity tariff. For this analysis, an industrial electricity tariff (Ctariff) of 0.12 USD/kWh was applied, reflecting recent electricity pricing structures in South Korea. The CCAPAX heavily depends on economies of scale; based on recent micro-hydropower studies [15,16], installation costs generally range from 1000 to 3000 USD/kW. Consequently, a CCAPAX of 2000 USD/kW was assumed for larger installations (>20 kW), while 3000 USD/kW was applied to smaller-scale installations (<10 kW) to reflect these scaling dynamics.

4. Results: Energy Recovery Potential in the Busan Water Network

4.1. Hydraulic Characteristics of the Busan Water Distribution System

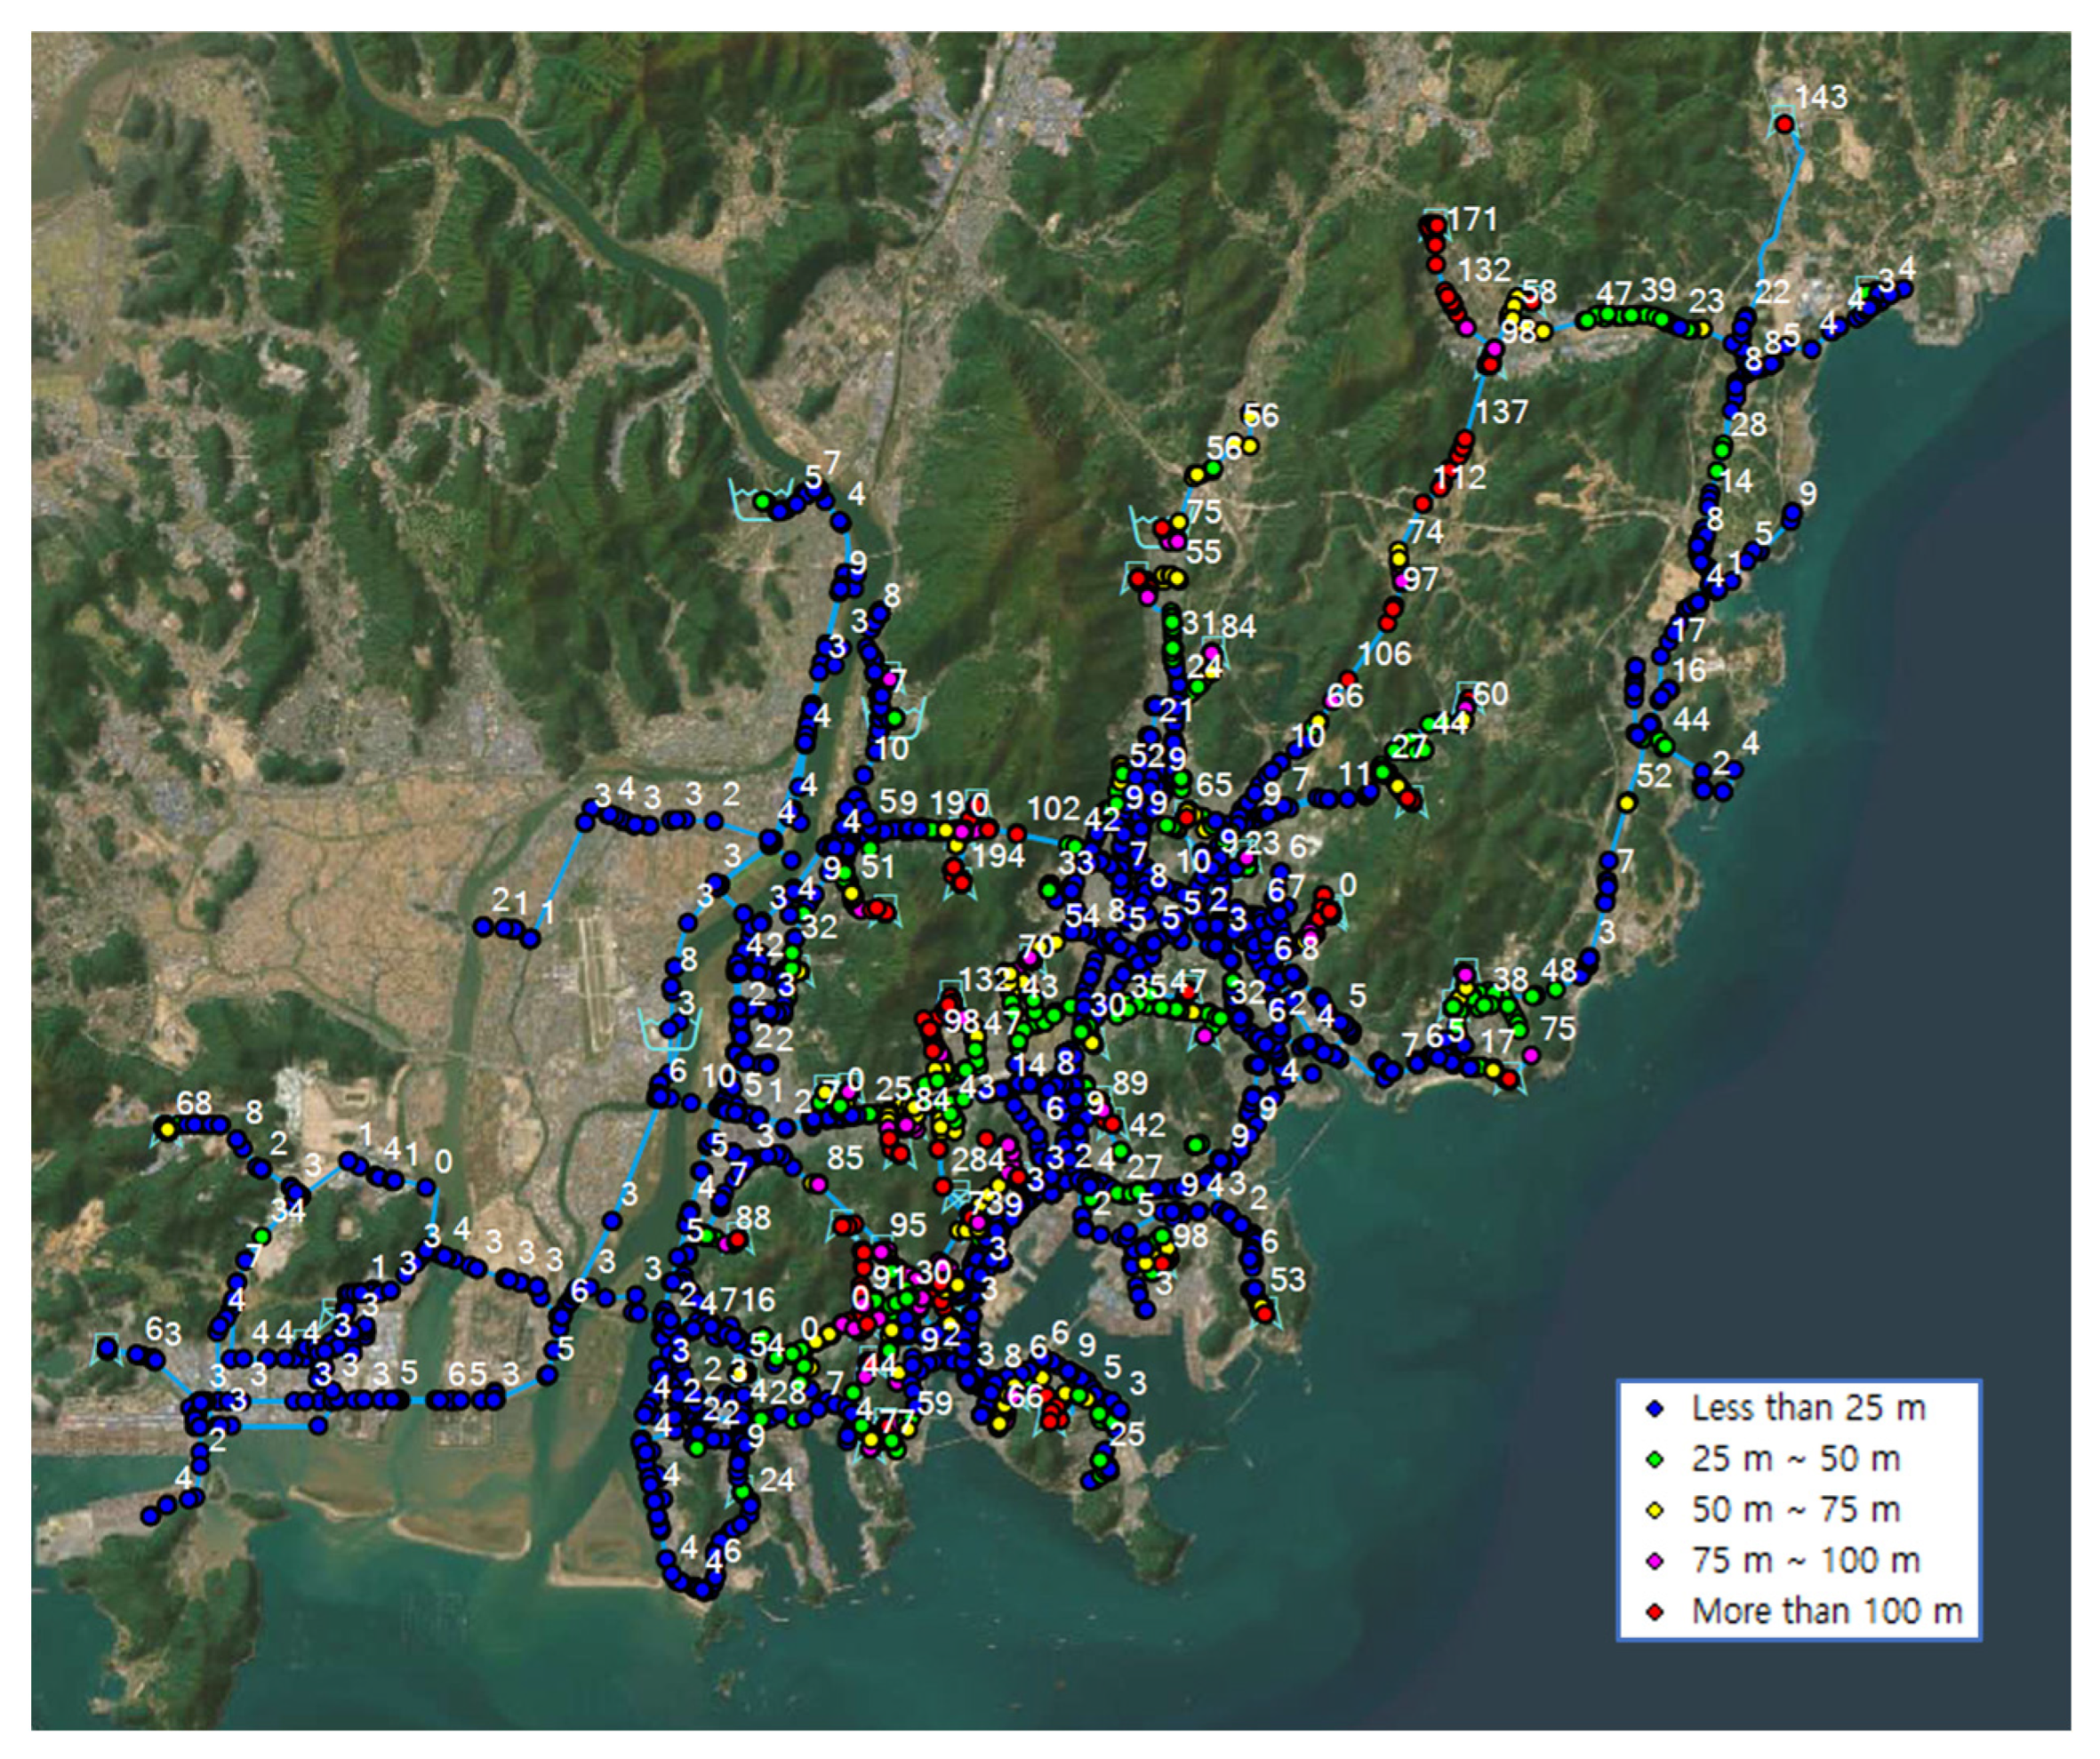
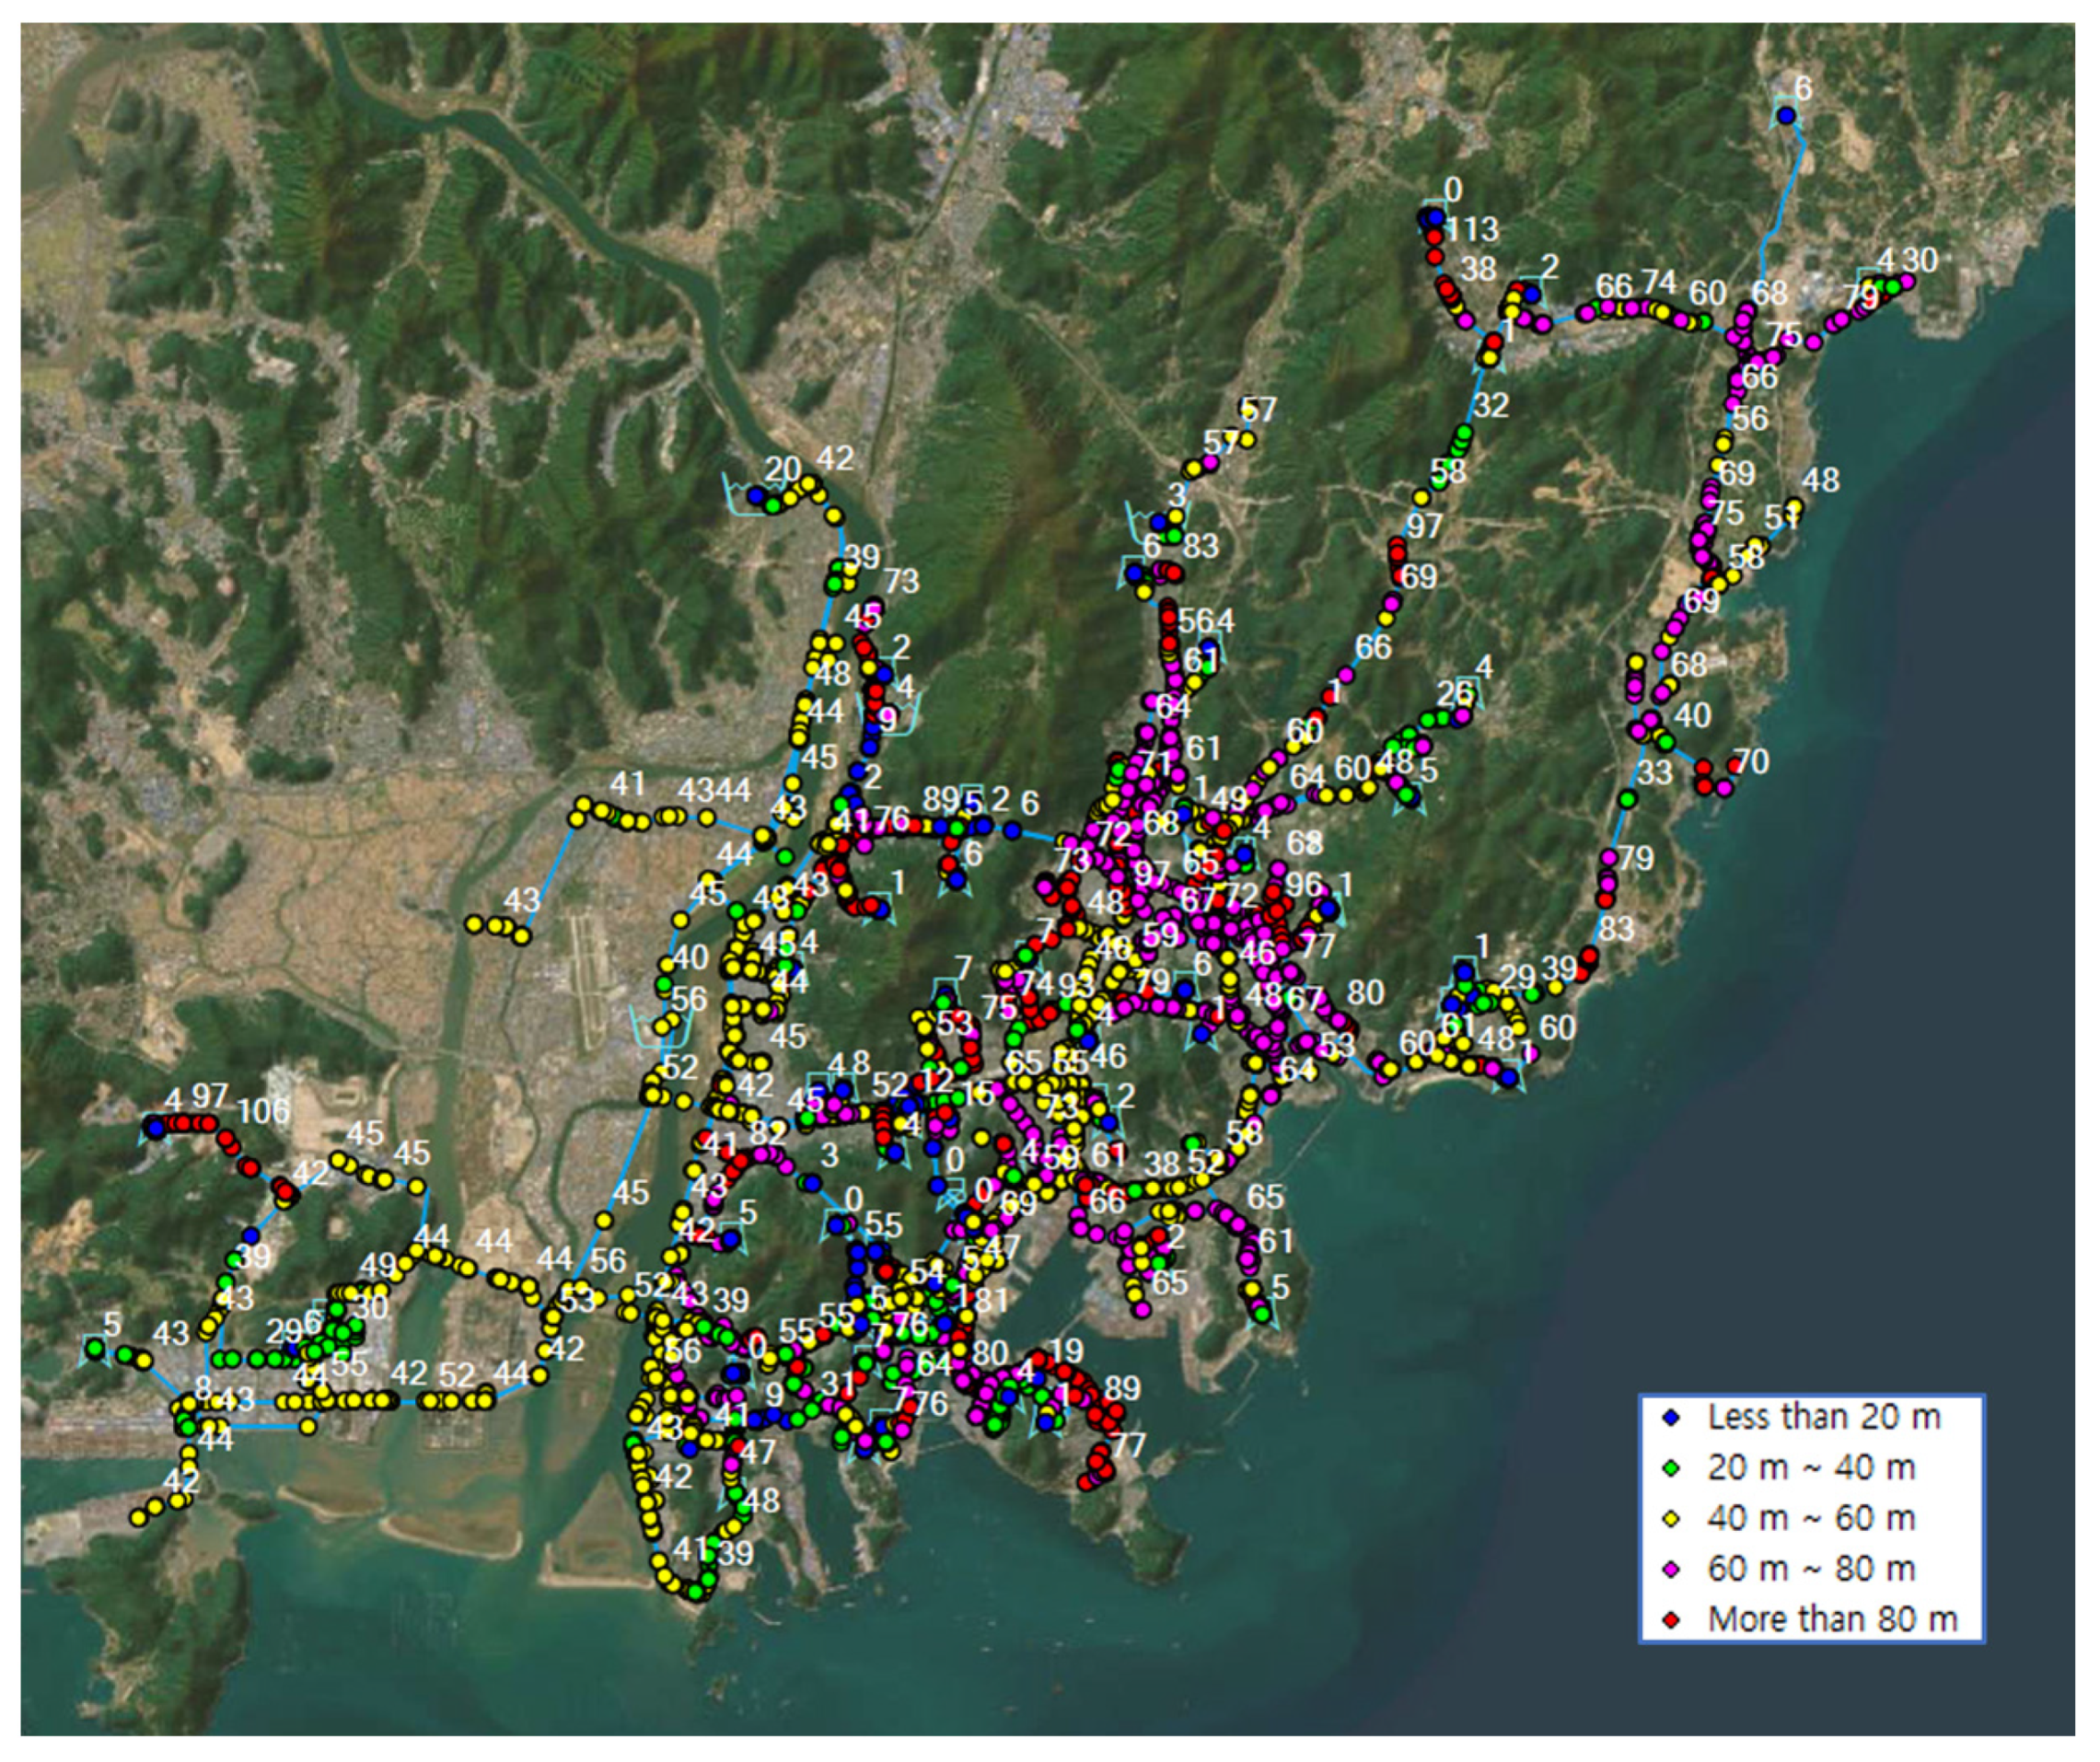
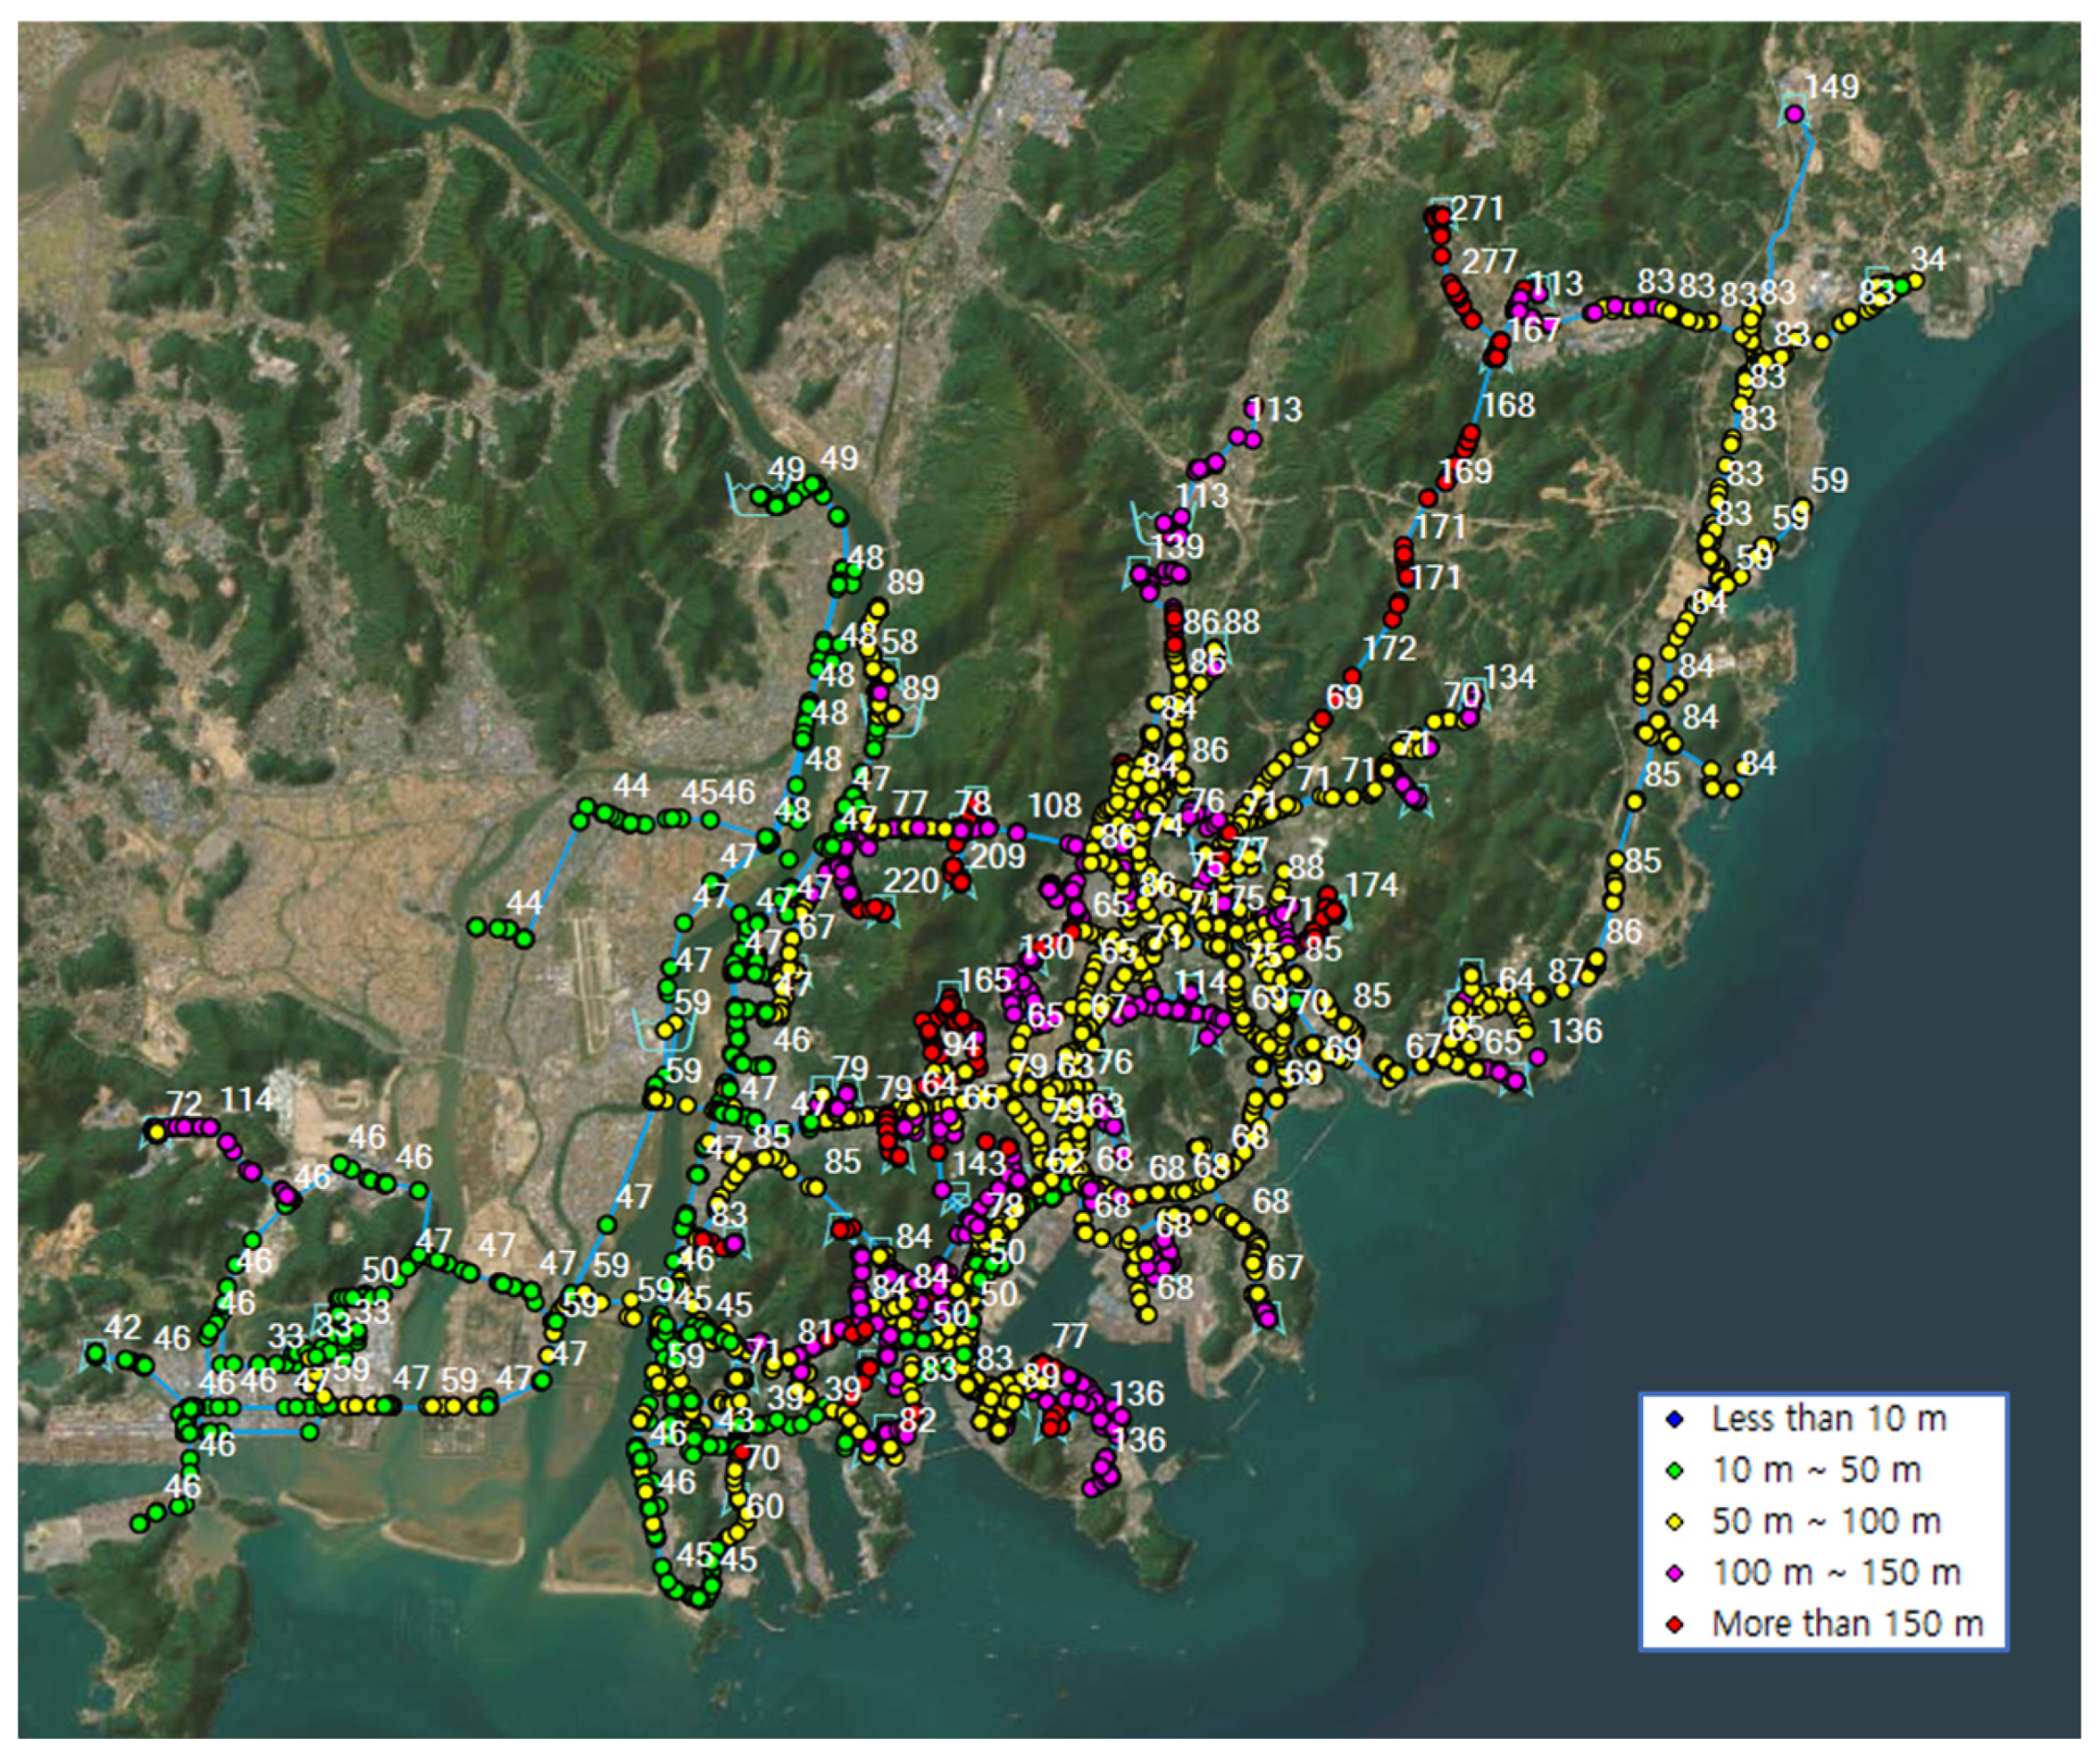
Figure 5 presents the spatial distribution of the HGL along the Busan water transmission network. The HGL varies significantly across the system, reflecting the combined influence of source elevations, pumping operations, and pressure regulation. Higher HGL values are predominantly observed in upstream and mountainous areas, whereas lower values are distributed toward downstream and coastal zones. The corresponding pressure distribution is shown in Figure 6. The results reveal a spatially varying pressure distribution across the transmission network, with pressure levels strongly correlated with both elevation and network configuration. High-pressure zones are mainly concentrated in upstream sections and at interfaces between transmission pipelines and downstream distribution areas. In contrast, reduced pressure levels are observed in downstream sections where pressure regulation is applied to maintain service constraints. The spatial variability in pressure highlights the presence of localized pressure drops, which are characteristic of pressure-managed urban water distribution systems.
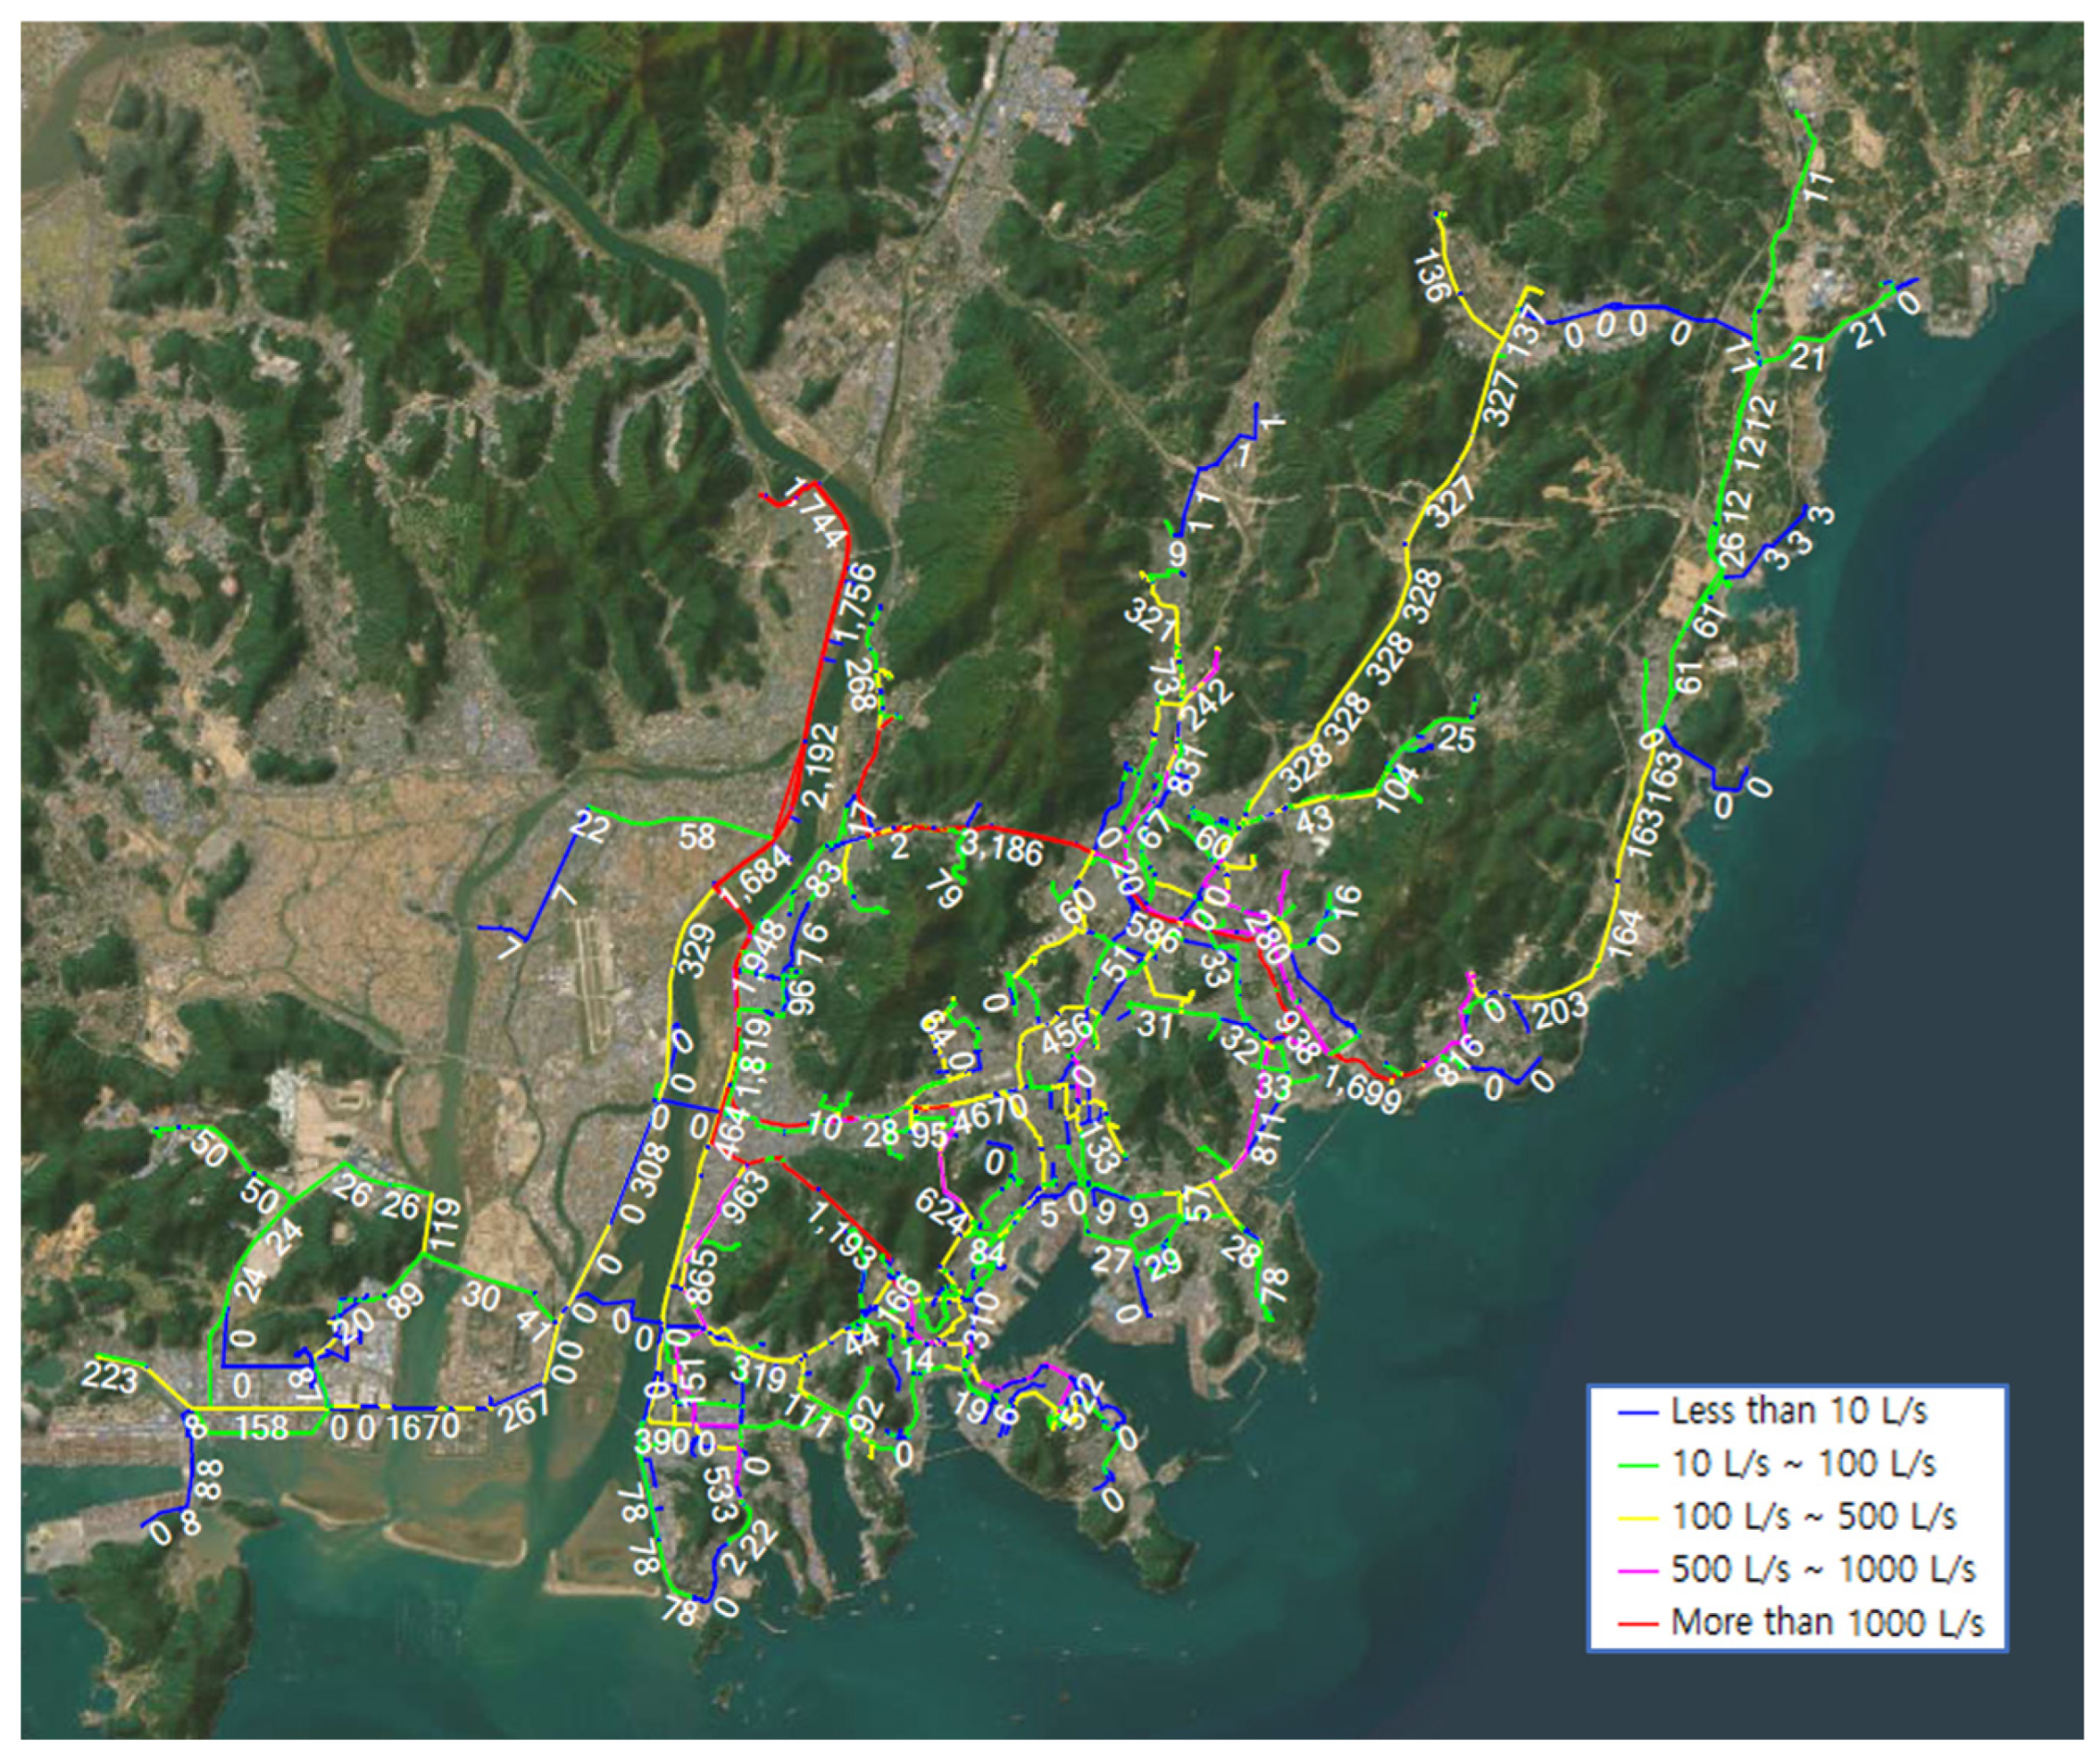
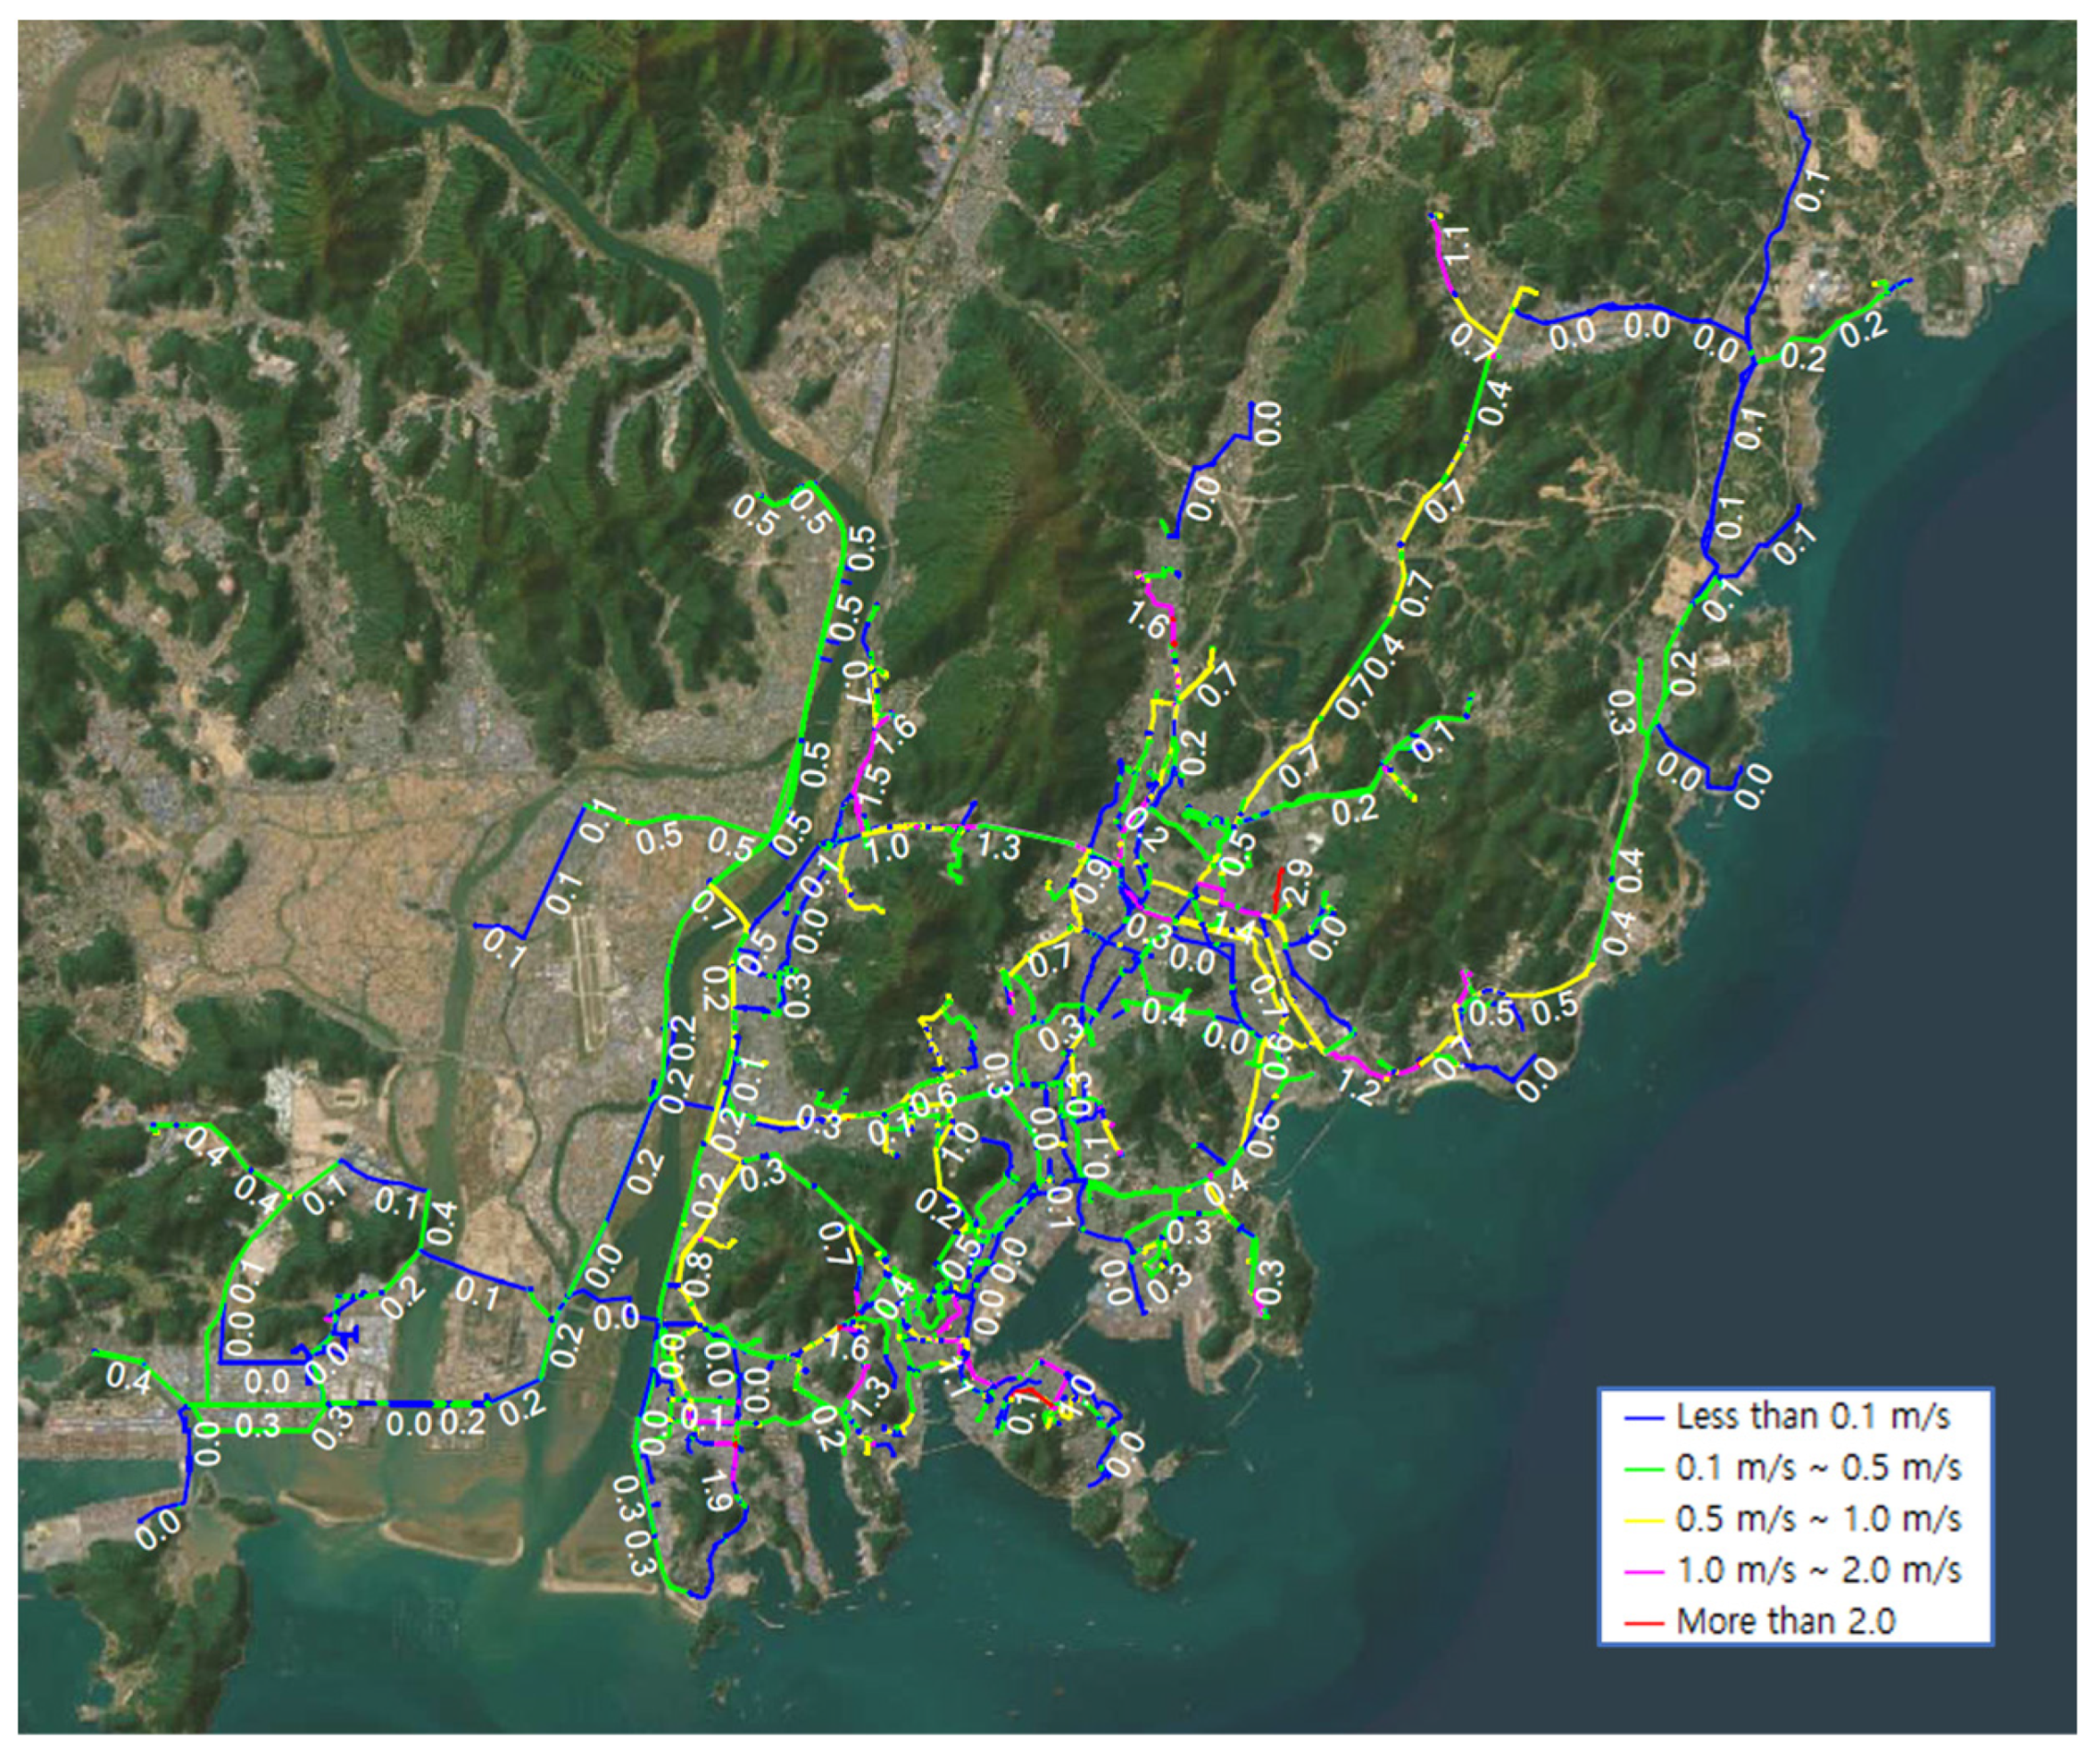
Figure 7 illustrates the spatial distribution of flow rates within the transmission network. High flow rates are primarily associated with main transmission pipelines conveying water from treatment facilities and reservoirs toward demand centers. These high-flow corridors form the backbone of the system, while lower flow rates are observed in peripheral and branching sections of the network. The results demonstrate that flow magnitude is unevenly distributed spatially, with a limited number of pipelines carrying a substantial portion of the total system flow. The velocity distribution shown in Figure 8 further reflects the combined effects of flow rate and pipeline geometry. Higher velocities are observed along major transmission routes, whereas lower velocities dominate in secondary and peripheral pipelines.
Taken together, Figure 5, Figure 6, Figure 7 and Figure 8 demonstrate that hydraulic head, pressure, flow rate, and velocity are unevenly distributed across the Busan water transmission network. These spatial patterns provide a fundamental basis for identifying locations where significant hydraulic head coincides with sufficient flow, which is a prerequisite for assessing the potential for microturbine-based energy recovery in subsequent analyses.

4.2. Candidate Sites and Estimated Energy Recovery

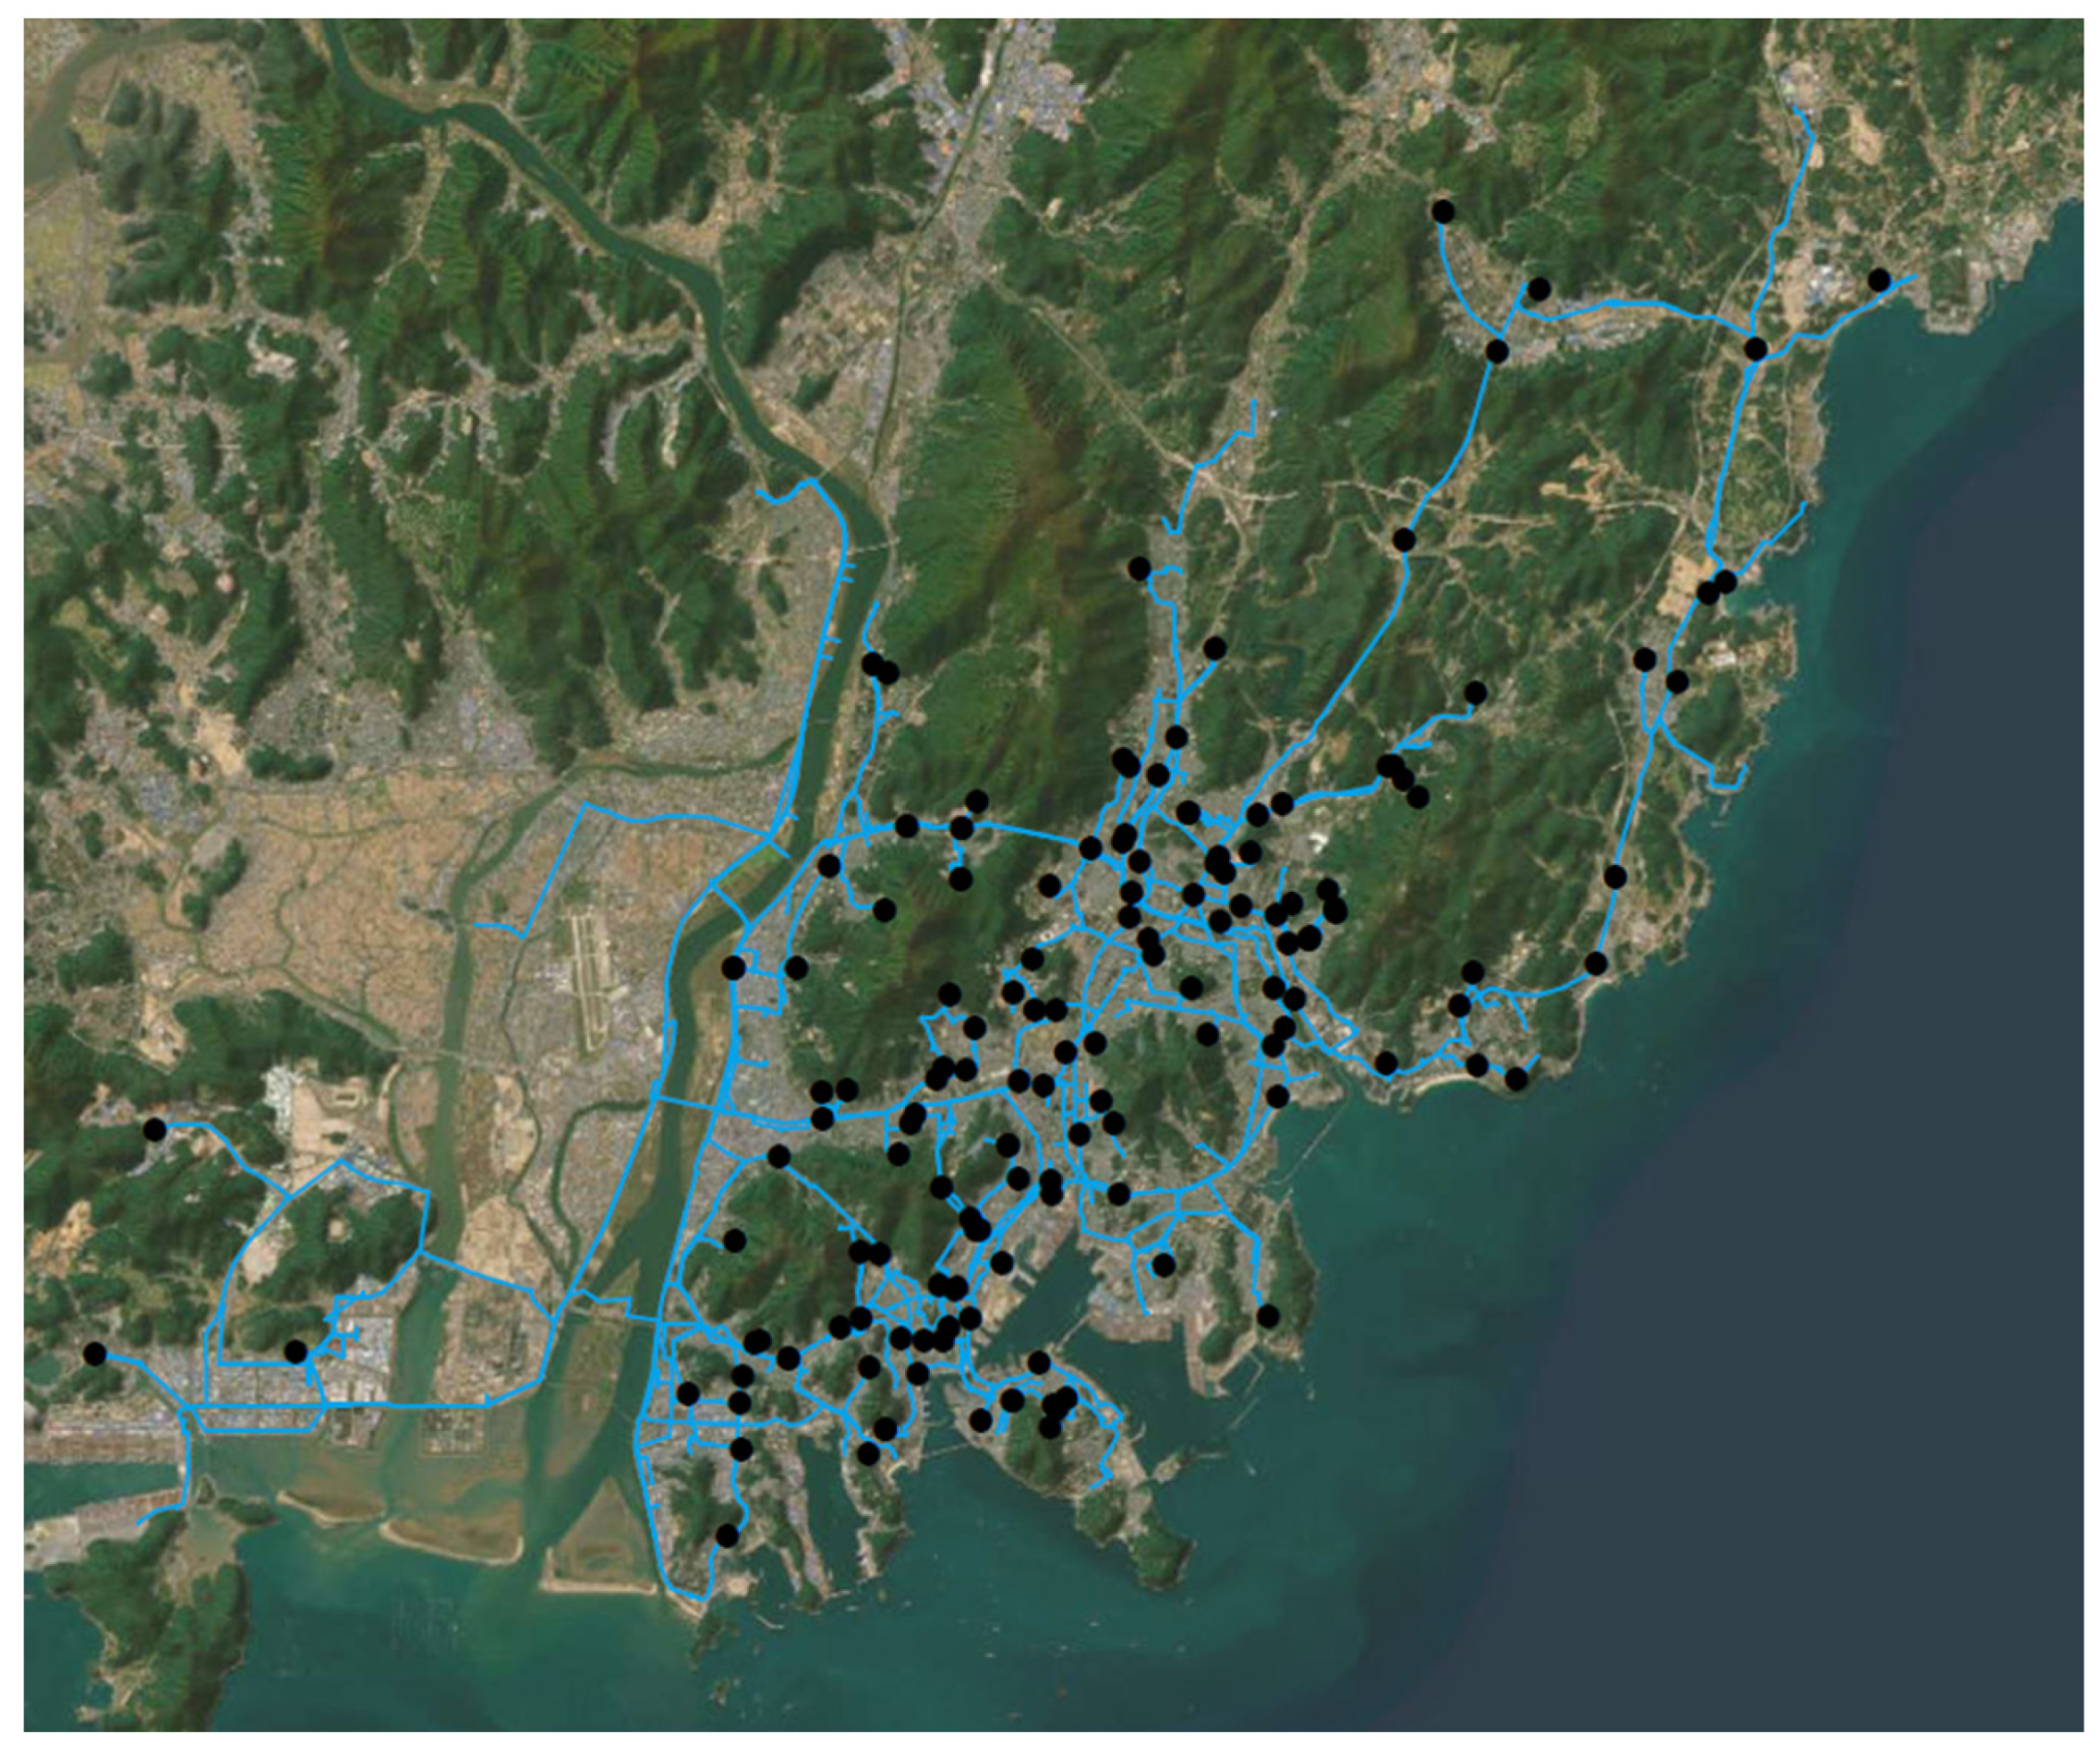
Based on the hydraulic conditions identified in Section 4.1, candidate locations for microturbine installation were selected at PRV sites where excess pressure is dissipated under normal operating conditions—routine system operation under typical water demand without emergency or abnormal operational events. Figure 9 shows the spatial distribution of PRVs within the Busan water distribution system. Candidate sites were initially screened using digital twin (DT) simulation results by evaluating the product of flow rate and head loss across each PRV, which represents a primary indicator of recoverable hydraulic energy potential.
To verify the DT-based screening results under actual operating conditions, supervisory control and data acquisition (SCADA) data were incorporated. Table 2 presents a comparison between DT-based hydraulic results and SCADA-based energy recovery estimates for the top 20 PRV sites. The SCADA values represent average operating conditions during July and August 2022. Since SCADA inlet pressure data were unavailable, inlet pressure values from the DT model were used for power estimation, while flow rate and outlet pressure were based on SCADA measurements. The comparison indicates that although DT simulations capture the general spatial pattern of high-potential sites, differences arise due to discrepancies between modeled and observed hydraulic conditions.
Differences between the DT-based and SCADA-based estimates arise primarily from differences between modeled operating assumptions and real operational conditions. The DT model represents hydraulic conditions under representative planning scenarios, while the SCADA data reflect actual operational practices and control strategies within the network. In particular, PRV downstream pressure settings used in the hydraulic model are based on design setpoints, whereas SCADA observations indicate that operators may maintain higher downstream pressures to provide operational safety margins against sudden local demand fluctuations. This operational adjustment reduces the effective head drop across the valve and consequently lowers the recoverable power estimated from SCADA data. In addition, while the DT model distributes demand based on spatially allocated historical consumption patterns, SCADA measurements capture real-time hydraulic behavior influenced by dynamic demand and network control actions. Finally, inlet pressure measurements were not available in the SCADA system for the analyzed PRV locations; therefore, inlet pressures from the DT model were combined with SCADA flow rates and outlet pressures when estimating recoverable power. These factors collectively explain the differences observed between the DT and SCADA estimates.
For practical energy assessment, monthly and annual energy production values were calculated using SCADA-based hydraulic data. The maximum recoverable power at the most favorable site (Valve 2401) was approximately 24.3 kW under representative SCADA-derived operating conditions. Because the SCADA data correspond to operational conditions during July–August 2022, the potential annual variation in microturbine power output was estimated using the monthly variation in water demand. Based on the monthly water demand records for Busan, the demand factor relative to the annual average is approximately 1.0375 for the July–August period, with a minimum of 0.885 in March and a maximum of 1.080 in September. Assuming that recoverable power varies approximately proportionally with flow rate, seasonal changes in demand result in corresponding variations in power generation. For the most favorable site (Valve 2401), the estimated power output ranges from approximately 20.7 kW in the lowest-demand month to 25.3 kW in the highest-demand month, compared with the July–August baseline value of 24.3 kW. Similarly, for a representative microturbine corresponding to the average capacity of the top 20 candidate sites (baseline of approximately 7.0 kW during July–August), the estimated power output ranges between 6.0 kW and 7.3 kW over the year. While these estimates provide a reasonable approximation of seasonal operational variability, they are based on city-wide aggregated demand factors and may not fully capture localized hydraulic fluctuations at individual PRV nodes.
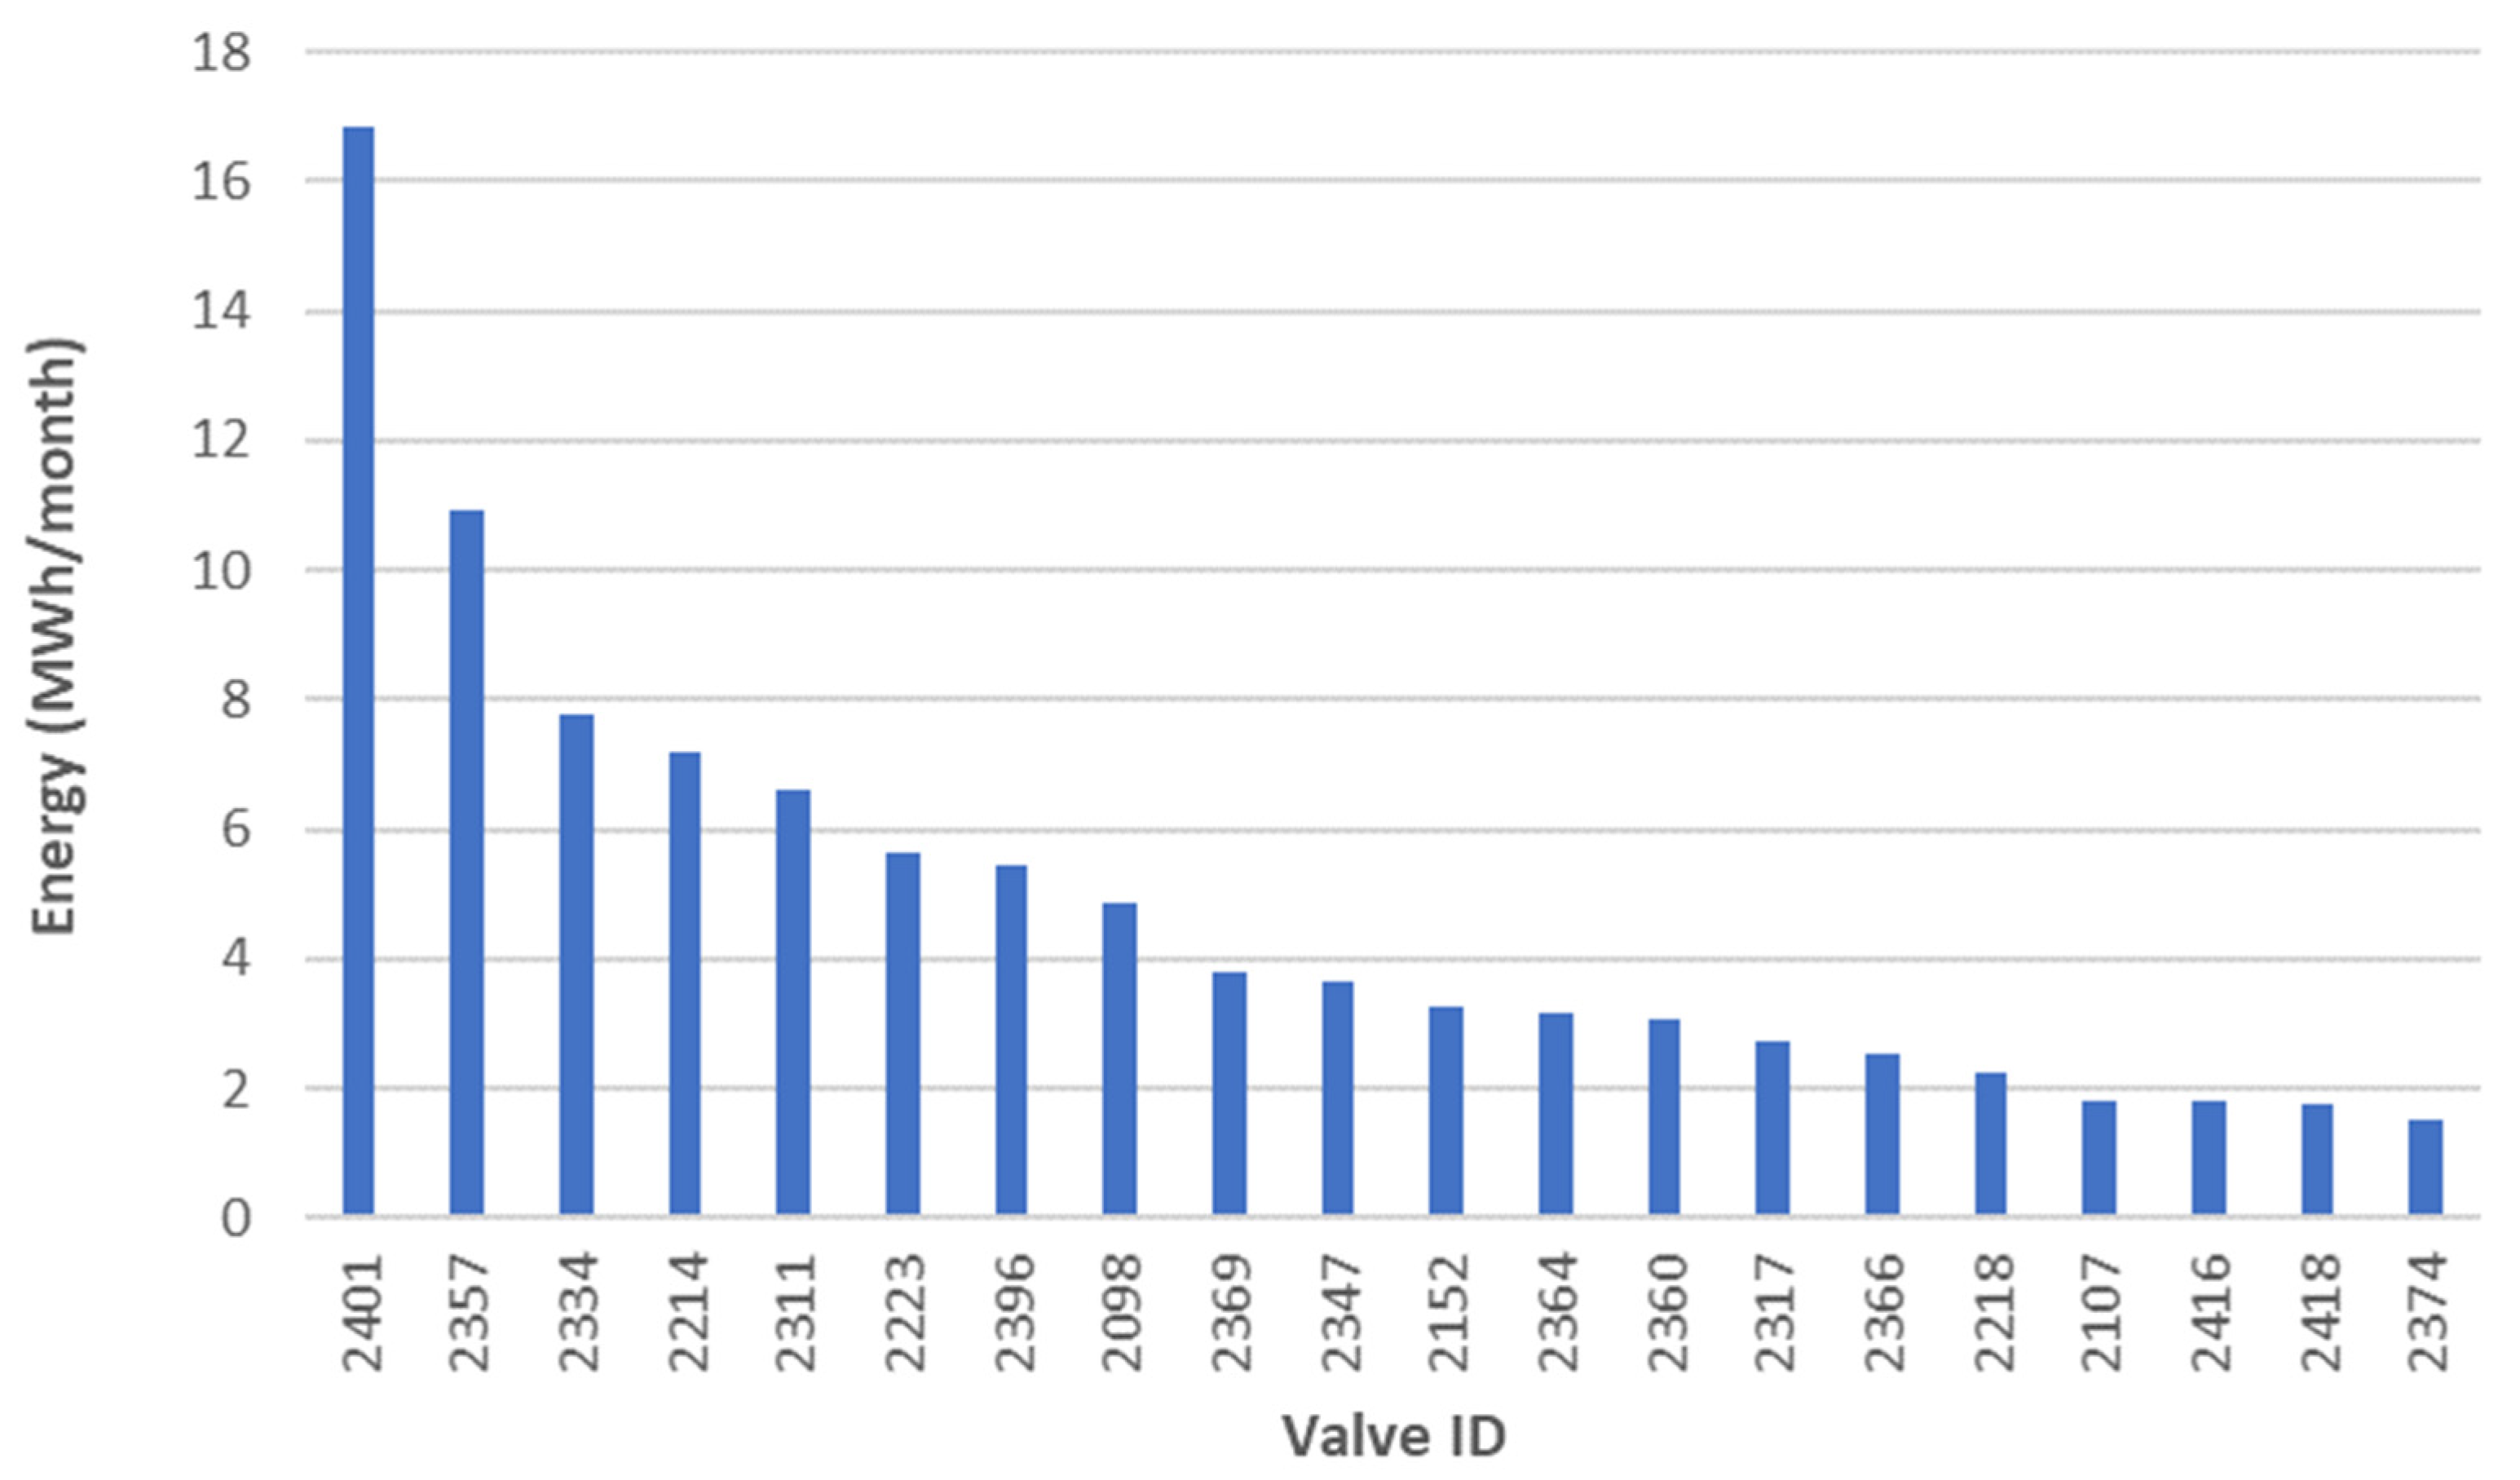
Figure 10 presents the ranking of the top 20 PRV sites based on recoverable monthly energy estimated from SCADA conditions. Assuming continuous operation, the estimated power generation at the most favorable site corresponds to approximately 16.9 MWh of monthly energy production and 205.0 MWh of annual energy production. For contextual comparison, based on an average household electricity consumption of 304 kWh per month for a four-person household in South Korea, this monthly production is equivalent to the electricity demand of approximately 55 households. The cumulative potential across multiple candidate sites indicates measurable opportunities for distributed energy recovery within the Busan water distribution system.
Although this study focuses on the top 20 PRV sites with the highest recoverable energy potential, the Busan water distribution system contains 630 pressure control facilities where excess pressure is dissipated. The screening process, therefore, prioritizes locations with the highest hydraulic energy potential. As discussed in Section 5, the economic feasibility of energy recovery is strongly influenced by the recoverable power capacity, and the highest-ranked sites show favorable payback characteristics compared to locations with smaller power potential.

4.3. Economic Evaluation of Candidate Sites

Utilizing the methodological framework described in Section 3.3, the PBP was estimated for two representative scenarios derived from the hydraulic analysis: Scenario A represents the most favorable candidate site (Valve 2401), and Scenario B represents an installation corresponding to the average capacity of the top 20 candidate sites.
For Scenario A, the estimated average power output is approximately 23.4 kW, yielding an annual electricity generation of roughly 205.1 MWh. Applying the larger-scale CCAPAX assumption (2000 USD/kW), the calculated PBP is approximately 1.9 years. For Scenario B, the representative average capacity is 6.7 kW with an estimated annual production of 58.8 MWh per site. Applying the smaller-scale CCAPAX assumption (3000 USD/kW), the calculated $PBP$ is approximately 2.9 years.

4.4. Field Investigations and Physical Constraints

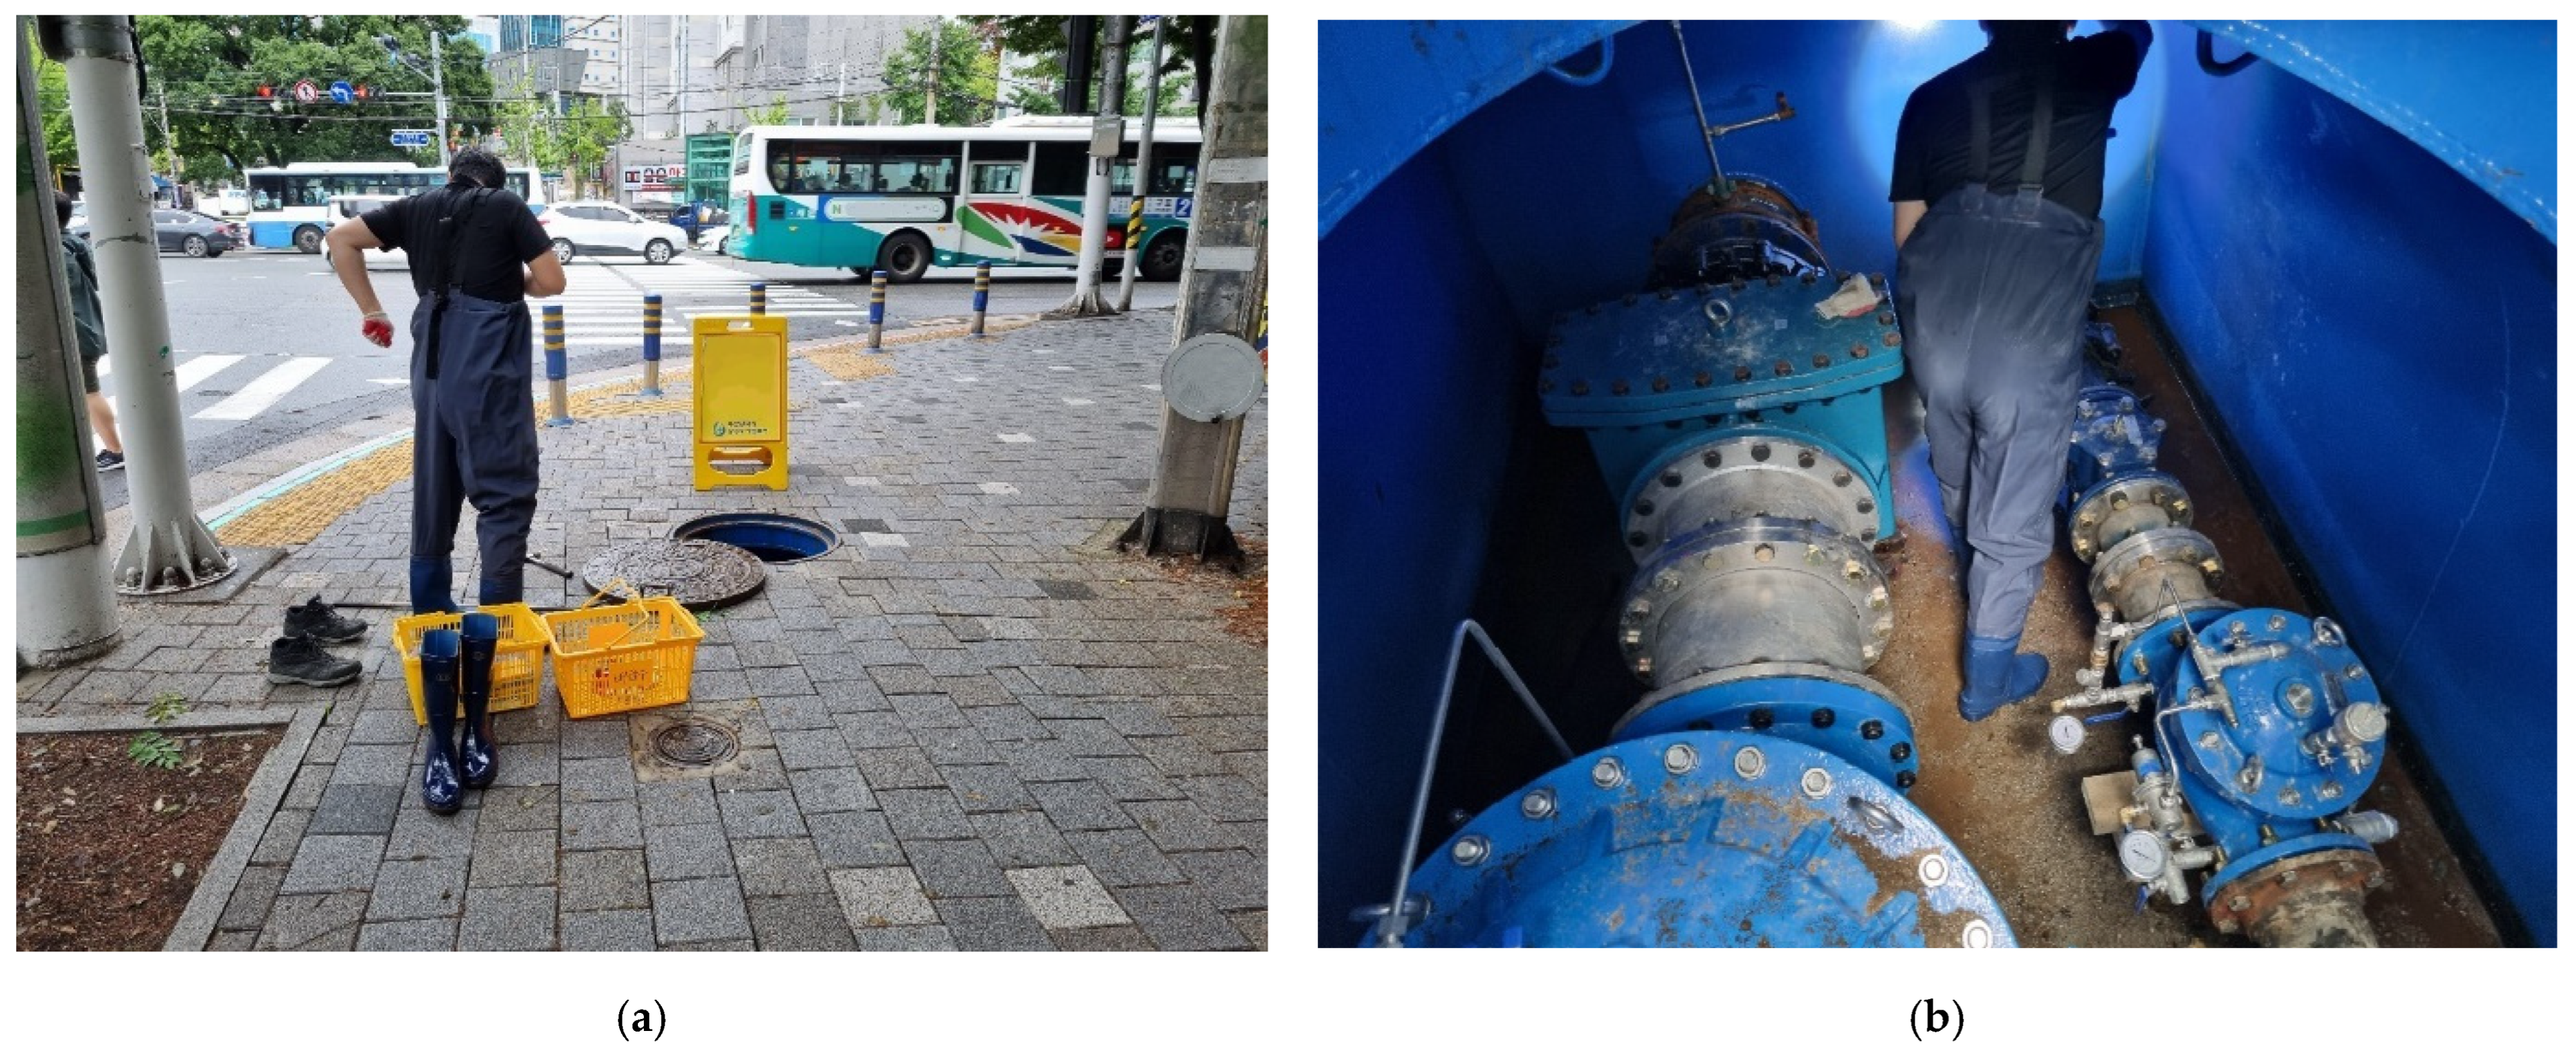
Beyond theoretical hydraulic and economic potential, practical installation is dictated by site-specific physical constraints. Field investigations conducted at the high-potential PRV locations revealed that existing underground valve chambers often provide highly restricted spatial footprints. As shown in Figure 11, the available space for introducing additional mechanical equipment alongside existing piping and PRVs is limited.

5. Discussion

The findings indicate that transmission networks characterized by significant elevation differences, such as the Busan system, inherently create favorable conditions for pressure-driven energy recovery. Excess pressure is systematically dissipated at PRV sites, particularly at interfaces between transmission and downstream distribution networks. At these locations, high flow rates coincide with substantial pressure differentials. These locations, therefore, represent technically viable points for integrating microturbines into existing pressure management infrastructure without compromising downstream service requirements. The digital twin framework adopted in this study plays a central role in enabling network-scale identification and prioritization of candidate sites. By integrating hydraulic simulations with operational SCADA data, the framework allows quantification of recoverable energy potential at individual PRV locations, thereby supporting data-driven infrastructure planning and reducing reliance on purely empirical field assessments.
It is important to contextualize the methodological contribution of this case study within the broader spectrum of advanced energy recovery frameworks. As discussed in Section 2, the current state-of-the-art includes sophisticated approaches such as multi-objective optimization [6,17], computer-assisted PAT selection tools such as HYPER [8], and stakeholder-based decision frameworks [10,11]. However, applying these computationally intensive approaches directly to a large-scale urban water distribution system such as the Busan network—comprising more than 8500 km of pipelines—can be impractical at the initial planning stage. Therefore, the digital twin framework and the screening indicator adopted in this study, based on the product of flow rate and head loss across PRVs, are intended to function as a macroscopic first-stage screening tool. By systematically narrowing thousands of potential locations to a prioritized shortlist of high-potential sites, this approach bridges the gap between raw operational data and detailed engineering analysis. The results of this screening provide the practical boundaries needed for the subsequent application of advanced optimization algorithms, turbine selection tools, and socio-economic stakeholder analyses during later project development stages.
Although this study refers to candidate locations for microturbine installation, the identified sites should more broadly be interpreted as locations with recoverable hydraulic energy potential. In practice, the selection between microturbines and pumps-as-turbines (PATs) depends on site-specific hydraulic conditions, operational flexibility requirements, and economic considerations. PATs are often attractive due to their lower capital cost and widespread availability of standard pump equipment. However, microturbines may offer advantages in terms of efficiency over wider operating ranges, improved control capability, and integration with pressure management infrastructure. Therefore, the digital twin framework developed in this study should be viewed as a screening tool for identifying energy recovery opportunities, while the final technology selection (PAT vs. microturbine) should be determined during the detailed engineering design stage.
The results of the preliminary economic assessment indicate the favorable economic feasibility of microturbine integration within the Busan water distribution network. The calculated Payback Periods ranging from 1.9 to 2.9 years indicate that retrofitting PRVs with energy recovery devices is not only hydraulically feasible but also represents a potentially attractive investment for water utilities. Because the economic feasibility of micro-hydropower is strongly influenced by economies of scale, the strategic prioritization of high-yield transmission nodes—as demonstrated by the digital twin screening—is essential to guarantee returns within acceptable municipal investment horizons.
However, capitalizing on this theoretical potential requires navigating strict physical and operational constraints. As detailed in the field investigations (Section 4.4), the confined environments of existing PRV chambers necessitate highly compact turbine configurations and modular designs. Furthermore, the integration of these turbines must not compromise the primary objective of the infrastructure: reliable pressure management. To achieve this in practical implementations, careful consideration of operational control strategies and system reliability is required. Previous studies have proposed several operational configurations, including fixed-speed turbine operation, variable-speed control systems, and bypass layouts that maintain conventional PRV functionality. In many water utilities, turbines installed at PRV locations are typically integrated with parallel bypass pressure control configurations. In this arrangement, the turbine is installed on a parallel branch while a conventional PRV or control valve remains available to maintain downstream pressure regulation when the turbine is not operating. If the turbine trips, undergoes maintenance, or operates outside its optimal hydraulic range, the bypass pressure control device automatically regulates downstream pressure to ensure an uninterrupted water supply. Variable-speed turbine systems can provide greater operational flexibility under fluctuating flow conditions, while fixed-speed configurations may be suitable for locations with relatively stable hydraulic regimes. The transition between turbine operation and bypass pressure regulation is typically managed through automated control systems integrated with the SCADA platform. Therefore, although this study focuses on identifying candidate locations for energy recovery, the final system design would require integration of appropriate control strategies to ensure reliable pressure regulation and stable water supply operations.
Several limitations should be acknowledged. Energy estimates were derived from steady-state hydraulic simulations under representative operating conditions, and diurnal variations in flow and pressure or long-term operational changes were not explicitly considered. Such variability may influence turbine performance, particularly for PATs operating outside nominal design ranges. Future studies should therefore integrate dynamic hydraulic simulations with computer-assisted turbine selection tools to address performance uncertainties under variable operating conditions. Furthermore, economic feasibility was assessed primarily from an energy recovery standpoint. Incorporating life-cycle cost analysis, long-term monitoring data, pilot-scale validation, and potential integration of energy storage systems (ESS) would enable more comprehensive evaluation of operational stability and economic performance.
In addition, the present digital twin framework evaluates hydraulic conditions at the network scale and does not explicitly simulate internal turbine flow phenomena such as cavitation or precessing vortex rope (PVR). In practical turbine implementation, these effects are typically addressed during the turbine design and selection phase using manufacturer performance curves, cavitation coefficients, or detailed computational fluid dynamics (CFD) analyses. Future research could integrate turbine performance models or CFD-based approaches with the digital twin framework to evaluate turbine stability and cavitation risk under variable operating conditions.
Beyond improving hydraulic efficiency, microturbine-based energy recovery can contribute to reducing greenhouse gas emissions by offsetting electricity that would otherwise be supplied from the power grid. Based on the estimated annual energy production of approximately 205 MWh for the most favorable site (Valve 2401), and using the average grid emission factor for electricity generation in South Korea (approximately 0.42 tCO2/MWh [22]), the corresponding avoided emissions are estimated to be approximately 86 tCO2 per year. For a representative turbine corresponding to the average capacity of the top 20 candidate sites (approximately 58.8 MWh/year), the avoided emissions are estimated to be approximately 25 tCO2 per year per installation. These values provide a preliminary indication of the environmental benefits associated with distributed hydropower recovery in urban water distribution systems.
Potential environmental considerations associated with microturbine installations should also be acknowledged. These include the embedded carbon associated with manufacturing turbine and generator components, as well as potential noise emissions from electromechanical equipment. However, such impacts are generally limited because the turbines are typically installed within existing underground PRV chambers or utility facilities, and the overall life-cycle environmental impact is expected to remain favorable compared with the operational emissions avoided through renewable electricity generation.
Overall, the findings of this study suggest that microturbine-based energy recovery is a technically feasible and environmentally beneficial option for urban water distribution systems with significant pressure management requirements. When supported by digital twin–based analysis and integrated with existing pressure control infrastructure, microturbines can contribute to improving the energy efficiency and sustainability of water utility operations.

6. Conclusions

This study evaluated the feasibility and potential for microturbine-based energy recovery in the Busan urban water distribution system using a digital hydraulic model. The analysis demonstrated that significant recoverable energy is available at PRV locations where excess pressure is intentionally dissipated. High-potential sites were primarily identified at interfaces between transmission and downstream distribution networks, where substantial pressure differentials coincide with relatively high flows under representative operating conditions. The maximum recoverable energy at a single site was estimated to be approximately 16.9 MWh/month, highlighting the viability of strategically deployed small-scale installations.
Although energy recovery at individual sites is modest, cumulative implementation across multiple locations supports a distributed energy recovery strategy within large-scale water networks. The digital twin framework proved effective for systematic identification and prioritization of candidate sites, enabling data-driven infrastructure planning and transferable application to other systems with complex topography. Crucially, the preliminary economic assessment indicated highly favorable Payback Periods (1.9 to 2.9 years) for the prioritized sites. However, capitalizing on this potential requires addressing site-specific physical constraints through compact designs and implementing parallel bypass configurations with automated SCADA control to guarantee uninterrupted and reliable pressure management.
Future work should incorporate diurnal variations in flow and pressure, seasonal demand variability, pilot-scale validation, and comprehensive life-cycle cost analysis to enhance the robustness of operational and economic assessments. Furthermore, integrating energy storage systems into these dynamic simulations should be evaluated to mitigate output variability. Overall, microturbine-based energy recovery, supported by greenhouse gas emission offsets, represents a practical and environmentally beneficial strategy for improving the energy efficiency and sustainability of urban water utilities.

Author Contributions

Conceptualization, B.J., S.K. (Sungwon Kang) and D.K.; methodology, B.J., S.K. (Sungwon Kang) and D.K. software, B.J.; validation, B.J., D.K. and S.K. (Sungwon Kang); formal analysis, B.J., S.K. (Sungwon Kang) and P.K.; investigation, B.J., S.K. (Sungwon Kang) and P.K.; resources, D.K.; data curation, D.K.; writing—original draft preparation, B.J., S.K. (Sungwon Kang); writing—review and editing, I.H., S.K. (Sanghyun Kim) and P.K.; visualization, B.J. and S.K. (Sanghyun Kim); supervision, B.J., S.K. (Sanghyun Kim) and P.K.; project administration, I.H. and P.K.; funding acquisition, I.H. and P.K. All authors have read and agreed to the published version of the manuscript.

Funding

This research was funded by the Korea Institute of Civil Engineering and Building Technology (KICT), grant number 20260133-001.

Data Availability Statement

The data presented in this study are available on request from the corresponding author. The data are not publicly available due to institutional restrictions.

Acknowledgments

Generative AI (ChatGPT, GPT-5 based model) was used solely for English grammar checking and language refinement. No AI tools were used for data analysis, interpretation of results, or scientific content generation.

Conflicts of Interest

The authors declare no conflicts of interest.

Abbreviations

The following abbreviations are used in this manuscript:
BEPBest Efficiency Point
DDADemand-Driven Analysis
HGLHydraulic Grade Line
LCOELevelized Cost of Energy
NPVNet Present Value
PATPump as Turbine
PBPPayback Period
PDAPressure-Driven Analysis
ROIReturn on Investment
PRVPressure Reducing Valve
SCADASupervisory Control And Data Acquisition
WSSWater Supply System

References

  1. Carravetta, A.; Del Giudice, G.; Fecarotta, O.; Ramos, H.M. Pump as Turbine (PAT) Design in Water Distribution Network by System Effectiveness. Water 2013, 5, 1211–1225. [Google Scholar] [CrossRef]
  2. Patelis, M.; Kanakoudis, V.; Gonelas, K. Combining pressure management and energy recovery benefits in a water distribution system installing PATs. J. Water Supply Res. Technol.—AQUA 2017, 66, 520–527. [Google Scholar] [CrossRef]
  3. Eskandaripour, M.; Moeini, R.; Dehnavi, A.; Bateni, S.M. Pressure management and energy production approaches in urban water distribution networks using pumps as turbines. Energy Rep. 2025, 14, 2593–2606. [Google Scholar] [CrossRef]
  4. Süme, V.; Daneshfaraz, R.; Kerim, A.; Abbaszadeh, H.; Abraham, J. Investigation of Clean Energy Production in Drinking Water Networks. Water Resour. Manag. 2024, 38, 2189–2208. [Google Scholar] [CrossRef]
  5. Ma, D.; Belloni, C.; Hull, N.M. Innovative microbial water quality management in water distribution systems using in-pipe hydropowered UV disinfection: Envisioning futuristic water-energy systems. Environ. Technol. 2025, 46, 1045–1061. [Google Scholar] [CrossRef]
  6. Fernández García, I.; McNabola, A. Maximizing Hydropower Generation in Gravity Water Distribution Networks: Determining the Optimal Location and Number of Pumps as Turbines. J. Water Resour. Plan. Manag. 2020, 146, 04019066. [Google Scholar] [CrossRef]
  7. Latifi, M.; Moghadam, K.F.; Naeeni, S.T. Pressure and Energy Management in Water Distribution Networks through Optimal Use of Pump-As-Turbines along with Pressure-Reducing Valves. J. Water Resour. Plan. Manag. 2021, 147, 04021039. [Google Scholar] [CrossRef]
  8. Marini, G.; Di Menna, F.; Maio, M.; Fontana, N. HYPER: Computer-Assisted Optimal Pump-as-Turbine (PAT) Selection for Microhydropower Generation and Pressure Regulation in a Water Distribution Network (WDN). Water 2023, 15, 2807. [Google Scholar] [CrossRef]
  9. Kostner, M.K.; Zanfei, A.; Alberizzi, J.C.; Renzi, M.; Righetti, M.; Menapace, A. Micro hydro power generation in water distribution networks through the optimal pumps-as-turbines sizing and control. Appl. Energy 2023, 351, 121802. [Google Scholar] [CrossRef]
  10. Latifi, M.; Kerachian, R.; Zali, R.B. Evaluating energy harvesting from water distribution networks using combined stakeholder and social network analysis. Energy Strategy Rev. 2023, 49, 101158. [Google Scholar] [CrossRef]
  11. Latifi, M.; Zali, R.B.; Kerachian, R. Optimal energy harvesting plans in water distribution networks considering the stakeholders’ utilities. Energy Strategy Rev. 2024, 54, 101437. [Google Scholar] [CrossRef]
  12. Carravetta, A.; Del Giudice, G.; Fecarotta, O.; Ramos, H.M. Energy Production in Water Distribution Networks: A PAT Design Strategy. Water Resour. Manag. 2012, 26, 3947–3959. [Google Scholar] [CrossRef]
  13. Samora, I.; Manso, P.; Franca, M.J.; Schleiss, A.J.; Ramos, H.M. Energy Recovery Using Micro-Hydropower Technology in Water Supply Systems: The Case Study of the City of Fribourg. Water 2016, 8, 344. [Google Scholar] [CrossRef]
  14. Pérez-Sánchez, M.; Sánchez-Romero, F.J.; Ramos, H.M.; López-Jiménez, P.A. Energy Recovery in Existing Water Networks: Towards Greater Sustainability. Water 2017, 9, 97. [Google Scholar] [CrossRef]
  15. Pugliese, F.; Giugni, M. An Operative Framework for the Optimal Selection of Centrifugal Pumps As Turbines (PATs) in Water Distribution Networks (WDNs). Water 2022, 14, 1785. [Google Scholar] [CrossRef]
  16. Bideris-Davos, A.A.; Vovos, P.N. Techno-economic design and placement tool for energy recovering pressure regulating turbines in water distribution systems. Renew. Energy 2024, 237, 121460. [Google Scholar] [CrossRef]
  17. Fecarotta, O.; McNabola, A. Optimal Location of Pump as Turbines (PATs) in Water Distribution Networks to Recover Energy and Reduce Leakage. Water Resour. Manag. 2017, 31, 5043–5059. [Google Scholar] [CrossRef]
  18. Stefanizzi, M.; Filannino, D.; Capurso, T.; Camporeale, S.M.; Torresi, M. Optimal hydraulic energy harvesting strategy for PaT installation in Water Distribution Networks. Appl. Energy 2023, 344, 121246. [Google Scholar] [CrossRef]
  19. Fernández García, I.; Ferras, D.; McNabola, A. Potential of Energy Recovery and Water Saving Using Micro-Hydropower in Rural Water Distribution Networks. J. Water Resour. Plan. Manag. 2019, 145, 05019001. [Google Scholar] [CrossRef]
  20. Telci, I.T.; Aral, M.M. Optimal Energy Recovery from Water Distribution Systems Using Smart Operation Scheduling. Water 2018, 10, 1464. [Google Scholar] [CrossRef]
  21. Rodríguez-Pérez, A.M.; Pulido-Calvo, I. Analysis and viability of microturbines in hydraulic networks: A case study. J. Water Supply Res. Technol.—AQUA 2019, 68, 474–482. [Google Scholar] [CrossRef]
  22. Ministry of Climate and Energy Environment. National Greenhouse Gas Emission Factor for the Electricity Sector; Government of the Republic of Korea: Seoul, Republic of Korea, 2025. [Google Scholar]
Figure 1. Schematic illustration of microturbine installation and head variation in a water distribution pipeline.
Water 18 00847 g001
Figure 2. Digital twin representation of the Busan water transmission system (green lines).
Water 18 00847 g002
Figure 3. Spatial distribution of elevation (m) in the Busan water transmission system.
Water 18 00847 g003
Figure 4. Example of hydraulic grade line (HGL) variation along a water transmission line, illustrating elevation profile, branch connections, and pressure differences between upstream and downstream locations.
Water 18 00847 g004
Figure 5. Spatial distribution of hydraulic grade line (m) in the Busan water transmission system.
Water 18 00847 g005
Figure 6. Spatial distribution of pressure (m) in the Busan water transmission system.
Water 18 00847 g006
Figure 7. Spatial distribution of flow (L/s) in the Busan water transmission system.
Water 18 00847 g007
Figure 8. Spatial distribution of velocity (m/s) in the Busan water transmission system.
Water 18 00847 g008
Figure 9. Digital twin model of the Busan water transmission system, showing the spatial distribution of pressure reducing valves (PRVs) used as candidate locations for microturbine installation.
Water 18 00847 g009
Figure 10. Top 20 pressure-reducing valve (PRV) locations ranked by estimated recoverable monthly energy for microturbine installation.
Water 18 00847 g010
Figure 11. Field investigation of a pressure reducing valve (PRV) chamber at a high-potential site: (a) access and inlet location of the valve chamber; (b) interior layout showing limited available space for additional equipment installation.
Water 18 00847 g011
Table 1. Research summary on microturbine and PAT applications in water distribution systems.
ReferenceStudy Area/NetworkEnergy
Production
Economics & Key Findings
Carravetta et al. (2012) [12]Hypothetical network54.4–258.5 kWh/dayVariable Operating Strategy (VOS) recovers >50% of available energy; Achieved pump efficiency of 0.49–0.59
Samora et al. (2016) [13]Fribourg
(Switzerland)
60.5 MWh/yearNPV (20 year): $258,000; PBP: 0.7 years; Recovers ~10% of total available energy in the network
Fecarotta & McNabola (2017) [17]Jowitt benchmark network348.7 kWh/dayNPV: €833,740 (including leakage reduction benefits); Leakage reduction: 929.4 m3/day; Including water saving benefits increased NPV by 11%
Patelis et al. (2017) [2]Kozani (Greece)43.8 MWh/yearEnergy recovery is feasible at 7 DMAs (sites >2 kW selected); Pressure management efficiency is slightly lower than PRVs, but offers energy generation
Telci & Aral (2018) [20]Dover Township (USA)275 MWh/yearCO2 reduction: 190 tons/year; Capable of powering ~25 average US homes
Fernández García et al. (2019) [19]Blackstairs
(Ireland)
74 MWh/yearPBP: 1 year; Leakage reduction identified as the most economically advantageous component
Rodríguez-Pérez & Pulido-Calvo (2019) [21]Giahsa network (Spain)278.2 MWh/yearPBP: 2 years; Investment cost: ~€40,000; Annual revenue: ~€20,000; Francis turbine installed at WWTP inlet
Pugliese & Giugni (2022) [15]Hypothetical simplified network135.1 kWh/dayNPV: €76,728; PBP: 2.50 years; Higher available head (Hav) significantly improves economic viability
Stefanizzi et al. (2023) [18]Southern Italy WSS750 MWh/yearNPV: €520,561; PBP: 2.91 years; ROI: 31.4%
Kostner et al. (2023) [9]Egna
(Italy)
19.7 MWh/yearNet energy balance: +3411 kWh (production > consumption); Leakage losses reduced by 21%; Dynamic pressure control maximizes efficiency
Latifi et al. (2024) [11]Tehran
(Iran)
212 MWh/yearMax energy with 5 PATs; Stakeholder analysis favored selling electricity to the grid over other options
Bideris-Davos & Vovos (2024) [16]Kentucky
(USA)
210.8 MWh/yearLCOE: 0.0621 €/kWh; PBP: 7.69 years; Consideration of “shadow benefits” (avoided PRV costs) improved economic metrics
Süme et al. (2024) [4]Trabzon
(Türkiye)
84.1 kWh/hour
(47 PBVs)
PBP: 3.7 years; Annual CO2 reduction: 377 tons
Eskandaripour et al. (2025) [3]Jowitt benchmark network114.9 kWh/day
(5 PATs)
PDA predicted higher energy production than DDA (97.86 vs. 85.56 kWh)
Table 2. Comparison of Digital Twin and SCADA-Based Energy Recovery Estimates for Top 20 PRV Sites.
RankValve IDDigital Twin ResultSCADA ResultsMonthly Energy 2 (MWh)Annual Energy 2 (MWh)
Flow
(m3/day)
Inlet Pressure (m)Outlet Pressure (m)Estimated Power
(kW)
Flow
(m3/day)
Outlet Pressure (m)Estimated Power 1
(kW)
124019418783333.787334324.316.9205.0
223574209894715.443034315.710.9132.8
3233429031135413.424285511.27.894.4
422143605805410.336274410.47.287.6
52311240899619.42445509.56.680.4
62223370897658.33666698.25.768.9
72396203258444.83302287.95.566.5
82098334781586.93392557.04.959.2
92369252969466.02287395.53.846.1
102347265466605.72463395.33.744.6
112152156093575.21410514.73.339.7
122364305152414.13372354.63.238.4
132360274862345.52238374.43.137.6
142317382871694.33511573.92.733.0
152366243970613.32686533.62.530.6
162218143375424.31062373.22.227.1
172107411363503.33295532.61.822.1
182416174978512.22052622.61.822.1
192418117667294.1717232.51.721.2
202374277965612.22776552.21.518.6
Note: 1 Since SCADA inlet pressure data were not available, inlet pressure from the digital twin model was used for power calculation. 2 The estimated monthly and annual energy values were calculated by adjusting the SCADA-based power estimates with a demand variation factor of 1.0375. This factor accounts for the difference between the observed peak demand period (July–August 2022) and the annual average water demand.
Disclaimer/Publisher’s Note: The statements, opinions and data contained in all publications are solely those of the individual author(s) and contributor(s) and not of MDPI and/or the editor(s). MDPI and/or the editor(s) disclaim responsibility for any injury to people or property resulting from any ideas, methods, instructions or products referred to in the content.