Article

Integrated Data-Driven Multi-Criteria Analysis and Machine Learning Approaches for Assessment of Flood Susceptibility Mapping


1
Department of Earth and Environmental Sciences, University of Bari Aldo Moro, Via E. Orabona 4, 70125 Bari, Italy
2
Centre of Excellence in Water Resources Engineering, University of Engineering and Technology, Lahore 54890, Pakistan
3
Faculty of Environmental Management, Prince of Songkla University, Hat Yai 90110, Thailand
4
Department of English Literature, Bahawalnagar Sub-Campus, The Islamia University of Bahawalpur, Minchanabad Road, Bahawalnagar 62300, Pakistan
5
Department of Civil, Environmental and Ocean Engineering, Stevens Institute of Technology, Hoboken, NJ 07030, USA
*
Authors to whom correspondence should be addressed.
Water 2026, 18(7), 844; https://doi.org/10.3390/w18070844
Submission received: 21 February 2026 / Revised: 17 March 2026 / Accepted: 30 March 2026 / Published: 1 April 2026
(This article belongs to the Special Issue Recent Advances in Flood Risk Assessment and Management)

Abstract

Flood events represent a major natural threat, and identifying the key factors contributing to flood occurrence has gained considerable attention in 2010 and 2022 in the Swat River, Pakistan. In this study, Google Earth Engine was utilized to extract flood-related indices for the Mohmand Dam catchment, Pakistan. Different types of datasets were used to calculate fourteen influencing parameters. These indices were processed and normalized in ArcMap 10.8 and Python to enhance their visual and analytical representation. Two multi-criteria analyses with AHP, FAHP, and five machine learning models, including logistic regression, K-nearest neighbors, random forest, support vector machine, and multi-layer perception, were applied to determine the relative importance of each parameter and produce a flood susceptibility map. The results indicate that rainfall, LULC, and soil texture are the most influential factors, each contributing 11.11% to flood susceptibility. The random forest approach demonstrated stronger predictive performance than the AHP and FAHP techniques. The flood susceptibility map reveals that approximately 31.67% (4320.40 km2) of the study area falls under high flood risk. This methodology provides valuable support for planners, policymakers, hydrologists, and disaster management authorities in developing effective flood mitigation, watershed management, and resilience strategies.

1. Introduction

Floods are one of the most frequent and devastating natural disasters in the world, affecting about 1.81 billion people, corresponding to 23% of the global population [1,2]. Due to accelerating urbanization and climate change, this number is expected to increase to 2.3 billion by 2050 [2]. In the last 20 years, there has been an almost 40-fold increase in the frequency of flood events due to the growing number of precipitation extremes, population, deforestation, and unplanned urbanization [3,4]. Floods are associated with numerous deaths, socio-economic and social long-term decay, damage to infrastructure, degradation of ecosystems, and forced migration [5,6,7,8,9,10]. Although developing countries lose human and economic resources disproportionately because of floods, due to low institutional capacity, inadequate infrastructure, and high population density in areas prone to floods, they may reduce the impact of floods by having resilient infrastructure, warning systems, and proper planning based on available historical data on flood occurrence [11]. In 2020 alone, the damage caused by floods in the world amounted to USD 105 billion, and the estimates show that the damage might amount to USD 150 billion in 2050 [12,13].
Pakistan is a prime example of this increasing susceptibility. The country, which is the fifth most populated and the eighth most vulnerable to climate in the world, is prone to flood disasters due to its complex topography, monsoon-dominated weather conditions, river systems driven by glaciers, and rapid land use transformation [14,15,16,17]. The Swat Valley (~5400 km2; altitudes reaching 6000 m a.s.l) is one of the most affected regions, wherein 2.3 million inhabitants are at great risk of floods because of the highly populated riverbank areas and high-intensity precipitation in monsoons [18]. These physiographic situations promote a quick generation of runoff, initiation of debris flows, as well as downstream flooding, especially during the outbreak of intense monsoons [14].
The 2022 monsoon-induced unprecedented flooding impacted more than 33 million individuals across the country, resulting in the deaths of 1730 people, the destruction of more than 1.3 million homes, and damage to about 13,000 km of road infrastructure [19,20,21]. This extreme rainfall, which was 78 percent higher than the historical average, caused destructive flash floods and debris flows [22]. The dams generated by the riverbed debris flow increased downstream flooding and exacerbated the destruction of settlements, agricultural land, transportation systems, and public utilities [23,24,25]. Among the most important factors inducing such remarkable damage are sharp gradients, gully formations, and shallow-slope failures, which have to be mentioned; at the same time, land use changes, and in particular, deforestation, loss of grasslands, and the development of barren land, increased slope instability and the development of erosional processes [26,27]. Such phenomena follow similar trends occurring throughout the world [28,29,30] where flash floods and debris flows are becoming the dominant hydrometeorological risks in mountainous landscapes, especially during compound interactions of climate change and human activities [31].
Furthermore, climate projections indicate that such multi-day extreme precipitation events are likely to intensify in Southern Asia under continued global warming, substantially increasing the future flood risk and posing major challenges for adaptation and disaster risk reduction [32]. The 2022 flood, therefore, underscores an urgent need to shift from a reactive disaster response toward proactive, data-driven flood-risk assessment and spatial planning approaches.
In response, the flood catastrophes in northern Pakistan have prompted national and international agencies to adopt the Integrated Risk Management (IRM) paradigm, emphasizing active risk identification rather than a reactive response. Such projects demonstrate the urgent need for efficient, spatially explicit, and reliable methods of flood susceptibility mapping to facilitate watershed management, land use planning, and evidence-based disaster risk reduction in hazard-prone regions [33].
Flood susceptibility (FS) consists of the identification of those areas most prone to flooding, which plays a key role in effective flood risk management [34]. Flood Susceptibility Mapping (FSM) can assist policymakers, planners, and disaster management bodies in identifying high-risk areas and ranking mitigation efforts according to environmental, climatic, and anthropogenic drivers, such as topography, precipitation patterns, land use, soil characteristics, density of drainage, or vegetation cover [35,36,37,38]. The standard FSM techniques are based on the geographic information system (GIS), hydrological modeling, and multi-criteria decision analysis (MCDA) methods, including the Analytic Hierarchy Process (AHP) and Fuzzy AHP (FAHP) methods [39,40,41]. Despite being transparent and interpretable, such methods tend to be limited in terms of subjectivity, scalability, computing performance, and combining large and multi-source remote sensing data, especially where data are limited.
Recent developments in machine learning (ML) have significantly enhanced FSM as they allow the modeling of complex and nonlinear relationships between several factors that condition a flood, as well as increase predictive accuracy [36,42,43]. Random forest (RF), support vector machines (SVM), gradient boosting, and artificial neural networks (ANN) are ML algorithms that have proven to be high-performing in a variety of physiographic and climatic environments [44,45,46,47,48]. Flood susceptibility across models of ensemble learning (such as XGBoost, CatBoost, RF) are becoming known for its superiority compared to traditional statistical frameworks in comparative studies [49,50]. Moreover, by combining ML with cloud-based platforms, in particular Google Earth Engine (GEE), it is possible to track high-resolution optical and radar satellite imagery, and to fast and effectively derive flood-related indices, including elevation, slope, aspect, drainage density, land use/land cover, NDVI, NDWI, topographic wetness index, and extreme precipitation measures, without having to use high-end local computational infrastructure [51,52].
The integration of ML with MCDA into hybrid frameworks has become the best practice in current studies of flood risks. Comparable studies combining ML algorithms with AHP, FAHP, fuzzy logic, and explainable AI methods (e.g., SHAP) show that they achieve better predictive accuracy and maintain interpretability and expert knowledge [47,53]. These methods are especially useful in mountainous, data-limited, and flood-prone areas, where hydrological processes are very nonlinear and spatially heterogeneous.
Despite rapid methodological advances, recent review and meta-analysis studies confirm that flood susceptibility mapping (FSM) still faces persistent limitations in model integration, scalability, and geographic representation. Contemporary reviews report that a substantial proportion of FSM research remains single-model-based and spatially localized, which constrains transferability across heterogeneous and mountainous landscapes [48,54]. Although machine learning approaches increasingly dominate FSM, recent systematic reviews highlight the continued lack of rigorous, large-scale benchmarking between ML and MCDA frameworks, particularly under complex topographic and monsoon-driven conditions. Moreover, state-of-the-art reviews emphasize that cloud-enabled, ensemble-based FSM integrating multi-source remote sensing remains underrepresented in monsoon-dominated mountainous regions, including Pakistan, despite escalating flash flood and debris flow risks under climate and land use change [55].
This paper fills these gaps by applying the MCDA methodologies (AHP and FAHP) to several machine learning models to assess 14 parameters of floods and produce high-resolution flood susceptibility maps of the Mohmand Dam catchment in Pakistan. The proposed framework will improve predictive accuracy, scalability, and interpretability by utilizing multi-source remote sensing, cloud computing, and ensemble learning. These findings can be used in practice towards disaster preparedness, watershed management, and community resiliency, and offer a reproducible methodology that can be used with other flood-prone areas in the world.
The research structure of the given work is as follows: (i) Section 2 presents the study areas and datasets and the GEE, where different credible data sources are obtained by using Landsat-8 (L8) satellite images and the Shuttle Radar Topography Mission (SRTM) Digital Evaluation Model (DEM) and Sentinel 2; (ii) Section 3 is dedicated to detailed information concerning the proposed methodology implementation; (iii) the results of the methodology implementation concerning different levels of risk are provided. The findings of this study are then compared to those of the literature, and (iv) the major accomplishments are given in the concluding remarks.

2. Materials and Methods

2.1. Study Area

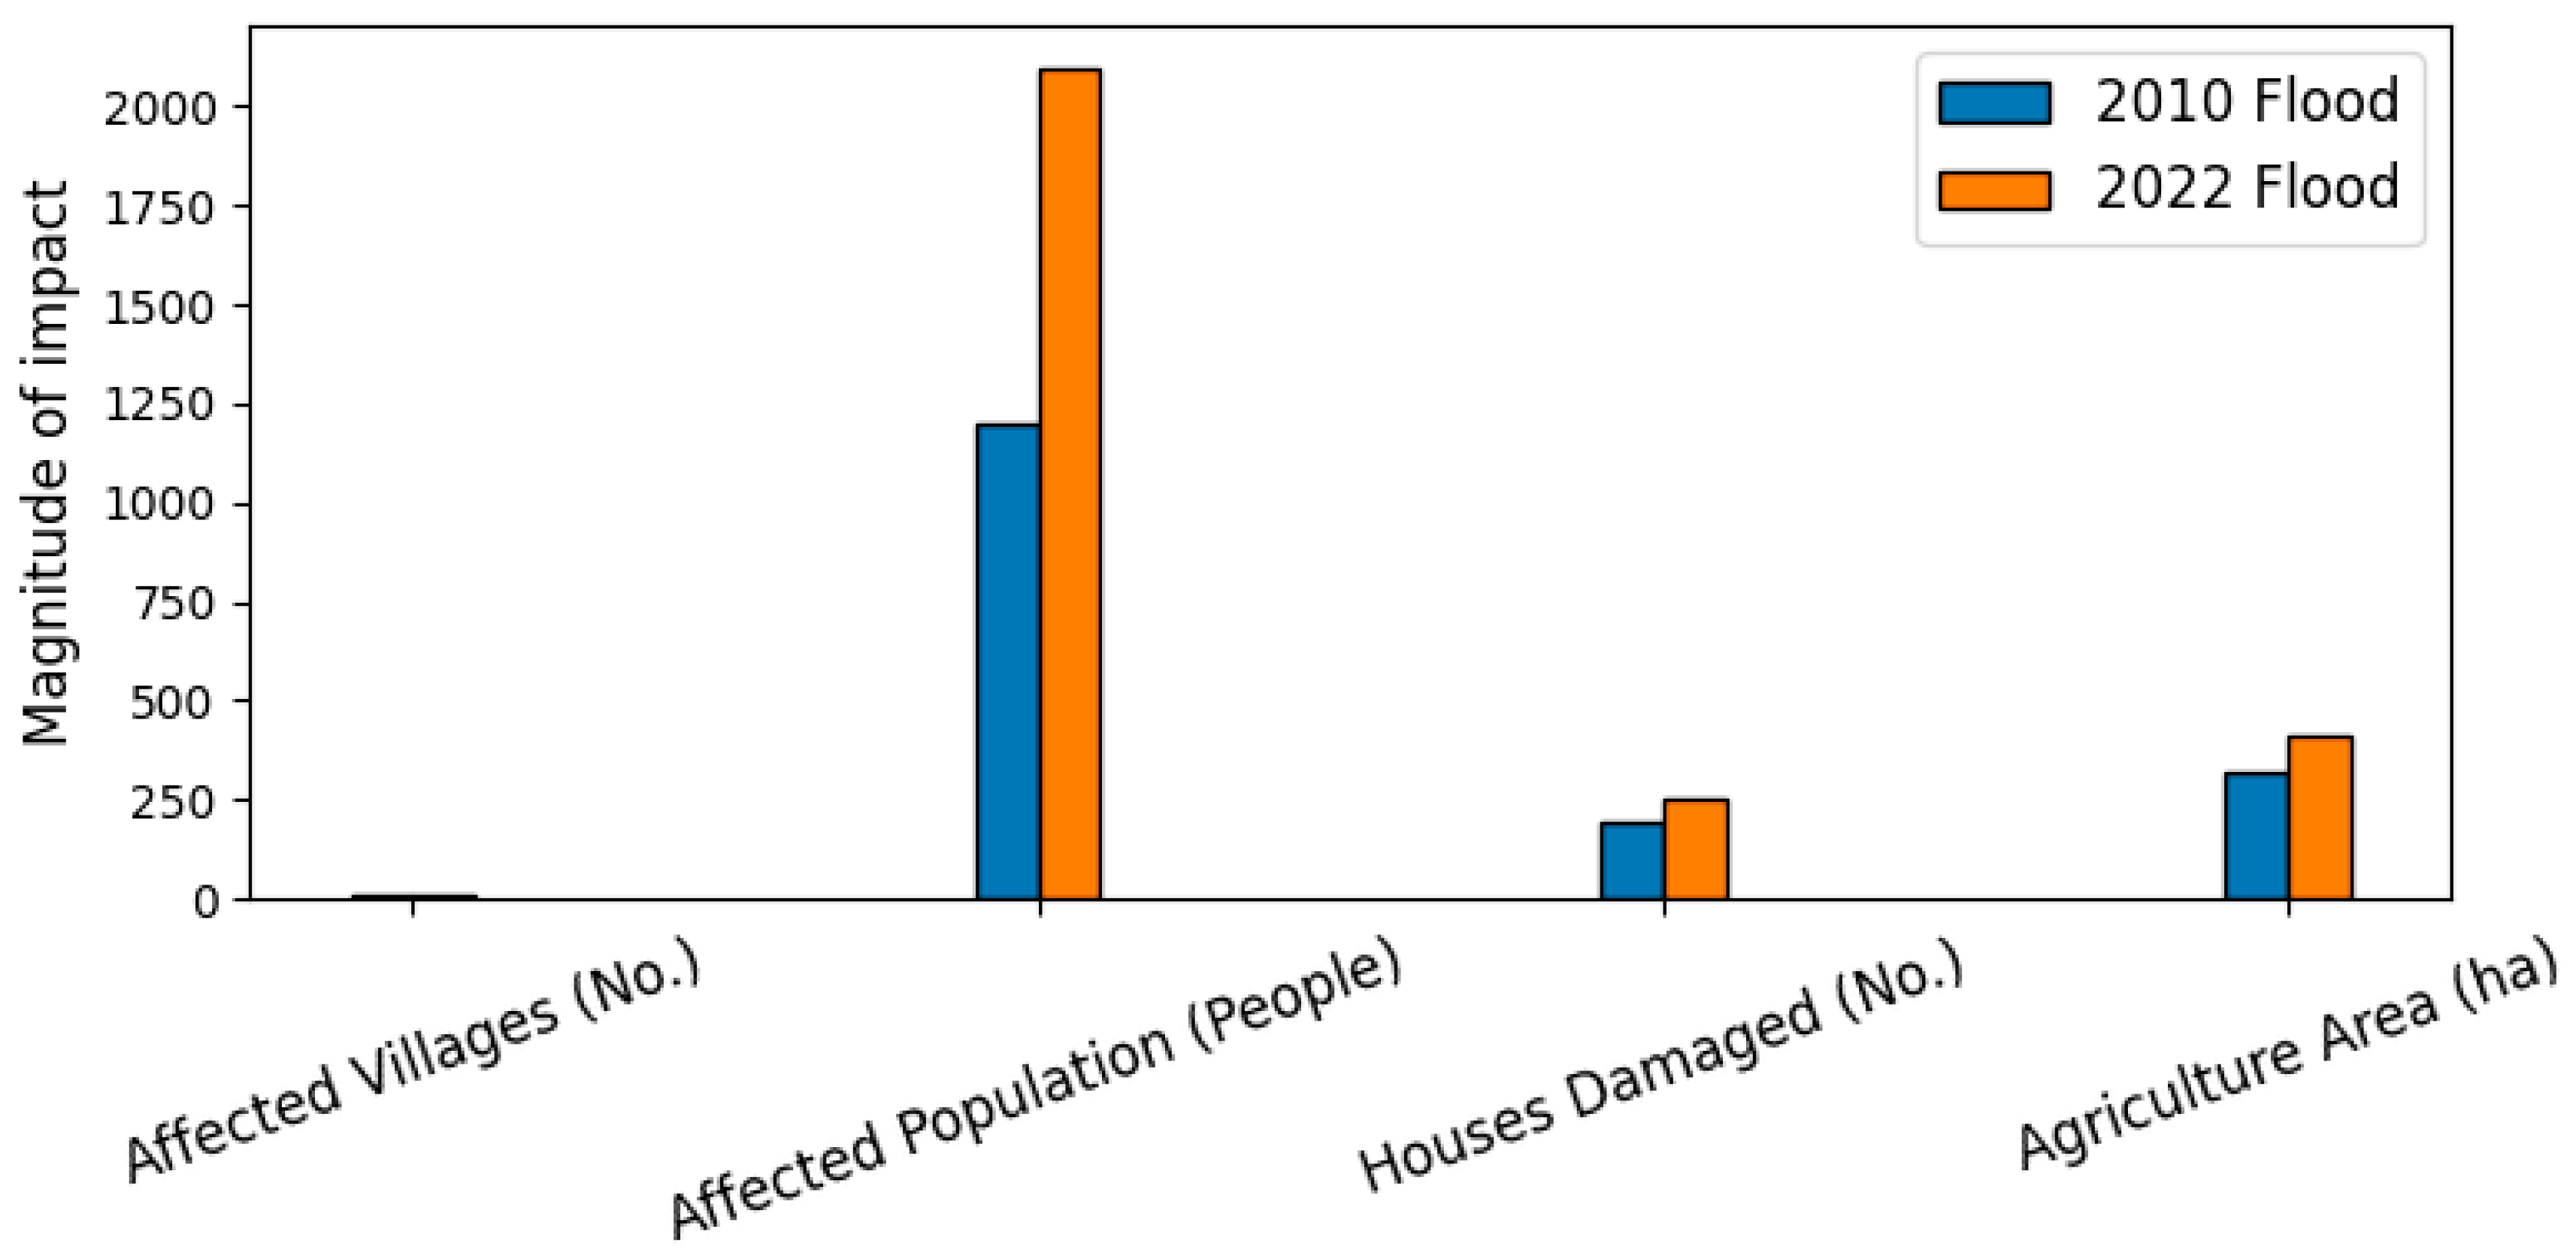
The Mohmand Catchment Dam (also known as the Munda Dam) is a catchment on the Swat River, in Khyber Pakhtunkhwa, Pakistan, about 48 km northeast of Peshawar. The dam is located at a latitude of 34°21′ N and longitude 71°32′ E and has an overall catchment of around 13,956 km2 (Figure 1). The main purposes of the Mohmand Dam are irrigation water storage, hydropower generation, and minimizing floods. The Swat River has its origin in the Kalam region, at the confluence of the Gabral and Ushu Rivers, and is fed by large tributaries like the Amandara and Panjkora Rivers downstream. The area has mountainous topography, and the catchment rises at an elevation of up to nearly 360 to 4500 m a.m.s.l. Precipitation averages 375 mm to 1250 mm/year, with snowmelt runoff (May–June) and monsoon precipitation (July–September) having a significant effect. The MDC comprises a geomorphology and hydrometeorological environment that makes it most vulnerable to flash floods. The 2022 Monsoon floods have been reported to be more severe than the 2010 floods, resulting in a humanitarian crisis that affected over 33 million people and caused 1739 deaths. Livestock, homes, and infrastructure have suffered significant damage across Sindh, KP, Southern Punjab, and Eastern Balochistan. Figure 2 shows the statistics for the 2010 and 2022 flood events.

2.2. Data Sources and Preprocessing

The data used in the analysis were collected and processed in this research as follows:
Multi-source remote sensing and geospatial data, including Landsat-8 and Sentinel-2 imagery and the SRTM DEM, were used (Table 1). Different types of datasets used for FSM. Historical flood inventories were compiled from government records and field surveys and used as reference data for modeling. All satellite data were analyzed in Google Earth Engine (GEE), which applies radiometric and atmospheric corrections. Additional calculations and proximity-based calculations were done in ArcMap (version 10.8) and Python (version 3.13) using vs. Code. To make datasets spatially compatible, all datasets were resampled to a shared spatial resolution and projection into a shared coordinate reference frame.
To ensure spatial compatibility among all conditioning factors, all datasets were resampled to a common spatial resolution. Although resampling may cause slight smoothing or a loss of local details, especially for categorical layers, this step was necessary to enable consistent pixel-based analysis across multi-source datasets.

2.3. Flood-Conditioning Factors

Flood contributing factors were used for the susceptibility of flash flood analysis due to data availability and logical variability. In the present study, fourteen flood-conditioning factors were selected for this study based on the geomorphological features of the Mohmand Dam Catchment (MDC) and information from past research [15]. These variables include topographic, hydrological, environmental, anthropogenic, meteorological, and soil variables. Topographic parameters are elevation, slope, aspect, topographic wetness index (TWI), and topographic position index (TPI), which determine the flow and accumulation of surface water. Hydrological measures, including surface runoff patterns and distance to streams, describe the properties of the river network and drainage system. The land use/land cover (LULC), normalized difference vegetation index (NDVI), and land surface temperature (LST) were used to represent vegetation and environmental conditions. Proximity factors, such as distances to roads and built-up areas, indicate the effects of human infrastructure on flood susceptibility. Rainfall is the meteorological factor that was considered, and soil texture was added to explain its influence on both infiltration and the runoff processes. All fourteen factors combine to create a complete model of flash flood-prone areas in the MDC.
Shuttle Radar Topography Mission SRTM DEM provided topography parameters, and Geographic Information System (GIS) provided spatial analysis of the hydrological indicators, while LULC was obtained using Sentinel-2 images, and NDVI and LST with Landsat-8 images in Google Earth Engine (GEE), respectively. Euclidean distance functions were used to compute the proximity variables. For each factor, five susceptibility classes (very low to very high) were defined as natural breaks and literature thresholds.

2.4. Weight Assignment and Flood Susceptibility Mapping

The Analytic Hierarchy Process (AHP) was used to assess the relative importance of the flood-conditioning factors. Following Saaty’s scale, pairwise comparisons were conducted, and normalized weights were obtained. The consistency ratio (CR) was computed through Equation (1):
C R = C I R I , C I = λ max n n 1
where λ max is the maximum eigenvalue, n is the number of criteria, and RI is the random consistency index. A CR value below 0.1 was considered acceptable. Then, normalized weights were combined with the standardized factor values using the Weighted Linear Combination (WLC) technique to produce the flood susceptibility index (FSI) Equation (2):
F S I = i = 1 n W i × X i
where W i is the normalized weight of the factor i , and X i is its standardized value. The fuzzy analytical hierarchy process (FAHP) was also used to address uncertainty in expert judgment, yielding a fuzzy flood susceptibility index (FFSI) that was obtained by summing the fuzzy normalized weights to the WLC.

2.5. Machine Learning Models

Five supervised machine learning (ML) models were used to predict flood susceptibility, including random forest (RF), support vector machine (SVM), logistic regression (LR), K-nearest neighbors (KNN), and multi-layer perception (MLP). The input features were the fourteen flood-conditioning factors.
Stratified 10-fold cross-validation was applied to divide historical flood points, keeping the proportion of flood and non-flood classes unchanged. Receiver operating characteristic (ROC) curves were plotted, and the area under the curve (AUC) was calculated as the primary performance metric for each fold. The true positive rates were interpolated to obtain a mean ROC curve with a standard deviation shading, as in Waleed et al. [14]. An example is in RF, where the mean AUC was 0.987 (SD = 0.005) and the total accuracy was 94%. Classification performance was evaluated using metrics such as precision, recall, and F1-score for each model.
Hyperparameters were optimized: RF was trained with 300 trees, KNN was trained with k = 7, LR and SVM models were trained with standardized features through scikit-learn Pipelines, and MLP had two hidden layers of 50 and 20 neurons with an iteration of 2000 epochs. Cross-validation was performed on the complete datasets, which were then used to train the models to produce final susceptibility maps.
To assess the influence of each factor on model predictions, feature importance was estimated using tree-based models (RF and LightGBM), and SHAP (Shapley Additive exPlanations) values were used to quantify the strength and direction of each feature’s influence on the probability of floods. SHAP analyses can be used to develop interpretable machine learning models that identify the truly significant causes of flood susceptibility in MDC.
Lastly, each model was used to generate flood-prone rasters at the basin scale. Probability results were projected to GeoTIFFs, and big raster arrays were run in batches of results to run efficiently with memory. The results of these outputs were compared with AHP and Fuzzy AHP indices. All analyses were performed in Python 3.x with packages such as scikit-learn, pandas, rasterio, geopandas, matplotlib, LightGBM, and SHAP.

2.6. Methodology Workflow

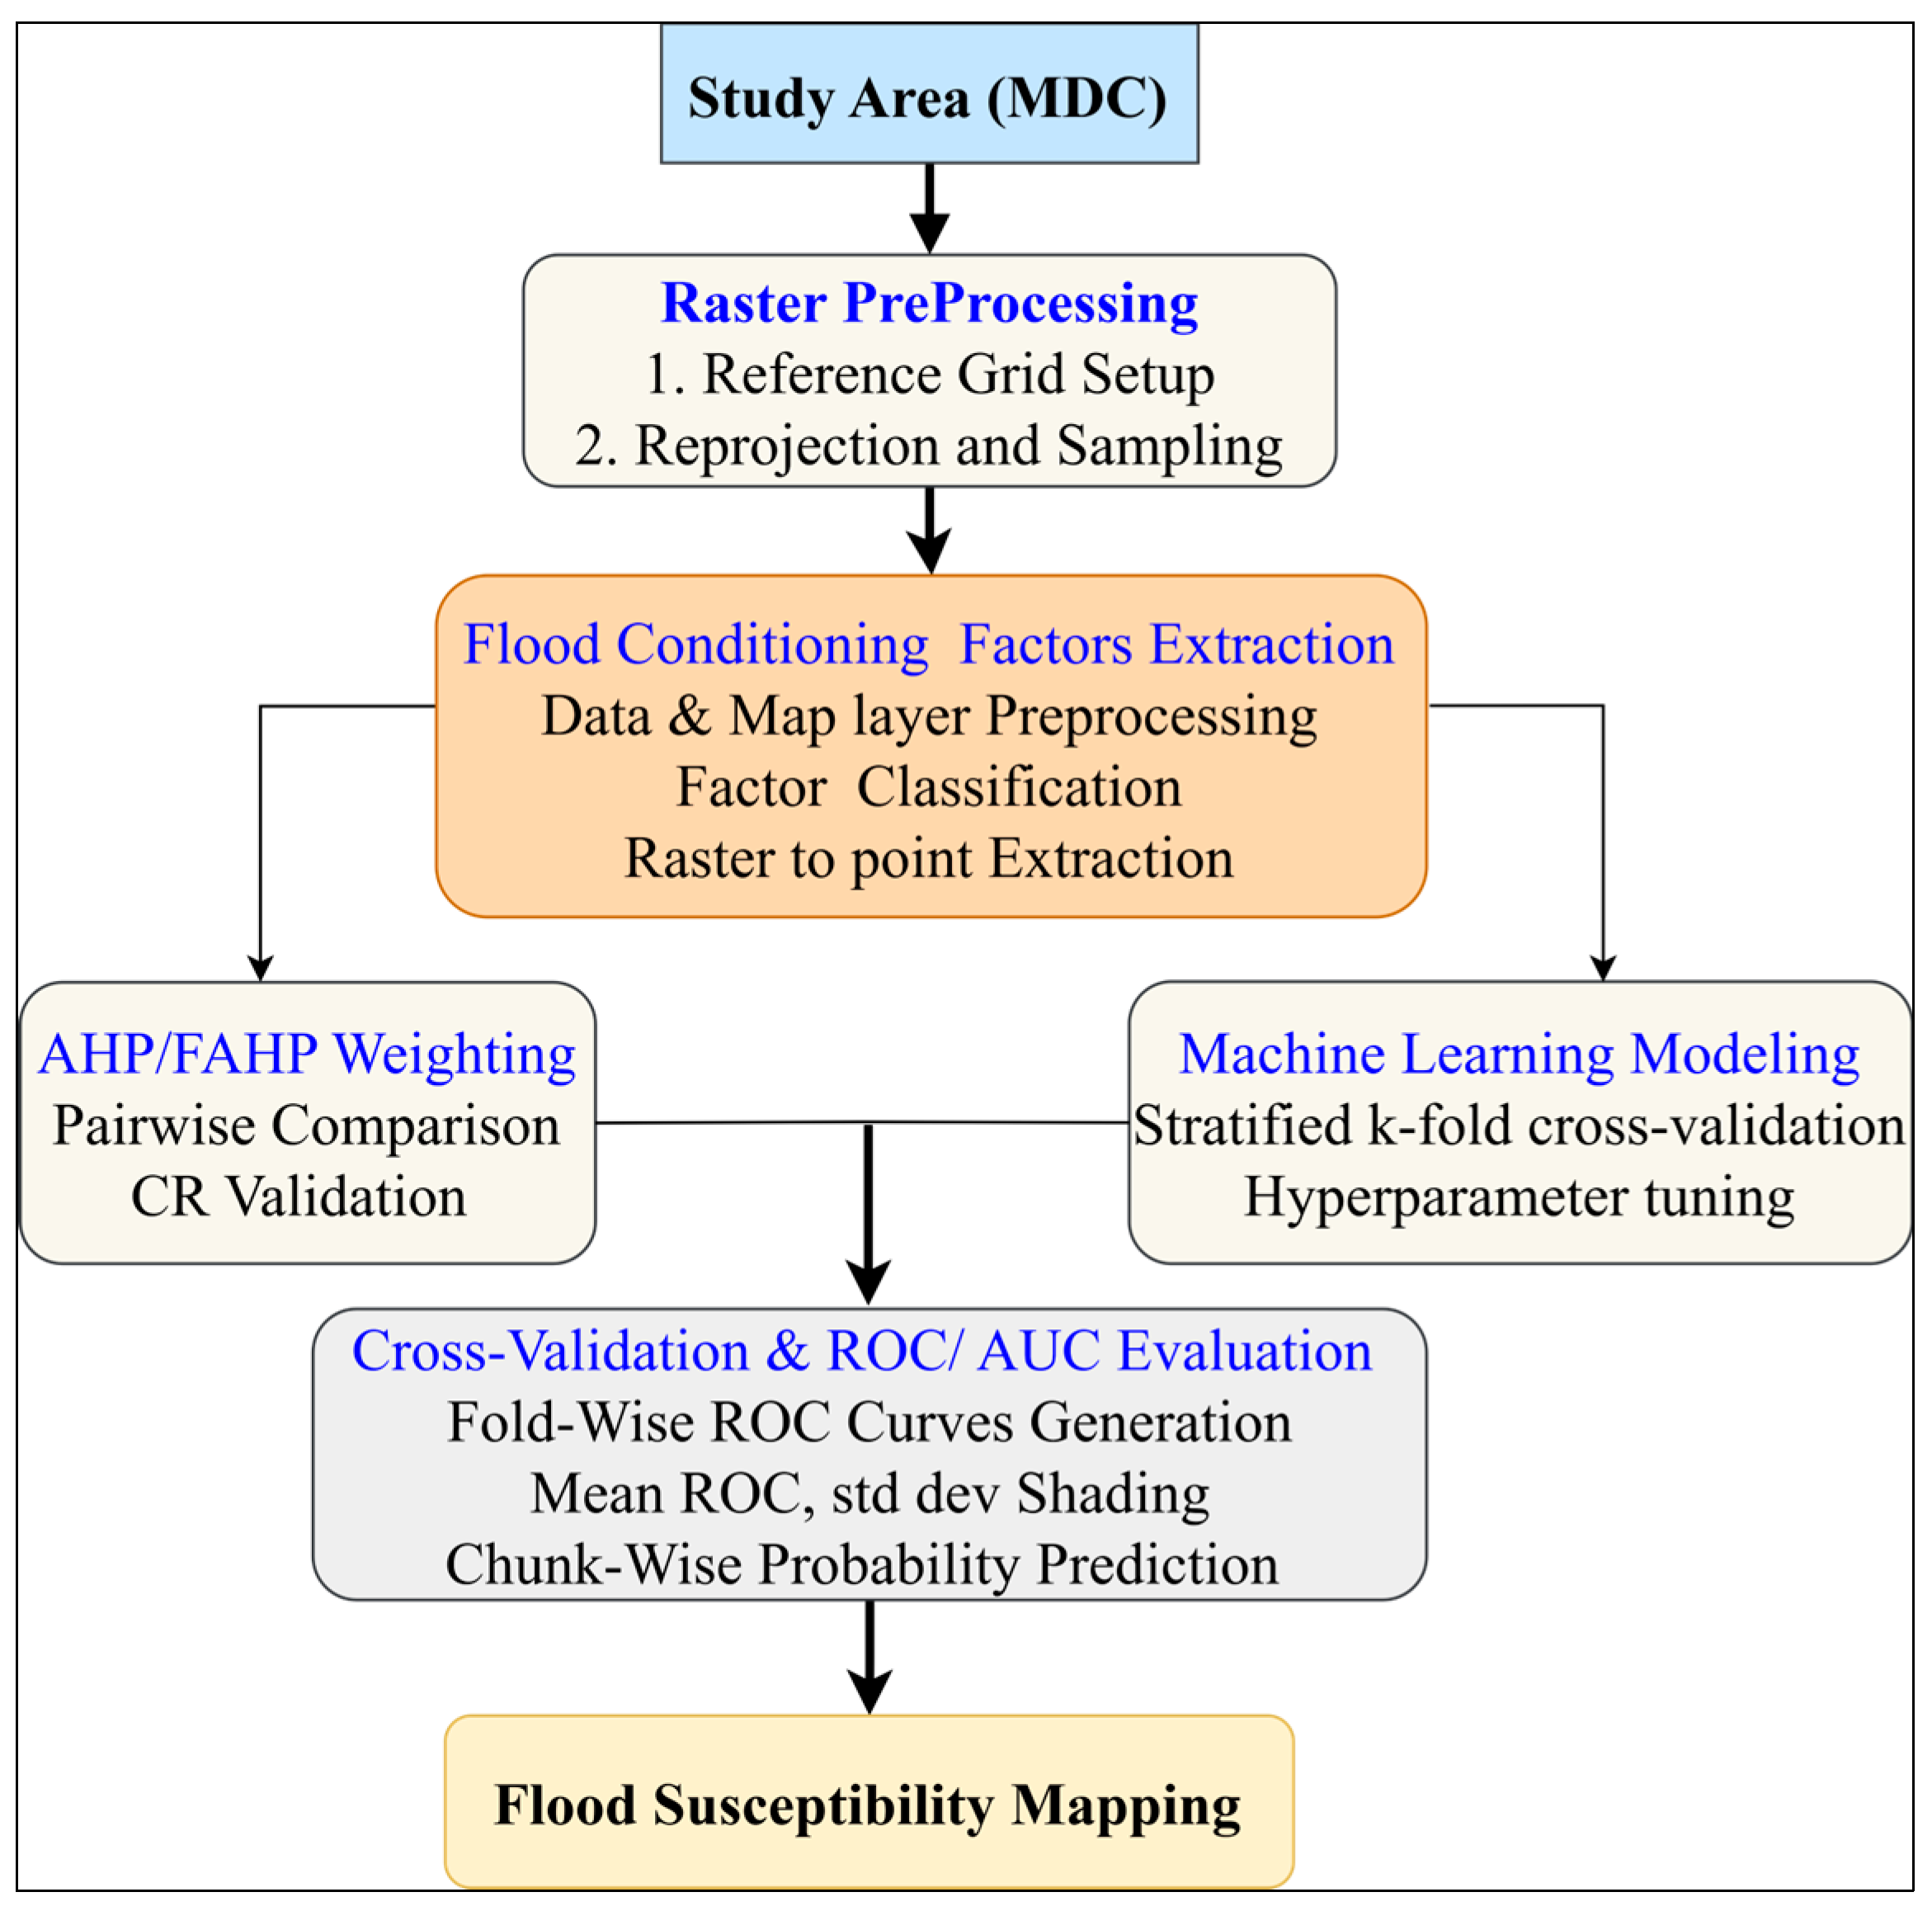
Figure 3 presents the overall workflow, which combines raster preprocessing, extraction of the flood-conditioning factor, AHP/FAHP weight optimization, machine learning model development, cross-validation, ROC/AUC analyses, feature-prioritization ranking via SHAP, and final flood susceptibility mapping. Raster sampling, raster-to-point extraction, and chunk-wise probability prediction were used to guarantee upper computational efficiency and reproducibility.

2.7. AI Use Statement

Google Gemini was used only for limited minor code correction during debugging, such as identifying syntax-level issues in the computational workflow. It was not used for data analysis, model development, interpretation of results, or generation of scientific content. All methodological decisions and analyses were performed and verified by the authors.

3. Results

3.1. Spatial Distribution of Key Factors

The following section presents the results of this study, including the spatial distribution of the main aspects affecting flood susceptibility and the analysis of soil types, topography, and other conditioning parameters across the research area.

3.1.1. Soil Type

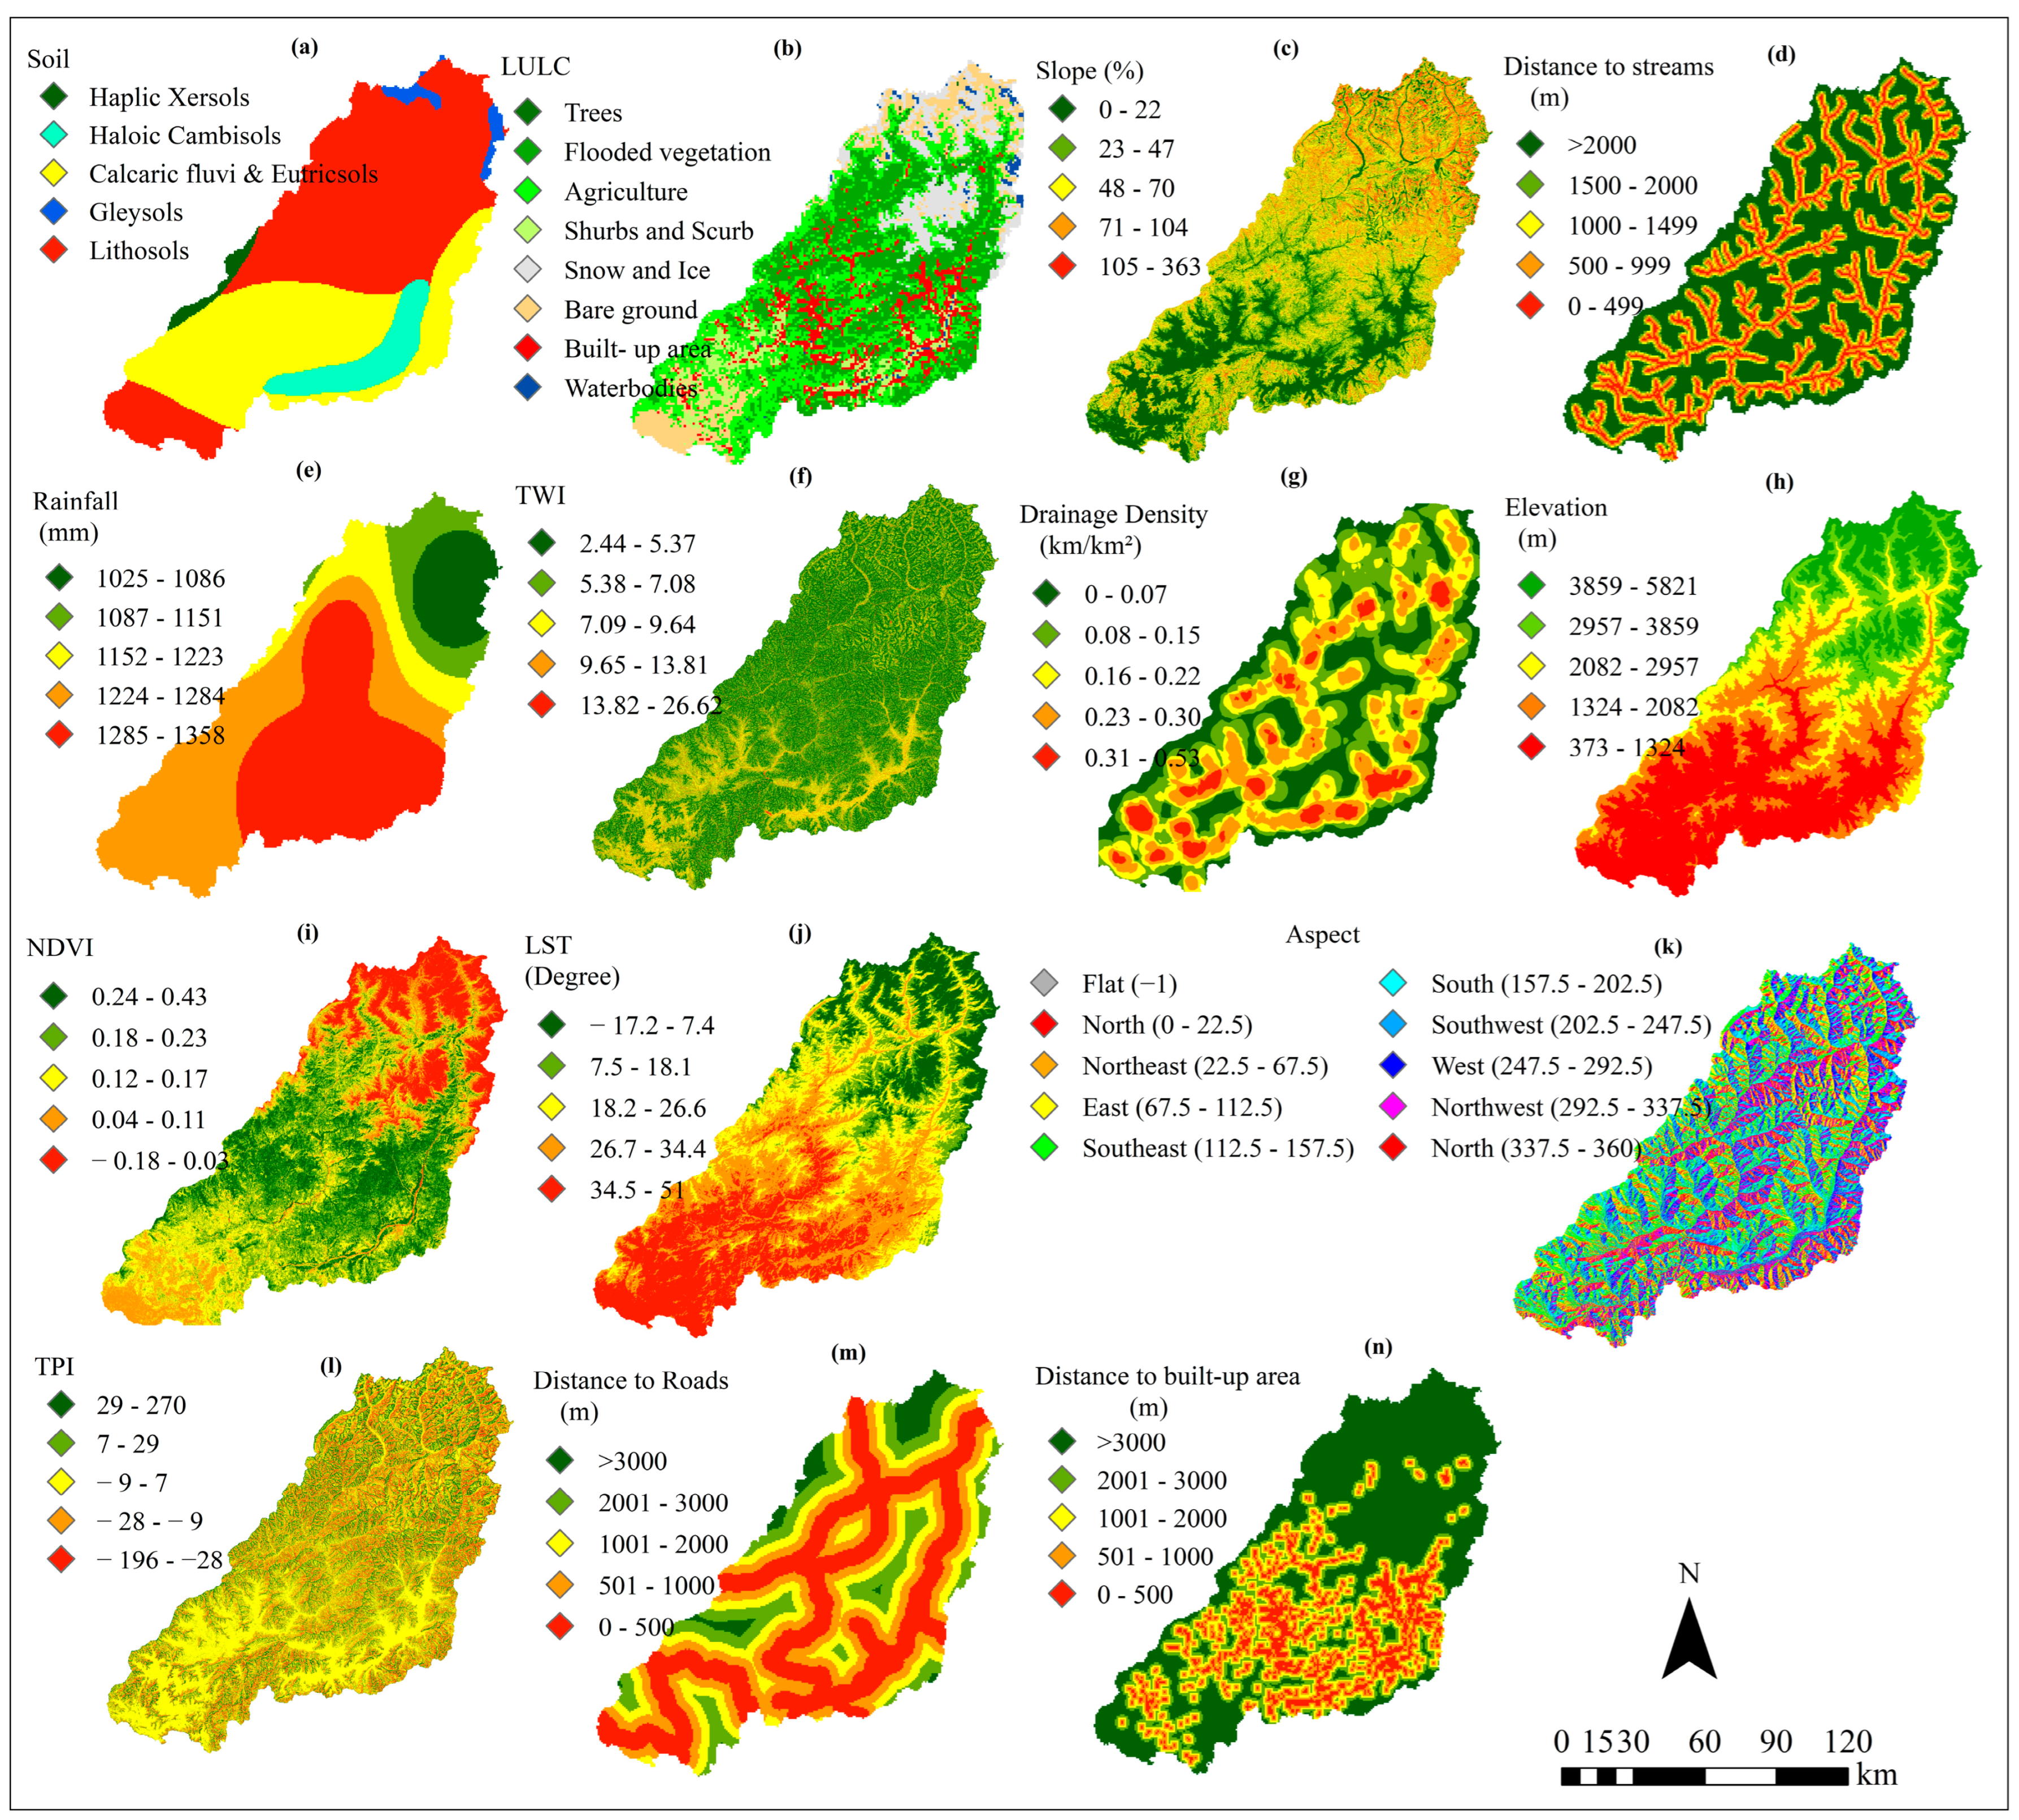
Soil information is an important input variable for flood susceptibility mapping. Numerous soil surface textures and chemical and physical characteristics are needed, such as bulk density, hydraulic conductivity of the soil, and available moisture content (AMC). The soil map of the area was prepared using the IPCC global soil classification data. The research area comprises a diverse range of soil types, including Lithosols, Haloic Cambisols, Haplic Xerolosols, Gleysols, Calcaric Fluvisols, and Eutricsols, as shown in Figure 4a. According to the type of soil, 1.58% (220.48 km2), 7.48% (1043.32 km2), and 35.75% (50.1419 km2) areas were very low, low, and moderately vulnerable to flood, respectively. The very low, low, and moderate vulnerable areas to flood occur in the east, south, west, and middle parts of the study region. Moreover, 1.91% (266.74 km2) of the area is very high, and 53.28% (7435.39 km2) is highly vulnerable to flooding. The soil-type map shows that a little more than half of the research area occurs within high flood susceptibility.
Such results are in line with past studies that indicate that soil properties are the dominant factors in mapping flood susceptibility. Gleysols and Calcaric Fluvisols are generally linked to low drainage rates and low groundwater levels, which amplify surface runoff and water stagnancy in the occurrence of heavy raindrops. The similarity of the space dominance in high flood potential during the fine-textured and alluvium soils is reported in mountainous catchments within South Asia, which argues for consistency of the soil-based susceptibility trends in this paper.

3.1.2. Land Use Land Cover (LULC) and Accuracy Assessment

The LULC map of the MDC was created by using the Dynamic World V1 dataset on Google Earth Engine. The LULC information used in this study was obtained from the Dynamic World V1 dataset, a 10 m near-real-time global LULC product derived from Sentinel-2 imagery. Dynamic World provides per-pixel class probabilities and labels for nine land cover classes and is available from 2015 onward. The imagery between 1 January 2021 and 1 January 2022 had been filtered across the basin boundary, and a mode composite of the land cover label band was generated to derive the most common land cover class at each pixel. LULC impacts on infiltration rates and regulates surface groundwater interactions of the region [17,56]. The built-up area reduces the infiltration rate, as it increases the susceptibility to flooding. The various classes of land use and land cover of the study region are presented in Figure 4b. The LULC map shows that 0.18% (25.14 km2), 30.12% (4205.40 km2), 29.46% (4114.42 km2), 5.95% (830.44 km2), 11.34% (1583.80 km2), 11.76% (1641.50 km2), 9.84% (1374.05 km2), and 1.36% (189.39 km2) area were trees, flood vegetation, agriculture, shrubs and scrubs, snow and ice, bare ground, built-up area, and waterbodies, respectively. Mostly, the study region covers flooded vegetation and agriculture. Conversely, the waterbodies, barren land, and built-up area collectively cover an area of 22.95% (3204.94 km2), which is highly susceptible and occurs in the south, north, and central parts of the region.
The dominance of high flood-prone areas in the built and barren land areas is consistent with the large body of literature that illustrates the influence of impervious surfaces being on the rise in runoff and decreasing in infiltration. Similar outcomes were documented in flood susceptibility analysis studies in Pakistan and nearby areas, where the fast increase in urbanization and the change in land cover made the flood risk very high [57].
To evaluate classification accuracy, random validation points were generated within the basin and visually interpreted using high-resolution satellite imagery available in GEE and Google Earth Pro. A confusion matrix was then constructed to compare the reference data with the classified map, from which overall accuracy, producer’s accuracy, and user’s accuracy were calculated (Figure S1).
As this study used Dynamic World as an existing LULC input dataset, the study relied on the published validation reported by the dataset developers and subsequent independent comparison studies. Previous assessments indicate that Dynamic World has moderate to good overall accuracy at the global scale, although performance varies across classes and regions, with reduced reliability reported in heterogeneous landscapes. Therefore, the results of the present study should be interpreted with this limitation in mind. A statistically robust local validation would require a sufficiently large, stratified, and representative reference sample, which was beyond the scope of the current work [58,59,60].

3.1.3. Slope (SL)

The slope ranges from steep to gentle due to the topography of the study area, which is surrounded by mountains. Figure 4c illustrates the SL map of the study area, showing that 23.30% (3251.94 km2), 28.98% (4044.18 km2), and 28.71% (4007.00 km2) areas were very low, low, and moderately vulnerable to flood, respectively. The low and very low vulnerable areas occurred in the western and southern sectors of the study region. The very high and highly vulnerable areas to flood were 16.15% (2253.37 km2) and 2.87% (399.91 km2), respectively, and were found in the central and northern sectors. Most of the study area is characterized by flat to low-slope terrain, which is less susceptible to flash floods. Conversely, the highly susceptible area to flooding in the region falls within steep slopes. Furthermore, most of the study region falls within low and moderate flood hazard zones due to the presence of gentle slopes.
These findings are consistent with past studies in which low slopes and flat landscapes have been found to develop higher flood levels as they have a lower runoff speed, and steep slopes have high drainage and low water retention. The slope–flood correlations have also been reported in Himalayan and Hindukush catchments, which validates the uniformity in the slope-related patterns of the observed susceptibility.

3.1.4. Distance to Streams (DS)

DS is another crucial factor in flood susceptibility, with floods being more severe in areas closer to the main streams. The stream network of the study region is mostly spread throughout the area, as shown in Figure 4d, with many streams and a large portion of the area surrounded by them. The DS map reveals that 47.89% (6689.79 km2), 11.05% (1543.72 km2), and 7.78% (1089.42 km2) areas were very low, low, and moderately vulnerable to flood, respectively. Moreover, 21.67% (3028.08 km2) and 11.57% (1616.75 km2) of the area are categorized as highly and very highly vulnerable to floods, respectively. According to the distance to stream map, most of the region has low susceptibility to flooding.
The geographical clustering of the high flood in proximity to the stream networks is supported by previous research that suggests that proximity to rivers is one of the most vital factors of flood occurrence [61]. It has been found that higher inundation frequencies in mountainous river basins have been observed to happen in regions near streams because of channel overflow and backwater impacts when a river is at its peak discharge.

3.1.5. Rainfall (R)

Rainfall is a direct determinant of the amount of runoff produced at the ground surface. According to the classification of rainfall, 9.56% (1333.11 km2) of the study area was classified with very low flood susceptibility, 8.48% (1183.57 km2) as low, 10.21% (1424.04 km2) as moderate, 34.79% (4853.53 km2) as high, and 36.96% as very high flood susceptibility. As indicated in Figure 4e, areas with elevated to extreme flood risk, which constitute 71.75% (10,009.57 km2), have been found in the central and southern parts of the study area. In addition, approximately 2/3 of the research area has high susceptibility, as indicated by the rainfall map. The low susceptibility areas, amounting to 18.04% (2516.69 km2), are in the north sector of the area, which means that it has relatively low rainfall intensity or a good drainage rate.
The high and very high rates of susceptibility areas in regions receiving high amounts of precipitation are aligned with the existing knowledge, according to which the concentration and duration of the precipitation are the core issues that determine the occurrence of flash floods. The same tendencies of rainfall-related susceptibility have been mentioned in flood-related areas in northern Pakistan and the upper Indus basin.

3.1.6. Topographic Wetness Index

The topographic wetness index (TWI) has a positive relationship with flood susceptibility, as a larger value of the TWI normally denotes a region with more water and, therefore, more prone to flooding. The TWI-based categorization showed that 36.52% (5084.94 km2) of the study area is characterized by very low, 39.55% (5508.19 km2) by low, and 17.11% (2383.57 km2) by moderate susceptibility. In the meantime, 5.45% (759.15 km2) and 1.37% (190.92 km2) of the land are classified as high and very high susceptibility zones, respectively. The TWI map shows that most of the study area falls under a low flood risk. In general, low flood susceptibility is found in over two-thirds of the region, 76.07% (Figure 4f).
High values of a low TWI confirm a high level of surface drainage and low saturation of the soil, which is in line with the previous findings of hydrological activity. Flood hotspots in areas characterized by complex terrain and high TWI values have been widely identified as strong predictors of flood initiation.

3.1.7. Drainage Density (DD)

The landscape of the study region contains numerous streams, increasing its susceptibility to floods. The drainage density map shows that 26.19% (3618.3 km2), 25.05% (3460.35 km2), and 23.51% (3248.64 km2) areas were very low, low, and moderately vulnerable to flood, while 19.11% (2640.32 km2) and 6.13% (847.16 km2) areas were very high and highly vulnerable to flooding, respectively. Mostly, the very high and high drainage density occurred in the central sector of the area, which is near the built-up area, as shown in Figure 4g. According to the DD map, 25.24% (3487.48 km2) of the area is highly vulnerable to floods, while 51.24% (7078.65 km2) has low susceptibility to floods.
Higher drainage density and flood susceptibility have a positive relationship in this study, which will be determined in accordance with previous studies that see dense drainage networks as an element that may increase the rate of runoff concentration and reduce response time during rainfall. Other comparable spatial patterns have been found in catchment-level flood susceptibility evaluations in Asia.

3.1.8. Elevation (EL)

EL is an important factor for flow direction and depth of flooding, influencing water movement and accumulation patterns. High EL occurs in the eastern part, as shown in Figure 4h. The EL map indicates that 33.30% (4645.17 km2) and 22.36% (3119.34 km2) areas are very high and highly vulnerable, while 13.33% (1859.97 km2), 14.48% (2020.03 km2), and 16.52% (2304.88 km2) are very low, low, and moderate vulnerable to flood, respectively. The highly susceptible class covering an area 55.66% (7764.52 km2) occurred in the southern part of the study region. The elevation map reveals that the low susceptibility of floods occurs in the northern part and some portions in the middle, having an area of 3880.00% (27.81 km2). Moreover, the study region covers about half of the areas exposed to flooding.
The concentration of high flood susceptibility in low-elevation zones supports previous findings that low-lying areas act as natural accumulation zones for surface runoff and floodwaters. This elevation–flood relationship has been consistently observed in mountainous watersheds, validating the elevation-based susceptibility patterns derived in this study.

3.1.9. Normalized Difference Vegetation Index (NDVI)

The NDVI is negatively correlated to flood susceptibility. The NDVI map shows that 17.11% (2388.99 km2), 27.91% (3895.79 km2), and 24.45% (3412.32 km2) areas were very low, low, and moderately vulnerable to flood, respectively. The low susceptibility area of 45.03% (6284.78 km2) is in the middle, eastern, and western sectors, with a small portion in the southern part of the study region. The 14.19% (1981.18 km2) and 16.32% (2278.07 km2) areas were very high and highly susceptible to flooding of the study region, respectively. High (0.18–0.23) and very high (0.24–0.43) NDVI values are predominantly observed in the northern part of the study area, with smaller patches also present in the southern sector (Figure 4i).
The inverse relationship between the NDVI and flood risks agrees with the available literature, indicating the protective behavior of vegetation in the improvement of infiltration and diminishing overland flow. A similar pattern of the NDVI and flood susceptibility has been reported in both tropical and subtropical catchments, which confirms the ecological importance of vegetation cover in mitigating floods.

3.1.10. Land Surface Temperature (LST)

The LST is also a critical issue for the valuation of flood susceptibility. According to the LST map, areas with 24.03% (3354.28 km2), 28.49% (3976.72 km2), 22.73% (3171.98 km2), 12.58% (1755.81 km2), and 12.16% (1697.48 km2) were classified as very high, high, moderate, low, and very low vulnerable to flood, respectively. The highly vulnerable zone to floods covers an area of 52.53% (7331.00 km2) in the central and southern parts of the region, while the low susceptibility flood zone is distributed across its northern sector, as shown in Figure 4j.
The spatial dominance of high flood susceptibility in areas with lower LST values reflects the link between surface moisture and flood potential, as highlighted by previous research. LST has increasingly been used as a proxy for surface wetness in flood susceptibility modeling, and the results of this study further support its relevance.

3.1.11. Aspect (A)

Aspect is also a crucial factor for the assessment of flood susceptibility. It shows the direction of the slope. The aspect map showed that 20.59% (2873.84 km2), 18.57% (2592.52 km2), 20.98% (2928.57 km2), 20.95% (2923.35 km2), and 18.90% (2638.13 km2) of the area were very low, low, moderate, high, and very highly vulnerable to flood, respectively. The aspect map of the research is shown in Figure 4k.
The combined effect of aspect on flood susceptibility experienced in the current research is in line with prior analyses, indicating that the slope orientation has an indirect impact on the soil moisture due to the varying solar radiation and evapotranspiration [62]. Aspect-related variability has also been noted to be similar in mountainous areas where microclimatic effects affect runoff generation.

3.1.12. Topographic Position Index (TPI)

The TPI is a very important topographic parameter in determining flood susceptibility since it affects the way water gathers or disperses on land. The classification of the study area based on the TPI showed that 8.93% of the area (1246.89 km2) has been classified as very low, 22.45% (3132.78 km2) as low, 39.84% (5560.21 km2) as moderate, 21.05% (2937.28 km2) as high, and 7.73% (1079.23 km2) as very high. The low susceptibility areas, which make up 31.38 percent (4379.69 km2), are randomly distributed throughout the study zone, whereas areas with elevated and extreme vulnerability, amounting to 28.78 percent (4016.52 km2), are also present. These findings underscore the significance of the TPI in determining sites that are susceptible to water collection, usually at the valley bottoms or at the lowest depressions, which are most likely to experience flash flooding. Figure 4l shows the TPI map of the investigated area: areas classified as high FS with low or negative TPI values indicate that valley bottoms and concave terrains are more susceptible to water accumulation and flash floods [63].

3.1.13. Distance to Roads (DR)

Areas near roads are more vulnerable to flooding due to increased surface runoff and reduced infiltration. According to the distance to roads map, areas with 4.66% (652.11 km2), 14.80% (2066.87 km2), and 19.40% (2710.48 km2) were very low, low, and moderately vulnerable to flood, respectively. Conversely, the area with 26.06% (3640.07 km2) was highly vulnerable, and 35.06% (4898.22 km2) was at the highest risk of flooding, respectively. The roads of the study region are distributed randomly, as shown in Figure 4m. In the DR map, it is found that over half of the study is at great risk of flooding. The elevated flood susceptibility near road networks supports earlier studies indicating that roads disrupt the natural drainage pathways and enhance localized water accumulation [64]. Similar patterns have been observed in rapidly developing regions, where transportation infrastructure significantly modifies surface hydrology.

3.1.14. Distance to Built-Up Area

Regions around urbanized areas are usually more prone to floods due to decreased infiltration and increased surface runoff. Figure 4n maps the distance to built-up areas, showing that 10.11% (1412.53 km2) and 16.89% (2360.03 km2) were very high and highly vulnerable, while areas with 45.67% (6380.61 km2), 13.68% (1910.96 km2), and 13.65% (1906.54 km2) were very low, low, and moderately vulnerable to flood, respectively. The highly vulnerable area, 27.00% (3772.56 km2) to floods, occurs mostly in the central, southern, and eastern parts of the study region. In contrast, the low vulnerable areas covering 59.35% (8291.57 km2) fall across the northern and western parts. Moreover, distance to the built-up areas indicates that east of the study area, over half of the location lies in the low flood-prone area.

3.2. Multi-Criteria Analysis and Weights of Factors

A scale of criteria weights ranging between 1 and 9 was given, as shown in Table 2. The eigenvalue method of the analytical hierarchy process (AHP) was used in the normalization of each criterion and corresponding feature classes. A 14 × 14 pairwise comparison table, where the diagonal items are set to 1, was made and is provided in Table 3. GNU Octave was used to calculate the consistency ratio (CR), and the reported value of 0 is way below the acceptable level of 0.1 [65,66,67]. Further, the CR value illustrates the completeness of the matrix. This very low CR value implies a high level of agreement among the pairwise comparisons, thus justifying the reliability of the assigned weights. The AHP usage does not only entail the use of expert judgment but also provides a systematic and statistically valid process of decision-making. The strong framework of evaluation contributes to the credibility of the flood susceptibility analysis results of this work, and the outcomes are more reliable for making appropriate planning and risk management.
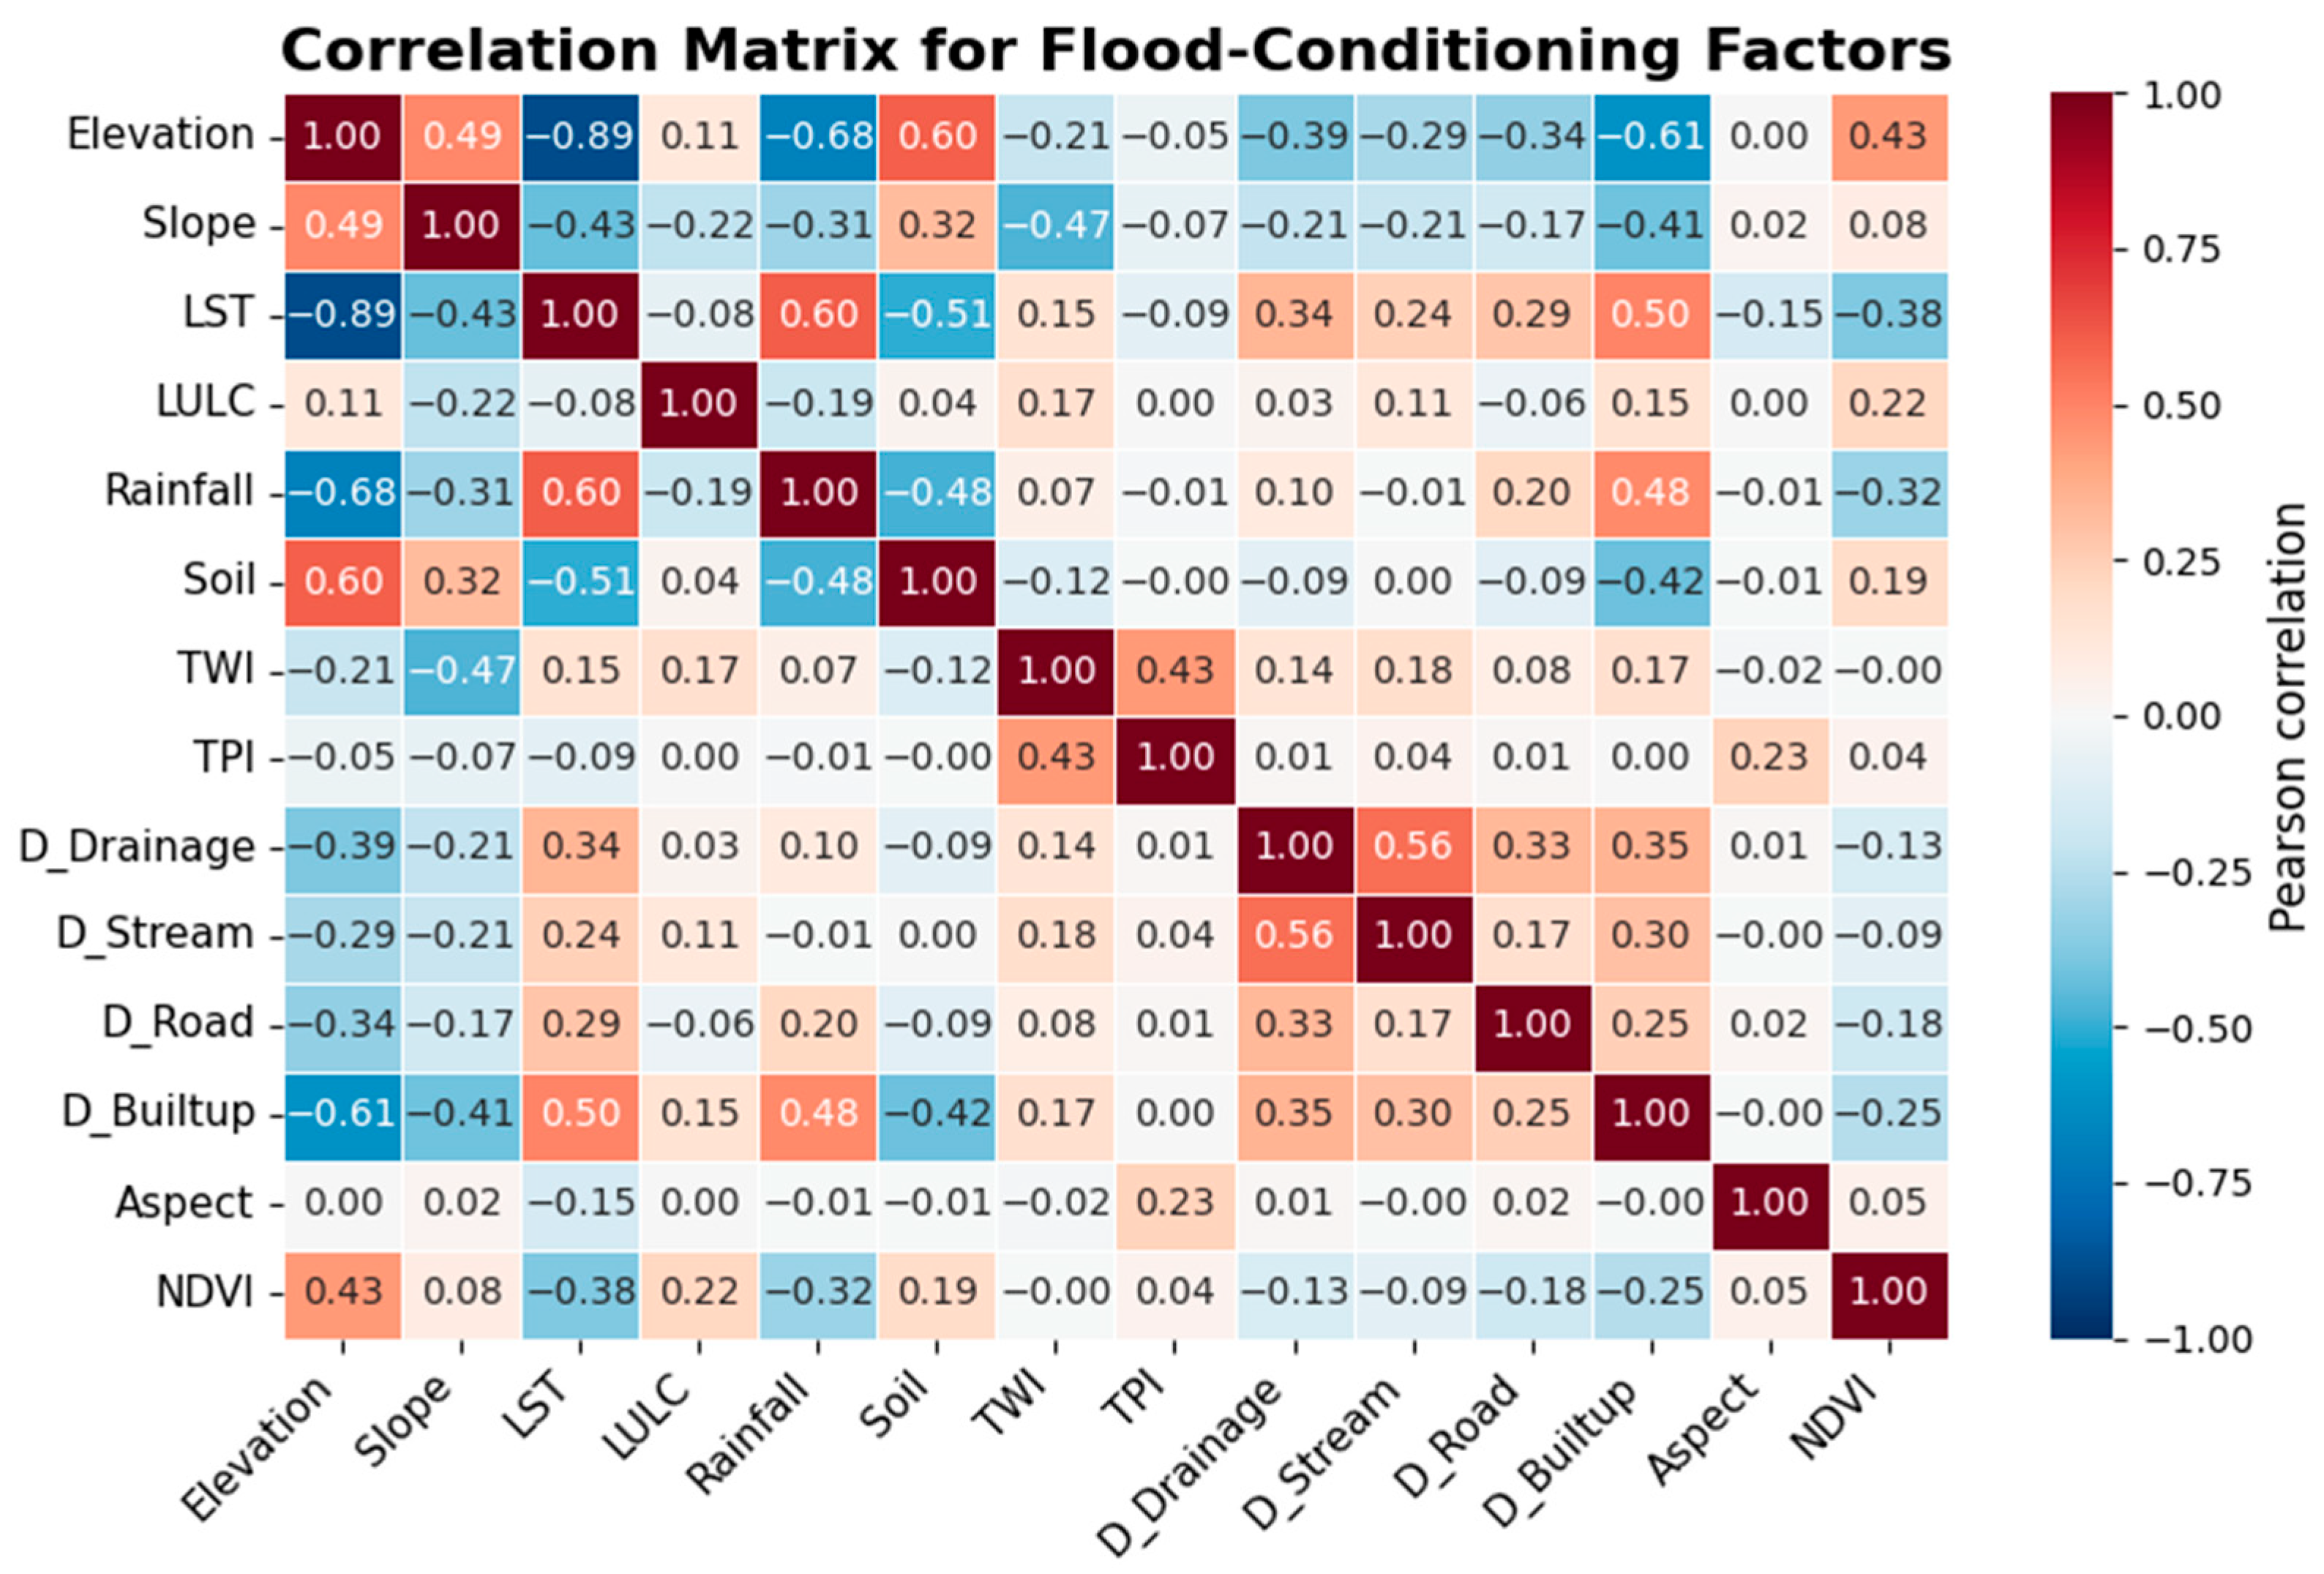
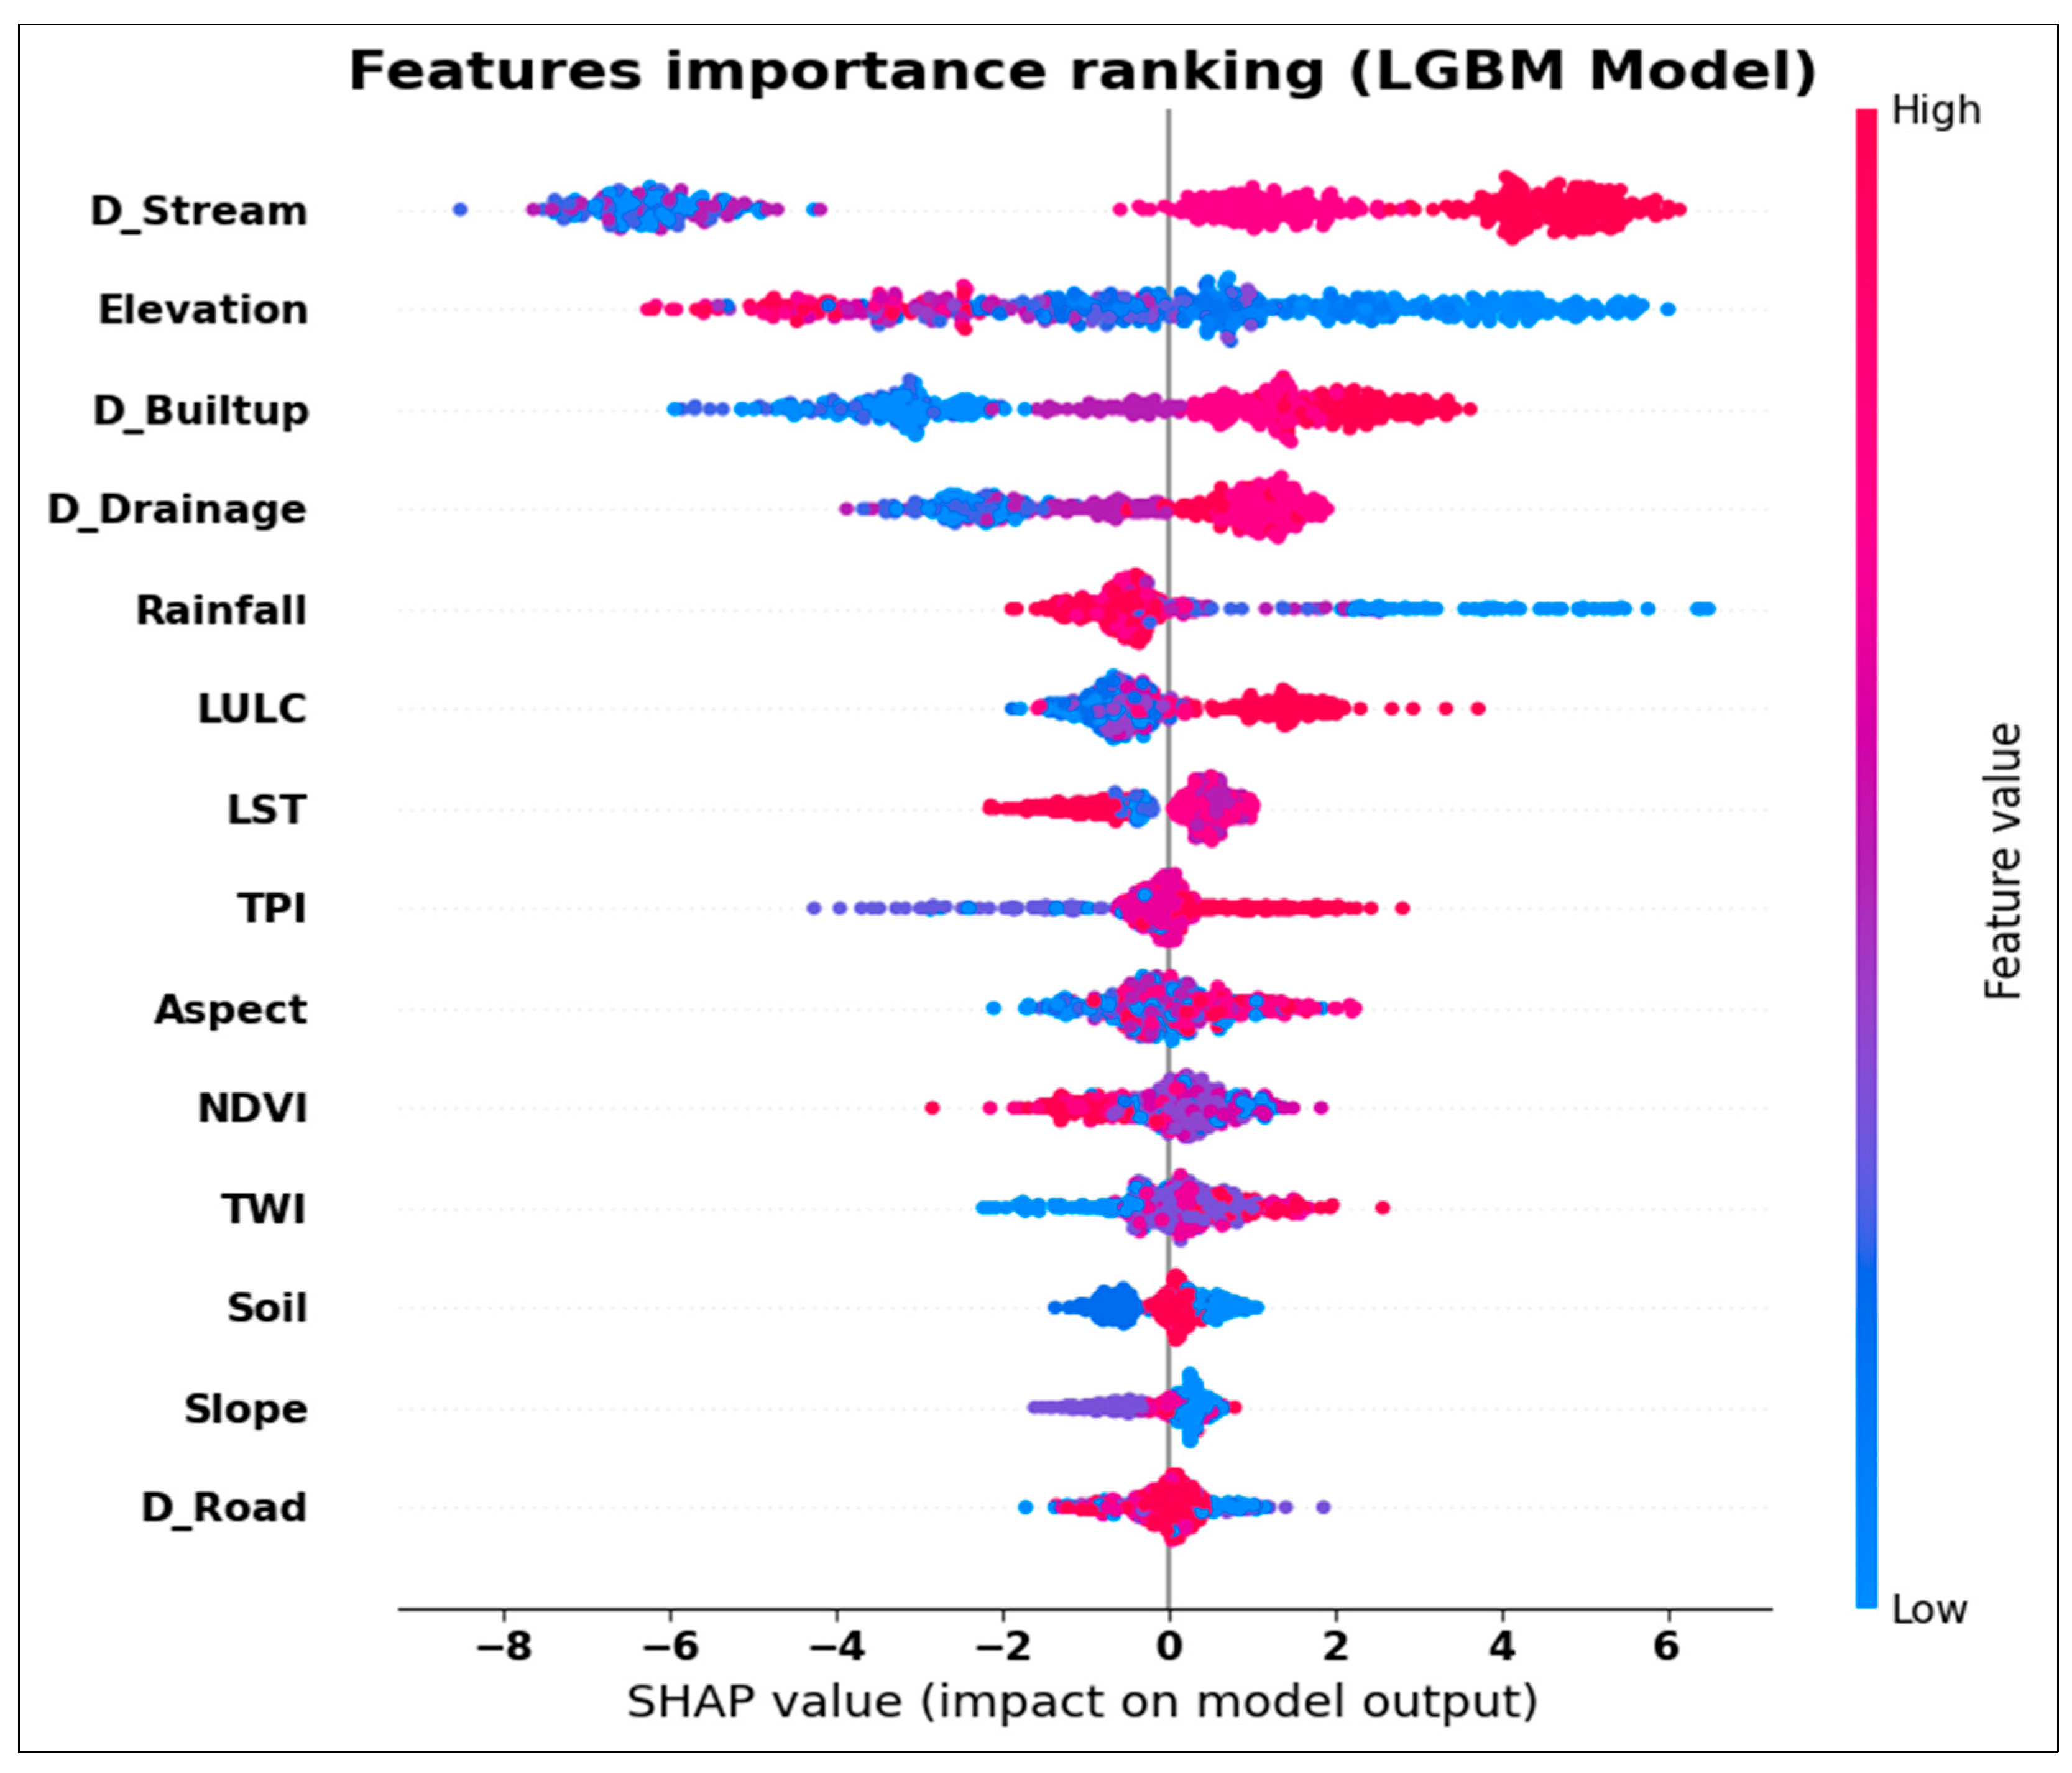
In Figure 5, the correlation matrix reveals notable relationships among 14 variables. Some degrees of multicollinearity, most variables show weak to moderate correlations, indicating that each factor provides unique information to the model. Figure 6, illustrates that the SHAP analysis indicates that distance to stream, elevation, and distance to built-up areas are the most influential variables, demonstrating that proximity to drainage networks and terrain characteristics strongly affect flood potential. Rainfall, drainage density, and slope also contribute significantly, although their effects vary spatially. Factors such as land surface temperature (LST), topographic position index (TPI), soil, normalized difference vegetation index (NDVI), and land use/land cover (LULC) exhibit comparatively lower influence. The integration of SHAP-based feature importance and correlation analysis confirms that hydrological proximity and terrain attributes are key drivers of flood susceptibility.

3.3. Flood Susceptibility

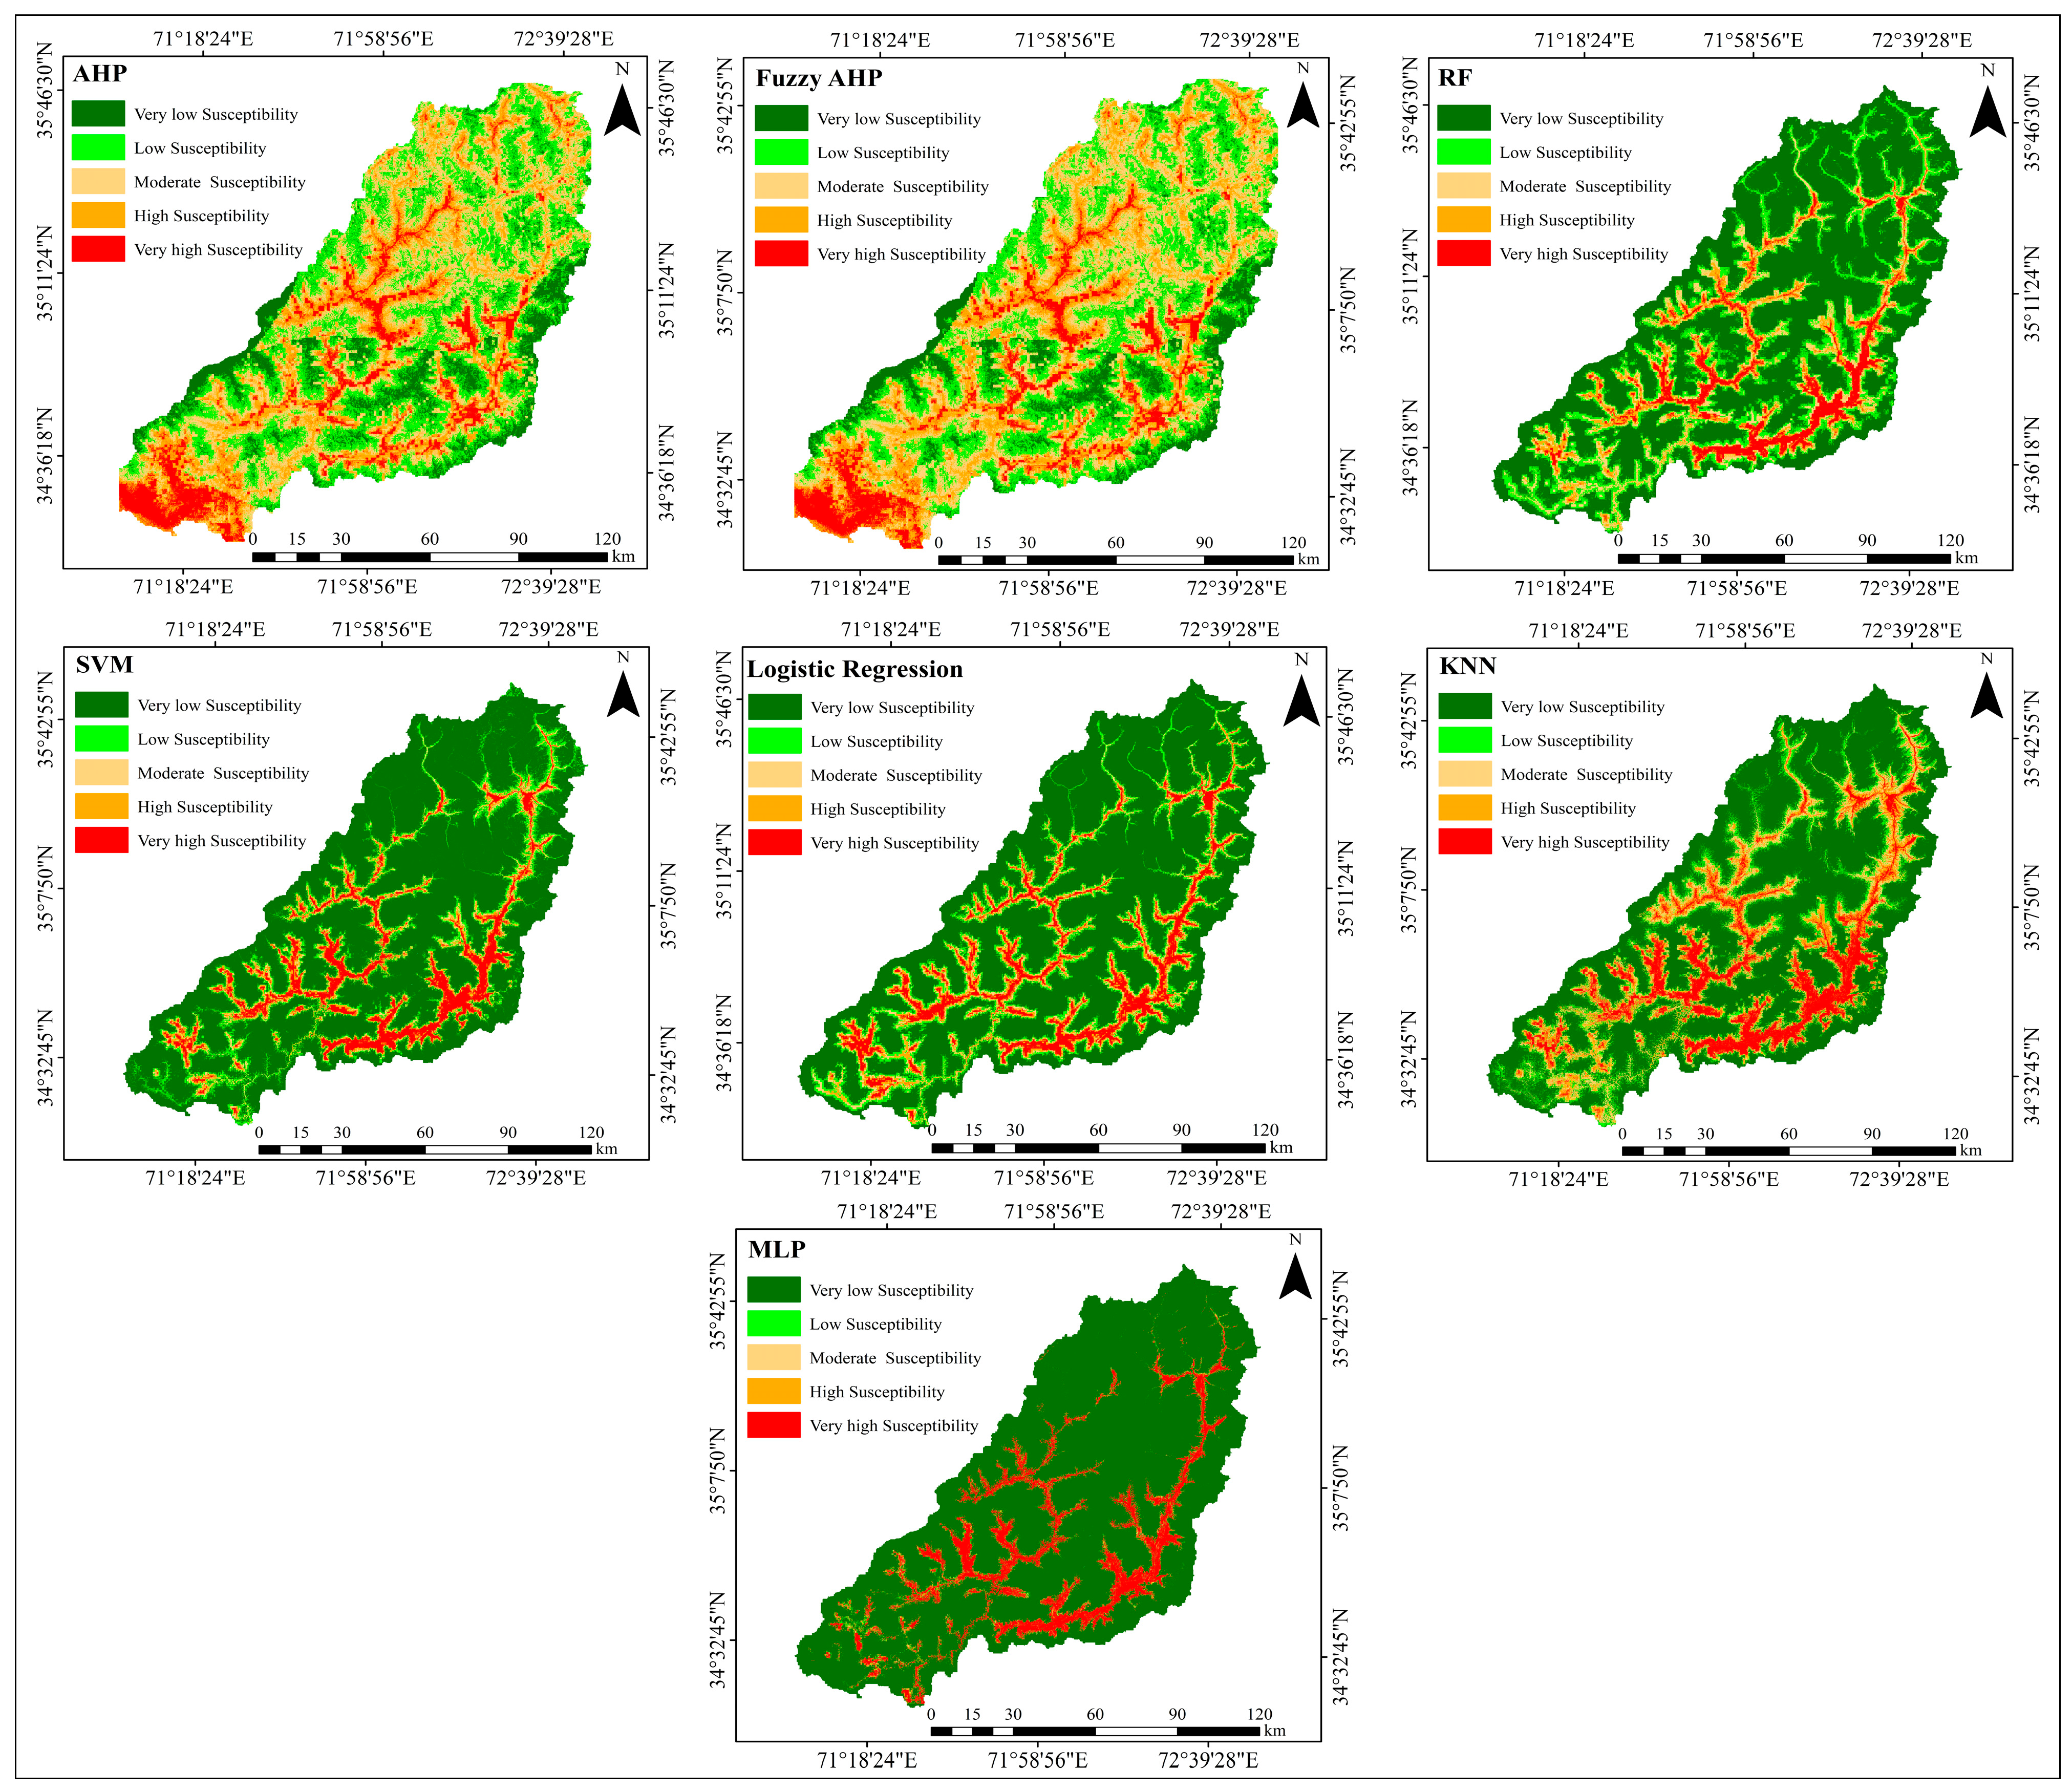
The values of the susceptibility index were 3.419 to 6.667 by using AHP, and they were classified as very low (3.4196.667), low (4.7955.113), high (5.4955.794), and very high (6.667), as shown in Figure 7. The analysis shows that 10.13% (1381.92 km2) of the area under study belongs to the very high susceptibility category, and 21.55% (2938.48 km2) of the area belongs to the highly vulnerable category. These are quite localized in the central, southern, eastern, and northern sections of the area, especially along stream channels and in urban and bare land areas where surface runoff is more enhanced, with limited infiltration capacity. Conversely, the very low 11.55% (1575.18 km2), low 26.66% (3637.05 km2), and moderate 30.10% (4105.13 km2) susceptibilities are more broadly distributed, with the moderate component occupying the largest percentage of the area.
The fuzzy-based AHP values of the flood susceptibility index were 3.51–6.94, considered to be very low (3.51–4.63), low (4.64–4.98), moderate (4.99–5.31), high (5.32–5.70), and very high (5.71–6.94), as shown in Figure 7. These findings indicate that the portion under the very high susceptibility area is 10.18% (1388.35 km2), with the highly vulnerable area amounting to 20.84% (2841.44 km2). These areas are characterized by spatial distributions like those found in the AHP model and occur in the drainage channels as well as urbanized and barren zones. In the meantime, the more localized classes of 12.21% (1665.68 km2), 27.51% (3751.22 km2), and 29.26% (3991.08 km2) constitute an even greater area in the region, with the latter being the largest. The AHP and Fuzzy AHP models exhibit smoother transitions between susceptibility classes due to the deterministic weighting structure of the multi-criteria decision analysis. Comparatively, the machine learning models (RF, SVM, KNN, LR, and MLP) offer compressed and clear high susceptibility areas, especially along drainage networks. Random forest and multi-layer perceptron have a more pronounced delineation of flood-prone areas, and their ability to elicit nonlinear relationships between flood-conditioning factors is high, indicating these machine learning models are the most effective. In general, machine learning models have greater predictive ability and spatial discrimination regarding flood susceptibility mapping, compared to the AHP-based methods of providing interpretable patterns of susceptibility.

3.4. Model Performance Evaluation Using ROC Analysis

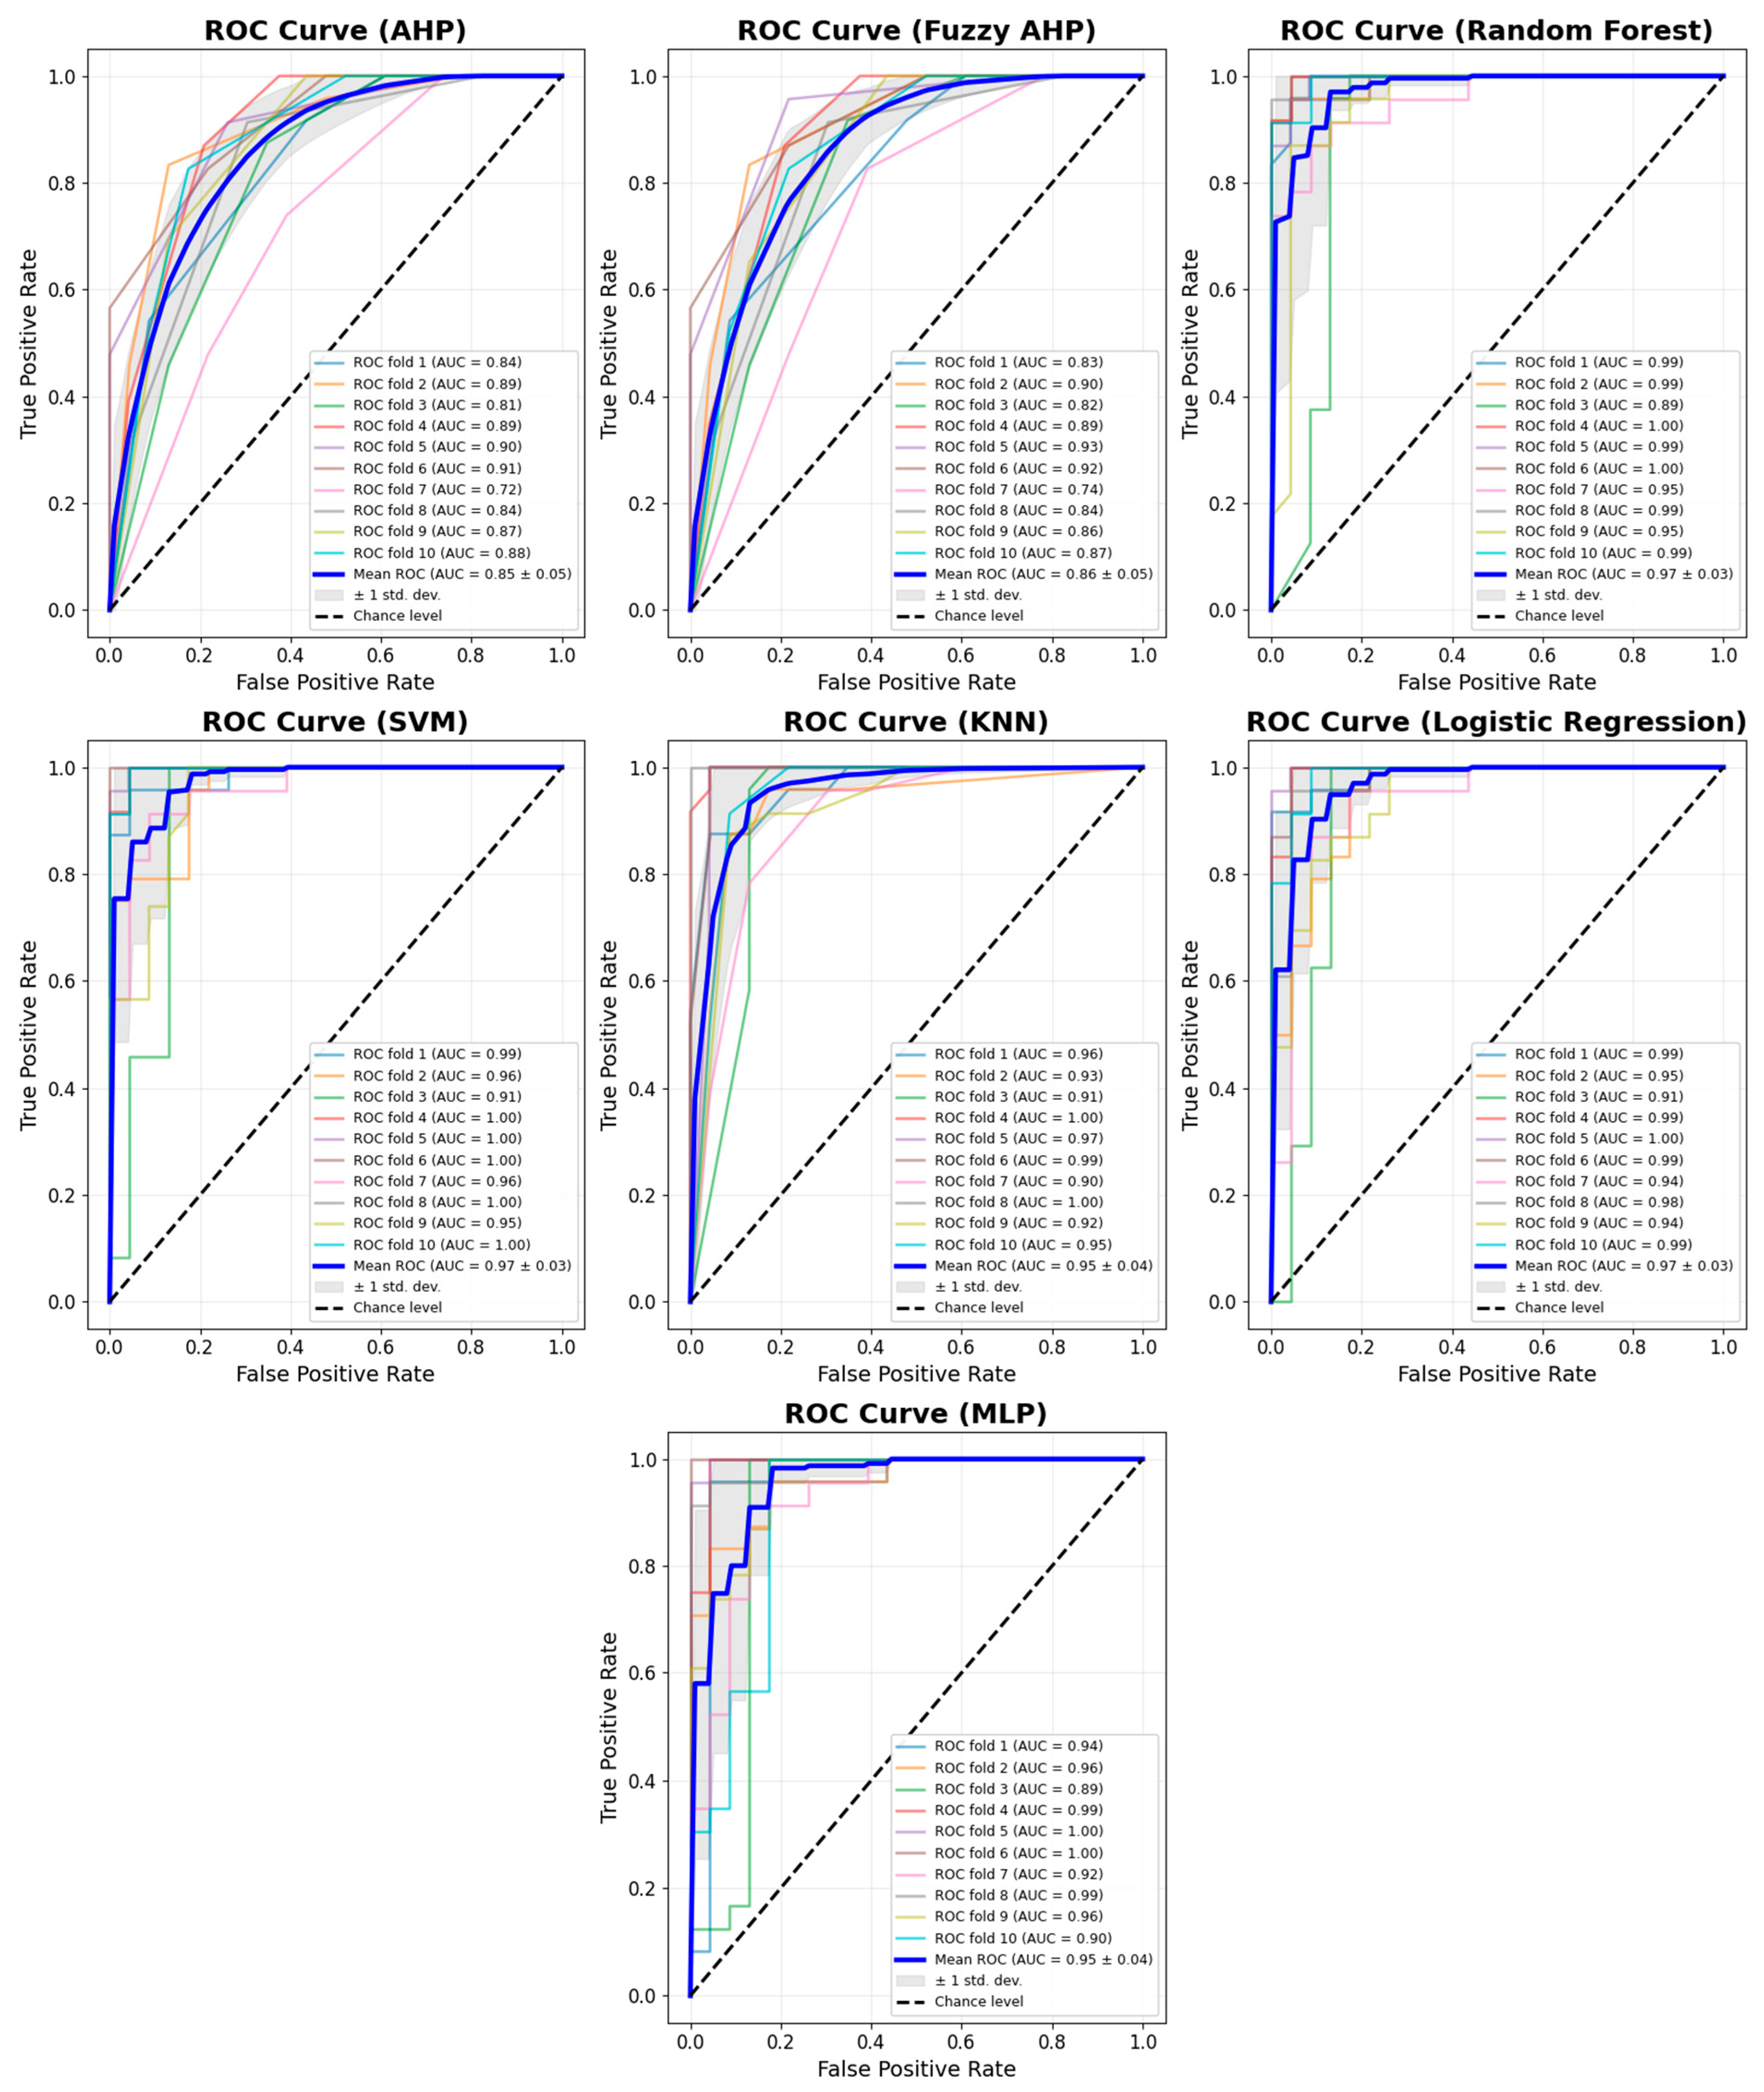
The flood susceptibility models were evaluated in terms of predictive performance using receiver operating characteristic (ROC) curves and the area under the curve (AUC), as shown in Figure 8. The two GIS-based multi-criteria approaches also showed good prediction performance (mean AUC of 0.85 ± 0.05 for AHP, and 0.86 ± 0.05 for Fuzzy AHP). In contrast, machine learning models exhibited excellent performance. The mean values of AUC using 10-fold cross-validation for random forest (RF) and support vector machine (SVM) were 0.97 ± 0.03, logistic regression (LR) 0.97 ± 0.03, K-nearest neighbors (KNN) 0.95 ± 0.04, and multi-layer perceptron (MLP) 0.95 ± 0.04. In each Figure 8 section, bold lines and shaded regions represent the mean ROC curves and mean ± 1 standard deviation, respectively, and the lines in color describe the ROC curves for individual folds.
Compared with existing flood susceptibility studies, the superior performance of ML models in this research aligns with broader findings that ensemble- and classification-based techniques typically outperform traditional MCDA approaches such as AHP in flood risk prediction. For example, hybrid ML methods generally yield higher AUC values, reflecting improved discrimination between areas at risk of flooding and those not affected, compared to standalone AHP approaches in other basins (e.g., AHP models showing AUCs from ~0.75 to ~0.90). The excellent performance of RF and SVM in this study is consistent with similar ROC-based evaluations in flood and flash flood mapping literature, where machine learning algorithms consistently exhibit robust predictive capabilities, AUC > 0.90 by Chen et al. [61]. The differences in AUC values between MCDA and ML models suggest that ML algorithms better capture complex, nonlinear relationships among flood-conditioning factors, whereas linear weighting schemes and expert subjectivity constrain AHP and Fuzzy AHP. However, the relatively strong performance of AHP methods in this study also reflects their continued utility in environments with limited data or when interpretability is prioritized over predictive complexity. Overall, the results highlight the capacity of advanced ML techniques for operational FS mapping and reinforce the value of ROC–AUC as a rigorous performance metric in comparative model evaluation.
The close agreement between the AHP- and FAHP-derived flood susceptibility maps is consistent with earlier comparative studies showing that FAHP retains the overall spatial pattern of AHP-based results while better handling uncertainty and ambiguity in expert judgment through fuzzy pairwise comparisons. Comparative flood studies have also reported modest but meaningful performance gains for FAHP over conventional AHP, suggesting that FAHP is particularly useful in complex terrains where flood-conditioning factors are heterogeneous and difficult to weight precisely [68].

4. Discussion

4.1. Comparative Performance of AHP-Based and Machine Learning Models

The multi-criteria decision analysis (AHP and Fuzzy AHP) and machine learning (ML) models are compared in terms of their advantages and disadvantages, as well as in terms of their complementarity in flood susceptibility mapping. AHP-based models are very useful in combining expert information and physical insights on factors of flood-conditioning, which generate spatially coherent patterns of susceptibility that are consistent with geomorphological and hydrological processes. The fact that the consistency ratio is very low in the current study also confirms the strength and soundness of the weighting schemes by experts.
On the contrary, machine learning models have been shown to better represent nonlinear and complicated relationships between conditions and the occurrence of floods and frequently achieve greater predictive power in the validation stage [36,37,69,70,71,72]. ML techniques are empirical and less reliant on subjective weighting, which enables them to adjust to the complex interplay of topographic, hydrological, and anthropogenic variables. The quality, quantity, and representativeness of training data, however, have a strong impact on their performance [53,54,73].
The comparison shows that although AHP and Fuzzy AHP have good interpretability and conceptual transparency, machine learning models have better predictive abilities. Therefore, the approach to applying MCDA-based algorithms to machine learning systems has been commonly accepted as a powerful approach to flood susceptibility analysis, where physical reasoning is complemented by data optimization [64,74,75,76]. Such a mixed approach has made the flood risk mapping process more reliable and practical in disaster management and spatial planning.
Compared with previous flood susceptibility studies conducted in Pakistan and elsewhere, the present study employed a broadly similar set of commonly used flood-conditioning factors, including elevation, slope, land use and land cover, drainage-related variables, rainfall, soil characteristics, and vegetation indices. This indicates consistency with the established literature, where such factors are widely recognized as important controls on flood occurrence. Similar findings were reported by Haider et al. [77] in Pakistan, who identified slope, elevation, drainage density, and land use and land cover as dominant predictors of flood-prone zones. Likewise, Masood et al. [78], in a regional flood susceptibility assessment, found that low-lying terrain, proximity to drainage networks, and anthropogenic land modification strongly influenced flood occurrence. In another comparable study, Khan et al. [79] and Waleed et al. [14] showed that machine learning models such as random forest and support vector machine achieved strong predictive performance when applied with topographic, hydrologic, and land cover variables, which is consistent with the results obtained in the present study. However, the present study differs from many earlier works in its integrated use of both multi-criteria decision analysis techniques (AHP and FAHP) and multiple machine learning models within the same analytical framework. This combination enabled a comparison between expert-driven and data-driven approaches and provided a more robust evaluation of flood-prone areas. The resulting susceptibility patterns are generally in agreement with earlier studies, particularly in identifying low-lying terrain, poorly drained zones, and intensively modified land areas as highly susceptible to flooding. Nevertheless, some differences in the ranking of conditioning factors and in model predictive performance were observed when compared with other studies. These variations may be attributed to differences in regional characteristics, data resolution, temporal coverage, inventory quality, and model structure [80,81].

4.2. Trend Analysis of Land Surface Temperature and Normalized Difference Vegetation Index

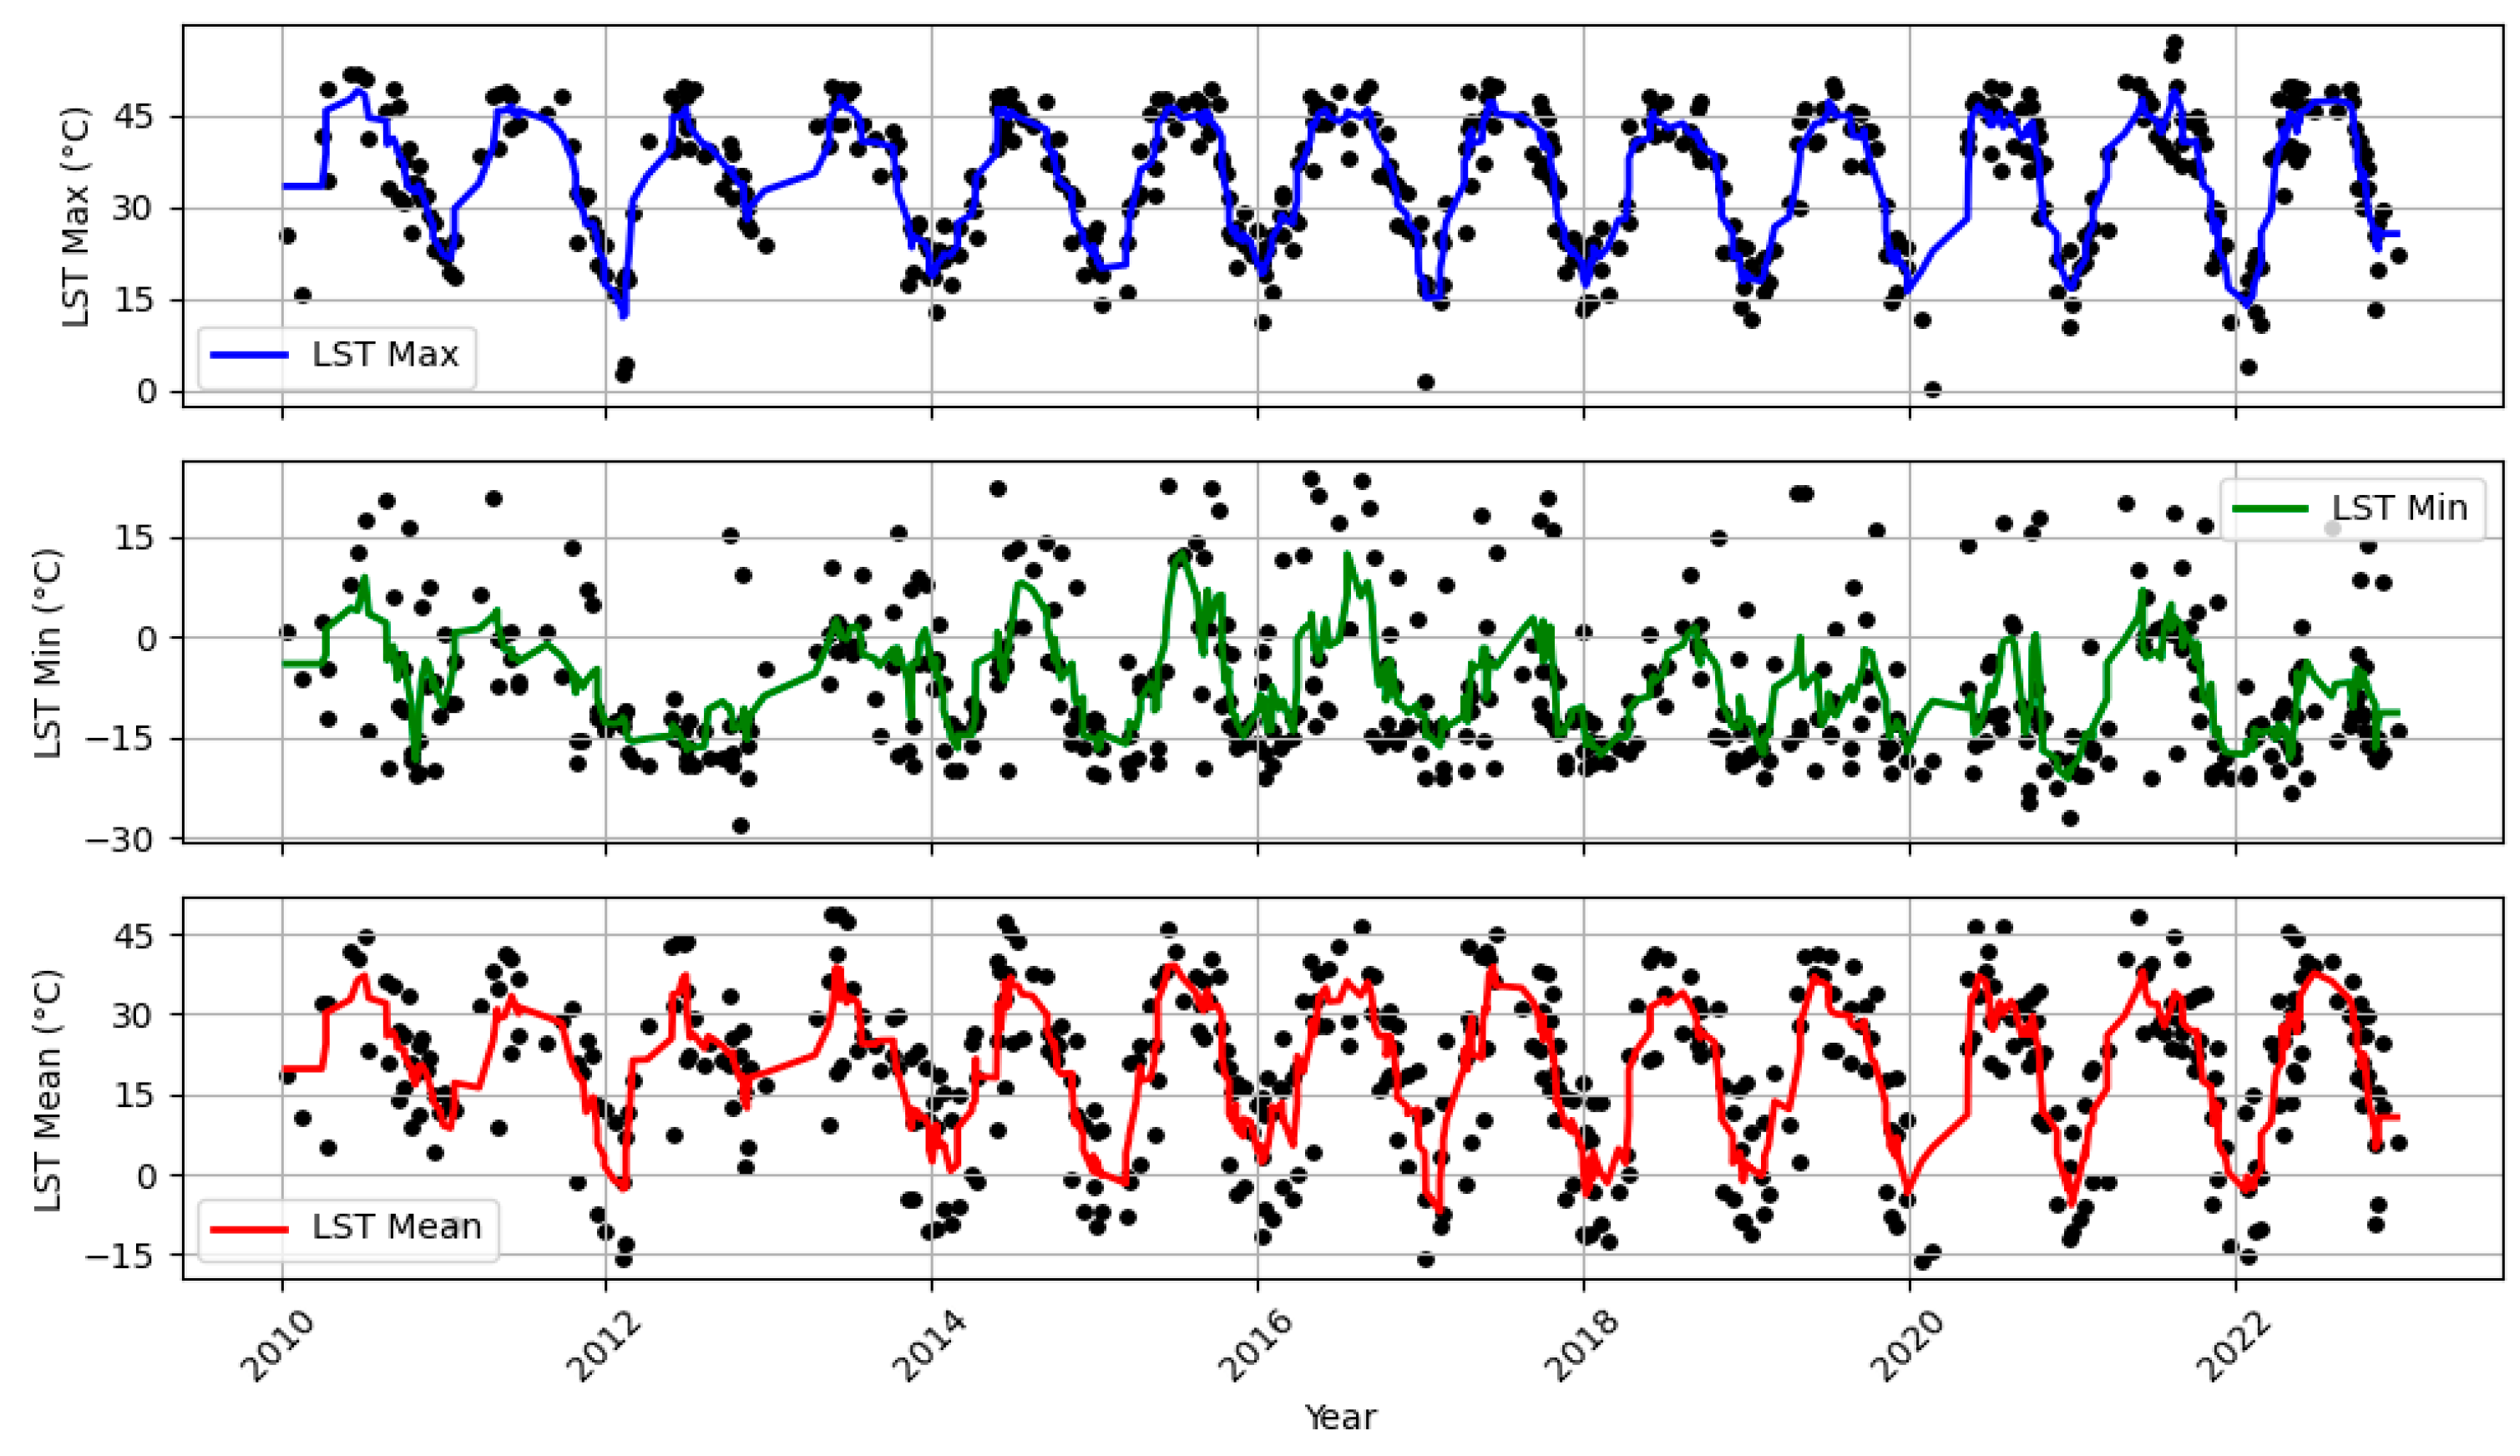
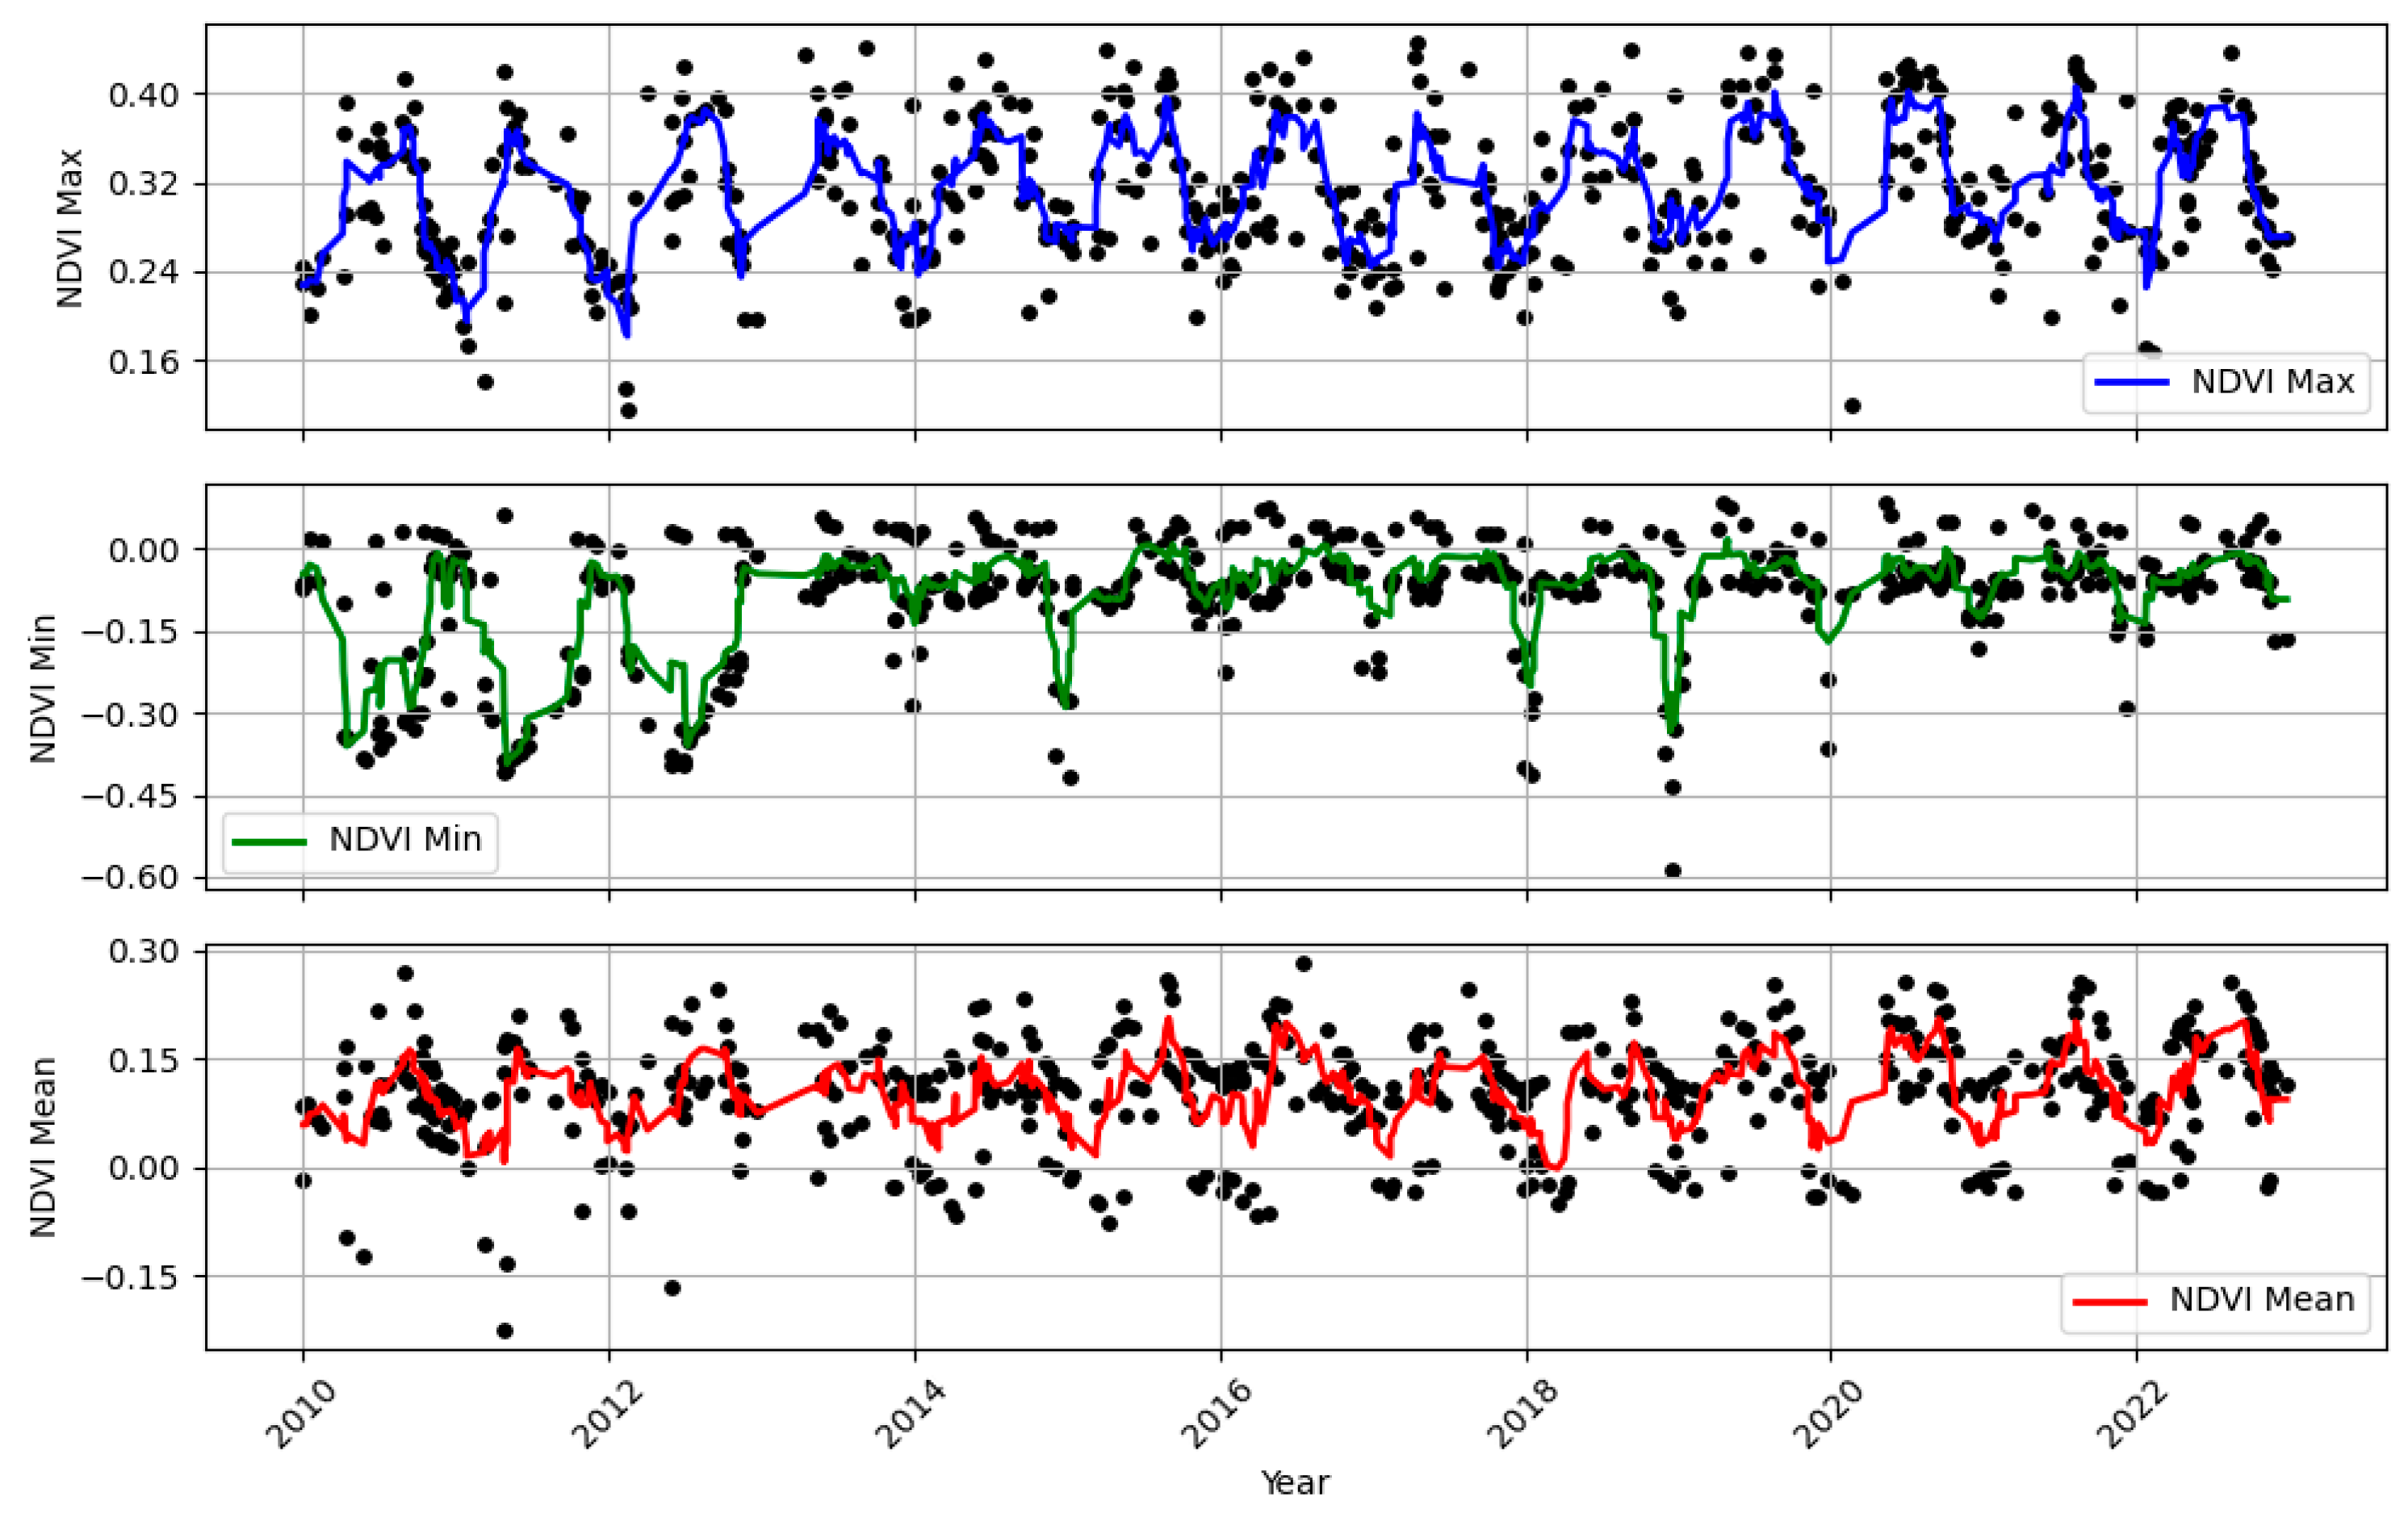
The LST and the NDVI are shown in Figure 9 and Figure 10, from 2010 to 2022, computing the changes for maximum, minimum, and average values. The maximum changes in temperature were observed in 2010 and 2022, while the minimum and average mostly changed in 2013, 2017, and 2019.

4.2.1. Trend Analysis of Land Surface Temperature

Peaks were recorded in 2010 and 2022, with the maximum LST values typically falling between roughly 40 and 50 °C. Between −25 °C and 30 °C, the minimum LST values varied the most in 2013, 2017, and 2019. Over the course of the 12-year period, mean LST values showed a moderately increasing trend, indicating a slow warming of the study area. Seasonal cycles, interannual climate variability, and possible changes in land use and land cover are all reflected in these LST variations. Flood risk may be impacted by increased evapotranspiration and decreased soil moisture caused by elevated surface temperatures [82,83].

4.2.2. Trend Analysis of Normalized Difference Vegetation Index

The NDVI_minimum values occasionally reached −0.5, indicating times of sparse cover or vegetation stress, while the NDVI_maximum values ranged from 0.2 to 0.4. The study area’s vegetation density was generally low to moderate, as indicated by the NDVI_mean values that stayed between 0.0 and 0.2. Notably, the NDVI declines coincided with LST peaks, highlighting the inverse relationship between surface temperature and vegetation greenness, consistent with previous studies [34,63,84]. Reduced vegetation cover can lower infiltration and increase surface runoff, thereby enhancing flood susceptibility.

4.3. Implications for Flood Susceptibility

Surface temperature and vegetation cover dynamically interact, as shown by the observed LST–NDVI trends, which are important for determining flood hazard [34,85]. Higher runoff and less infiltration are likely to occur in areas with higher LST and lower NDVI, raising the risk of flooding. The incorporation of these temporal patterns into flood susceptibility mapping can enhance the precision of hazard assessment and facilitate efficient mitigation and land management plans.
The NDVI and LST maps represent the spatial distribution for a representative year, whereas the interpolated plots show the temporal evolution of annual minimum, mean, and maximum NDVI and LST values from 2010 to 2022. Because one analysis is spatial and the other is based on aggregated temporal statistics, the two are not directly comparable. The interpolated curves were used to illustrate year-to-year variability in the NDVI and LST rather than pixel-wise NDVI–LST relationships.

4.4. Relationship of LST and NDVI

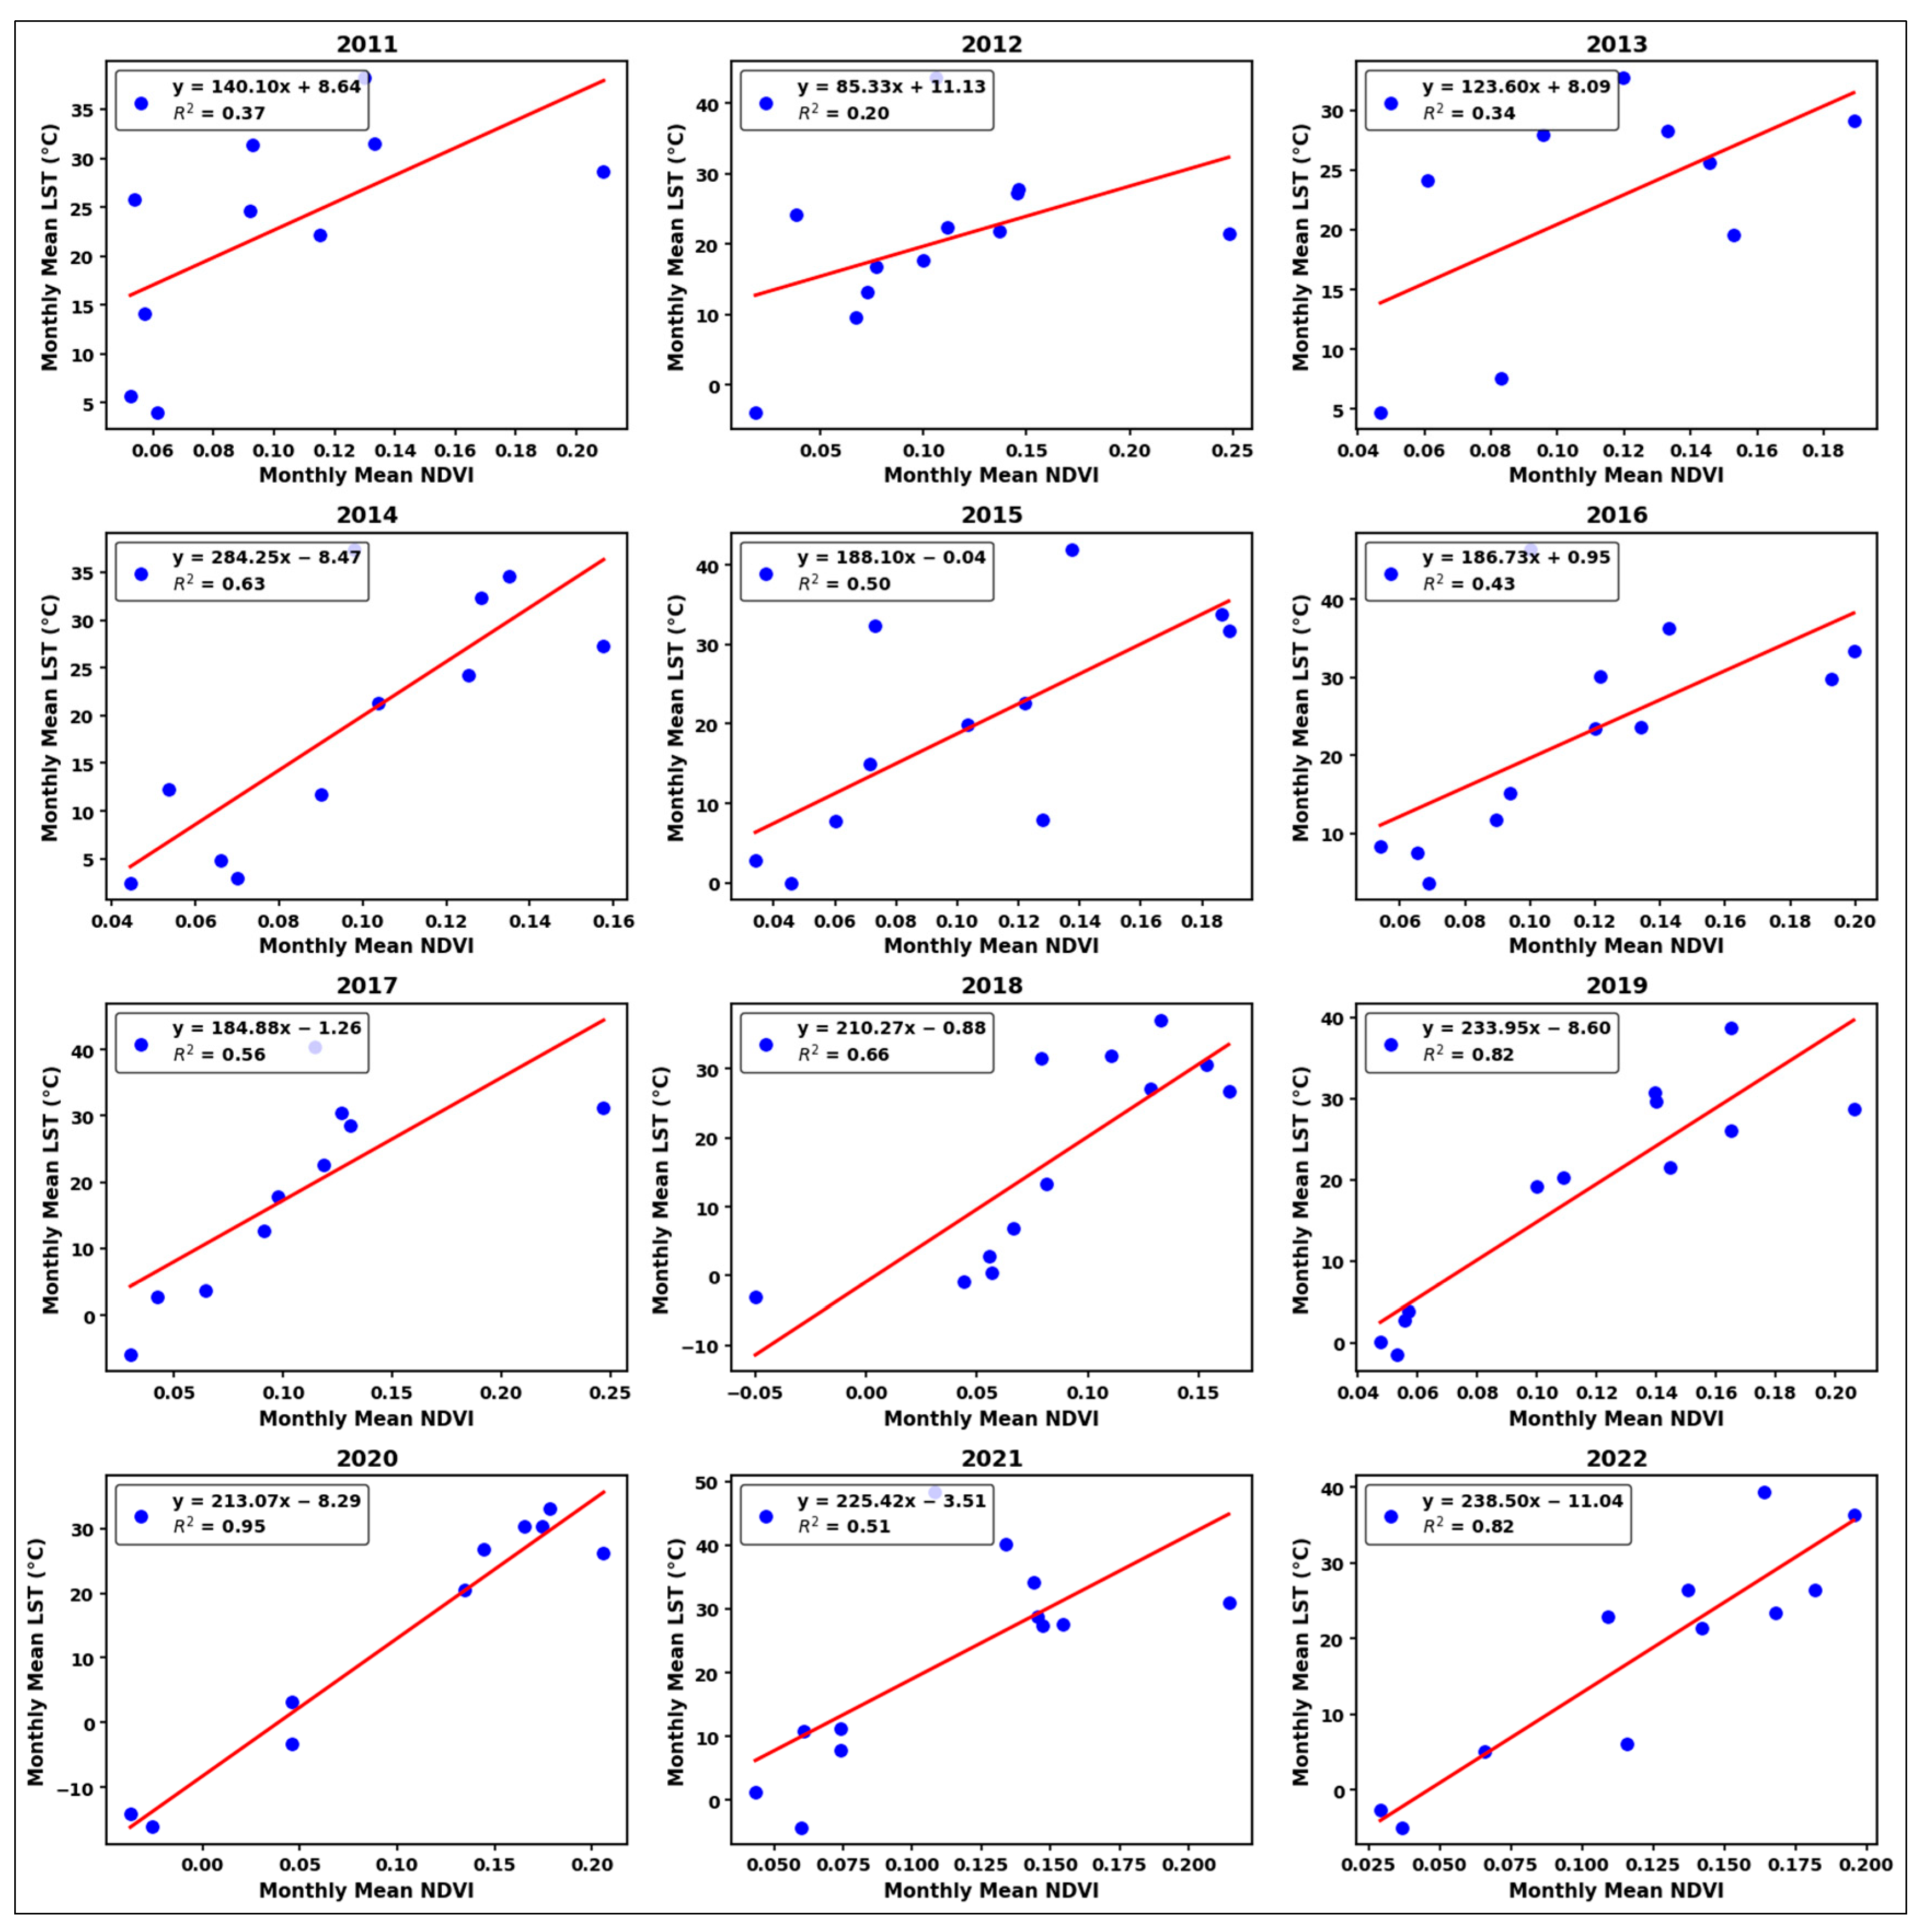
A scatterplot analysis was performed between LST and the NDVI, which were derived from Landsat 7 and Landsat 8 satellite images for the Mohmand Dam catchment for the period 2011–2022 showing in Figure 11. NDVI is the greenness and density of vegetation, and LST is the thermal properties of the land surface that are obtained through satellite measurements. The analysis of the interdependence between the two variables can be useful in comprehending the process of interaction between vegetation and temperature, which can affect the hydrological activities and the vulnerability to floods in the basin. Scatterplots of both years show the correlation of the NDVI and LST to linear regression lines. The regression slopes are always positive in both years, meaning that those regions or observations whose NDVI values are higher are likely to have comparatively higher values of LST in the data. Nonetheless, this relationship is weaker during the study time. The coefficient of determination (R2) has a value of between 0.2 and 0.95, which shows a weak to high relationship between vegetation condition and land surface temperature. The highest correlation is in 2020 (R2 is around 0.95), and the weaker correlations are in 2012–2013, where the R2 is around 0.2 to 0.34.
The inconsistency of the LST–NDVI correlation indicates that vegetation is not the sole determinant of the surface temperature patterns in the Mohmand Dam catchment. Rather, the noted differences can probably be caused by several environmental conditions, such as topography, seasonal climate change, soil moisture level, and land use heterogeneity in the Swat River Basin. The topography increases and decreases in elevation, and fluctuations in rainfall regimes may change the vegetation cover and thermal properties of the land surface, consequently resulting in a difference in the observed correlation between years. The analysis shows that vegetation dynamics, as indicated by the NDVI, help to explain a portion of the spatial and temporal variation in LST within the Mohmand Dam catchment, although with a moderate correlation strength. This correlation applies to flood-prone regions research since vegetation cover has the potential to determine surface runoff, evapotranspiration, and soil moisture storage, which are essential in hydrological response and flood production.
In Figure 4i,j shows the spatial distribution of the NDVI and LST for a representative year, whereas Figure 11 presents the temporal relationship between the monthly mean NDVI and the monthly mean LST for different years. Since Figure 4 reflects spatial variability within a single year and Figure 11 indicates temporal variability based on yearly averaged values, the two figures are not directly comparable. The inverse spatial pattern visible in the maps may not necessarily appear in the same way in the interannual mean-value analysis.

4.5. Study Importance and Implications

The findings of this work support planning authorities, flood response institutions, and local populations by identifying the areas most susceptible to flooding within the Mohmand Dam Catchment (MDC). The flood risk maps generated can function as an effective resource for planning and prioritizing flood prevention measures, early warning systems, and emergency response strategies. By highlighting the regions at highest risk, authorities can make informed decisions on infrastructure development, land use planning, and resource allocation to reduce potential loss of life and property [86,87,88].
Additionally, this study raises awareness of the factors driving flood risk, such as rainfall patterns, land use, and topography, helping stakeholders to design targeted interventions. The results also support long-term planning efforts to enhance the resilience of vulnerable communities, ensuring that both urban and rural areas are better prepared for future flood events. Overall, this study bridges scientific research and practical decision-making, offering actionable guidance for sustainable water and disaster risk management [89].

4.6. Study Constraints

Despite the comprehensive approach employed, there are limitations to this study that should be recognized. Firstly, though the Landsat-8 and Sentinel-2 multispectral and SRTM DEM provided a solid information basis, this approach may not be able to capture fine-scale flood-prone-area variations due to its spatial resolution (e.g., 30 m for Landsat/SRTM), especially in complex multi-heterogeneous urban terrains. Second, historic flood records were based on government statistics and field investigations and may be subject to incomplete or non-uniform compilation rates, leading to potential uncertainty in model training and validation.
Additionally, specific temporal variability in flood drivers (e.g., seasonal rainfall, snowmelt, or land use change) was only partially described because we used snapshot remote sensing and precipitation data over a selected timeframe. Model uncertainty is another factor; while countless machine learning models (RF, SVM, LR, KNN, and MLP) and AHP/FAHP methods have been used, each of these models has innate disadvantages. Although the SHAP analyses render a better understanding of feature importance, predictive accuracy could still potentially drop due to extreme events or unobserved conditions. Lastly, certain hydrological and anthropogenic factors, such as small irrigation channels, drainage systems, and temporary embankments with local significance, were not clearly integrated based on data limitations, which might lead to the misrepresentation of flood susceptibility in precise locations.
One limitation of this study is the use of Dynamic World LULC data without conducting a full local accuracy assessment by using a statistically representative reference sample. Although Dynamic World has been validated in published studies, its thematic performance can vary by land cover type and is generally lower in heterogeneous landscapes. Future work should conduct area-specific validation by using stratified random sampling and sufficient reference observations for each class.

4.7. Future Directions

Future research can build upon this study by incorporating higher-resolution and near-real-time datasets, such as Sentinel-1 SAR imagery and UAV-derived DEMs, along with up-to-date precipitation and runoff data. These enhancements could improve the accuracy and timeliness of flood predictions. Investigating the impacts of climate change, including shifts in rainfall patterns, snowmelt dynamics, and temperature trends, would further support long-term flood risk planning and community resilience.
Integrating machine learning-based susceptibility maps with physically based hydrodynamic models, such as HEC-RAS or LISFLOOD, could provide detailed information on flood depth, velocity, and extent of inundation, allowing for more comprehensive risk assessments. Continuous monitoring of land use changes, urban expansion, and infrastructure development would also help in understanding how anthropogenic activities modify flood risk over time. Finally, engaging local communities in ground-truthing, validation, and incorporating indigenous knowledge could enhance the reliability and practical applicability of flood susceptibility assessments.

5. Conclusions

This paper has evaluated the susceptibility to flash flood in the Swat River Basin, through an integrated model that integrates GIS-based multi-criteria decision analysis (AHP and Fuzzy AHP) with machine learning models. Fourteen flood-conditioning variables that included topographic, hydrological, environmental, meteorological, and anthropogenic factors were assessed in a systematic way to adhere to the complex spatial dynamics of the occurrence of floods.
Spatial analysis showed that the topographical indices, land use and land cover, rainfall, drainage density, soil type, and distance to streams are the dominant factors that determine the patterns of flood susceptibility. The high and very high susceptibility zones were mainly concentrated at the river channels, lowlands, developed areas, and those areas that had a high intensity of rainfall and inadequate drainage. On the contrary, the more vegetation-covered areas, as shown by the NDVI, had lower flood susceptibility, which underscores the role that vegetation plays in reducing surface runoff and flood potential.
The AHP-based flood susceptibility map identified 10.13% of the study area as very highly susceptible and 21.55 as high, with the Fuzzy AHP model providing similar results, giving 10.18 as very high and 20.84 as high. The high correlation between the two models ascertains the strength of the GIS-based multi-criteria approach. In addition, the Fuzzy AHP method showed a slightly better performance as it was able to deal with uncertainty in the weighting of factors. The susceptibility maps were also validated, and the predictive accuracy of the machine learning models was also stronger as they were able to efficiently characterize nonlinear interactions between flood-conditioning factors.
Among all models, machine learning approaches, such as random forest, SVM, logistic regression, KNN, and MLP, demonstrated excellent predictive performance (AUC > 0.94), outperforming traditional AHP-based methods. This highlights their ability to capture complex, nonlinear relationships among flood-conditioning factors and supports their use in operational flood risk mapping and disaster mitigation strategies.
Altogether, expert-informed decision analysis and machine-learned data-driven flood susceptibility mapping offer a holistic and sound framework for flood susceptibility assessment, which can guide flood risk management, land use planning, and disaster mitigation in the Swat River Basin. Although the proposed framework is methodologically transferable to other regions, direct application of trained models outside the Mohmand Dam Catchment should be approached with caution, as predictor importance and flood processes may vary across climatic, hydrological, and geomorphological settings.

Supplementary Materials

The following supporting information can be downloaded at: https://www.mdpi.com/article/10.3390/w18070844/s1, Figure S1. Confusion matrix for the LULC classification of the MDC between reference validation points and predicted land-cover classes; Table S1. Pairwise comparison of flood conditioning factors.

Author Contributions

Conceptualization, methodology, and writing—original draft preparation: M.R., S.U., F. and S.H.; validation and visualization: M.R., S.U. and F.; software, M.R. and S.F.; data correction and formal analysis: M.R. and F.; writing—review and editing, M.P., M.R., S.U. and F.; supervision, M.P. and I.S.L. All authors have read and agreed to the published version of the manuscript.

Funding

This research received no external funding.

Data Availability Statement

Restrictions apply to the availability of these data. Data were obtained from the Water and Power Development Authority (WAPDA) and the Pakistan Meteorological Department (PMD) and are available from the authors with the permission of these institutions.

Acknowledgments

We would like to express our sincere gratitude to the Pakistan Meteorological Department (PMD) for providing the data essential for this research. Their support and cooperation were instrumental in facilitating this study on rainwater harvesting and its impact on local water resources and ecosystems. Additionally, we express our sincere gratitude to the Department of Earth Geo Environmental Sciences, University of Bari Aldo Moro, Italy, Centre of Excellence in Water Resources Engineering at UET Lahore, Pakistan, and Stevens Institute of Technology, New Jersey, USA, for providing the necessary facilities and support for this research. During the preparation of this manuscript, the authors used Google Gemini for minor code correction for Python. Grammarly has been used for grammar correction, language polishing, punctuation, sentence structuring, clarity, and coherence. The authors reviewed and edited all outputs as necessary and take full responsibility for the content of this publication.

Conflicts of Interest

The authors declare no conflict of interest.

References

  1. Liu, Q.; Du, M.; Wang, Y.; Deng, J.; Yan, W.; Qin, C.; Liu, M.; Liu, J. Global, Regional and National Trends and Impacts of Natural Floods, 1990–2022. Bull. World Health Organ. 2024, 102, 410–420. [Google Scholar] [CrossRef] [Scilit]
  2. Rentschler, J.; Salhab, M.; Jafino, B.A. Flood Exposure and Poverty in 188 Countries. Nat. Commun. 2022, 13, 3527. [Google Scholar] [CrossRef] [Scilit]
  3. Guccione, A.; Bassi, P.; Desbiolles, F.; Borgnino, M.; D’Andrea, F.; Pasquero, C. Global Extreme Precipitation Changes in Relation to Urbanization. Authorea Prepr. 2025. [Google Scholar] [CrossRef] [Scilit]
  4. Kalantari, Z.; Lyon, S.W.; Folkeson, L.; French, H.K.; Stolte, J.; Jansson, P.-E.; Sassner, M. Quantifying the Hydrological Impact of Simulated Changes in Land Use on Peak Discharge in a Small Catchment. Sci. Total Environ. 2014, 466–467, 741–754. [Google Scholar] [CrossRef] [Scilit]
  5. Bazai, N.A.; Alam, M.; Cui, P.; Hao, W.; Khan, A.P.; Waseem, M.; Shunyu, Y.; Ramzan, M.; Wanhong, L.; Ahmed, T. Dynamics and Impacts of Monsoon-Induced Geological Hazards: A 2022 Flood Study along the Swat River in Pakistan. Nat. Hazards Earth Syst. Sci. 2025, 25, 1071–1093. [Google Scholar] [CrossRef] [Scilit]
  6. Dickson, R. The Significant Threat Posed by Climate Change. Pixo Rev. Arquitetura Cid. Contemp. 2025, 9, 196. [Google Scholar] [CrossRef] [Scilit]
  7. Khoso, W.A.; Tanoli, M.A.; Bashir, M.T.; Khan, M.M.H.; Waseem, M.; Alrowais, R.; Wahab, A.; Leta, M.K. Impacts of Global Climate Change on Floods in Pakistan with Current Trends Challenges and Future Perspectives. Discov. Environ. 2025, 3, 239. [Google Scholar] [CrossRef] [Scilit]
  8. O’Brien, K.; Sygna, L.; Leichenko, R.; Adger, W.R.; Barnett, J.; Mitchell, T.; Schipper, L.; Tanner, T.; Vogel, C.; Mortreux, C. Disaster Risk Reduction. Disaster Risk Reduction, Climate Change Adaptation and Human Security. Report Prepared for the Royal Norwegian Ministry of Foreign Affairs by the Global Environmental Change and Human Security (GECHS) Project, GECHS Report. 2008. Available online: https://www.unisdr.org/files/7946_GECHSReport3081.pdf (accessed on 29 March 2026).
  9. Pereira Pordeus, M.; Vieira Pordeus, C.L.; Holanda dos Santos, V.H.; Davi Santos, M.; Isaías Nogueira, G.; Pessoa Fonteles, J.C. Climate Change and Human Activity: Global Challenge in Public Policy and The Cause-And-Effect Relationship in Natural Disasters Around the World Between 2020 and 2024. Environ. Soc. Manag. J. 2025, 19, e013004. [Google Scholar] [CrossRef] [Scilit]
  10. Ward, P.J.; Blauhut, V.; Bloemendaal, N.; Daniell, J.E.; de Ruiter, M.C.; Duncan, M.J.; Emberson, R.; Jenkins, S.F.; Kirschbaum, D.; Kunz, M.; et al. Review Article: Natural Hazard Risk Assessments at the Global Scale. Nat. Hazards Earth Syst. Sci. 2020, 20, 1069–1096. [Google Scholar] [CrossRef] [Scilit]
  11. Devitt, L.; Neal, J.; Coxon, G.; Savage, J.; Wagener, T. Flood Hazard Potential Reveals Global Floodplain Settlement Patterns. Nat. Commun. 2023, 14, 2801. [Google Scholar] [CrossRef] [Scilit]
  12. Altaf, M. Pakistan: Flood Damages and Economic Losses over USD 30 Billion and Reconstruction Needs over USD 16 Billion-New Assessment; World Bank: Washington, DC, USA, 2022. [Google Scholar]
  13. Wang, Y.; Cui, P.; Zhang, C.-D.; Zhang, G.-T.; Hao, J.-S.; Yuan, X.; Jiang, Y.-Z.; Wang, L. Antecedent Snowmelt and Orographic Precipitation Contributions to Water Supply of Pakistan Disastrous Floods, 2022. Adv. Clim. Change Res. 2024, 15, 419–430. [Google Scholar] [CrossRef] [Scilit]
  14. Waleed, M.; Sajjad, M. Advancing Flood Susceptibility Prediction: A Comparative Assessment and Scalability Analysis of Machine Learning Algorithms via Artificial Intelligence in High-Risk Regions of Pakistan. J. Flood Risk Manag. 2025, 18, e13047. [Google Scholar] [CrossRef] [Scilit]
  15. Masood, M.U.; Khan, N.M.; Haider, S.; Anjum, M.N.; Chen, X.; Gulakhmadov, A.; Iqbal, M.; Ali, Z.; Liu, T. Appraisal of Land Cover and Climate Change Impacts on Water Resources: A Case Study of Mohmand Dam Catchment, Pakistan. Water 2023, 15, 1313. [Google Scholar] [CrossRef] [Scilit]
  16. Mustafa, S.; Rashid, M.; Nabi, G.; Raza, A.; Haider, S.; Shah, S.I.H.; Aslam, M.F.; Hamza, M.; Abbasi, H.K.J. Evaluating the Influence of Land Use Dynamics on Flood Mitigation Strategies: A Hydrological Analysis of the Marala-Khanki Reach in the Chenab River Basin. Environ. Sustain. Indic. 2025, 28, 101047. [Google Scholar] [CrossRef] [Scilit]
  17. Haider, S.; Rashid, M.; Saleem, J. Evaluation of Climate Change and Land-Use Impacts on Groundwater Dynamics in the Bari Doab Canal System. Theor. Appl. Climatol. 2026, 157, 106. [Google Scholar] [CrossRef] [Scilit]
  18. Li, H. Tibetan Plateau Warming-Induced Abnormal Distribution of South Asian Monsoon Precipitation Contributes to Pakistan’s Fatal Flood in 2022. In EGU General Assembly Conference Abstracts; European Geosciences Union: Munich, Germany, 2023; p. EGU-10722. [Google Scholar]
  19. Saeed, U.; Hussain, M.; Hameedullah; Jannat butt, H.; Mukhtar, R.; Younas, I.; Ali, F.; Akmal, F.; Khan, S. Development of a Spatial Framework for Flash Flood Damage Assessment and Mitigation by Coupling Analytics of Machine Learning and Household Level Survey Data—A Case Study of Rapid Collaborative Assessments and Disbursement of Public Funds to the Affecte. Int. J. Disaster Risk Reduct. 2024, 108, 104463. [Google Scholar] [CrossRef] [Scilit]
  20. Dunstone, N.; Smith, D.M.; Hardiman, S.C.; Davies, P.; Ineson, S.; Jain, S.; Kent, C.; Martin, G.; Scaife, A.A. Windows of Opportunity for Predicting Seasonal Climate Extremes Highlighted by the Pakistan Floods of 2022. Nat. Commun. 2023, 14, 6544. [Google Scholar] [CrossRef] [Scilit]
  21. Waseem, H.B.; Rana, I.A. Understanding Urban Flood Risk Perception and Its Determinants across Diverse Hazard Sources. Urban Water J. 2025, 23, 460–481. [Google Scholar] [CrossRef] [Scilit]
  22. Rogelis, M.C.; Werner, M. Regional Debris Flow Susceptibility Analysis in Mountainous Peri-Urban Areas through Morphometric and Land Cover Indicators. Nat. Hazards Earth Syst. Sci. 2014, 14, 3043–3064. [Google Scholar] [CrossRef] [Scilit]
  23. Otto, F.E.L.; Zachariah, M.; Saeed, F.; Siddiqi, A.; Kamil, S.; Mushtaq, H.; Arulalan, T.; AchutaRao, K.; Chaithra, S.T.; Barnes, C. Climate Change Increased Extreme Monsoon Rainfall, Flooding Highly Vulnerable Communities in Pakistan. Environ. Res. Clim. 2023, 2, 25001. [Google Scholar] [CrossRef] [Scilit]
  24. Qamer, F.M.; Abbas, S.; Ahmad, B.; Hussain, A.; Salman, A.; Muhammad, S.; Nawaz, M.; Shrestha, S.; Iqbal, B.; Thapa, S. A Framework for Multi-Sensor Satellite Data to Evaluate Crop Production Losses: The Case Study of 2022 Pakistan Floods. Sci. Rep. 2023, 13, 4240. [Google Scholar] [CrossRef] [Scilit]
  25. You, Y.; Ting, M. Climate Change Contributes to the Record-Shattering 2022 Pakistan Rainfall. In EGU General Assembly Conference Abstracts; European Geosciences Union: Munich, Germany, 2023; p. EGU-4544. [Google Scholar]
  26. Rashid, M.; Haider, S.; Rizwan, A.; Naseer, M.W.; Aslam, M.F.; Hamza, M.; Nadeem, A.; Haider, M.A.; Abbasi, H.K.J.; Tariq, M.A.U.R. Mitigating Soil Erosion in Arid Landscapes: Integrating RUSLE and Geospatial Analysis for Sustainable Land Management. Environ. Chall. 2025, 20, 101210. [Google Scholar] [CrossRef] [Scilit]
  27. Ullah, S.; Ali, U.; Rashid, M.; Haider, S.; Kisi, O.; Vishwakarma, D.K.; Raza, A.; Alataway, A.; Dewidar, A.Z.; Mattar, M.A. Evaluating Land Use and Climate Change Impacts on Ravi River Flows Using GIS and Hydrological Modeling Approach. Sci. Rep. 2024, 14, 22080. [Google Scholar] [CrossRef] [Scilit]
  28. Dave, R.; Sen, S.; Bhatia, U. Disproportionate Impact of Compound Flood Events on Road Infrastructure Damage. In Proceedings of the EGU25; European Geosciences Union: Munich, Germany, 2025; p. EGU25-834. [Google Scholar]
  29. Braud, I.; Borga, M.; Gourley, J.; Hürlimann, M.; Zappa, M.; Gallart, F. Flash Floods, Hydro-Geomorphic Response and Risk Management. J. Hydrol. 2016, 541, 1–5. [Google Scholar] [CrossRef] [Scilit]
  30. Haider, S.; Masood, M.U.; Rashid, M.; Ali, T.; Pande, C.B.; Alshehri, F.; Elkhrachy, I. Assessment of Rainwater Harvesting Potential for Urban Area under Climate and Land Use Changes Using Geo-Informatics Technology. Urban Clim. 2023, 52, 101721. [Google Scholar] [CrossRef] [Scilit]
  31. Borga, M.; Stoffel, M.; Marchi, L.; Marra, F.; Jakob, M. Hydrogeomorphic Response to Extreme Rainfall in Headwater Systems: Flash Floods and Debris Flows. J. Hydrol. 2014, 518, 194–205. [Google Scholar] [CrossRef] [Scilit]
  32. Nanditha, J.S.; Kushwaha, A.P.; Singh, R.; Malik, I.; Solanki, H.; Chuphal, D.S.; Dangar, S.; Mahto, S.S.; Vegad, U.; Mishra, V. The Pakistan Flood of August 2022: Causes and Implications. Earth’s Futur. 2023, 11, e2022EF003230. [Google Scholar] [CrossRef] [Scilit]
  33. Prniyazova, A.; Turaeva, S.; Turgunov, D.; Jarihani, B. Sustainable Transboundary Water Governance in Central Asia: Challenges, Conflicts, and Regional Cooperation. Sustainability 2025, 17, 4968. [Google Scholar] [CrossRef] [Scilit]
  34. Latif, R.M.A.; He, J. Flood Susceptibility Mapping in Punjab, Pakistan: A Hybrid Approach Integrating Remote Sensing and Analytical Hierarchy Process. Atmosphere 2025, 16, 22. [Google Scholar] [CrossRef] [Scilit]
  35. Chapi, K.; Singh, V.P.; Shirzadi, A.; Shahabi, H.; Bui, D.T.; Pham, B.T.; Khosravi, K. A Novel Hybrid Artificial Intelligence Approach for Flood Susceptibility Assessment. Environ. Model. Softw. 2017, 95, 229–245. [Google Scholar] [CrossRef] [Scilit]
  36. Towfiqul Islam, A.R.M.; Talukdar, S.; Mahato, S.; Kundu, S.; Eibek, K.U.; Pham, Q.B.; Kuriqi, A.; Linh, N.T.T. Flood Susceptibility Modelling Using Advanced Ensemble Machine Learning Models. Geosci. Front. 2021, 12, 101075. [Google Scholar] [CrossRef] [Scilit]
  37. Otto, F.E.L.; Zachariah, M.; Saeed, F.; Siddiqi, A.; Kamil, S.; Mushtaq, H.; Arulalan, T.; AchutaRao, K.; Chaithra, S.T.; Barnes, C.; et al. Flood Susceptibility Modelling Using Advanced Ensemble Machine Learning Models. Geocarto Int. 2022, 2022, 207–217. [Google Scholar] [CrossRef] [Scilit]
  38. Serdar, M.Z.; Ajjur, S.B.; Al-Ghamdi, S.G. Flood Susceptibility Assessment in Arid Areas: A Case Study of Qatar. Sustainability 2022, 14, 9792. [Google Scholar] [CrossRef] [Scilit]
  39. Msabi, M.M.; Makonyo, M. Flood Susceptibility Mapping Using GIS and Multi-Criteria Decision Analysis: A Case of Dodoma Region, Central Tanzania. Remote Sens. Appl. Soc. Environ. 2021, 21, 100445. [Google Scholar] [CrossRef] [Scilit]
  40. Ekmekcioğlu, Ö.; Koc, K.; Özger, M. District Based Flood Risk Assessment in Istanbul Using Fuzzy Analytical Hierarchy Process. Stoch. Environ. Res. Risk Assess. 2021, 35, 617–637. [Google Scholar] [CrossRef] [Scilit]
  41. Papaioannou, G.; Vasiliades, L.; Loukas, A. Multi-Criteria Analysis Framework for Potential Flood Prone Areas Mapping. Water Resour. Manag. 2015, 29, 399–418. [Google Scholar] [CrossRef] [Scilit]
  42. Ha, H.; Luu, C.; Bui, Q.D.; Pham, D.-H.; Hoang, T.; Nguyen, V.-P.; Vu, M.T.; Pham, B.T. Flash Flood Susceptibility Prediction Mapping for a Road Network Using Hybrid Machine Learning Models. Nat. Hazards 2021, 109, 1247–1270. [Google Scholar] [CrossRef] [Scilit]
  43. Karakas, G.; Kocaman, S.; Gokceoglu, C. Multi-Hazard Susceptibility Assessment with Hybrid Machine Learning Methods for Tut Region (Adiyaman, Turkiye). Int. Arch. Photogramm. Remote Sens. Spat. Inf. Sci. 2023, 48, 529–536. [Google Scholar] [CrossRef] [Scilit]
  44. Adeyemi, A.B.; Komolafe, A.A. Flood Hazard Zones Prediction Using Machine-Learning-Based Geospatial Approach in Lower Niger River Basin, Nigeria. Nat. Hazards Res. 2025, 5, 399–412. [Google Scholar] [CrossRef] [Scilit]
  45. Farnaz; Nuthammachot, N.; Ali, M.Z. Comparative Study of Multiple Algorithms Classification for Land Use and Land Cover Change Detection and Its Impact on Local Climate of Mardan District, Pakistan. Environ. Chall. 2025, 18, 101069. [Google Scholar] [CrossRef] [Scilit]
  46. Khodaei, H.; Nasiri Saleh, F.; Nobakht Dalir, A.; Zarei, E. Future Flood Susceptibility Mapping under Climate and Land Use Change. Sci. Rep. 2025, 15, 12394. [Google Scholar] [CrossRef] [Scilit]
  47. Mudashiru, R.B.; Sabtu, N.; Abdullah, R.; Saleh, A.; Abustan, I. A Comparison of Three Multi-Criteria Decision-Making Models in Mapping Flood Hazard Areas of Northeast Penang, Malaysia. Nat. Hazards 2022, 112, 1903–1939. [Google Scholar] [CrossRef] [Scilit]
  48. Mudashiru, R.B.; Sabtu, N.; Abustan, I. Quantitative and Semi-Quantitative Methods in Flood Hazard/Susceptibility Mapping: A Review. Arab. J. Geosci. 2021, 14, 941. [Google Scholar] [CrossRef] [Scilit]
  49. Bentivoglio, R.; Isufi, E.; Jonkman, S.N.; Taormina, R. Deep Learning Methods for Flood Mapping: A Review of Existing Applications and Future Research Directions. Hydrol. Earth Syst. Sci. 2022, 26, 4345–4378. [Google Scholar] [CrossRef] [Scilit]
  50. Ren, H.; Pang, B.; Bai, P.; Zhao, G.; Liu, S.; Liu, Y.; Li, M. Flood Susceptibility Assessment with Random Sampling Strategy in Ensemble Learning (RF and XGBoost). Remote Sens. 2024, 16, 320. [Google Scholar] [CrossRef] [Scilit]
  51. Khan, S.M.; Shafi, I.; Butt, W.H.; Diez, I.D.; Flores, M.A.; Galán, J.C.; Ashraf, I. A Systematic Review of Disaster Management Systems: Approaches, Challenges, and Future Directions. Land 2023, 12, 1514. [Google Scholar] [CrossRef] [Scilit]
  52. Rashid, M.; Parise, M.; Haider, S.; Ullah, S. Advancing Flood Susceptibility Mapping Assessment Using Multi-Criteria Analysis and Machine Learning Models. In Proceedings of the AGU25, New Orleans, LA, USA, 15–19 December 2025. [Google Scholar]
  53. Singha, C.; Chakraborty, N.; Sahoo, S.; Pham, Q.B.; Xuan, Y. A Novel Framework for Flood Susceptibility Assessment Using Hybrid Analytic Hierarchy Process-Based Machine Learning Methods. Nat. Hazards 2025, 121, 13765–13810. [Google Scholar] [CrossRef] [Scilit]
  54. Islam, T.; Zeleke, E.B.; Afroz, M.; Melesse, A.M. A Systematic Review of Urban Flood Susceptibility Mapping: Remote Sensing, Machine Learning, and Other Modeling Approaches. Remote Sens. 2025, 17, 524. [Google Scholar] [CrossRef] [Scilit]
  55. Long, G.; Tantanee, S.; Nusit, K.; Sooraksa, P. A Comprehensive Review of Flood-Prone Area Zonation Using Ensemble and Hybrid Machine Learning Models with a Framework Proposal for Modelling. Geocarto Int. 2025, 40, 2492372. [Google Scholar] [CrossRef] [Scilit]
  56. Majed, U.; Nabi, G.; Rashid, M.; Hussain, R.; Haider, S.; Arshed, A.B. Sustainable Management of Urban Groundwater in Lahore Central Business District: Trends, Challenges, and Economic Implications. Environ. Chall. 2025, 21, 101368. [Google Scholar] [CrossRef] [Scilit]
  57. Ullah, I.; Jamil, S.; Ahmad, S.; Zeeshan, M.; Arif, Z. Twin Calamities in the Swat River Basin: Unraveling the Hydro Meteorological Drivers of the 2010 and 2022 Floods. J. Asian Dev. Stud. 2025, 14, 169–183. [Google Scholar] [CrossRef] [Scilit]
  58. Brown, C.F.; Brumby, S.P.; Guzder-Williams, B.; Birch, T.; Hyde, S.B.; Mazzariello, J.; Czerwinski, W.; Pasquarella, V.J.; Haertel, R.; Ilyushchenko, S.; et al. Dynamic World, Near Real-Time Global 10 m Land Use Land Cover Mapping. Sci. Data 2022, 9, 251. [Google Scholar] [CrossRef] [Scilit]
  59. Venter, Z.S.; Barton, D.N.; Chakraborty, T.; Simensen, T.; Singh, G. Global 10 m Land Use Land Cover Datasets: A Comparison of Dynamic World, World Cover and Esri Land Cover. Remote Sens. 2022, 14, 4101. [Google Scholar] [CrossRef] [Scilit]
  60. Xu, P.; Tsendbazar, N.-E.; Herold, M.; de Bruin, S.; Koopmans, M.; Birch, T.; Carter, S.; Fritz, S.; Lesiv, M.; Mazur, E.; et al. Comparative Validation of Recent 10 M-Resolution Global Land Cover Maps. Remote Sens. Environ. 2024, 311, 114316. [Google Scholar] [CrossRef] [Scilit]
  61. Chen, Y.; Zhang, X.; Yang, K.; Zeng, S.; Hong, A. Modeling Rules of Regional Flash Flood Susceptibility Prediction Using Different Machine Learning Models. Front. Earth Sci. 2023, 11, 1117004. [Google Scholar] [CrossRef] [Scilit]
  62. Tian, Y.; Xiong, J.; He, X.; Pi, X.; Jiang, S.; Han, F.; Zheng, Y. Joint Operation of Surface Water and Groundwater Reservoirs to Address Water Conflicts in Arid Regions: An Integrated Modeling Study. Water 2018, 10, 1105. [Google Scholar] [CrossRef] [Scilit]
  63. Rahman, Z.U.; Ullah, W.; Bai, S.; Ullah, S.; Jan, M.A.; Khan, M.; Tayyab, M. GIS-Based Flood Susceptibility Mapping Using Bivariate Statistical Model in Swat River Basin, Eastern Hindukush Region, Pakistan. Front. Environ. Sci. 2023, 11, 1178540. [Google Scholar] [CrossRef] [Scilit]
  64. Radmehr, A.; Araghinejad, S. Flood Vulnerability Analysis by Fuzzy Spatial Multi Criteria Decision Making. Water Resour. Manag. 2015, 29, 4427–4445. [Google Scholar] [CrossRef] [Scilit]
  65. Saaty, T.L. How to Make a Decision: The Analytic Hierarchy Process. Eur. J. Oper. Res. 1990, 48, 9–26. [Google Scholar] [CrossRef] [Scilit]
  66. Saaty, R.W. The Analytic Hierarchy Process—What It Is and How It Is Used. Math. Model. 1987, 9, 161–176. [Google Scholar] [CrossRef] [Scilit]
  67. Saaty, T.L. Decision Making with the Analytic Hierarchy Process. Int. J. Serv. Sci. 2008, 1, 83–98. [Google Scholar] [CrossRef] [Scilit]
  68. Mokhtari, E.; Abdelkebir, B.; Djenaoui, A.; Hamdani, N.E.H. Integrated Analytic Hierarchy Process and Fuzzy Analytic Hierarchy Process for Sahel Watershed Flood Susceptibility Assessment, Algeria. Water Pract. Technol. 2024, 19, 453–475. [Google Scholar] [CrossRef] [Scilit]
  69. Khosravi, K.; Pourghasemi, H.R.; Chapi, K.; Bahri, M. Flash Flood Susceptibility Analysis and Its Mapping Using Different Bivariate Models in Iran: A Comparison between Shannon’s Entropy, Statistical Index, and Weighting Factor Models. Environ. Monit. Assess. 2016, 188, 656. [Google Scholar] [CrossRef] [Scilit] [PubMed]
  70. Khosravi, K.; Nohani, E.; Maroufinia, E.; Pourghasemi, H.R. A GIS-Based Flood Susceptibility Assessment and Its Mapping in Iran: A Comparison between Frequency Ratio and Weights-of-Evidence Bivariate Statistical Models with Multi-Criteria Decision-Making Technique. Nat. Hazards 2016, 83, 947–987. [Google Scholar] [CrossRef] [Scilit]
  71. Chakrabortty, R.; Chandra Pal, S.; Rezaie, F.; Arabameri, A.; Lee, S.; Roy, P.; Saha, A.; Chowdhuri, I.; Moayedi, H. Flash-Flood Hazard Susceptibility Mapping in Kangsabati River Basin, India. Geocarto Int. 2022, 37, 6713–6735. [Google Scholar] [CrossRef] [Scilit]
  72. Gudiyangada Nachappa, T.; Tavakkoli Piralilou, S.; Gholamnia, K.; Ghorbanzadeh, O.; Rahmati, O.; Blaschke, T. Flood Susceptibility Mapping with Machine Learning, Multi-Criteria Decision Analysis and Ensemble Using Dempster Shafer Theory. J. Hydrol. 2020, 590, 125275. [Google Scholar] [CrossRef] [Scilit]
  73. Yaseen, A.; Lu, J.; Chen, X. Flood Susceptibility Mapping in an Arid Region of Pakistan through Ensemble Machine Learning Model. Stoch. Environ. Res. Risk Assess. 2022, 36, 3041–3061. [Google Scholar] [CrossRef] [Scilit]
  74. Malik, S.; Chandra Pal, S.; Chowdhuri, I.; Chakrabortty, R.; Roy, P.; Das, B. Prediction of Highly Flood Prone Areas by GIS Based Heuristic and Statistical Model in a Monsoon Dominated Region of Bengal Basin. Remote Sens. Appl. Soc. Environ. 2020, 19, 100343. [Google Scholar] [CrossRef] [Scilit]
  75. Wang, G.; Liu, L.; Shi, P.; Zhang, G.; Liu, J. Flood Risk Assessment of Metro System Using Improved Trapezoidal Fuzzy AHP: A Case Study of Guangzhou. Remote Sens. 2021, 13, 5154. [Google Scholar] [CrossRef] [Scilit]
  76. Gigović, L.; Pamučar, D.; Bajić, Z.; Drobnjak, S. Application of GIS-Interval Rough AHP Methodology for Flood Hazard Mapping in Urban Areas. Water 2017, 9, 360. [Google Scholar] [CrossRef] [Scilit]
  77. Haider, S.; Rashid, M.; Tariq, M.A.U.R.; Nadeem, A.; Haider, M.A.; Arshed, A.B. Seasonal Variability in Hydrologic Responses Due to Climate and Land-Cover Changes in the Pothohar Plateau, Pakistan. J. Water Clim. Change 2025, 16, 2407–2428. [Google Scholar] [CrossRef] [Scilit]
  78. Haider, S.; Masood, M.U.; Rashid, M.; Alshehri, F.; Pande, C.B.; Katipoğlu, O.M.; Costache, R. Simulation of the Potential Impacts of Projected Climate and Land Use Change on Runoff under CMIP6 Scenarios. Water 2023, 15, 3421. [Google Scholar] [CrossRef] [Scilit]
  79. Khan, M.M.; Sarwar, M.K.; Zafar, M.A.; Rashid, M.; Tariq, M.A.U.R.; Haider, S.; Okasha, A.M.; Dewidar, A.Z.; Mattar, M.A.; Salem, A. Comparative Analysis of Inflow Forecasting Using Machine Learning and Statistical Techniques: Case Study of Mangla Reservoir and Marala Headworks. Front. Environ. Sci. 2025, 13, 1590346. [Google Scholar] [CrossRef] [Scilit]
  80. Baalousha, H.M.; Younes, A.; Yassin, M.A.; Fahs, M. Comparison of the Fuzzy Analytic Hierarchy Process (F-AHP) and Fuzzy Logic for Flood Exposure Risk Assessment in Arid Regions. Hydrology 2023, 10, 136. [Google Scholar] [CrossRef] [Scilit]
  81. Bokhari, B.F.; Tawabini, B.; Baalousha, H.M. A Fuzzy Analytical Hierarchy Process-GIS Approach to Flood Susceptibility Mapping in NEOM, Saudi Arabia. Front. Water 2024, 6, 1388003. [Google Scholar] [CrossRef] [Scilit]
  82. Kumar, D.N.; Reshmidevi, T.V. Remote Sensing Applications in Water Resources. J. Indian Inst. Sci. 2013, 93, 163–188. [Google Scholar]
  83. Mumtaz, F.; Li, J.; Liu, Q.; Tariq, A.; Arshad, A.; Dong, Y.; Zhao, J.; Bashir, B.; Zhang, H.; Gu, C.; et al. Impacts of Green Fraction Changes on Surface Temperature and Carbon Emissions: Comparison under Forestation and Urbanization Reshaping Scenarios. Remote Sens. 2023, 15, 859. [Google Scholar] [CrossRef] [Scilit]
  84. Thapa, R.; Thoms, M.C.; Reid, M.; Parsons, M. Do Adaptive Cycles of Floodplain Vegetation Response to Inundation Differ among Vegetation Communities? River Res. Appl. 2020, 36, 553–566. [Google Scholar] [CrossRef] [Scilit]
  85. Ali, R.; Sajjad, H.; Rahaman, M.H.; Saha, T.K.; Masroor, M.; Roshani; Sharma, A. A Systematic Review on Climate Change-Induced Flood Susceptibility, Vulnerability and Risk: Future Research Perspective. Environ. Monit. Assess. 2025, 197, 1127. [Google Scholar] [CrossRef] [Scilit] [PubMed]
  86. Ibrahim, M.; Huo, A.; Ahmed, A.; Zhao, Z.; Zhong, F. Comprehensive Assessment of Flood Exposure in Arid Regions: Integrating GIS Techniques and Multi-Method Approaches—A Case Study of Downstream Swat River, Pakistan. Int. J. Disaster Risk Reduct. 2024, 109, 104515. [Google Scholar] [CrossRef] [Scilit]
  87. Shah, S.A.; Ai, S. Flood Susceptibility Mapping Contributes to Disaster Risk Reduction: A Case Study in Sindh, Pakistan. Int. J. Disaster Risk Reduct. 2024, 108, 104503. [Google Scholar] [CrossRef] [Scilit]
  88. Munir, A.; Ghufran, M.A.; Ali, S.M.; Majeed, A.; Batool, A.; Khan, M.B.A.S.; Abbasi, G.H. Flood Susceptibility Assessment Using Frequency Ratio Modelling Approach in Northern Sindh and Southern Punjab, Pakistan. Polish J. Environ. Stud. 2022, 31, 3249–3261. [Google Scholar] [CrossRef] [Scilit] [PubMed]
  89. Ogato, G.S.; Bantider, A.; Abebe, K.; Geneletti, D. Geographic Information System (GIS)-Based Multicriteria Analysis of Flooding Hazard and Risk in Ambo Town and Its Watershed, West Shoa Zone, Oromia Regional State, Ethiopia. J. Hydrol. Reg. Stud. 2020, 27, 100659. [Google Scholar] [CrossRef] [Scilit]
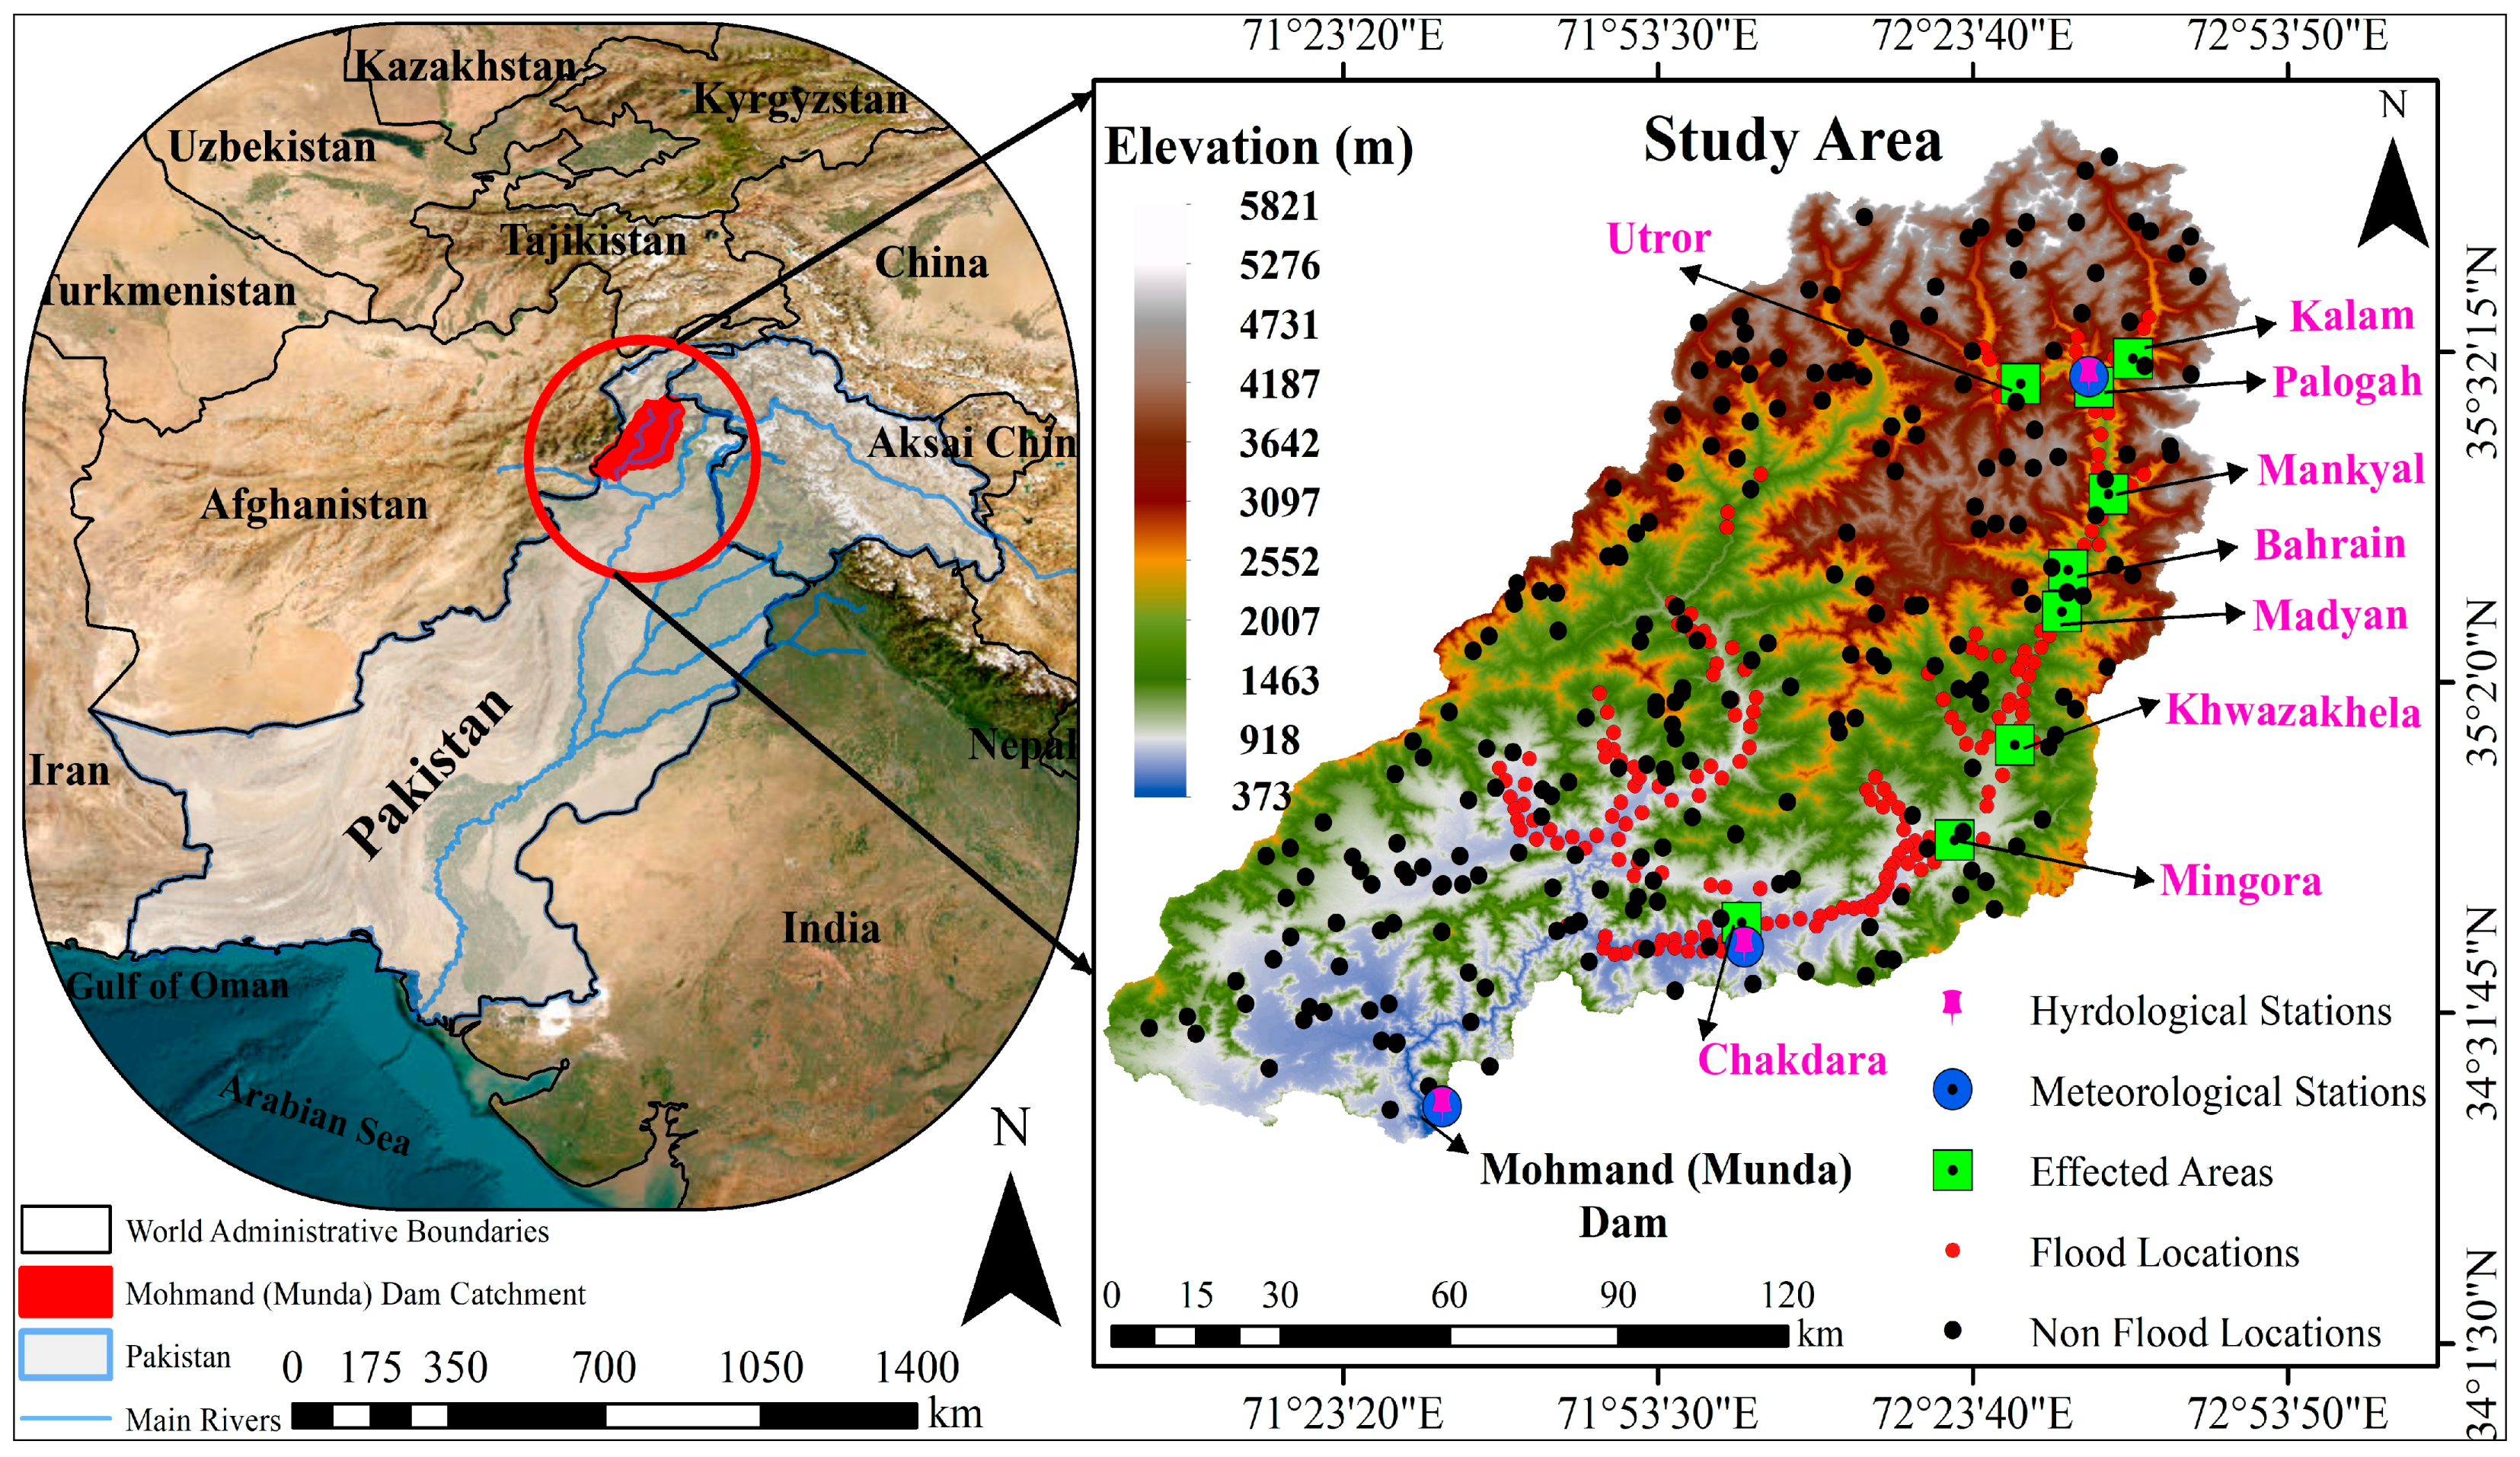
Figure 1. Study area of the Mohmand (Munda) Dam catchment showing administrative boundaries, main rivers, meteorological and hydrological stations, as well as flood and non-flood locations, and affected areas.
Water 18 00844 g001
Figure 2. Flood damage statistics for the 2010 and 2022 flood events, including affected villages (number), affected population (people), houses damaged (number), and agricultural area affected (hectare).
Water 18 00844 g002
Figure 3. Theoretical workflow for flood susceptibility assessment.
Water 18 00844 g003
Figure 4. Factors of flood conditioning that were chosen in the flood susceptibility assessment. Enhanced flood-prone conditions around constructed areas are consistent with a large body of literature that has identified hydrological effects of urbanization, such as decreased infiltration and surface runoff. (a) Soil type; (b) LUL C; (c) Slope percentage; (d) Distance to streams; (e) Rainfall; (TWI); (f) Topographic wetness index; (g) Drainage density; (h) Elevation; (i) Normalize difference vegetation index; (j) Land surface temperature; (k) Aspect; (l) Topographic position index; (m) Distance to roads and (n) distance to build up area.
Water 18 00844 g004
Figure 5. Correlation matrix of conditioning factors used for flood susceptibility.
Water 18 00844 g005
Figure 6. Feature importance ranking (LGBM model) using SHAP diagrams.
Water 18 00844 g006
Figure 7. Comparison of flood susceptibility mapping of AHP, FAHP, RF, SVM, logistic regression, KNN, and MLP.
Water 18 00844 g007
Figure 8. ROC curves and AUC values for AHP, Fuzzy AHP, and machine learning-based flood susceptibility models using 10-fold cross-validation in the Mohammed Dam Catchment.
Water 18 00844 g008
Figure 9. Time series analysis of land surface temperature from 2010 to 2022 (LSTmax, LSTmini, and LSTmean).
Water 18 00844 g009
Figure 10. Time series analysis of the normal difference vegetation index from 2010 to 2022 (NDVImax, NDVImin, and NDVImean).
Water 18 00844 g010
Figure 11. Relationship between LST and NDVI for the period of 2011 to 2022.
Water 18 00844 g011
Table 1. Different types of datasets used for FSM.
Data TypeData SourcesResolutionWebsiteAccessed Date
DEMSRTMGrid Cell:
(30 × 30)
https://earthexplorer.usgs.gov/5 January 2022
LULCSentinel-2Grid Cell:
(10 × 10)
https://livingatlas.arcgis.com/landcoverexplorer/5 June 2024
NDVILandsatGrid Cell:
(30 × 30)
https://earthexplorer.usgs.gov/10 May 2024
LSTLandsatGrid Cell:
(30 × 30)
https://earthexplorer.usgs.gov/7 December 2024
SoilFAOGrid Cell:
(30 × 30)
https://www.fao.org/soils-portal/en/10 February 2022
Stream &
river network
SRTM(30 × 30)https://earthexplorer.usgs.gov/5 January 2022
ClimatePakistan Meteorological
Data (PMD)
Daily basishttps://www.pmd.gov.pk/en/22 March 2024
River flowWAPDADaily basishttps://www.wapda.gov.pk/25 July 2024
Table 2. Weights and classification of flood-conditioning factors.
FactorsMain
Weight
Subclass
Weights
Susceptibility
Classes
Classification%
Weight
a Soil type99Very highLithosols11.11
8HighGleysols
7Moderatecalcaric fluvisols and eutricsols
6LowHaloic cambisols
5Very lowHaplic Xersols
b LULC99Very highWater11.11
2Very LowTrees
3LowFlood vegetation
4ModerateAgriculture
5ModerateShurbs and Scurb
8Very highBuild up area
7HighBare ground
6HighSnow and Ice
c Slope (%)88Very high103.95–363.089.88
7High69.78–103.94
6Moderate47.00–69.77
5Low22.79–46.99
4Very low0–22.78
d Distance to Stream (m)88Very high0–499.999.88
7High500–999.99
6Moderate1000–1499.99
5Low1500–2000
4Very low>2000
e Rainfall77Very high1283.91–1358.398.64
6High1222.48–1283.90
5Moderate1150.60–1222.47
4Low1086.56–1150.59
3Very low1025.13–1086.55
f TWI77Very high13.82–26.628.64
6High9.65–13.81
5Moderate7.09–9.64
4Low5.38–7.08
3Very low2.44–5.37
g Drainage Density67Very high0.31–0.537.4
6High0.23–0.30
5Moderate0.16–0.22
4Low0.08–0.15
3Very low0–0.07
h Elevation (m)67Very high373–13247.4
6High1324.01–2082
5Moderate2082.01–2957
4Low2957.01–3859
2Very low3859.01–5821
i NDVI57Very high−0.18–0.036.17
6High0.04–0.11
5Moderate0.12–0.17
4Low0.18–0.23
3Very low0.24–0.43
j LST56Very high34.39–50.956.17
5High26.64–34.38
4Moderate18.09–26.63
3Low7.40–18.08
2Very low−17.20–7.39
k Aspect46Very high282.37–359.904.94
5High211.88–282.36
4Moderate142.80–211.87
3Low1–72.30
2Very low72.31–142.79
l TPI36Very high−195.92–−27.643.7
5High−27.65–−9.35
4Moderate−9.36–7.11
3Low7.12–29.06
2Very low29.07–270.51
m Distance to roads (m)26Very high0–499.992.47
5High500–999.99
4Moderate1000–1999.99
3Low2000–3000
2Very low>3000
n Distance to built-up area (m)26Very high0–499.992.47
5High500–999.99
4Moderate1000–1999.99
3Low2000–3000
2Very low>3000
100
Notes: a–n The physical significance and hydrological role of each factor are described in Supplementary Materials S1. This Supplementary Materials Section provides a detailed description of the physical meaning, hydrological relevance, and relationship with flood susceptibility of each flood-conditioning factor used in this study. The explanations support the classification scheme and weight assignment presented in the Supplementary Materials Section.
Table 3. Pairwise comparison of flood-conditioning factors.
Fac.STLULCSLDSRTWIDDELNDVILSTATPIDRDBNWFNW
ST1.001.001.131.131.291.291.501.501.801.802.253.004.504.500.1140.114
LULC1.001.001.131.131.291.291.501.501.801.802.253.004.504.500.1140.114
SL0.890.891.001.001.141.141.331.331.601.602.002.674.004.000.1010.099
DS0.890.891.001.001.141.141.331.331.601.602.002.674.004.000.1010.099
R0.780.780.880.881.001.001.171.171.401.401.752.333.503.500.0880.088
TWI0.780.780.880.881.001.001.171.171.401.401.752.333.503.500.0880.088
DD0.670.670.750.750.860.861.001.001.201.201.502.003.003.000.0760.075
EL0.670.670.750.750.860.861.001.001.201.201.502.003.003.000.0760.075
NDVI0.560.560.630.630.710.710.830.831.001.001.251.672.502.500.0630.061
LST0.560.560.630.630.710.710.830.831.001.001.251.672.502.500.0630.061
A0.440.440.500.500.570.570.670.670.800.801.001.332.002.000.0510.048
TPI0.330.330.380.380.430.430.500.500.600.600.751.001.501.500.0380.036
DR0.220.220.250.250.290.290.330.330.400.400.500.671.001.000.0250.023
DB0.220.220.250.250.290.290.330.330.400.400.500.671.001.000.0250.023
Note: ST, LULC, SL, DS, R, TWI, DD, EL, NDVI, LST, A, TPI, DR, and DB represent soil type, land use and land cover, slope, distance to stream, rainfall, drainage density, elevation, normalized vegetation index, land surface temperature, aspect, topographic positional index, distance to roads, and distance to built-up area, respectively.
Disclaimer/Publisher’s Note: The statements, opinions and data contained in all publications are solely those of the individual author(s) and contributor(s) and not of MDPI and/or the editor(s). MDPI and/or the editor(s) disclaim responsibility for any injury to people or property resulting from any ideas, methods, instructions or products referred to in the content.