Article

Contrasting Hydropower Development Strategies in Central Asia’s Water–Energy–Food Nexus Through Spatially Explicit System Dynamics Modelling

by
Sara Pérez Pérez
1,
Raquel López Fernández
1,*,
Iván Ramos-Diez
1,
Patricia Osuna Fuentes
2,
Daniel S. Hayes
3 and
Jan De Keyser
2
1
Energy Division, CARTIF Technology Centre, Parque Tecnológico de Boecillo, 205, 47151 Valladolid, Spain
2
Institute for Hydraulic Engineering, Hydraulics and River Research, Department of Landscape, Water and Infrastructure, BOKU University, 1200 Vienna, Austria
3
Institute of Hydrobiology and Aquatic Ecosystem Management, Department of Ecosystem Management, Climate and Biodiversity, BOKU University, 1180 Vienna, Austria
*
Author to whom correspondence should be addressed.
Water 2026, 18(16), 2007; https://doi.org/10.3390/w18162007
Submission received: 14 July 2026 / Revised: 6 August 2026 / Accepted: 12 August 2026 / Published: 17 August 2026
(This article belongs to the Special Issue Advanced Perspectives on the Water–Energy–Food Nexus)

Abstract

Central Asia faces increasing pressure on transboundary water, energy and food systems, particularly in the Aral Sea Basin, where hydropower, agriculture and downstream water availability are closely linked. This study applies a spatially disaggregated Water–Energy–Food (WEF) Nexus System Dynamics Model under combined climate–socioeconomic scenarios (SSP1-2.6, SSP2-4.5 and SSP5-8.5) to assess hydropower development and policy pathways at basin and sub-basin scales in the Amu Darya and Syr Darya basins during 2015–2050. At basin scale, mean annual water supply remains stable across scenarios, at approximately 42 and 87 million hm3/year, respectively. Under national hydropower plans, installed capacity nearly doubles by 2050, reaching 10.45 and 10.65 GW, respectively. Food supply is more sensitive to climate–socioeconomic pathways than to hydropower expansion, with 2050 values ranging from 1120 to 1370 tonnes in the Syr Darya and 1405 to 1780 tonnes in the Amu Darya. Spatial simulations show that upstream-only development concentrates energy gains, whereas integrated basin-wide planning delivers more balanced WEF outcomes and the highest Aral Sea inflows, reaching 8.41 million hm3/year and 17,319 hm3/year, respectively. Persistent Amu Darya trade-offs underscore the need for transboundary coordination in reservoir operation, irrigation planning and downstream-flow safeguards. Spatial disaggregation reveals trade-offs concealed by basin-scale averages.

1. Introduction

Central Asia (CA) stands at a critical juncture in the governance of its shared water resources [1]. The region’s hydrological system is dominated by the Syr Darya and Amu Darya river basins, which together form the Aral Sea Basin, a representative example of the interconnected Water–Energy–Food (WEF) systems [2]. These rivers originate in the mountainous upstream countries of Kyrgyzstan and Tajikistan and flow toward the downstream states of Uzbekistan, Kazakhstan, and Turkmenistan. The result is a structural asymmetry in Central Asia’s water resources, in which availability and control are unevenly split between upstream and downstream countries [3]. The coexistence of hydropower-producing upstream countries and agriculture-dependent downstream economies makes the Aral Sea Basin a critical case study for integrated resource management [4] and has historically generated recurrent tensions over seasonal water allocation, particularly during drought periods or moments of political and institutional transition [5]. The environmental collapse of the Aral Sea remains the clearest example of the long-term consequences of single-focused, irrigation-driven agricultural expansion without integrated basin-scale management [6,7]. Political and institutional developments are reshaping this regional governance landscape. Kyrgyzstan adopted a new Water Code scheduled to enter into force in 2026 [8], which formally recognises water as a strategic economic resource comparable to oil and gas [9]. The Code unifies previously fragmented water legislation into a single framework, recentralizes control over irrigation infrastructure, and allows Kyrgyzstan to formally charge downstream states for water access [10]. This is particularly significant given that Kyrgyzstan currently uses only around 25% of its river flow, while the remainder benefits downstream neighbours [11]. For Uzbekistan and Kazakhstan, whose agricultural sectors rely on predictable seasonal releases from upstream reservoirs, the reform introduces important economic and social uncertainties. Although provisional agreements have been negotiated to preserve short-term water–energy balances, the implementation of the new policy framework is expected to trigger broader institutional and operational transformations across the region [12].
Growing population, economic expansion, and climate change are intensifying pressures on water, energy, and food systems in CA [13,14]. Recent studies show that climate change is increasing crop water consumption in the region despite the adoption of less water-intensive cropping practices [15]. In this context, the WEF Nexus approach has gained increasing relevance in CA for analysing transboundary resource interactions and emerging policy challenges [2,16,17]. However, existing studies focus mainly on water-related issues and multinational scales, leaving smaller spatial scales underexplored; a more balanced methodological approach that integrates sub-basin (SB) analyses is therefore needed [5].
Recent Nexus research has also used optimisation-based approaches to identify efficient resource-allocation strategies. For example, a recent study developed a multi-objective collaborative optimisation model for WEF–Carbon, considering irrigation water productivity, carbon emissions, agricultural competitiveness, and uncertainty in surface-water availability [18]. Such approaches are valuable for identifying resource allocations that perform favourably under predefined objectives and constraints. However, their primary purpose is to derive optimal or compromise solutions rather than to reproduce the endogenous feedbacks, temporal delays, stock–flow relationships, and spatial propagation processes that shape the evolution of interconnected WEF systems under alternative policy and infrastructure pathways. System Dynamics (SD) modelling provides a complementary approach by explicitly representing these dynamic interactions and has increasingly been applied to complex socio-environmental systems [19,20,21,22]. By integrating multiple subsystems, including population dynamics and climate variability, within a unified simulation framework, SD modelling can simulate how policy interventions influence resource security over time. Thereby SD models can support scenario analysis and the evaluation of alternative policy combinations for sustainable resource management [23]. However, existing regional WEF nexus SD models still face important limitations. Many operate at relatively aggregated spatial scales and therefore have limited capacity to represent how local hydrological processes, infrastructure operations, and policy interventions propagate across interconnected river systems [19]. In addition, the representation of dynamic feedback between hydropower (HP) operation, irrigation demand, climate variability, and institutional change remains limited [24].
In response to this challenge, Perez et al. [25] developed the first WEF Nexus System Dynamics Model (SDM) specifically for the Aral Sea Basin, introducing a finer spatial resolution based on 19 SBs in the Amu Darya and nine in the Syr Darya [25], enabling disaggregated assessments across the entire Aral Sea Basin, individual river systems, and specific sub-catchments, and thus significantly enhancing its capacity for transboundary analysis. In addition to the core WEF components, the SDM incorporates ecological and agricultural constraints, including environmental-flow requirements, irrigation demand and land degradation, which influence the simulated interactions among the water, energy and food subsystems [25]. Finally, the SDM explicitly integrates climate change through combined Shared Socioeconomic Pathways (SSPs) and Representative Concentration Pathways (RCPs) [26,27], enabling the simulation of WEF security trajectories and Aral Sea inflows up to 2050.
Building on this previously developed conceptual WEF Nexus SDM for the Aral Sea Basin, the present study both applies and extends the model by incorporating HP pathways and policy interventions in CA, reflecting the strategic role of HP in regional water–energy interactions [28]. In particular, this study integrates newly defined HP development trajectories, infrastructure-expansion scenarios, and policy instruments derived from recent regional assessments, including water-saving technologies, renewable energy deployment, and institutional coordination measures [3,29]. HP development strategies are further compared at the sub-basin level. This enables the assessment of how different levels of regional coordination affect water supply, installed HP capacity, food supply and final discharge to the Aral Sea across the basin.
Specifically, the study addresses the following research questions: (i) How do changes in HP development pathways and water governance propagate across interconnected upstream–downstream systems in the Aral Sea Basin? (ii) How do alternative policy and infrastructure scenarios affect water supply, installed HP capacity, food supply and final discharge to the Aral Sea? (iii) To what extent can spatially disaggregated SDM improve the representation of transboundary WEF Nexus dynamics in CA? By analysing contrasting development pathways under conditions of transboundary interdependence and climate uncertainty, this study provides a quantitative framework for assessing policy trade-offs and synergies across WEF systems in CA. The results contribute to the development of integrated analytical tools that support adaptive governance and sustainable resource management in CA, while reinforcing the value of a WEF Nexus perspective for designing effective and equitable long-term regional policies.

2. Materials and Methods

2.1. Study Area: The Aral Sea Basin

The study focuses on the Aral Sea Basin, structured around its two transboundary Amu Darya and Syr Darya river systems originating in the Pamir and Tian Shan mountain ranges, respectively. The Aral Sea Basin extends over approximately 786,500 km2 [30] and supports a population exceeding 57 million inhabitants [31]. The region’s climate is arid to semi-arid [32], with low and unevenly distributed precipitation, averaging around 486,600 hm3 per year and high evaporation rates that exacerbate water scarcity [27].
The Amu Darya is the more water-abundant of the two main rivers, sustaining extensive irrigated agriculture, particularly in Uzbekistan and Turkmenistan. The Syr Darya, which traverses Kyrgyzstan, Uzbekistan, and Kazakhstan, exhibits more pronounced seasonal variability due to its stronger snowmelt-fed regime [33]. Both river networks are crucial for irrigation, HP generation, and domestic water use, and the resulting anthropogenic interventions have substantially modified the river’s flow regimes, particularly through reservoir regulation and the large-scale irrigation diversions established during the Soviet era to promote cotton production and other irrigated crops [34].
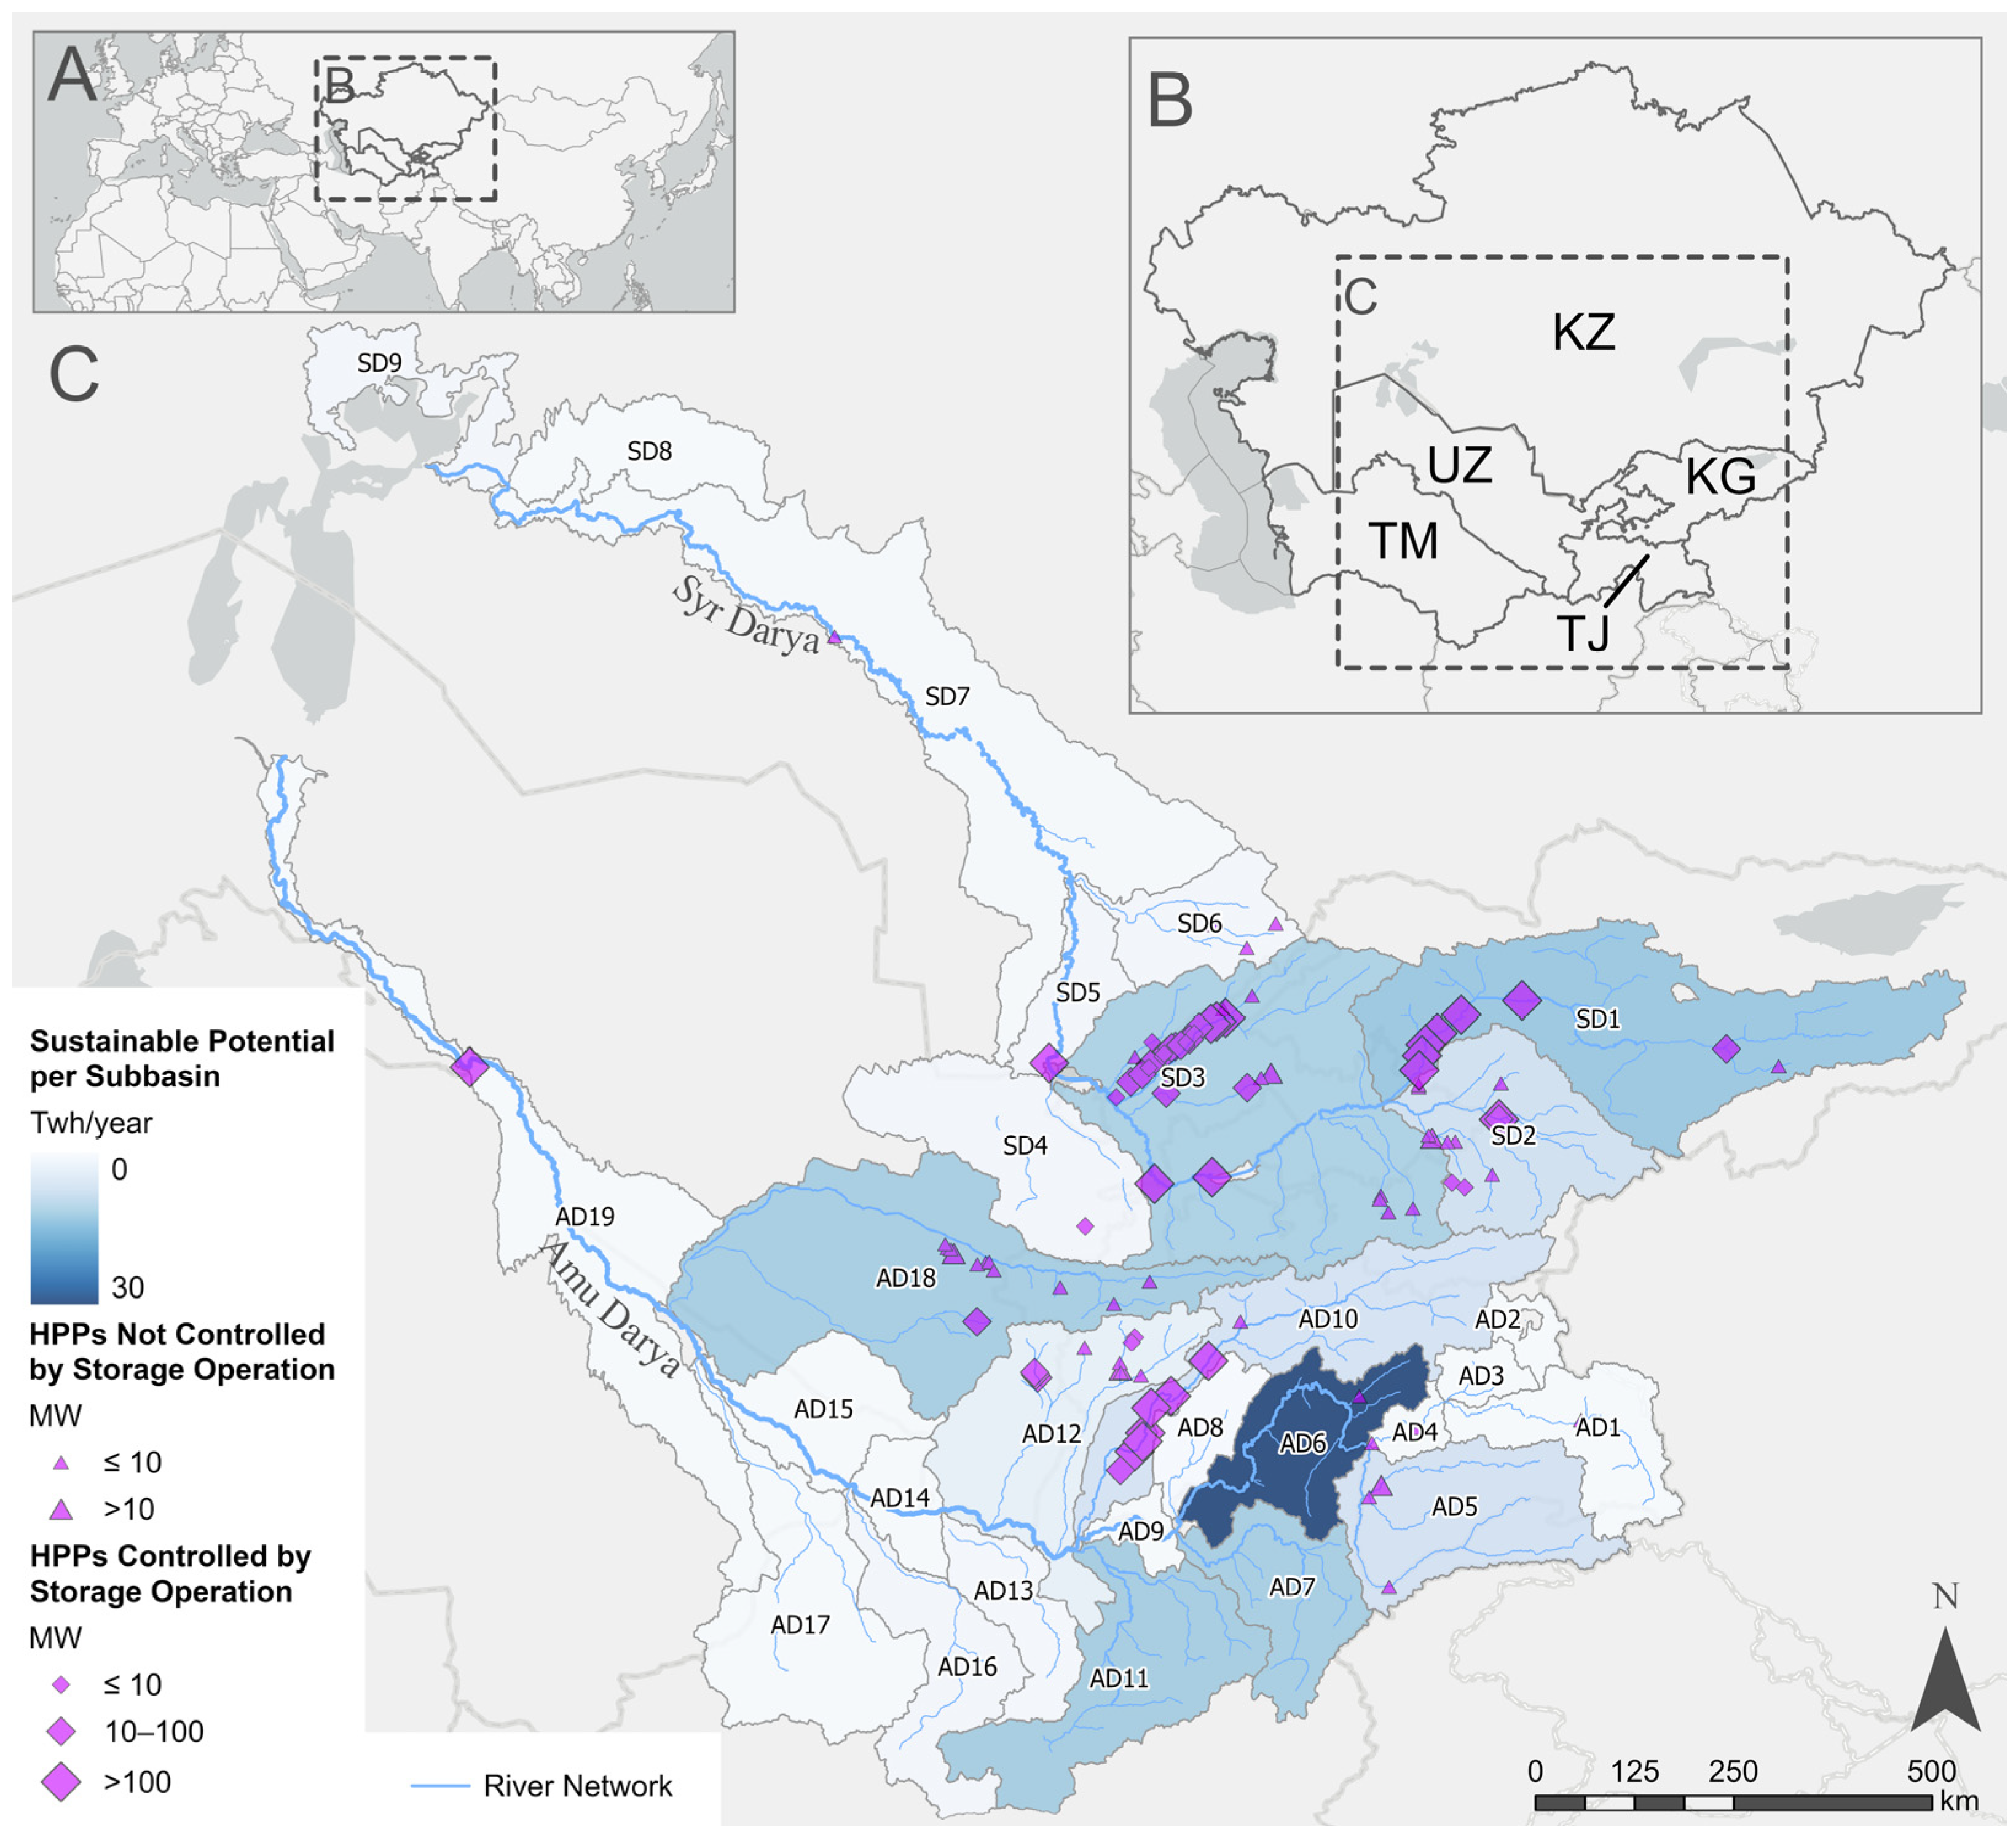
Despite substantial existing HP infrastructure in the Aral Sea Basin, the basins still retain considerable remaining sustainable potential, estimated at around 174 TWh/year (Figure 1) [29]. Most of this untapped potential is concentrated in mountainous upstream regions [3,29], where steep gradients and perennial flows create favourable conditions for further development [35]. However, given the competing demands on shared water resources and the region’s vulnerability to climate change and glacier retreat [36], the need for environmentally and socially sustainable HP planning is increasingly recognised [3,37].

2.2. WEF Nexus SDM

The WEF Nexus SDM represents the complex and dynamic interconnections among water, energy, and food systems within the Aral Sea Basin, integrating climate and socio-economic factors as exogenous drivers.
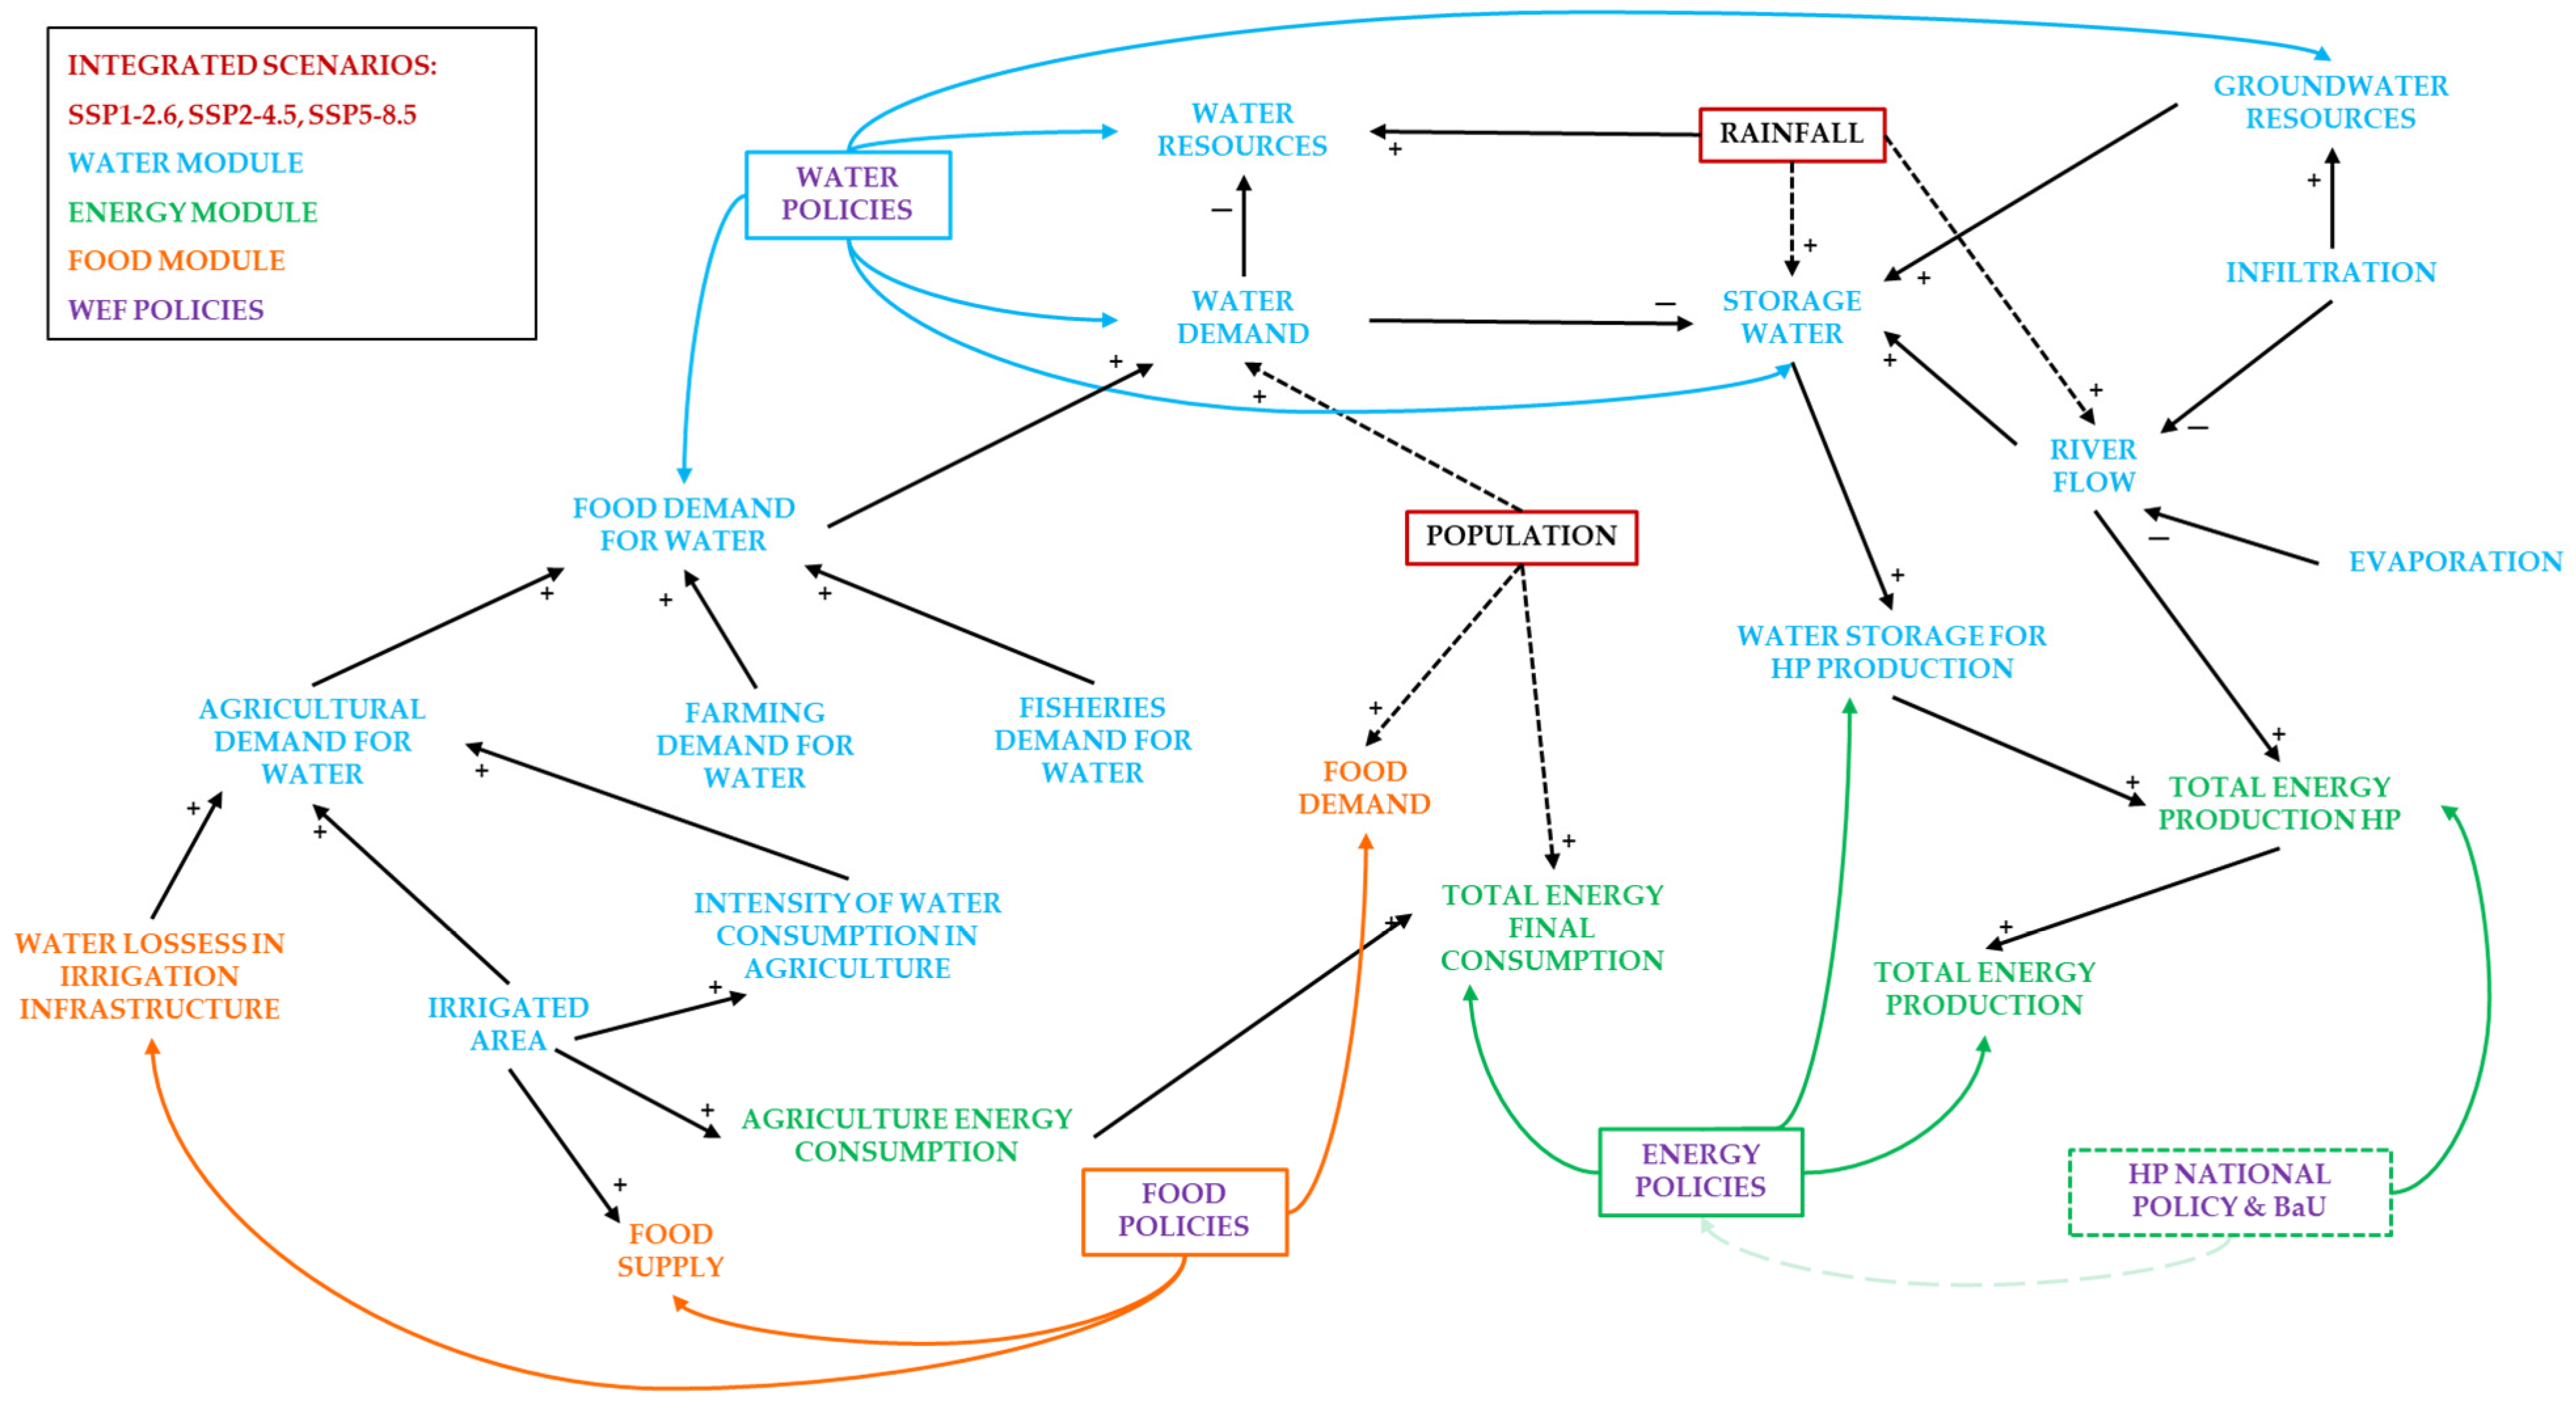
The WEF Nexus SDM captures feedback processes, accumulations, and time delays governing the behaviour of interconnected resource systems over time. The framework is composed of stock, flow, and auxiliary variables, including five stock variables, ten flow variables, and 485 auxiliary or parameter variables [25]. This extensive set of model variables includes endogenous processes and constraints related to irrigation demand, environmental-flow requirements, reservoir storage, and sectoral water withdrawals. The causal relationships linking these subsystems, illustrated in Figure 2, enable the quantitative evaluation of trade-offs, synergies, and feedback loops shaping the WEF Nexus across spatial and temporal scales [39]. The three subsystems of the SDM framework are described below.
The water subsystem evaluates the water availability, storage, and allocation across the SBs, accounting for precipitation, runoff, infiltration, evapotranspiration, and transboundary exchanges between upstream and downstream basins. It represents key stocks, such as surface reservoirs and groundwater, as well as flows related to inflows, withdrawals, and evaporation. Water is allocated among competing sectors, including HP generation, irrigation, and domestic and industrial consumption, while maintaining feedback with the energy and food subsystems [40,41]. One of the key variables of the subsystem is water supply (WS), defined as the total volume of water effectively available to meet sectoral demands within each basin or SB. In the model, water supply (WS) is calculated as the sum of the exploitable fraction of surface water and groundwater inputs, as follows:
WS = (SW × SWSR) + GWI
where WS denotes water supply (hm3), SW represents surface water (hm3), SWSR is the surface-water supply rate (dimensionless, fixed constant that is different for each SB), and GWI denotes groundwater input (hm3). This formulation enables the model to represent the combined contribution of surface and groundwater resources to annual water availability while accounting for the operational limits of water abstraction within each spatial unit. WS should be interpreted as a gross annual water-supply potential rather than the net balance remaining after demand. Population and agricultural demand affect reservoir outputs, return flows, water security and downstream transfers, whereas they are not directly subtracted in Equation (1).
The energy subsystem focuses primarily on HP production and the region’s transition from fossil fuels to renewable energy sources. It simulates total energy generation, supply, and consumption, differentiating between energy carriers (HP, fossil fuels, solar, and wind) and capturing the physical linkages to water resources through HP generation and irrigation pumping requirements. In this subsystem, cumulative HP potential is defined as the accumulated installed HP capacity available within the system over the simulation horizon, accounting for newly incorporated HP capacity and decommissioned capacity. It is expressed as
H P t = H P ( t 0 ) + t 0 t [ N H P ( τ ) D H P ( τ ) ] d τ
where HP(t) is the total installed HP capacity at time t (MW), HP(t0) is the existing installed capacity at the model initialization time t0 (MW), and NHP(τ) DHP(τ) are the annual rates of newly incorporated and decommissioned HP capacity (MW/year), respectively. The symbol τ denotes the integration variable, whereas t represents the time at which installed capacity is evaluated. This stock-based formulation is consistent with the SD structure of the energy subsystem, in which installed HP capacity is accumulated over time and subsequently constrained by the sustainable and remaining HP potential before being converted into annual HP production using active operating hours. At this temporal resolution, the model supports strategic comparison of long-term hydropower expansion, reservoir capacity, irrigation efficiency, renewable energy and spatial water-allocation pathways, rather than operational scheduling. The annual time step also reflects the limited availability of consistent sub-annual data reservoir releases, hydropower operation and irrigation withdrawals across the 28 sub-basins. Given the annual time step of the model, the stock is numerically updated once per simulation year, intra-annual seasonal flow regimes are not explicitly simulated. Instead, the effects of seasonal hydrological variability are implicitly reflected in the annual flow-related input data used to parameterize the model. The subsystem is therefore sensitive to hydrological variability insofar as it affects annual water availability for HP production and irrigation-related energy demand. This enables the assessment of how energy policies or HP expansion plans may influence water and food security, while recognising that detailed seasonal operational dynamics are outside the temporal resolution of the model [3,42,43].
The food subsystem represents the agricultural dimension of the Nexus, capturing water demand for crop production, agricultural yields, and trade balances. It integrates irrigated and rainfed crop systems, livestock water requirements, and food imports or exports. Through its links with the water subsystem, it quantifies how changes in irrigation efficiency, crop allocation, or land-use policies influence total water withdrawals and food security outcomes [44,45,46,47]. One of the key variables of the subsystem is food supply (FS), defined as the total amount of food resources, livestock and poultry food resources, and food imports. Accordingly, food supply (FS) is expressed as
FS = AFR + LPFR + FI
where FS is food supply (tonnes), AFR denotes agricultural food resources (tonnes), LPFR denotes livestock and poultry food resources (tonnes), and FI represents food imports (tonnes). This formulation enables the model to assess food availability as a function of both endogenous food production and external food inflows, thereby supporting the evaluation of food security within the WEF Nexus framework. Equation (3) represents the final food-supply balance rather than the full water-allocation mechanism. Agricultural demand, reservoir storage and hydropower requirements interact through the shared sub-basin water balance, thereby affecting irrigation availability and downstream flows. The complete equations and interlinkages are provided in the work of Pérez Pérez et al. [25].
Spatial differentiation is achieved by disaggregating the model into the corresponding sub-basins (SBs), following the HydroSHEDS—level 5 delineation [30], with 19 SBs in the Amu Darya and nine in the Syr Darya basin. This approach reflects the hydrological heterogeneity of the Aral Sea Basin and the interdependencies among riparian states. The spatial representation is implemented through subscripts in the Vensim® DSS 9.4.2 (Decision Support System) software [48], which enable the simultaneous simulation of upstream–downstream dynamics without redundancy in equations [41,49].
Finally, the WEF-Nexus SDM operates on an annual time step over the period 2015 to 2050, using historical data from 2015 to 2023 for calibration. The calibration process presented the work of in Perez et al., 2025, achieved a robust correspondence between simulation and observed data across three key dimensions of the WEF Nexus: final water discharge to the Aral Sea Basin (Mean Absolute Error (MAE) < 5%), energy balance (MAE = 4.6%), and agricultural water demand (basin-wide MAE = 1.2%) [25].

2.3. Policy Implementation and Scenario Development in the WEF Nexus SDM

Scenario development in the WEF Nexus SDM integrates climate, socio-economic, and policy dimensions to evaluate the long-term implications of alternative development pathways for the Aral Sea Basin, allowing for an integrated exploration of trade-offs and synergies under future uncertainty [50,51]. The selected scenarios and policy measures were intended to represent both a broad range of plausible future conditions and the principal development priorities currently shaping the WEF Nexus in Central Asia. Therefore, the WEF Nexus model adopts a multi-layered scenario architecture that builds upon three main scenario blocks, as shown in Figure 2:
  • Combined climate–socioeconomic scenarios (SSP-RCP) [26,27], which are incorporated into the model through rainfall and population variables (Section 2.3.1);
  • WEF-related policy scenarios, covering water efficiency measures, renewable energy deployment or agricultural subsidies (Section 2.3.2);
  • HP development scenarios, encompassing both HP–Business as Usual (BaU) and HP–National Plans (NP) expansion trajectories (Section 2.3.3). These two pathways distinguish the continuation of historically observed HP development trends from the implementation of officially announced national projects and targets.
The previous components are incorporated into the SDM through adjustable levers and parameters that modify the behaviour of key variables according to predefined objectives, enabling the SDM to evaluate their combined impacts on WEF resource availability, agricultural productivity or environmental sustainability across spatial and temporal scales. The model structure was specifically designed to ensure consistency between renewable energy policies and HP development pathways. Although HP contributes to renewable energy targets, HP expansion was implemented in the model through dedicated HP development scenarios rather than as part of the WEF-related policy framework. This approach enables the coherent representation of both renewable energy policy objectives and HP infrastructure expansion within the energy subsystem. The HP scenarios are separate only in their specification as exogenous infrastructure pathways and are not dynamically disconnected from the WEF-related policies. Once activated, both components are simulated jointly within the coupled SDM, so HP production and the resulting WEF outcomes respond to changes in water availability, reservoir storage, sectoral water demand and the energy mix. However, the prescribed HP capacity targets do not adjust endogenously in response to the simulated outcomes.

2.3.1. Combined Climate–Socioeconomic Scenarios

To capture a range of plausible future pathways, the model adopts combined SSP-RCP scenarios consistent with the Intergovernmental Panel on Climate Change (IPCC) framework [26,27]. In particular, the study considers a sustainable pathway (SSP1-2.6), a middle-of-the-road trajectory (SSP2-4.5), and a high-emissions fossil-fuelled development scenario (SSP5-8.5). Although the recent Scenario MIP–CMIP7 literature indicates that SSP5-8.5 is increasingly implausible for the 21st century due to renewable energy cost trends, emerging climate policies, and recent emissions trajectories [52], it was retained as a stress-test scenario alongside the more plausible low- and medium-emission futures. These SSP-RCP scenarios drive changes in climate variables, such as precipitation and temperature, as well as socio-economic parameters, including population and economic activity. This enables the model to simulate how external pressures influence transboundary water availability, energy transition, food security, and regional cooperation dynamics across CA through dynamic feedback mechanisms [53].

2.3.2. WEF-Related Policy Framework

Within this scenario context, the policy framework analysed in this study reflects the growing integration of WEF considerations into national development strategies across CA through measures related to resource efficiency, renewable energy expansion, infrastructure development and climate adaptation [54,55].
  • Water-related policies mainly target irrigation efficiency improvements, a reduction in water losses, and modernization of storage and distribution infrastructure to address the region’s high agricultural water demand [56].
  • Energy policies prioritise the expansion of renewable energy sources (RES), particularly HP, solar, and wind, through infrastructure development and long-term decarbonization targets, while some countries also maintain investments in thermal generation to ensure supply reliability during the transition [57,58,59,60,61,62].
  • Food-related objectives are addressed indirectly through water and energy policies aimed at improving irrigation management, stabilising WS, and enhancing agricultural resilience, complemented by environmental measures such as reforestation and watershed management [63].
All selected WEF related NP are presented in Table 1.
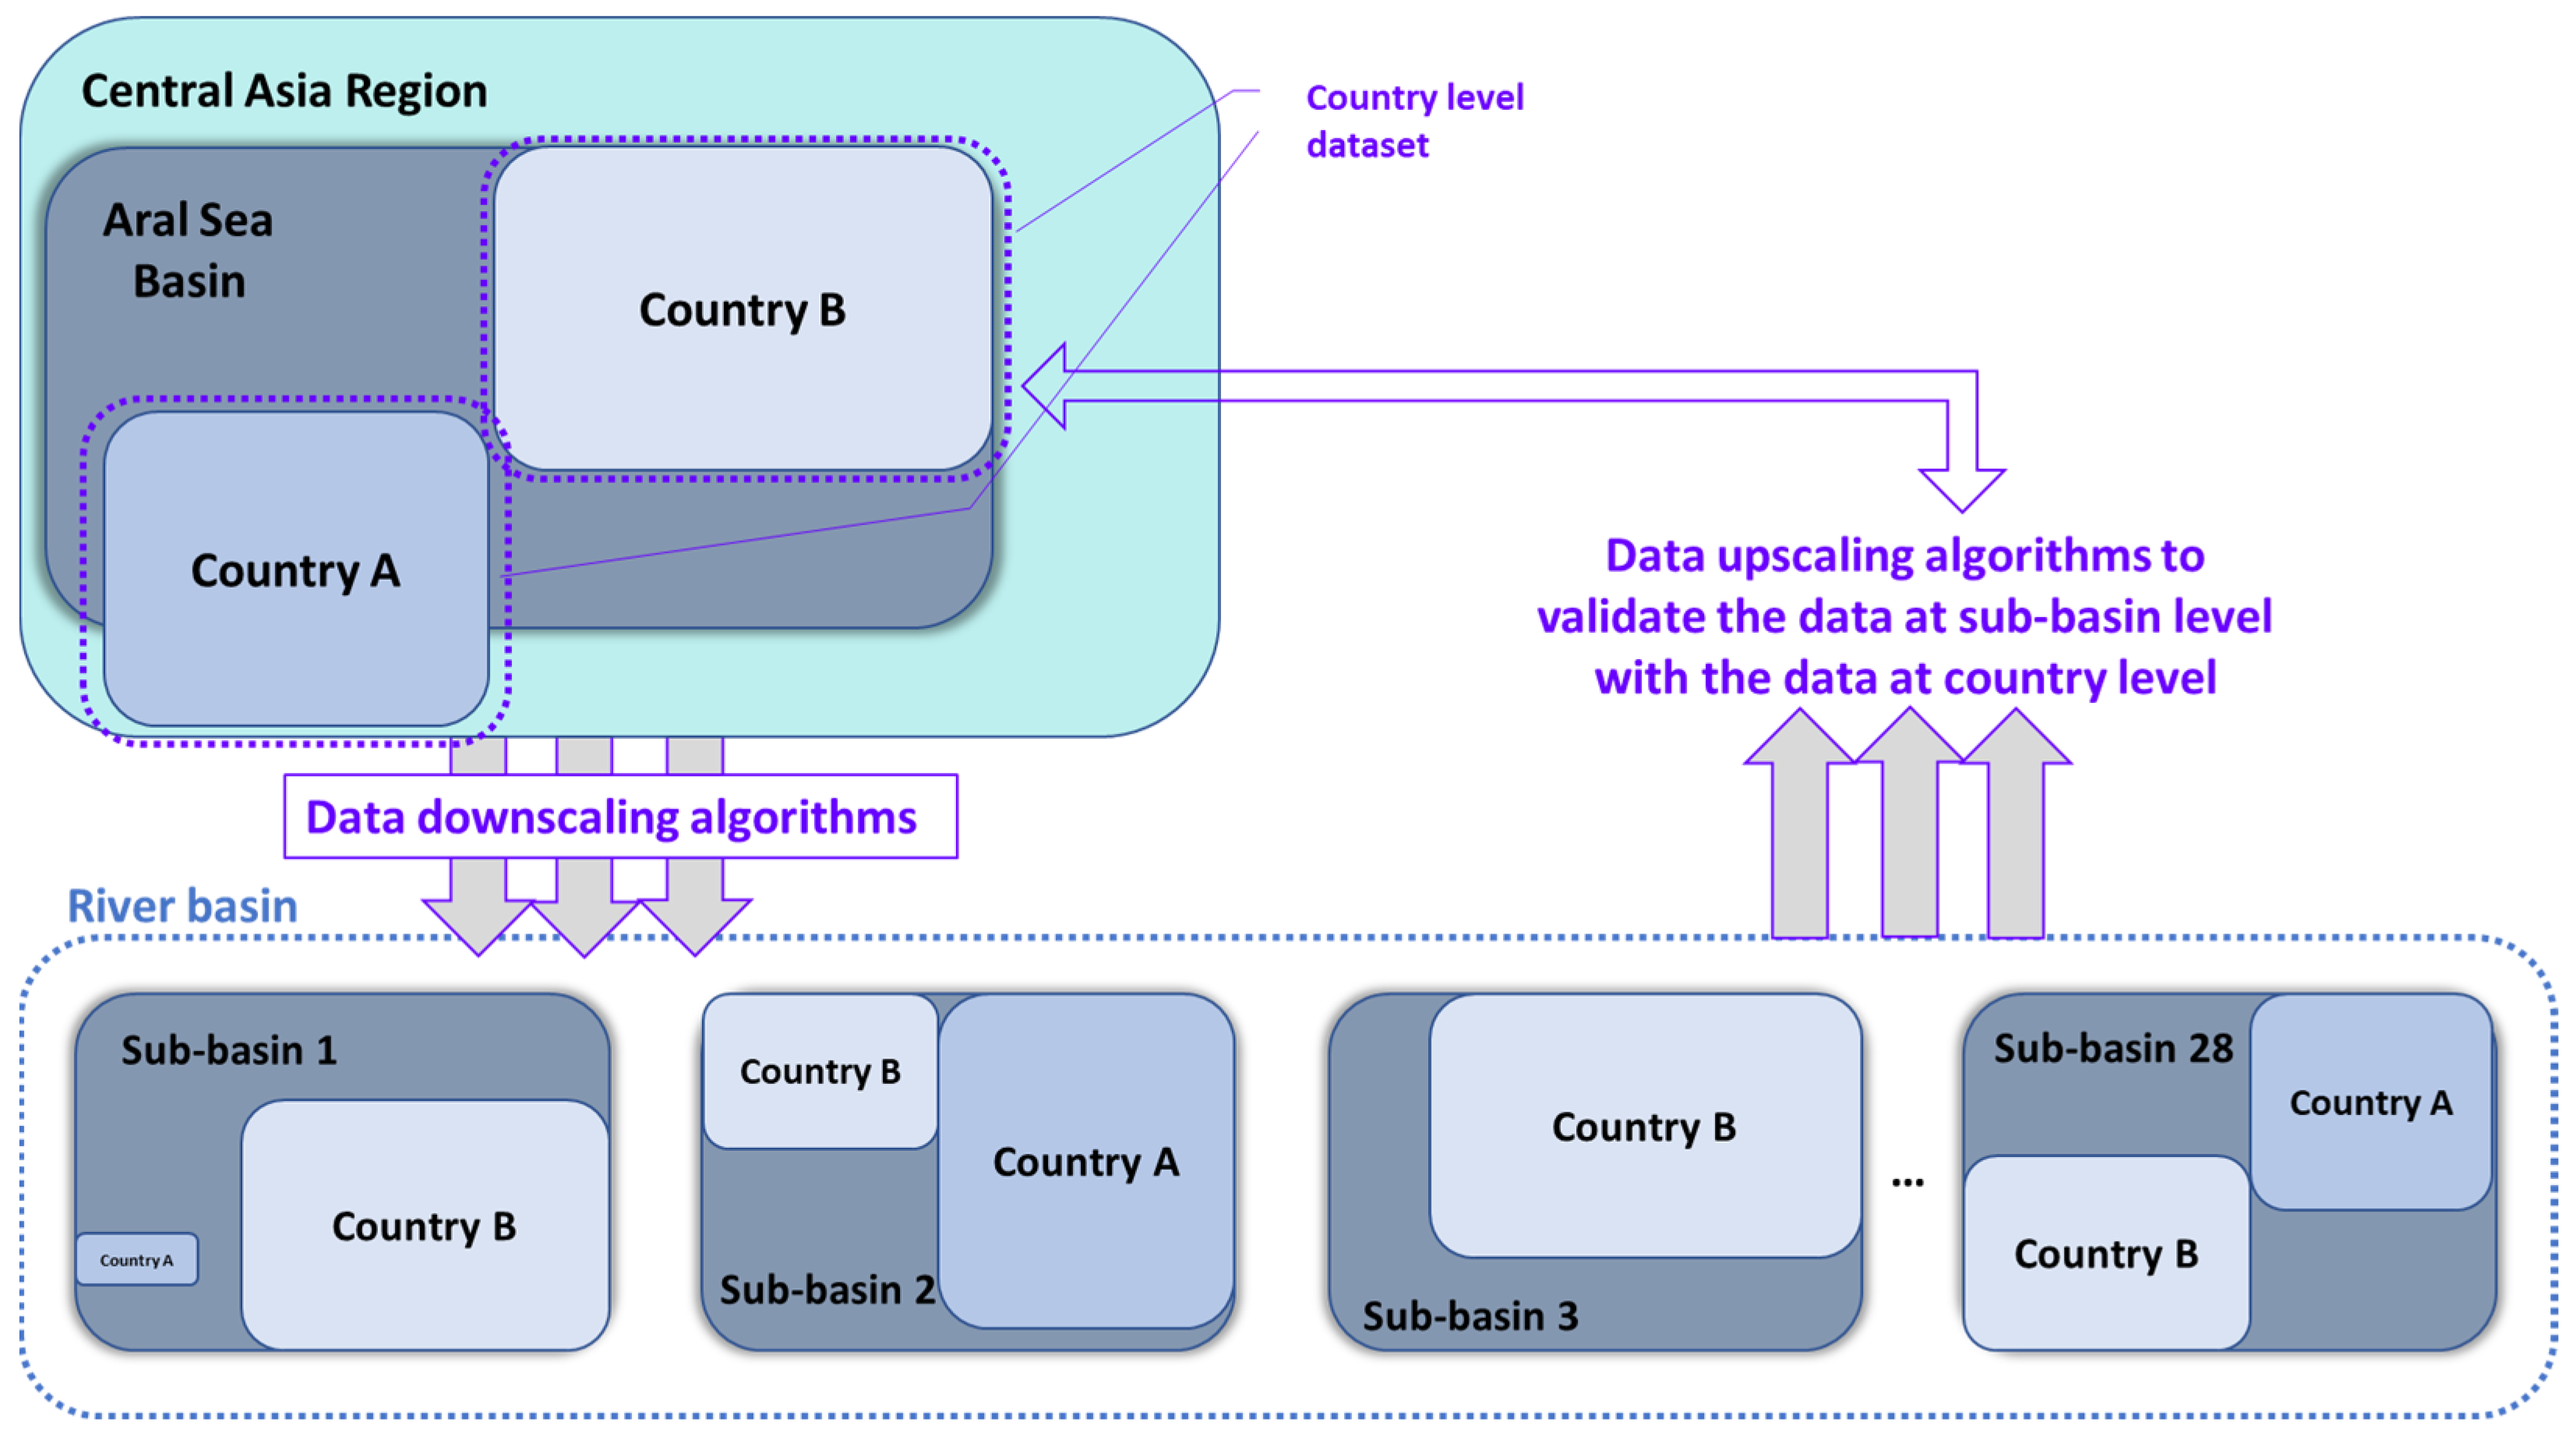
Since the WEF Nexus SDM operates at hydrological units (basin and SB levels), the WEF-related national policies targets presented in Table 1 required a structured downscaling and validation process to enable their integration into the model, as illustrated in Figure 3 [79,80]. The first downscaling step consisted of spatially allocating national targets to SB scale using different drivers according to the policy type: land-based policies (including land use, forest coverage or irrigation infrastructure) were allocated according to the proportion of national territory contained within each SB [81]. For percentage-based targets (such as renewable energy shares or emission reduction commitments), the full target value was assigned to the SB containing the largest share of the country’s territory in order to avoid fractionalization of policy commitments while maintaining consistency with the spatial structure of the model [82]. Following downscaling, a validation step was performed to ensure consistency between the spatially disaggregated targets and the original national policy objectives [83]. As shown in Figure 3, SB-level estimates were aggregated back to the country scale and compared with the original datasets for both absolute and percentage-based indicators. The validation criterion required deviations to remain below a 5% MAE threshold [84], ensuring that the spatial disaggregation preserved both the quantitative consistency and strategic intent of the original policies.
The downscaled WEF-related national policies (Table 1) were then translated into quantifiable model inputs, including targets related to irrigation efficiency, renewable energy deployment, and HP infrastructure development, enabling the evaluation of their systemic effects within the WEF Nexus SDM (Table 2 and Table 3). Although most WEF-related national policies targets are formally defined for 2030 or 2040, the corresponding values were temporally extended to 2050 after their allocation at the SB level, in line with the simulation horizon.

2.3.3. Hydropower Development Scenarios

Given the central role of HP in the regional WEF Nexus, two dedicated HP development scenarios were defined (Table 2): (i) The business-as-usual (HP-BaU) scenario assumes HP grows at historically observed rates derived from an existing HP inventory [38]. By fitting a growth model characterised by the compound annual growth rate to the last two decades of capacity additions of each country, future installed capacity is projected incrementally. Essentially, the HP-BaU scenario reflects a continuation of existing practices and investment levels, leading to modest capacity increases in each country except Turkmenistan, as no HP growth has happened in recent decades. This provides a reference scenario of minimal intervention. (ii) The national policy (HP-NP) scenario assumes that all currently planned or scheduled HP projects in CA countries are implemented. It is based on an inventory of announced or ongoing HP developments and allocates these new projects into the model timeline by their planned commissioning dates (often around 2030 and 2035) depending on official document or statement [29]. This results in a faster, policy-driven capacity expansion compared to BaU. For modelling, the country-level planned additions are downscaled to SB according to known project locations and capacities. The HP-NP scenario thus represents a concerted effort by each nation to fulfil its HP development agenda.
Table 2. HP targets for BaU and HP scenarios per country.
CountryHP-BaU Scenario (Target Year)HP-NP Scenario (Target Year)
Kazakhstan3091 MW (2035)3439 MW (2035)
Kyrgyzstan3184 MW (2035)5591 MW (2035)
Tajikistan5241 MW (2030)9000 MW (2030)
Turkmenistan0 MW 0 MW
Uzbekistan2108 MW (2030)5000 MW (2030)

3. Results

3.1. WEF-Related Policies Across Basins and Sub-Basins

Table 3 summarises the resulting aggregated targets for the Syr Darya and Amu Darya basins by 2050. Although the results were downscaled and implemented at both the sub-basin and basin levels, only basin-level aggregates are presented here for clarity and readability.
Table 3. Basin-level downscaled WEF-related national policies targets for Syr Darya and Amu Darya river basins by 2050.
Policy Name in the WEF Nexus SDMSectorTarget
Syr Darya
Construction of new reservoirsWaterIncrease in water storage capacity by 335 hm3
Boost water efficiencyWaterDecrease in water demand by 11,900 hm3
Water efficiency in irrigationWater and FoodDecrease of 34% in water losses due to irrigation
Water-saving in livestock and poultryWater and FoodDecrease of 17% in water demand for farming
Changes in the irrigated areaWater and FoodDecrease of 6.1% in irrigated land and a consequent increase of 6.1% in non-irrigated land
Increase wind and solar energy productionEnergyIncrease energy production by 12,264 GWh
Increase biofuels and waste energy productionEnergyIncrease energy production by 17,367 GWh
Increase RES production *EnergyIncrease of 10% in the share of RES in the energy mix and a corresponding decrease 10% in the share of fossil fuels
Decrease in GHG emissionsEnergyDecrease of 20% in CO2 as a result of increased RES in the energy mix
Amu Darya
Water efficiency in irrigationWater and FoodDecrease of 30% in water losses through irrigation
Water saving in livestock and poultryWater and FoodDecrease of 10% in water demand for farming
Changes in the irrigated areaWater and FoodDecrease of 5.5% in irrigated land and a consequent increase of 5.5% in non-irrigated land
Increase wind and solar energy productionEnergyIncrease energy production by 6793 GWh
Increase biofuels and waste energy productionEnergyIncrease energy production by 20,586 GWh
Increase RES production *EnergyIncrease of 19% in the share of RES in the energy mix and a corresponding decrease of 19% in the share of fossil fuels
Decrease in GHG emissionsEnergyDecrease of 20% CO2 as a result of increased RES in energy
Notes: * When the policy “increase RES production” is activated, the model is configured to prevent the simultaneous activation of specific renewable energy policies (i.e., wind, solar, biofuels, and waste energy production). In such cases, only one alternative is implemented at a time to ensure a consistent and non-overlapping evaluation of the policy effects.
In the Syr Darya basin (Table 3), stronger emphasis is placed on water management and infrastructure-related policies, with upstream SBs prioritising HP development and water storage while midstream and downstream SBs favour irrigation efficiency and water-saving measures. The Amu Darya basin has a stronger focus on energy diversification and demand-side water management, with substantial existing HP capacity in upstream SBs and growing water-use pressures in downstream SBs with higher agricultural dependence and water stress. Policy targets prioritise reducing irrigation losses, improving water-use efficiency, and expanding non-HP renewable sources such as solar, wind, biofuels, and waste-to-energy.

3.2. Hydropower Development Scenarios Across Basins and Sub-Basins

The spatial downscaling of the two HP development scenarios identified in Section 2.3.2 produced basin- and sub-basin-level capacity estimates for integration into the WEF Nexus SDM. Table 4 and Table 5 present the resulting allocations for the Syr Darya and Amu Darya basin, respectively. The higher BaU than NP values in some sub-basins reflect the concentration of BaU growth in already-developed areas, while part of the NP capacity may remain unallocated at the sub-basin scale.

3.3. Basin-Wide Policy Implementation and Future WEF Projections

This section compares the three basin-wide scenario configurations defined in Table 6, which represent alternative combinations of climate–socioeconomic conditions, WEF-related policies and HP development pathways. The simulations evaluate their effects on the main WEF Nexus variables, namely WS, installed HP capacity and FS. The baseline scenario explores the influence of alternative SSP-RCPs, while the two policy scenarios assess the additional effects of renewable-energy policies combined with either business-as-usual (HP-BaU) or national policy (HP-NP) hydropower development pathways.

3.3.1. Water Supply Response to Basin-Wide Policy Implementation

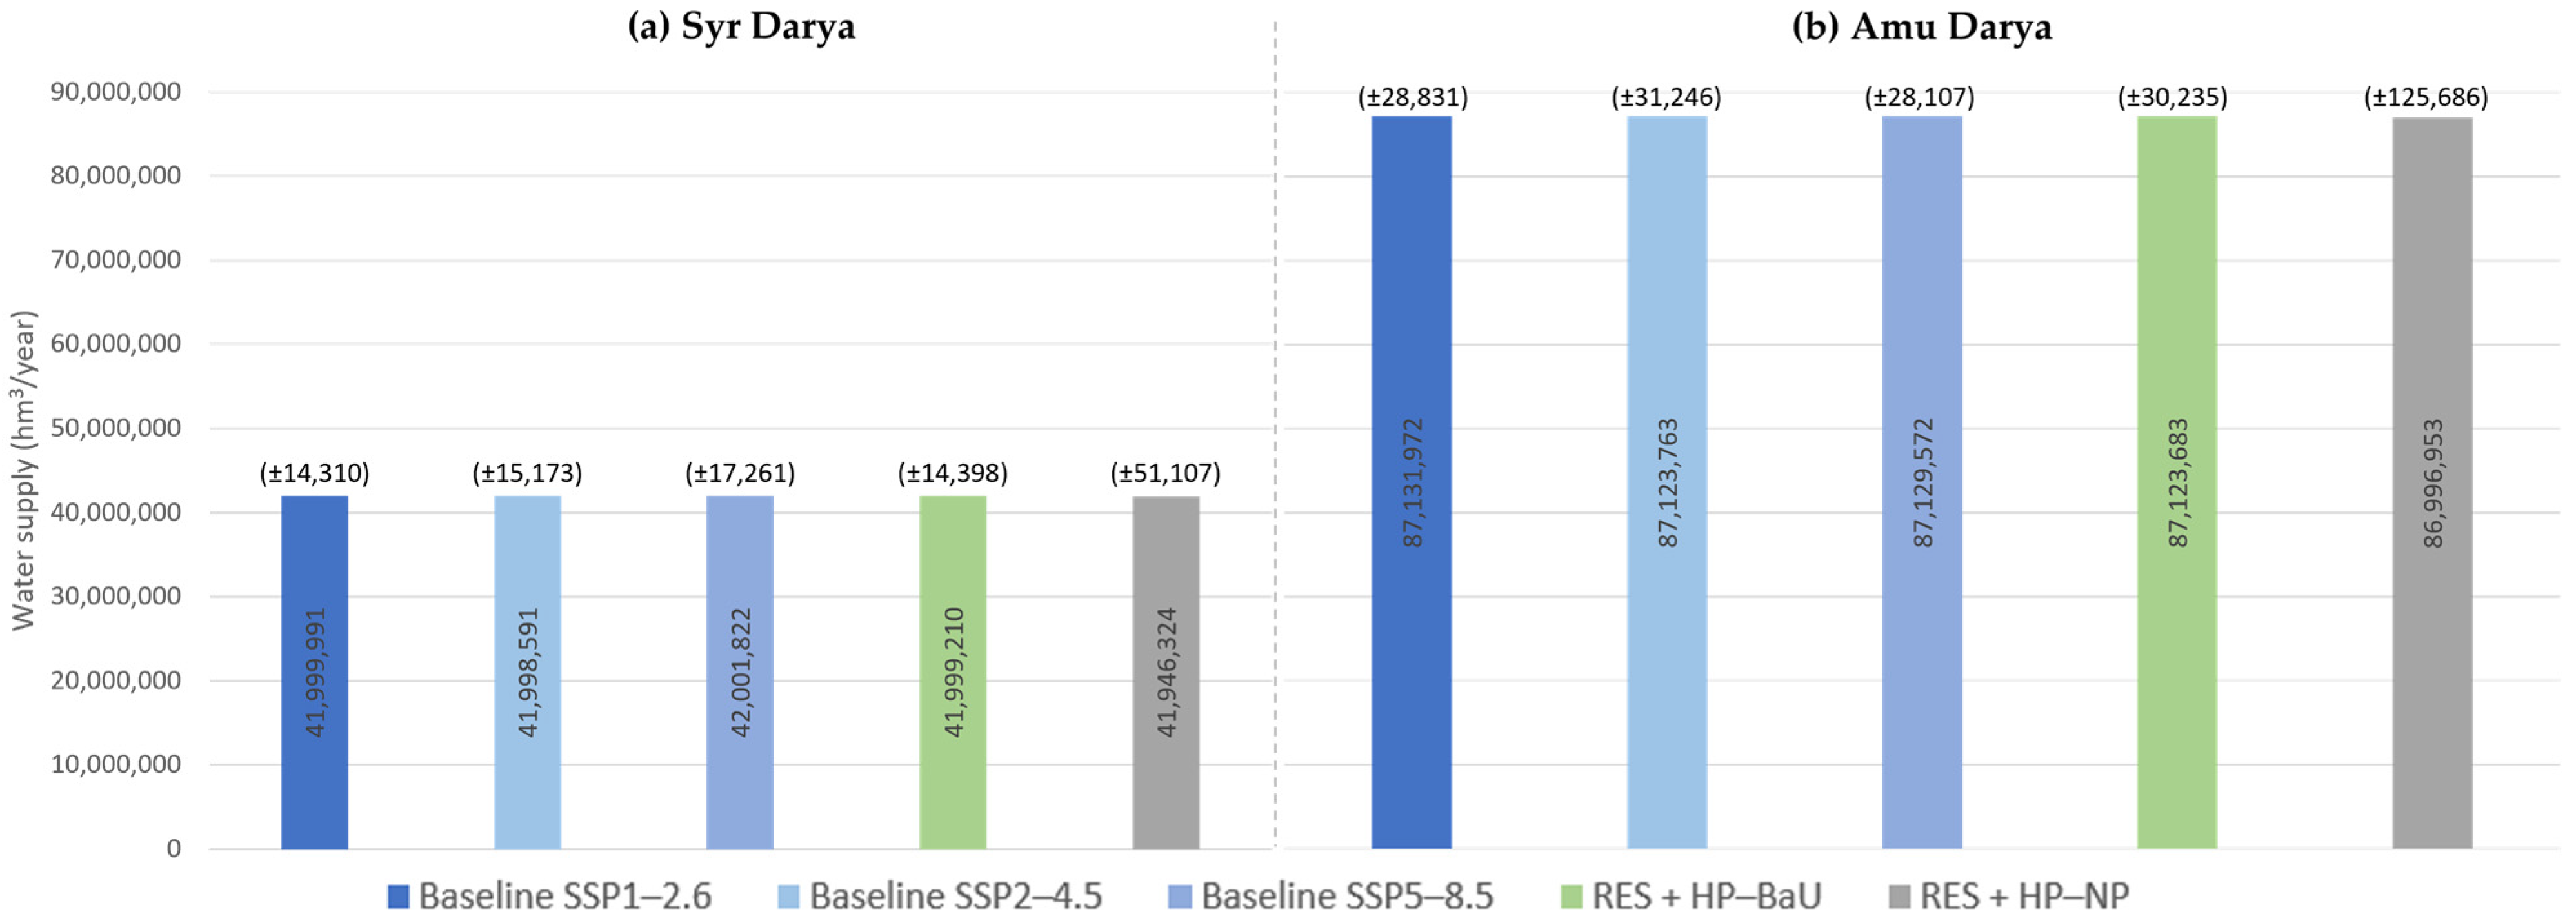
Figure 4 compares basin-scale water supply under the three basin-wide scenarios. Across all scenarios, water supply remains remarkably stable in both river basins, indicating that neither renewable-energy policies nor alternative HP development pathways substantially modify annual basin-scale water availability.
Under the baseline scenario, which represents the endogenous evolution of the WEF Nexus without additional policy interventions, water supply is primarily controlled by the climate-socioeconomic assumptions represented by the three SSP-RCPs. In the Syr Darya basin (Figure 4a), mean annual water supply remains close to 42 million hm3/year under all climate scenarios, with only minor differences between pathways. Similarly, in the Amu Darya basin (Figure 4b), mean annual water supply remains close to 87 million hm3/year, approximately twice the value observed in the Syr Darya basin. Interannual variability is consistently low across all scenarios, ranging from ±14,310 to ±17,761 hm3/year in the Syr Darya basin and from ±12,672 to ±12,971 hm3/year in the Amu Darya basin. The slightly higher variability observed under SSP5-8.5 in the Syr Darya basin suggests a modest increase in year-to-year fluctuations under the most adverse climate pathway, whereas variability remains virtually unchanged across scenarios in the Amu Darya basin.
Introducing renewable-energy policies together with the HP-BaU development pathway produces only marginal changes relative to the baseline. Mean annual water supply remains close to 41.99 million hm3/year in the Syr Darya basin and 87.12 million hm3/year in the Amu Darya basin, while interannual variability (±14,998 and ±12,693 hm3/year, respectively) remains within the range observed under the baseline scenario.
Similarly, implementing the more ambitious HP-NP scenario does not substantially alter basin-scale water supply. Mean annual values remain around 41.95 million hm3/year in the Syr Darya basin and 87.00 million hm3/year in the Amu Darya basin, with interannual variability (±15,107 and ±12,969 hm3/year) remaining comparable to that of the baseline and HP-BaU scenarios.
Overall, the three policy configurations produce nearly identical mean water supply values and comparable levels of interannual variability, suggesting that basin-scale water availability is primarily governed by climatic and hydrological conditions rather than by the alternative HP development pathways considered in this study.
The variation among scenarios reflects the fact that the tested renewable-energy and hydropower pathways primarily modify the energy subsystem, while the main annual hydrological inputs remain broadly comparable. The slightly larger response under RES+HP-NP is associated with its more rapid and extensive capacity expansion and the resulting influence on storage-related processes. Nevertheless, annual averaging and basin-scale aggregation attenuate these effects and conceal part of the water redistribution occurring among sub-basins.

3.3.2. Basin-Wide Hydropower Capacity Under Alternative Policy Pathways

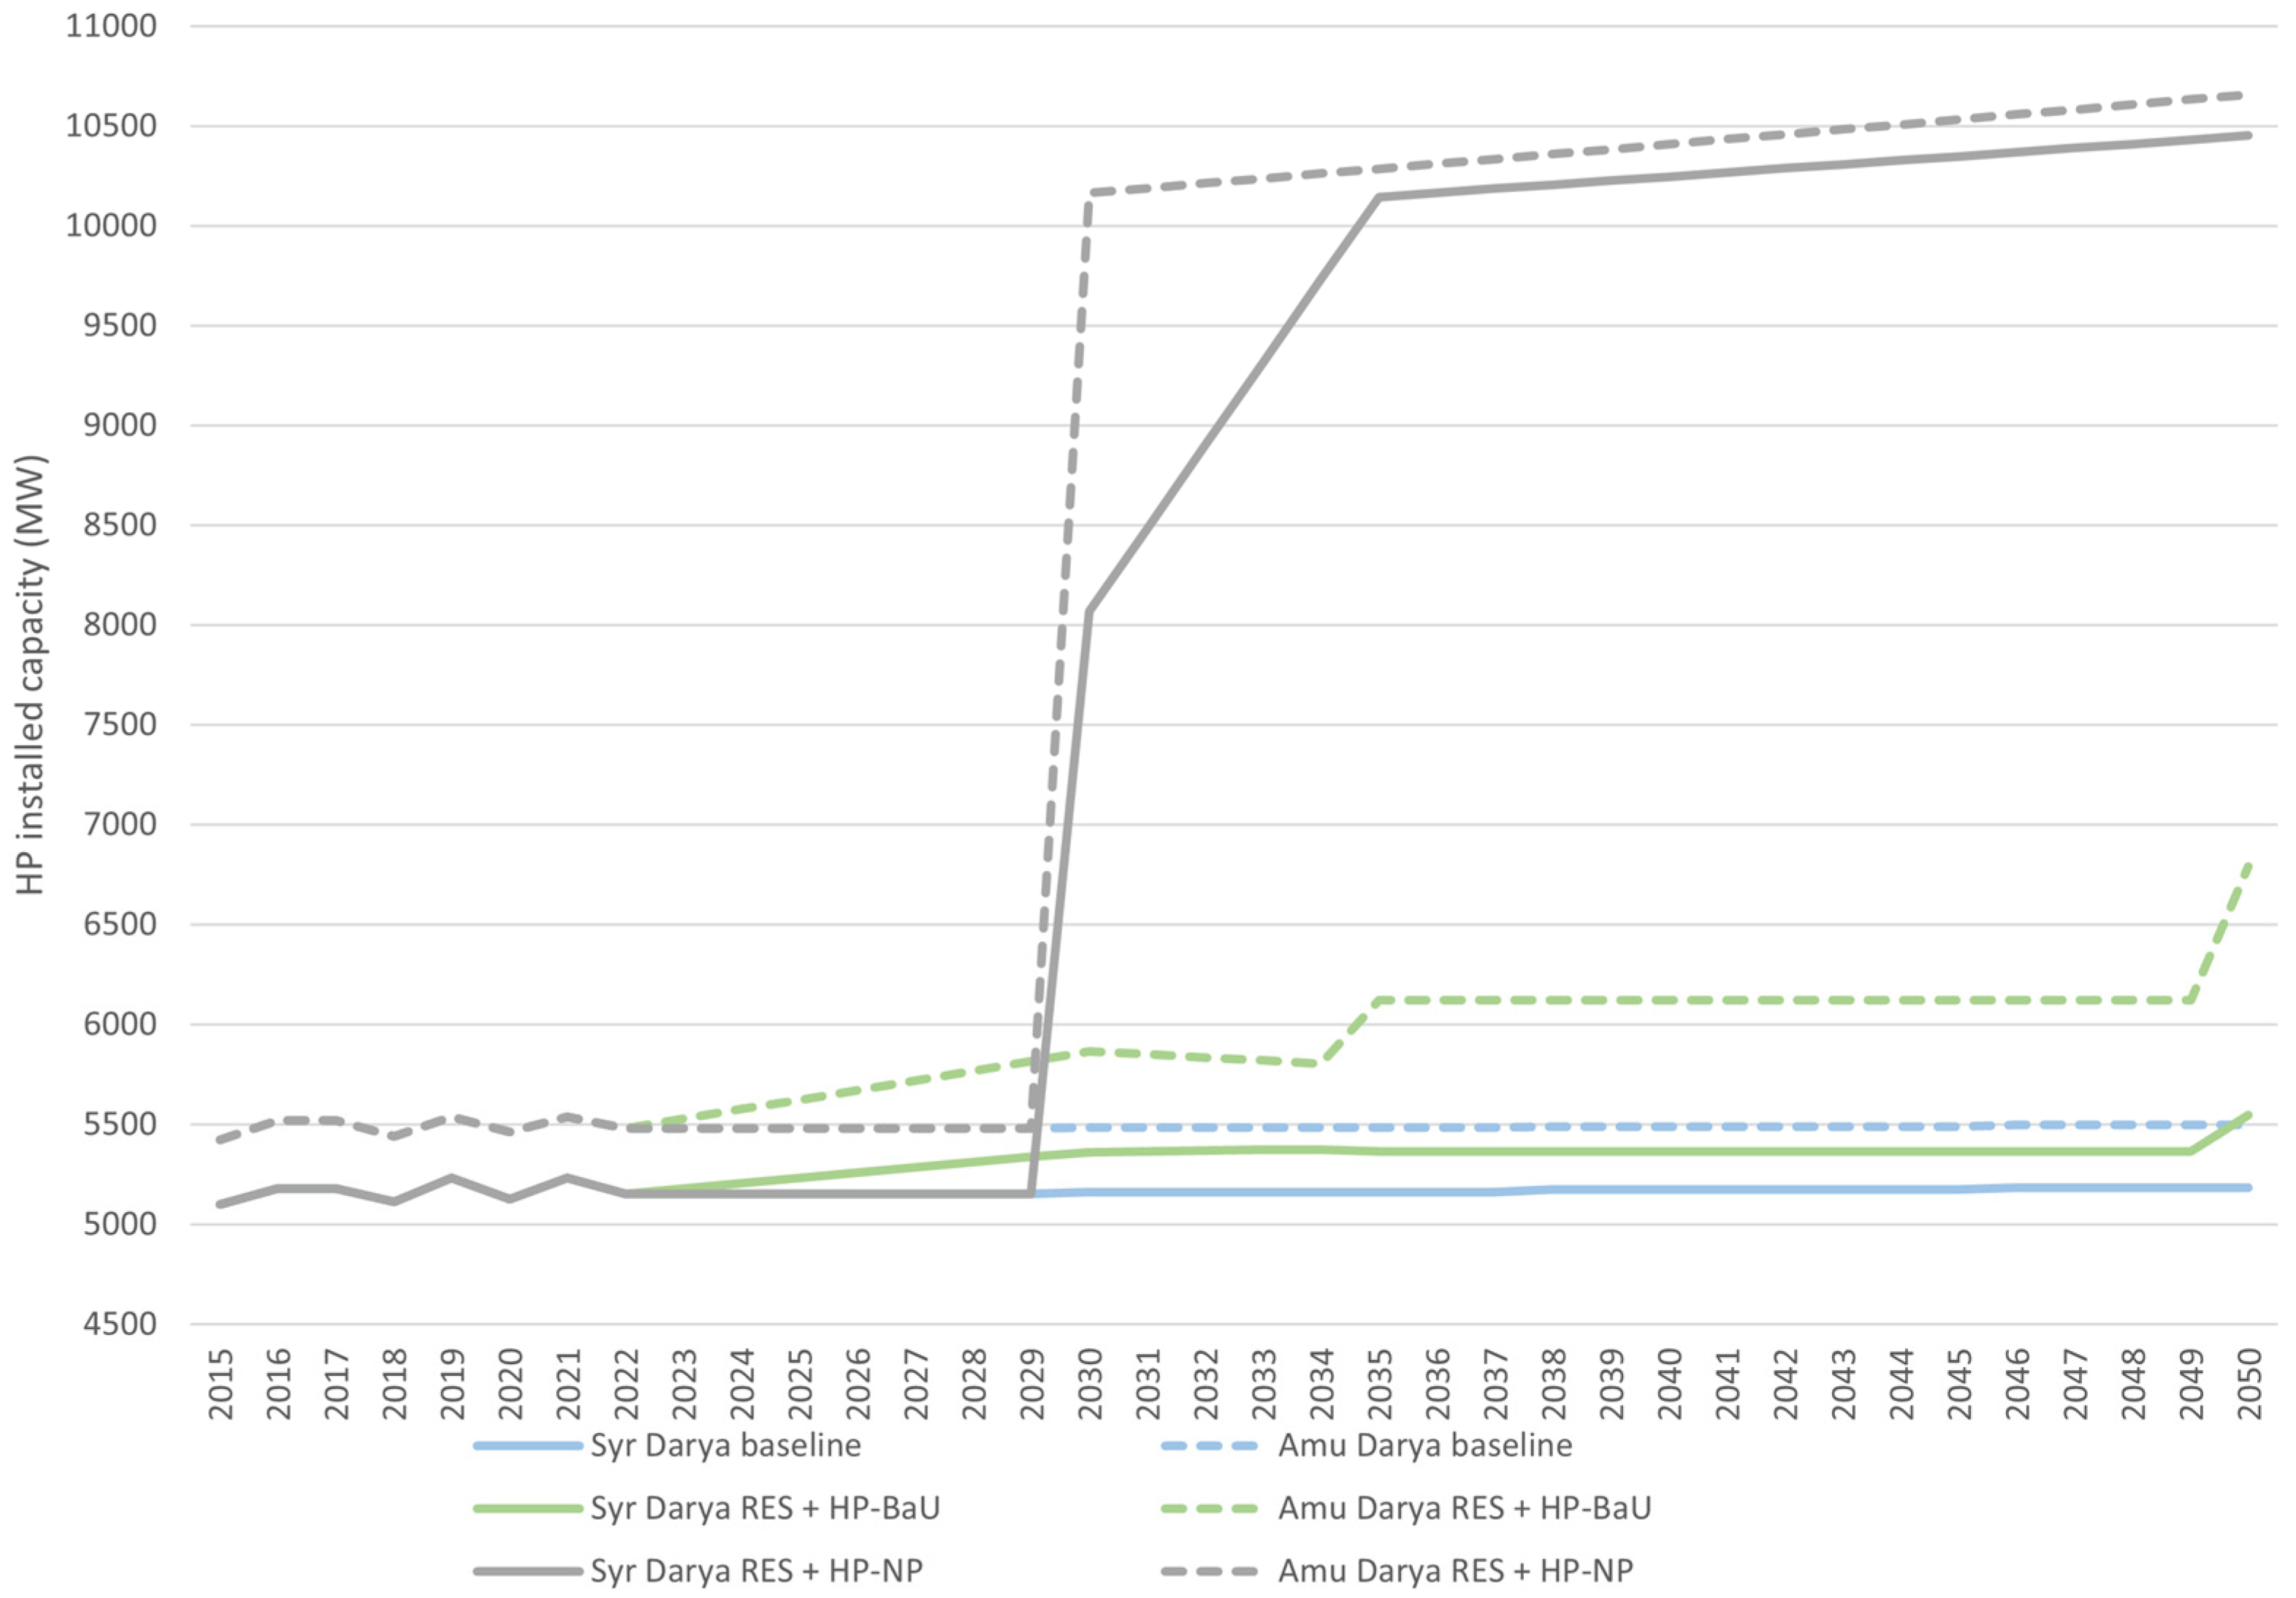
Figure 5 illustrates the evolution of installed HP capacity under the three basin-wide policy configurations. Under the baseline scenario, installed HP capacity follows endogenous WEF Nexus dynamics without explicit expansion targets. No differences are observed among the three SSP-RCPs; therefore, a single baseline trajectory is presented in Figure 5, with solid lines representing the Syr Darya basin and dashed lines representing the Amu Darya basin. Installed capacity increases only slightly during the simulation period, rising from approximately 5100 MW to 5180 MW in the Syr Darya basin (+1.6%) and from approximately 5425 MW to 5500 MW in the Amu Darya basin (+1.3%).
The RES+HP-BaU scenario introduces explicit business-as-usual HP expansion together with renewable-energy policies. Compared with the baseline, installed capacity follows a noticeably steeper trajectory in both basins. In the Syr Darya basin, capacity reaches approximately 5400 MW by 2030 and exceeds 5500 MW by 2050. The Amu Darya basin experiences a stronger increase, with installed capacity rising from around 5425 MW in 2025 to approximately 6800 MW by 2050, reflecting continued infrastructure development under historical growth trends.
The largest changes are observed under the RES+HP-NP scenario, where national HP development plans are fully implemented. Installed capacity exceeds 10,145 MW by 2035 and reaches approximately 10,450 MW by 2050 in the Syr Darya basin. In the Amu Darya basin, capacity surpasses 10,000 MW shortly after 2030 and approaches 10,650 MW by 2050.
These results indicate that HP capacity is the variable most directly affected by policy implementation, with national HP plans approximately doubling installed capacity compared with baseline conditions in both basins, although the Amu Darya basin (dashed lines in Figure 5) exhibits a slightly higher final installed HP capacity than the Syr Darya basin (solid lines in Figure 5).

3.3.3. Basin-Wide Food Supply Under Alternative Policy Pathways

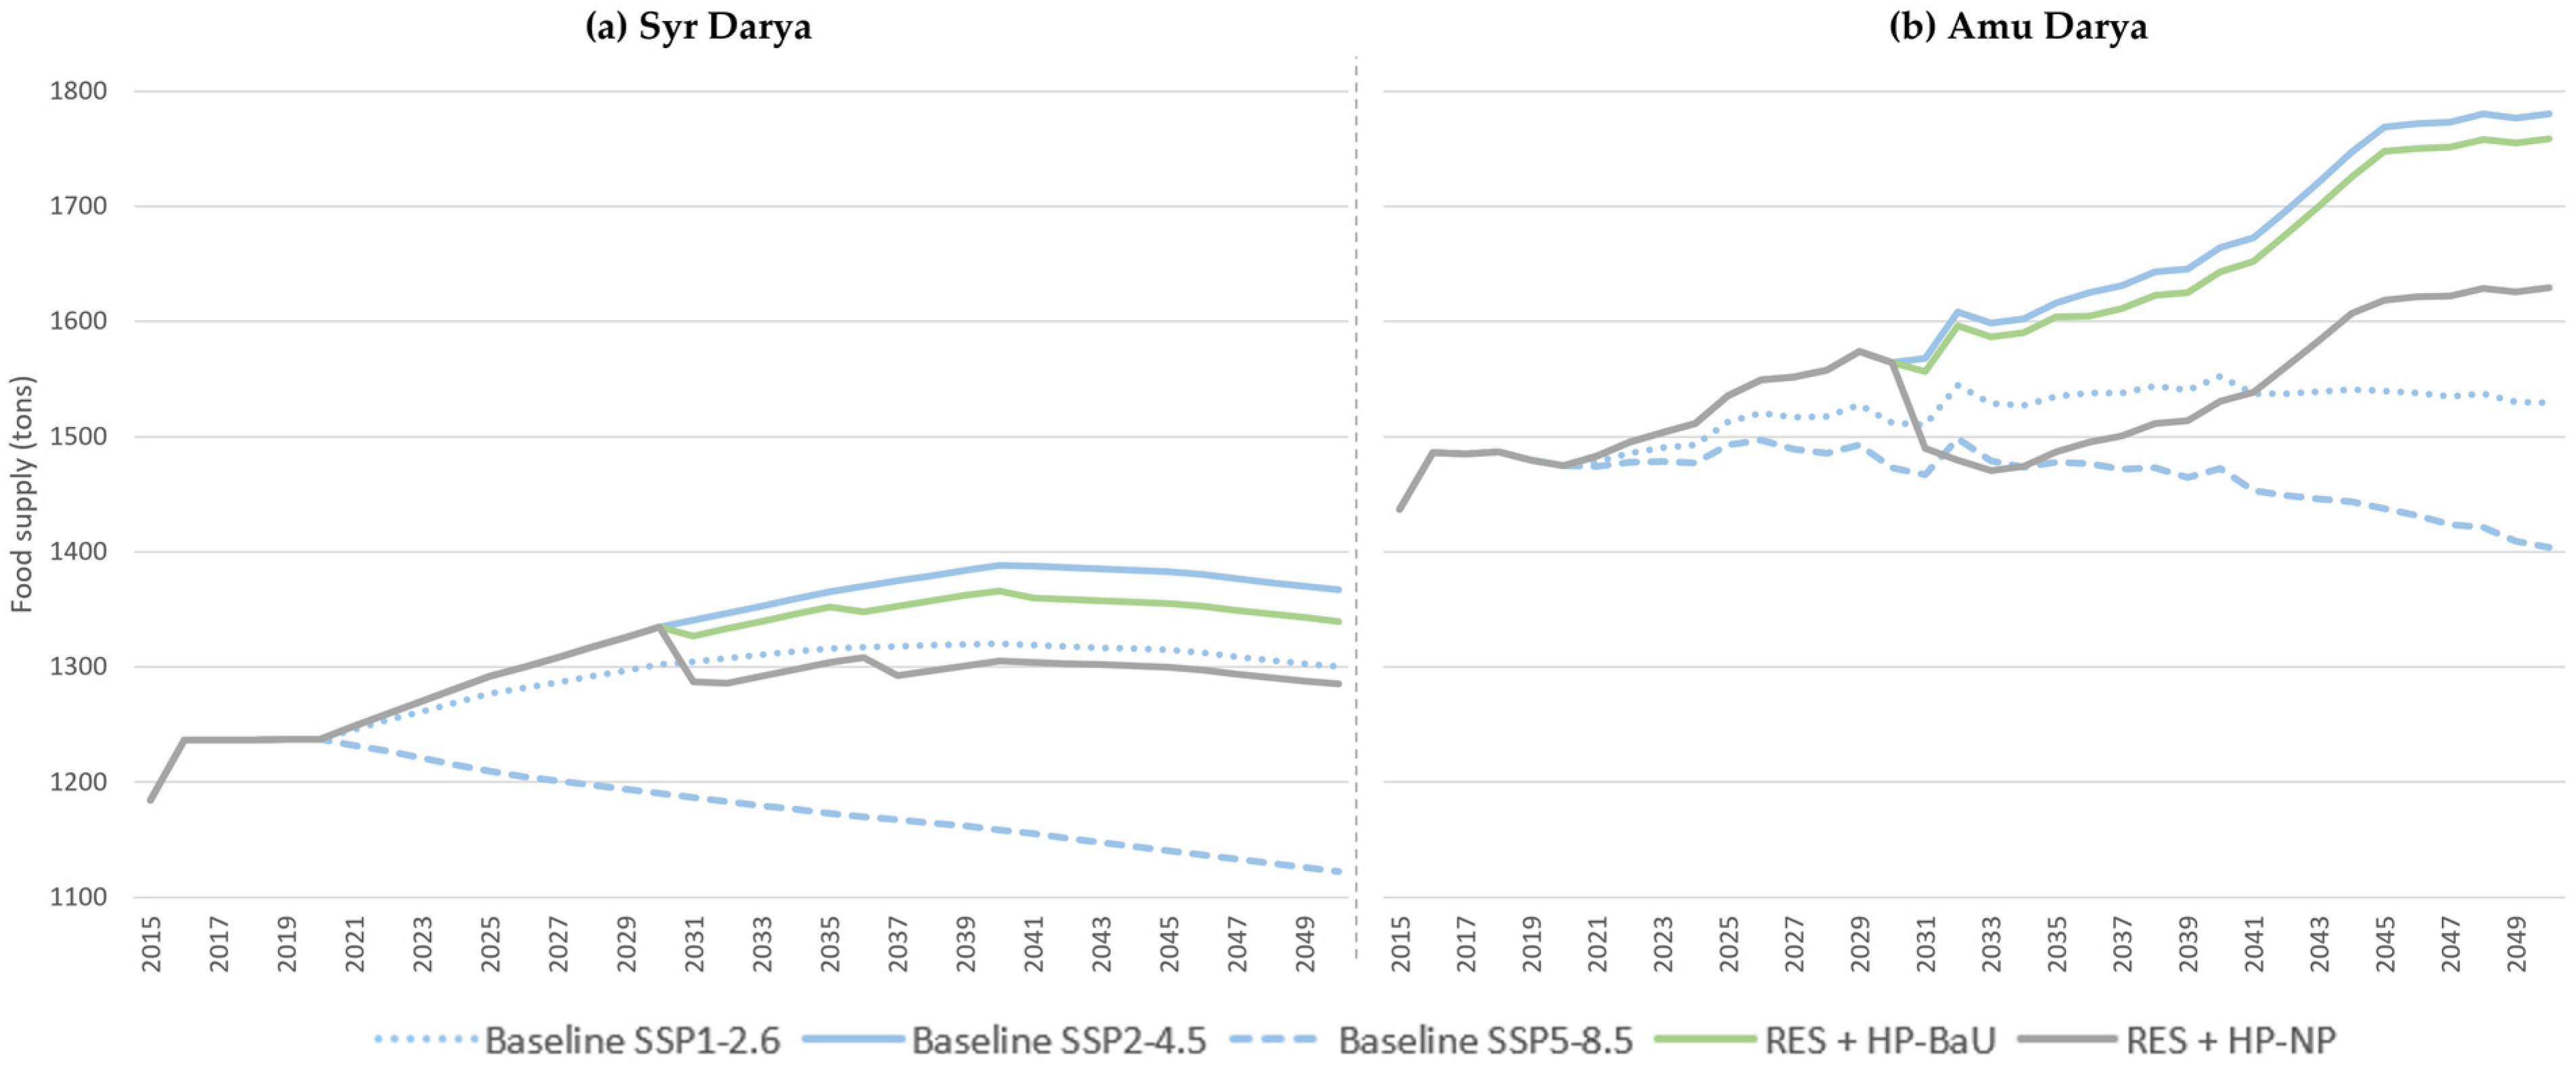
Figure 6 compares food supply trajectories under the three basin-wide policy configurations. Under the baseline scenario, food supply is strongly influenced by the climate-socioeconomic pathway. In both basins, SSP2-4.5 produces the highest food supply throughout the simulation period, SSP1-2.6 follows an intermediate trajectory, and SSP5-8.5 yields the lowest food supply values by 2050. In the Syr Darya basin (Figure 6a), food supply increases until the early 2040s before stabilising under SSP2-4.5, whereas SSP5-8.5 declines after the early 2020s. In the Amu Darya basin (Figure 6b), scenario divergence is more pronounced, with SSP2-4.5 showing sustained growth and SSP5-8.5 progressively declining, reflecting the stronger dependence of this basin on agriculture and irrigation.
Introducing renewable-energy policies together with the HP-BaU pathway produces only limited changes compared with the baseline SSP2-4.5 trajectory. In both basins, food supply follows very similar temporal dynamics, with only marginal differences throughout the simulation period.
Likewise, implementing the HP-NP scenario results in only small additional changes. Despite the substantial increase in installed HP capacity shown in Figure 5, food supply remains close to the baseline SSP2-4.5 and HP-BaU trajectories in both river basins, maintaining a gradual increase followed by slight stabilisation towards the end of the simulation period.
Overall, food supply is considerably more sensitive to the underlying climate–socioeconomic assumptions than to the alternative HP development pathways evaluated. The policy scenarios analysed here substantially modify the energy subsystem but exert only moderate influence on basin-scale agricultural production.

3.4. Upstream–Downstream Differentiated Policy Implementation and Future WEF Projections

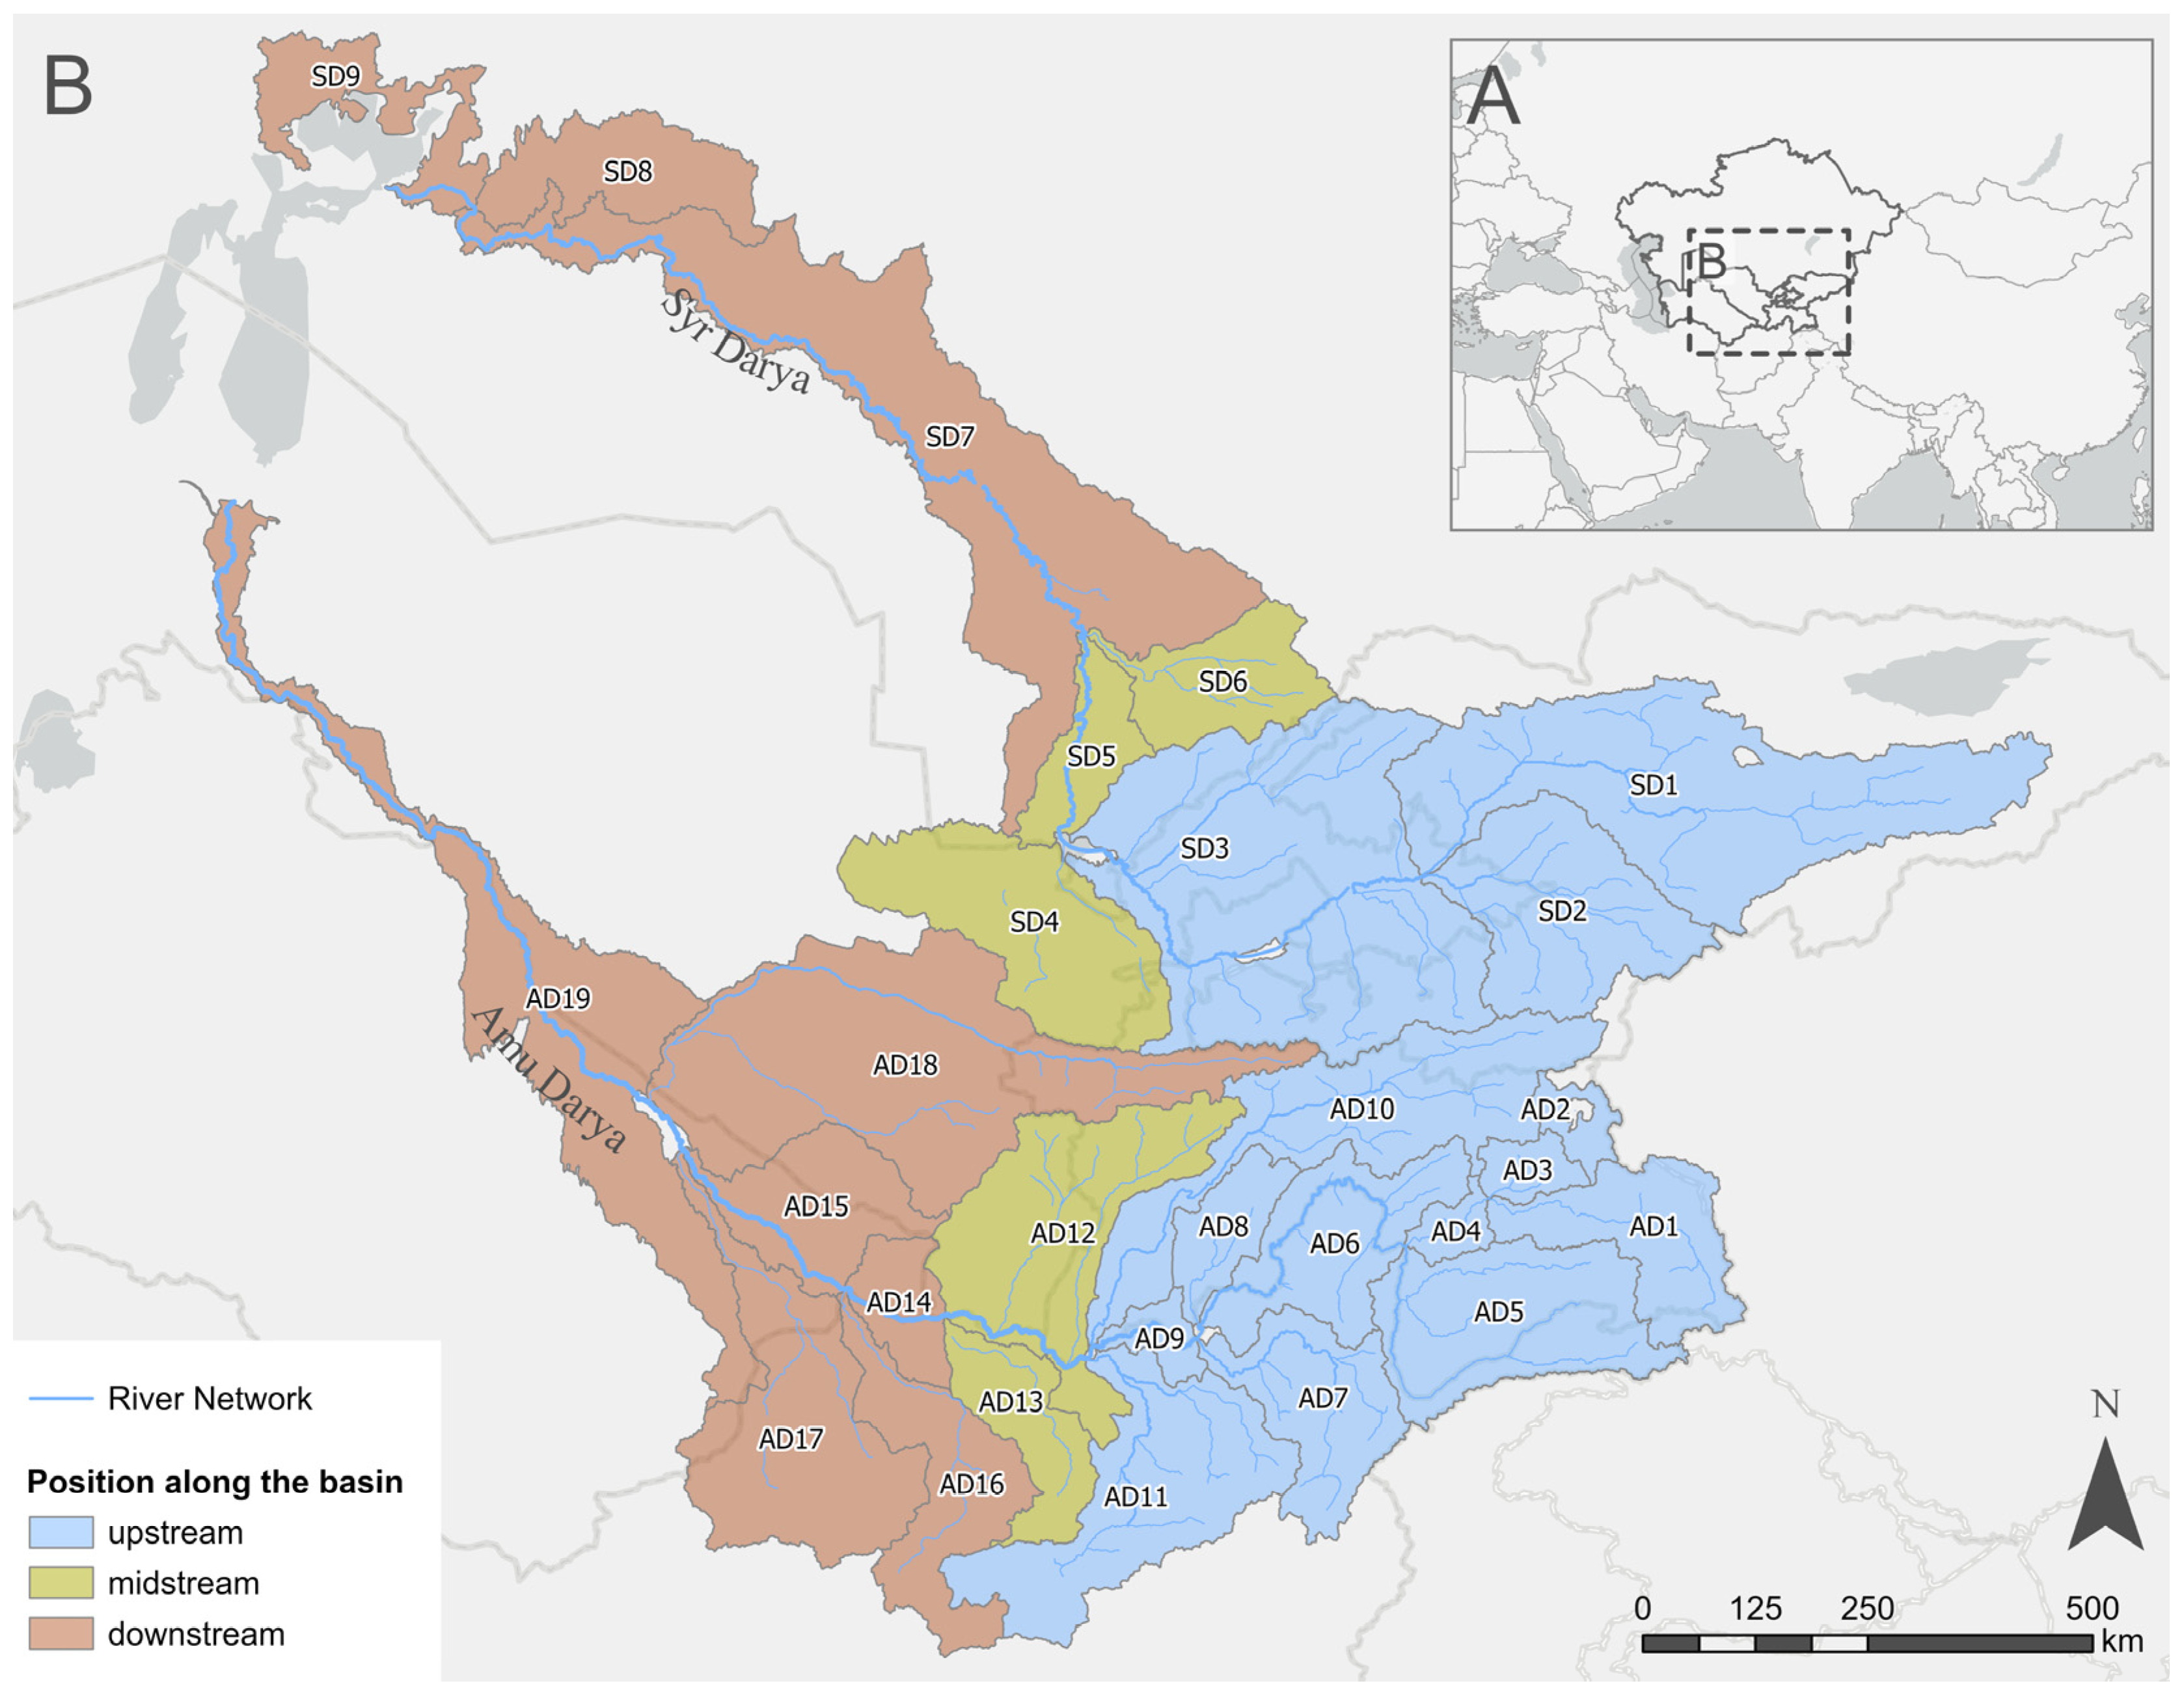
The WEF Nexus–SDM was further applied to assess spatially differentiated policy pathways across upstream, midstream and downstream areas of the Aral Sea Basin represented in Figure 7, rather than uniform basin-wide implementation.
The analysis assesses the combined effects of HP development, renewable energy, agricultural and water-management policies under three representative spatial configurations, evaluated under the middle-of-the-road climate-socioeconomic pathway (SSP2-4.5). These configurations were selected to examine how territorial policy prioritisation shapes key WEF variables and upstream–midstream/downstream interactions across the Syr Darya and Amu Darya basins (Table 7).
  • Upstream-Only HP-NP Strategy: Assesses the effects of HP-NP expansion restricted to upstream sub-basins, without additional water-efficiency or renewable-energy policy measures.
  • Differentiated Upstream–Downstream Strategy: Combines upstream HP-NP expansion with downstream water-efficiency measures, including irrigation-efficiency improvements and livestock and poultry water-saving technologies.
  • Integrated Basin-Wide Strategy: Applies HP-NP expansion across the whole basin, together with broader water- and energy-efficiency measures, representing a coordinated approach to improve long-term WEF Nexus sustainability across the Aral Sea Basin.
The following sections compare the three spatial implementation strategies by analysing their effects on WS, Aral Sea discharge, installed HP capacity and food supply across upstream, midstream and downstream sub-basins.

3.4.1. Water Supply and Aral Sea Discharge Under Differentiated Policy Implementation

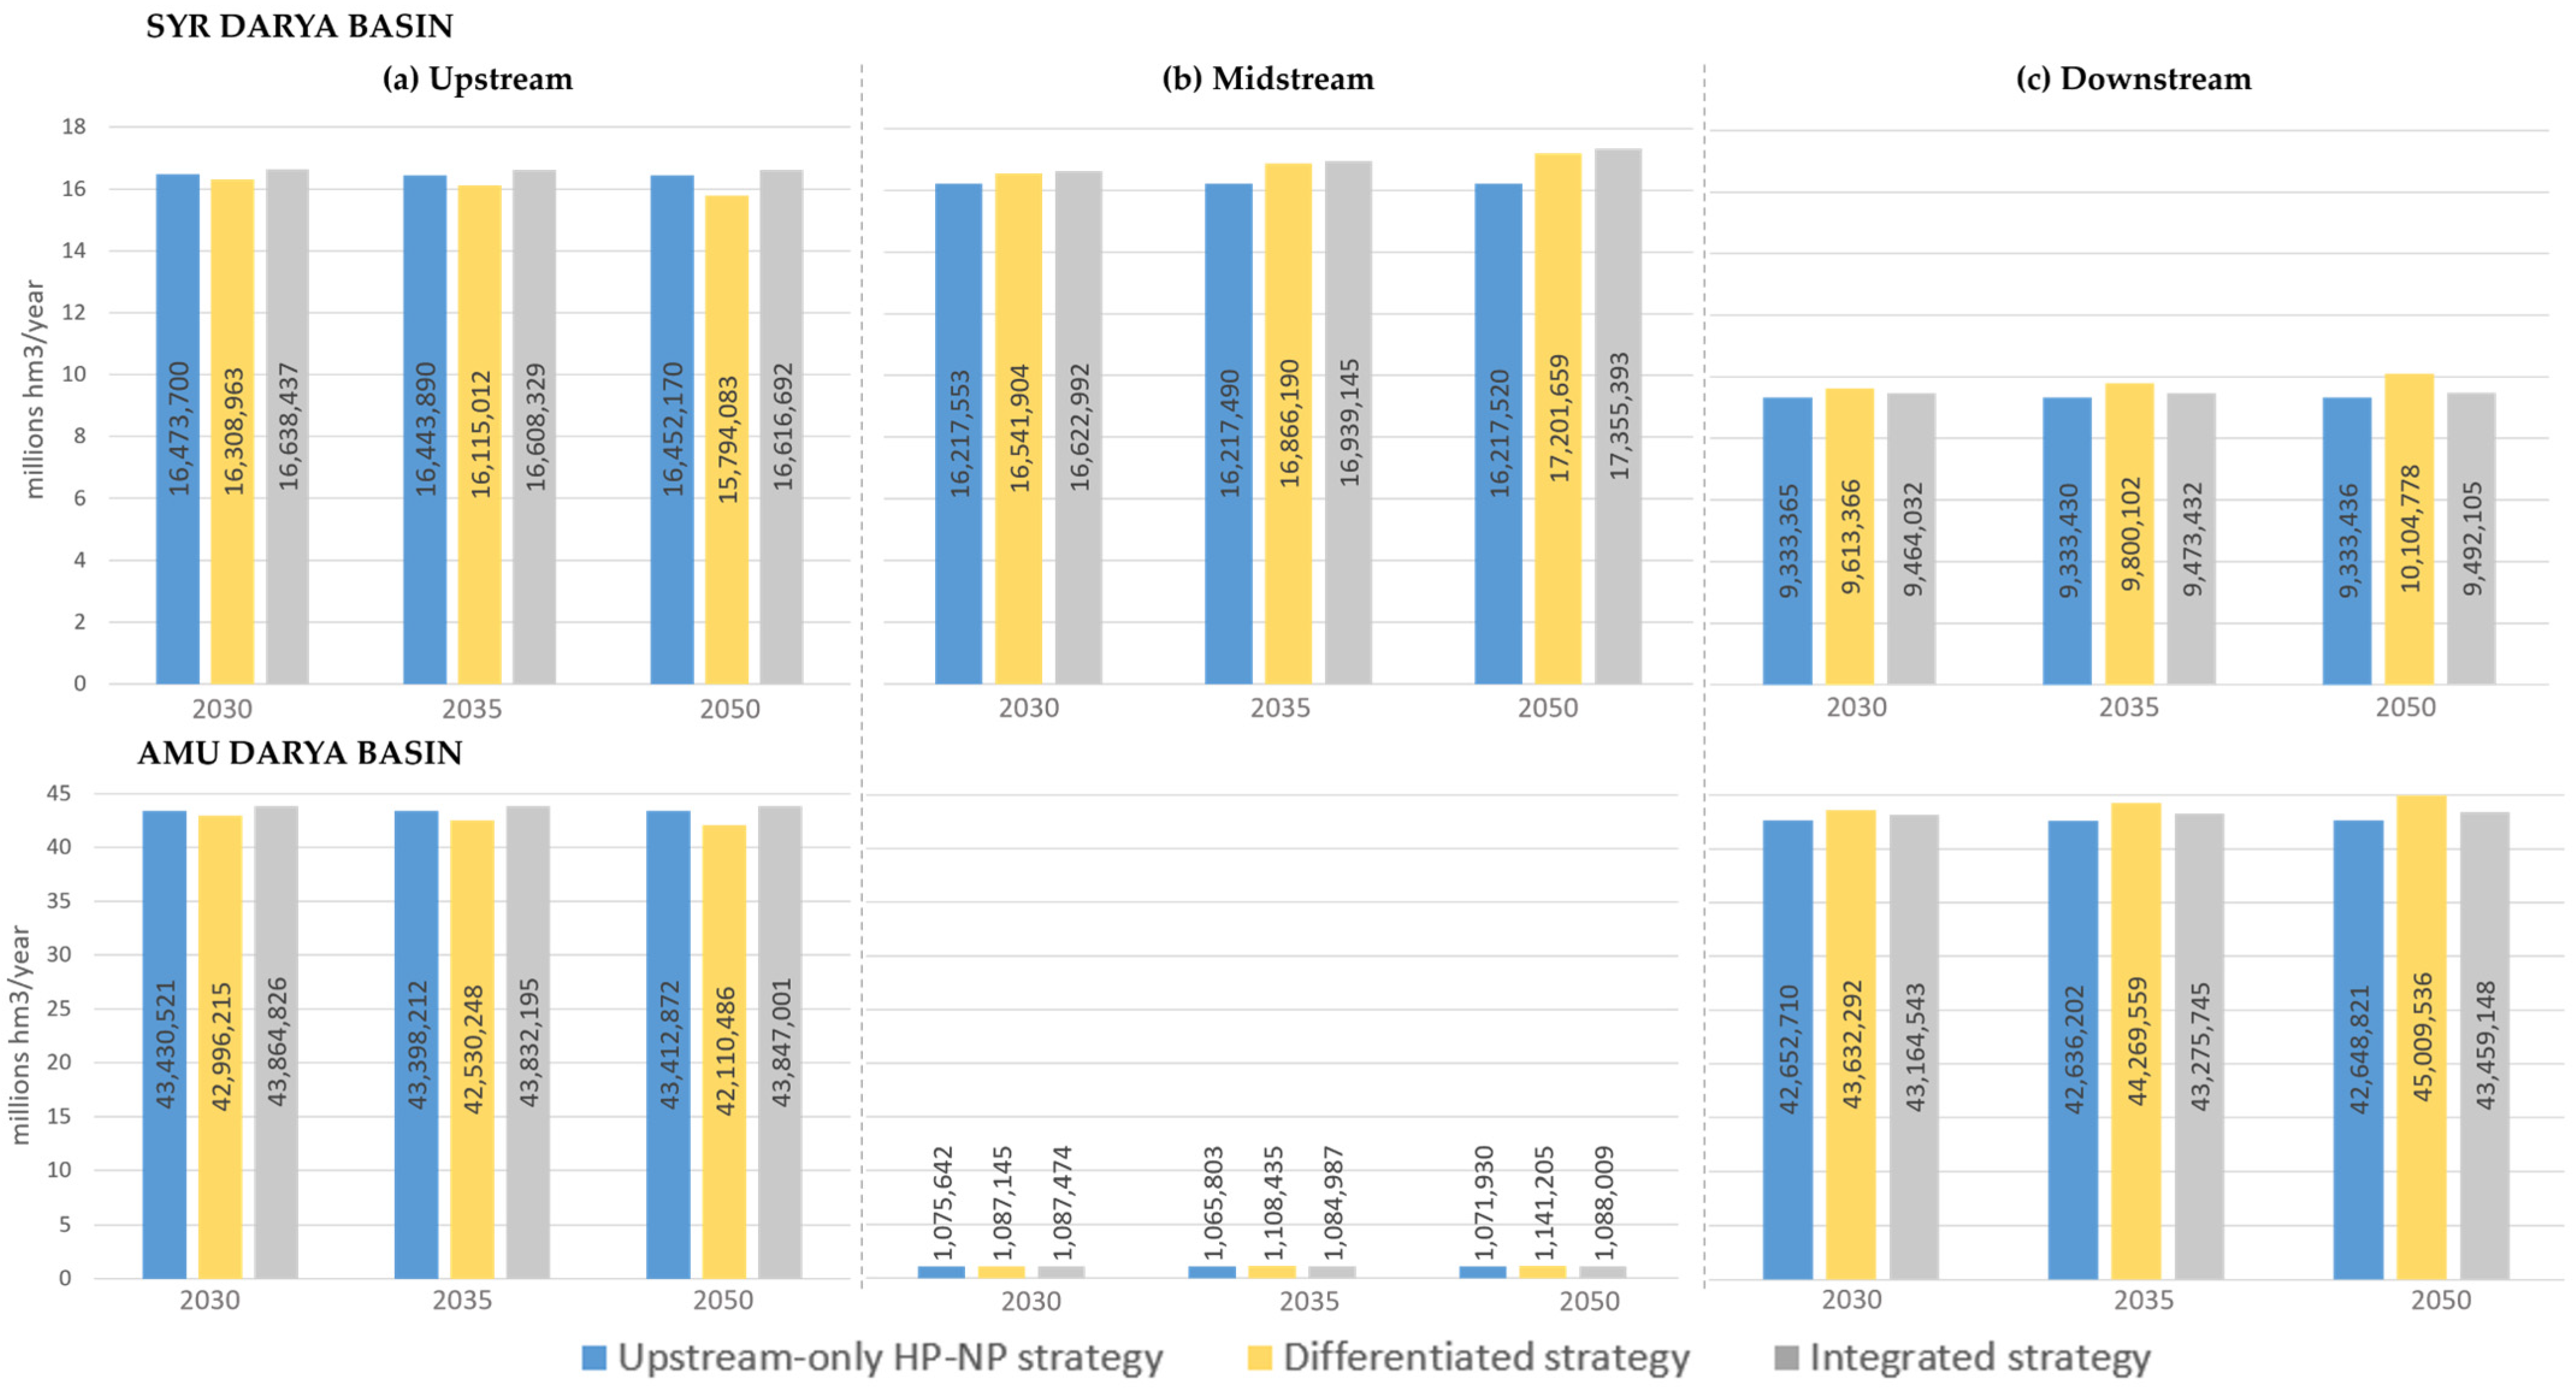
Figure 8 compares water supply across the three spatial implementation strategies. Overall, water supply remains relatively stable in both river basins, although important spatial redistributions emerge depending on where policies are implemented.
Under the upstream HP-NP strategy (Figure 8, blue bars), water supply largely reflects the existing hydrological distribution of resources. In the Syr Darya basin, upstream and midstream sub-basins maintain similar water supply (around 16.4 and 16.2 million hm3/year), whereas downstream values remain considerably lower (around 9.3 million hm3/year). In the Amu Darya basin, upstream and downstream sub-basins both exceed 43 million hm3/year, while the midstream zone remains close to 1.1 million hm3/year.
Introducing the differentiated upstream–downstream strategy (Figure 8, yellow bars) produces a moderate redistribution of water resources. In the Syr Darya basin, upstream water supply decreases slightly whereas both midstream and downstream zones experience gradual increases, indicating that downstream water-efficiency measures improve local water availability. Similar improvements are observed in the Amu Darya basin, where downstream water supply reaches its highest values under this strategy.
The integrated basin-wide strategy (Figure 8, grey bars) generates the most balanced spatial distribution. Upstream water supply remains almost unchanged, while both midstream and downstream sub-basins maintain slightly higher water availability than under the upstream-only HP-NP strategy, particularly in the Syr Darya basin.
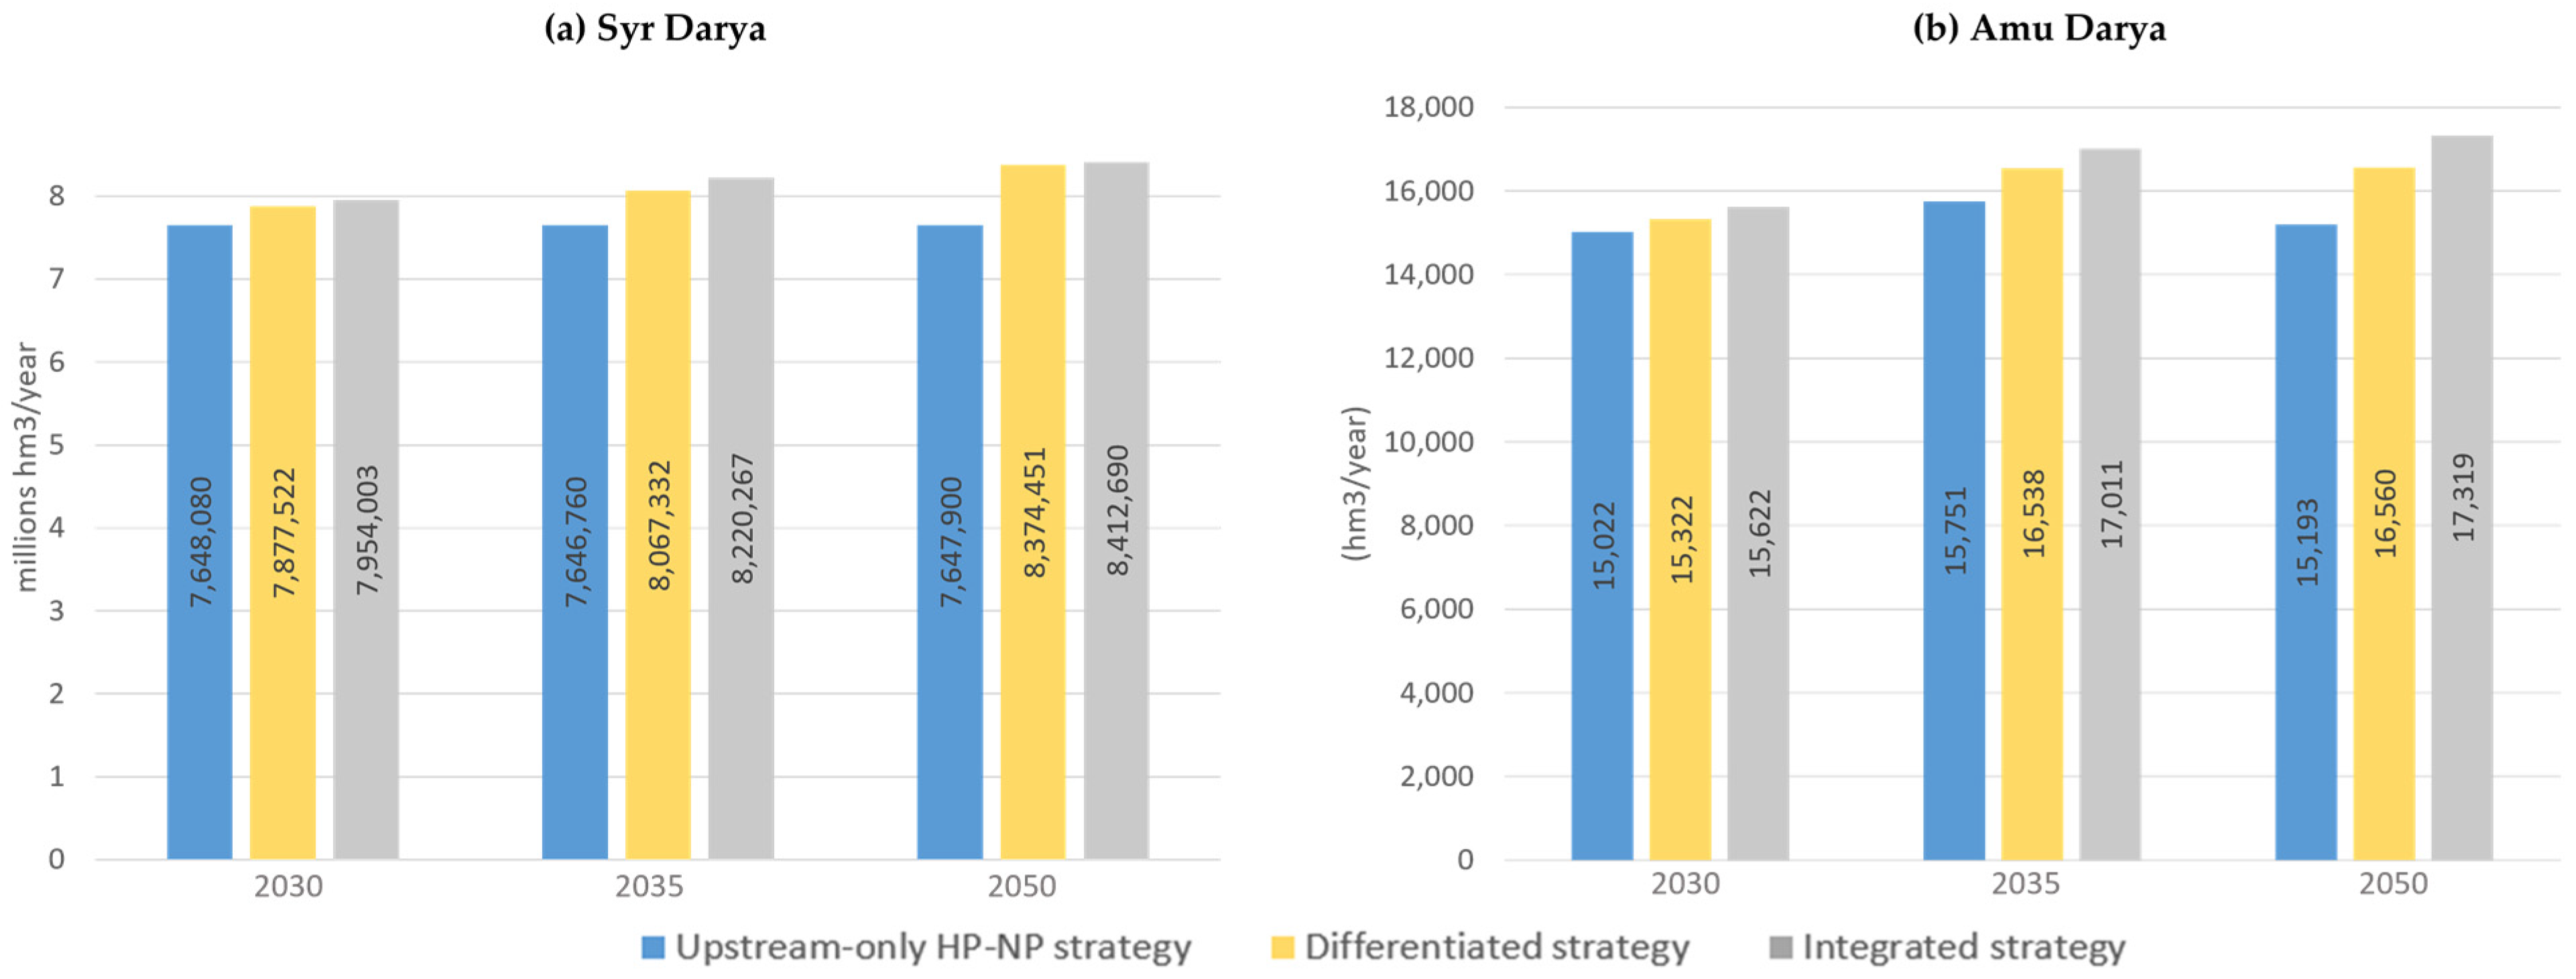
Figure 9 shows the corresponding discharge reaching the Aral Sea. Under the Upstream-only HP-NP strategy, terminal discharge remains almost unchanged in the Syr Darya basin and shows only a temporary increase in the Amu Darya basin, indicating that upstream HP development alone is insufficient to sustain higher inflows to the Aral Sea. The differentiated strategy increases Aral Sea inflows in both basins, particularly in the Amu Darya, whereas the integrated basin-wide strategy produces the highest discharge throughout the simulation period. By 2050, Aral Sea inflow reaches approximately 8.41 million hm3/year in the Syr Darya basin and 17,319 hm3/year in the Amu Darya basin, demonstrating that coordinated basin-wide implementation provides the most favourable outcome for Aral Sea inflows among the simulated strategies.

3.4.2. Hydropower Capacity Under Differentiated Policy Implementations

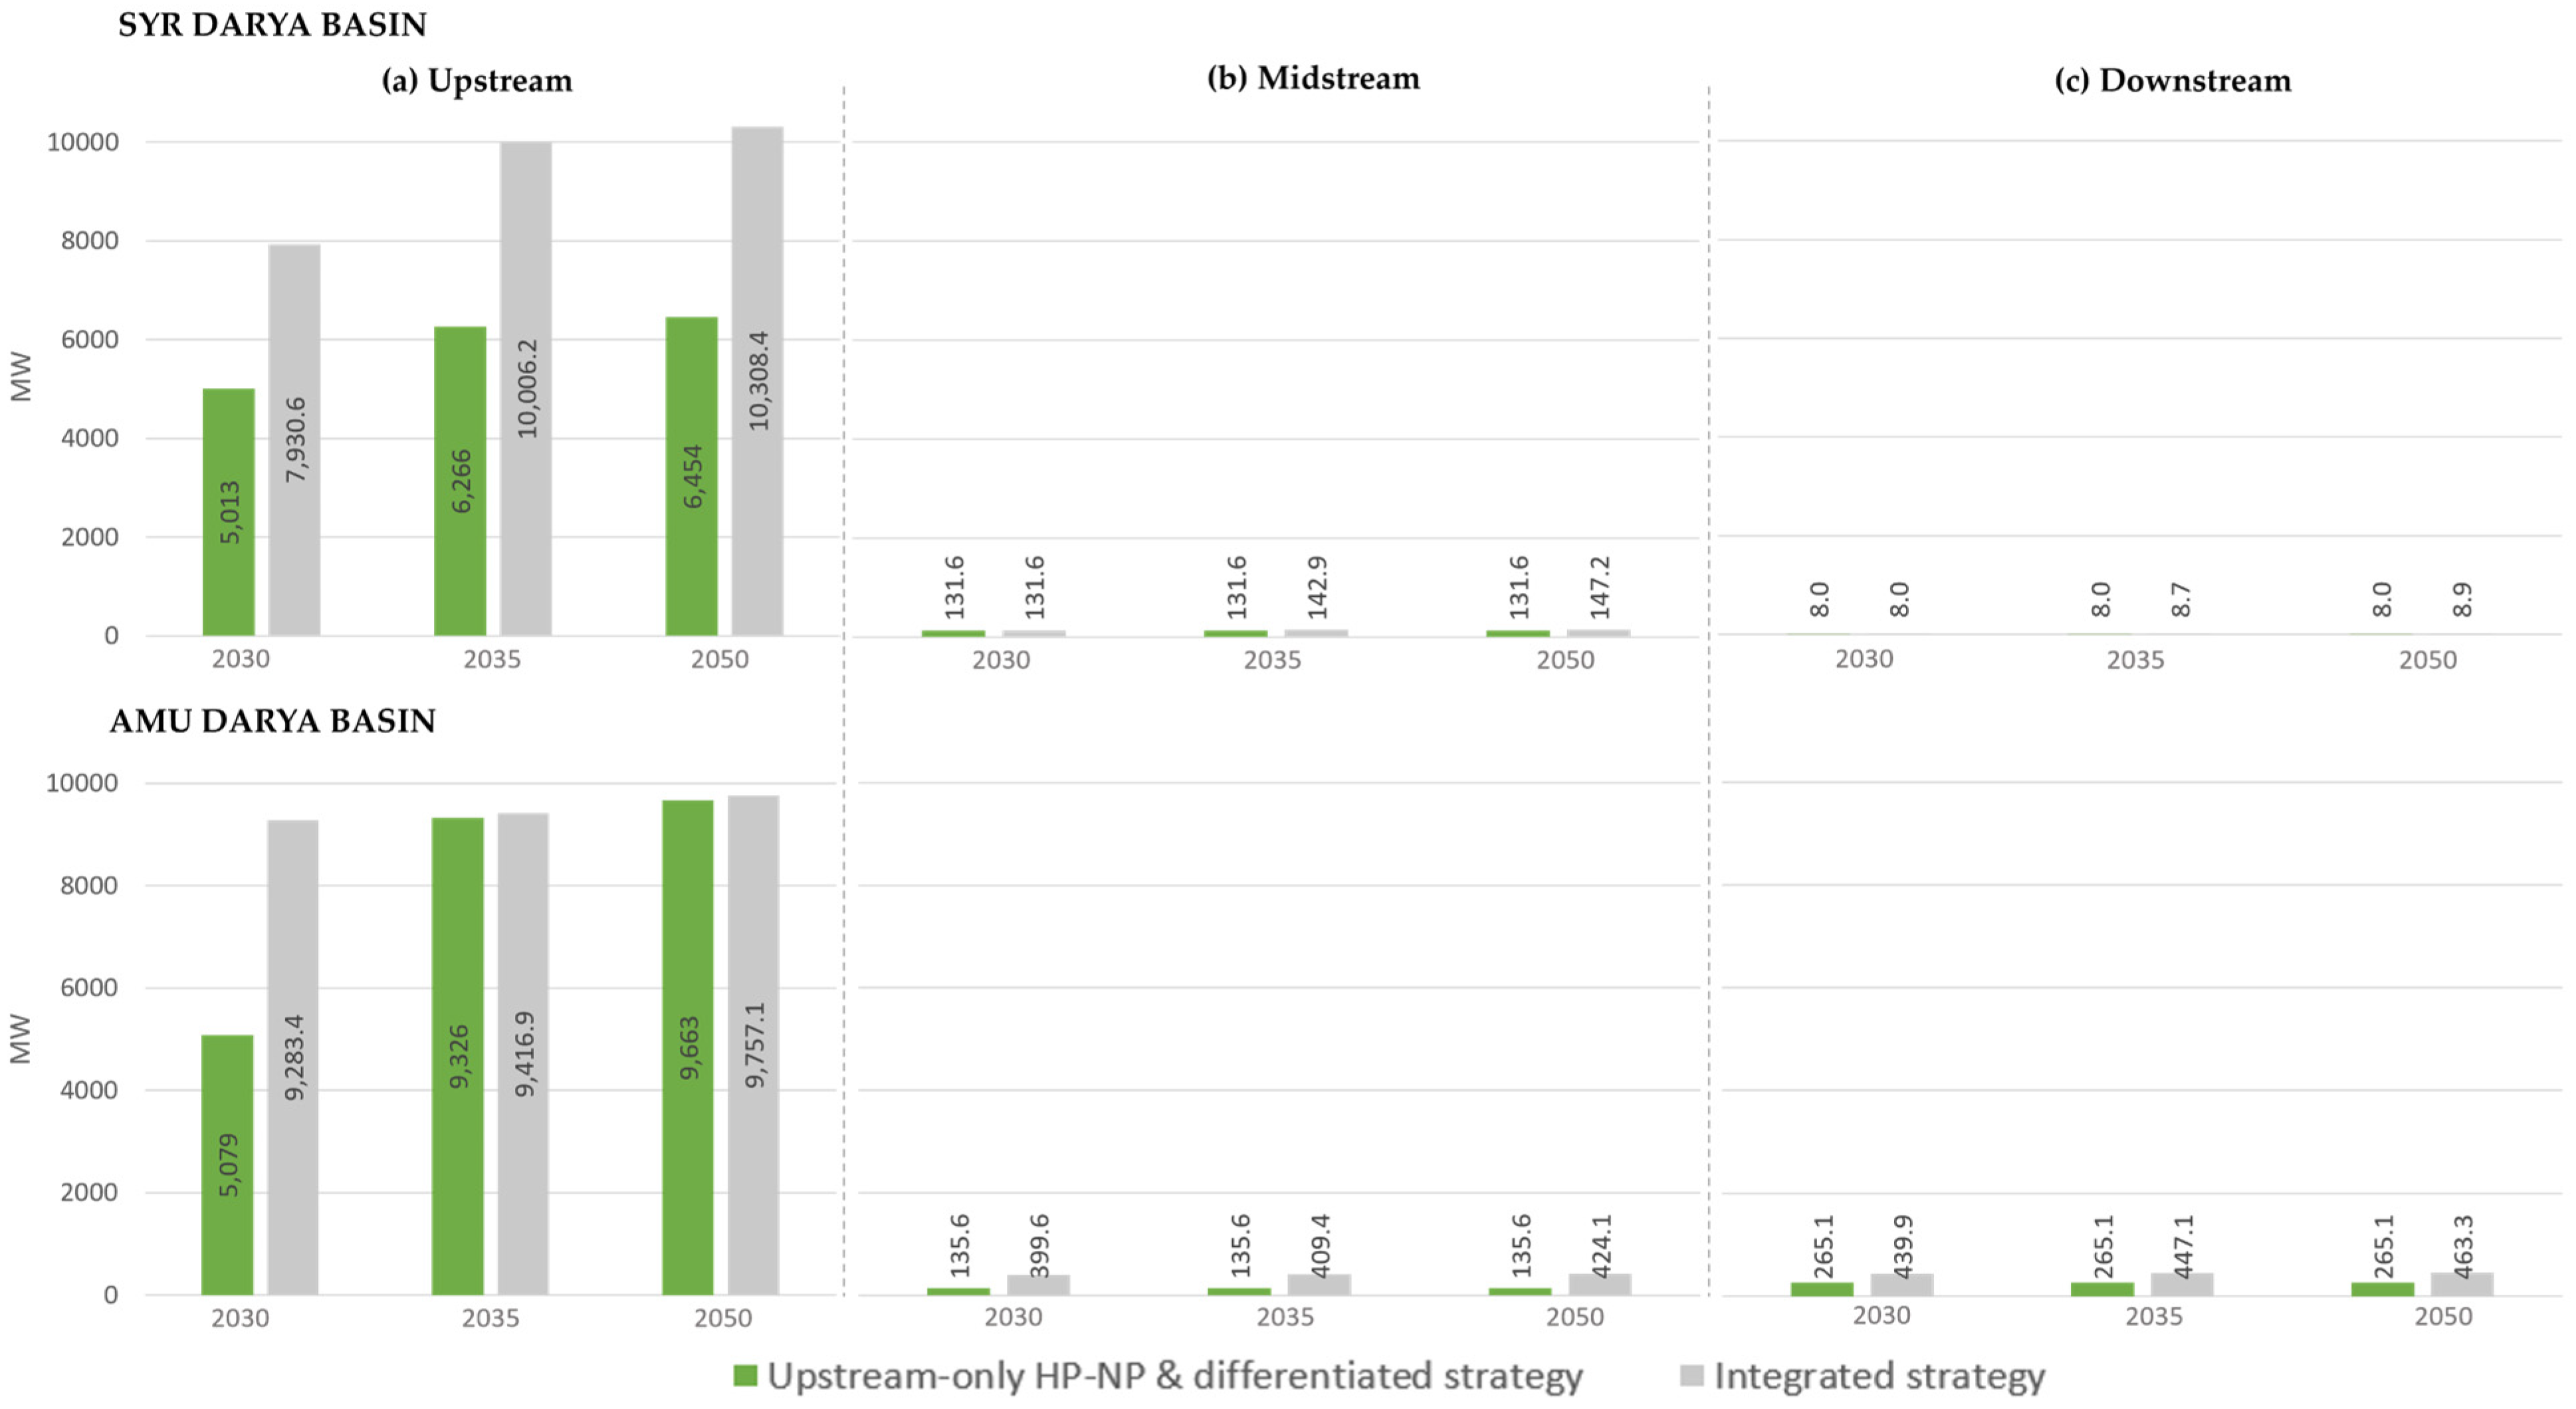
Figure 10 compares installed HP capacity across the three spatial implementation strategies. As the upstream-only HP-NP and differentiated strategies share the same upstream HP expansion pathway, they produce identical installed-capacity trajectories and are therefore shown as a single curve. Consequently, the observed differences are solely attributable to the spatial extent of HP deployment.
Under the upstream HP-NP strategy, nearly all additional installed capacity is concentrated in upstream sub-basins. In the Syr Darya basin, upstream capacity increases from approximately 5013 MW in 2030 to 6454 MW by 2050, while midstream and downstream capacities remain almost unchanged. A similar pattern is observed in the Amu Darya basin, where upstream capacity rises from approximately 5079 MW to 9663 MW, whereas downstream zones experience negligible growth.
The differentiated strategy maintains the same upstream HP allocation while introducing downstream water-management measures. Consequently, installed HP capacity remains almost identical to the upstream HP-NP strategy, confirming that the additional policies mainly affect water management rather than energy infrastructure.
In contrast, the integrated basin-wide strategy substantially expands and spatially diversifies HP capacity. Besides the strong upstream increases, additional capacity is also deployed in the midstream and downstream sub-basins. By 2050, upstream installed capacity reaches approximately 10,308 MW in the Syr Darya basin and 9757 MW in the Amu Darya basin, while both basins also experience moderate capacity growth outside upstream areas.

3.4.3. Food Supply Under Differentiated Policy Implementation

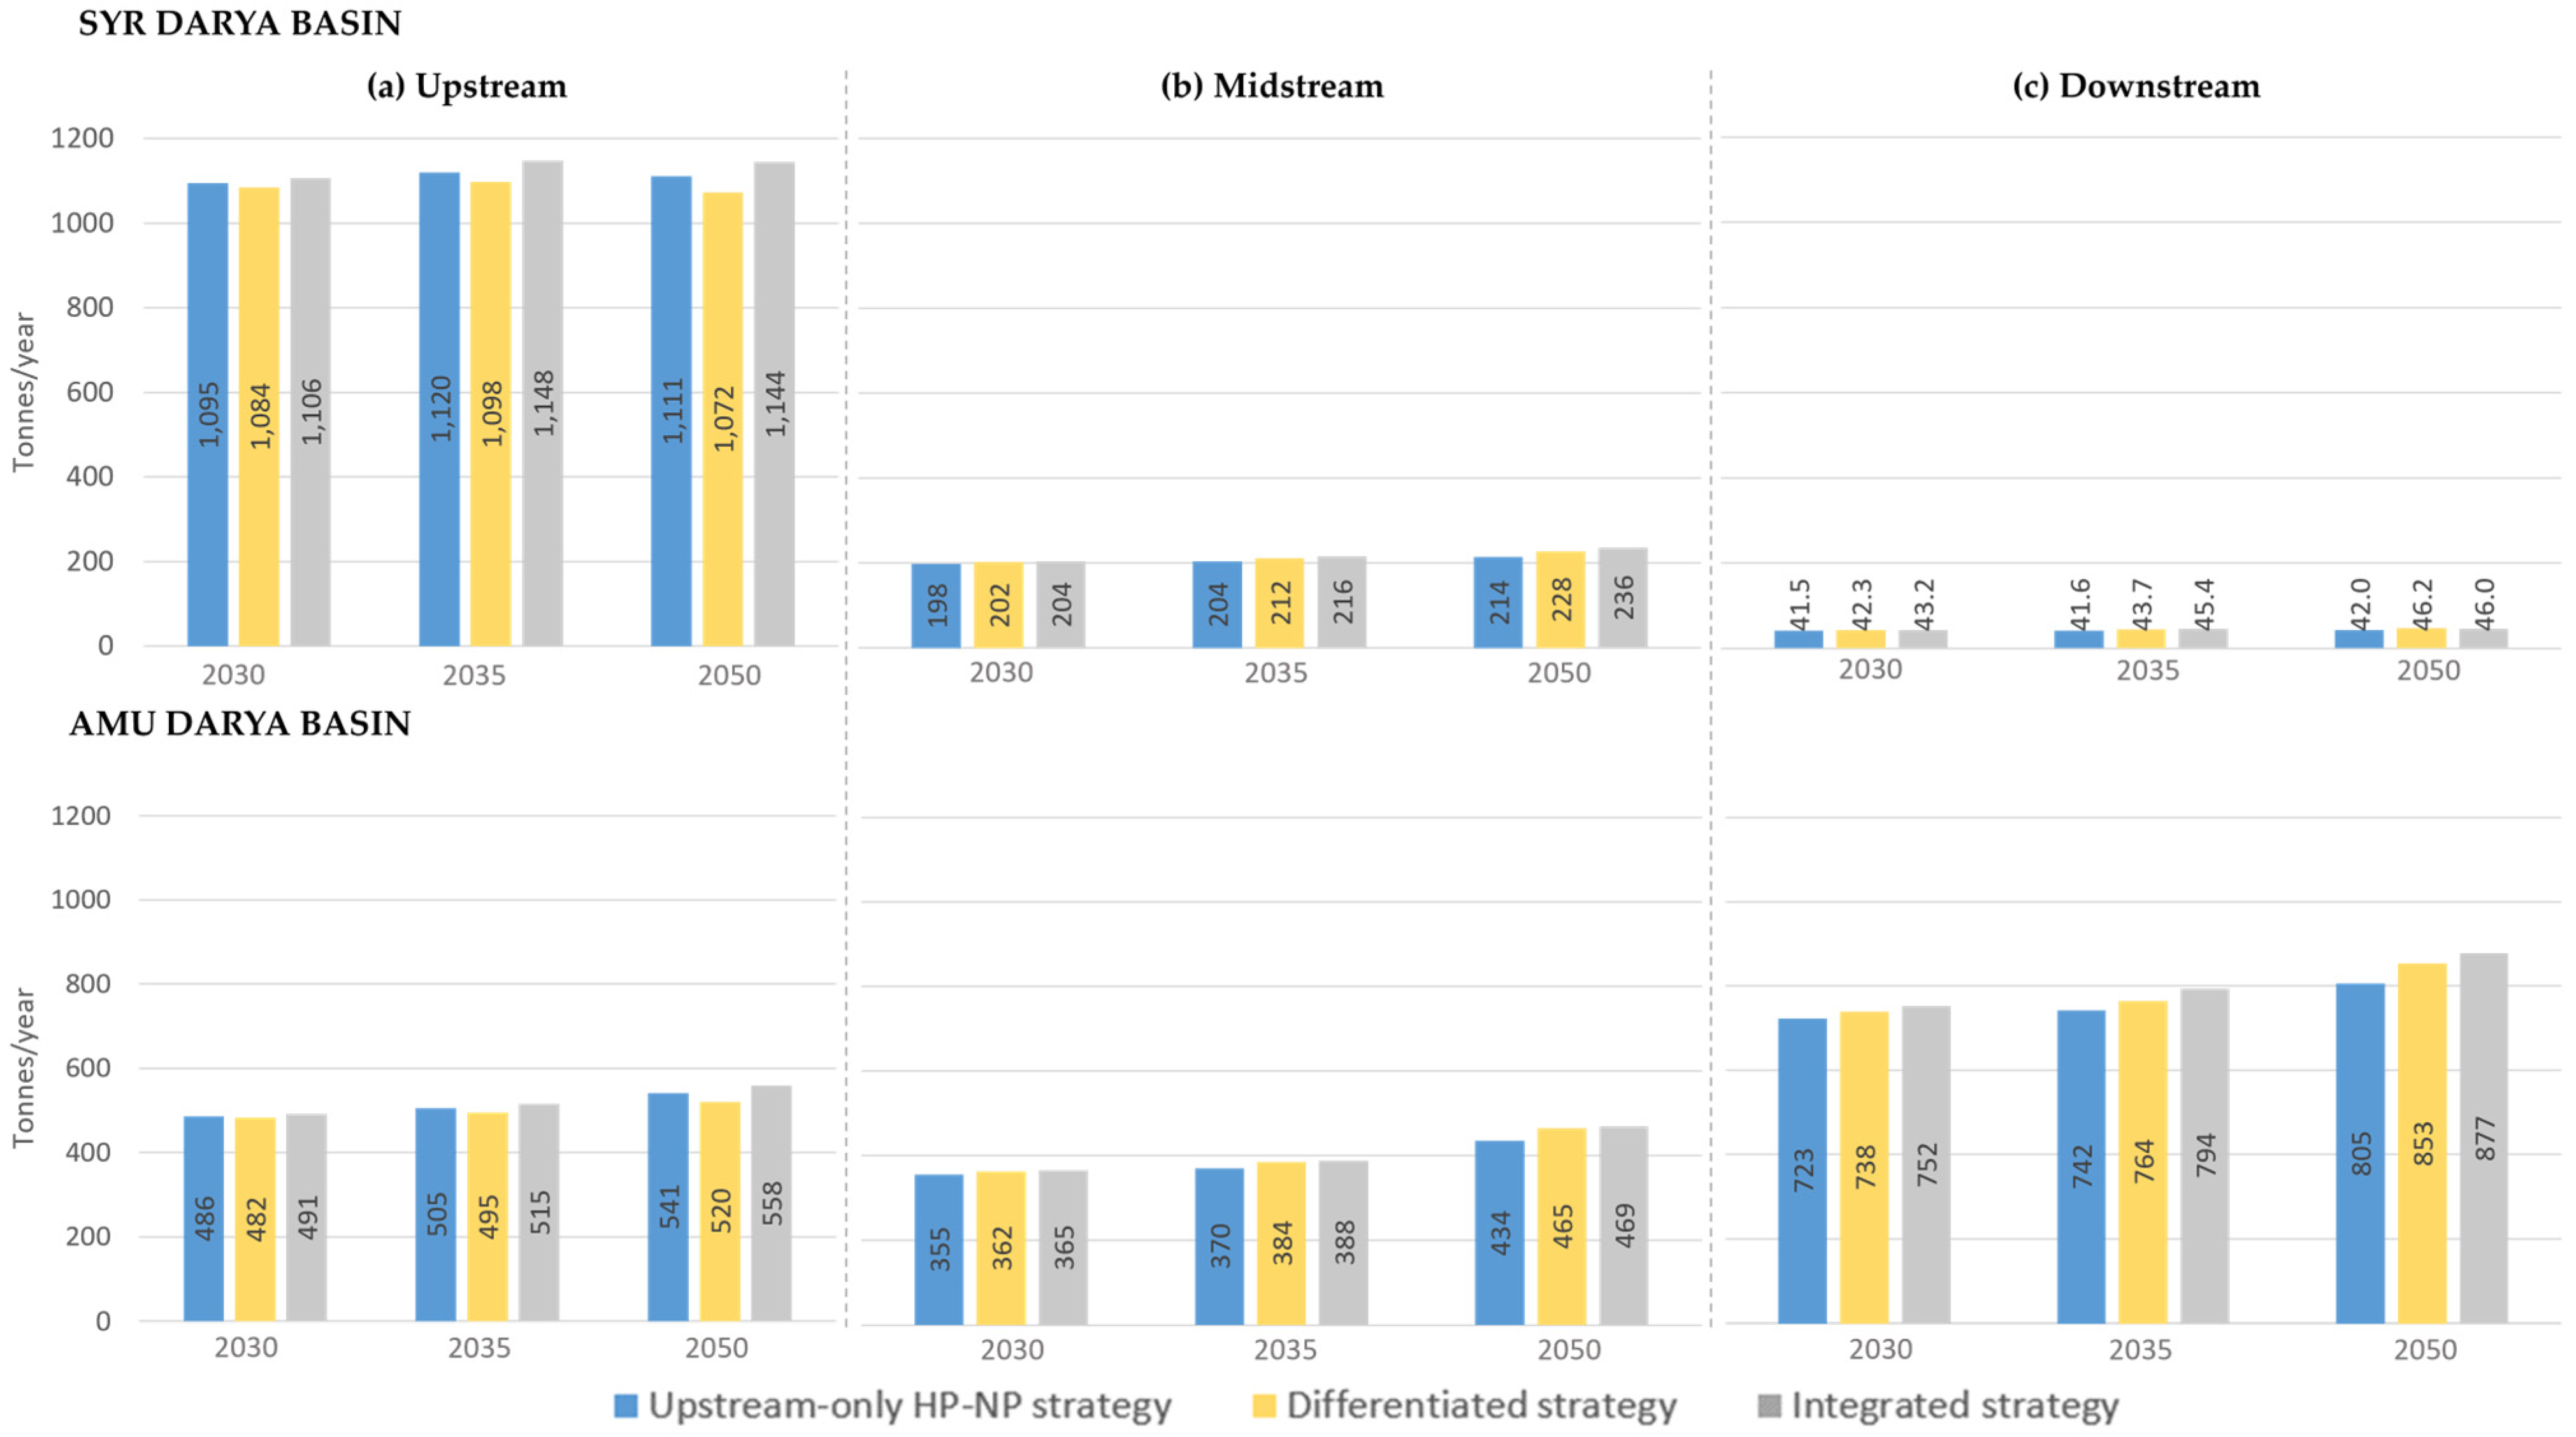
Figure 11 compares food supply across the three spatial implementation strategies. In both river basins, food production remains concentrated in the most agriculturally productive sub-basins, although clear differences emerge between strategies.
Under the upstream HP-NP strategy, food production remains strongly concentrated in upstream areas of the Syr Darya basin and downstream areas of the Amu Darya basin. Between 2030 and 2050, upstream food supply increases only marginally in the Syr Darya basin, from 1095 to 1111 ton/year (+1.5%), while midstream production rises from 198 to 214 ton/year (+8.1%) and downstream production remains almost unchanged at around 42 ton/year. In the Amu Darya basin, stronger increases are observed, with upstream, midstream and downstream food supply rising by approximately 11.3%, 22.3%, and 11.3%, respectively.
The differentiated upstream–downstream strategy enhances food production primarily in midstream and downstream areas through targeted water-efficiency measures. In the Syr Darya basin, upstream food supply decreases slightly from 1084 to 1072 ton/year (−1.1%), whereas midstream and downstream production increase from 202 to 228 ton/year (+12.9%) and from 42.3 to 46.2 ton/year (+9.2%), respectively. The response is more pronounced in the Amu Darya basin, where upstream, midstream and downstream food supply increase from 482 to 520 ton/year (+7.9%), 362 to 465 ton/year (+28.5%), and 738 to 853 ton/year (+15.6%).
The integrated basin-wide strategy produces the highest food supply across both river basins. In the Syr Darya basin, upstream food supply increases from 1106 to 1144 ton/year (+3.4%), while midstream and downstream production rise from 204 to 236 ton/year (+15.7%) and from 43.2 to 46.0 ton/year (+6.5%), respectively. In the Amu Darya basin, the integrated strategy also delivers the largest gains, with upstream production increasing from 491 to 558 ton/year (+13.6%), midstream from 365 to 469 ton/year (+28.5%), and downstream from 752 to 877 ton/year (+16.6%) by 2050.

4. Discussion

The simulations provide new insights into how alternative HP development strategies influence the WEF Nexus in the Aral Sea Basin. The main finding is that HP expansion substantially modifies installed capacity while producing only marginal changes in total basin-scale water supply. These marginal differences should not be interpreted as evidence that evaporation or seepage losses are negligible in absolute terms. Reservoir evaporation and broader infiltration and groundwater exchanges are incorporated into the water-balance structure and are largely common across the simulated scenarios. Moreover, HP-capacity expansion does not automatically imply a proportional increase in reservoir surface area, as the HP pathways also include the rehabilitation, modernization and expansion of existing facilities, while new reservoir construction is represented as a separate water-management policy. Consequently, the reported differences reflect the incremental effects of the tested HP pathways at an annual basin scale rather than a site-specific assessment of losses from individual reservoirs. As shown in Figure 4 and Figure 8, annual water supply remains remarkably stable despite large differences in installed HP capacity, indicating that the gross annual water supply indicator is primarily controlled by climatic and hydrological inputs. This stability does not imply that population growth or increasing sectoral water demand has no effect on the water system. Rather, these pressures influence reservoir outputs, return flows, water-security conditions and the volume transferred to downstream sub-basins, while they are not directly deducted from the gross water supply indicator. Furthermore, the annual temporal resolution limits the representation of seasonal water redistribution associated with hydropower operation. However, the spatially differentiated simulations show that the location and coordination of HP development and accompanying policies generate different responses in food supply and final discharge to the Aral Sea across upstream, midstream and downstream sub-basins.
At the same time, basin-scale indicators conceal substantial spatial heterogeneity. Although aggregate simulations (Figure 4, Figure 5 and Figure 6) suggest relatively limited changes in water supply and food supply, the spatially explicit analyses (Figure 8, Figure 9, Figure 10 and Figure 11) reveal pronounced upstream versus midstream/downstream differences under alternative HP development pathways. These localised trade-offs become particularly evident when comparing upstream-focused HP expansion with coordinated basin-wide implementation, demonstrating the added value of spatially explicit WEF Nexus modelling for transboundary planning.

4.1. Hydropower Development as a Transboundary Planning and Governance Challenge

Expanding HP capacity does not substantially modify annual basin-scale water availability. Even under the most ambitious National Plan (HP-NP) scenario, which approximately doubles installed HP capacity in both river basins (Figure 5), mean annual water supply remains remarkably stable (Figure 4). Instead, the spatial simulations show that alternative HP development strategies generate different patterns of installed HP capacity, food supply and Aral Sea inflows across the basin, revealing how development benefits and trade-offs are distributed among upstream, midstream and downstream areas.
This interpretation is consistent with previous studies describing Central Asia’s water challenges as primarily governance rather than resource-availability problems. Although climate change will influence future hydrology, long-standing upstream–downstream tensions in the Aral Sea Basin have largely resulted from reservoir operation, seasonal water releases and competing national development priorities rather than from absolute physical water scarcity alone [3,4]. The simulations provide quantitative evidence supporting this interpretation by showing that alternative HP pathways redistribute benefits and trade-offs across the basin while producing only marginal changes in total annual water availability.
The contrast between the upstream-focused HP-NP scenario and the integrated basin-wide strategy reinforces this conclusion. Although both strategies substantially increase installed HP capacity, basin-wide implementation produces a more balanced distribution of outcomes across the reported WEF indicators, including food supply and Aral Sea inflows, whereas upstream-only development concentrates the largest gains within the energy subsystem. Additionally, the integrated basin-wide implementation not only maximises total HP installed capacity but also distributes HP development more evenly across the river basins. These findings show that where HP is developed can be as important as how much HP is developed, supporting coordinated basin-scale planning within Integrated Water Resources Management (IWRM) and WEF Nexus management frameworks [85,86].
These results are directly relevant to current policy developments in Central Asia. Kyrgyzstan’s 2025 Water Code frames water as a strategic economic resource and establishes the legal basis for charging downstream countries for upstream releases [8,9,10]. The National Policy Dialogue on Water has also emphasised regional cooperation, integrated water governance and coordinated management of shared water resources [87]. Under this evolving policy framework, future negotiations are likely to focus increasingly on allocation mechanisms rather than on increasing total water availability. In addition, because the present model does not explicitly represent transboundary electricity markets or water-pricing mechanisms, the potential benefits of cross-border electricity trade as an incentive for cooperation are not captured [88].

4.2. Benefits of Integrated Basin-Wide Planning

The spatial policy configurations defined in Table 7 show that how HP development is coordinated across the basin is as important as the scale of infrastructure expansion itself. While both development pathways increase installed HP capacity, only the integrated basin-wide strategy generates balanced improvements across the three WEF Nexus dimensions. As shown in Figure 8, Figure 9, Figure 10 and Figure 11, coordinated implementation enhances food supply, installed HP capacity and Aral Sea inflows, whereas upstream-focused development primarily benefits the energy subsystem while producing more limited improvements in downstream water and food outcomes.
These findings highlight the importance of considering the Aral Sea Basin as a single interconnected socio-hydrological system. River flows and reservoir operations extend across political boundaries, while food production in midstream and downstream areas depends strongly on water availability and upstream management decisions. Coordinated planning therefore produces a more balanced distribution of benefits across sectors and territories than unilateral infrastructure development. The downstream environmental dimension, represented in this study by final discharge to the Aral Sea, further reinforces this conclusion. Under the integrated basin-wide strategy, higher Aral Sea inflows are maintained while installed HP capacity and food supply also improve. This suggests that sustaining downstream inflows need not necessarily conflict with energy and agricultural development when policies are coordinated across the basin. These findings are consistent with recent studies highlighting the importance of explicitly incorporating environmental flow requirements into HP planning and river-basin management [37,89].
The simulations also show that coordinated planning should not imply identical management strategies across both river basins. The Syr Darya basin exhibits stronger synergies among HP expansion, food supply and Aral Sea inflows, whereas the Amu Darya basin shows more persistent trade-offs among these outcomes. These contrasting responses highlight the need for basin-specific implementation within a common transboundary planning framework.

4.3. Added Value of Spatially Explicit WEF Nexus Modelling and Its Limitations

A key methodological contribution of this study is the explicit representation of upstream–downstream heterogeneity through sub-basin disaggregation. Previous applications of SD modelling in Central Asia have mainly focused on individual water bodies or local hydrological processes [90], whereas the present framework extends this approach to the basin scale by integrating spatial heterogeneity and WEF Nexus interactions. While basin-scale indicators (Figure 4, Figure 5 and Figure 6) suggest limited changes in water supply and food supply, the spatial analyses (Figure 8, Figure 9, Figure 10 and Figure 11) reveal substantial territorial differences in installed HP capacity, food supply and Aral Sea inflows.
Direct numerical benchmarking of the spatially stratified outputs against previous Central Asian WEF studies is constrained by the absence of directly comparable assessments using the same sub-basin structure, indicators and scenario configurations. Existing studies generally operates at national, basin-wide or local scales and therefore cannot reproduce the upstream–midstream–downstream comparisons presented here [1,2,7,13]. The present results nevertheless build upon the historically calibrated and validated WEF Nexus SDM reported by Pérez Pérez et al. [25], while their broader interpretation is consistent with the regional literature emphasising spatial asymmetries, cross-sectoral trade-offs and the importance of coordinated transboundary management.
The comparison between the upstream-focused HP-NP scenario and the integrated basin-wide strategy illustrates this added value. Although both strategies achieve substantial increases in installed HP capacity at the basin-scale (Figure 5), the spatial simulations reveal markedly different distributions of benefits across sub-basins. This additional level of detail enables decision-makers to identify where policy interventions generate synergies or conflicts, providing information that cannot be obtained from basin-average indicators alone.
The results also highlight the broader value of increasing spatial resolution in transboundary river-basin assessment. Recent methodological developments show that higher-resolution spatial information derived from Earth observation and remote sensing can improve the characterisation of river systems, particularly in data-scarce regions [91]. The present study complements these advances by integrating spatially explicit information within a dynamic WEF Nexus modelling framework, allowing for spatial heterogeneity and temporal interactions between water, energy and food systems to be evaluated simultaneously. Although irrigation demand and environmental-flow requirements are represented within the SDM structure, they were not evaluated as standalone outcome indicators in this study. Accordingly, agricultural responses are discussed through food supply, whereas the downstream environmental response is represented by final discharge to the Aral Sea.
The framework should nevertheless be interpreted in light of its annual time step. Although, this temporal resolution enables long-term policy comparison across multiple sectors and sub-basins, annual averages may obscure intra-annual dynamics, including summer irrigation shortfalls and winter energy demand. The model does explicitly not simulate seasonal reservoir operation, short-term water–energy exchanges or intra-annual irrigation constraints. A more detailed seasonal assessment was not conducted because the limited access of higher-resolution input data, including river hydrology, crop-specific water demand and reservoir release and hydropower operation data.
Beyond this temporal resolution, the framework is subject to several structural limitations. It does not explicitly represent transboundary electricity trading or water-pricing mechanisms, while heterogeneous national policy and institutional constraints are simplified through aggregated scenario assumptions. Hydropower development is represented primarily through installed capacity and spatial allocation, without differentiating among plant sizes and technologies, such as large and small hydropower plants, storage and run-of-river schemes, or diversion plants. Consequently, the potentially divergent impacts associated with these different project types are not explicitly captured.
Future work should therefore combine the present spatially explicit SDM with higher-temporal-resolution hydrological, reservoir-operation and energy-market data to assess seasonal trade-offs more explicitly. The framework could also be extended through economic and environmental modules and through a systematic assessment of uncertainty in aspects such as hydrological, climatic, demand and policy assumptions.

4.4. Policy Implications for Transboundary WEF Nexus Management

The findings have several implications for future WEF Nexus planning in transboundary river basins. First, HP development should be planned as part of an integrated basin-wide strategy rather than as an isolated energy policy. Although expanding installed HP capacity increases renewable-energy generation potential, the associated outcomes for food supply and Aral Sea inflows depend strongly on where new infrastructure is located and how reservoir operations are coordinated. Any new development therefore needs environmental flows and coordinated operations written in policy and legislation as a priority, not an afterthought. Furthermore, quantitative modelling from other transboundary basins can provide helpful benchmarks. For example, in the Mekong’s Nam Ngum basin, joint operation of irrigation and hydropower raised net system benefits by roughly 3–12% (or US$12–53 million per year), with the gains growing alongside water availability and flow variability, representing a useful target for what basin-wide coordination could be worth in the Syr Darya and Amu Darya systems [92].
Second, the contrasting responses of the Syr Darya and Amu Darya basins indicate that a single management strategy is unlikely to maximise WEF performance across the entire Aral Sea Basin. Future transboundary agreements should therefore combine basin-wide coordination with measures tailored to each basin’s hydrological, agricultural and infrastructural characteristics. Regarding benefit-sharing, Jalilov et al. tested an analytical basis to build on. The hydro-economic modelling of the Amu Darya basin around the Rogun Hydropower Plant found that any agreement will likely require Uzbekistan and Turkmenistan to structure compensation to Tajikistan for its water releases downstream rather than use for its own irrigation [93].
Third, the results emphasise the need to move beyond infrastructure-centred planning towards governance mechanisms that promote coordinated water allocation among riparian countries. Progress remains constrained by national self-interest, underinvestment, and weak data-sharing among the five Central Asian states. Institutional reform must begin with the Interstate Commission for Water Coordination (ICWC). Since 1992, the ICWC has regulated water use across the region. It operates through two executive bodies: the Amu Darya and Syr Darya Basin Water Organizations. These entities jointly manage dozens of shared hydraulic infrastructures, gauging stations, and interstate canals.
However, the commission’s mandate is outdated. UN assessments show that ICWC authority is restricted to irrigation, leaving it with no influence over hydropower. Consequently, regional water quotas are routinely inaccurate and unenforced. Despite the existence of hydrological models, allocation quotas remain incorrect over 80% of the time in the Aral Sea basin, mainly due to inaccurate provided data. To address these enforcement failures, Kazakhstan proposed a reform plan in February 2026. The proposal advocates for a new, enforcement-backed entity established under a Central Asian Framework Convention on Water Management. A modernised treaty should therefore do two things: first, give ICWC (or its succeeding body) enforcement authority over both irrigation and hydropower operations, not irrigation alone, and secondly formalise a shared budget line dedicated to monitoring, data infrastructure, and long-term basin planning, following the parity-financing principle already written into ICWC’s founding by-laws [94].
As discussed in Section 4.1, future policy developments in Central Asia are likely to place increasing emphasis on negotiated allocation frameworks, reservoir operation and regional cooperation. Decision-support tools capable of evaluating these interactions will therefore become increasingly valuable for evidence-based policy making.
Finally, although the present framework focuses on HP development and renewable-energy policies, it provides a flexible basis for future analyses incorporating additional governance and economic instruments, including transboundary electricity markets, water-pricing mechanisms and climate-adaptation strategies. Implementing these governance structures will also require addressing the physical linkages between water systems.
While the Scientific Information Center of ICWS (SIC ICWS) has functioned for decades as the region’s main hub for water information, groundwater and glacier data remain managed separately from surface water, an important structural gap that must be closed. Cross-border research funding agreed that technical formulas for calculating costs and allocations, and stakeholder engagement from planning through implementation would let joint commissions act on the data ICWC already collects, rather than negotiating quotas from a weak evidentiary base every season [94]. Extending the model in these directions would strengthen its capacity to support integrated WEF Nexus planning under increasing climatic and socio-economic uncertainty.

5. Conclusions

This study applied a spatially explicit WEF Nexus SDM to evaluate how alternative HP development pathways and policy strategies may affect long-term resource security in the Aral Sea Basin. By integrating climate–socioeconomic scenarios, national policy targets, renewable-energy measures, water-efficiency interventions and HP expansion trajectories at the basin and sub-basin scales, the model provides an integrated framework for assessing transboundary water, energy, food and environmental interactions under future uncertainty.
The results show that basin-scale water supply remains remarkably stable across the simulated climate and policy scenarios. HP expansion substantially increases installed generation capacity, particularly under National Plan development pathways, but generates limited effects on annual basin-scale water availability. This apparent stability refers specifically to the gross annual water-supply indicator and should not be interpreted as evidence that increasing demand, reservoir operation or seepage have no effect on wider water demand. These processes influence reservoir outputs, return flows, water security conditions and downstream transfers, while annual temporal resolution does not explicitly capture the seasonal redistribution of water associated with reservoir operation and hydropower generation. This indicates that, at the annual scale considered in this study, HP development acts primarily as an energy-sector transformation and water-allocation challenge rather than as a mechanism for substantially altering total water availability.
Food supply responds differently. It is more sensitive to climate–socioeconomic conditions and water-management interventions than to HP expansion alone. This highlights the need to address irrigation efficiency, agricultural water use and climate resilience directly when designing future food-security strategies in Central Asia. Increasing renewable generation should therefore be embedded within a broader policy portfolio that jointly considers agricultural production, irrigation performance and downstream environmental requirements.
The sub-basin analysis further demonstrates that basin-wide indicators can conceal important upstream–downstream trade-offs. Upstream-focused HP development concentrates energy benefits in upstream areas while generating limited improvements in downstream water and food security. In contrast, the integrated basin-wide strategy produces the most balanced outcomes, combining increased HP capacity with improved food production and enhanced Aral Sea inflows, particularly in the Syr Darya basin. However, the persistent trade-offs observed in the Amu Darya basin show that coordinated policy portfolios do not automatically produce simultaneous improvements in installed HP capacity, food supply and Aral Sea inflows. The contrasting response of the two river systems further demonstrate that a uniform management strategy is unlikely to be equally effective throughout the Aral Sea Basin.
These findings underline the need for coordinated, basin-specific and spatially differentiated governance approaches. Future transboundary agreements should combine basin-wide cooperation with measures tailored to the hydrological, agricultural and infrastructural characteristics of each river basin. Coordinated reservoir operation, irrigation planning, safeguards for downstream flows and negotiated water-allocation mechanisms will be essential to balance upstream energy development with downstream water, food and ecosystem needs. Such agreements should also strengthen regional data exchange, benefit-sharing arrangements and the institutional integration of irrigation and hydropower management, thereby improving consistency between national infrastructure strategies and basin-wide sustainability objectives.
From a methodological perspective, the study demonstrates the added value of spatially explicit System Dynamics modelling for transboundary WEF Nexus assessments. By representing sub-basin heterogeneity and upstream–downstream feedback, the proposed framework helps identify where benefits, risks and trade-offs emerge across interconnected river systems. Future work should build on this framework and follow a staged and data-driven pathway. First, the annual water module should be complemented by monthly reservoir-operation components for selected data-rich reservoirs, incorporating monthly inflows, storage-area-elevation relationships, evaporation, irrigation and environmental flow requirements, turbine constraints and rule-based releases. These components should be calibrated and validated against observed storage, release and hydropower generation series before being progressively extended to the wider basin network. Second, the hydrological module should be coupled with a regional electricity-market representation that includes seasonal electricity demand, generation portfolios, interconnection capacities, transmission losses and cross-border exchanges. Subsequent extensions should incorporate water-pricing, negotiated allocation and benefit-sharing mechanisms, together with formal sensitivity and uncertainty analyses of reservoir rules, irrigation efficiencies, crop-water requirements and hydropower operating parameters. Given the limited availability of harmonised operational data, these developments should initially be implemented through pilot applications and subsequently scaled to the complete Aral Sea Basin.

Author Contributions

Conceptualization, S.P.P., I.R.-D. and R.L.F.; methodology, S.P.P. and R.L.F.; software, S.P.P. and I.R.-D.; validation, R.L.F., P.O.F., D.S.H. and J.D.K.; investigation, S.P.P., R.L.F., P.O.F., D.S.H. and J.D.K.; data curation, S.P.P.; writing—original draft preparation, S.P.P., R.L.F., P.O.F., D.S.H. and J.D.K.; writing—review and editing, all authors; visualisation, S.P.P. and J.D.K.; project administration, R.L.F. and J.D.K.; funding acquisition, R.L.F. and D.S.H. All authors have read and agreed to the published version of the manuscript.

Funding

This research has received funding from the European Union’s Horizon 2020 research and innovation programme under grant agreement No. 101022905.

Data Availability Statement

The original data presented in the study are openly available in a Zenodo repository (https://doi.org/10.5281/zenodo.21807911).

Acknowledgments

During the preparation of this work, the authors used ChatGPT-5.5 Thinking for language editing and to improve the readability and clarity of the manuscript. After using this tool, the authors have reviewed and edited the content as needed and take full responsibility for the content of this publication.

Conflicts of Interest

The authors declare no conflicts of interest. The funders had no role in the design of the study; in the collection, analyses, or interpretation of data; in the writing of the manuscript; or in the decision to publish the results.

Abbreviations

The following abbreviations are used in this manuscript:
AFRAgricultural Food Resources
BaUBusiness-as-usual
CACentral Asia
CMIPCoupled Model Intercomparison Project
DHPDecommissioned hydropower capacity
DSSDecision Support System
FIFood imports
GHGGreenhouse Gas
GWIGroundwater inputs
HPHydropower
IPCCIntergovernmental Panel on Climate Change
LPFRLivestock and poultry food resources
MAEMean Absolute Error
NDCNational Determined Contributions
NHPNewly incorporated hydropower capacity
NPNational Plan
PVPhotovoltaic
RCPRepresentative Concentration Pathways
RESRenewable Energy Sources
SBSub-basin
SDSystem Dynamics
SDMSystem Dynamics Model
SSPShared Socioeconomic Pathways
SWSurface water
WEFWater–Energy–Food

References

  1. Varis, O.; Kummu, M. The Major Central Asian River Basins: An Assessment of Vulnerability. Int. J. Water Resour. Dev. 2012, 28, 433. [Google Scholar] [CrossRef] [Scilit]
  2. Saidmamatov, O.; Rudenko, I.; Pfister, S.; Koziel, J. Water–Energy–Food Nexus Framework for Promoting Regional Integration in Central Asia. Water 2020, 12, 1896. [Google Scholar] [CrossRef] [Scilit]
  3. De Keyser, J.; Osuna Fuentes, P.; Hayes, D.S.; Habersack, H. A Review of Hydropower in Central Asia: Past, Present, and Future. Renew. Sustain. Energy Rev. 2026, 226, 116239. [Google Scholar] [CrossRef] [Scilit]
  4. Prniyazova, A.; Turaeva, S.; Turgunov, D.; Jarihani, B. Sustainable Transboundary Water Governance in Central Asia: Challenges, Conflicts, and Regional Cooperation. Sustainability 2025, 17, 4968. [Google Scholar] [CrossRef] [Scilit]
  5. Bamgboye, T.T.; Shukurov, E.; Rafipour-Langeroudi, M.; Baubekova, A.; Tahir Virk, Z.; Gohari, A.; Patro, E.R.; Kløve, B.; Torabi Haghighi, A. A Review of the Water–Energy–Food Nexus in Central Asia’s Transboundary Basins: Trends, Gaps and Applications Assessments. Int. J. Water Resour. Dev. 2025. [Google Scholar] [CrossRef] [Scilit]
  6. Micklin, P. The Past, Present, and Future Aral Sea. Lakes Reserv. Res. Manag. 2010, 15, 193. [Google Scholar] [CrossRef] [Scilit]
  7. Touge, Y.; Kobayashi, G.; Khujanazarov, T.; Tanaka, K. Reproduction of Historical Water Balance in the Aral Sea Basin: The Physically-Based Framework to Quantify Water Consumption Components in Endorheic Lake. J. Hydrol. 2024, 640, 131711. [Google Scholar] [CrossRef] [Scilit]
  8. Dzhumagulov, A.M.; Baigazieva, D.M.; Eshmuradova, N.D. Transboundary Water Management in Kyrgyzstan: International Law Aspects. BIO Web Conf. 2024, 107, 04003. [Google Scholar] [CrossRef] [Scilit]
  9. Zamin. From 2026 Kyrgyzstan Plans to Sell Water to Uzbekistan. Available online: https://zamin.uz/en/world/160575-from-2026-kyrgyzstan-plans-to-sell-water-to-uzbekistan.html (accessed on 26 March 2026).
  10. Swiss Agency for Development and Cooperation. Sustainable Water Policy in Uzbekistan Thanks to New Water Laws. Available online: https://www.eda.admin.ch/en/sustainable-water-policy-in-uzbekistan-thanks-to-new-water-laws (accessed on 30 January 2026).
  11. Yusupova, G.N.; Yugai, N.A.; Choguldurov, M.D.; Khubieva, S.A. Development of Water Resources Infrastructure in the Kyrgyz Republic: Conflict Potential. BIO Web Conf. 2024, 83, 04001. [Google Scholar] [CrossRef] [Scilit]
  12. United Nations Conference on Trade and Development. World Investment Report 2025: International Investment in the Digital Economy; United Nations: Geneva, Switzerland, 2025; Available online: https://unctad.org/publication/world-investment-report-2025 (accessed on 2 February 2026).
  13. Latipov, N. Climate Change and Sustainable Development Pathways in Central Asia. Zenodo. 2025. Available online: https://zenodo.org/records/17401305 (accessed on 21 February 2026).
  14. Issakov, Y.; Sarkytkan, K.; Gajić, T.; Akhmetova, A.; Berdygulova, G.; Zhoya, K.; Razia, T.; Matigulla, B. Climate-Induced Transboundary Water Insecurity in Central Asia: Institutional Challenges, Adaptation Responses, and Future Research Directions. Water 2025, 17, 1795. [Google Scholar] [CrossRef] [Scilit]
  15. Peña-Guerrero, M.D.; Senay, G.B.; Umirbekov, A.; Tarasova, L.; Rufin, P.; Pulatov, B.; Müller, D. Climate Change Has Increased Crop Water Consumption in Central Asia despite Less Water-Intensive Cropping. Commun. Earth Environ. 2026, 7, 122. [Google Scholar] [CrossRef] [Scilit]
  16. Mayar, M.A.; Hamidov, A.; Akramkhanov, A.; Helming, K. Consideration of the Environment in Water–Energy–Food Nexus Research in the Aral Sea Basin. Water 2024, 16, 658. [Google Scholar] [CrossRef] [Scilit]
  17. De Keyser, J.; Hayes, D.S.; Marti, B.; Siegfried, T.; Seliger, C.; Schwedhelm, H.; Anarbekov, O.; Gafurov, Z.; López Fernández, R.M.; Ramos Diez, I.; et al. Integrating Open-Source Datasets to Analyze the Transboundary Water–Food–Energy–Climate Nexus in Central Asia. Water 2023, 15, 3482. [Google Scholar] [CrossRef] [Scilit]
  18. Yang, Z.; Li, L.; Su, Y.; Huo, L.; Yang, G. Multi-Objective Collaborative Optimization Model and Application of the Water-Energy-Food-Carbon Nexus Under Uncertainty: A Case Study of the Heihe Irrigation Area. Water 2026, 18, 841. [Google Scholar] [CrossRef] [Scilit]
  19. Zahedi, R.; Yousefi, H.; Aslani, A.; Ahmadi, R. System Dynamic Model of Water, Energy and Food Nexus for Policy Implementation. Appl. Water Sci. 2024, 14, 213. [Google Scholar] [CrossRef] [Scilit]
  20. Javan, K.; Altaee, A.; Darestani, M.; Mirabi, M.; Azadmanesh, F.; Zhou, J.L.; Hosseini, H. Assessing the Water–Energy–Food Nexus and Resource Sustainability in the Ardabil Plain: A System Dynamics and HWA Approach. Water 2023, 15, 3673. [Google Scholar] [CrossRef] [Scilit]
  21. Bakhshianlamouki, E.; Masia, S.; Karimi, P.; van der Zaag, P.; Sušnik, J. A System Dynamics Model to Quantify the Impacts of Restoration Measures on the Water–Energy–Food Nexus in the Urmia Lake Basin, Iran. Sci. Total Environ. 2020, 708, 134874. [Google Scholar] [CrossRef] [Scilit] [PubMed]
  22. Wang, X.; Dong, Z.; Sušnik, J. System Dynamics Modelling to Simulate Regional Water–Energy–Food Nexus Combined with the Society–Economy–Environment System in Hunan Province, China. Sci. Total Environ. 2023, 863, 160993. [Google Scholar] [CrossRef] [Scilit] [PubMed]
  23. Giordano, R.; Osann, A.; Henao, E.; López, M.L.; Piqueras, J.G.; Nikolaidis, N.P.; Lilli, M.; Coletta, V.R.; Pagano, A. Causal Loop Diagrams for Bridging the Gap between Water–Energy–Food–Ecosystem Nexus Thinking and Nexus Doing: Evidence from Two Case Studies. J. Hydrol. 2025, 650, 132571. [Google Scholar] [CrossRef] [Scilit]
  24. Oduor, B.O.; Martínez-Pérez, S.; Rodríguez-Castellanos, J.M.; Sánchez-Gómez, A.; Molina-Navarro, E. Future of Water Security in Mediterranean Reservoirs: Advancing SWAT+ Modeling of Hydrological Response to Climate Change in Central Spain. Earth Syst. Environ. 2026, 10, 7743. [Google Scholar] [CrossRef] [Scilit]
  25. Pérez Pérez, S.; Ramos-Diez, I.; López Fernández, R. Transboundary Water–Energy–Food Nexus Management in Major Rivers of the Aral Sea Basin Through System Dynamics Modelling. Water 2025, 17, 2270. [Google Scholar] [CrossRef] [Scilit]
  26. Tebaldi, C.; Debeire, K.; Eyring, V.; Fischer, E.; Fyfe, J.; Friedlingstein, P.; Knutti, R.; Lowe, J.; O’Neill, B.; Sanderson, B.; et al. Climate Model Projections from the Scenario Model Intercomparison Project (ScenarioMIP) of CMIP6. Earth Syst. Dyn. 2021, 12, 253. [Google Scholar] [CrossRef] [Scilit]
  27. Copernicus Climate Change Service. CMIP6 Climate Projections. 2020. Available online: https://www.wdc-climate.de/ui (accessed on 12 April 2026).
  28. Mahla, P.K. Hydropower Horizons: Exploring the Future of the Aral Sea Basin in Central Asia. SSRN. 2025. Available online: https://papers.ssrn.com/sol3/papers.cfm?abstract_id=5315539 (accessed on 12 April 2026).
  29. De Keyser, J.; Seliger, C.; Hayes, D.S.; Schwedhelm, H.; Osuna Fuentes, P.; Carey, J.I.; Siegfried, T.; Marti, B.; Habersack, H. A Regional-Scale Framework for Assessing Sustainable Hydropower Potential Based on Open-Access Data: The Case of Central Asia. Appl. Energy 2026, 414, 127843. [Google Scholar] [CrossRef] [Scilit]
  30. HydroSHEDS. Available online: https://www.hydrosheds.org/ (accessed on 18 April 2026).
  31. Wang, X.; Meng, X.; Long, Y. Projecting 1 km-Grid Population Distributions from 2020 to 2100 Globally under Shared Socioeconomic Pathways. Sci. Data 2022, 9, 563. [Google Scholar] [CrossRef] [Scilit] [PubMed]
  32. Eurasian Development Bank. Regulation of the Water and Energy Complex of Central Asia; Reports and Working Papers 22/4; Eurasian Development Bank: Almaty, Kazakhstan, 2022; Available online: https://eabr.org/upload/iblock/43a/EDB_2022_Report-4_Water-and-Energy-Complex-of-CA_eng.pdf (accessed on 12 April 2026).
  33. Kalashnikova, O.; Niyazov, J.; Nurbatsina, A.; Kodirov, S.; Radchenko Yu Kretova, Z. Kyrgyz Transboundary Rivers’ Runoff Assessment (Syr-Darya and Amu-Darya River Basins) in Climate Change Scenarios. Cent. Asian J. Water Res. 2023, 9, 59. [Google Scholar] [CrossRef] [Scilit]
  34. The Aral Sea Encyclopedia. Available online: https://www.cawater-info.net/bk/water_land_resources_use/english/english_ver/pdf/aral-sea-encyclopedia.pdf (accessed on 15 April 2026).
  35. United Nations Industrial Development Organization; International Center on Small Hydro Power. World Small Hydropower Development Report; UNIDO: Vienna, Austria, 2022; Available online: https://www.unido.org/WSHPDR2022 (accessed on 14 April 2026).
  36. Zhang, M.; Chen, Y.; Shen, Y.; Li, B. Tracking Climate Change in Central Asia through Temperature and Precipitation Extremes. J. Geogr. Sci. 2019, 29, 3. [Google Scholar] [CrossRef] [Scilit]
  37. Hayes, D.S.; Hägele, T.; Kopecki, I.; Zeiringer, B.; Karimov, E.; Karimov, B.K.; Coeck, J.; Verhelst, P.; De Keyser, J.; Omonov, O.; et al. Environmental Flows Assessment Integrating Snow Trout Habitat Requirements in the Shakhimardan Basin, Central Asia. Int. J. Environ. Sci. Technol. 2025, 22, 16935. [Google Scholar] [CrossRef] [Scilit]
  38. De Keyser, J.; Osuna Fuentes, P.; Hayes, D.S.; Habersack, H. HP:CA—A Geodatabase on Hydropower Plants in Central Asia. Zenodo. 2025. Available online: https://zenodo.org/records/13320645 (accessed on 18 April 2026).
  39. Wang, X.; Duan, W.; Zou, S.; Zhang, Z.; Wei, W.; Feng, M.; Di, Y.; Li, C. Mapping the Evolution of the Water–Energy–Food–Ecosystem (WEFE) Nexus: A Comprehensive Review of the Methods, Scales, and Sustainability Challenges. Geogr. Sustain. 2026, 7, 100447. [Google Scholar] [CrossRef] [Scilit]
  40. UNECE. Handbook on Water Allocation in a Transboundary Context; United Nations Economic Commission for Europe: Geneva, Switzerland, 2021; Available online: https://unece.org/sites/default/files/2021-12/ECE_MP.WAT_64_Handbook%20on%20water%20allocation%20in%20a%20the%20transboundary%20context.pdf (accessed on 20 April 2026).
  41. Koushali, H.P.; Moshtagh, R.; Mastoori, R. Water Resources Modelling Using System Dynamic in Vensim. J. Water Resour. Hydraul. Eng. 2015, 4, 251. [Google Scholar] [CrossRef] [Scilit]
  42. Azimov, U.; Avezova, N. Sustainable Small-Scale Hydropower Solutions in Central Asian Countries for Local and Cross-Border Energy/Water Supply. Renew. Sustain. Energy Rev. 2022, 167, 112726. [Google Scholar] [CrossRef] [Scilit]
  43. Peña-Torres, D.; Boix, M.; Montastruc, L. Multi-Objective Optimization and Demand Variation Analysis on a Water Energy Food Nexus System. Comput. Chem. Eng. 2024, 180, 108473. [Google Scholar] [CrossRef] [Scilit]
  44. Vogel, R.M.; Lall, U.; Cai, X.; Rajagopalan, B.; Weiskel, P.K.; Hooper, R.P.; Matalas, N.C. Hydrology: The Interdisciplinary Science of Water. Water Resour. Res. 2015, 51, 4409. [Google Scholar] [CrossRef] [Scilit]
  45. Walters, J.P.; Archer, D.W.; Sassenrath, G.F.; Hendrickson, J.R.; Hanson, J.D.; Halloran, J.M.; Vadas, P.; Alarcon, V.J. Exploring Agricultural Production Systems and Their Fundamental Components with System Dynamics Modelling. Ecol. Model. 2016, 333, 51. [Google Scholar] [CrossRef] [Scilit]
  46. Yupanqui, C.; Dias, N.; Goodarzi, M.R.; Sharma, S.; Vagheei, H.; Mohtar, R. A Review of Water–Energy–Food Nexus Frameworks, Models, Challenges and Future Opportunities to Create an Integrated, National Security-Based Development Index. Energy Nexus 2025, 18, 100409. [Google Scholar] [CrossRef] [Scilit]
  47. Huang, D.; Li, G.; Sun, C.; Liu, Q. Exploring Interactions in the Local Water–Energy–Food Nexus (WEF-Nexus) Using a Simultaneous Equations Model. Sci. Total Environ. 2020, 703, 135034. [Google Scholar] [CrossRef] [Scilit] [PubMed]
  48. Vensim Software. Available online: https://vensim.com/software/ (accessed on 22 February 2026).
  49. Jones, L. Vensim and the Development of System Dynamics. In Discrete-Event Simulation and System Dynamics for Management Decision Making, 1st ed.; Brailsford, S., Churilov, L., Dangerfield, B., Eds.; Wiley: Hoboken, NJ, USA, 2014; p. 215. [Google Scholar] [CrossRef] [Scilit]
  50. Drobinski, P.; Rivera-Ferre, M.G.; Monem, M.A.; Hatab, A.A.; Behnassi, M.; Chfadi, T.; Cramer, W.; Debolini, M.; Driouech, F.; El-Kenawy, A.; et al. Nexus Approach to Enhance Water–Energy–Food Security and Ecosystems Resilience under Climate Change in the Mediterranean. npj Clim. Action 2025, 4, 115. [Google Scholar] [CrossRef] [Scilit]
  51. Naidoo, D.; Nhamo, L.; Mpandeli, S.; Sobratee, N.; Senzanje, A.; Liphadzi, S.; Modi, A.T.; Mabhaudhi, T. Operationalising the Water–Energy–Food Nexus through the Theory of Change. Renew. Sustain. Energy Rev. 2021, 149, 111416. [Google Scholar] [CrossRef] [Scilit] [PubMed]
  52. Van Vuuren, D.P.; O’Neill, B.C.; Riahi, K.; Fricko, O.; Janssens-Maenhout, G.; Kriegler, E.; Meinshausen, M.; Rogelj, J.; Schaeffer, M.; Tebaldi, C.; et al. The Scenario Model Intercomparison Project for CMIP7 (ScenarioMIP-CMIP7). Geosci. Model. Dev. 2026, 19, 2627. [Google Scholar] [CrossRef] [Scilit]
  53. Farjad, B.; Gupta, A.; Sartipizadeh, H.; Cannon, A.J. A Novel Approach for Selecting Extreme Climate Change Scenarios for Climate Change Impact Studies. Sci. Total Environ. 2019, 678, 476. [Google Scholar] [CrossRef] [Scilit] [PubMed]
  54. Qi, J.; Evered, K.T. (Eds.) Environmental Problems of Central Asia and Their Economic, Social and Security Impacts; Springer: Dordrecht, The Netherlands, 2008; Available online: https://pdfs.semanticscholar.org/092c/f0b4233124d3d6da72543220fbe658075692.pdf (accessed on 28 April 2026).
  55. Tolstykh, V. Central Asia and International Law. In The BRICS Legal Cooperation and Perspectives; Springer Nature: Singapore, 2026. [Google Scholar] [CrossRef] [Scilit]
  56. Abdullaev, I. Water Management Policies of Central Asian Countries: Integration or Disintegration. In Proceedings of the USDS Organized Conference “Celebrating 10 Years of Contemporary Issues Fellowships Conference on Water Issues in Central Asia”, Tashkent, Uzbekistan, 25 September 2004. [Google Scholar]
  57. Radovanović, M.; Filipović, S.; Andrejević Panić, A. Sustainable Energy Transition in Central Asia: Status and Challenges. Energy Sustain. Soc. 2021, 11, 49. [Google Scholar] [CrossRef] [Scilit]
  58. Baimagambetova, L.; Baibulekova, L.; Aliyeva, Z.T.; Aidarova, A.B.; Mashirova, T.; Balapanova, E.; Nurpeissova, A.; Bolganbayev, A. Analysis of the Effects of Energy Consumption, Employment, Mining, Natural Resource Income, and Foreign Direct Investments on Economic Growth in the Central Asian Turkic Republics Using Panel Causality Tests. Int. J. Energy Econ. Policy 2025, 15, 204. [Google Scholar] [CrossRef] [Scilit]
  59. Wang, L.; Hafeez, M.; Ullah, S.; Yonter, I.U. Cross-Sectional Dependence in Financial Openness and Its Influence on Renewable Energy Consumption in Asia. Energy Environ. 2025, 36, 3294. [Google Scholar] [CrossRef] [Scilit]
  60. Khushvakhtzoda, K.K.; Makhsumov, I.B.; Kholnazarov, M.B.; Kirpichnikova, I.M. Impact of Green Energy Development on Climate Change Mitigation. Reg. Sustain. 2026, 7, 100292. [Google Scholar] [CrossRef] [Scilit]
  61. Kholmamatovich, N.O.; Toshtemirovich, K.J.; Shamsievich, B.A.; Pazilbekovich, M.R.; Khamidovich, K.B. Ensuring the Safety of Hydraulic Structures in Central Asia: A Comparative Perspective. Leg. J. Ilm. Huk. 2026, 34, 46. [Google Scholar] [CrossRef] [Scilit]
  62. Kurmanov, N.; Kabdullina, G.; Baidakov, A.; Kabdolla, A. Renewable Energy, Green Economic Growth and Food Security in Central Asian Countries: An Empirical Analysis. Int. J. Energy Econ. Policy 2025, 15, 1. [Google Scholar] [CrossRef] [Scilit]
  63. Zhang, Y.; Li, T.; Hu, Q.; He, L.; Li, X. Food Security Changes in Central Asia during 1992–2019 and Potential Assessment in Different Scenarios Based on Self-Sufficiency. Environ. Impact Assess. Rev. 2025, 114, 107900. [Google Scholar] [CrossRef] [Scilit]
  64. Green Action Task Force. Overview of the Use and Management of Water Resources in Central Asia: A Discussion Document; OECD: Paris, France, 2020; Available online: https://cawater-info.net/library/eng/overview-wm-ca-en.pdf (accessed on 5 May 2026).
  65. Kyrgyz Republic. National Development Strategy of the Kyrgyz Republic for 2018–2040. Available online: https://inff.webflow.io/resources/national-development-strategy-of-the-kyrgyz-republic (accessed on 5 May 2026).
  66. FAO. National Strategy for Adaptation to Climate Change of the Republic of Tajikistan for the Period up to 2030. 2019. Available online: https://leap.unep.org/en/countries/tj/national-legislation/national-strategy-adaptation-climate-change-republic-tajikistan (accessed on 6 May 2026).
  67. Ministry of Foreign Affairs of the Republic of Tajikistan. The Energy Sector of the Republic of Tajikistan. Available online: https://mfa.tj/en/main/view/185/the-energy-sector-of-the-republic-of-tajikistan (accessed on 6 May 2026).
  68. Petrov, G. Tajikistan’s Energy Projects: Past, Present, and Future. 2004. Available online: https://ca-c.org/index.php/cac/article/download/612/573/1173 (accessed on 7 May 2026).
  69. Hrebianchuk, L. Kazakhstan—Development of a Road Map for Strengthening Water Management for Improved Water Efficiency and Security; World Bank Group: Washington, DC, USA, 2016; Available online: https://documents.worldbank.org/en/publication/documents-reports/documentdetail/088020924185132443 (accessed on 12 May 2026).
  70. EU Reporter Correspondent. Kazakhstan Cuts Water Use by 874 Mln m3 through New Technologies. EU Reporter. 8 June 2026. Available online: https://www.eureporter.co/kazakhstan-2/2026/06/08/kazakhstan-cuts-water-use-by-874-mln-m%C2%B3-through-new-technologies/ (accessed on 12 May 2026).
  71. National Welfare Fund Samruk-Kazyna Joint Stock Company. Water Resources Management. Kazakhstan, 2025. Available online: https://sk.kz/our2024/en/water-management.html (accessed on 12 May 2026).
  72. OSCE. Kazakhstan Action Plan: To Develop a National Strategic Environmental Assessment System; OSCE: Vienna, Austria, 2021; Available online: https://unece.org/sites/default/files/2022-03/Kazakhstan_SEA_action_plan_ENG_0.pdf (accessed on 12 May 2026).
  73. Government of Turkmenistan. National Strategy of Turkmenistan on Climate Change; UNDP: Ashgabat, Turkmenistan, 2021; Available online: https://www.undp.org/turkmenistan/publications/national-strategy-turkmenistan-climate-change (accessed on 12 May 2026).
  74. Turkmenistan. Law on Renewable Energy Sources, Energy Saving and Energy Efficiency. 2024. Available online: https://www.turkmenistan.gov.tm/ru/post/82397/zakon-turkmenistana-ob-energosberezhenii-i-energoeffektivnosti (accessed on 12 May 2026).
  75. Republic of Uzbekistan. Updated Nationally Determined Contribution; UNFCCC: Bonn, Germany, 2021; Available online: https://unfccc.int/sites/default/files/NDC/2022-06/Uzbekistan_Updated%20NDC_2021_EN.pdf (accessed on 14 May 2026).
  76. International Energy Agency. Law of the Republic of Uzbekistan “On the Use of Renewable Energy Sources” Dated 21 May 2019 No. ZRU-539. 2022. Available online: https://www.iea.org/policies/13310-law-of-the-republic-of-uzbekistan-on-the-use-of-renewable-energy-sources-dated-may-21-2019-no-zru-539 (accessed on 14 May 2026).
  77. INDEX. Small Hydropower Development: Prospects and Challenges for Uzbekistan; INDEX: Tashkent, Uzbekistan, 2024; Available online: https://inconsult.uz/publications/view/small-hydropower-development-prospects-and-challenges-for-uzbekistan (accessed on 18 May 2026).
  78. Concept Note for Ensuring Electricity Supply in Uzbekistan 2020–2030. 2019. Available online: https://climate-laws.org/document/concept-note-for-ensuring-electricity-supply-in-uzbekistan-2020-2030_0b60 (accessed on 18 May 2026).
  79. Jain, S.K. Downscaling Methods in Climate Change Studies. Available online: https://nihroorkee.gov.in/sites/default/files/uploadfiles/Downscaling-Climate-ChangeStudies.pdf (accessed on 18 May 2026).
  80. Mateo Martínez, A.; López Fernández, R.; Ramos-Diez, I.; Frechoso-Escudero, F. High-Resolution GDP Downscaling for Water–Energy–Food Nexus Modelling in Data-Scarce African Regions. Data 2026, 11, 150. [Google Scholar] [CrossRef] [Scilit]
  81. Rashidi, P.; Patil, S.D.; Schipper, A.M.; Alkemade, R.; Rosa, I. Downscaling Global Land-Use Scenario Data to the National Level: A Case Study for Belgium. Land 2023, 12, 1740. [Google Scholar] [CrossRef] [Scilit]
  82. Karbalaye Ghorbanpour, A.; Hessels, T.; Moghim, S.; Afshar, A. Comparison and Assessment of Spatial Downscaling Methods for Enhancing the Accuracy of Satellite-Based Precipitation over Lake Urmia Basin. J. Hydrol. 2021, 596, 126055. [Google Scholar] [CrossRef] [Scilit]
  83. Wu, Y.; Lindgren, F.; Hanson, H.A. Areal Disaggregation: A Small Area Estimation Perspective. arXiv 2026, arXiv:2603.04246. [Google Scholar] [CrossRef] [Scilit]
  84. Pisoni, E.; Zauli-Sajani, S.; Belis, C.A.; Khomenko, S.; Thunis, P.; Motta, C.; Van Dingenen, R.; Bessagnet, B.; Monforti-Ferrario, F.; Maes, J.; et al. High Resolution Assessment of Air Quality and Health in Europe under Different Climate Mitigation Scenarios. Nat. Commun. 2025, 16, 5134. [Google Scholar] [CrossRef] [Scilit] [PubMed]
  85. Zhang, B.; Li, Y.; Zhu, T.; Fu, G.; Zhang, C.; Xu, M. Basin-Wide Water Resources Management Strategies Improve Cooperation Effectiveness and Benefits. J. Water Resour. Plan. Manag. 2022, 148, 04022010. [Google Scholar] [CrossRef] [Scilit]
  86. Elsayed, H.; Djordjević, S.; Tsoukalas, I.; Makropoulos, C.; Savić, D. Water–Food–Energy Nexus Pathways in the Nile River Basin under Climate Change Uncertainty. Environ. Model. Softw. 2026, 204, 107053. [Google Scholar] [CrossRef] [Scilit]
  87. Kyrgyz Republic. National Policy Dialogue on Water in the Kyrgyz Republic; Kyrgyz Republic: Bishkek, Kyrgyzstan, 2026; Available online: https://unece.org/sites/default/files/2026-04/eng_Final_PROTOCOL%20NPD%20KG_March%202026_0.pdf (accessed on 2 June 2026).
  88. UNECE. Modelling a Resilient and Integrated Energy System for Central Asia: A Roadmap for Regional Interconnectivity; United Nations Economic Commission for Europe: Geneva, Switzerland, 2025; Available online: https://unece.org/sites/default/files/2025-06/Report_Modeling%20a%20resilient%20%26amp%3B%20integrated%20EnergySystem%20for%20CA.pdf (accessed on 2 June 2026).
  89. European Union. Ecological Flows in the Implementation of the Water Framework Directive; Guidance Document No. 31. Technical Report—2015—086; European Union: Luxembourg, 2015; Available online: https://circabc.europa.eu/sd/a/4063d635-957b-4b6f-bfd4-b51b0acb2570/Guidance%20No%2031%20-%20Ecological%20flows%20%28final%20version%29.pdf (accessed on 5 June 2026).
  90. Alifujiang, Y.; Abuduwaili, J.; Ma, L.; Samat, A.; Groll, M. System Dynamics Modeling of Water Level Variations of Lake Issyk-Kul, Kyrgyzstan. Water 2017, 9, 989. [Google Scholar] [CrossRef] [Scilit]
  91. Schwedhelm, H.; Siegfried, T.; Casas-Mulet, R.; Dallmeier, A.; Rüther, N. A Novel Framework for Analysing River Planform Characteristics in Data-Scarce Regions Using Remote Sensing Data. Earth Surf. Process. Landf. 2026, 51, e70276. [Google Scholar] [CrossRef] [Scilit]
  92. Jeuland, M.; Baker, J.; Bartlett, R.; Lacombe, G. The costs of uncoordinated infrastructure management in multi-reservoir river basins. Environ. Res. Lett. 2014, 9, 105006. [Google Scholar] [CrossRef] [Scilit]
  93. Jalilov, S.-M.; Varis, O.; Keskinen, M. Sharing Benefits in Transboundary Rivers: An Experimental Case Study of Central Asian Water-Energy-Agriculture Nexus. Water 2015, 7, 4778. [Google Scholar] [CrossRef] [Scilit]
  94. Church, J.M. UN Initiatives on Water Management in Central Asia and Potential Entry Points; Issue-Based Coalition on Environment and Climate Change, United Nations Economic Commission for Europe: Geneva, Switzerland, 2024; Available online: https://uneuropecentralasia.org/sites/default/files/2025-01/IBC%20Central%20Asia%20Water%20Paper%202024_Final.pdf (accessed on 5 August 2026).
Figure 1. (A): Overview of the study area location; (B): five countries of the CA region (KZ = Kazakhstan; KG = Kyrgyzstan; TJ = Tajikistan; TM = Turkmenistan; UZ = Uzbekistan); (C): sub-basin scale sustainable hydropower potential (TWh/year) across the Aral Sea Basin, aggregated based on [29,30]. Sub-basin IDs indicate the river basin (SD = Syr Darya; AD = Amu Darya); Existing hydropower plants (HPPs) are shown and differentiated by installed capacity and storage control, based on [3,38]. Source: Own elaboration.
Water 18 02007 g001
Figure 2. Relationships among the WEF Nexus components. Elements enclosed in boxes represent the main model inputs: WEF policies, HP development scenarios, and combined SSP-RCP scenarios. Source: Own elaboration.
Water 18 02007 g002
Figure 3. Spatial downscaling and validation of WEF-NP targets to SB scale. Source: Own elaboration.
Water 18 02007 g003
Figure 4. Mean annual water supply across the simulated scenarios (2015–2050) in the (a) Syr Darya and (b) Amu Darya basins. Values are reported as mean annual water supply ± interannual variability over the 2015–2050 simulation period.
Water 18 02007 g004
Figure 5. HP capacity trajectories under baseline and policy-driven scenarios in the Syr Darya and Amu Darya basins. Since no differences are observed among the three baseline—SSP-RCP scenarios, all three simulations are represented by a single trajectory.
Water 18 02007 g005
Figure 6. Food supply dynamics under baseline and policy-driven scenarios in (a) the Syr Darya basin and (b) the Amu Darya basin.
Water 18 02007 g006
Figure 7. (A) Overview of the study area location; (B) Spatial zonation of upstream, midstream and downstream sub-basins used for the differentiated policy implementation analysis. Source: Own elaboration.
Water 18 02007 g007
Figure 8. Water supply dynamics across different upstream–midstream–downstream implementation strategies in the Syr Darya and Amu Darya river basins, following the spatial zonation shown in Figure 7.
Water 18 02007 g008
Figure 9. Water discharge into the Aral Sea from (a) Syr Darya and (b) Amu Darya across different upstream–downstream implementation strategies.
Water 18 02007 g009
Figure 10. Installed HP in the Syr Darya (up) and Amu Darya (down) river basin under alternative policy implementation strategies in (a) upstream SBs, (b) midstream SBs and (c) downstream SBs, following the spatial zonation shown in Figure 7. Since the upstream-only HP-NP strategy and the differentiated strategy share the same HP development pathway, they overlap and are represented by a single trajectory.
Water 18 02007 g010
Figure 11. Food supply dynamics in the Syr Darya (up) Amu Darya (down river basin under alternative policy implementation strategies in (a) upstream SBs, (b) midstream SBs and (c) downstream SBs, following the spatial zonation shown in Figure 7.
Water 18 02007 g011
Table 1. WEF-NP targets in Central Asian countries.
Policy NameTarget YearSectorTarget
Kyrgyzstan
Boost water efficiency [64]2025WaterWater consumption limit of 11,900 hm3/year.
National Development Strategy [65]2040Water and EnergyIncrease share of RES to 50%.
Small HP Plants [35]2025EnergyBuilt/rehabilitate 136 SHP plants (278 MW) *.
Tajikistan
National Strategy for Adaptation to Climate Change [66]2030Energy and WaterDecrease water losses in irrigation by 20%
30% share of RES.
Large and Small HP Plants [67,68]2028EnergyHP: complete 3600 MW and modernise 474 MW *.
SHP: 47 MW *.
Kazakhstan
Improve water efficiency2030Water and FoodDecrease to 25% the water losses from irrigation.
Water code and Water Management Systems [69,70,71]2050Water and FoodBuild 20 new reservoirs and renovate 20 existing ones.
Achieve water savings of 0.15% in livestock and poultry.
Kazakhstan Action Plan [72]2050Energy2030 → 15% increase in RES.
2050 → 50% increase in RES.
Wind farms → 1,787 MW.
Solar parks → 714 MW.
Biogas → 15 MW.
41 SHP Plants → 539 MW *.
Turkmenistan
National Strategy of Turkmenistan on Climate Change [73]2030Water and EnergyDecrease to 25% the water losses from irrigation.
Increase installed capacity of RES to 2 GW.
Increase share of RES to 20%.
Law on Renewable Energy Sources [74]2030EnergyTotal of 20% of energy consumption should come from RES.
Wind, solar, hydro, and biomass → 2 GW.
Ten large solar plants → 1000 MW.
Five wind farms → 250 MW.
Improve HP infrastructure (57 MW) *.
Uzbekistan
National Determined Contributions (NDCs) [75]2030EnergyIncrease energy consumption for RES to 25%.
Construction of new RES (10 MW):
-
Solar → 5 MW.
-
Wind → 3 MW.
HP → 1.9 MW *.
Renewable Energy Sources [76]2030EnergyLarge wind farms → 100–500 MW.
Solar PV plants → 300 MW.
10 HP Plants → 1774 MW *.
Large and Small HP [77]2030Energy252 MW between small and micro HP *.
Concept of Electricity Supply 2020–2030 [78]2030EnergyDevelopment of a thermal power sector with a total capacity of 7900 MW.
Note: * Targets related to HP development were incorporated into the model through the NP-HP scenarios and not through WEF-related policies.
Table 4. HP capacity scenarios across Syr Darya sub-basins (see Figure 2), based on NP with a 2030 target horizon, except for SB-1 (2035 horizon), and complemented by BaU growth projections over multiple time scales.
SB
Number
Current Installed
Capacity (MW) *
NP 2030
(MW)
BaU 2030
(MW)
BaU 2035 (MW)BaU 2050 (MW)
SD13085.75161.3 *3156.93126.83239.5
SD2279.0NA242.6241.5246.3
SD31648.44565.91695.91674.01771.0
SD40.2NA0.20.20.2
SD5126.0NA137.1132.0151.2
SD65.4NA5.95.76.5
SD78.0NA8.78.49.6
SD80.0NA0.00.00.0
SD90.0NA0.00.00.0
Total basin5152.79727.25247.35188.65424.3
Notes: * Current installed capacity refers to 2022. “NA” in the NP column indicates that no sub-basin-specific policy target could be identified and assumed to remain at its current level, whereas “0” in the BaU columns denotes no projected expansion under business-as-usual conditions because no development has occurred in the past.
Table 5. HP capacity scenarios across Amu Darya sub-basins (see Figure 2), derived from NP with a 2030 target horizon and BaU growth projections over multiple time scales.
SB
Number
Current Installed
Capacity (MW) *
NP 2030
(MW)
BaU 2030
(MW)
BaU 2035 (MW)BaU 2050 (MW)
AD11.5NA1.61.71.9
AD20.0NA0.00.00.0
AD30.0NA0.00.00.0
AD41.4NA1.51.61.9
AD539.5NA41.242.746.6
AD60.4NA0.40.40.4
AD70.0NA8.48.48.4
AD80.0NA0.00.00.0
AD90.0NA0.00.00.0
AD105036.19283.45310.05555.86188.2
AD110.0NA4.24.24.2
AD12135.6399.6138.7141.2149.5
AD130.0NA0.00.00.0
AD140.0NA0.00.00.0
AD150.010.30.00.00.0
AD160.0NA0.00.00.0
AD170.0NA0.00.00.0
AD18115.1279.6118.6121.6132.2
AD19150.0NA152.4154.5161.7
Total basin5479.610,077.257776032.16695
Notes: * Current installed capacity refers to 2022. “NA” in the NP column indicates that no sub-basin-specific policy target could be identified and assumed to remain at its current level, whereas “0” in the BaU columns denotes no projected expansion under business-as-usual conditions because no development has occurred in the past.
Table 6. Basin-wide scenario configurations implemented in the WEF Nexus SDM.
Scenario
Simulation
Combined Climate-Socioeconomic
Scenario
WEF-Related Policy ImplementationHP
Development Scenario
BaselineSSP1-2.6NoneEndogenous baseline dynamics
SSP2-4.5None
SSP5-8.5None
RES+HP-BaUSSP2-4.5Increase wind and solar energy production
Increase biofuels and waste energy production
Increase RES production
BaU
RES+HP-NPSSP2-4.5Increase wind and solar energy production
Increase biofuels and waste energy production
Increase RES production
NP
Note: For the Syr Darya and Amu Darya basins, energy-related policy targets are presented in Table 3, while the corresponding HP development scenarios are reported in Table 4 and Table 5, respectively.
Table 7. Spatially differentiated configurations implemented in the WEF Nexus SDM under SSP2-4.5 scenario.
Scenario
Simulation
WEF-Related Policy ImplementationHP
Development
Scenario
Upstream-focused HP-NP strategyNoneHP-NP only in upstream SBs
Differentiated strategy
  • Water efficiency policies in mid and downstream SBs.
  • Water efficiency in irrigation.
  • Water-saving technologies in livestock and poultry water demand.
  • Boost water efficiency.
HP-NP only in upstream SBs
Integrated strategyWater efficiency policies in all the SBs:
  • Water efficiency in irrigation.
  • Water-saving technologies in livestock and poultry water demand.
  • Boost water efficiency.
  • Increase in RES in downstream SBs.
  • Change in the irrigated area in the mid- and downstream SBs.
  • New water reservoirs in mid- and downstream SB of the Syr Darya basin.
HP-NP in all the SBs
Disclaimer/Publisher’s Note: The statements, opinions and data contained in all publications are solely those of the individual author(s) and contributor(s) and not of MDPI and/or the editor(s). MDPI and/or the editor(s) disclaim responsibility for any injury to people or property resulting from any ideas, methods, instructions or products referred to in the content.