Article

Acute Effect of Acetaminophen and Chloramphenicol on Hydrogenotrophic Denitrification Driven by Anaerobic Granular Sludge

Department of Civil, Architectural and Environmental Engineering, University of Naples Federico II, Via Claudio 21, 80125 Naples, Italy
*
Author to whom correspondence should be addressed.
Water 2026, 18(11), 1257; https://doi.org/10.3390/w18111257
Submission received: 8 April 2026 / Revised: 14 May 2026 / Accepted: 19 May 2026 / Published: 22 May 2026
(This article belongs to the Section Water Quality and Contamination)

Highlights

  • The acute effect of acetaminophen and chloramphenicol was investigated on AnGS H2Den.
  • Acetaminophen enhanced NO3 removal, achieving a NRE of 97.5% after 3 days.
  • Chloramphenicol initially inhibited microbial activity, showing an NRE as low as 26.3% after 3 days.
  • Chloramphenicol caused NO2 accumulation of up to 37.0 ± 7.2 mg/L and increased N2O emissions.
  • Acetaminophen caused NO accumulation with a maximum NO emission rate of 16.20 × 10⁻² μg NO/min/g AnGS.

Abstract

Hydrogenotrophic denitrification (H2Den) is a promising strategy for NO3 removal from a supply water with low or negligible organic carbon content. However, its performance may be affected by emerging contaminants (ECs), which pose increasing risks to the environment and human health. This study investigates the acute effect of two widely detected ECs, acetaminophen (ACN) and chloramphenicol (CHP), at a 200 mg/L concentration, on H2Den using anaerobic granular sludge (AnGS) as inoculum. Acute exposure to ACN enhanced NO3 removal, likely due to the formation of oxidizable metabolites serving as electron donors through the heterotrophic pathway. On day 3, the residual NO3 concentration had already dropped below the regulatory limit of 50 mg/L, reaching 4.3 mg NO3/L. In contrast, CHP initially inhibited the denitrification process, resulting in limited NO3 removal, i.e., a residual concentration of 145.4 mg NO3/L on day 3. Nevertheless, short-term microbial adaptation likely enabled performance recovery under CHP exposure. On day 6, both EC exposure tests allowed a NO3 removal above 97%, although CHP resulted in residual NO2, i.e., 37 mg NO2/L. In the presence of ACN, the accumulation of gaseous denitrification intermediates was observed, with NO concentration in the headspace peaking at 9.5% (i.e., 16.2 × 10⁻² µg NO/min/g VS) on day 6. Thus, in terms of either the production of gaseous intermediates or the presence of residual nitrogen in the liquid phase, ACN and CHP significantly influenced the denitrification performance, highlighting the importance of considering their presence in the operation of the denitrification process.

1. Introduction

Water intended for human consumption is increasingly scarce and polluted [1]. Climate change and anthropogenic activities, including global population growth, urbanisation, and agricultural and industrial activities, are undermining water quantity and quality [2]. According to the United Nations Educational, Scientific and Cultural Organisation (UNESCO) report, 26% of the global population has no access to safe drinking water [3].
Nitrate (NO3) is one of the most common water pollutants, originating from industrial activities and extensive fertiliser use [4]. Elevated NO3 concentrations in water may cause eutrophication or diseases affecting human health (e.g., methemoglobinemia, thyroid dysfunction, gastric cancer) [5]. The European Union (EU) Directive 2020/2184 established the threshold limits of 50 mg NO3/L and 0.5 mg NO2/L for water intended for human consumption [6]. Therefore, effective NO3 removal techniques are necessary to comply with regulatory standards.
Biological denitrification is an effective alternative to physicochemical processes (e.g., ion exchange, reverse osmosis), converting NO3 into harmless nitrogen gas (N2) through a four-step reaction mediated by specific enzymes (i.e., nitrate reductase (Nar), nitrite reductase (Nir), nitric oxide reductase (Nor) and nitrous oxide reductase (Nos)) [7,8,9]. Autotrophic denitrification (AuDen) is a valuable alternative for drinking water treatment, as these waters typically exhibit a low C/N ratio, and does not require the addition of external organic carbon [10,11,12]. Moreover, AuDen produces less sludge thanks to the reduced biomass yield of autotrophic microorganisms, which use naturally occurring carbonate and bicarbonate in water, as well as inorganic electron donors such as sulfur-based compounds, hydrogen (H2), iron, arsenite, manganese, or thiocyanate, as an energy source [13].
H2 is a promising inorganic electron donor, as it can be produced from renewable sources, and its implementation avoids the formation of toxic by-products, making it an environmentally friendly solution [14,15]. However, hydrogenotrophic denitrification (H2Den) also presents drawbacks, such as low H2 solubility, resulting in poor gas–liquid mass transfer, flammability and explosivity [16]. So far, H2Den has been implemented in various reactor systems, including fixed and fluidised bed reactors (FBRs), membrane bioreactors (MBRs), up-flow anaerobic sludge blanket (UASB) reactors, bioelectrode reactors, and hybrid systems, reaching an NO3 removal efficiency close to 100% [17,18].
Besides NO3, emerging contaminants (ECs) represent a growing issue for water quality. ECs include pharmaceutical and personal care products (e.g., antibiotics), pesticides (e.g., insecticides, herbicides) and industrial chemicals (e.g., solvents) [19]. Conventional water treatment techniques (e.g., coagulation, flocculation) generally show limited efficiency in eliminating ECs, particularly persistent organic pollutants [20]. The presence of ECs, commonly detected in the aquatic environment at concentrations ranging from ng/L to µg/L, may also affect H2Den performance [21]. These compounds can interfere with microbial metabolism by affecting protein synthesis, membrane integrity, or enzymatic activity [22]. For instance, Xu et al. [23] showed that ibuprofen inhibited metabolic activity, resulting in lower adenosine triphosphate (ATP) and electron transfer system activity.
The type, concentration, and ECs’ mode of action on microorganisms are key aspects influencing NO3 removal efficiency (NRE). In iron sulfide-based AuDen, 2 mg/L of tetracycline reduced NRE by 86% [24]. Microbial response to ECs also depends on the characteristics of the inoculum used. Granular sludge showed higher tolerance to ECs than sludge flocs due to its compact structure and more varied microbial composition, which promotes greater stability and adaptability in contaminated waters [25,26]. For instance, Luo et al. [27] observed that granular sludge exhibited high tolerance to organic emerging pollutants up to 1200 mg/L in a co-removal process involving organic compounds and nitrate during heterotrophic denitrification.
Short- or long-term exposure of the microbial community to the contaminants may result in acute or chronic toxicity, affecting overall process performance [28]. Prolonged exposure to emerging contaminants can drive microbial communities to adapt, selecting for resistant genes [23].
Despite the increasing occurrence of ECs in aquatic systems, their potential effects on H2Den remain poorly understood, particularly when anaerobic granular sludge (AnGS) is used as inoculum. To the best of the authors’ knowledge, this is the first study to investigate the effects of ECs on AnGS H2Den. This study evaluates for the first time the effects of two ECs with different mechanisms of action, i.e., acetaminophen (ACN) and chloramphenicol (CHP), on the H2Den process driven by AnGS. ACN is among the most consumed pharmaceuticals worldwide, and it is frequently detected in wastewater effluents and surface waters due to its incomplete removal in conventional treatment processes [29,30]. CHP, although banned or severely restricted in many countries, is a broad-spectrum bacteriostatic pharmaceutical known to interfere with microbial metabolism [31].
Although ECs are typically detected in aquatic environments at ng/L or µg/L levels, higher concentrations were applied in this study to determine the tolerance and operational limits of the AnGS H2Den process. Thus, this study aims at disclosing the impact of ACN and CHP on AnGS H2Den through acute toxicity batch tests by monitoring NO3 and NO2 concentration trends, as well as the possible presence of residual gaseous denitrification intermediates, such as nitric oxide (NO) and nitrous oxide (N2O), which are often neglected in denitrification studies despite their importance in terms of air pollution and greenhouse effect.

2. Materials and Methods

2.1. Reagents

Acetaminophen (C8H9NO2, purity ≥ 99.0%) and potassium nitrate (KNO3, purity ≥ 99.0%) were provided by Sigma-Aldrich (Steinheim, Germany). Chloramphenicol (C11H12Cl2N2O5, purity ≥ 99.0%) and di-potassium hydrogen phosphate trihydrate (K2HPO4∙3H2O, purity ≥ 99.0%) were provided by ITW Reagents (Monza, Italy). Sodium phosphate monobasic trihydrate (NaH2PO4∙2H2O, purity ≥ 98.0%) was purchased from J.T. Baker (Milan, Italy).

2.2. Synthetic Water Preparation, Hydrogen and Inoculum Sources

The synthetic water contained 0.362 g/L of KNO3 as a NO3 source (i.e., 200 mg NO3/L), 0.123 g/L of NaH2PO4∙2H2O, 0.360 g/L of K2HPO4∙3H2O as buffers and 1 mL/L of a trace elements solution prepared as follow (g/L): 7.3 of CaCl2·2H2O, 5.0 of FeSO4·7H2O, 2.5 of MnCl2·4H2O, 0.5 of CoCl2·6H2O, 0.5 of (NH4)6Mo7O24·4H2O, 0.22 of ZnSO4·7H2O, 0.2 of CuSO4·5H2O [32]. Tap water was used to prepare the synthetic feed, since it contains naturally occurring inorganic carbon ions. The ECs, i.e., ACN and CHP, were added to the synthetic feed to achieve the desired concentration of 200 mg/L.
The H2 used as the electron donor was produced using a PF500 H2 generator (Fulltech Instruments, Rome, Italy). The inoculum consisted of an AnGS collected from a UASB reactor processing dairy wastewater at Arrabawn dairy farms (Killconnell, Galway, Ireland), with a total solid (TS) and volatile solid (VS) content of 8.6% and 7.6%, respectively.

2.3. Experimental Conditions

The operating conditions used in the acute toxicity tests in the presence of ACN and CHP are reported in Table 1. Starting from the optimal conditions obtained in a previous study on AnGS H2Den [33], in each bottle, 10% (v/v) of the working volume was filled with AnGS and the remaining with the synthetic water. H2 was provided at 100% in excess compared to the stoichiometry [7] (Table 1). H2Den tests were performed in the absence of ECs to assess NO3 removal without potential process inhibitors. In addition, since cell death and lysis may release organic matter, which could act as an electron donor [34], thereby contributing to heterotrophic NO3 removal, control tests were conducted in the absence of H2 (Table 1).
Batch tests were conducted in 250 mL serum glass bottles (OCHS, Lenglern, Germany), with both working and headspace volumes set at 125 mL. The tests were monitored for 6 days. Liquid samples were collected four times during the experiments (i.e., on days 0, 1, 3, and 6), while the gas sample was collected from the headspace only at the end.
Before starting each test, pH was corrected to 8.0 ± 0.1 using a 1 M NaOH solution, and the bottles were flushed with Argon (Ar) from the bottom to ensure anoxic conditions in the headspace and remove dissolved oxygen from the liquid phase. H2 was added after venting the bottles to atmospheric pressure. In the control tests, Ar replaced H2 to maintain equivalent initial pressures. The bottles were sealed and equipped with a needle and a 1-way stopcock used for gas and liquid sampling, as described in Marino et al. [33]. The bottles were kept at room temperature and shaken at 70 rpm using the Water Shaking Bath-45 (Witeg, Wertheim, Germany). All experiments were performed in triplicate.

2.4. Analytical Methods and Calculations

A HI98100 Checker Plus pH meter (Hanna Instrument, Padova, Italy) was used to measure the pH of each liquid sample. NO3 and NO2 concentrations were measured by ion chromatography using a 930 Compact IC Flex (Metrohm, Herisau, Switzerland) equipped with a Metrosep A Supp 19 anionic column. The flow rate was 0.7 mL/min, whereas injection volume and temperature were 4 µL and 30 °C, respectively. The initial and final soluble chemical oxygen demand (sCOD) concentration was determined through the standard colorimetric method [35]. Before the analyses, the liquid samples were filtered at 0.45 µm using polypropylene-membrane syringe filters (VWR, Milan, Italy). The headspace composition, i.e., H2, methane (CH4), carbon dioxide (CO2), water vapour (H2Ogas), NO, N2O, N2, O2, and Ar, at the end of the batch tests was evaluated using an HPR-20 RD gas-mass spectrometer (Hiden Analytical, Warrington, UK) equipped with a capillary unit heated to 140 °C and a Faraday Cup as detector with the lower detection limit of 1 ppm, as described by Marino et al. [33]. The NO3 removal efficiency (NRE) on a certain day was calculated following Equation (1):
N R E ( % ) = [ N O 3 ] i n [ N O 3 ] i [ N O 3 ] i n · 100
where [ N O 3 ] i n is the NO3 concentration measured on day 0 and [ N O 3 ] i is the NO3 concentration on a certain day of the test (i = 1, 3, and 6).
The NO3 removal rate was calculated following Equation (2) and expressed in mg NO3/L/d:
N O 3   r e m o v a l   r a t e ( m g   N O 3 / L / d ) = ( [ N O 3 ] i [ N O 3 ] j ) t
where [ N O 3 ] i is the NO3 concentration at a certain day of the test (i = 0, 1, 3 and 6 days) and [ N O 3 ] j is the NO3 concentration measured on the following sampling day. The time interval Δt is equal to the difference between the two sampling days considered in the calculation.

2.5. Statistical Comparison

A statistical analysis of the data was conducted through a one-way analysis of variance (ANOVA), followed by the Tukey post hoc test using Minitab Statistical Software version 22 (Minitab LCC, State College, PA, USA). The NRE obtained in the ACN-H2 and CHP-H2 tests was compared with the NO3-H2 test conducted in the absence of ECs, as well as with the corresponding control tests.

3. Results and Discussion

3.1. Effect of Acetaminophen and Chloramphenicol on Denitrification Performance

The applied EC concentration (i.e., 200 mg/L), although markedly higher than those typically reported in natural environments, was selected to enable the evaluation of tolerance limits and potential process vulnerabilities of AnGS H2Den under acute pharmaceutical exposure.
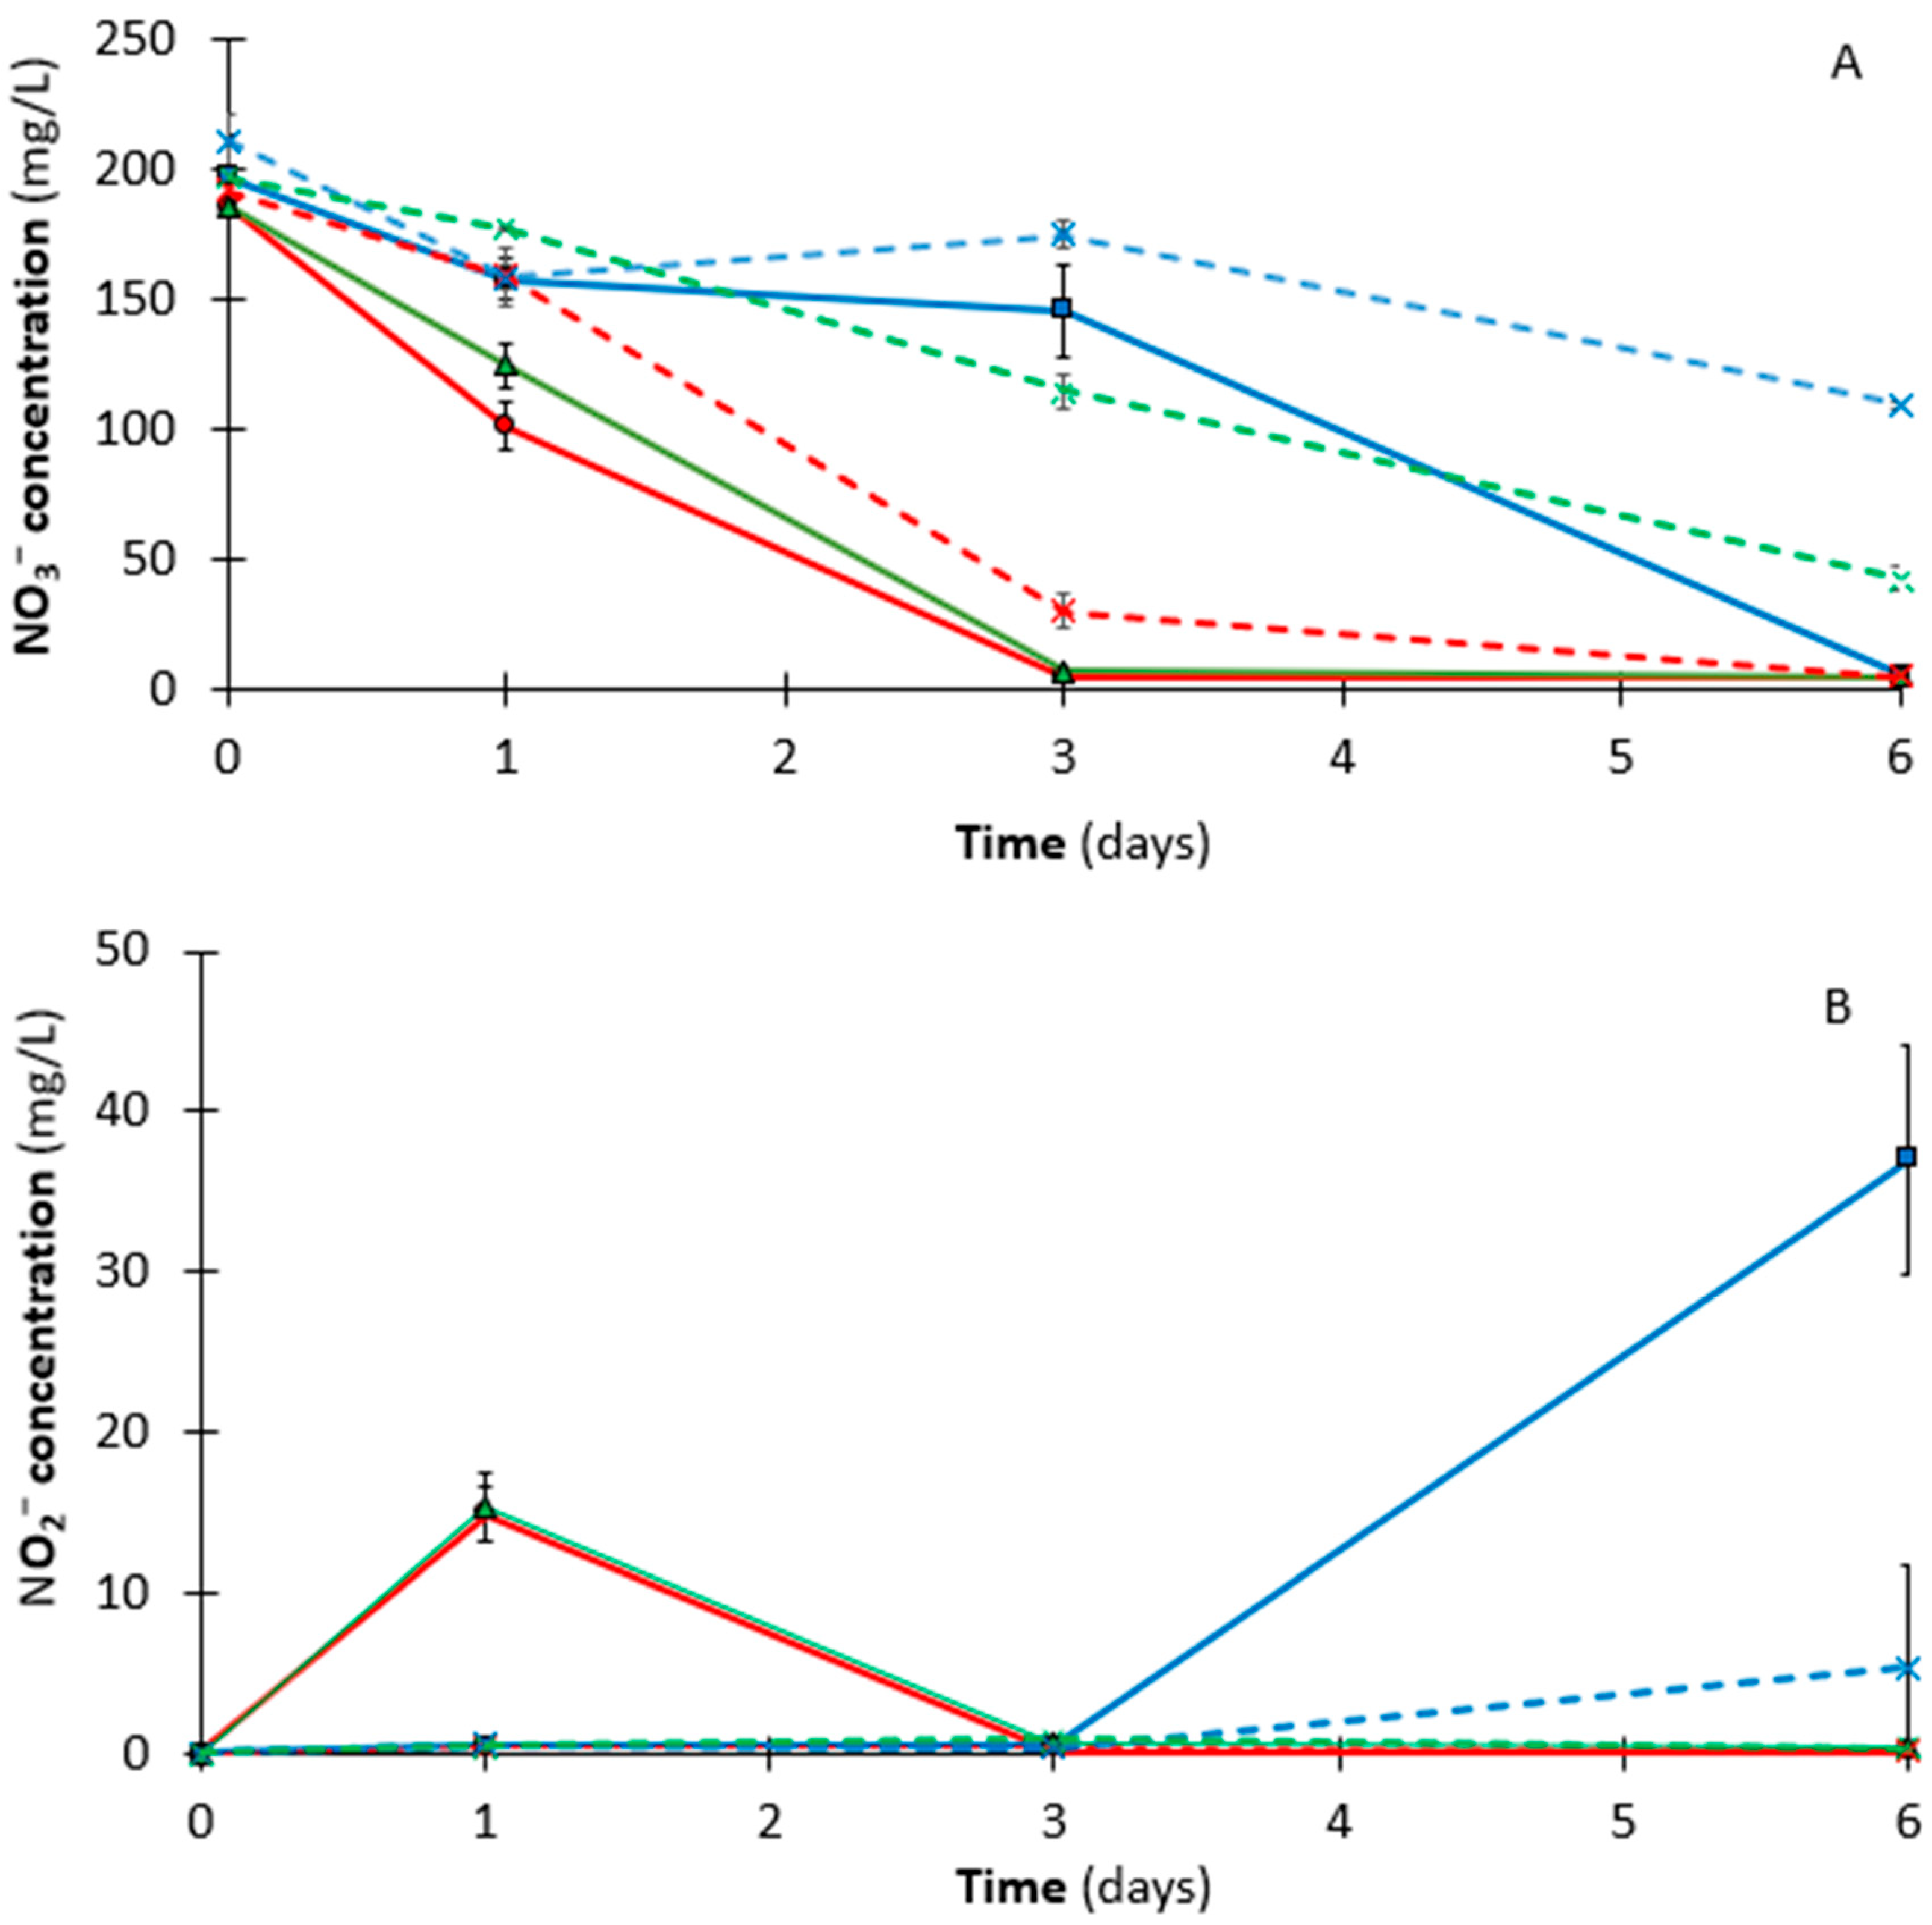
The trends of NO3 and NO2 concentrations during the batch tests are shown in Figure 1. The presence of ACN and CHP resulted in a different behaviour of H2Den (Figure 1A), especially in the intermediate days (i.e., on days 1 and 3). After 1 day of H2Den operation, in ACN-H2 and CHP-H2, the NRE was 45.7% and 20.1% (p < 0.05), respectively, whereas the NRE reached 33.0% (Table 2) in the absence of ECs (i.e., NO3-H2). The residual NO3 concentration after 1 day was 101.0 ± 8.8 mg NO3/L for ACN-H2, 157.6 ± 8.0 mg NO3/L for CHP-H2, and 124.6 ± 8.5 mg NO3/L for NO3-H2 (Table 2).
The presence of ACN and CHP in AnGS H2Den had opposite effects on the NO3 removal rate. In comparison with the NO3-H2 test, after 1 day of operation in the presence of ACN, the NO3 removal rate increased from 61.3 to 84.9 mg NO3/L/d, whereas in the presence of CHP, it decreased from 61.3 to 39.7 mg NO3/L/d. Therefore, ACN at 200 mg/L did not have an inhibitory effect on AnGS H2Den, likely because this compound is an analgesic, thus not having a direct antimicrobial action [29]. Nevertheless, earlier studies have shown that ACN inhibited denitrification at 250 mg/L [36]. The increased NO3 removal rate (Table 2) may be attributed to the microbial utilisation of ACN for the denitrification process. To date, no evidence has been found suggesting that ACN can be directly utilised by denitrifying microorganisms as an organic carbon source. However, denitrifiers have shown potential in degrading ACN under anoxic conditions, forming simpler metabolites such as p-aminophenol and catechol [37]. These metabolites may be oxidised and release electrons that can be used to improve NO3 removal [38]. Despite this unexpected finding, NO3 removal through H2-based denitrification was dominant in ACN-H2 tests, as the NRE reached 45.7% after 1 day, which was markedly higher than the 17.2% observed in CACN, the control conducted without H2 as electron donor (Table 2).
Regarding the acute toxicity test in the presence of CHP (i.e., CHP-H2 tests), the NRE only reached 20.1% after 1 day; in particular, the presence of CHP decreased the NO3 removal rate in CHP-H2 in comparison with NO3-H2, i.e., from 33.0% to 20.1% (Table 2). It indicates that CHP reduced denitrification, likely due to partial inhibition of the microbial community. Indeed, CHP is a broad-spectrum antibiotic with antibacterial properties, inhibiting bacterial protein synthesis by directly binding to the 50S subunit of the 70S ribosome [39].
The contrasting effects of ACN and CHP on the AnGS H2Den process become even more evident on day 3 (Figure 1A). The residual NO3 concentration decreased to 4.6 ± 0.7 and 6.6 ± 0.9 mg NO3/L, respectively, in the ACN-H2 and NO3-H2 test, whereas in CHP-H2 it remained as high as 145.4 ± 17.8 mg NO3/L (Table 2, Figure 2). Thus, both ACN-H2 and NO3-H2 showed NO3 concentrations below the regulatory limit of 50 mg NO3/L, with NREs of 97.5% and 96.4% (p > 0.05), respectively, whereas CHP-H2 only reached 26.3% (p < 0.05).
Notably, on day 3, the NRE in the CHP-H2 test (26.3%) was significantly lower than that obtained in the CNO3 control (41.8%; p < 0.05), thus corresponding to a 37% lower NRE when chloramphenicol was present compared to the uncontaminated control. This suggests that the presence of chloramphenicol resulted in a lower NRE than that obtained with the endogenous denitrification activity alone (Table 2). The contribution of ACN in NO3 removal was also supported by the results in the control containing ACN but lacking H2 as electron donor (CACN). Indeed, on day 3, CACN reached an NRE of 84.4%, against the value of 41.8% reached in the control with no EC addition, i.e., CNO3. Thus, ACN metabolites may have been oxidised and released electrons able to reduce NO3 [38]. Conversely, CHP continued to exert a partial inhibitor effect, even in the absence of H2 as an electron donor. Indeed, in CCHP tests, the NRE was only 24.9% on day 3 (Table 2).
On day 6, as previously discussed, in ACN-H2, the NO3 removal was nearly complete on day 3, resulting in the NRE increasing only from 97.5% on day 3 to 97.8% on day 6. Conversely, in CHP-H2 tests, the NRE increased significantly from 26.3% on day 3 to 97.5% on day 6. Therefore, after 72 h of acclimatation, the microbial community likely adapted to the presence of CHP, enabling more efficient NO3 removal with a higher NO3 removal rate in the presence of H2 as an electron donor.
Mutuku et al. [40] observed that CHP may stimulate the growth of antibiotic resistance genes. In contrast, in the control test without H2 (i.e., CCHP), the NRE at the end of the experiment was only 48.1%. Thus, the hydrogenotrophic pathway played a prevailing role in the denitrification process, also in the presence of CHP. Yuan et al. [41] investigated the nitrogen removal in the simultaneous nitrification and denitrification process in a sequencing-batch reactor operated over 161 days using a synthetic water containing CHP at feed concentrations between 10 and 20 mg/L. In the first operational phase, the denitrifying rate decreased at a 10 mg CHP/L level. After that, at 15 mg CHP/L, the biomass adapted to CHP toxicity, increasing the denitrifying rate.
Regarding NO2 concentration trends, it is evident that the presence of ACN and CHP in the process led to divergent behaviour (Figure 2). The ACN-H2 and NO3-H2 tests exhibited similar trends. On day 1, NO2 accumulated up to 14.9 ± 1.7 mg NO2/L and 15.3 ± 2.1 mg NO2/L, respectively. However, already on day 3, NO2 concentrations decreased to 0.1 ± 0.0 mg NO2/L in ACN-H2 and 0.6 ± 0.1 mg NO2/L in NO3-H2. At the end of the tests, NO2 concentrations were below the regulatory threshold value of 0.5 mg NO2/L (i.e., 0.1 ± 0.2 mg NO2/L in ACN-H2 and 0.4 ± 0.0 mg NO2/L in NO3-H2). This trend is consistent with the pattern previously reported by Marino et al. [33] in the absence of ECs. In contrast, in CHP-H2 tests, no marked NO2 accumulation was observed in the intermediate days (Figure 2), owing to the initial inhibition previously explained. Nevertheless, on day 6, NO2 concentration peaked at 37.0 ± 7.2 mg NO2/L. A similar trend was observed in the control without H2, i.e., CCHP, where NO2 concentration was 5.4 ± 6.3 mg NO2/L on day 6. Yang et al. (2021) [42] observed that exposure to antibiotics inhibited nitrite reduction more severely than nitrate reduction in similar short-term acute stress tests. Elevated NO2 concentrations in water pose serious risks to human health, including methemoglobinemia and the formation of carcinogenic N-nitroso compounds, which have been associated with gastric cancer and other adverse health effects. Therefore, an additional treatment step would be required to ensure adequate water quality and compliance with regulatory standards [5].
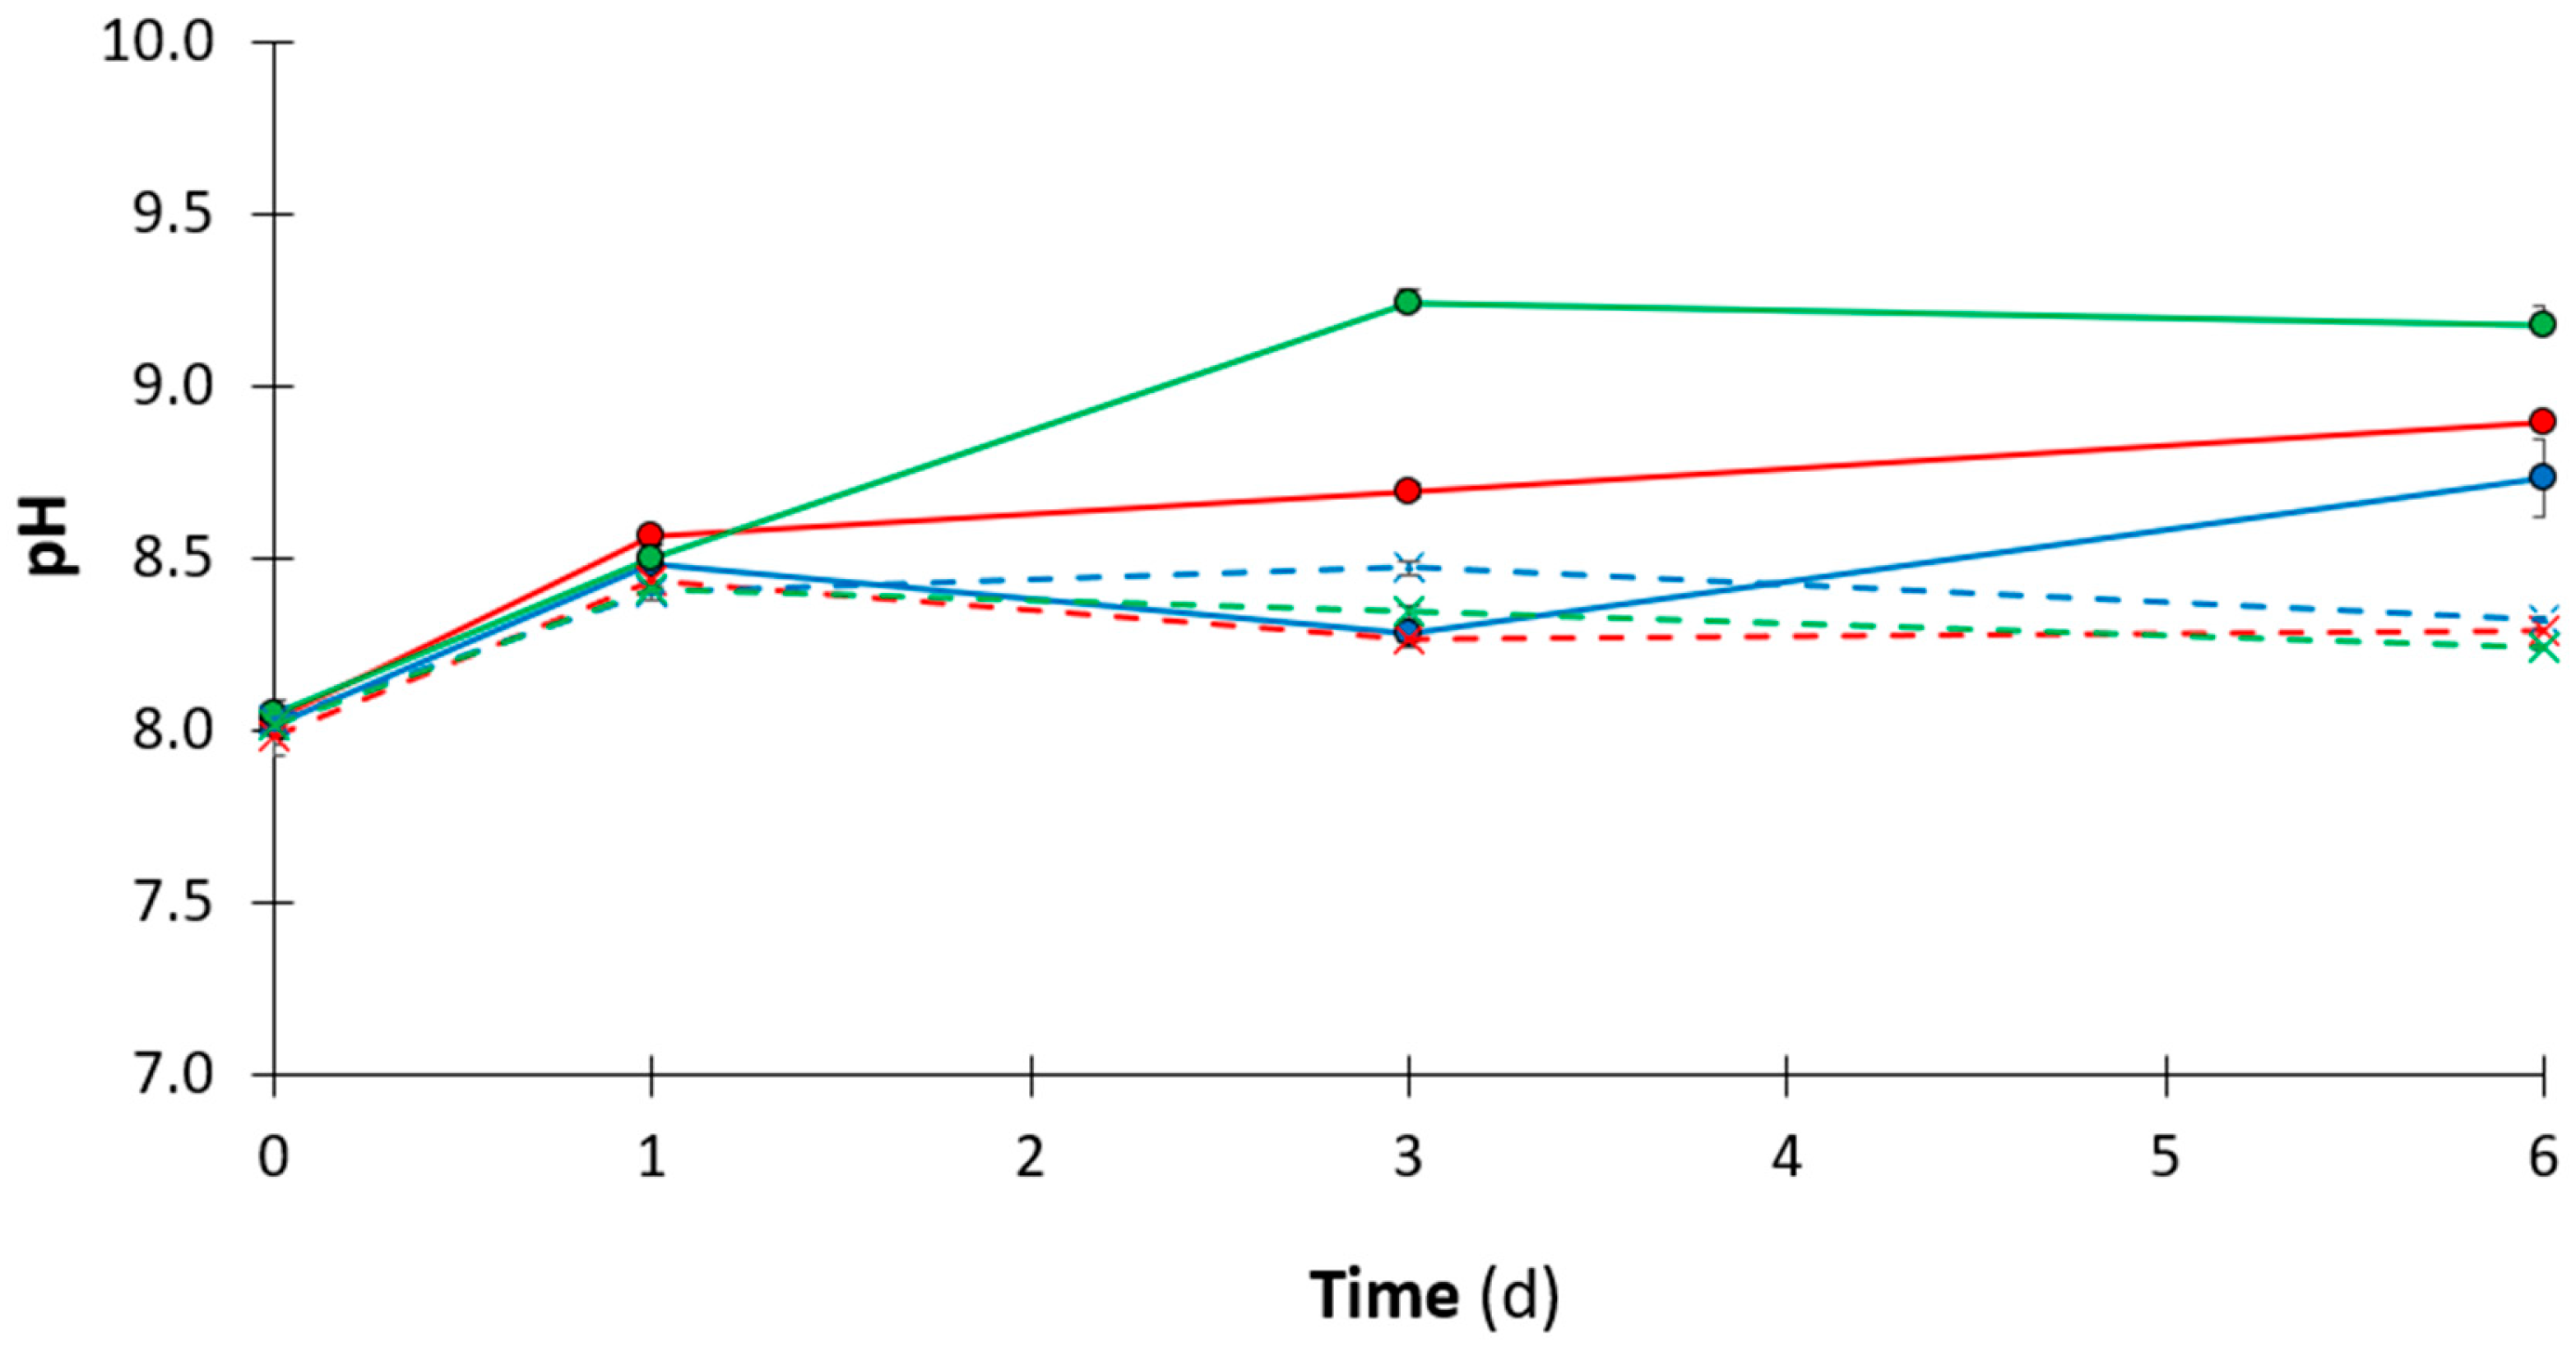
The pH trend further supports the above observations. In CHP-H2 tests, a slowdown of the denitrification process was reflected in a slight pH decrease on day 3 (i.e., from 8.5 to 8.3), following an initial increase from 8.0 to 8.5 on day 1. This behaviour could be attributed to the reduced alkalinity production associated with the limited denitrification activity [7]. Subsequently, the pH increased again on day 6, indicating a reactivation of the process. In contrast, the ACN-H2 test showed a pH profile (Figure 2) that increased to 8.6 and remained relatively constant. This behaviour is consistent with the higher NO3 removal rate, which increases alkalinity, observed during the first days of the test (Table 2). In conclusion, although the experiments were conducted under acute, high-dose conditions, they may offer preliminary mechanistic indications that could also be relevant for systems exposed to chronic contamination, where such effects might gradually develop at lower concentrations.

3.2. Effect of Acetaminophen and Chloramphenicol on Gaseous Emissions and Chemical Oxygen Demand

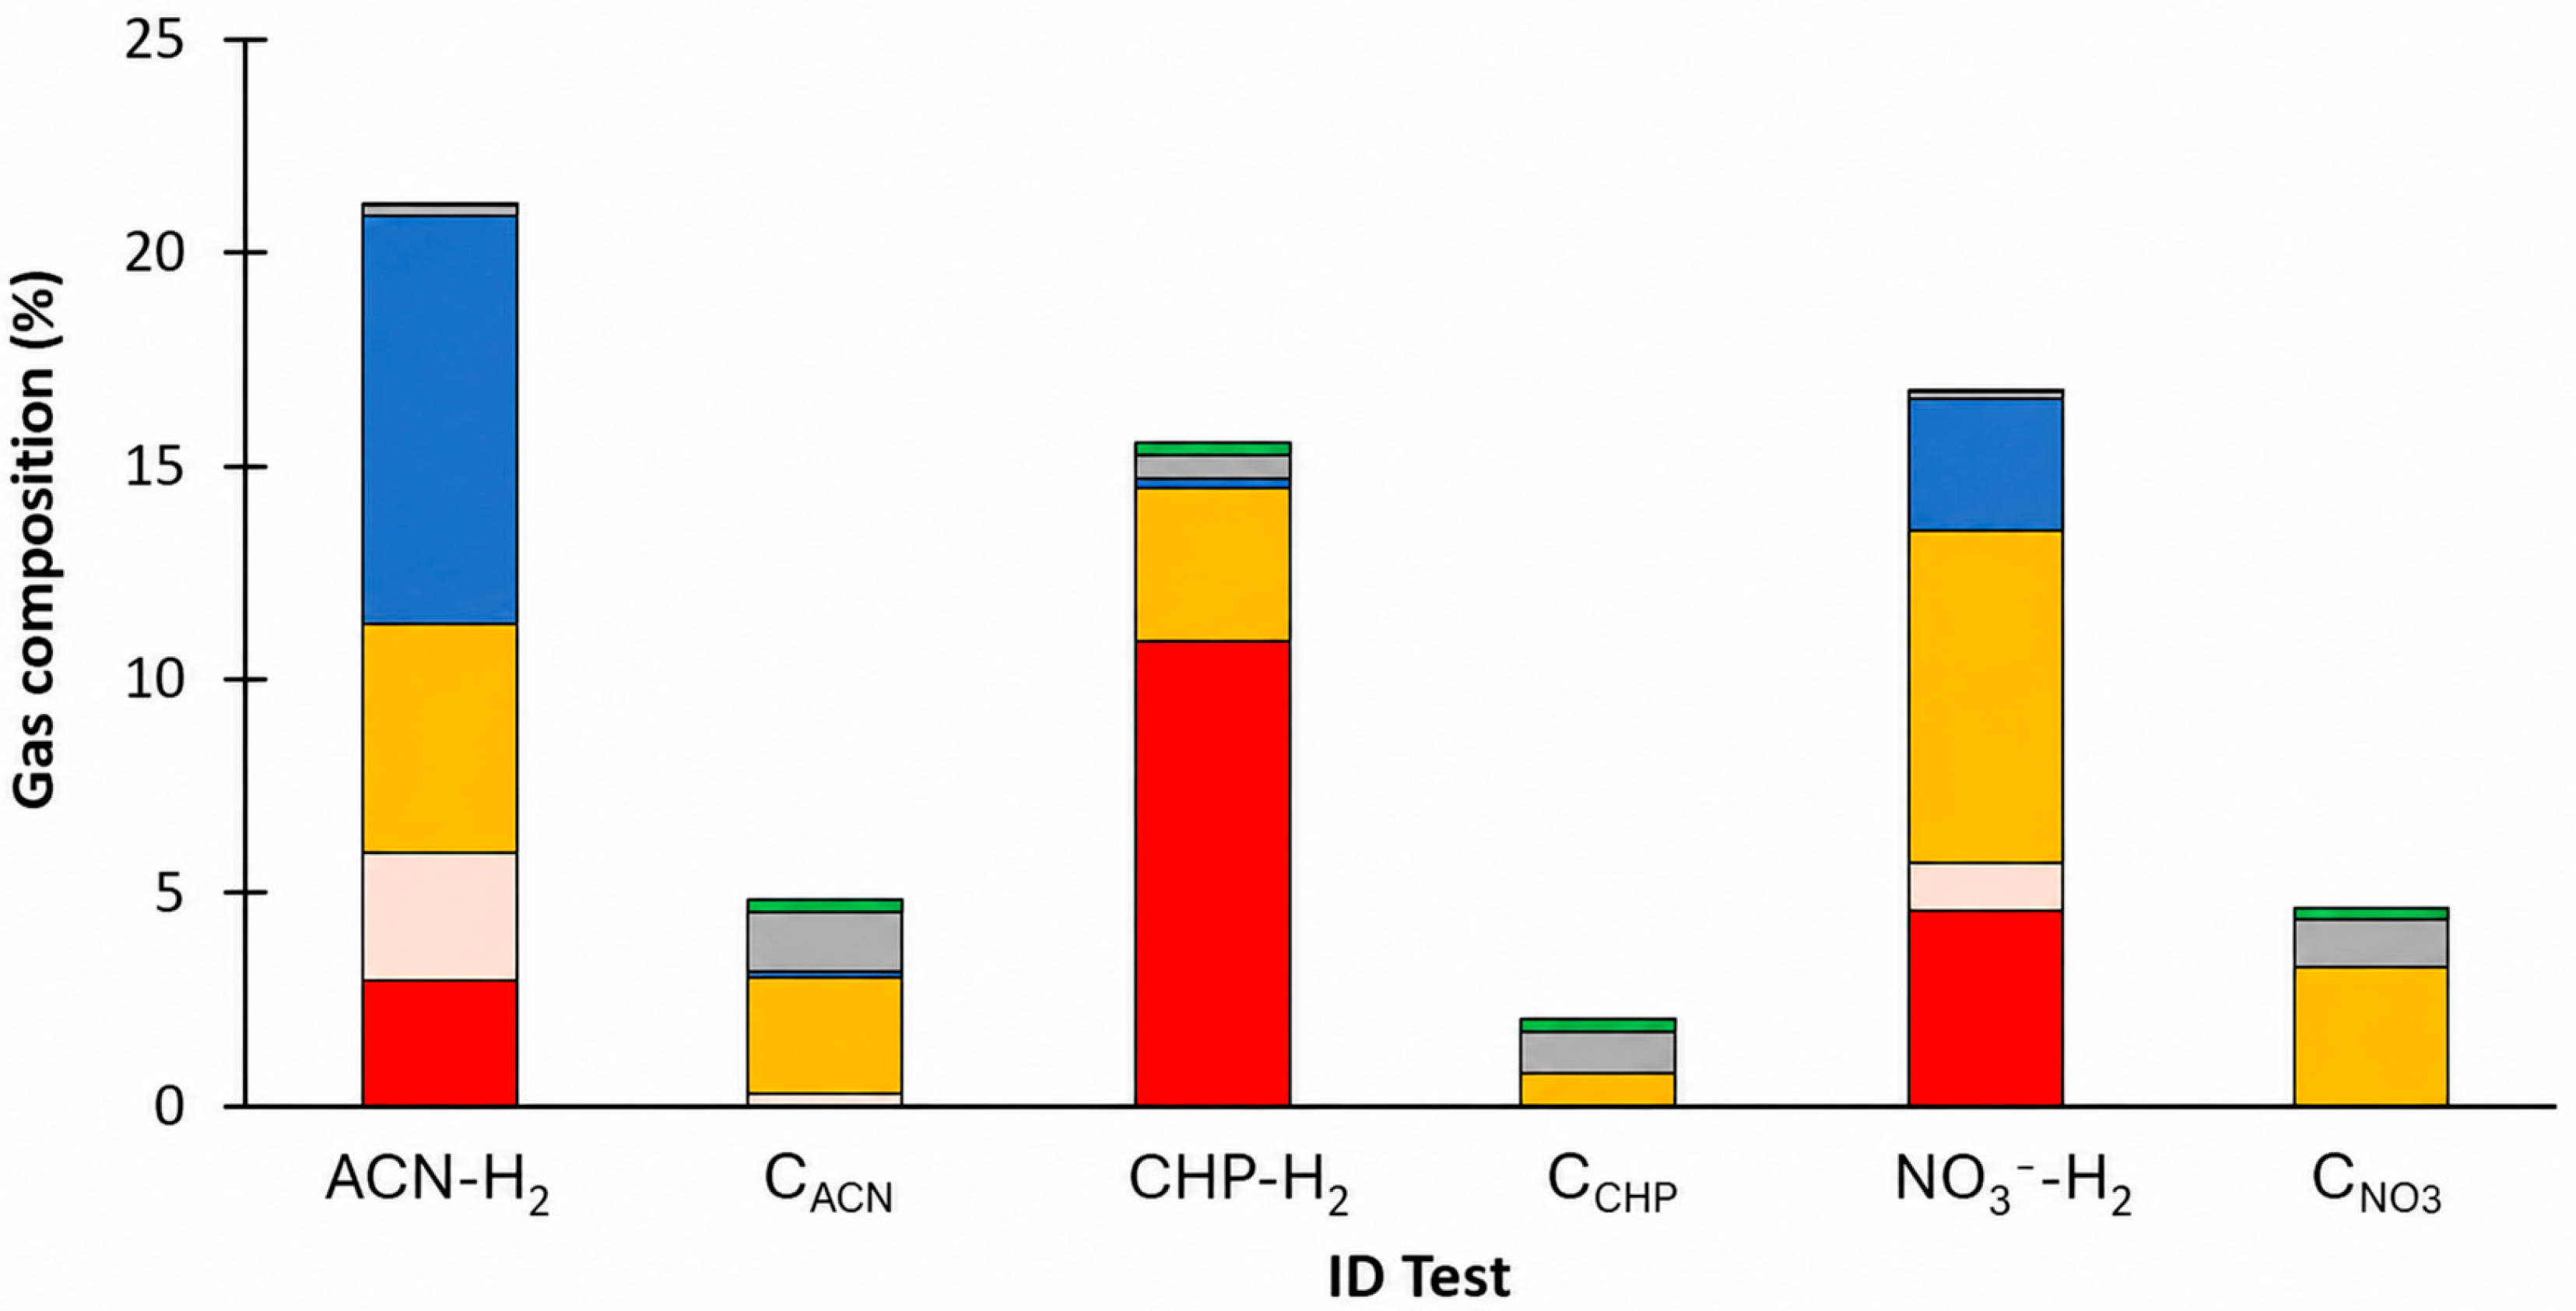
The presence of ECs is reported to alter the emissions of gaseous denitrification products (i.e., NO, N2O and N2). This alteration is mainly attributed to the inhibitory effect of ECs on NO reductase and N2O reductase enzymes [42]. Therefore, the evaluation of gaseous emissions is crucial to fully understand electron donor utilisation during the process, to assess the potential alterations induced by ECs, and to measure the emissions of greenhouse gases, such as N2O and CH4 [43]. The gas composition at the end of each batch test is shown in Figure 3.
In the acute toxicity tests (i.e., ACN-H2 and CHP-H2 tests), a different H2 utilisation was observed. On day 0, the initial H2 percentage in the headspace for each test was approximately 31%, being H2 in 100% excess compared to stoichiometry for each test (Table 1). On day 6, the average H2 percentage in the headspace was 3.0 ± 0.3% in ACN-H2, 10.9 ± 0.5% in CHP-H2, and 4.6 ± 1.2% in NO3-H2 (Figure 3). Thus, the presence of ACN did not hinder H2 utilisation since the final H2 percentage observed in the headspace was even lower than that measured in the absence of ECs (i.e., NO3-H2 tests). Conversely, in the presence of CHP, a higher percentage of the electron donor in the headspace in comparison with the other conditions was observed (Figure 3). This occurred because denitrification was strongly inhibited until day 3 (Table 2), and only afterwards, H2 was used by the microorganisms. This trend was confirmed by the N2 percentage, the final product of denitrification, which reached 5.3 ± 0.1% in ACN-H2, 3.6 ± 0.3% in CHP-H2, and 7.7 ± 1.7% in NO3-H2. The lower value in CHP-H2 indicates incomplete denitrification under CHP exposure.
As regards NO, it is worth pointing out that under ACN exposure, an average NO accumulation up to 9.5 ± 0.0% (i.e., accounting for approximately 46.5% of the total inorganic nitrogen at the end of the tests) was measured (i.e., ACN-H2) (Table 3). Instead, NO percentage was 0.2 ± 0.1% in CHP-H2 and 3.1 ± 0.9% in NO3--H2 (Figure 3). These values correspond to a NO emission rate of 16.20 × 10⁻² μg NO/min/g AnGS in ACN-H2, 0.35 × 10⁻² μg NO/min/g AnGS in CHP-H2, and 4.74 × 10⁻² μg NO/min/g AnGS in NO3-H2 (Table 3). Therefore, although ACN may have stimulated the initial steps of the denitrification as previously discussed (i.e., NO3 reduction to NO), it likely inhibited the subsequent reduction in NO, leading to its accumulation. This is further supported by the comparison with the NO3-H2 test, where NO did not accumulate to the same extent, indicating that in the absence of ECs, the denitrification pathway proceeds more efficiently. Figure 3 shows that NO was not fully reduced after 6 days, resulting in an elevated NO percentage in the headspace.
N2O accumulation was low in each batch test, reaching the maximum value of 0.3 ± 0.0% in CHP-H2 and in all the controls without H2 (i.e., CACN, CCHP, CNO3). Consequently, the highest N2O emission rate was observed in the presence of CHP, both in the acute toxicity test (CHP-H2) and the control lacking H2 (CCHP), i.e., 0.90·10−2 μg N2O/min/g AnGS (i.e., accounting for approximately 7.0% of the total inorganic nitrogen at the end of the tests) and 0.94 × 10⁻² μg N2O/min/g AnGS (i.e., accounting for approximately 13.1% of the total inorganic nitrogen at the end of the tests), respectively, whereas in ACN-H2 was 0.15 × 10⁻² μg N2O/min/g AnGS. The lowest value was observed in NO3-H2 tests, i.e., 0.07 × 10⁻² μg N2O/min/g AnGS. According to recent studies, the impact of ECs on N2O emissions in nitrogen removal processes varies mainly depending on the type of ECs and the biomass exposure time to the contaminant. For instance, the antibiotic chlortetracycline (CTC), at concentrations between 0.1 and 10 mg/L, caused an increase in the N2O emission factor, intended as the ratio between total N2O emission and total nitrogen removed, by 43.9% in anaerobic/oxic/anoxic (A2/O) sequencing batch reactors for nitrogen removal [10]. Therefore, incomplete denitrification induced by EC exposure may result in increased emissions of greenhouse gases originating from the denitrification pathway, as described by Yuan et al. [41]. Clearly, gaseous emissions in denitrification processes affected by the presence of ECs require further investigation, as the monitoring of N2O and NO is rarely pursued [42].
The CH4 percentage was almost null, except in ACN-H2 and NO3-H2 tests, in which it reached 3.0 ± 0.0% and 1.1 ± 0.1%, respectively. CH4 production may be attributed to the origin of the inoculum from fermentative processes, where methanogenic microorganisms were possibly present [44]. Methanogenic activity may have taken part in the ACN-H2 test, albeit to a limited extent, between days 3 and 6 of the batch tests, having almost removed all NO3 supplied after 3 days. Finally, the CO2 percentage was very low in the acute toxicity tests (i.e., 0.3 ± 0.0% in ACN-H2 and 0.5 ± 0.1% in CHP-H2) and reached the maximum value of 1.4 ± 0.2% in CACN.
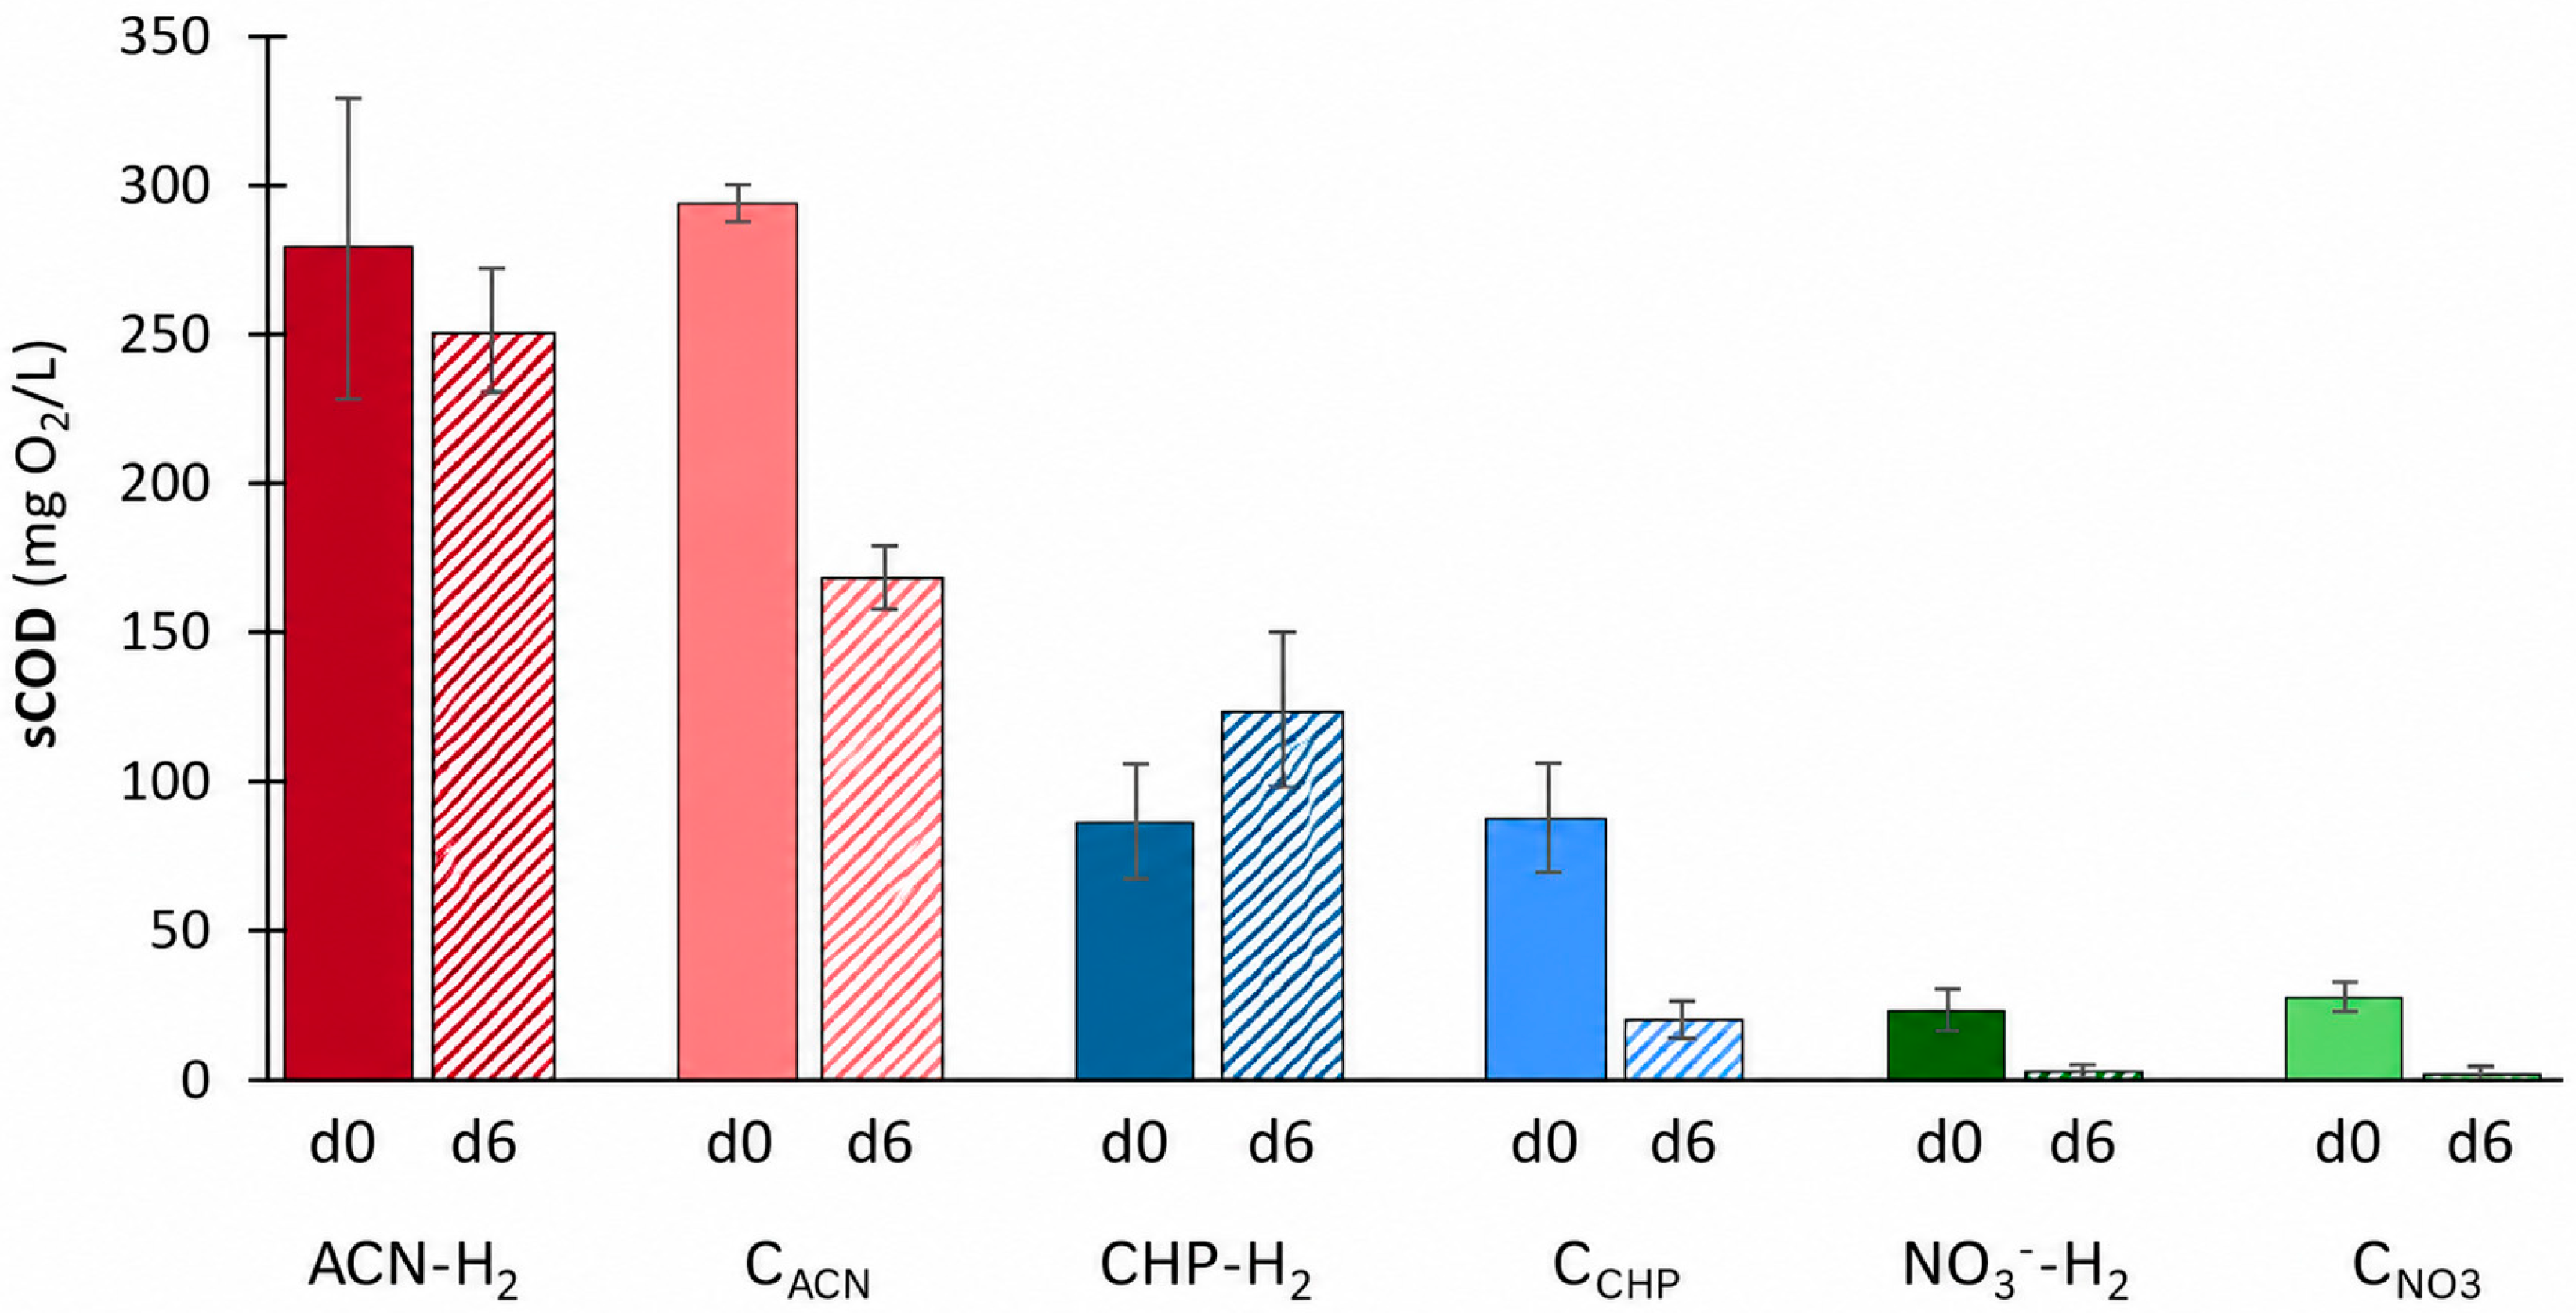
The sCOD degradation reveals markedly different behaviour depending on the EC. In ACN-H2 tests, sCOD decreased moderately from 279 mg/L to 251 mg/L, whereas the corresponding control without H2 showed a larger decrease from 293.5 mg/L to 170 mg/L (Figure 4). These results suggest that ACN contributed to sCOD and that heterotrophic denitrification pathways actively consumed ACN-related organic metabolites, to a greater extent in the absence of H2 as the electron donor.
In contrast, in CHP-H2 tests, an unexpected increase in sCOD from 86.9 to 124.1 mg/L was observed (Figure 4). This result may be attributed to intracellular organic matter release from AnGS induced by the presence of CHP and CHP metabolites. This behaviour could be consistent with a partial inhibition of the microbial community by CHP, which caused a significant decline in the H2Den performance from day 0 to day 3. In the absence of H2, the sCOD decreased from 88.3 to 20.1 mg/L in CCHP (Figure 4), suggesting the activation of the heterotrophic pathway. In the absence of ECs, on day 0, sCOD was 24.2 mg/L in NO3-H2 and 29.2 mg/L in CNO3 (Figure 4). On day 6, the sCOD removal was nearly complete, reaching 2.9 mg/L in NO3-H2 and 2.0 mg/L in CNO3 (Figure 4), indicating that the organic matter released from the AnGS is more readily available to microorganisms than more complex organic substances such as ECs. The lower sCOD removal observed in the presence of ECs may also be partially attributed to their inhibitory effects on microbial activity, as observed for CHP.

4. Conclusions

The presence of ACN and CHP led to different AnGS H2Den performances, particularly evident during the intermediate days of the acute toxicity tests. ACN stimulated NO3 removal, achieving a NO3 concentration below the regulatory limit already after 3 days (i.e., 4.9 ± 0.5 mg NO3/L). Nevertheless, exposure to ACN resulted in NO release, with a maximum NO emission rate of 16.20 × 10⁻² μg NO/min/g AnGS, suggesting an incomplete reduction in denitrification intermediates. In contrast, CHP initially inhibited microbial activity, showing an NRE as low as 26.3% and a NO3 removal rate of 6.1 mg NO3/L/d after 3 days. From day 3 to day 6, short-term microbial acclimation to CHP occurred, reaching a final NRE of 97.5%. Over such a limited time interval, this behaviour is likely associated with a selective succession within the microbial community, where CHP-sensitive microorganisms were inhibited or lysed, and pre-existing tolerant populations progressively prevailed. Nonetheless, CHP exposure caused NO2 accumulation of up to 37.0 ± 7.2 mg NO2/L and increased the N2O emission rate up to 0.9 × 10⁻² μg N2O/min/g AnGS, likely indicating a compromised enzymatic activity and incomplete denitrification. These findings suggest that CHP and ACN may promote the accumulation of undesired nitrogen intermediates, such as NO, NO2, and N2O, potentially posing risks in terms of effluent quality and greenhouse gas emissions.
Therefore, this study demonstrates that the presence of pharmaceuticals can significantly alter the microbial activity of anaerobic granular sludge in H2Den. Future research should focus on the identification of metabolites resulting from the degradation of the contaminants, chronic exposure scenarios, microbial community shifts, and mitigation strategies to ensure the feasibility of AnGS H2Den in drinking water treatment plants.

Author Contributions

Conceptualization, E.M., A.O. and S.P.; methodology, E.M. and A.O.; validation, E.M. and A.O.; formal analysis, E.M.; investigation, E.M.; resources, S.P., G.E. and F.P.; data curation, E.M.; writing—original draft, E.M.; writing—review and editing, E.M., A.O., S.P., G.E. and F.P.; visualization, E.M.; supervision, A.O., S.P., G.E. and F.P.; project administration, S.P. and F.P.; funding acquisition, F.P. All authors have read and agreed to the published version of the manuscript.

Funding

The scholarship of Emanuele Marino was co-funded by the Italian Ministry of University and Scientific Research, within the Mission 4 of Piano Nazionale di Ripresa e Resilienza (PNRR), as regulated by the Ministry Decree 352/2022, and by the company Acqua Campania SpA.

Data Availability Statement

The original contributions presented in the study are included in the article material. Further inquiries can be directed to the corresponding author.

Conflicts of Interest

The funder was not involved in the study design, collection, analysis, interpretation of data, the writing of this article, or the decision to submit it for publication.

References

  1. Pierrat, E.; Laurent, A.; Dorber, M.; Rygaard, M.; Verones, F.; Hauschild, M. Advancing water footprint assessments: Combining the impacts of water pollution and scarcity. Sci. Total Environ. 2023, 870, 161910. [Google Scholar] [CrossRef] [PubMed]
  2. Wang, M.; Bodirsky, B.L.; Rijneveld, R.; Beier, F.; Bak, M.P.; Batool, M.; Droppers, B.; Popp, A.; van Vliet, M.T.H.; Strokal, M. A triple increase in global river basins with water scarcity due to future pollution. Nat. Commun. 2024, 15, 880. [Google Scholar] [CrossRef] [PubMed]
  3. Rajan, M.; Karunanidhi, D.; Jaya, J.; Preethi, B.; Subramani, T.; Aravinthasamy, P. A comprehensive review on human health hazards due to groundwater contamination: A global perspective. Phys. Chem. Earth 2024, 135, 103637. [Google Scholar] [CrossRef]
  4. Wu, J.; Yin, Y.; Wang, J. Hydrogen-based membrane biofilm reactors for nitrate removal from water and wastewater. Int. J. Hydrogen Energy 2018, 43, 1–5. [Google Scholar] [CrossRef]
  5. Sokal-Dembowska, A.; Jarmakiewicz-Czaja, S.; Tabarkiewicz, J.; Filip, R. Nitrate and Nitrite in the Diet: Protective and Harmful Effects in Health and Disease. Curr. Nutr. Rep. 2025, 14, 89. [Google Scholar] [CrossRef]
  6. Abascal, E.; Gómez-Coma, L.; Ortiz, I.; Ortiz, A. Global diagnosis of nitrate pollution in groundwater and review of removal technologies. Sci. Total Environ. 2022, 810, 152233. [Google Scholar] [CrossRef]
  7. Di Capua, F.; Pirozzi, F.; Lens, P.N.L.; Esposito, G. Electron donors for autotrophic denitrification. Chem. Eng. J. 2019, 362, 922–937. [Google Scholar] [CrossRef]
  8. Tyagi, S.; Rawtani, D.; Khatri, N.; Tharmavaram, M. Strategies for Nitrate removal from aqueous environment using Nanotechnology: A Review. J. Water Process Eng. 2018, 21, 84–95. [Google Scholar] [CrossRef]
  9. Zou, G.; Papirio, S.; Ylinen, A.; Di Capua, F.; Lakaniemi, A.M.; Puhakka, J.A. Fluidized-bed denitrification for mine waters. Part II: Effects of Ni and Co. Biodegradation 2014, 25, 417–423. [Google Scholar] [CrossRef] [PubMed][Green Version]
  10. Chen, H.; Du, M.; Wang, D.; Zhou, Y.; Zeng, L.; Yang, X. Influence of chlortetracycline as an antibiotic residue on nitrous oxide emissions from wastewater treatment. Bioresour. Technol. 2020, 313, 123696. [Google Scholar] [CrossRef]
  11. Chen, D.; Xiao, Z.; Wang, H.; Yang, K. Toxic effects of vanadium (V) on a combined autotrophic denitrification system using sulfur and hydrogen as electron donors. Bioresour. Technol. 2018, 264, 319–326. [Google Scholar] [CrossRef]
  12. Kostrytsia, A.; Papirio, S.; Khodzhaev, M.; Morrison, L.; Collins, G.; Lens, P.N.L.; Ijaz, U.Z.; Esposito, G. Biofilm carrier type affects biogenic sulfur-driven denitrification performance and microbial community dynamics in moving-bed biofilm reactors. Chemosphere 2022, 287, 131975. [Google Scholar] [CrossRef] [PubMed]
  13. Liu, X.; Chen, S.; Yuan, R.; Chen, H.; Zhou, B.; Luo, S. Performance and mechanism analysis of autotrophic denitrification based on FexS. J. Clean. Prod. 2024, 478, 143961. [Google Scholar] [CrossRef]
  14. Li, R.; Lu, M.-Y.; Guo, R.-B.; Duan, H.; Ni, B.-J.; Fu, S.F. Life cycle assessment of hydrogenotrophic denitrification in membrane aerated biofilm reactors for sustainable wastewater treatment. Water Res. 2024, 267, 122529. [Google Scholar] [CrossRef]
  15. Karanasios, K.A.; Vasiliadou, I.A.; Pavlou, S.; Vayenas, D.V. Hydrogenotrophic denitrification of potable water. J. Hazard. Mater. 2010, 180, 20–37. [Google Scholar] [CrossRef]
  16. Zhou, J.; Ding, L.; Cui, C.; Lindeboom, R.E.F. High nitrite accumulation in hydrogenotrophic denitrification at low temperature: Transcriptional regulation and microbial community succession. Water Res. 2024, 263, 122144. [Google Scholar] [CrossRef]
  17. Marino, E.; Oliva, A.; Papirio, S.; Esposito, G.; Pirozzi, F. Long-term hydrogenotrophic denitrification of high-nitrate synthetic and spring water in dual-recirculation UASB reactors. J. Environ. Chem. Eng. 2026, 14, 123025. [Google Scholar] [CrossRef]
  18. Bi, Z.; Zhang, Q.; Xu, X.; Yuan, Y.; Ren, N.; Lee, D.J.; Chen, C. Perspective on inorganic electron donor-mediated biological denitrification process for low C/N wastewaters. Bioresour. Technol. 2022, 363, 127890. [Google Scholar] [CrossRef]
  19. Yang, L.; Pang, S.; Zhou, J.; Wu, C.; Li, X.; Yao, M.; Xia, S.; Rittmann, B.E. Biological conversion of sulfisoxazole in an autotrophic hydrogen-based membrane biofilm reactor. J. Water Process Eng. 2023, 51, 103396. [Google Scholar] [CrossRef]
  20. Shahid, M.K.; Kashif, A.; Fuwad, A.; Choi, Y. Current advances in treatment technologies for removal of emerging contaminants from water—A critical review. Coord. Chem. Rev. 2021, 442, 213993. [Google Scholar] [CrossRef]
  21. Morin-Crini, N.; Lichtfouse, E.; Liu, G.; Balaram, V.; Ribeiro, A.R.L.; Lu, Z.; Stock, F.; Carmona, E.; Teixeira, M.R.; Picos-Corrales, L.A.; et al. Worldwide cases of water pollution by emerging contaminants: A review. Environ. Chem. Lett. 2022, 20, 2311–2338. [Google Scholar] [CrossRef]
  22. Yang, W.; Bu, Q.; Shi, Q.; Zhao, R.; Huang, H.; Yang, L.; Tang, J.; Ma, Y. Emerging Contaminants in the Effluent of Wastewater Should Be Regulated: Which and to What Extent? Toxics 2024, 12, 309. [Google Scholar] [CrossRef] [PubMed]
  23. Xu, N.; Guo, J.; Huang, C.; Li, H.; Hou, Y.; Han, Y.; Song, Y.; Zhang, D. Effect of ibuprofen (IBU) on the sulfur-based and calcined pyrite-based autotrophic denitrification (SCPAD) systems with two filling modes: Performance and toxic response mechanism. Environ. Res. 2023, 239, 117251. [Google Scholar] [CrossRef] [PubMed]
  24. Bai, Y.; Wang, Z.; Lens, P.N.L.; Zhussupbekova, A.; Shvets, I.V.; Huang, Z.; Ma, J.; Wu, G.; Zhan, X. Role of iron (II) sulfide in autotrophic denitrification under tetracycline stress: Substrate and detoxification effect. Sci. Total Environ. 2022, 850, 158039. [Google Scholar] [CrossRef] [PubMed]
  25. Zheng, X.; Zhang, H.; Xu, Z.; Lin, T.; Yang, S.; Zhao, Z.; Han, Z.; Zhou, C. Tolerance and recovery of aerobic granular sludge: Impact of perfluorooctanoic acid. Chemosphere 2023, 313, 137430. [Google Scholar] [CrossRef]
  26. Lanzetta, A.; Di Capua, F.; Panneerselvam, B.; Mattioli, D.; Esposito, G.; Papirio, S. Impact of Influent Composition and Operating Conditions on Carbon and Nitrogen Removal from Urban Wastewater in a Continuous-Upflow (Micro)Aerobic Granular Sludge Blanket Reactor. Energies 2023, 16, 6303. [Google Scholar] [CrossRef]
  27. Luo, J.; Miao, S.; Koju, R.; Joshi, P.T.; Liu, R.; Liu, H.; Qu, J. Simultaneous removal of aromatic pollutants and nitrate at high concentrations by hypersaline denitrification: Long-term continuous experiments investigation. Water Res. 2022, 216, 118292. [Google Scholar] [CrossRef]
  28. Sun, S.; Hou, Y.N.; Huang, C.; Sharif, H.M.A.; Guo, J.; Ren, N.; Wang, A.J. Acute responses of bio-denitrification to short-term clopyralid exposure: Kinetic analysis and biological mechanisms. Chem. Eng. J. 2023, 457, 141145. [Google Scholar] [CrossRef]
  29. Igwegbe, C.A.; Aniagor, C.O.; Oba, S.N.; Yap, P.S.; Iwuchukwu, F.U.; Liu, T.; de Souza, E.C.; Ighalo, J.O. Environmental protection by the adsorptive elimination of acetaminophen from water: A comprehensive review. J. Ind. Eng. Chem. 2021, 104, 117–135. [Google Scholar] [CrossRef]
  30. Wu, J.L.; Liu, Z.H.; Ma, Q.G.; Dai, L.; Dang, Z. Occurrence, removal and risk evaluation of ibuprofen and acetaminophen in municipal wastewater treatment plants: A critical review. Sci. Total Environ. 2023, 891, 164600. [Google Scholar] [CrossRef]
  31. Nguyen, L.M.; Nguyen, N.T.T.; Nguyen, T.T.T.; Nguyen, T.T.; Nguyen, D.T.C.; Tran, T. VanOccurrence, toxicity and adsorptive removal of the chloramphenicol antibiotic in water: A review. Environ. Chem. Lett. 2022, 20, 1929–1963. [Google Scholar] [CrossRef]
  32. Wang, S.; Wang, Y.; Li, P.; Wang, L.; Su, Q.; Zuo, J. Development and characterizations of hydrogenotrophic denitrification granular process: Nitrogen removal capacity and adaptability. Bioresour. Technol. 2022, 363, 127973. [Google Scholar] [CrossRef]
  33. Marino, E.; Oliva, A.; Papirio, S.; Esposito, G.; Pirozzi, F. Effect of inoculum percentage and hydrogen supply on hydrogenotrophic denitrification driven by anaerobic granular sludge. Environ. Sci. Water Res. Technol. 2025, 11, 768–780. [Google Scholar] [CrossRef]
  34. Morello, R.; Di Capua, F.; Esposito, G.; Pirozzi, F.; Fratino, U.; Spasiano, D. Sludge minimisation in mainstream wastewater treatment: Mechanisms, strategies, technologies, and current development. J. Environ. Manag. 2022, 319, 115756. [Google Scholar] [CrossRef]
  35. American Public Health Association. Standard Methods for the Examination of Water and Wastewater; American Public Health Association: Washington, DC, USA, 2023. [Google Scholar]
  36. Barra Caracciolo, A.; Topp, E.; Grenni, P. Pharmaceuticals in the environment: Biodegradation and effects on natural microbial communities. A review. J. Pharm. Biomed. Anal. 2015, 106, 25–36. [Google Scholar] [CrossRef]
  37. Dai, H.; Gao, J.; Shan, J.; Lu, X.; Li, D.; Duan, W.; Cui, Y. Pressure of high level acetaminophen on fixed biofilm and aerobic granule-based systems: Insights on nitrification performances, microbial responses and acetaminophen’s bio-degradation pathways. Chem. Eng. J. 2021, 426, 131907. [Google Scholar] [CrossRef]
  38. Yang, C.W.; Chen, Y.E.; Chang, B.V. Microbial communities associated with acetaminophen biodegradation from mangrove sediment. Sustainability 2020, 12, 5410. [Google Scholar] [CrossRef]
  39. Falyouna, O.; Maamoun, I.; Ghosh, S.; Malloum, A.; Othmani, A.; Eljamal, O.; Amen, T.W.M.; Oroke, A.; Bornman, C.; Ahmadi, S.; et al. Sustainable technologies for the removal of Chloramphenicol from pharmaceutical industries Effluent: A critical review. J. Mol. Liq. 2022, 368, 120726. [Google Scholar] [CrossRef]
  40. Mutuku, C.; Gazdag, Z.; Melegh, S. Occurrence of antibiotics and bacterial resistance genes in wastewater: Resistance mechanisms and antimicrobial resistance control approaches. World J. Microbiol. Biotechnol. 2022, 38, 152. [Google Scholar] [CrossRef]
  41. Yuan, J.; Huang, S.; Yuan, H.; Fu, F.; Zhang, Y. Effects of chloramphenicol on the bacterial community structure and simultaneous nitrification and denitrification performance in a sequencing biofilm batch reactor. J. Water Process Eng. 2021, 42, 102095. [Google Scholar] [CrossRef]
  42. Yang, Y.; Li, G.; Li, Z.; Lu, L. The roles of typical emerging pollutants on N2O emissions during biological nitrogen removal from wastewater. Sci. Total Environ. 2024, 930, 172851. [Google Scholar] [CrossRef]
  43. Duan, H.; Zhao, Y.; Koch, K.; Wells, G.F.; Weißbach, M.; Yuan, Z.; Ye, L. Recovery of Nitrous Oxide from Wastewater Treatment: Current Status and Perspectives. ACS ES&T Water 2021, 1, 240–250. [Google Scholar] [CrossRef]
  44. Lawrence, J.; Oliva, A.; Papirio, S.; Murphy, J.D.; Lens, P.N.L. Biofuel and volatile fatty acids production from raw and pretreated spent coffee grounds in semi-continuous bioreactors. J. Water Process Eng. 2025, 71, 107403. [Google Scholar] [CrossRef]
Figure 1. Nitrate (NO3) (A) and nitrite (NO2) (B) concentration trend during the hydrogenotrophic denitrification tests. The acute toxicity tests in the presence of acetaminophen (ID test: ACN-H2) (Water 18 01257 i001) and chloramphenicol (ID test: CHP-H2) (Water 18 01257 i002) were compared with the test in the absence of emerging contaminants (ID test: NO3-H2) (Water 18 01257 i003). Control tests were performed in the absence of the electron donor (i.e., H2): CACN (Water 18 01257 i004), CCHP (Water 18 01257 i005), CNO3 (Water 18 01257 i006). The error bars represent the standard deviation of biological triplicates.
Water 18 01257 g001
Figure 2. pH trend during the hydrogenotrophic denitrification tests in the presence of emerging contaminants (ECs), i.e., acetaminophen (Test ID: ACN-H2) (Water 18 01257 i007) and chloramphenicol (Test ID: CHP-H2) (Water 18 01257 i008), as well as with no ECs addition (Test ID: NO3-H2) (Water 18 01257 i009). Control tests in the absence of H2 as the electron donor: NO3-H2 (Water 18 01257 i010), CACN (Water 18 01257 i011), CCHP (Water 18 01257 i012), CNO3 (Water 18 01257 i013). The error bars represent the standard deviation of biological triplicates.
Water 18 01257 g002
Figure 3. Gas composition (%) at the end of the hydrogenotrophic denitrification tests in the presence of emerging contaminants (ECs), i.e., acetaminophen (Test ID: ACN-H2) and chloramphenicol (Test ID: CHP-H2), as well as with no ECs addition (Test ID: NO3-H2) and in control tests in the absence of H2 as the electron donor (Test ID: CACN, CCHP, and CNO3). Detected gases: hydrogen (Water 18 01257 i014), methane (Water 18 01257 i015), nitrogen (Water 18 01257 i016), nitric oxide (Water 18 01257 i017), carbon dioxide (Water 18 01257 i018), and nitrous oxide (Water 18 01257 i019). The complement to 100% is represented by the Argon gas used to flush the bottles at the beginning of the experiments and water vapor.

Water 18 01257 g003
Figure 4. Comparison between the soluble chemical oxygen demand (sCOD) at the start (day 0) and the end (day 6) of the hydrogenotrophic denitrification tests, i.e., with acetaminophen (Test ID: ACN-H2) and chloramphenicol (Test ID: CHP-H2), as well as with no ECs addition (Test ID: NO3-H2) and in control tests in the absence of H2 as the electron donor (Test ID: CACN, CCHP, and CNO3−). The error bars represent the standard deviation of biological triplicates.
Water 18 01257 g004
Table 1. Experimental conditions used in the acute toxicity tests aimed at evaluating the effects of acetaminophen and chloramphenicol on H2-driven autotrophic denitrification.
Tested ConditionID TestACN (mg/L)CHP (mg/L)NO3
(mg/L)
H2 Supply
(mL)
Inoculum
(%)
Synthetic Water (mL)
Acute toxicityACN-H2200-20057
(excess of 100%)
10%
(0.95 g VS)
112.5
CHP-H2-200200
No emerging contaminantNO3-H2--20057
(excess of 100%)
10%
(0.95 g VS)
112.5
ControlsCACN200-200-10%
(0.95 g VS)
112.5
CCHP-200200
CNO3--200
Note(s): ACN = acetaminophen; CHP = chloramphenicol; NO3 = Nitrate.
Table 2. Nitrate removal efficiency (NRE) (%), and NO3 removal rate (mg NO3/d) in the acute toxicity tests and the corresponding controls with statistical information regarding the NRE.
ID TestsNitrate Removal Efficiency
(%)
NO3 Removal Rate
(mg NO3/L/d)
Statistical Information
Day 1Day 3Day 6Day 1Day 3Day 6Day 1Day 3Day 6
ACN-H245.7%97.5%97.8%84.948.20.2aaa
CHP-H220.1%26.3%97.5%39.76.146.8bca b
NO3-H233.0%96.4%97.7%61.359.00.8a baa
CACN17.2%84.4%97.8%32.964.48.5baa
CCHP17.0%24.9%48.1%35.78.416.3bcb
CNO310.0%41.8%78.5%19.631.324.1bba b
Note(s): a Significant difference (i.e., p < 0.05) occurs when two conditions do not share letters (e.g., a—b). b The mean NRE and DR were calculated as an average of biological triplicates.
Table 3. Nitric oxide (NO) and nitrous oxide (N2O) accumulation expressed as percentage (%) measured in the headspace at the end of the denitrification process, and the NO and N2O emission rate expressed with respect to the anaerobic granular sludge (AnGS) intake. The hydrogenotrophic denitrification tests were performed in the presence of emerging contaminants (ECs), i.e., acetaminophen (Test ID: ACN-H2) and chloramphenicol (Test ID: CHP-H2), as well as with no ECs addition (Test ID: NO3-H2) and in control tests in the absence of H2 as the electron donor (Test ID: CACN, CCHP, and CNO3).
ID TestNO Accumulation
(%)
NO Emission Rate (μg/min/g AnGS)N2O Accumulation
(%)
N2O Emission Rate (μg/min/g AnGS)
ACN-H29.5 ± 0.016.20 × 10−20.1 ± 0.00.15 × 10−2
CACN0.1 ± 0.00.20 × 10−20.3 ± 0.00.75 × 10−2
CHP-H20.2 ± 0.10.35 × 10−20.3 ± 0.00.90 × 10−2
CCHP0.0 ± 0.00.0 × 10−20.3 ± 0.00.94 × 10−2
NO3-H23.1 ± 0.94.74 × 10−20.1 ± 0.00.07 × 10−2
CNO30.0 ± 0.00.0 × 10−20.3 ± 0.00.88 × 10−2
Disclaimer/Publisher’s Note: The statements, opinions and data contained in all publications are solely those of the individual author(s) and contributor(s) and not of MDPI and/or the editor(s). MDPI and/or the editor(s) disclaim responsibility for any injury to people or property resulting from any ideas, methods, instructions or products referred to in the content.