1. Introduction
The United Nations Environment Programme (UNEP) defines an island as a naturally formed landmass surrounded by water that remains above sea level at high tide. It is estimated that approximately 10% of the world’s population currently resides on islands, which together account for about 7% of the Earth’s land surface. In addition, nearly one quarter of the world’s sovereign states consist of island or archipelagic territories [
1].
In the scientific literature, there is no single universally accepted definition of a “small island.” The definition varies depending on the disciplinary perspective (e.g., geography, economics, development studies, or the law of the sea) and the purpose of classification. Within hydrological research, Falkland [
2] defined small islands as those with an area not exceeding 1000 km
2. This definition is neither geomorphological nor political but rather operational and closely linked to water-resource considerations. Islands of this size typically have limited catchments, small storage capacity, and sensitive aquifers, making them particularly vulnerable to water scarcity and salinization [
2].
From a hydrological perspective, this threshold delineates systems characterized by restricted recharge areas, limited storage capacity, and rapid groundwater response, which collectively result in a high sensitivity to climatic forcing [
2,
3]. With an area of 405.7 km
2, the island of Cres falls within this category and can be considered representative of small island hydrosystems, where freshwater availability is largely controlled by the balance between recharge and evapotranspiration [
4].
However, hydrological behaviour in such environments is not governed by size alone but is strongly influenced by lithology, degree of karstification, and structural complexity. In karstified carbonate environments such as Cres, dissolution processes create highly permeable and heterogeneous subsurface drainage systems. Groundwater flow is therefore controlled by permeability contrasts and tectonic structures, resulting in complex flow paths and dynamic catchment boundaries that may differ substantially from those observed in non-karstic islands of similar size [
3,
5]. Consequently, while the small-island criterion provides a useful hydrological framework, its interpretation must be integrated with the geological and hydrogeological characteristics of the system.
The present study focuses on the island of Cres, located in the northern Adriatic Sea, which is particularly notable for hosting a large freshwater lake in a relatively small karst environment [
4]. Lake Vrana contains approximately 2.2 × 10
8 m
3 of high-quality freshwater [
3] and represents an unusual hydrogeologic configuration with its water surface above sea level and its bottom extending below it [
6,
7]. The persistence of such a large freshwater body within highly permeable carbonate rocks highlights the complexity of the governing hydrogeological processes.
Since 1954, water from Lake Vrana has served as the primary water supply source for the island of Cres and, since 1960, also for the neighbouring island of Lošinj [
7,
8,
9]. Water abstraction has increased from an annual average of approximately 55 L s
−1 (1978–2000) to 85 L s
−1 (2001), reaching 96 L s
−1 in 2024, with peak demand occurring during the summer tourist season.
The scientific significance of Lake Vrana has been recognized since the 19th century. Early studies described its geographical and hydrological characteristics [
10,
11], followed by the initial investigations of water temperature by Gavazzi [
12,
13] and hydrobiology by Morton [
14]. The first comprehensive analysis of the lake’s hydrological regime was conducted by Cecconi [
15], while Nümann examined the chemical composition of the lake water [
16]. Systematic research on the geographical and limnological characteristics of Vrana Lake in Croatia began with the works of Milan Petrik, published between 1958 and 1961 [
17,
18,
19]. Intensive interdisciplinary investigations of the numerous aspects of Lake Vrana began during the 1990s.
The climate of Cres Island is characterized by a modified Mediterranean regime influenced by mid-latitude atmospheric circulation and the Adriatic Sea, resulting in pronounced seasonal variability [
6]. Regional climatic conditions are further shaped by cyclogenetic activity over the northern Adriatic and the orographic influence of the Dinaric Alps and the Gorski Kotar region, while during summer, the Azores High suppresses the intrusion of colder air masses. Precipitation exhibits a distinct seasonal pattern, with the minimum during the warm period (April–September) and the maximum during the colder months, when approximately 57% of the annual total fall occurs, peaking in November [
6].
This precipitation regime, combined with the high permeability of karstified carbonate rocks, promotes rapid infiltration and limited surface runoff, which are defining characteristics of karst hydrology. As a result, groundwater recharge is concentrated during cooler months, while summer conditions are associated with increased evapotranspiration and hydrological deficits. These processes enhance the sensitivity of the karst aquifer and the lake it sustains to climatic variability.
Lake Vrana is a rare example of a large freshwater lake located within a cryptodepression on a small karst island. Owing to the combination of karst geology, insular setting, and substantial freshwater storage, it provides a unique natural system for investigating the response of vulnerable karst hydrosystems to climatic forcing. Its hydrogeological isolation and strong dependence on atmospheric inputs make it particularly sensitive to variations in temperature and precipitation. Accordingly, this study analyses long-term hydroclimatological changes in Lake Vrana by examining trends in water levels, water temperature, and key climatic variables, with the aim of improving understanding of the processes controlling water balance and drought dynamics in this distinctive karst environment.
2. Study Area
The island of Cres is the largest island in the Croatian part of the Adriatic Sea. It is elongated in the meridional direction, with a total length of 65.5 km and a width ranging from 2 to 11.5 km. Cres is separated from the neighbouring island of Lošinj by the Osor Strait, a narrow artificial channel excavated during the Roman period. The island’s highest peak is Gorice (648 m a.s.l.) and its coastline is 268.2 km long, with a coastline development index of 3.8. According to the 2021 population census, Cres has 2849 permanent residents. However, during the summer months, the number of visitors substantially exceeds the resident population. For example, between May and October 2024, the island hosted 135,394 visitors.
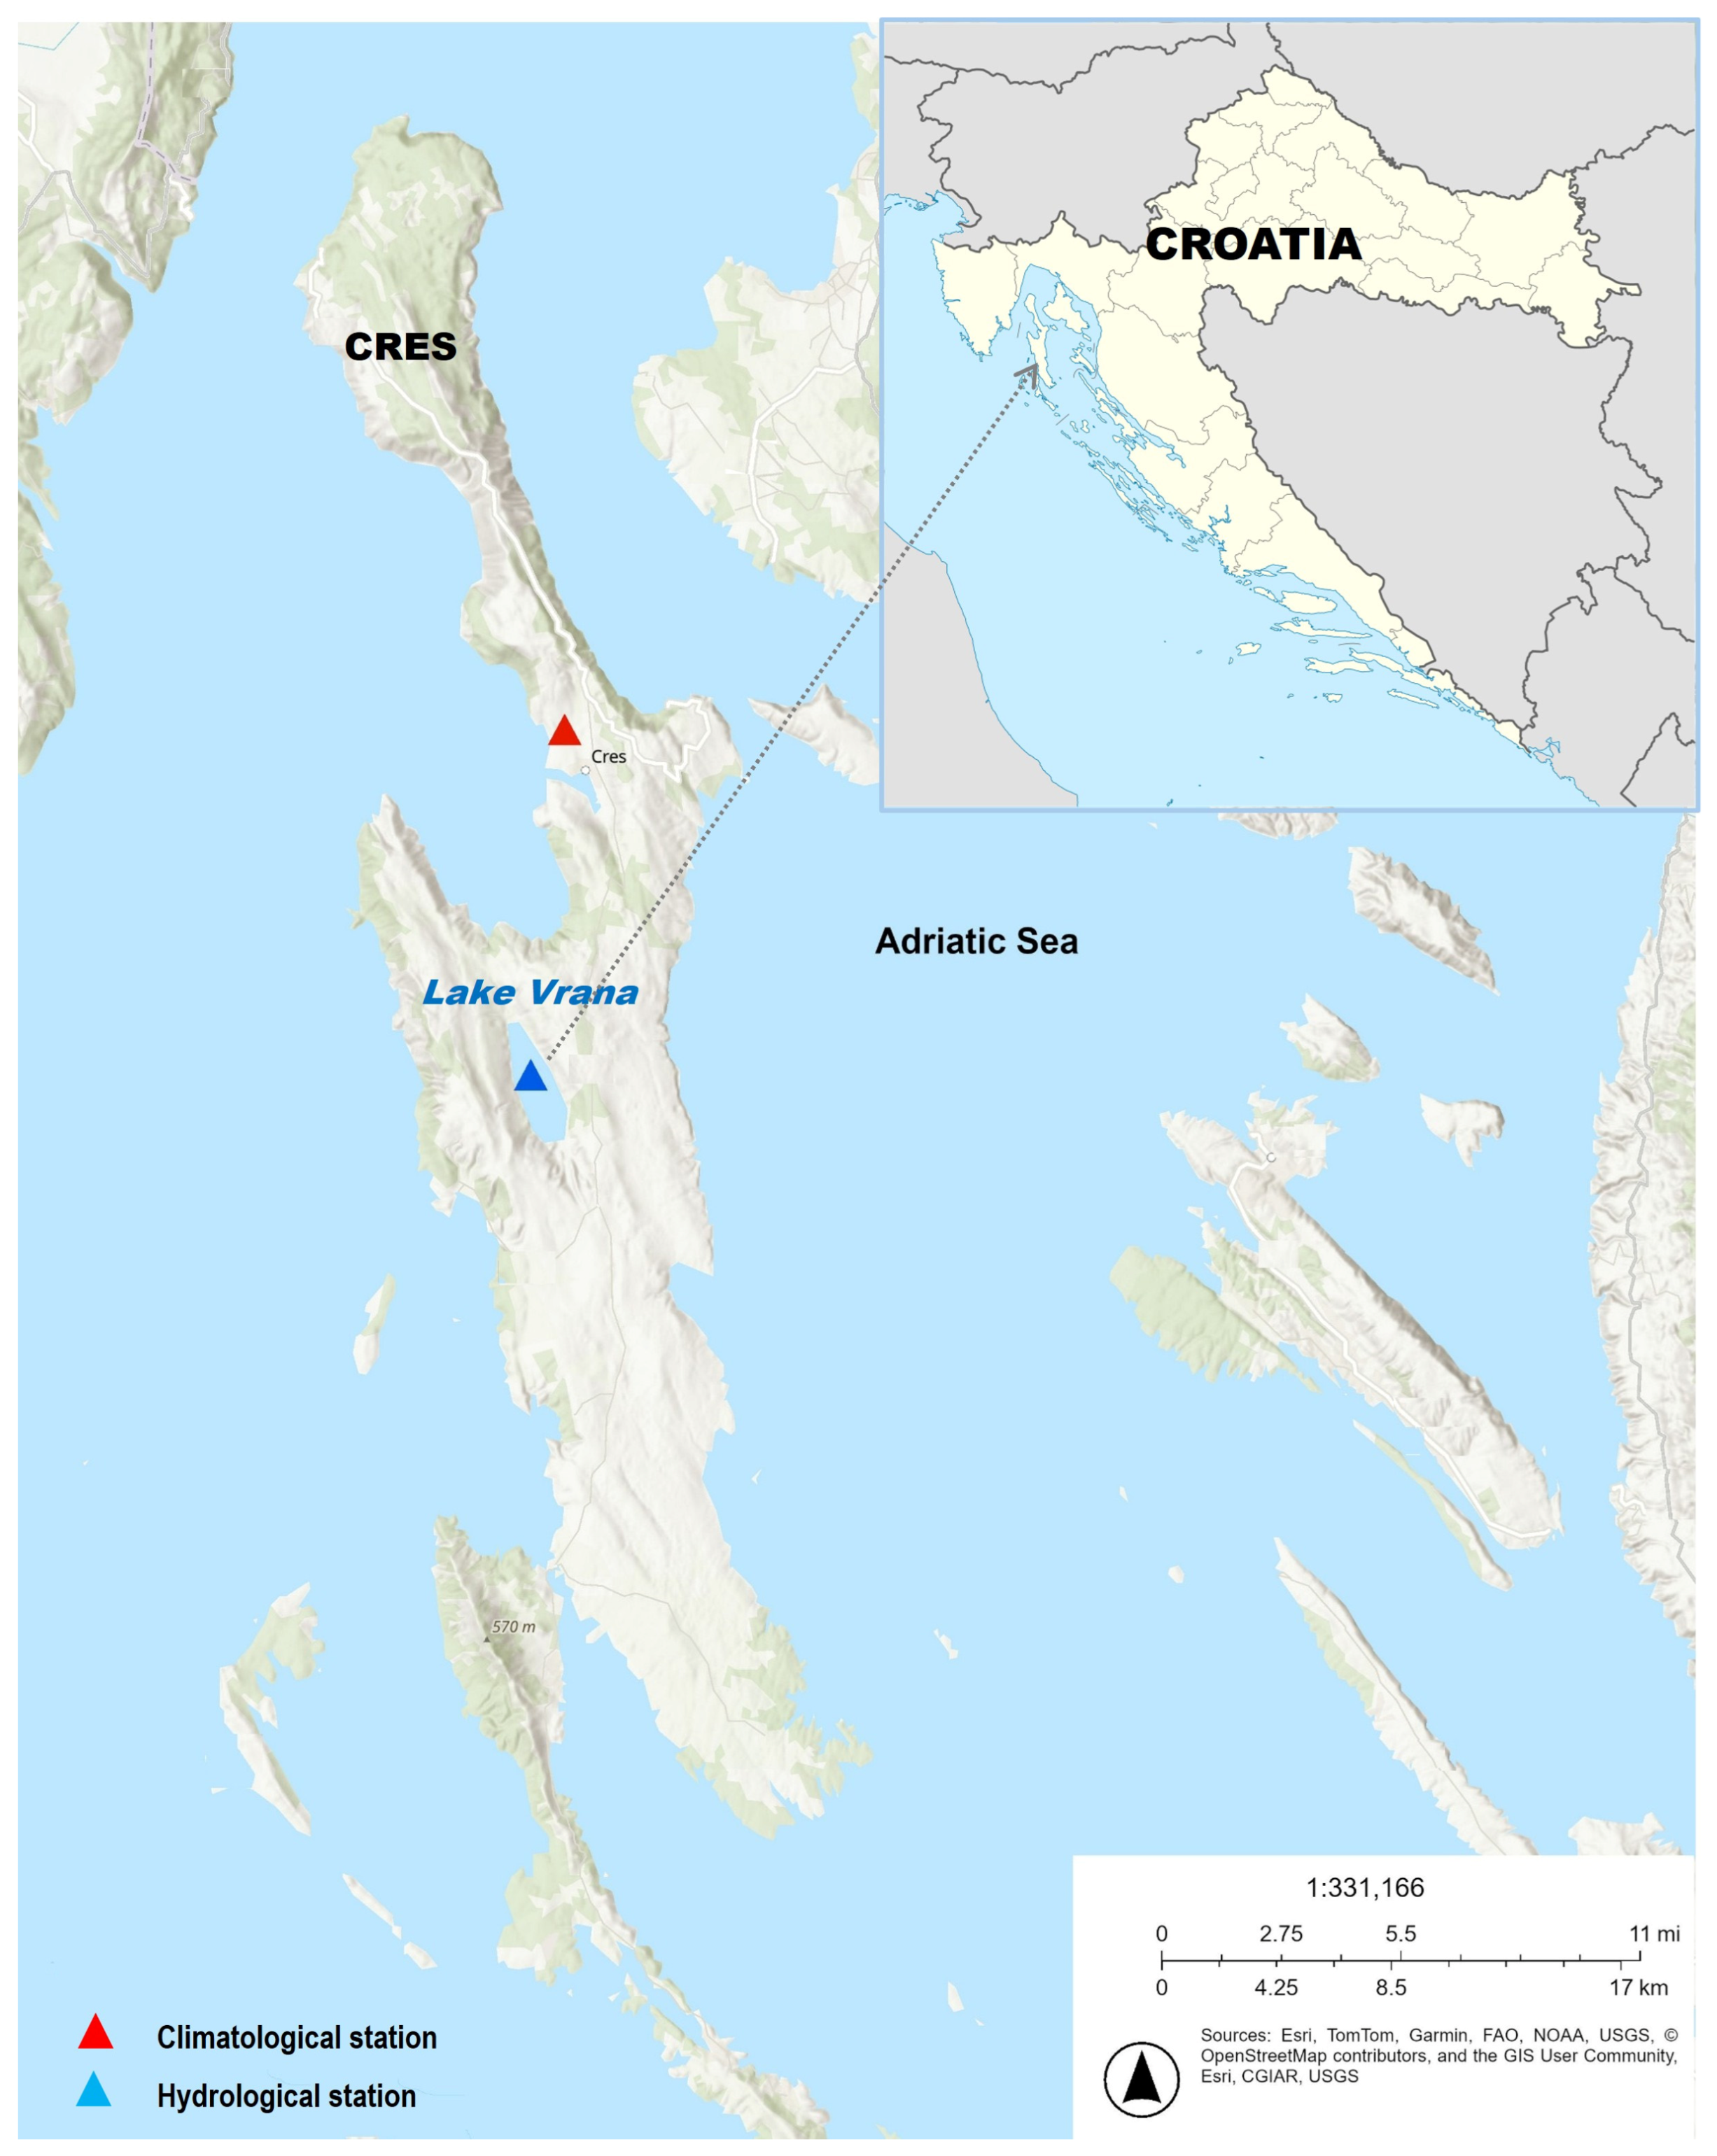
Lake Vrana, located in the central part of Cres, represents the focus of this study (
Figure 1 and
Figure 2). It is the largest freshwater lake on the Croatian islands and the main water resource for the islands of Cres and Lošinj [
3,
7,
8,
9]. The lake is approximately 5.7 km long, with a maximum width of 1.45 km and a surface area of about 5.7 km
2. Its mean water level lies at 12.78 m above sea level (a.s.l.) [
7], while the lake bottom reaches 61.3 m below sea level (b.s.l.), forming a pronounced cryptodepression.
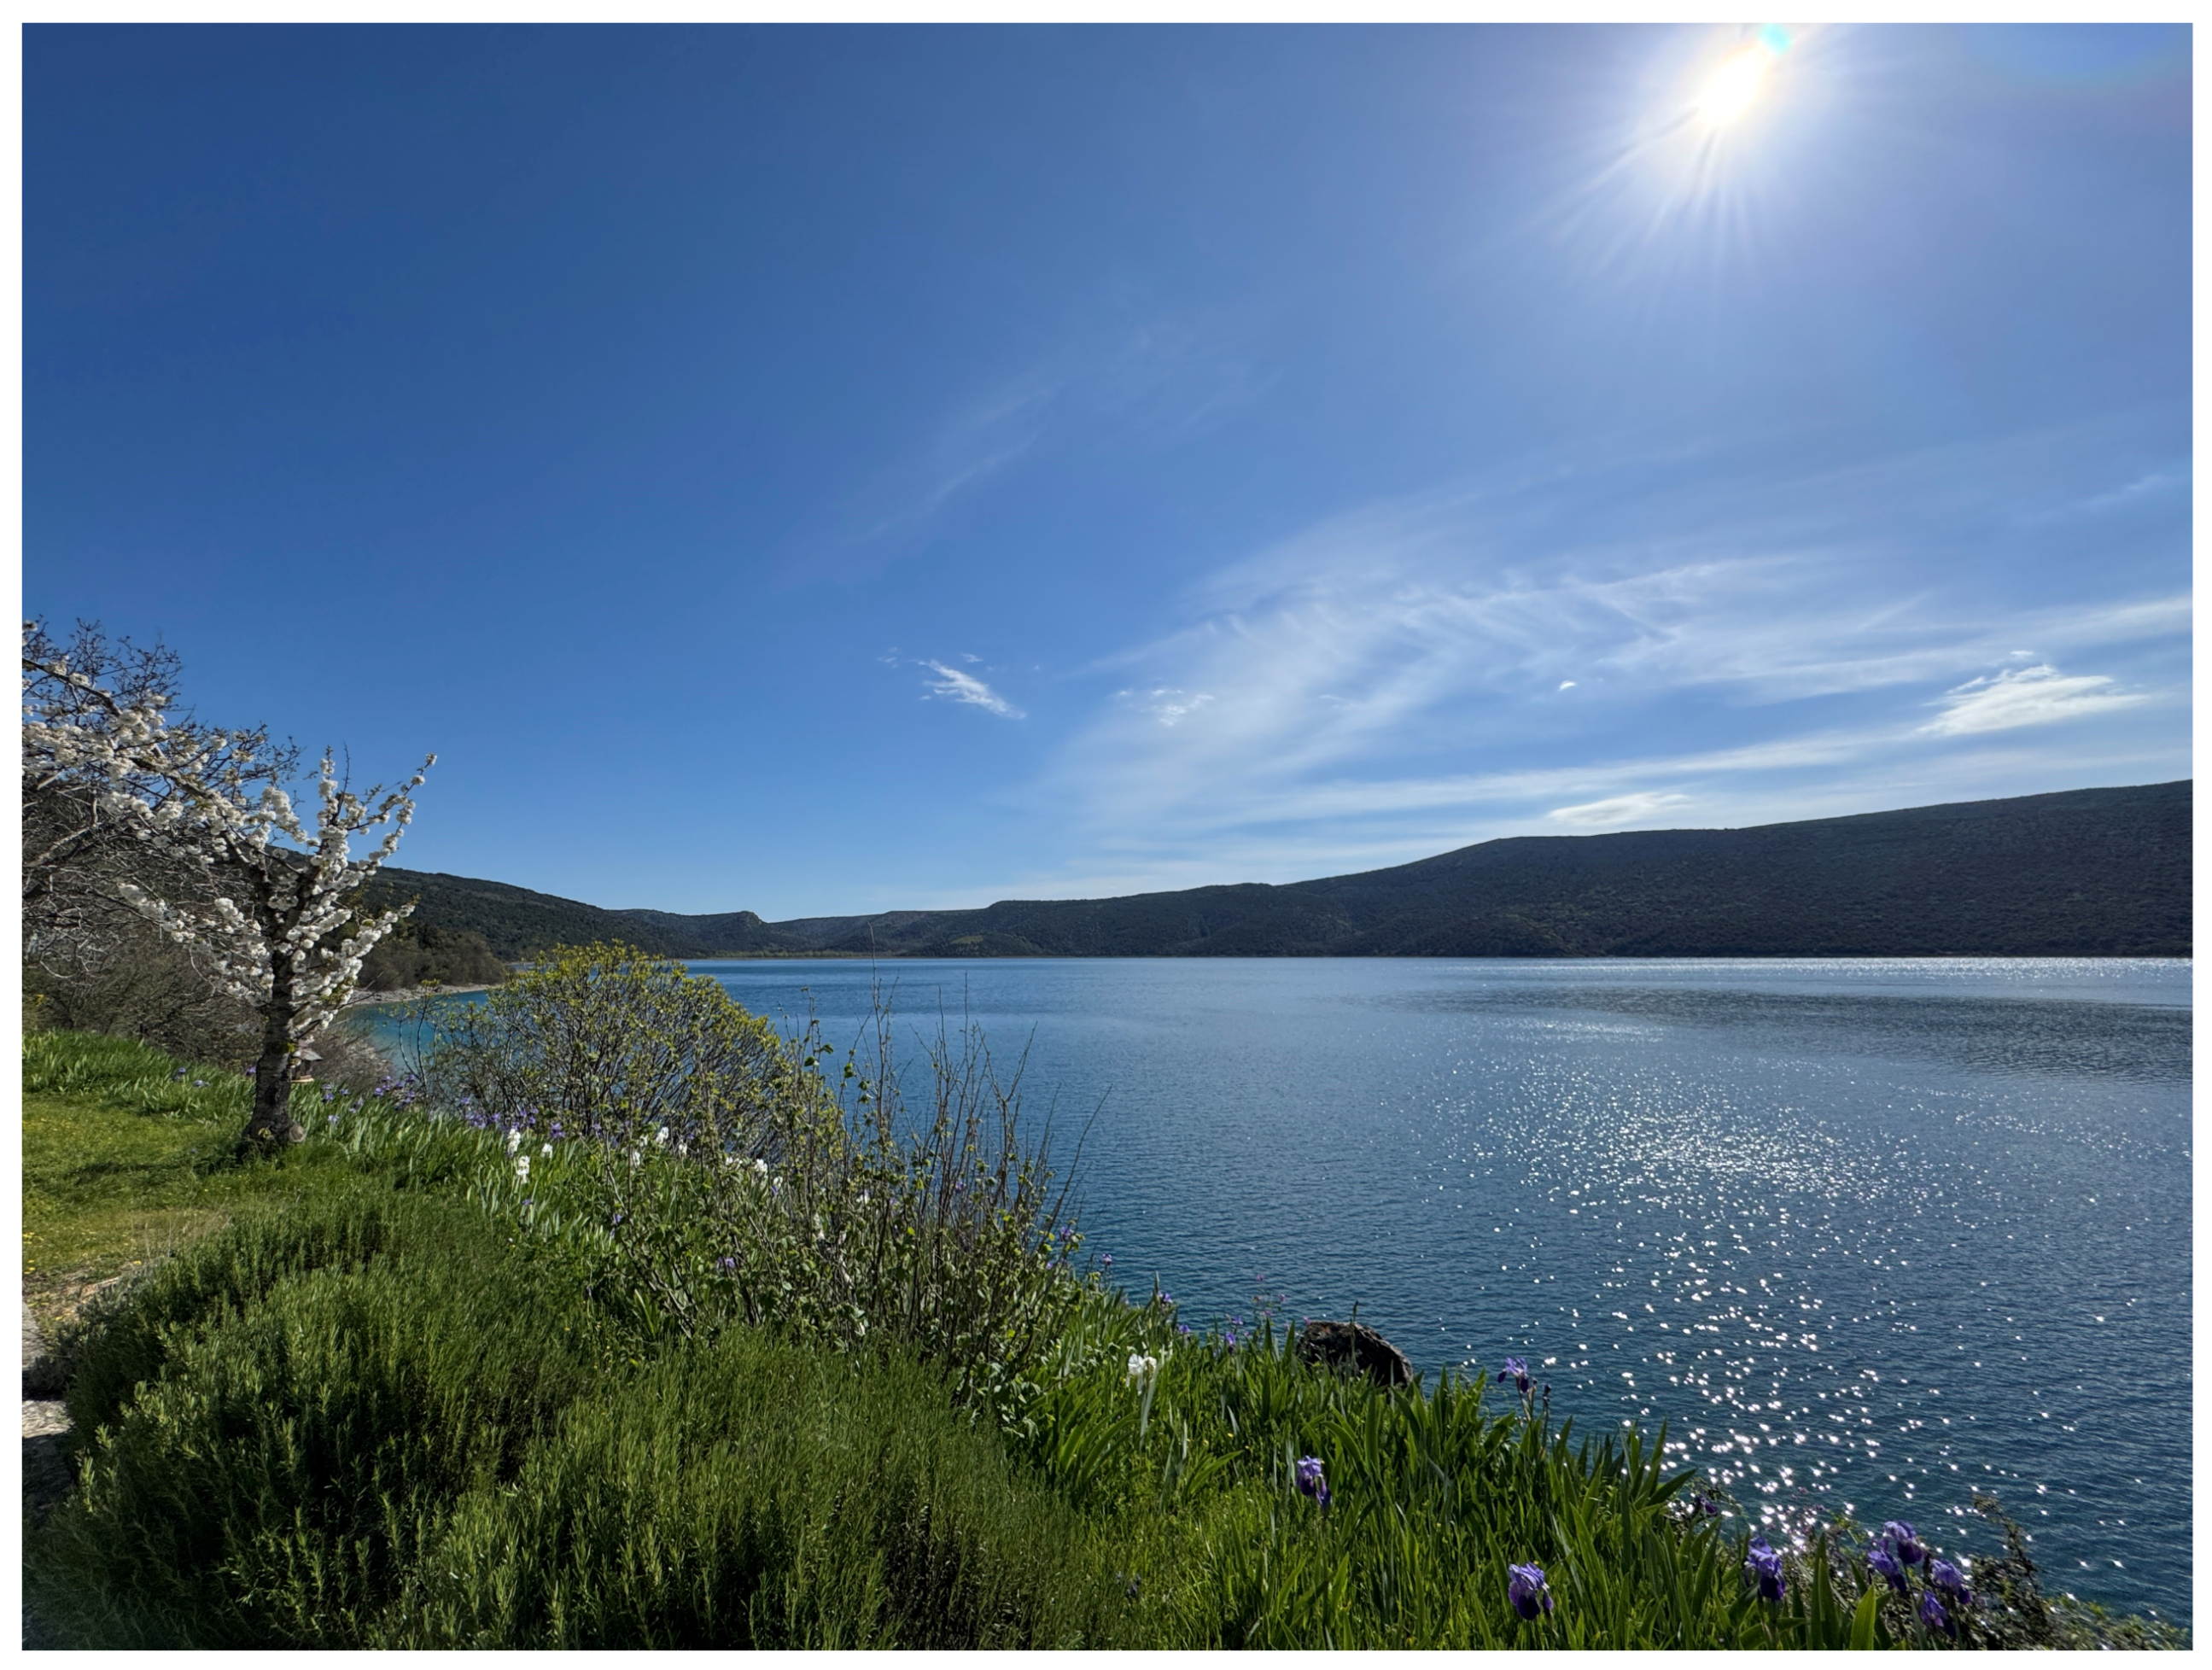
The location of the study area and a photograph of Lake Vrana are shown in
Figure 1 and
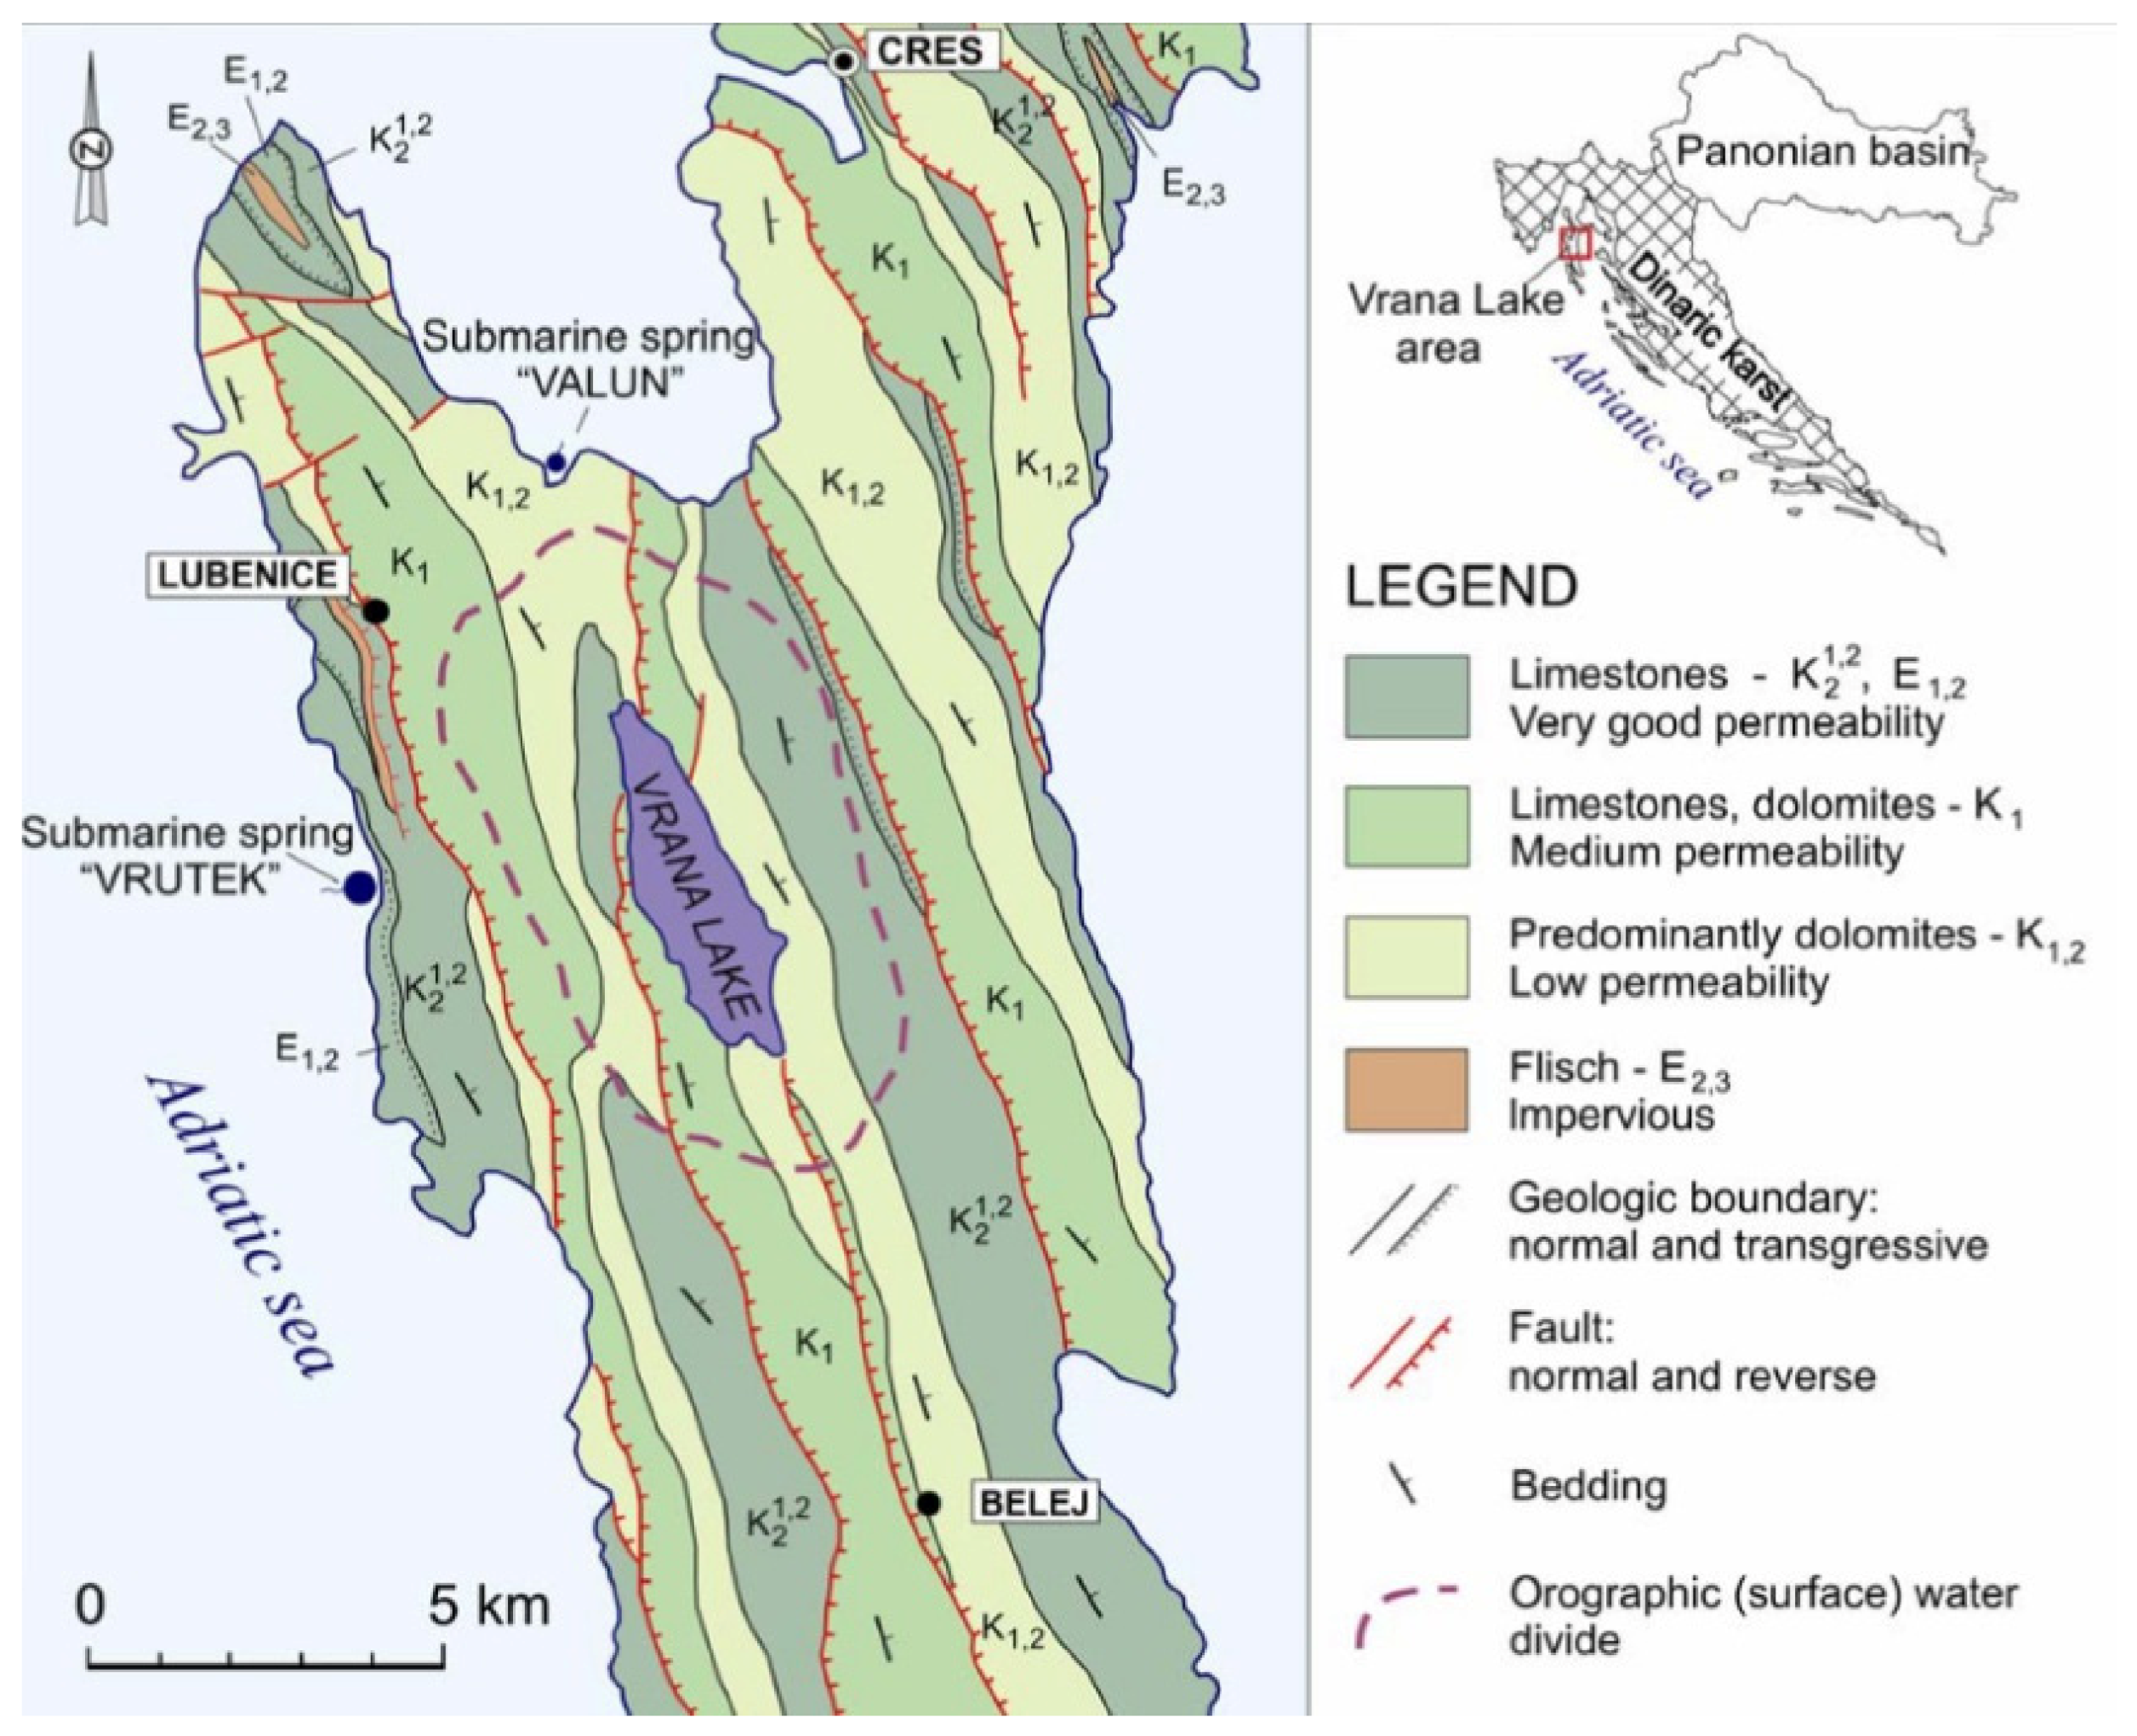
Figure 2, while the geological and hydrogeological setting is presented in
Figure 3.
Cres Island forms part of the Dinaric karst region, one of the most extensive karst landscapes in Europe. The geological framework of the island is dominated by a thick succession of carbonate rocks, primarily Cretaceous limestones and dolomites, with minor occurrences of Eocene limestones and locally developed flysch deposits [
6]. These lithological units exhibit contrasting hydrogeological properties, ranging from highly permeable well-karstified limestones to low-permeability dolomites and impermeable flysch formations, which strongly control groundwater flow, storage and discharge.
The structural framework of the island reflects tectonic deformation associated with the evolution of the External Dinarides, particularly during the Late Cretaceous to Oligocene–Miocene [
5]. A dense fault network, predominantly oriented NNW–SSE, exerts primary control over groundwater circulation and is considered a key factor in the formation of the lake depression through a pull-apart mechanism along major fault zones [
5,
6,
7]. The lake is situated within less permeable dolomitic formations, which facilitate the retention of freshwater despite the position of the lake bottom below sea level.
The spatial distribution of lithological units and structural features controlling the hydrogeological behaviour of the study area is shown in
Figure 3.
The genesis of Lake Vrana is associated with the combined influence of tectonic activity and Quaternary sea-level fluctuations. The depression developed along structurally weakened zones and was subsequently filled with freshwater during the Late Pleistocene and Holocene. Rising sea levels during this period increased groundwater levels and reduced subsurface drainage, facilitating the accumulation and persistence of freshwater within the depression.
Filipčić and Šegota [
20] proposed that the lake originated within a former karst polje, with initial formation beginning approximately 17,900 years ago during the Upper Würm glacial period. The presence of more than 25 m of Quaternary sediments indicates prolonged accumulation within a closed karst basin, without a direct hydraulic connection to the sea despite the lake’s proximity to the coast. Geochemical and mineralogical evidence suggests that early lake development was characterized by enhanced input of dolomitic detritus during the Late Glacial period, followed by stabilization during the Holocene. This later phase was marked by alternating siliciclastic input, organic productivity, and authigenic carbonate sedimentation. Overall, the evolution of the lake was primarily governed by climatic oscillations (humidity and erosion) and local geological structure rather than by direct eustatic sea-level influence [
5,
21].
Stable isotope analyses (δ
2H and δ
18O) indicate that Lake Vrana’s water is significantly enriched with heavy isotopes due to intense evaporation, supporting the interpretation of a nearly hydraulically closed system with negligible groundwater outflow [
22]. Consequently, the lake water balance is predominantly controlled by local precipitation and evaporation, which explains its high sensitivity to climatic variability and potential salinization in a coastal karst environment. Additional studies indicate that the lake is primarily recharged by meteoric water infiltrating through the surrounding karst aquifer, with no significant mixing with seawater despite the lake bottom being located below sea level [
23]. The hydrochemical composition (Ca-HCO
3 type) further confirms groundwater circulation through carbonate rocks and relatively long residence times.
Bonacci [
3] demonstrated that the lake is fed by a relatively small and dynamically defined karst catchment (approximately 25 km
2), in which groundwater divides shift seasonally in response to changing hydraulic conditions. As a result, classical concepts of fixed catchment boundaries are not fully applicable, reflecting the inherent complexity of groundwater flow in karst systems.
Numerous studies have examined the hydrological regime of Lake Vrana across a range of temporal scales, with particular emphasis on its variability [
24,
25,
26,
27,
28,
29,
30]. These investigations consistently demonstrate that lake-level fluctuations exhibit pronounced seasonal and interannual patterns, primarily controlled by variations in precipitation and evapotranspiration. The response of lake levels to precipitation is characterized by a distinct time lag, reflecting the complex recharge dynamics and storage processes typical of karst systems. Long-term fluctuations further highlight the lake’s sensitivity to climatic variability, particularly during prolonged dry periods, with important implications for water-resource management.
Hydrogeological analyses further emphasize the strong coupling between groundwater lake dynamics within the karst aquifer [
31,
32]. Observations from deep piezometers indicate highly synchronized groundwater behaviour across the catchment (R
2 = 0.955–0.998), confirming strong hydraulic connectivity. Estimated maximum mean daily inflow to the lake reached 8.9 m
3 s
−1, while maximum mean losses were approximately 1.9 m
3 s
−1, indicating pronounced seasonal variability in lake–aquifer exchange. Spatial differences in hydraulic relationships further highlight system complexity, with groundwater levels exceeding the lake level only 4.6% of the time in the closest piezometer, compared to 89.1% in the most distant one.
The thermal regime of Lake Vrana has also been investigated, with results indicating a statistically significant increase in water temperature, particularly during the warmer season, in agreement with regional air temperature trends [
6,
33]. Owing to its hydrogeological isolation, limited water exchange, and strong coupling with atmospheric conditions, the lake represents a sensitive indicator of climate change. Rising water temperatures may influence thermal stratification, biogeochemical processes, and the long-term sustainability of the water-supply system.
Paleolimnological studies provide important insight into the long-term evolution of the lake system. Reconstructions based on multiple proxy indicators (pollen, diatoms, macrofossils, and ostracods) indicate that lake-level fluctuations over the past ~16,000 years have been closely linked to regional paleoclimatic oscillations, with increasing anthropogenic influence during the Late Holocene [
34]. The results indicate a strong relationship between lake-level changes and regional paleoclimatic oscillations, particularly during the Late Glacial and the Holocene. Warmer and wetter periods correspond to higher lake levels and increased biological productivity, whereas later phases show shifts in trophic status and increased nutrient input associated with land-use changes. Overall, the evolution of the lake system reflects the combined effect of climatic forcing and human activity within a sensitive karst hydrological environment. Recent studies have further examined ecological and biological aspects of Vrana Lake [
35,
36,
37,
38,
39].
For the interpretation of the results presented in this study, it is also relevant to note that, according to the Köppen–Geiger climate classification [
40], Cres Island is characterized by a Cfa climate type, defined as a warm temperate humid climate with hot summers [
41].
3. Materials
This study is based on long-term hydroclimatological observations collected at two monitoring stations on Cres Island, including water level (H), lake water temperature (TW), precipitation (P), and air temperature (TA).
These variables were selected to represent both the hydrological response of the lake system and the main atmospheric drivers controlling its water balance. The datasets span multiple decades and enable consistent assessment of long-term trends and variability. Daily observations of water level (
H) are available for the period 1978–2024, while daily lake water temperature (
TW) measurements are available for 1979–2024. Several interruptions in the measurement series occurred, as indicated in
Table 1. From the Cres climatological station, daily precipitation totals (
P) and mean daily air temperature (
TA) were available for the period 1981–2024. All datasets were obtained from the Croatian Meteorological and Hydrological Service (DHMZ) in Zagreb. The straight-line distance between the two monitoring stations is 1122 m.
Water-level data prior to the establishment of the current gauging station in 1977 were not used due to documented uncertainties in gauge position and reference elevation, as well as inconsistencies in data sources. Therefore, only quality-controlled and methodologically consistent observations were included in the analysis.
Additional data on average annual water abstraction from Lake Vrana, expressed in L s−1, were obtained from the public utility company Vodoopskrba i Odvodnja Cres Lošinj Ltd., Cres, Croatia.
The main characteristics of the two monitoring stations are summarized in
Table 1.
Although the observational records do not fully overlap in their starting years, the analyses were conducted in a consistent and methodologically appropriate manner. Specifically, all comparative analyses involving multiple variables (relationship between air temperature, water temperature, precipitation, drought indices, and multiple regression) were performed over the common period 1981–2024, ensuring full temporal consistency. In contrast, analyses focused on individual variables (long-term trends in water level and water temperature) were performed using the complete available records (1978–2024 and 1979–2024, respectively), thereby maximizing the robustness of trend detection.
4. Methods Used
Linear regression analysis was applied to examine the relationship between changes in the dependent variable (
Y) and variations in the independent variable (
X). The same method was also used to determine linear trends in the time series of the analysed hydrological and climatological parameters. The linear regression model is defined by Equation (1):
where
Y represents the dependent variable, and
X denotes the independent variable, which in the case of trend analysis corresponds to time (year). The coefficients
A and
B are regression parameters calculated using the least-squares method. The slope coefficient
A indicates the direction and magnitude of change: negative values denote decreasing trends, whereas positive values indicate increasing trends, as expressed in Equation (1).
The Pearson linear correlation coefficient (R) was used to quantify the strength of the linear relationship between the variables, while the coefficient of determination (R2) represents the proportion of explained variance.
The statistical significance of monotonic trends in the analysed hydrological and climatological time series was evaluated using the non-parametric Mann–Kendall (M-K) trend test [
42,
43]. The null hypothesis assumes no statistically significant monotonic trend, whereas the alternative hypothesis indicates the presence of a trend. A significance level of
p < 0.01 was adopted. The standardized test statistic
Z was also calculated, indicating how far the observed trend deviates from random behaviour, expressed in units of standard deviation.
To characterize trend magnitude, three indicators were used: the linear regression slope (
A) from Equation (1), the non-parametric Sen’s slope estimator (
S) [
44], and the M-K
Z statistic. While the regression slope assumes normality and the absence of extreme values, which may occur in climatic and hydrological time series, Sen’s slope provides a robust estimate based on the median of all pairwise slopes. In dimensional terms, these indicators are expressed in °C yr
−1 for air and water temperature series and cm yr
−1 for lake water-level series.
The day-to-day (DTD) variability method was applied to mean daily air temperature, lake water temperature, and daily lake water levels. The time series were analysed without aggregation into monthly or annual averages, allowing for direct assessment of short-term variability and system dynamics. DTD variability is calculated using Equation (2):
where
n is the number of observations,
i denotes the time step (day),
Yi is the value of the analysed parameter on day
i,
Yi−1 is the value on the preceding day, and | | denotes the absolute value.
This approach complements conventional climatological analysis by capturing high-frequency variability and changes in system stability, which are essential for understanding climate-driven alterations in hydrological systems [
45,
46,
47,
48].
In this study, the Standardized Hydrological Index (SHI) was calculated from daily lake water-level series (
H) for Lake Vrana and is defined by Equation (3) [
48,
49,
50]:
where
Hi is the observed water level at time
i,
Hav is the average water level of the analysed series, and
SDH is the standard deviation of the water-level series. This drought index, as well as the two other drought indices used in this study, was calculated at the annual timescale.
The Standardized Precipitation Index (SPI) was used as a quantitative indicator of meteorological drought and is defined by Equation (4) [
51,
52,
53,
54]:
where
Pi is the annual precipitation total,
Pav is the average precipitation of the analysed series, and
SDP is the standard deviation of precipitation.
The New Drought Index (NDI), a composite drought index that integrates precipitation and temperature effects, providing a more comprehensive representation of drought conditions than traditional precipitation-based indices, is defined by Equation (5) [
55,
56,
57]:
where
Pi is annual precipitation,
Pav is the average precipitation of the series,
SDP is the standard deviation of precipitation,
Ti is the mean annual air temperature,
Tav is the mean temperature of the analysed series, and
SDT is the standard deviation of air temperature.
A multi-index approach based on Equations (3)–(5) was adopted to capture different components of drought processes, including meteorological forcing (SPI), hydrological response (SHI), and combined temperature–precipitation effects (NDI), enabling a comprehensive assessment of drought dynamics in the karst system.
Drought intensity categories were defined as follows: mild (0 to −1.0), moderate (−1.0 to −1.5), severe (−1.5 to −2.0), and extreme (<−2.0).
Multiple linear regression was applied to examine the dependence of mean annual lake water levels (
H) as the dependent variable, and on annual precipitation (
P), mean annual air temperature (
TA), and average annual water abstraction (
Q) as independent variables. This model is defined by Equation (6):
where
a,
b,
c, and
d are regression coefficients. For this relationship, the multiple coefficient of determination (RM
2) was calculated.
5. Results and Discussion
5.1. Water Level
The analysis of long-term lake water-level variability provides the basis for understanding changes in the hydrological regime of Lake Vrana.
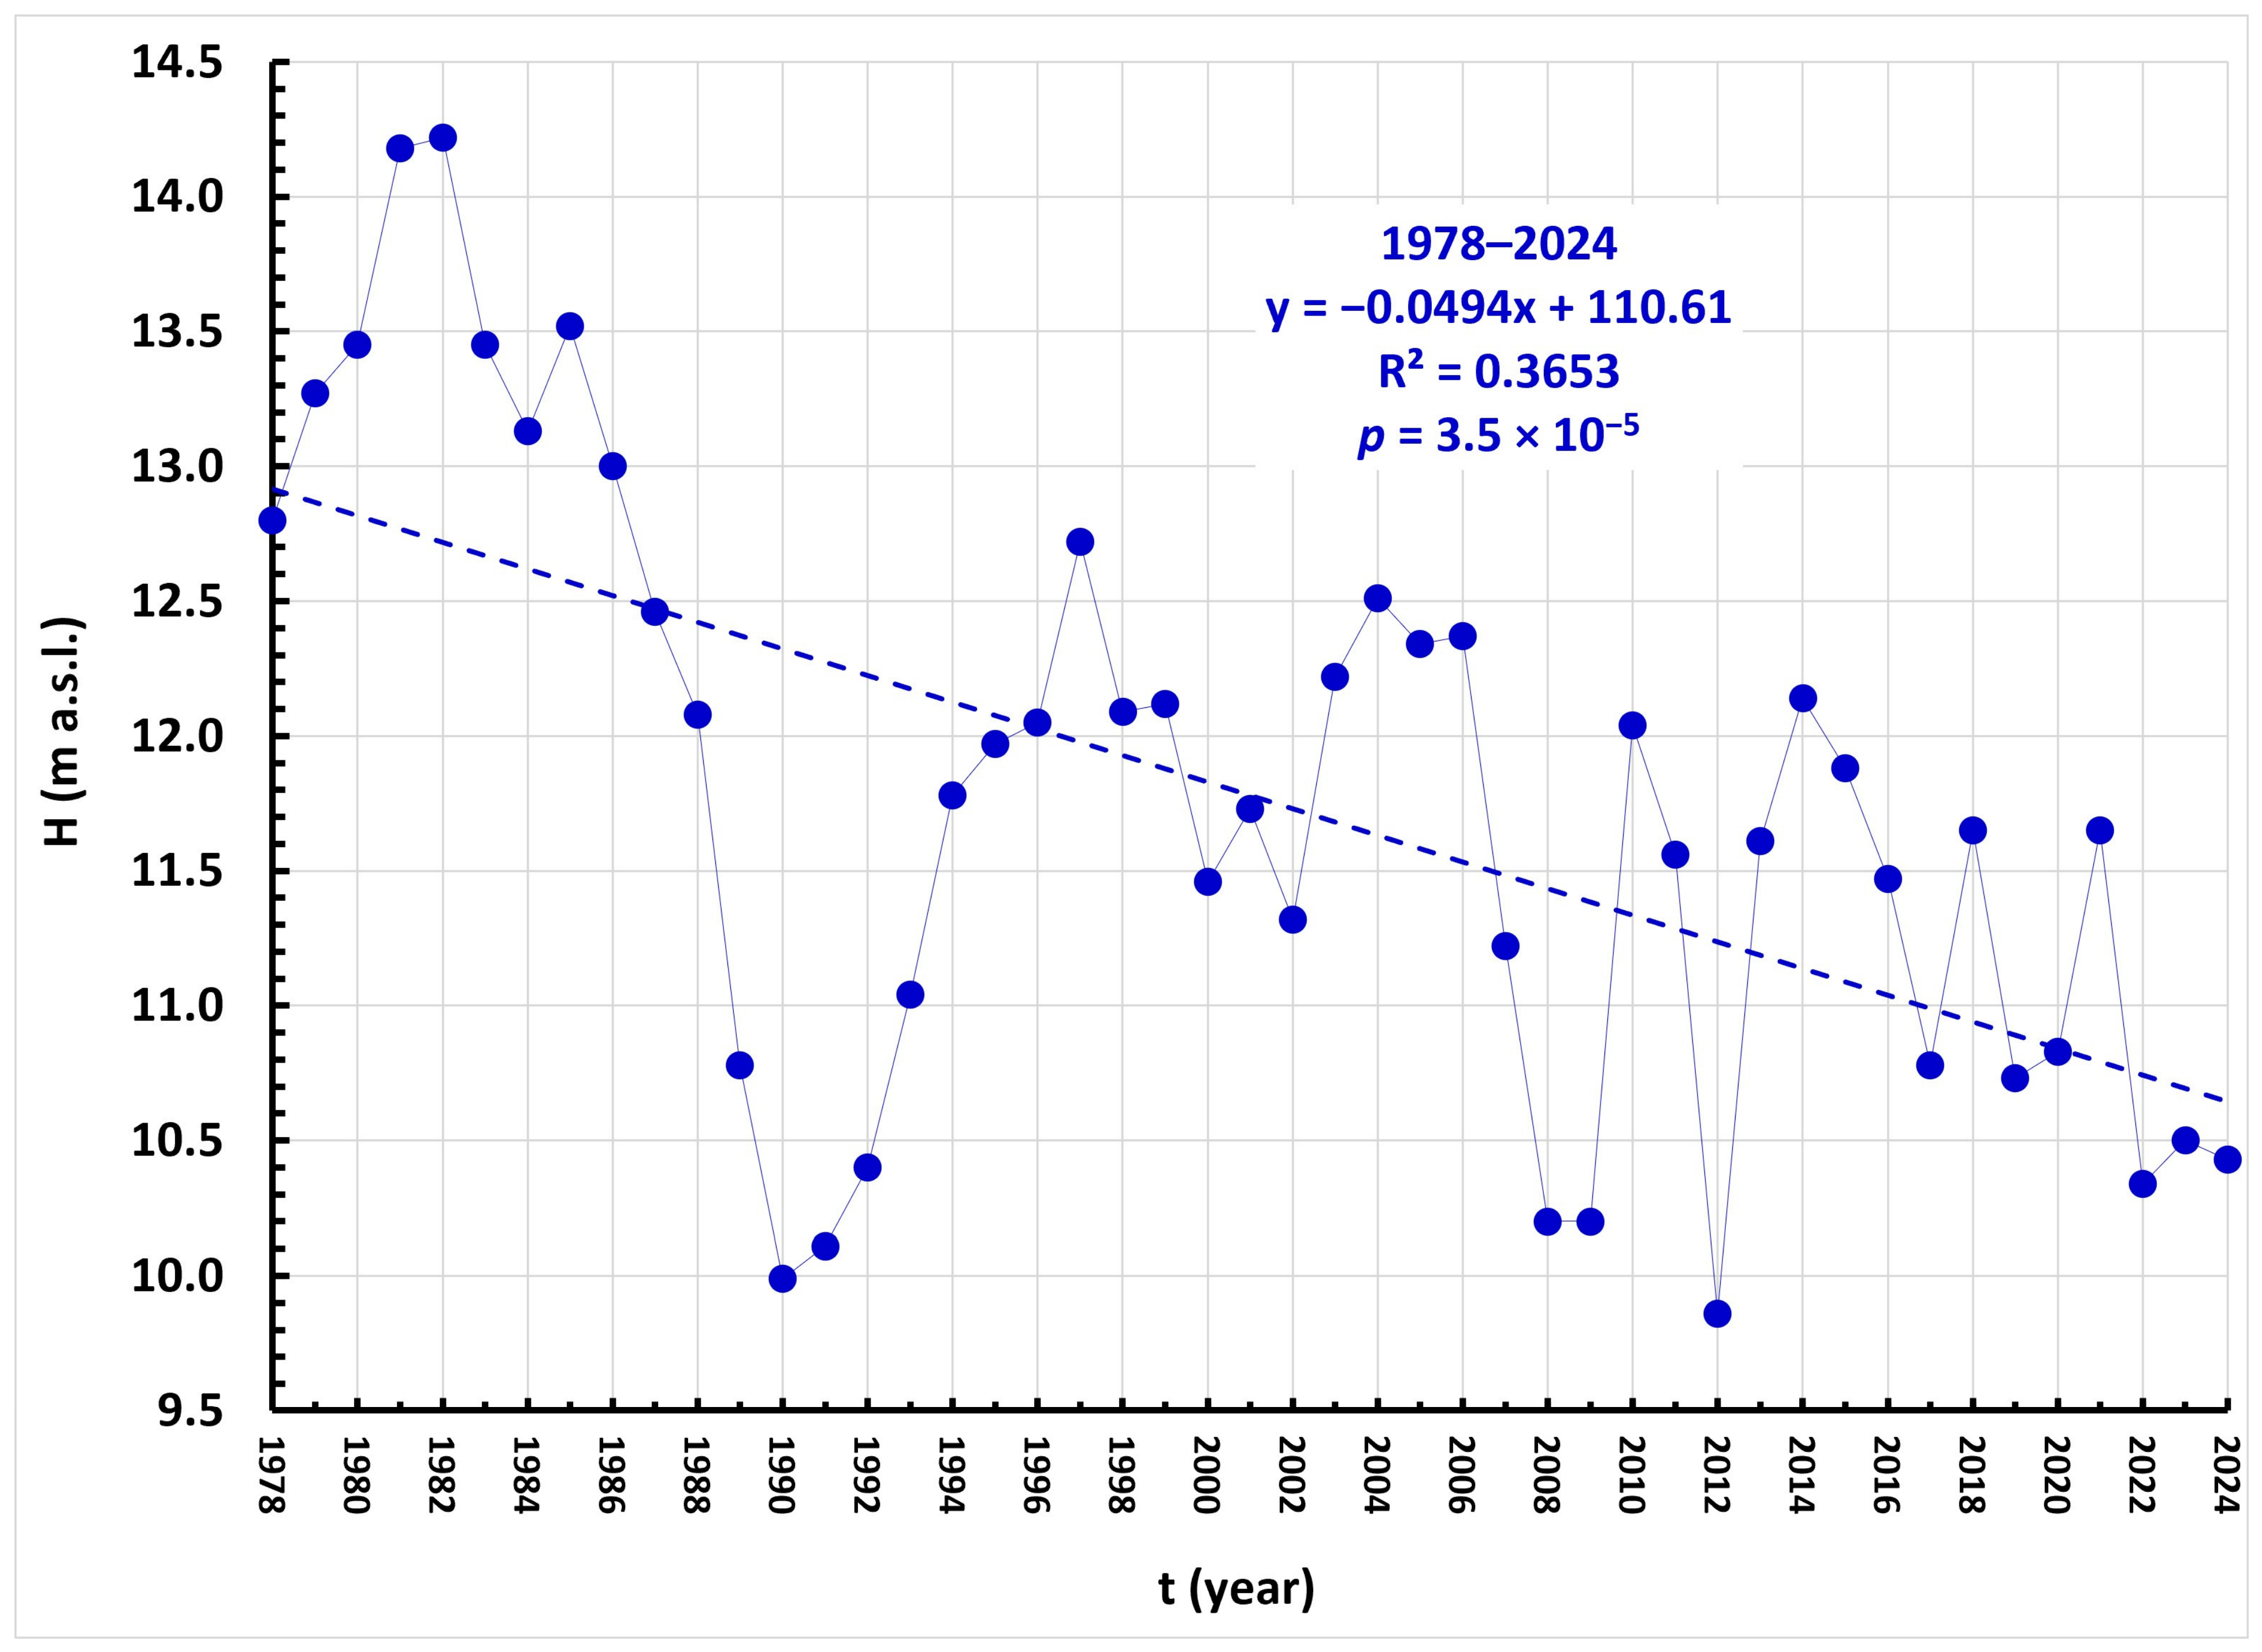
Figure 4 presents the time series of mean annual water levels of Lake Vrana during the period 1978–2024. The decreasing trend is statistically significant, as indicated by the very low probability value obtained from the M-K test (
p = 3.5 × 10
−5). The mean annual water level during the analysed period was 11.78 m a.s.l., ranging from 9.86 m a.s.l. in 2012 to 14.22 m a.s.l. in 1982.
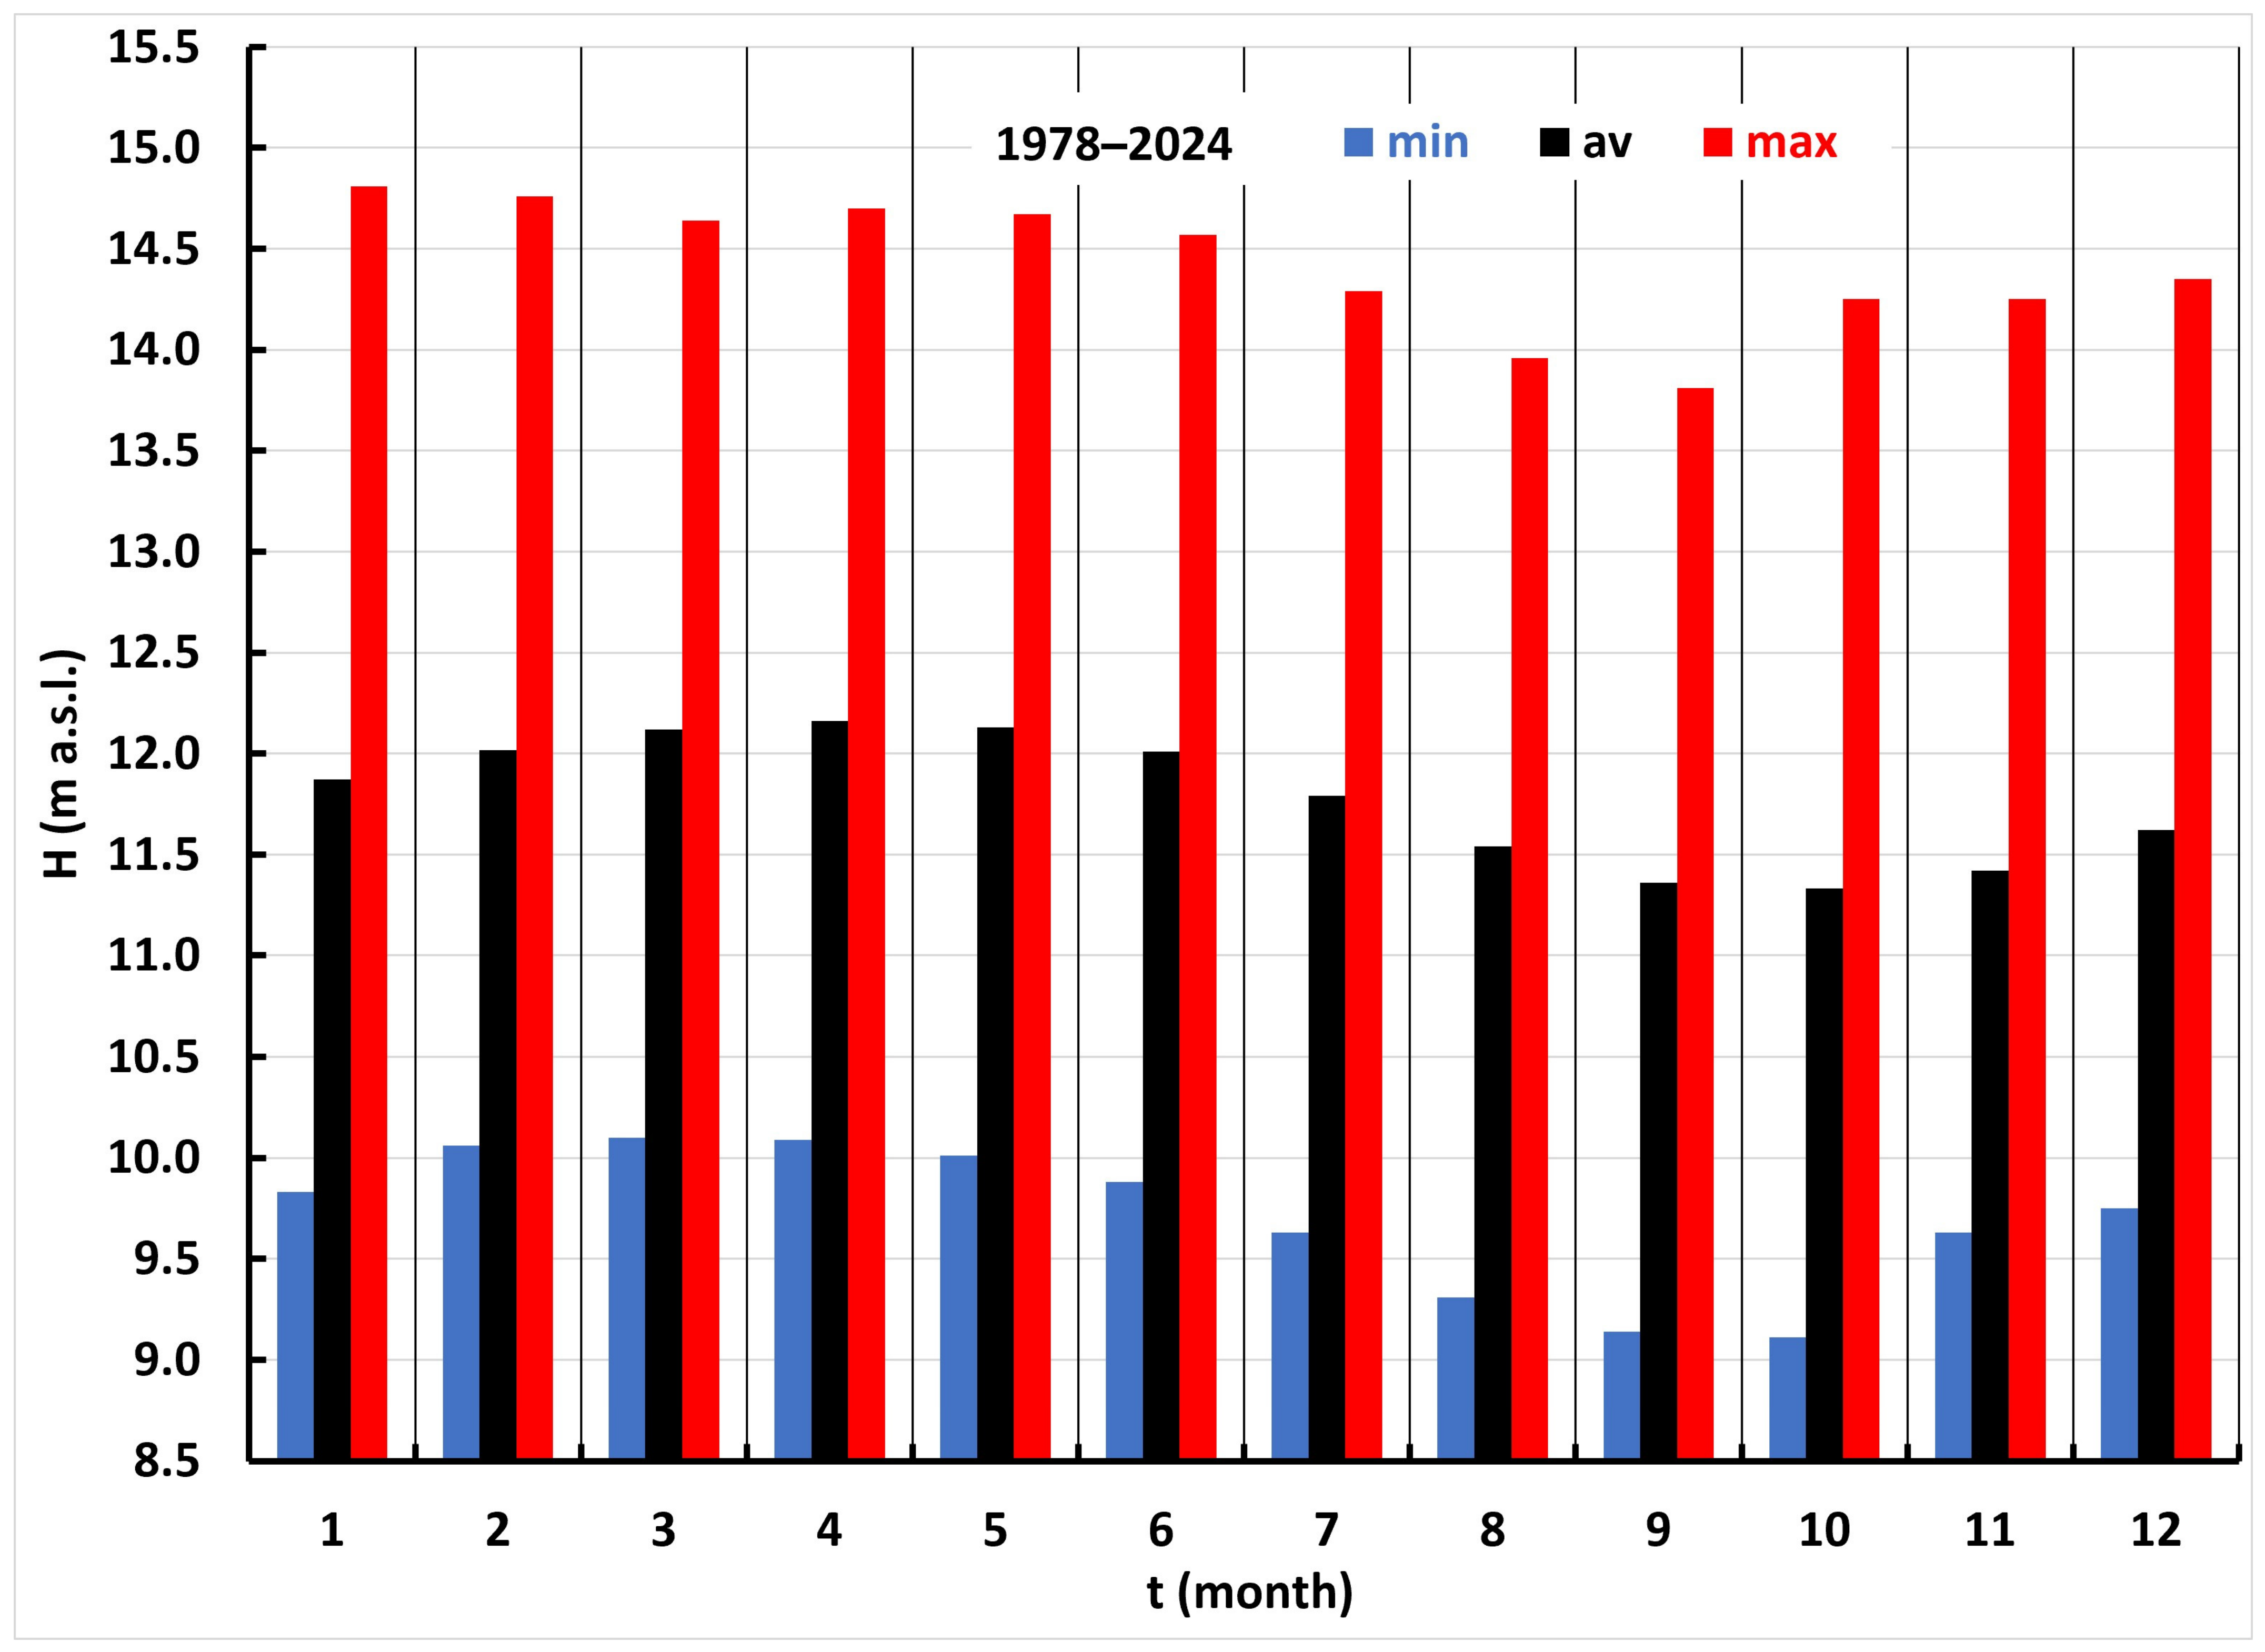
Figure 5 shows the characteristic mean monthly water levels (minimum, mean, and maximum). Values range from a minimum of 9.11 m a.s.l. observed in September 2012 to a maximum of 14.81 m a.s.l. recorded in January 1982. A distinct seasonal variation in water level is evident.
Table 2 presents the coefficients of determination (R
2), M-K statistics (
Z), M-K trend probabilities (
p), Sen slopes (
S), and linear regression slopes (
A) for the mean monthly and annual water-level series during the period 1978–2024.
All monthly and annual series exhibit statistically significant negative trends. Linear regression slopes range approximately between −4.5 and −5.2 cm per year. The R2 values range from 0.29 to 0.39, indicating that approximately 29–39% of the variance in the series is explained by the linear trend. Sen slopes are very similar to the corresponding linear regression slopes, confirming the robustness of the detected trend. The M-K Z statistics range from −3.6 to −4.5, indicating a strong negative monotonic trend.
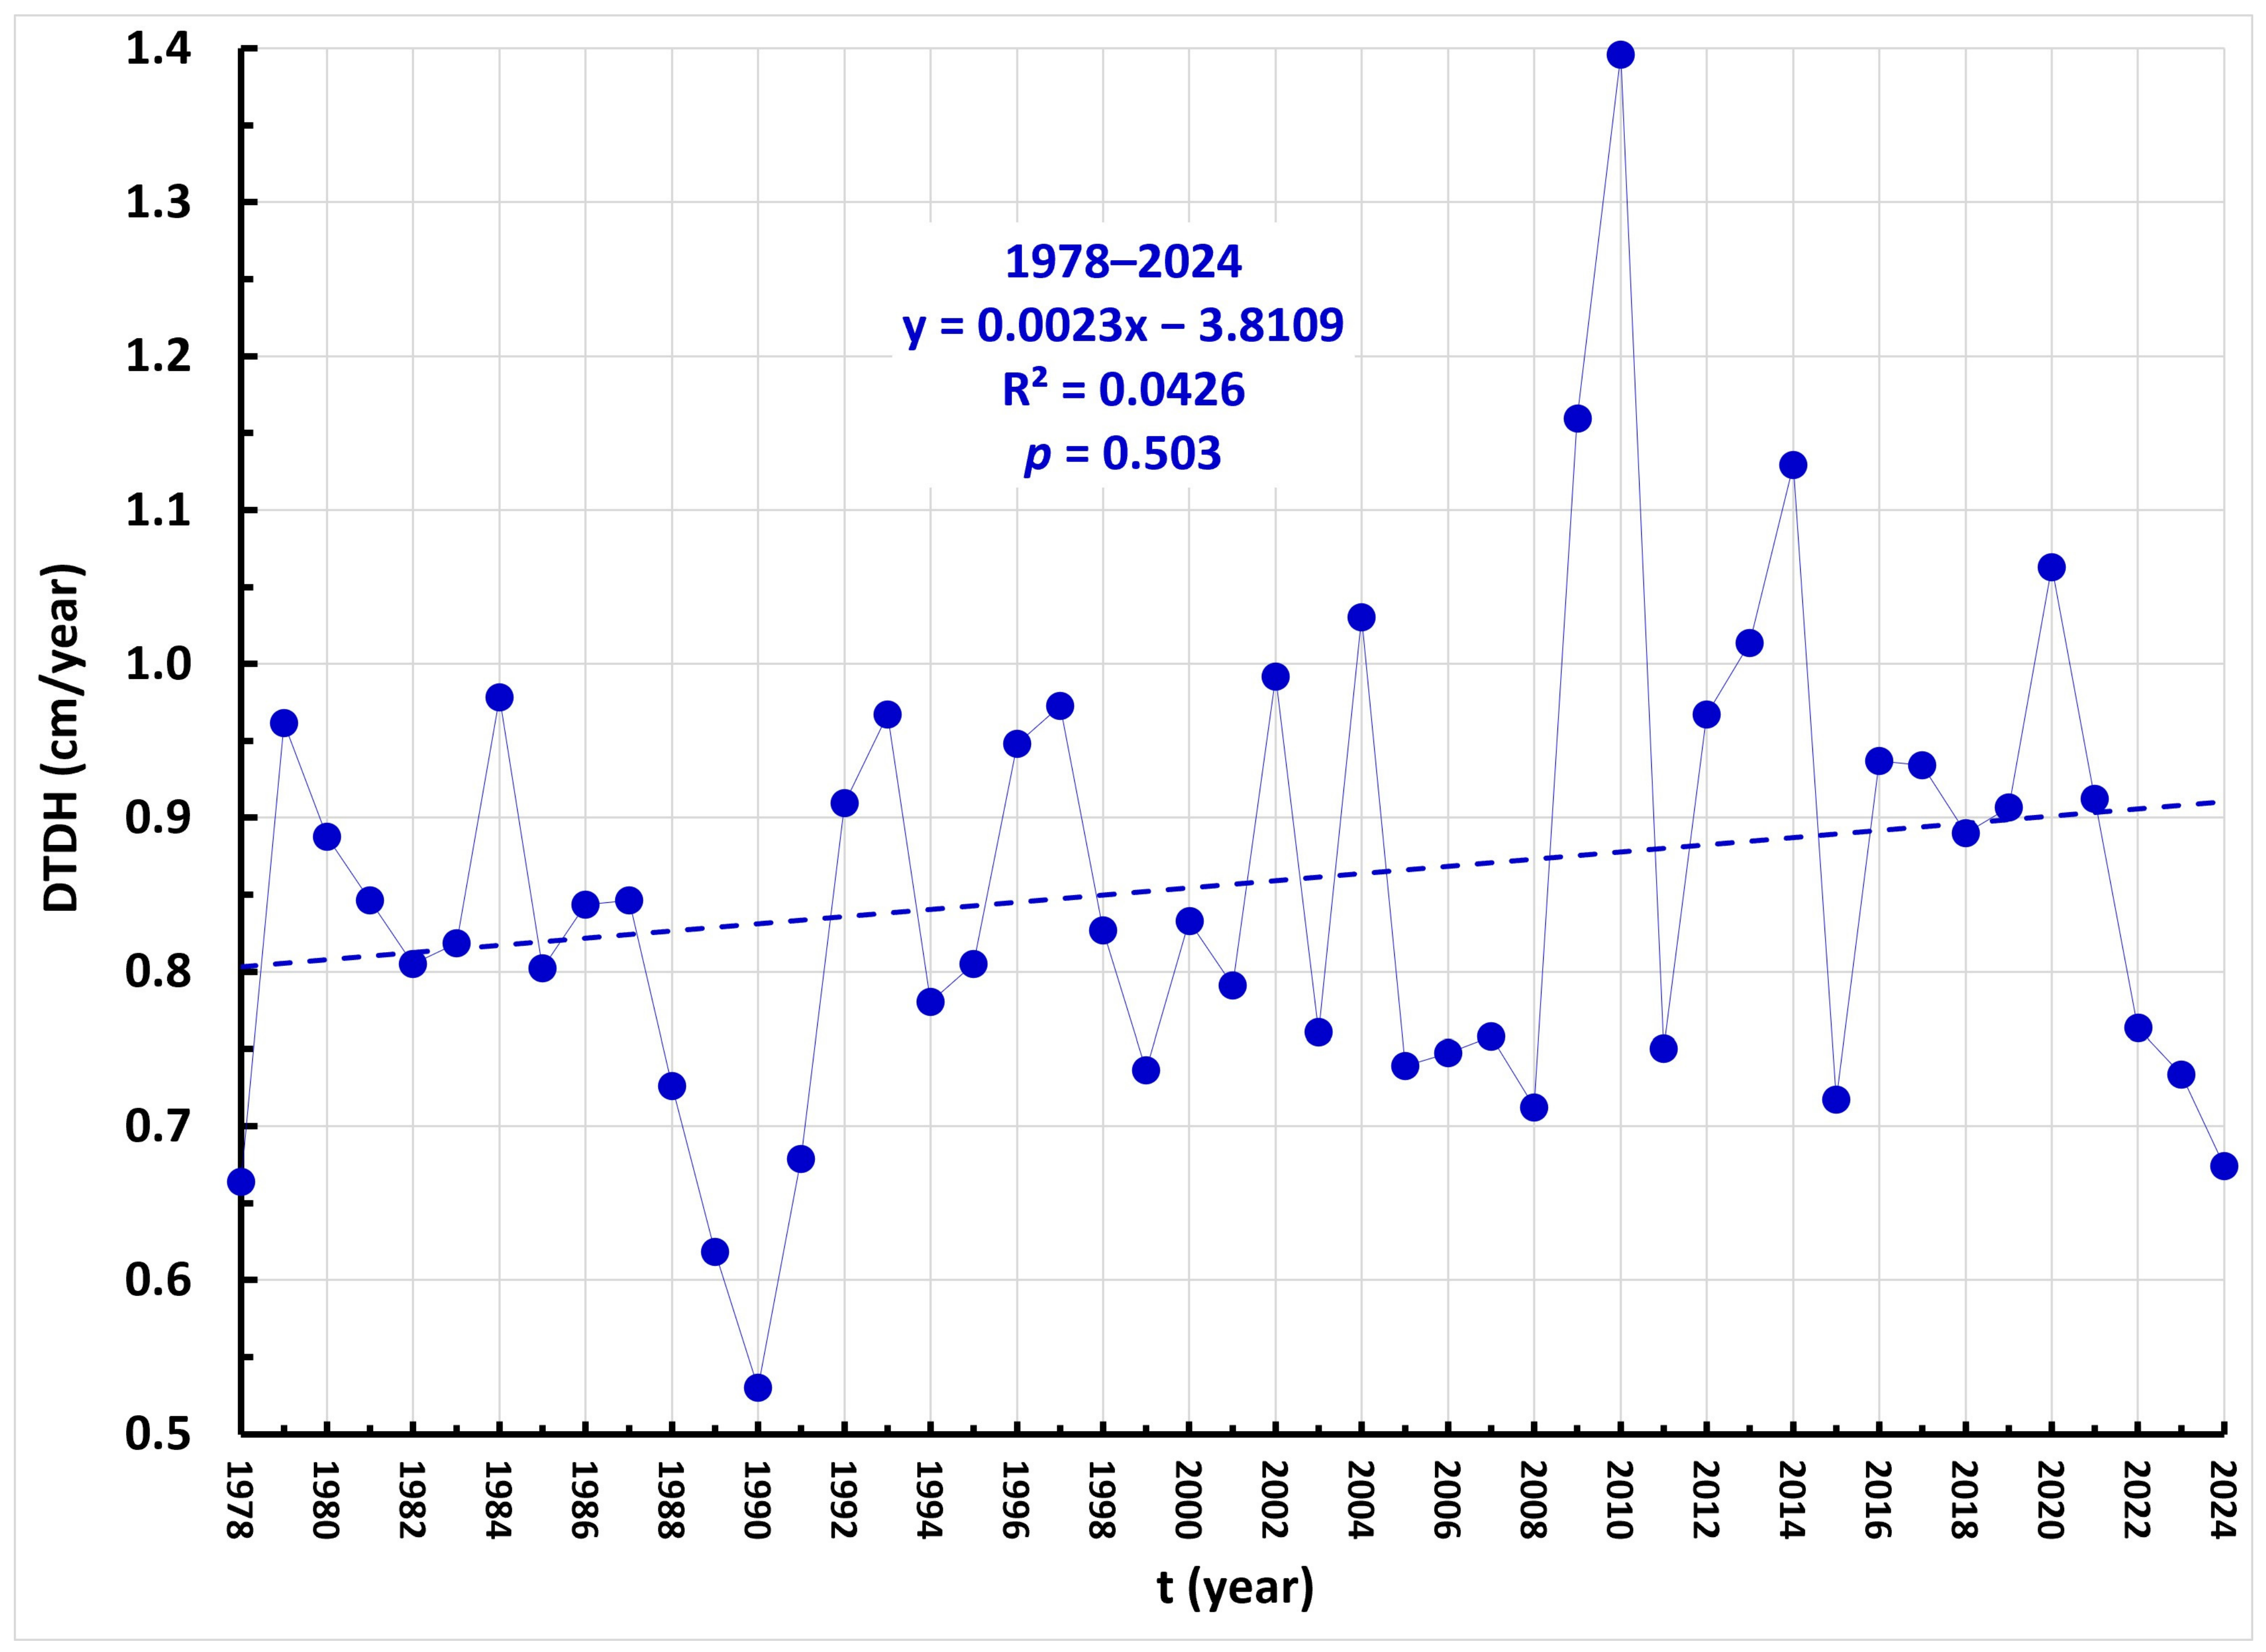
Figure 6 shows the annual series of DTDH daily water-level variability for Lake Vrana during the period 1978–2024. Values range from a minimum of 0.530 cm yr
−1 in 1990 to a maximum of 1.396 cm yr
−1 in 2010, with an average value of 0.857 cm yr
−1. A slight increasing trend that is statistically insignificant is observed.
The negative trend is present in all months of the year, while the linear model explains approximately 29–39% of the variance, suggesting a systematic change in the hydrological regime accompanied by natural climatic variability. The DTD analysis indicates a slight but statistically insignificant increase in daily dynamics of water levels.
5.2. Water and Air Temperatures
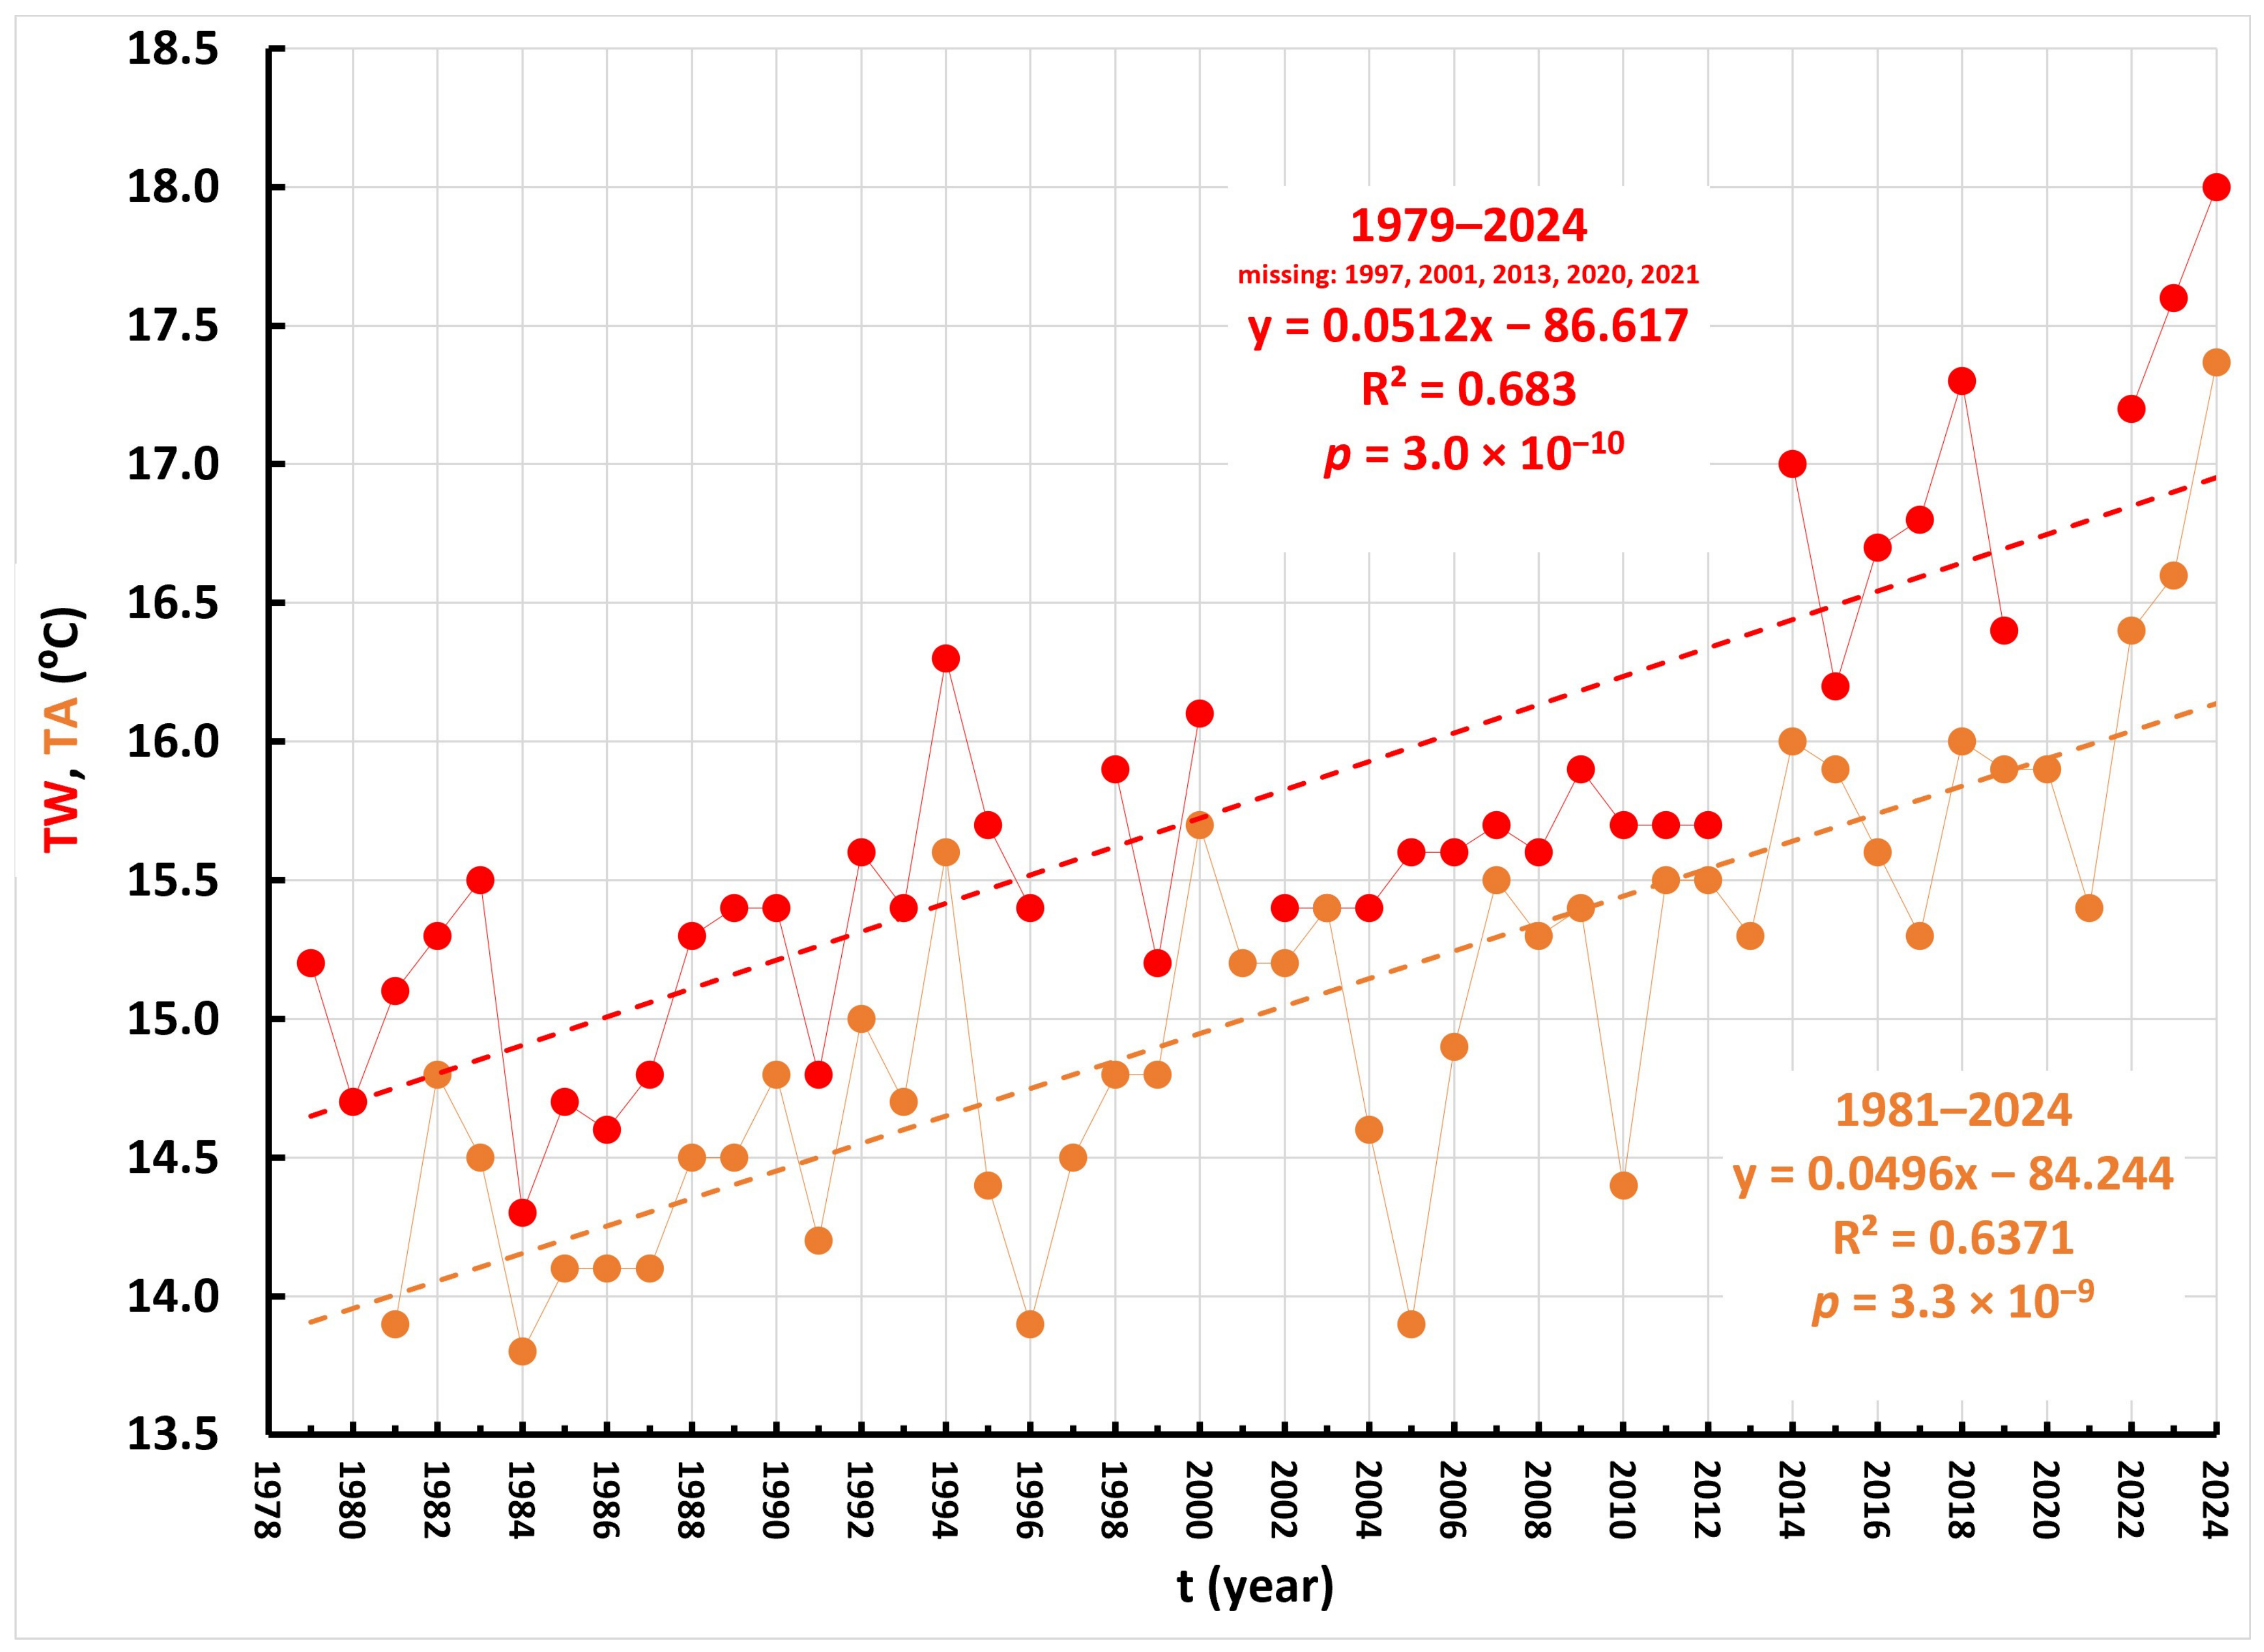
The time series of mean annual water temperature of Lake Vrana (
TW) during 1979–2024 and mean annual air temperature (
TA) measured at the Cres meteorological station during 1981–2024 are shown in
Figure 7.
The mean water temperature is slightly higher than the mean air temperature. For the period of simultaneous observations, the average water temperature was 15.79 °C, while the average air temperature was 0.75 °C lower (15.05 °C). The values of the M-K
Z parameter are high and positive, indicating a strong monotonic increase in both series. Sen’s slopes are very close to the linear regression slopes (
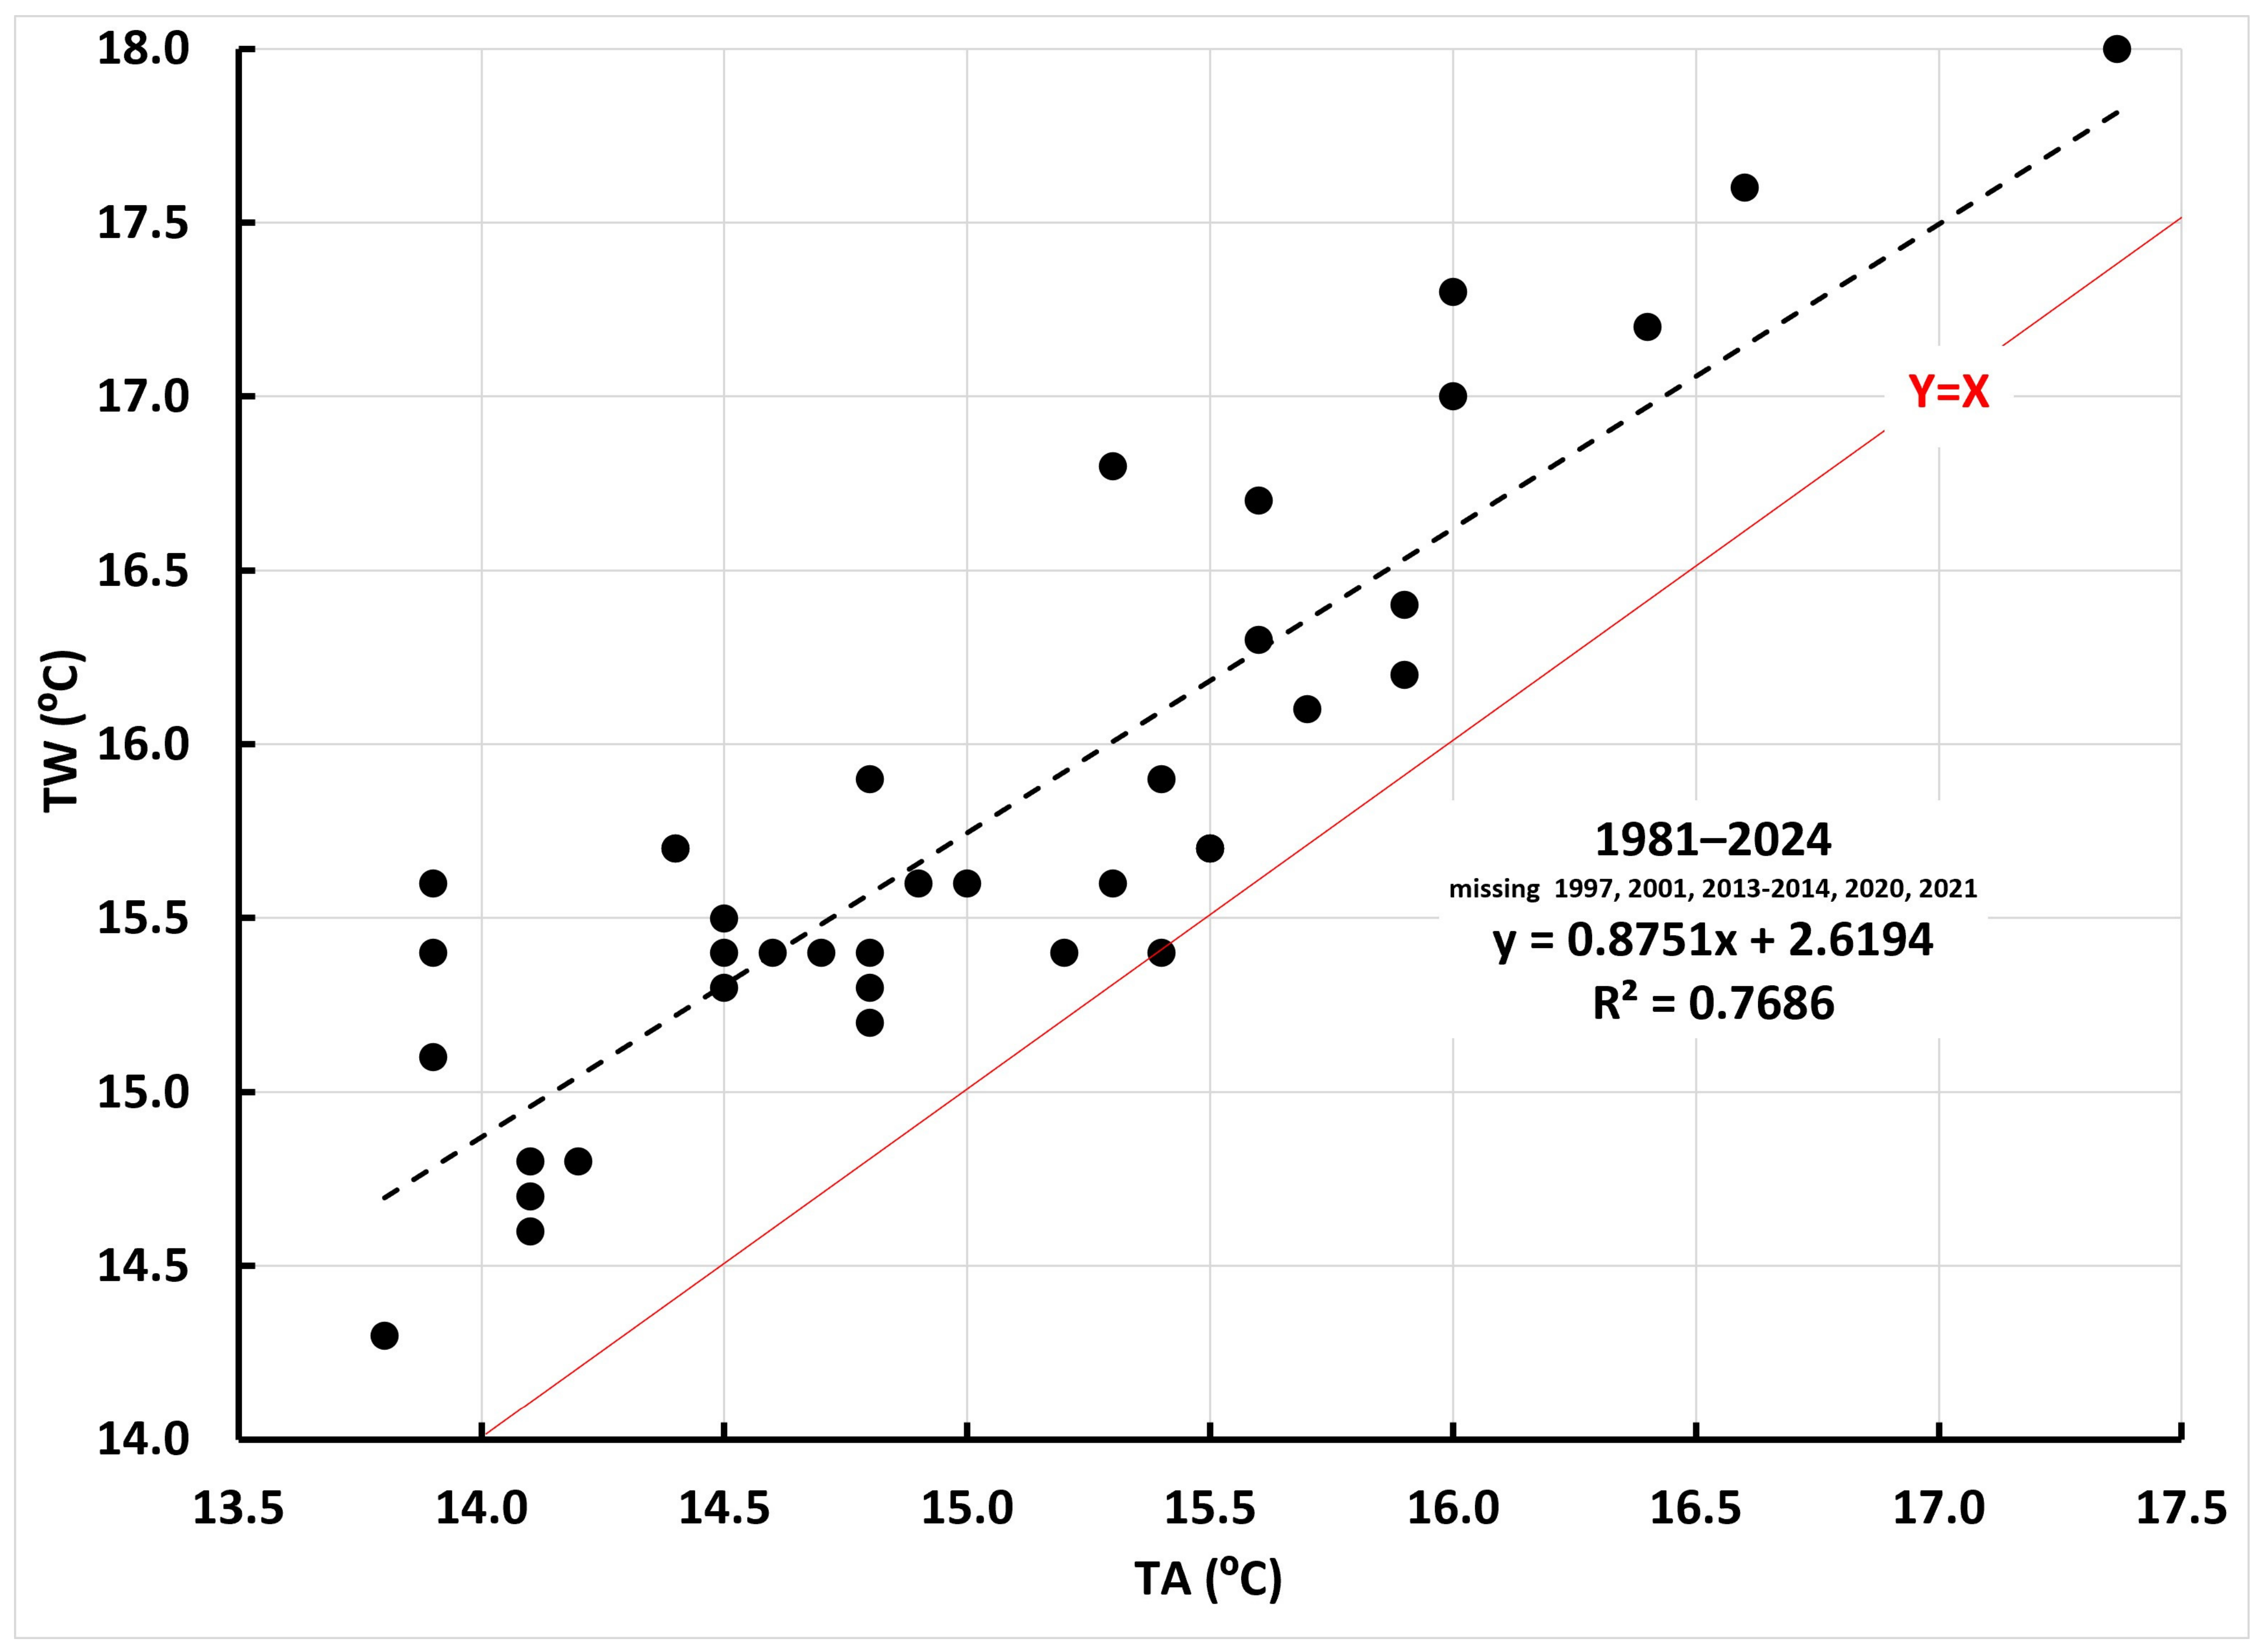
A), suggesting a stable and robust trend unaffected by outliers. Both indicators correspond to a warming rate of approximately 0.5 °C per decade. The relationship between mean annual water and air temperatures, presented in
Figure 8, reveals a high coefficient of determination (R
2 = 0.767).
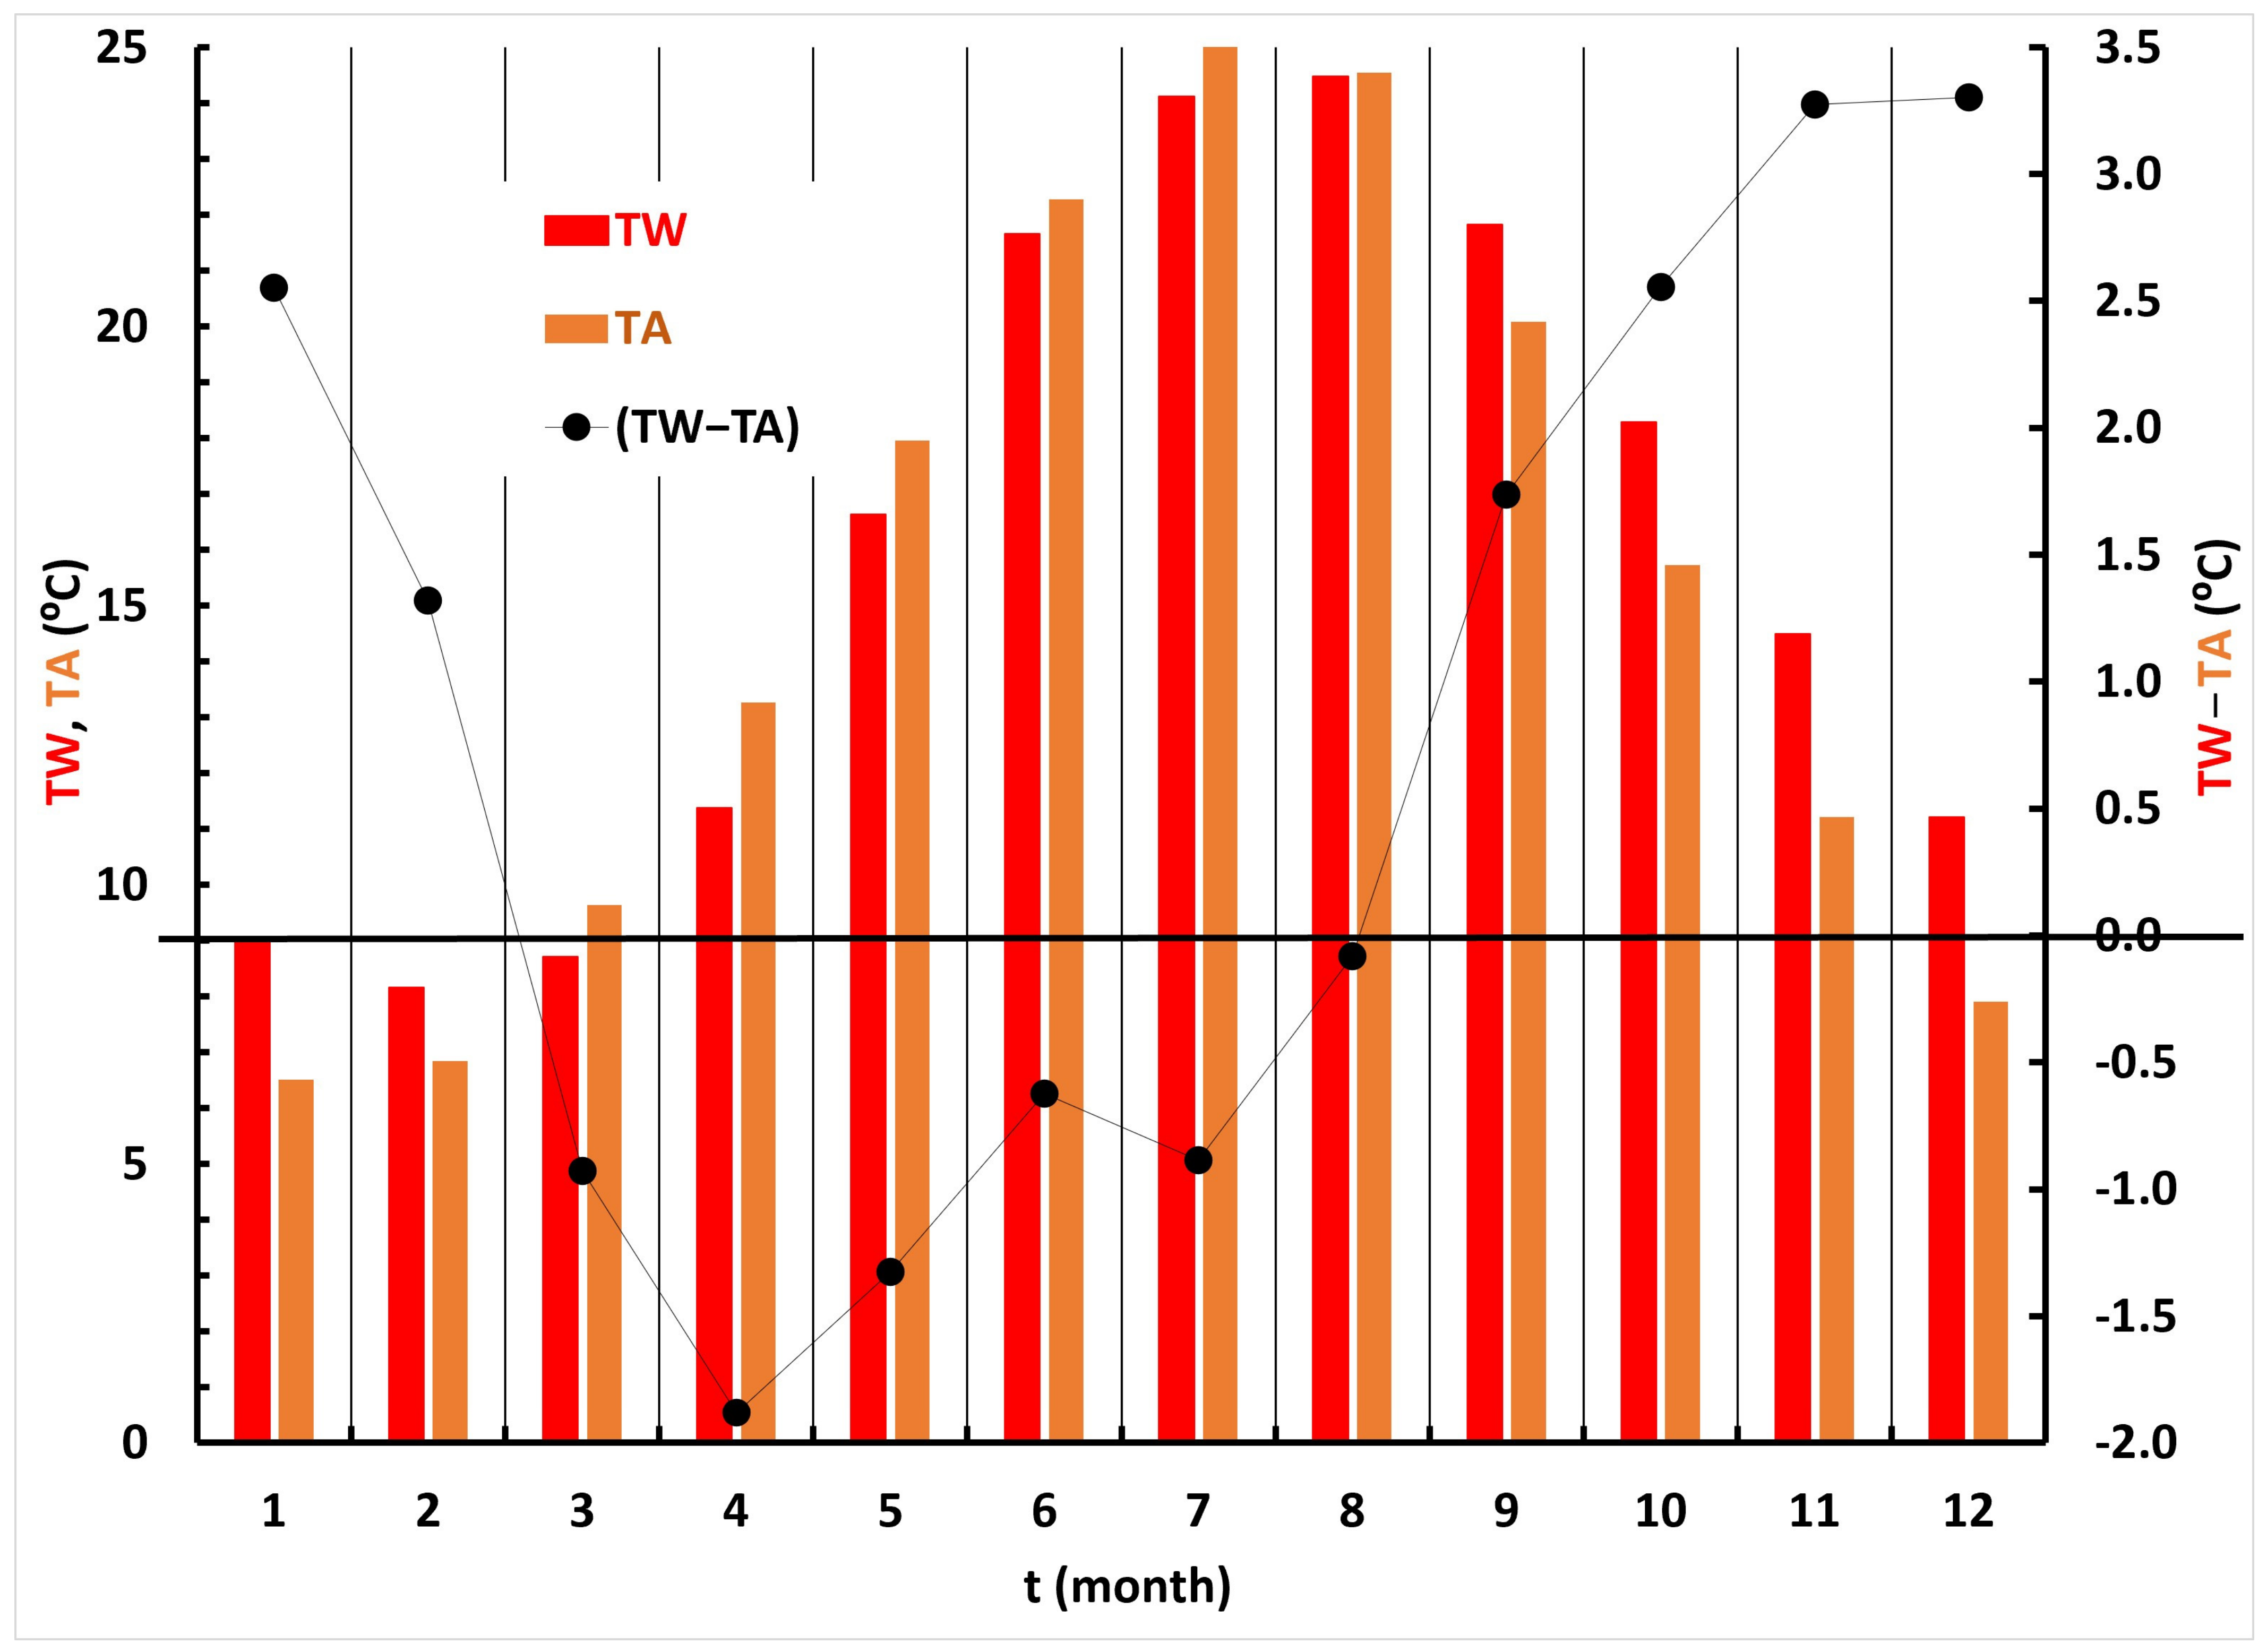
Bar graphs of average monthly water and air temperatures during the period of simultaneous observations (1981–2024) are shown in
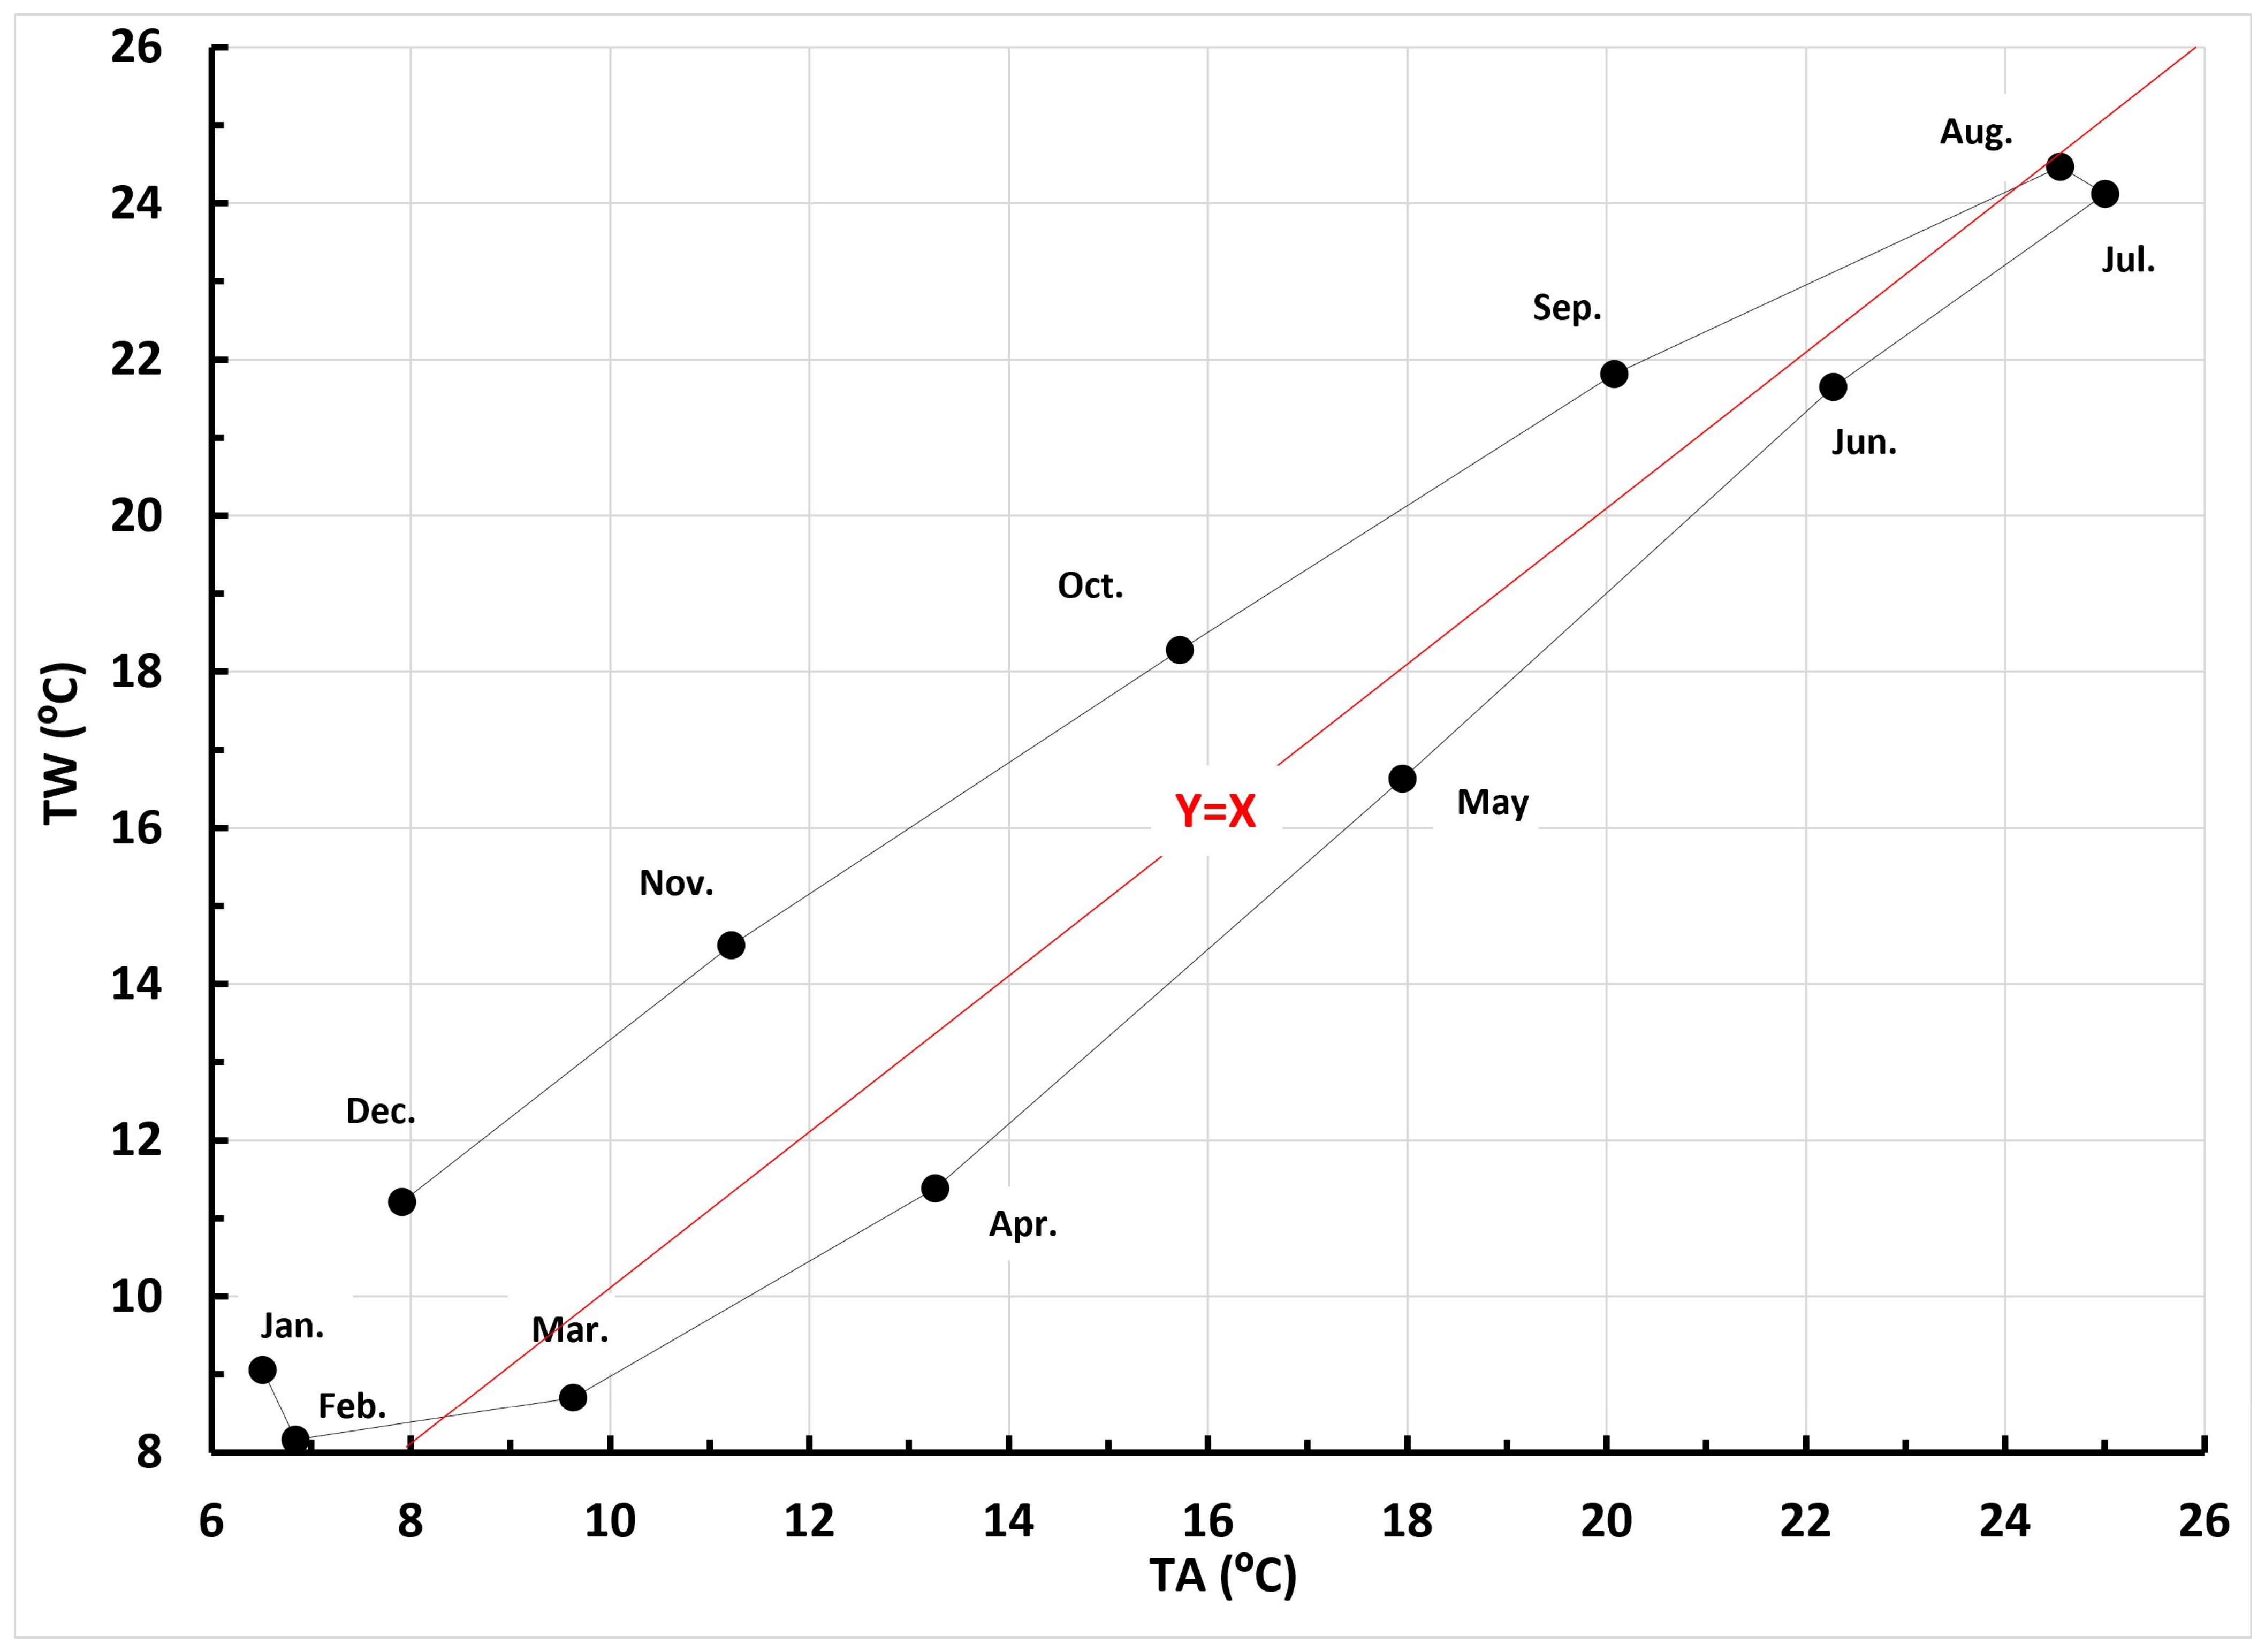
Figure 9, while their differences are represented by points connected by lines. From March to August, water temperatures are higher than air temperatures, whereas from September to February the opposite relationship occurs. This is also evident in
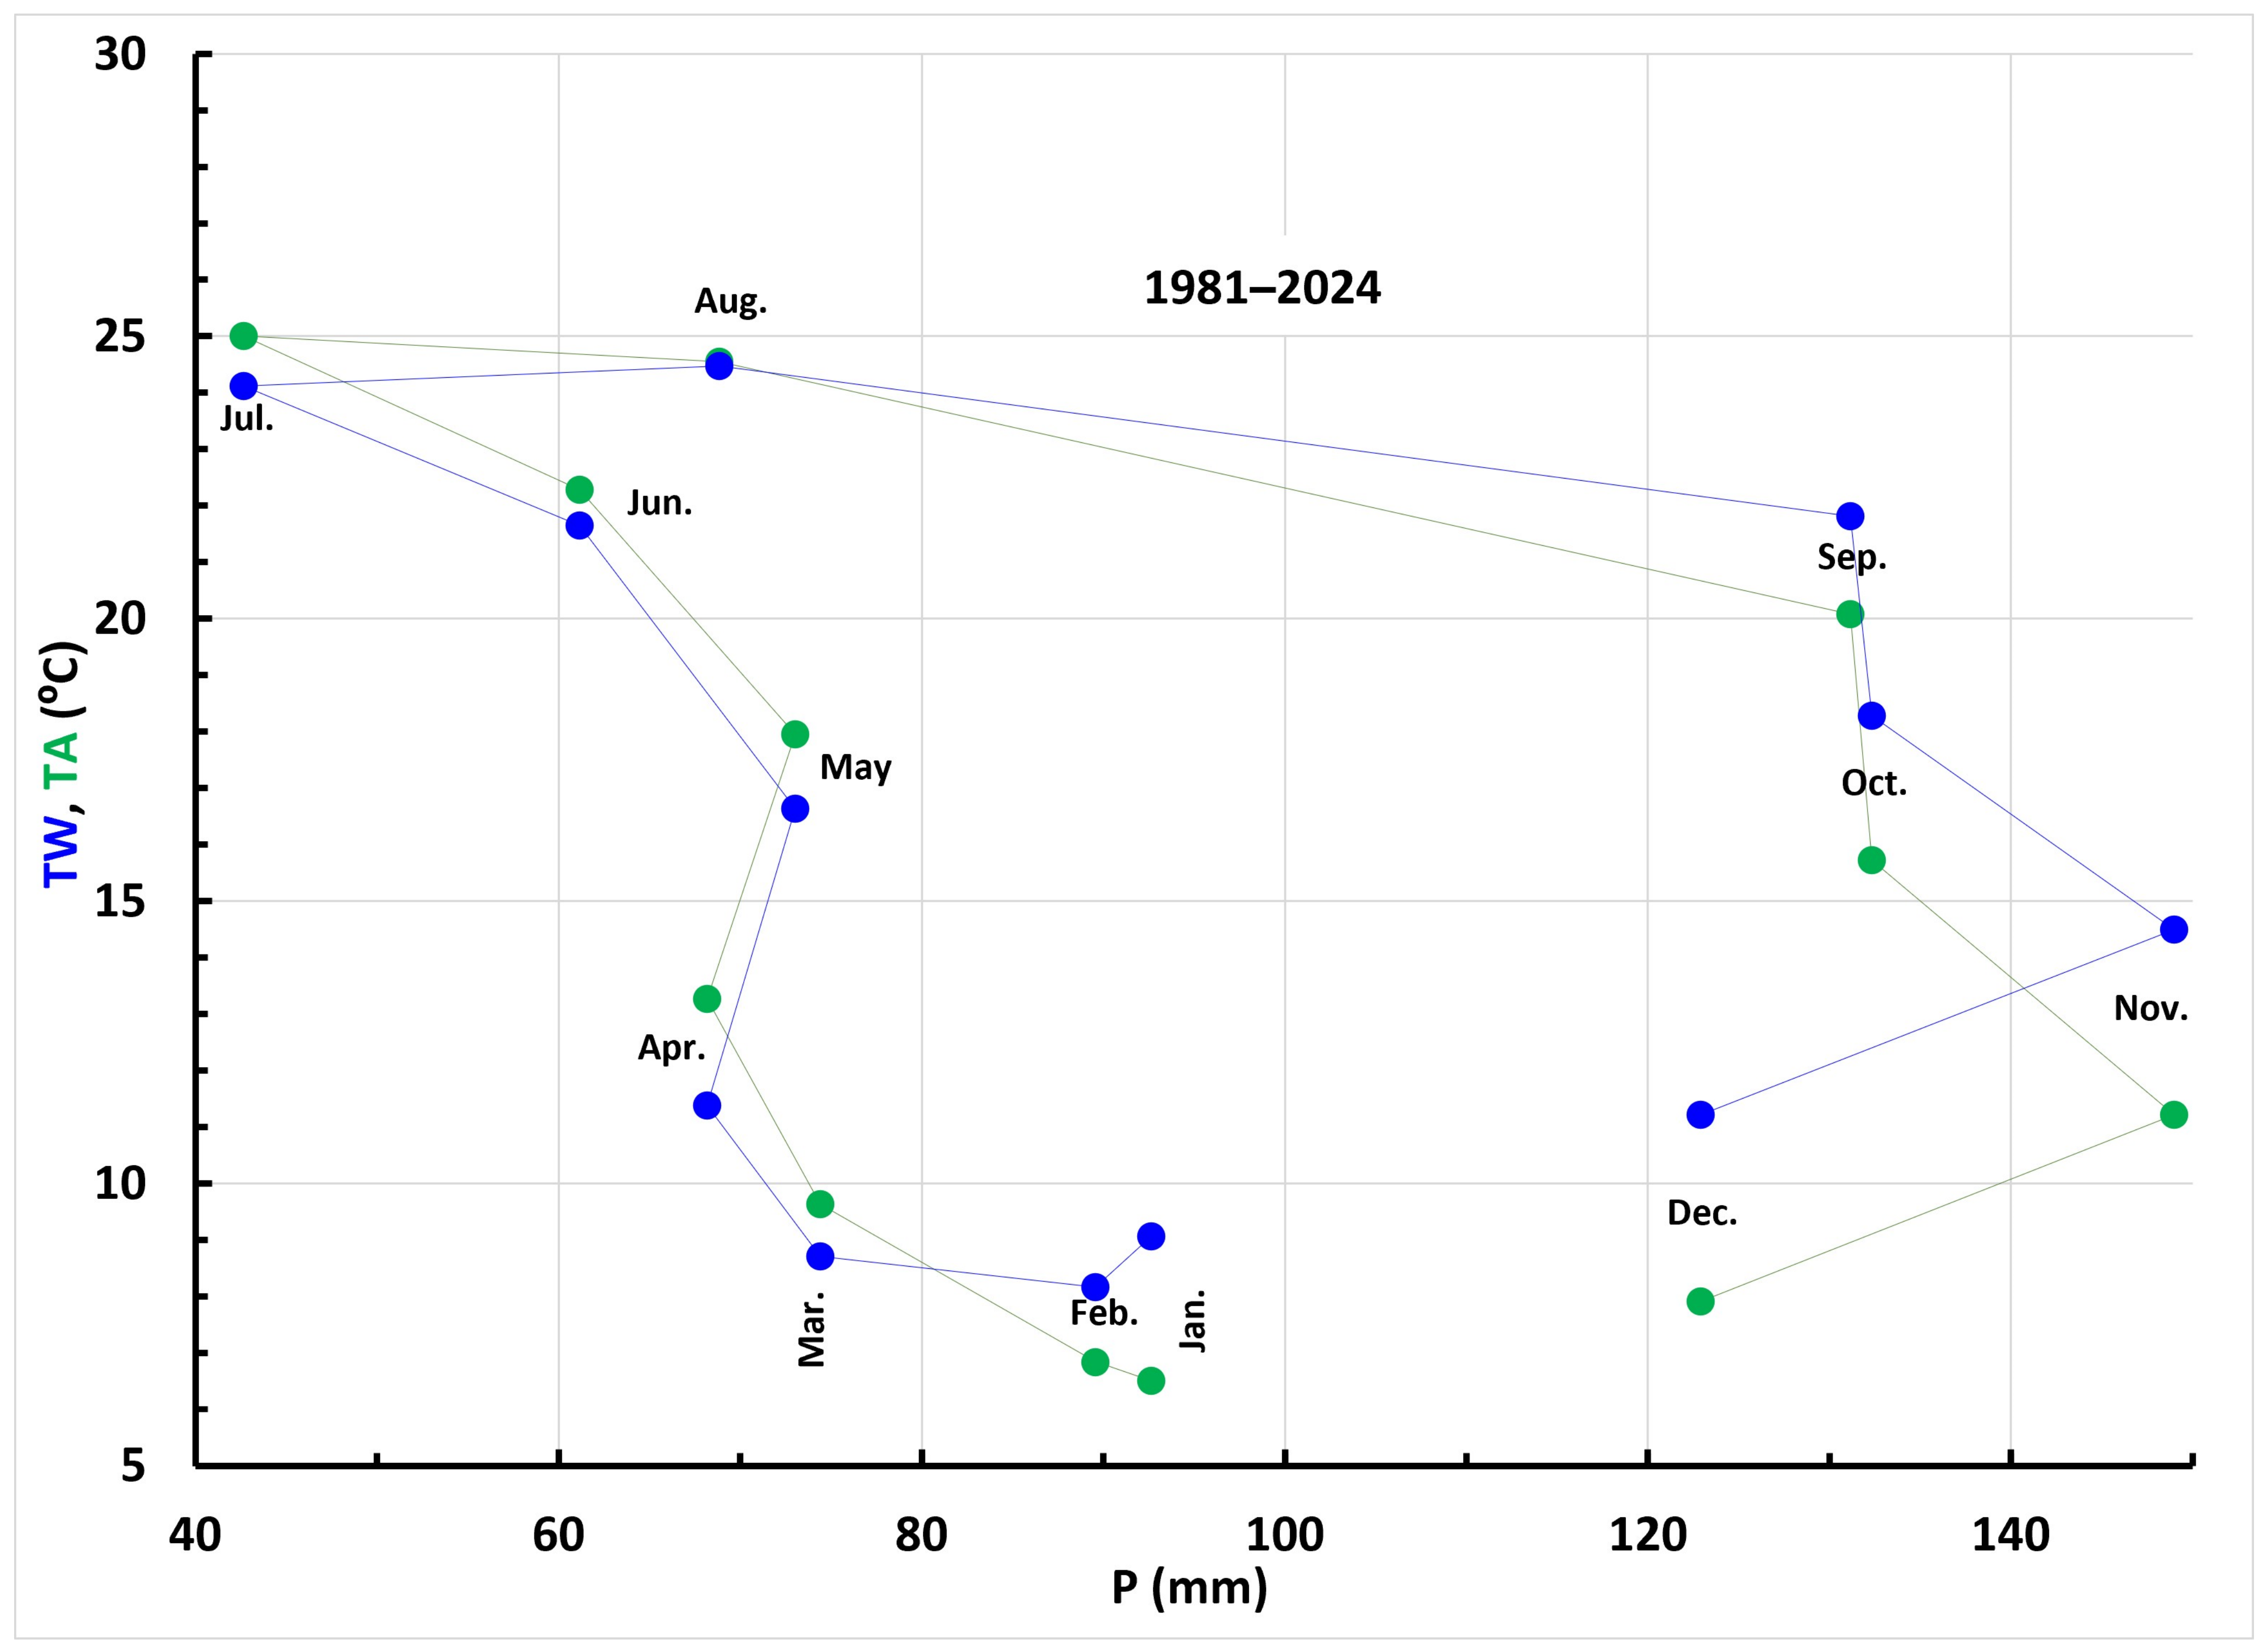
Figure 10, which shows the relationship between the average monthly values of water and air temperatures during the same observation period (1981–2024). A time lag in the response of the lake system to atmospheric changes is apparent. The observed lag between air temperature and water temperature is approximately one month, reflecting the high heat capacity and thermal inertia of the lake system. To further investigate the potential influence of precipitation on seasonal temperature dynamics,
Figure 11 presents the seasonal covariation between monthly precipitation (
P) and the average values of mean monthly water temperatures and air temperatures during the simultaneous measurement period (1984–2024) at Lake Vrana. The figure indicates an inverse seasonal relationship between precipitation and temperature variables, with the highest temperatures occurring during the dry summer months and the lowest temperatures occurring during the wet winter period.
The close seasonal correspondence between TW and TA further confirms strong coupling between atmospheric and lake thermal conditions, while the observed lag in water temperature response reflects the thermal inertia of the lake system.
To further evaluate the relationship among the analysed hydrological and climatological variables,
Table 3 summarizes the directions and relative strength of the observed associations between mean annual lake water level (
H), precipitation (
P), air temperature (
TA), water temperature (
TW), and average annual water abstraction (
Q). Positive relationships are shown in red, whereas inverse relationships are shown in blue. The results indicate a strong direct relationship among temperature-related variables, while lake water level (
H) exhibits an inverse relationship with thermal indicators and a direct relationship with precipitation (
P). Increasing water abstraction (
Q) is additionally associated with declining lake levels (
H), supporting the interpretation that both climatic warming and anthropogenic water use contribute to the recent hydrological behaviour of Lake Vrana.
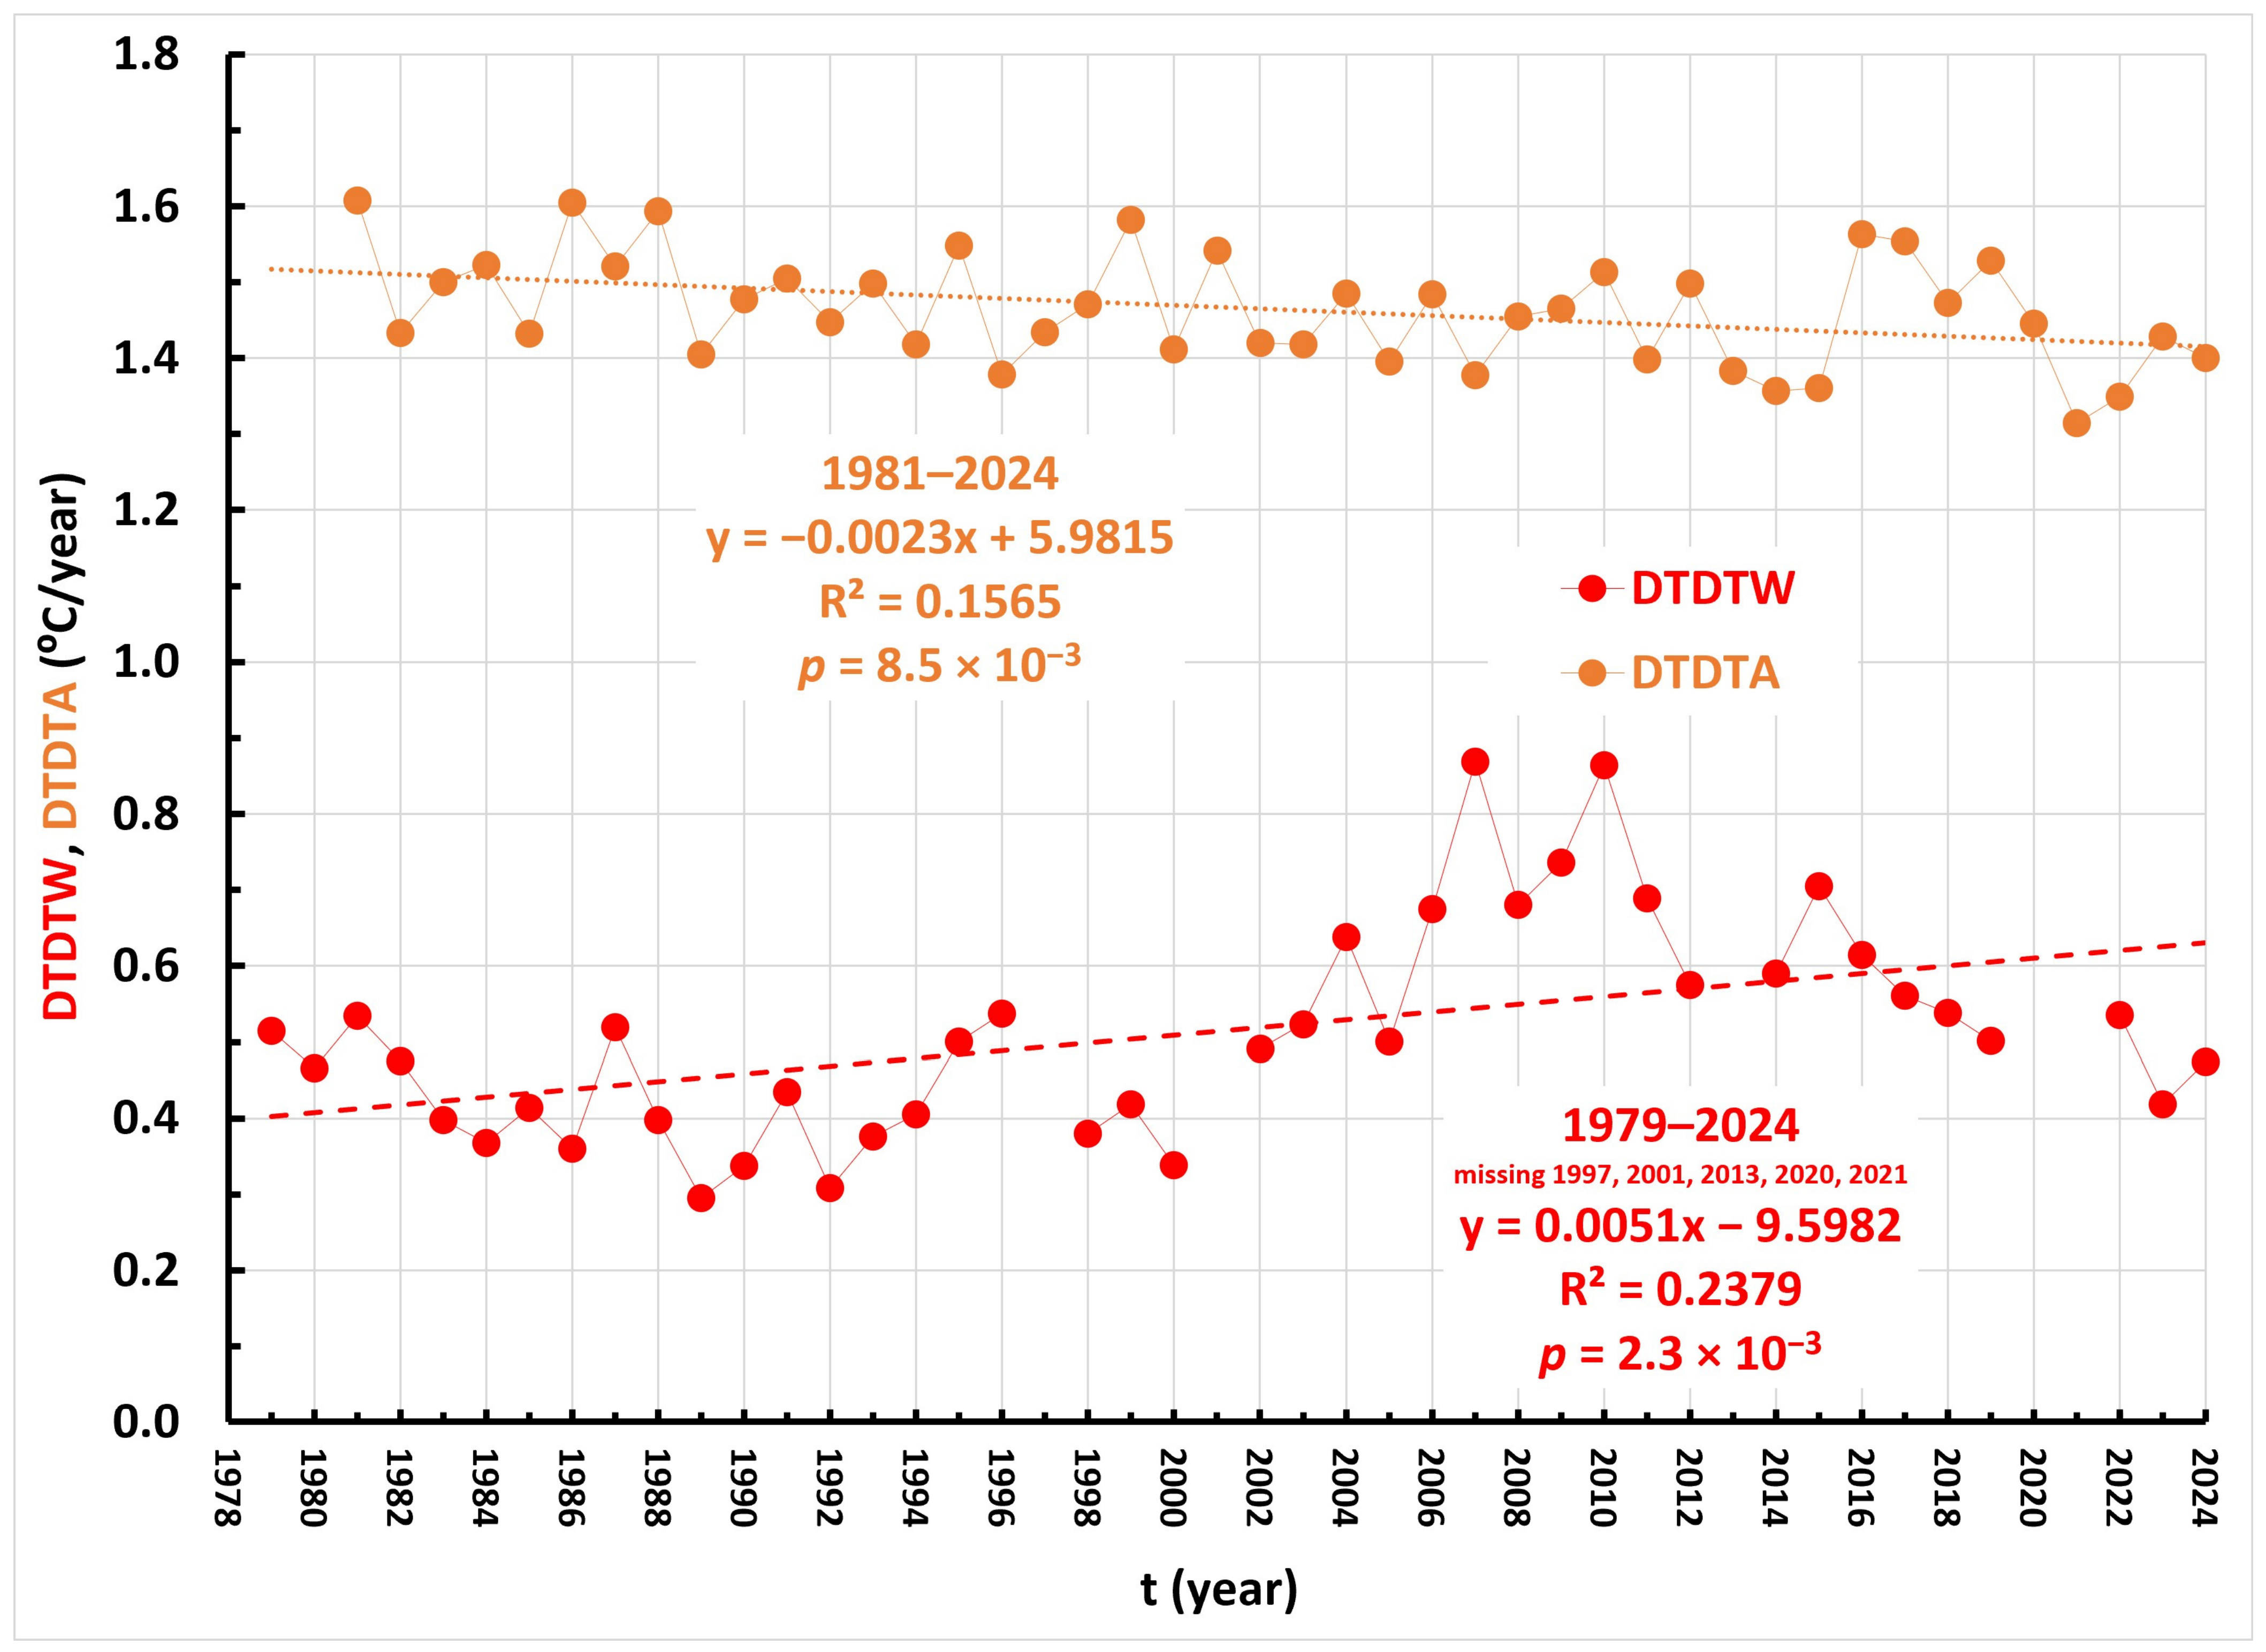
The annual series of DTDTW variability in water temperature during 1979–2024 and DTDTA variability in mean air temperature during 1981–2024 are presented in
Figure 12. While DTDTW shows a statistically significant increasing trend, DTDTA exhibits a statistically significant decreasing trend. Values of DTDTW are substantially lower than those of DTDTA. During the period with simultaneous measurements, the average DTDTA was 1.469 °C yr
−1, while the average DTDTW was 0.512 °C yr
−1.
Water has a large heat capacity and therefore responds more slowly to short-term fluctuations, effectively integrating the long-term energy balance of the system. Due to thermal inertia, water temperature exhibits a more stable and robust trend signal, as indicated by the higher R2 value, suggesting that the lake accumulates long-term climatic changes.
Air, by contrast, has a much lower heat capacity, responds more strongly to synoptic changes, and exhibits greater interannual variability. Although the (warming) trend is statistically significant, it is less well explained by the linear model, resulting in a lower R2 value. In this case, the signal appears to be more strongly controlled by regional atmospheric dynamics than by (long-term) heat accumulation.
The contrasting trends observed in DTDTW and DTDTA reflect differences between atmospheric and lake energy dynamics. While air temperature variability is primarily controlled by synoptic-scale atmospheric processes, the lake integrates and redistributes heat through internal mechanisms such as thermal stratification and vertical mixing.
The increase in DTDTW is likely associated with earlier and more persistent stratification, reduced vertical mixing, and a thinner surface mixed layer, which enhances the sensitivity of surface water to short-term atmospheric forcing. In addition, increased evaporation and changes in heat flux partitioning contribute to amplified short-term temperature fluctuations. These processes indicate a shift in the lake’s energy balance whereby internal dynamics increasingly amplify high-frequency variability despite reduced atmospheric variability. This behaviour is consistent with progressive warming and strengthened thermal stratification.
These findings confirm that the lake system functions as a thermal reservoir, damping short-term atmospheric fluctuations while exhibiting a temporal lag relative to atmospheric forcing. Air temperature represents the primary climatic signal, whereas water temperature reflects the integrated response of the system. It is evident that the atmosphere fluctuates, while the lake responds and retains the memory of those fluctuations.
5.3. Precipitation
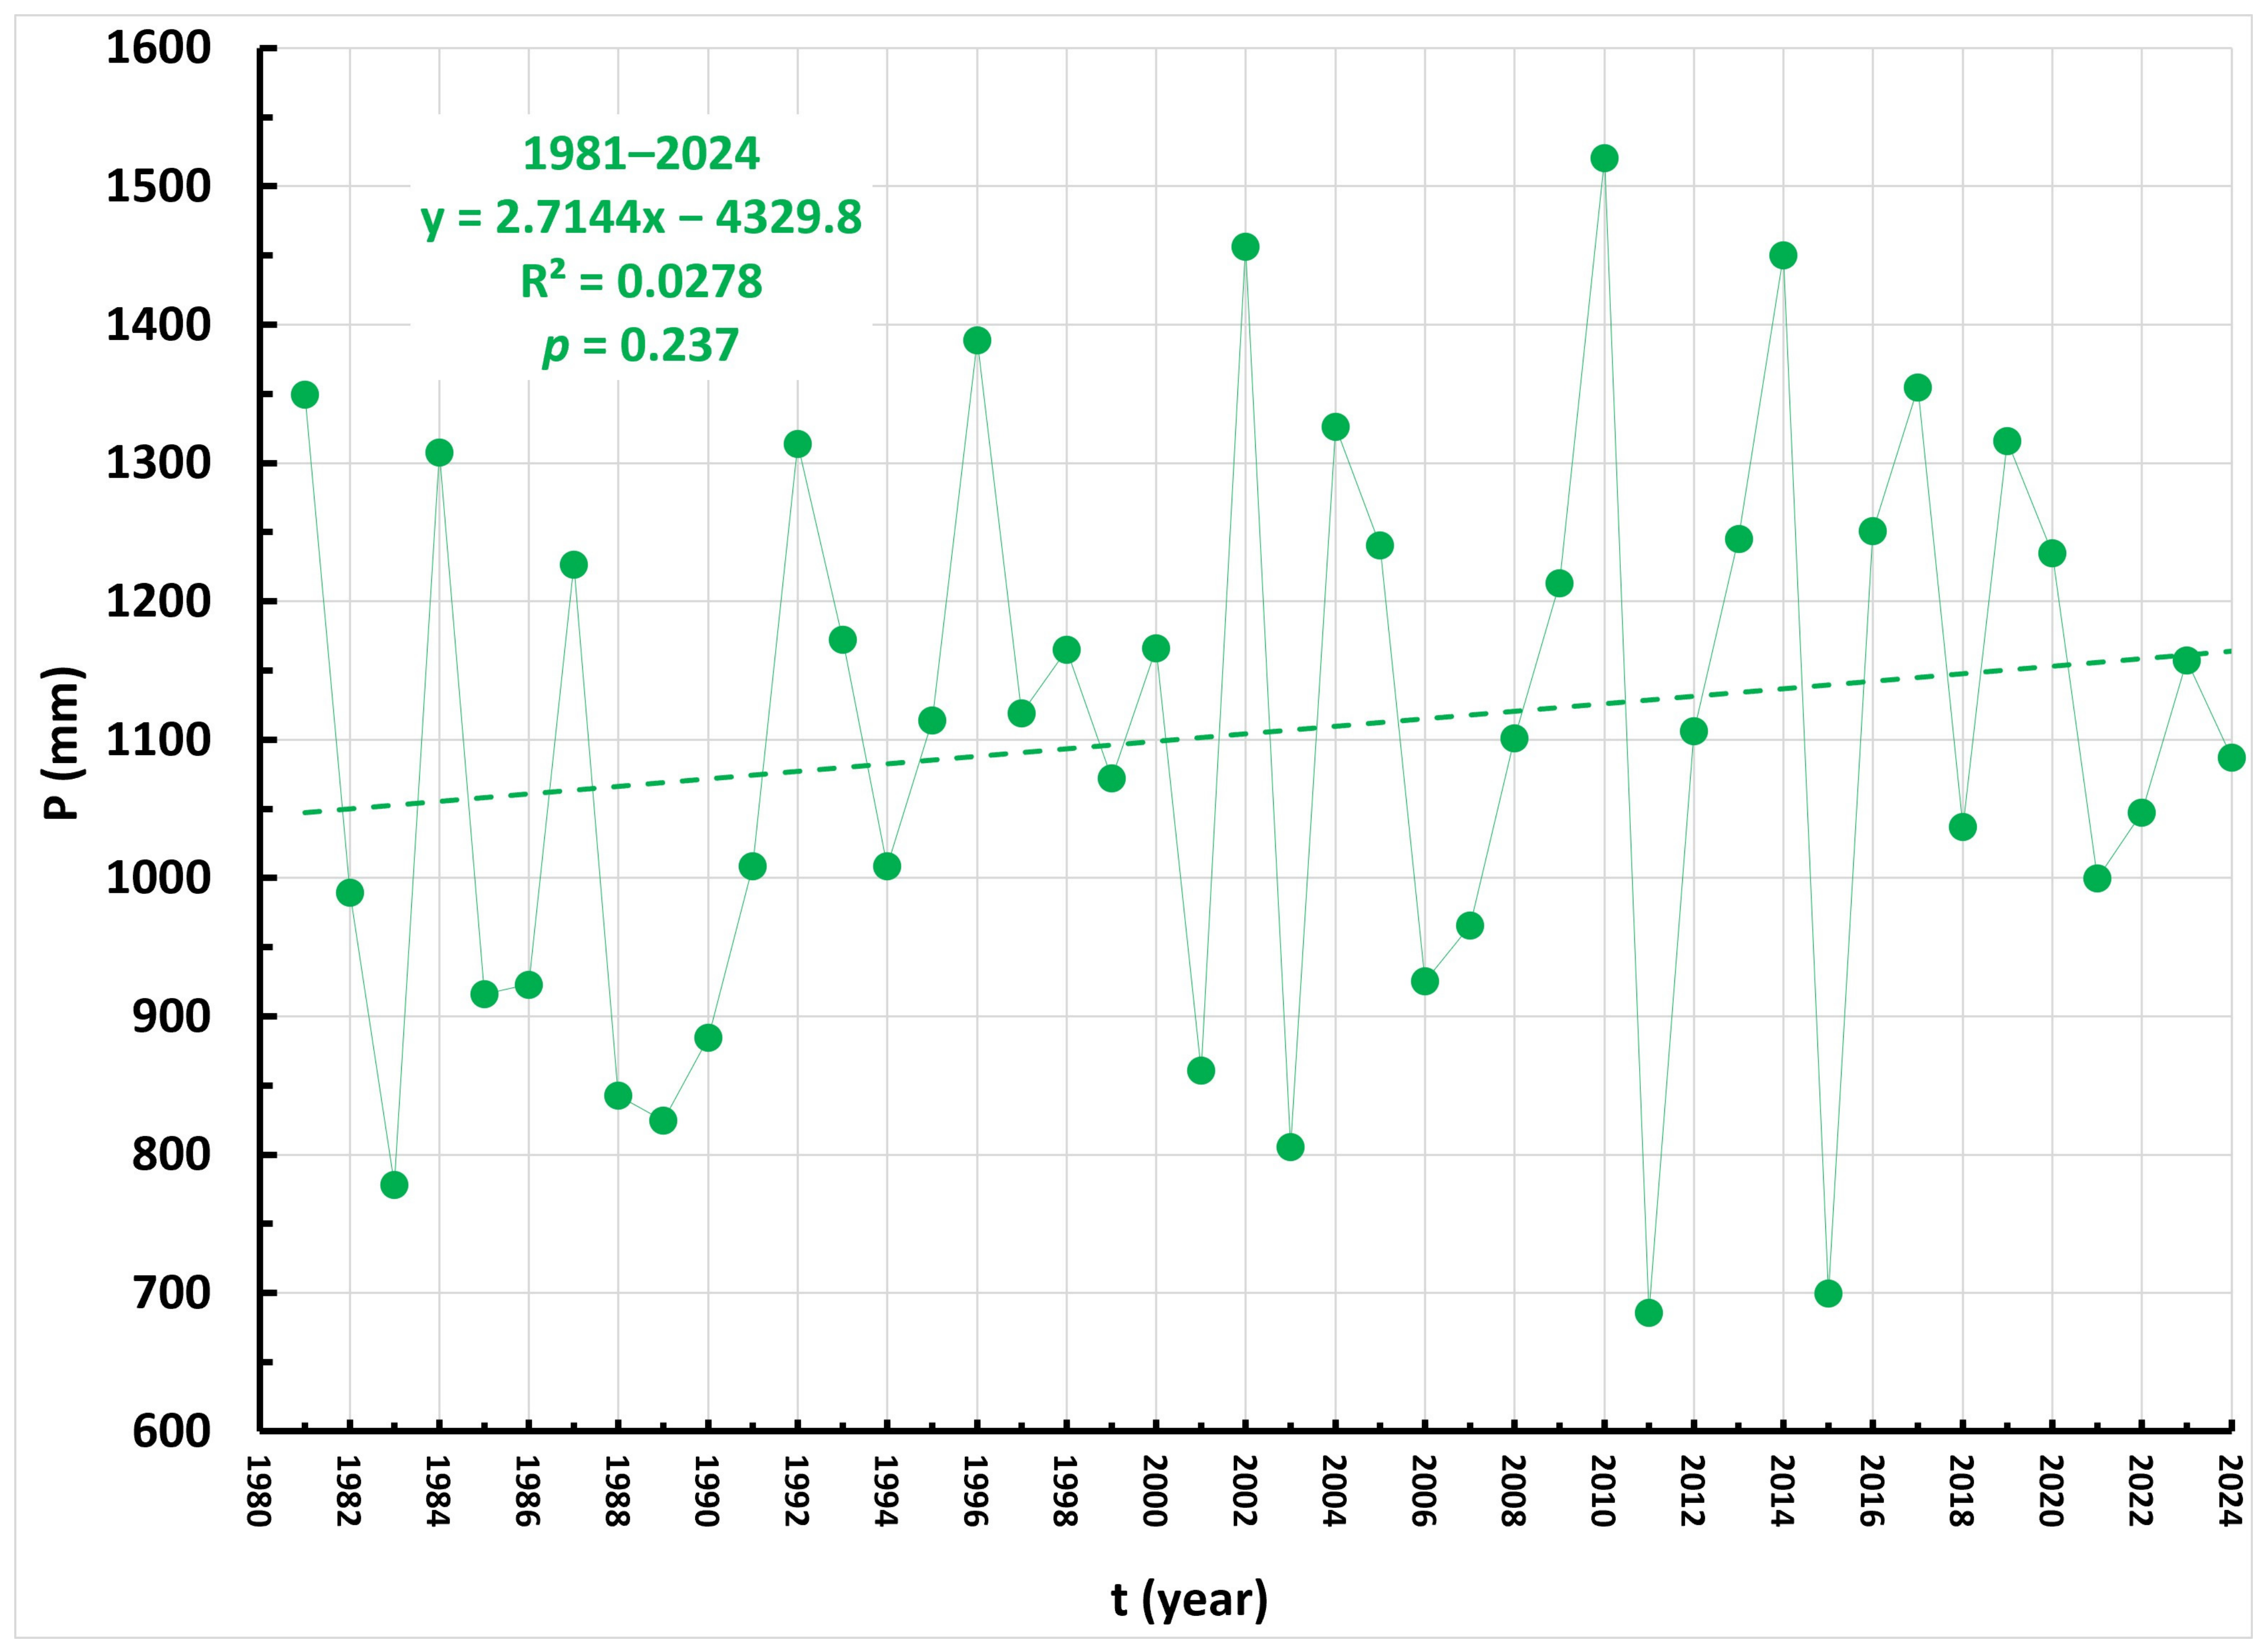
Figure 13 presents the time series of annual precipitation totals measured at the Cres climatological station during the period 1981–2024. The average annual precipitation amounts to 1105.8 mm, ranging from 685.7 mm (2011) to 1520.4 mm (2010). It is important to note that the increasing trend in annual precipitation is not statistically significant, as indicated by the M-K probability value (
p = 0.237).
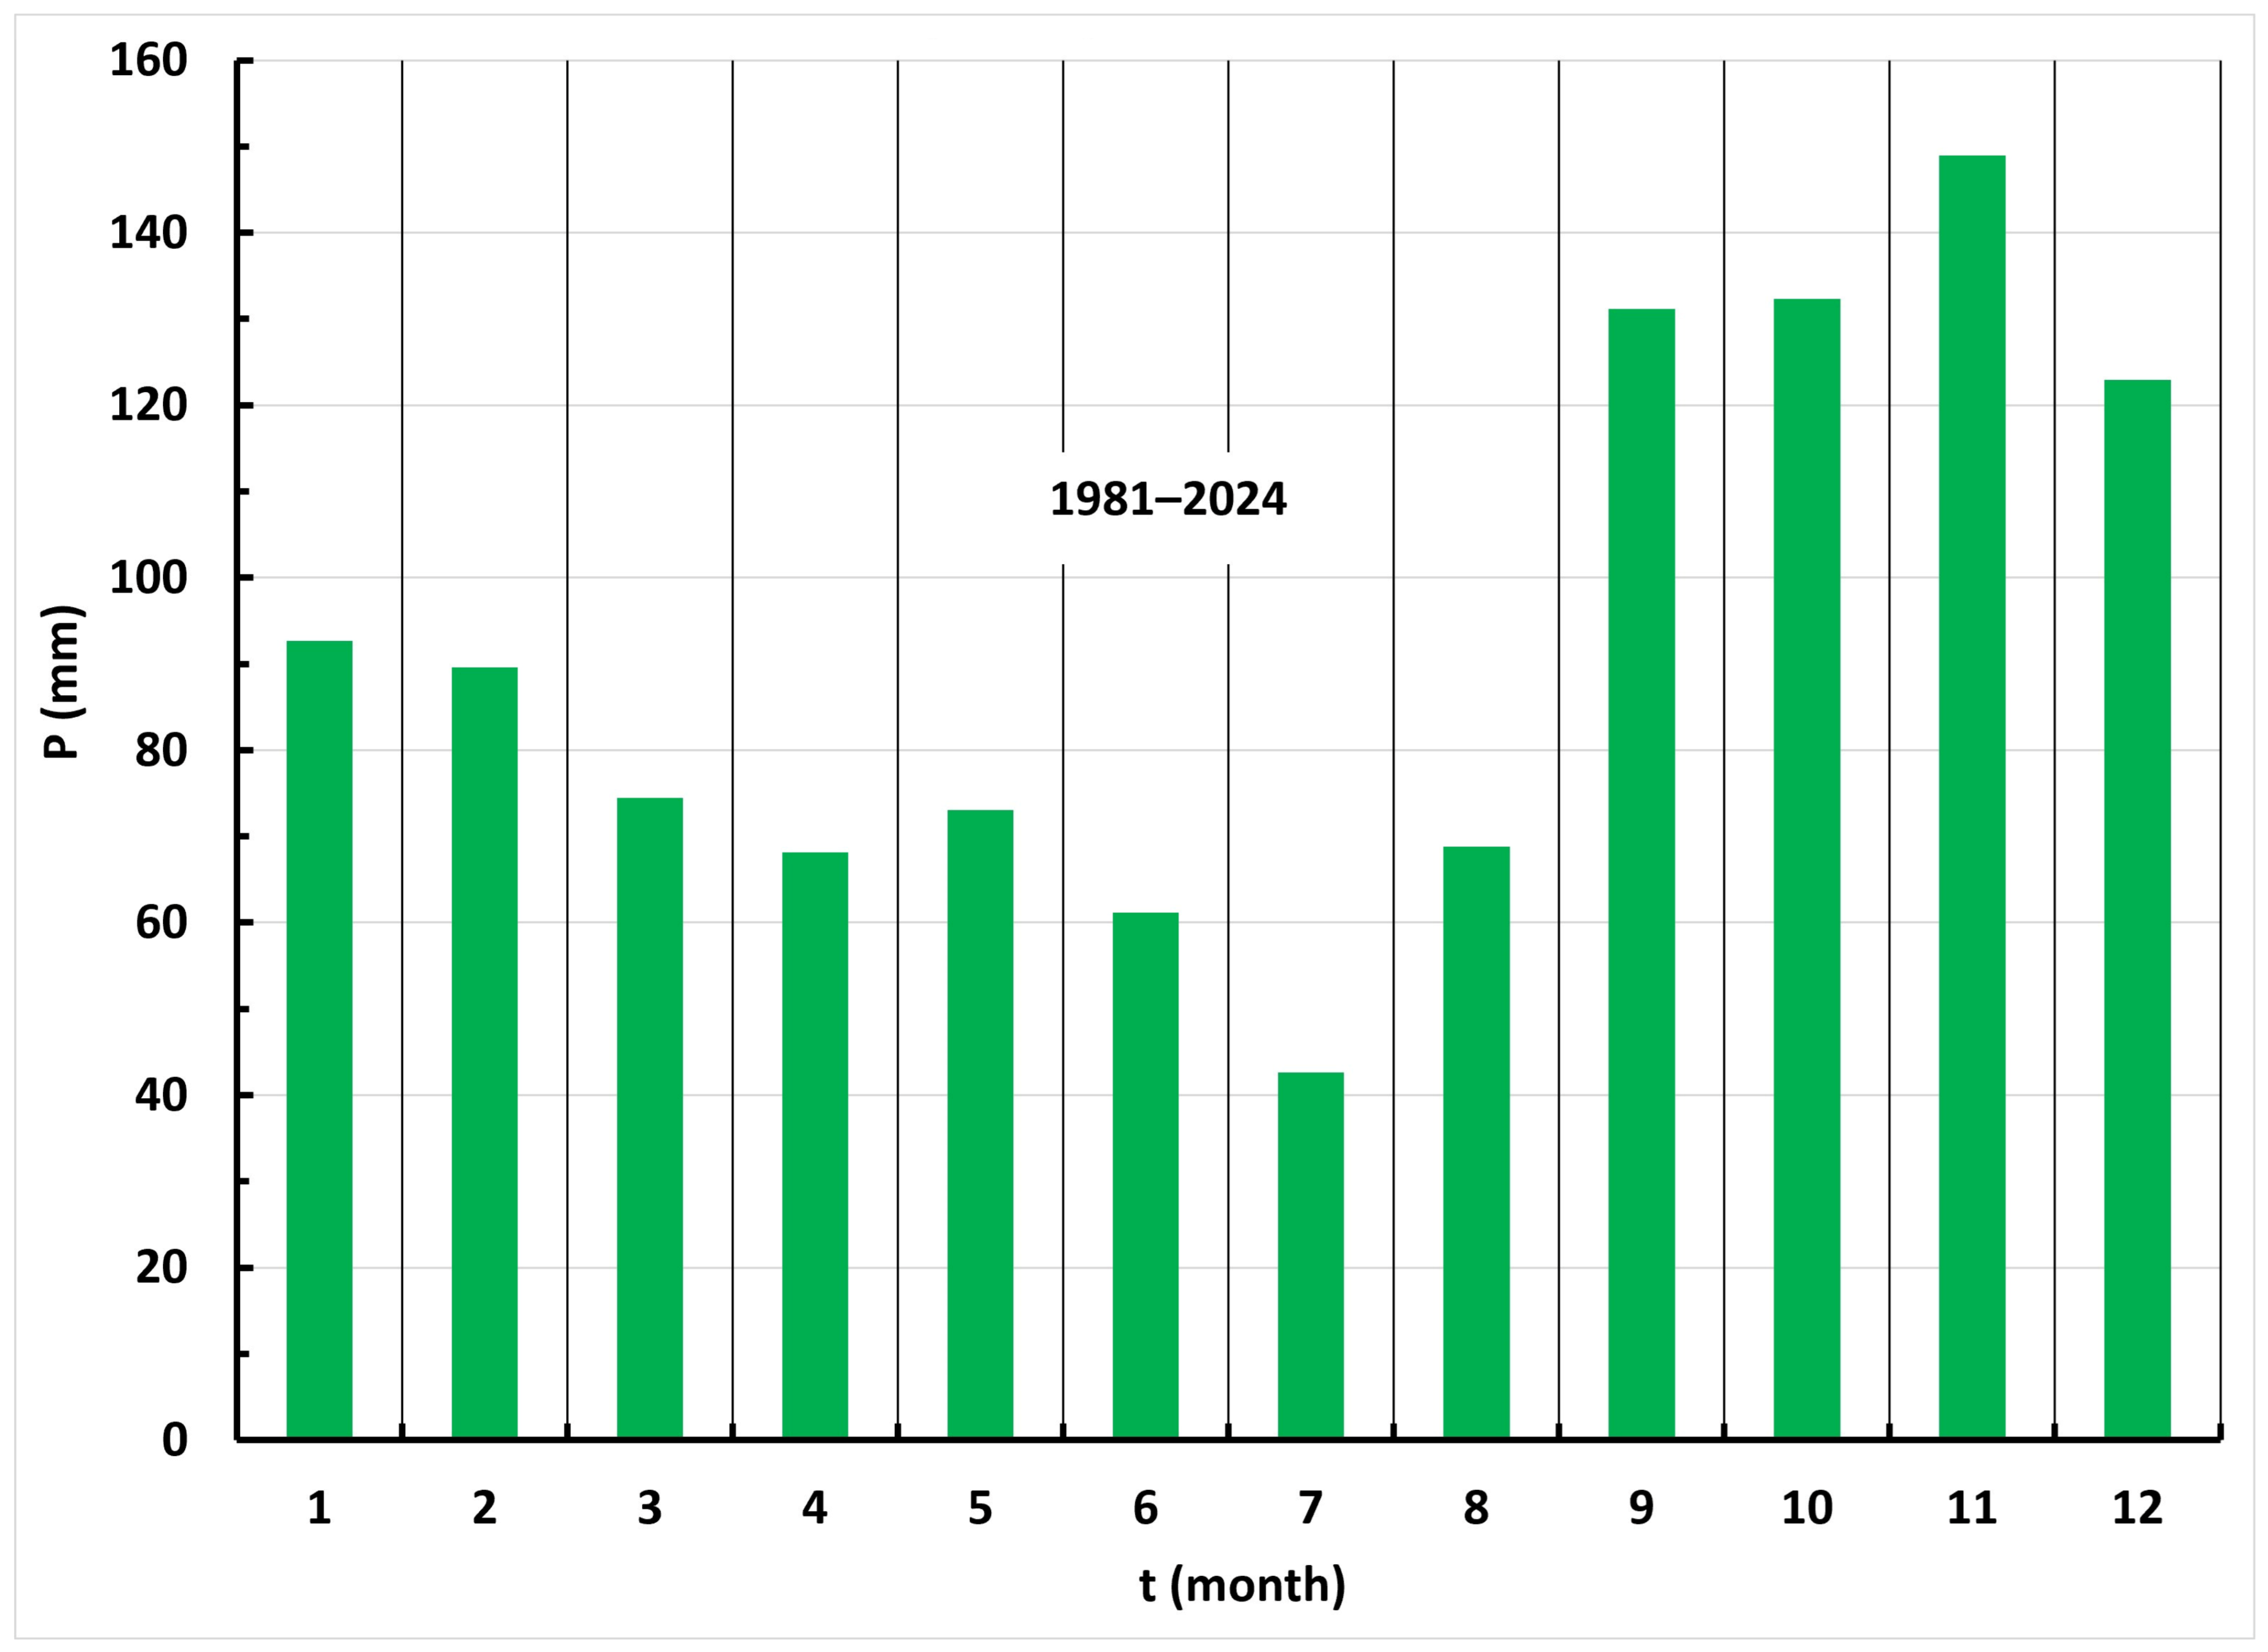
The bar graph of average monthly precipitation observed at the Cres station during 1981–2024 (
Figure 14) shows that maximum precipitation occurs from September to December, while July represents the driest month. This precipitation regime is typical of the northern Mediterranean climate.
5.4. Drought Analyses
Numerous studies indicate that droughts have become more frequent and more severe in the Mediterranean region, particularly on small islands, over the past three decades [
58,
59,
60,
61,
62]. Using three drought indices on an annual time scale, drought conditions on Cres Island were analysed for the last 44 years (1981–2024).
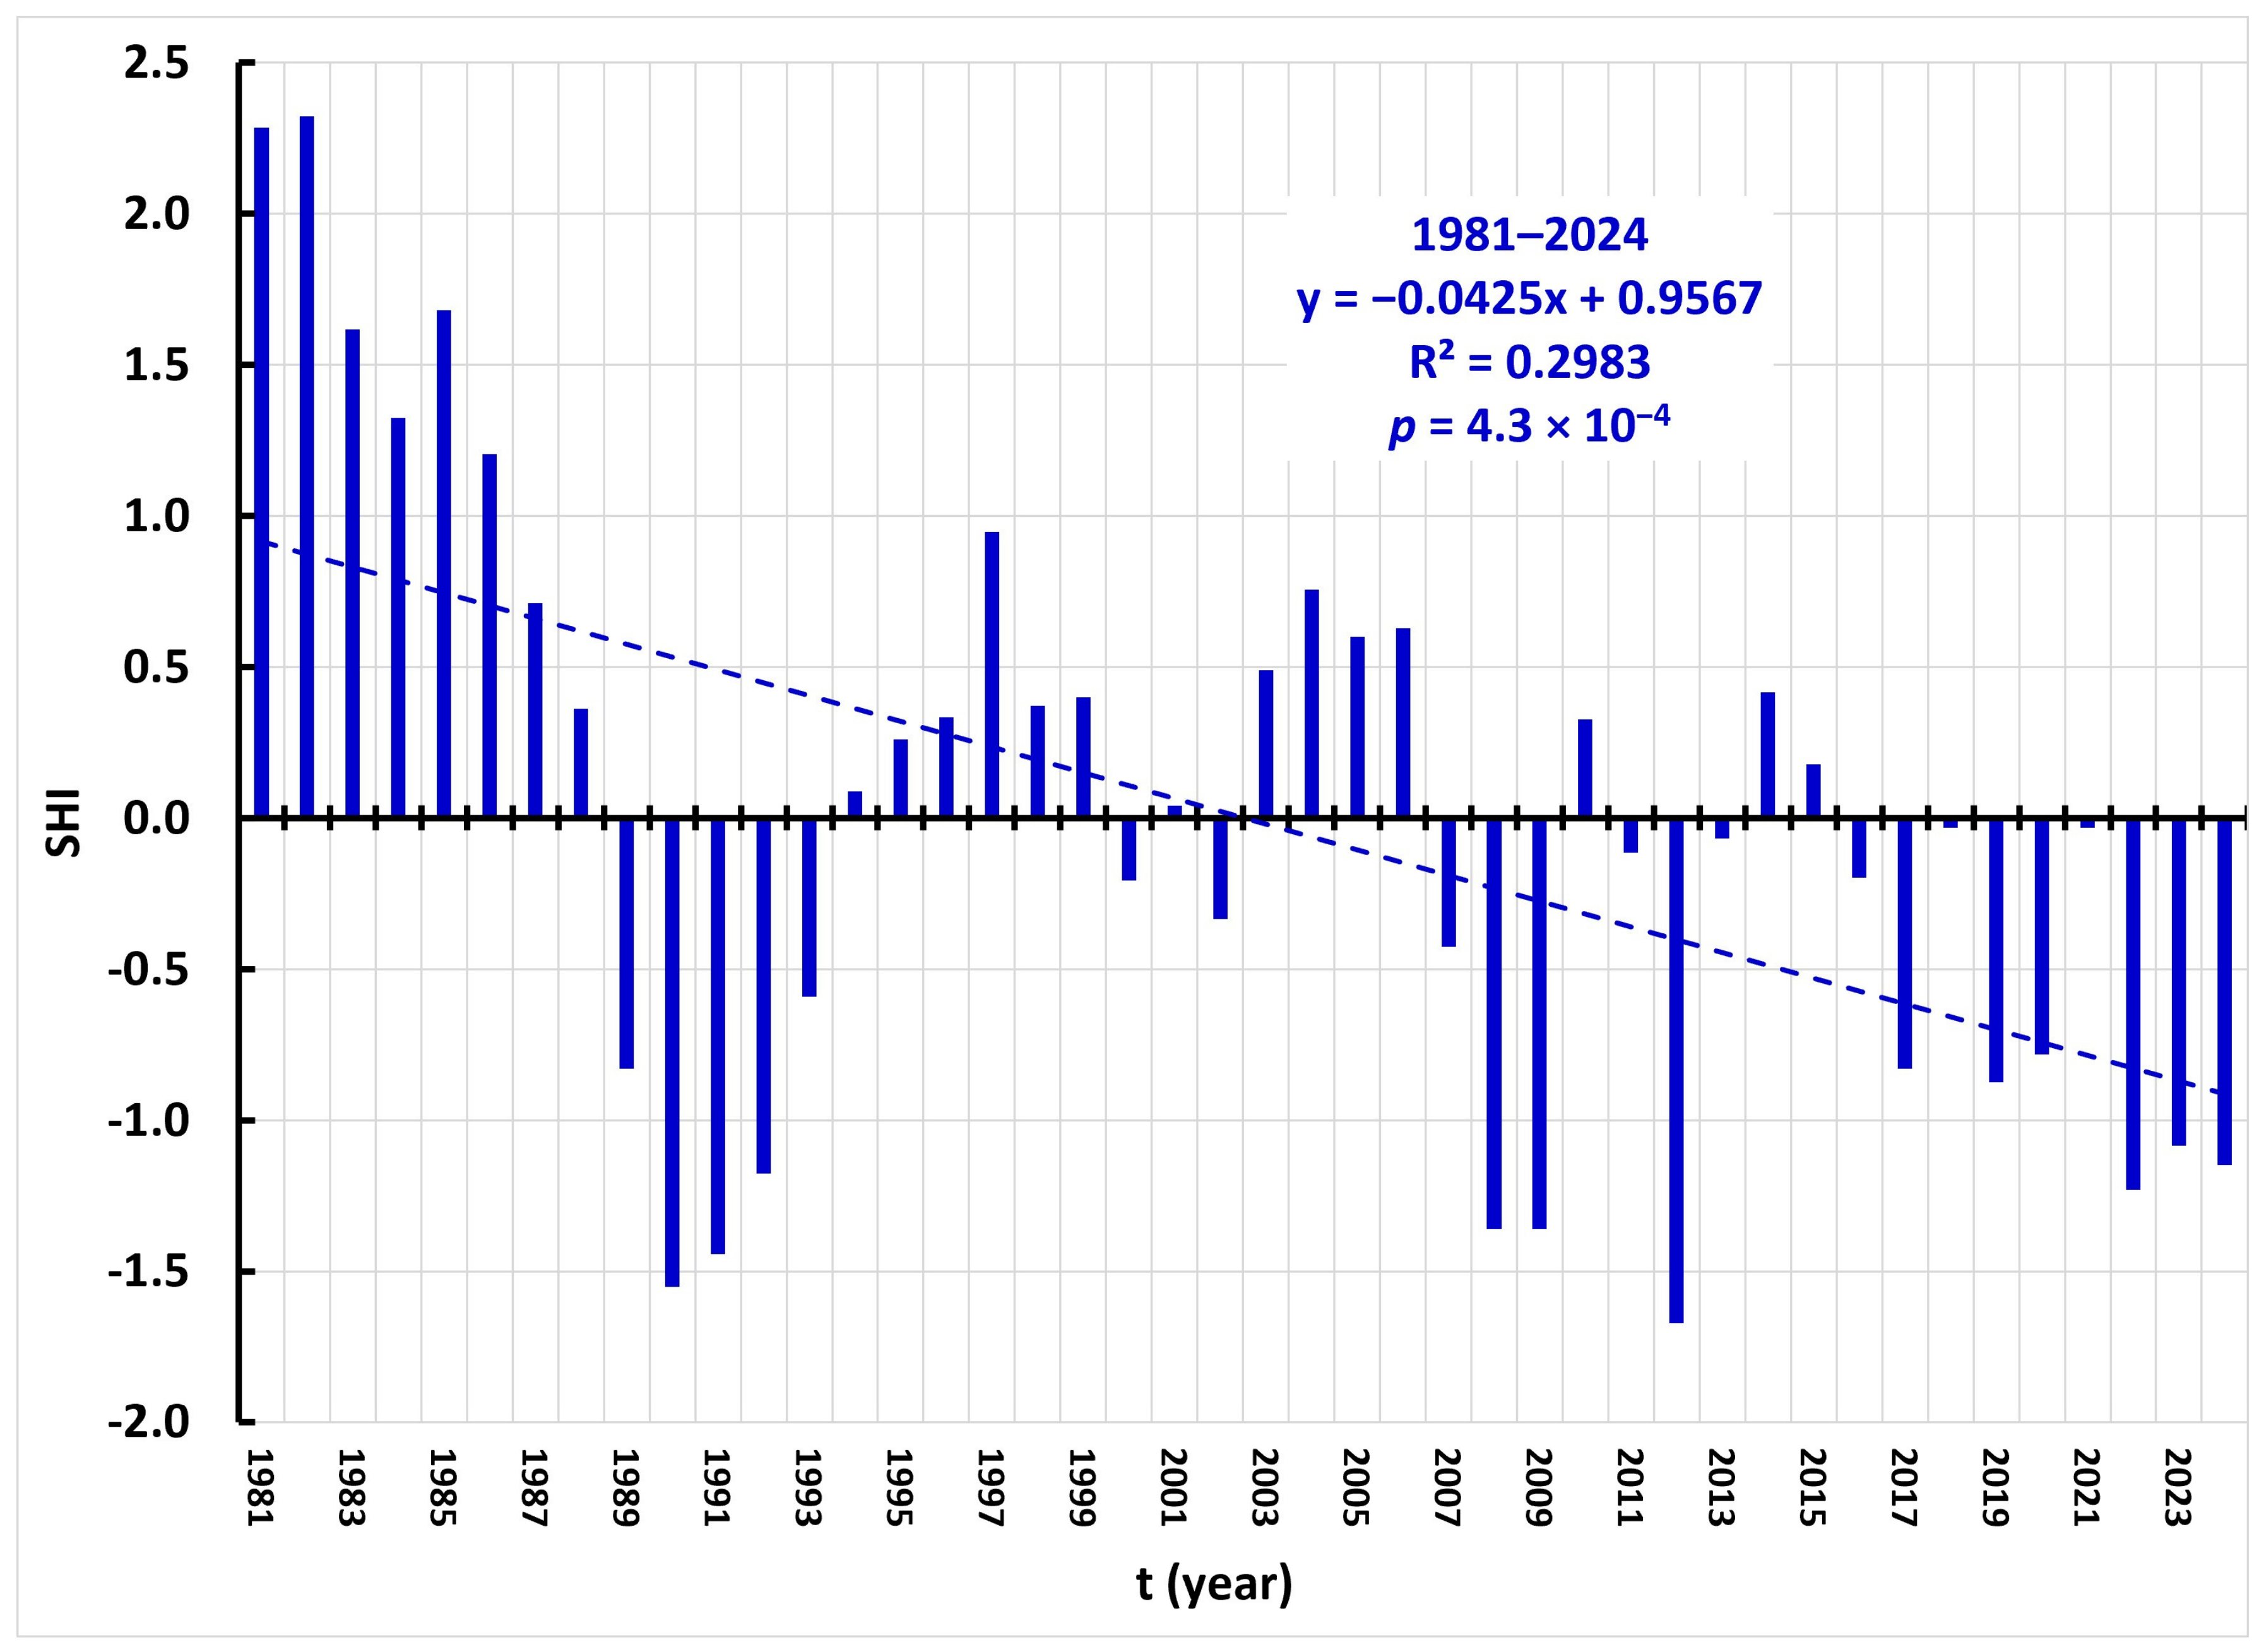
Figure 15 shows the annual SHI series calculated from water-level data measured at the Vrana Lake gauging station during 1981–2024. The decreasing trend is statistically significant, with an M-K probability value of
p = 4.3 × 10
−4. It should be noted that since 2007, most years indicate drought conditions (SHI < 0). However, according to the drought classification, extreme drought did not occur in any year, while severe drought occurred only in 1990 and 2012.
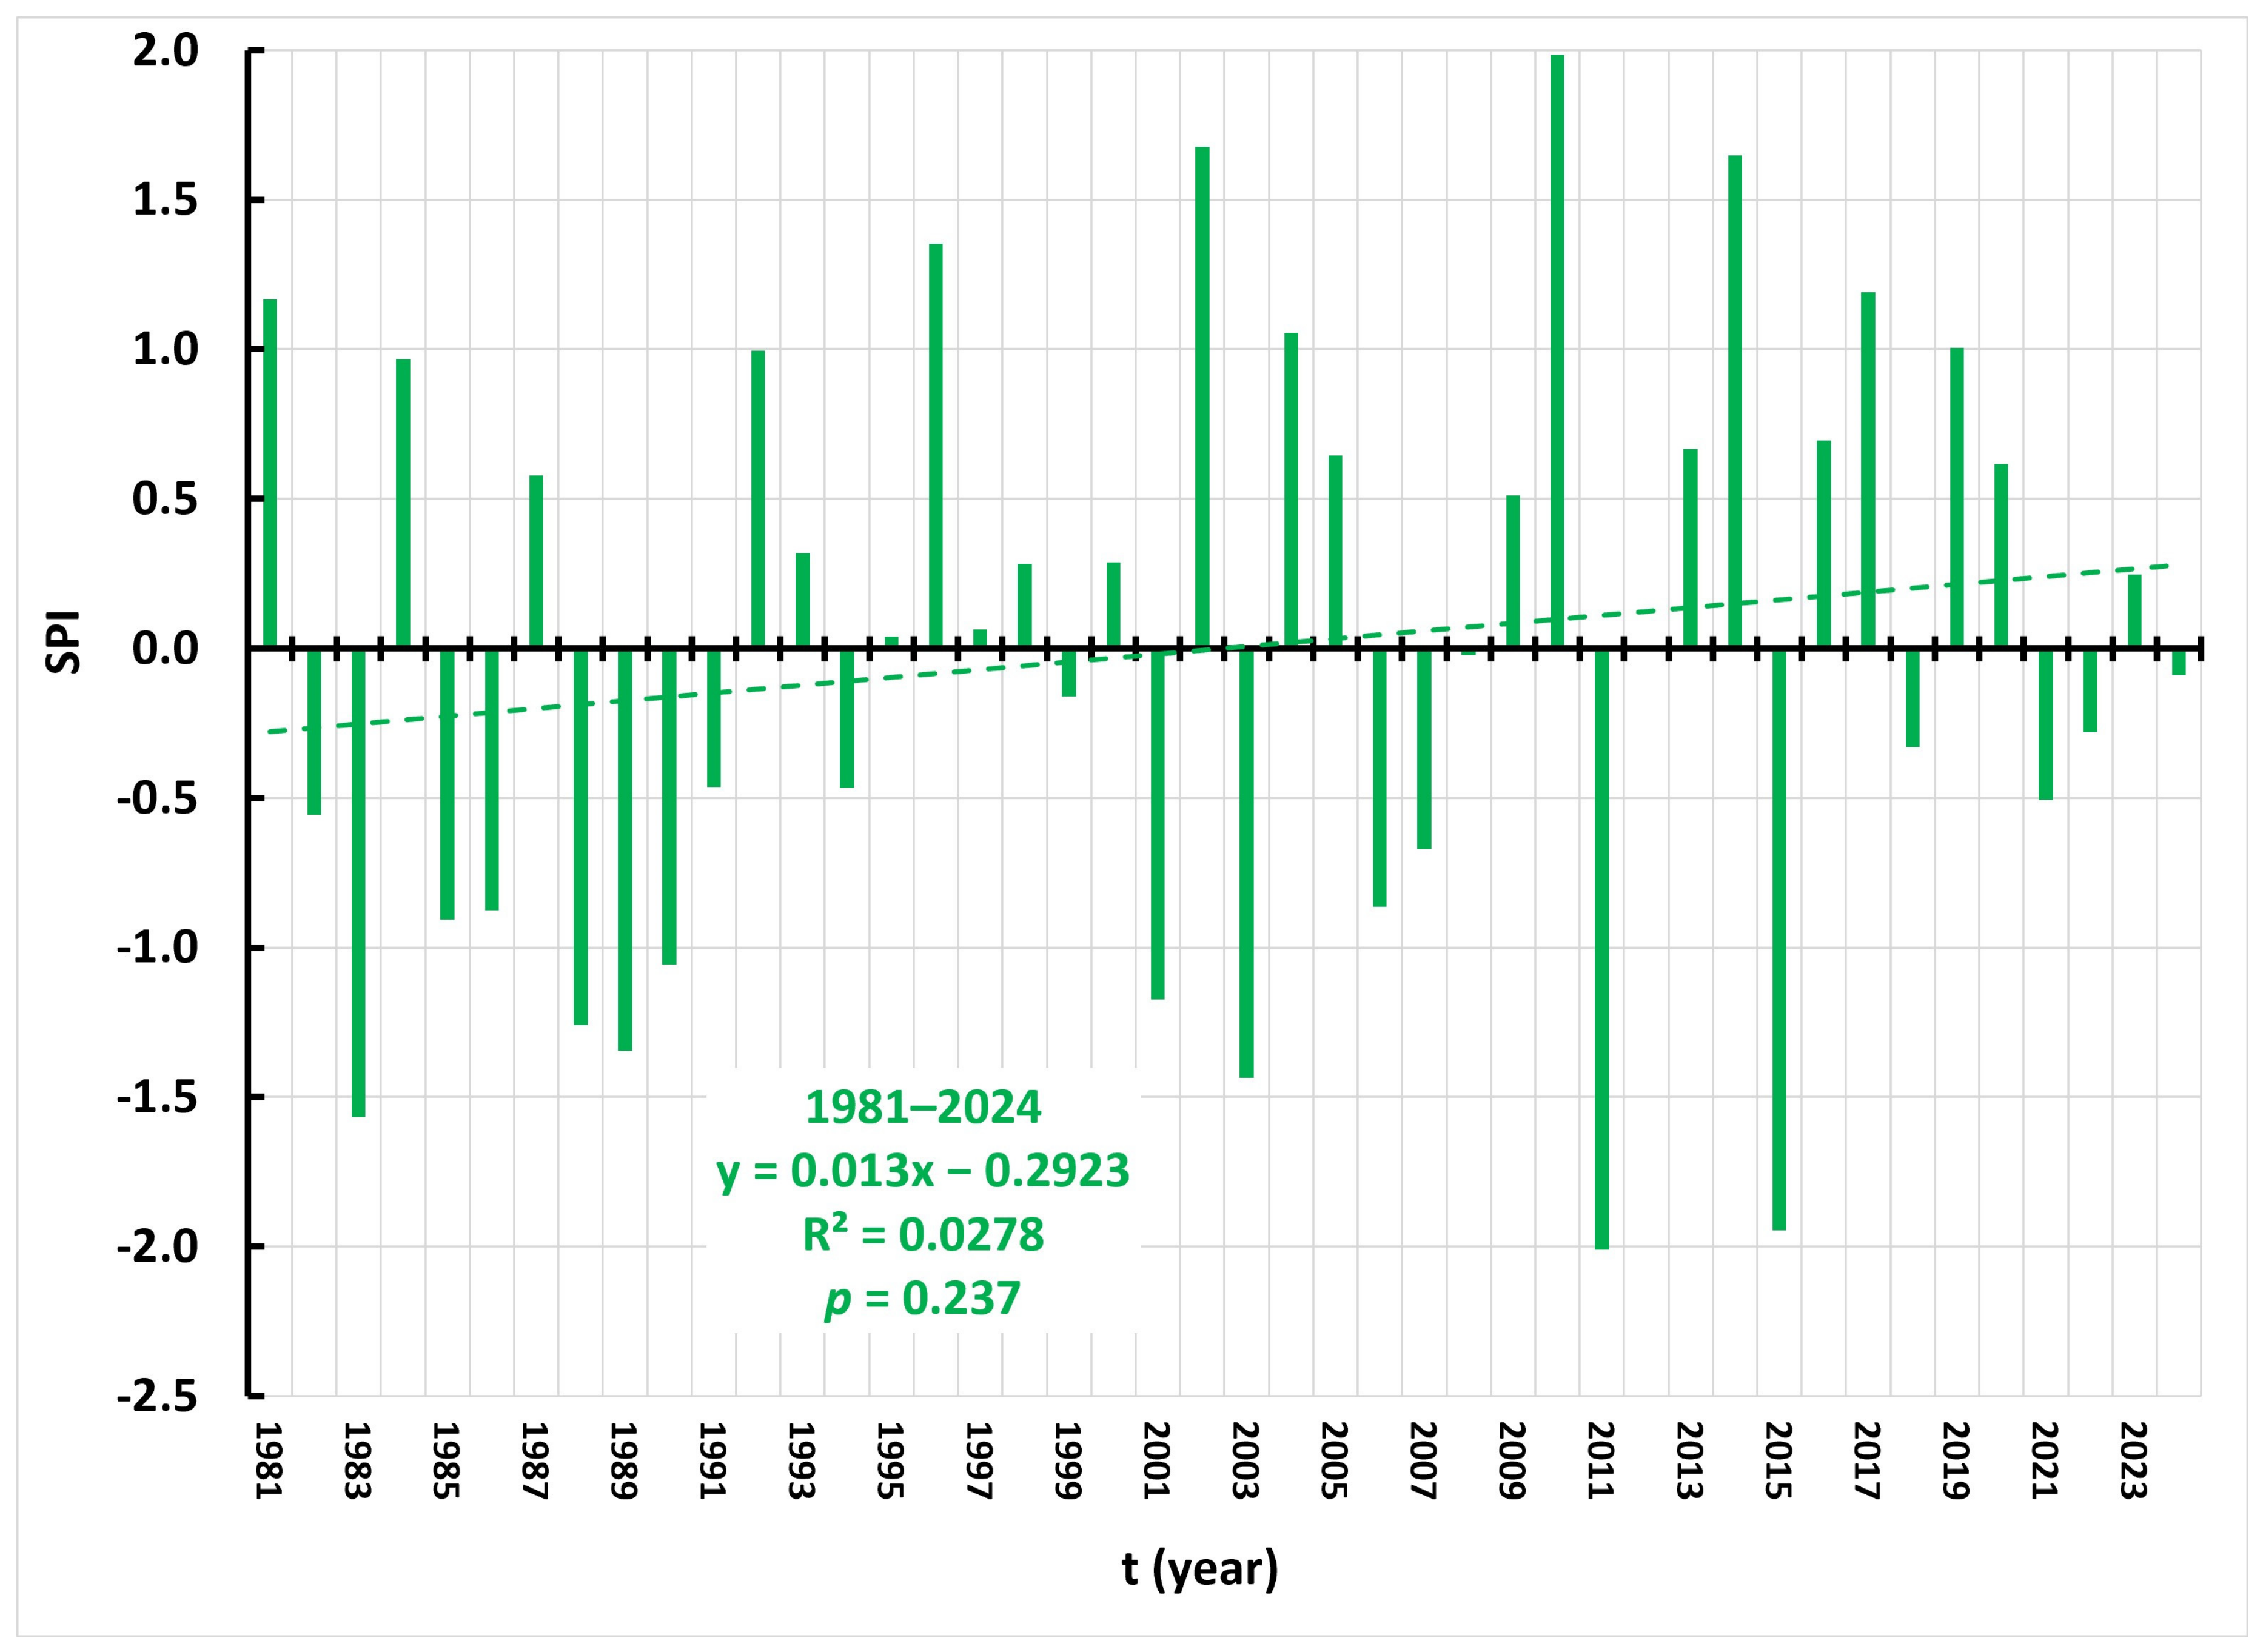
Figure 16 presents the annual SPI series calculated from precipitation data measured at the Cres climatological station during 1981–2024. In this case, a non-significant increasing trend is observed (
p = 0.237). Extreme meteorological drought occurred only in 2011.
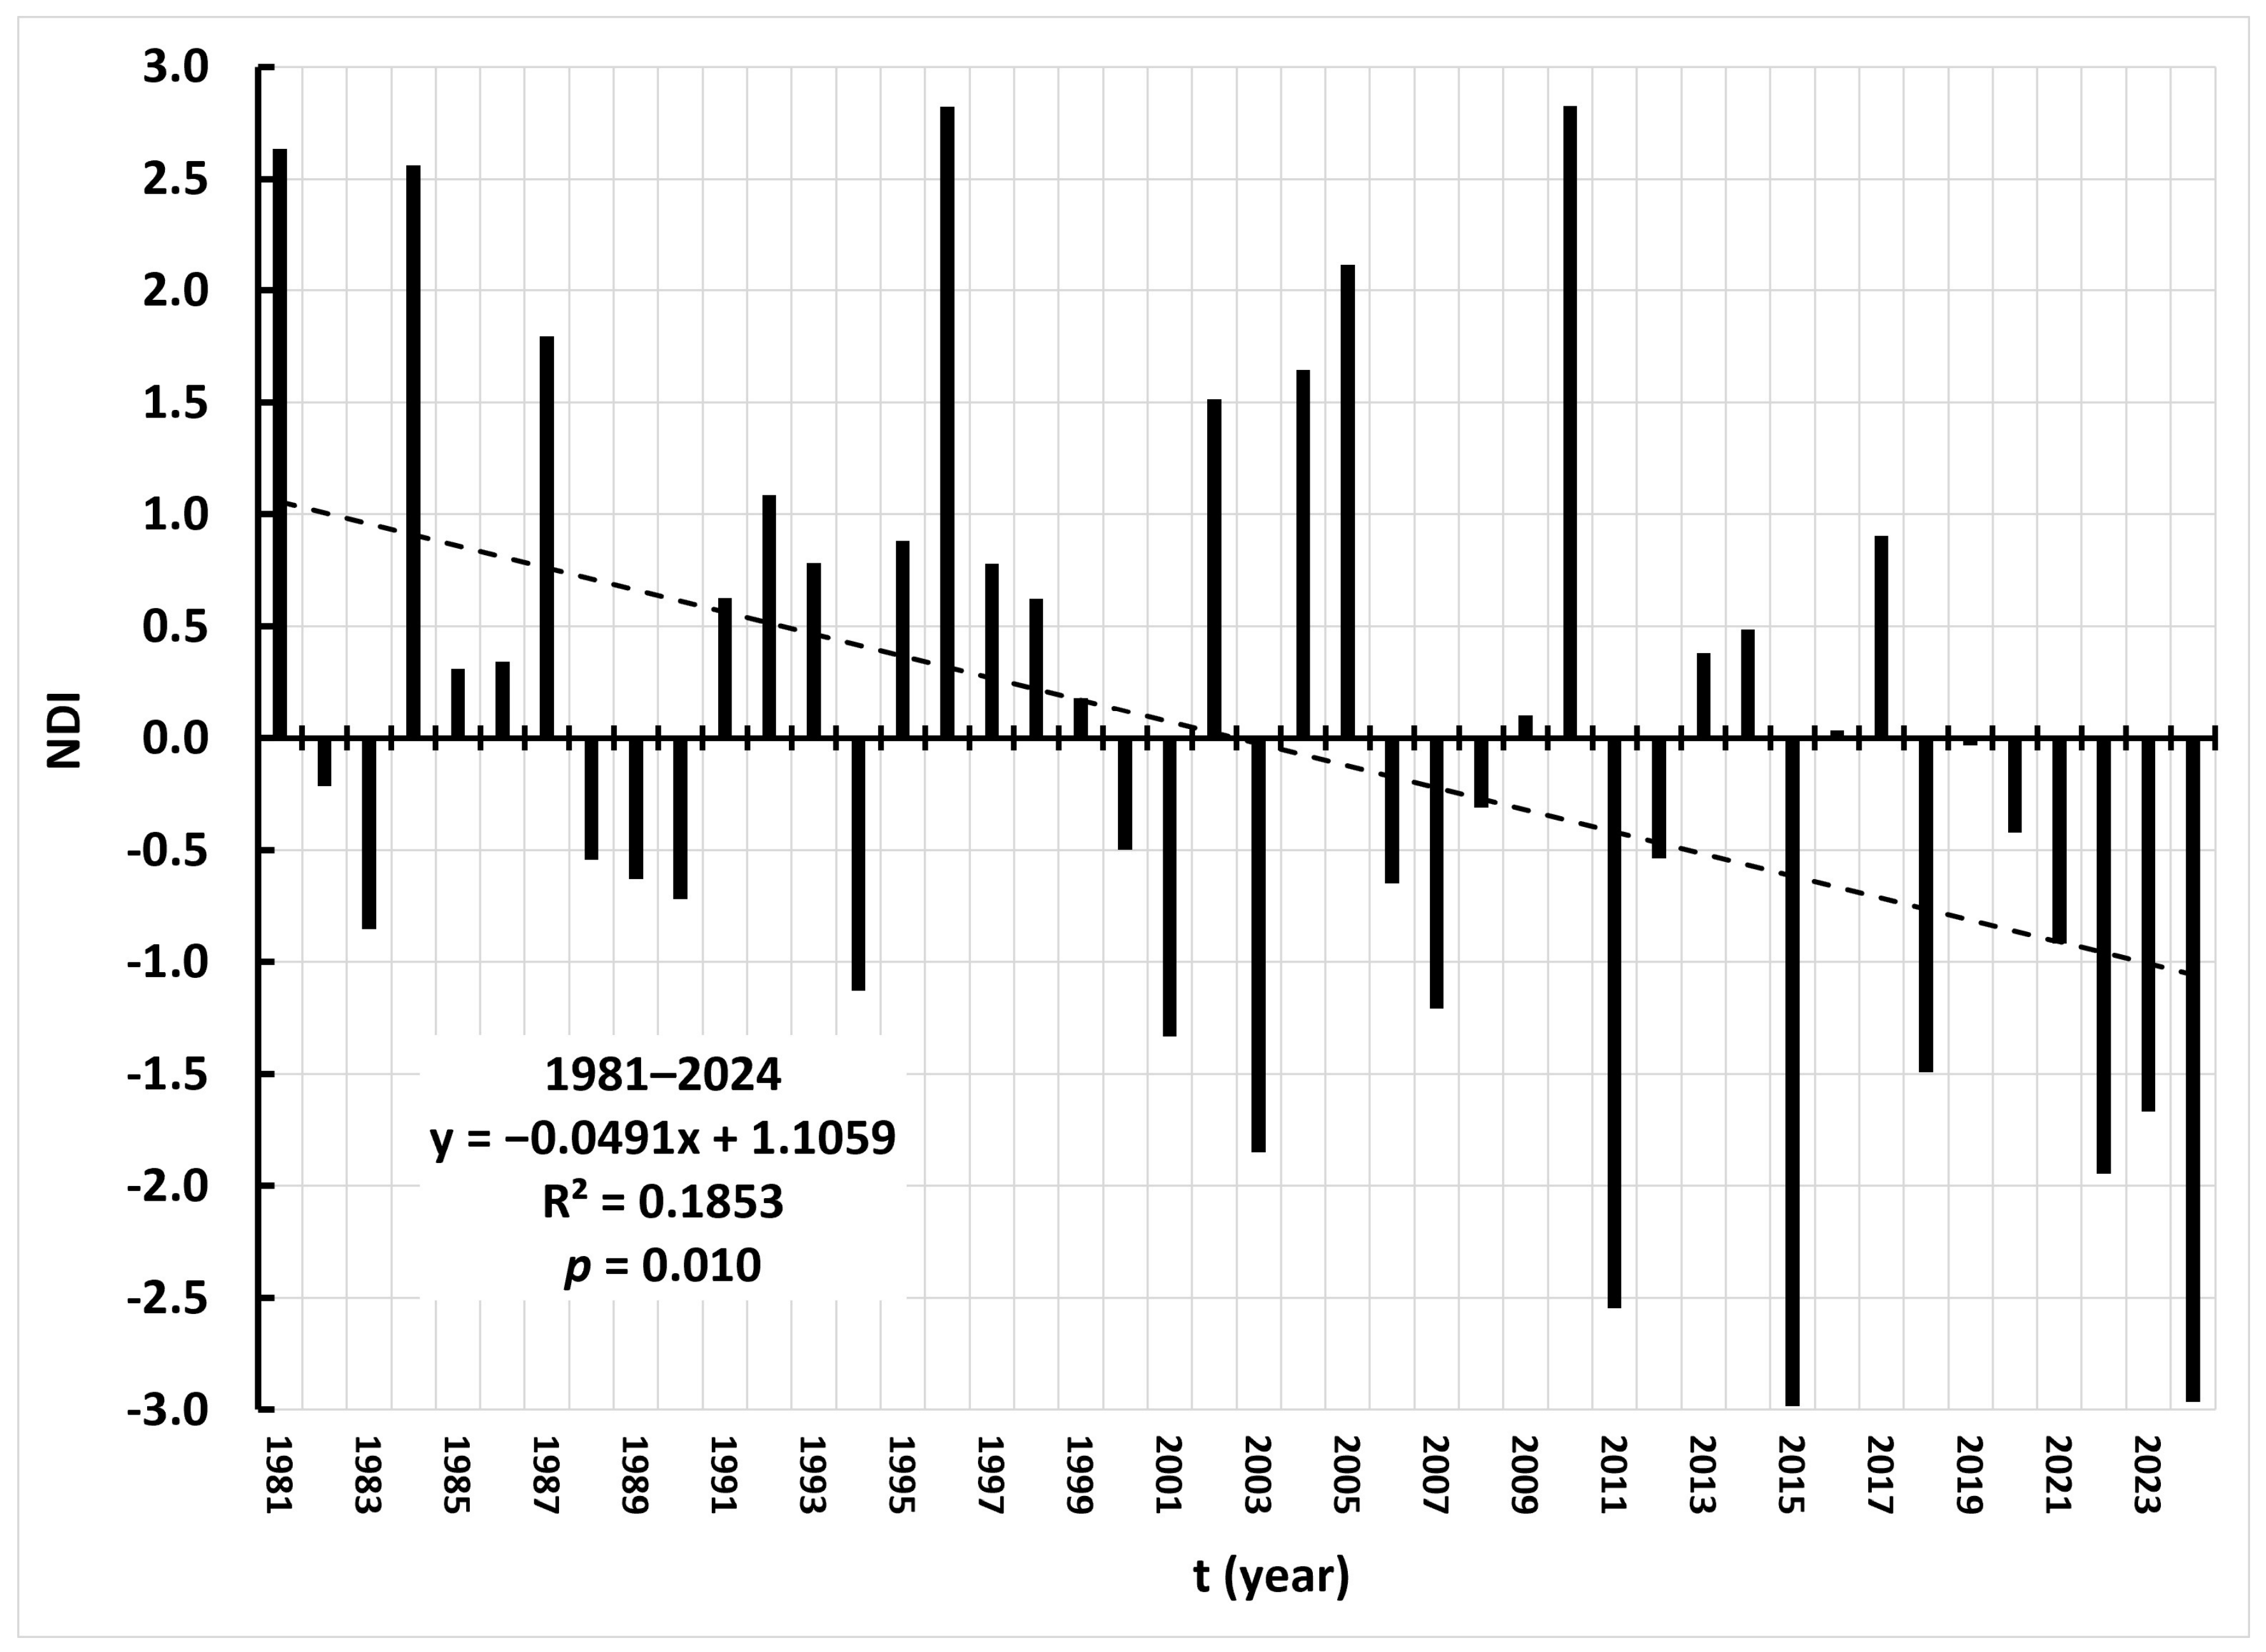
Figure 17 shows the annual NDI series calculated from precipitation and air-temperature data measured at the Cres climatological station during 1981–2024. The decreasing trend is statistically significant (
p = 0.010). Since 2006, most years indicate drought conditions (NDI < 0). According to the drought classification, extreme drought occurred in three years: 2011, 2015, and 2024.
The different drought indices clearly characterize drought conditions differently on this small island. Based on the analysis of the three indices (SHI, SPI, and NDI) for the period 1981–2024, it can be concluded that the hydrological and climatic system of Cres Island is under increasing drought pressure, although individual components of the system exhibit different sensitivities. The statistically significant negative trend in SHI confirms a progressive deterioration of hydrological conditions in the lake, with most years after 2007 characterized by negative index values. In contrast, SPI shows no statistically significant trend, indicating that changes in precipitation alone cannot explain the observed decline in lake water levels.
The composite NDI index, which integrates precipitation and air temperature, shows a statistically significant negative trend and a more pronounced occurrence of extreme droughts, highlighting the critical role of rising temperature and enhanced evapotranspiration in intensifying drought conditions. These results demonstrate that drought on Cres cannot be interpreted solely as a meteorological precipitation deficit, but rather as the result of the combined influence of precipitation and thermal factors, with the hydrological system of Lake Vrana being particularly sensitive to long-term climatic change.
5.5. Multiple Linear Regression
The multiple linear regression equation calculated for the period 1981–2024 is given by Equation (7):
where
H represents mean annual water level (m a.s.l.),
P annual precipitation (m),
TA average annual air temperature (°C), and
Q the average annual pumping rate (L s
−1). The coefficient of multiple linear determination is RM
2 = 0.310.
Among the predictors, only air temperature (TA) shows a statistically significant negative effect on water level (p = 0.011), whereas precipitation (P) (p = 0.491) and water abstraction (Q) (p = 0.543) do not show a statistically significant linear contribution within this model.
The results of the multiple linear regression indicate that increasing air temperature is the dominant driver of the observed decline in Lake Vrana water levels. The lack of statistical significance for precipitation suggests that total annual precipitation alone is not an adequate predictor of lake-level variability in this karst system. Recharge processes depend not only on precipitation amounts but also on seasonal distribution, infiltration dynamics, antecedent moisture conditions, and shifting groundwater flow divides.
The absence of a statistically significant trend in SPI indicates that precipitation deficits alone cannot explain the observed long-term decline in lake level, whereas the significant negative trends observed in SHI and NDI demonstrate that drought intensification is primarily controlled by rising temperatures and associated evapotranspiration losses.
The non-significance of water abstraction likely reflects the fact that abstraction, although hydrologically relevant, is relatively small compared with total lake storage and may not explain interannual variability as strongly as temperature-driven losses within a simple annual regression framework.
Accordingly, the regression results are fully consistent with the drought analysis and indicate that the long-term evolution of lake Vrana water levels is predominantly controlled by temperature-driven increases in evaporative demand and changes in the system water balance, while precipitation and water abstraction act as secondary or modulating factors.
6. Conclusions and Future Research Directions
The results of this study demonstrate that the hydrological system of Lake Vrana on the island of Cres is subject to strong and statistically significant long-term climatic and anthropogenic pressures. Over the period 1978–2024, lake water levels exhibit a consistent and statistically significant decline in all months, with linear regression slope and Sen’s slope estimates showing close agreement, confirming the robustness of the detected trend.
In contrast, annual precipitation exhibits a statistically non-significant increasing trend, while both air and water temperatures show pronounced and persistent increases. These results indicate that lake-level decline cannot be explained primarily by precipitation variability, but rather by the combined effects of rising temperature, enhanced evapotranspiration, changes in the system’s energy regime, and anthropogenic water abstraction for the Cres and Lošinj water supply.
Analysis of day-to-day variability of lake water level, air temperature, and water temperature further revealed markedly different responses of the atmospheric and lake systems. While air temperature shows a decrease in daily variability, water temperature exhibits an increasing trend, which may indicate changes in seasonality, a phase shift between atmospheric forcing and the lake response, and potential modifications in the lake’s stratification regime. The lake behaves as a thermal reservoir that integrates long-term climatic signals while simultaneously displaying increasingly pronounced oscillations in its internal dynamics.
Drought analysis confirms that the hydrological system of Lake Vrana is more sensitive than the meteorological precipitation regime alone would suggest. Negative trends in SHI and NDI, combined with the absence of a significant SPI trend, indicate that drought conditions on Cres are primarily temperature-driven, supporting the hypothesis that small karst islands respond nonlinearly and with enhanced sensitivity under warming conditions.
Considering that Lake Vrana represents the principal source of drinking water for the islands of Cres and Lošinj, the identified trends have direct implications for the long-term security of the regional water supply. The results highlight the need for integrated water resource management, including continuous monitoring of hydrological and climatological parameters, the development of climate projection scenarios, and the implementation of appropriate adaptation measures.
Due to its unique hydrogeological configuration and large freshwater accumulation within a small karst island, Lake Vrana represents an exceptionally sensitive indicator of climate change in Mediterranean karst environments. The combined evidence from water-level trends, drought indices, and regression results indicates that the system is primarily controlled by temperature-induced changes, while precipitation regime variability and water abstraction play a secondary but relevant role in the observed decline in lake level. Importantly, direct human pressure associated with recreational activities is absent, as access to Lake Vrana and its catchment is strictly prohibited throughout the year, ensuring that the hydrological regime is not influenced by direct human disturbance [
3].
Future research should focus on (1) lake energy balance and thermal stratification modelling, (2) quantification of evapotranspiration fluxes, (3) nonlinear and stochastic modeling of system stability, (4) coupling of high-resolution regional climate and hydrogeological catchment models, (5) analysis of groundwater flow paths and dynamic groundwater divides under warming, and (6) interdisciplinary approaches that include ecological, biogeochemical, and socio-economic aspects of system sustainability.
Despite the robustness of the statistical analysis and the relatively long recent data series, several limitations remain. First, the analysis is based on a single hydrological station and climatological station, which limits the spatial representativeness of the results. This is particularly important in karst environments, where strong spatial heterogeneity, anisotropy, and localized recharge produce variable groundwater responses.
Second, the applied drought indices rely on standardized statistical parameters without direct measurements of evapotranspiration, soil moisture, or groundwater fluxes. Third, linear trend analysis assumes stationarity and does not capture potential nonlinear transitions or thresholds in system behaviour. In addition, the lack of interannual water abstraction data introduces an additional uncertainty in interpreting causal relationships. Finally, the study does not include numerical hydrogeological modelling that could provide quantitative estimates of future system scenarios. Previous artificial neural network modelling of water levels in Lake Vrana demonstrated that reliable forecasts are generally limited to approximately one month ahead, indicating the complexity and nonlinear behaviour of the system under changing hydrological and climatic conditions [
63].
Future work should therefore prioritize improved spatial representation through denser monitoring networks, integration of remote sensing products, and the application of distributed or coupled hydrogeological–climate models.
These limitations do not reduce the validity of the obtained results but rather highlight the need for integrated, data-rich, and model-supported approaches to better assess the resilience and future stability of this unique karst freshwater system.




 ,
,