Article

Extreme Precipitation Dynamics and El Niño–Southern Oscillation Influences in Kathmandu Valley, Nepal

1
Department of Convergence & Fusion System Engineering, Graduate School, Kyungpook National University, Sangju 37224, Republic of Korea
2
Institute for Global Climate Change & Energy, Kyungpook National University, Daegu 41566, Republic of Korea
3
Cooperative Agricultural Research Center, College of Agriculture, Food, and Natural Resources, Prairie View A & M University, Prairie View, TX 77446, USA
4
Department of Nano & Advanced Materials Science and Engineering, Kyungpook National University, Sangju 37224, Republic of Korea
*
Author to whom correspondence should be addressed.
Water 2025, 17(9), 1397; https://doi.org/10.3390/w17091397
Submission received: 30 March 2025 / Revised: 30 April 2025 / Accepted: 5 May 2025 / Published: 6 May 2025
(This article belongs to the Special Issue Advances in Extreme Hydrological Events Modeling)

Abstract

:
Understanding historical climatic extremes and variability is crucial for effective climate change adaptation, particularly for urban flood management in developing countries. This study investigates historical precipitation trends in the Kathmandu Valley, Nepal, focusing on precipitation frequency, intensity, and the influence of the El Niño–Southern Oscillation (ENSO), using extreme precipitation indices and the precipitation concentration index (PCI). The results reveal sharply fluctuating short-term precipitation from 1980 to 2022, with the exception of an increasing trend during spring (1.17 mm/year) and a decreasing trend in November and December. Trends in extreme precipitation indices are mixed: RX7day shows an increasing trend of 0.1 mm/year, with decadal analysis (1980–2001 and 2002–2022) indicating similar upward patterns. In contrast, RX1day, RX3day, RX5day, and R95pTOT exhibit inconsistent trends, while R99pTOT demonstrates a decreasing trend over the full period (1980–2022). Although the number of days with precipitation ≥ 35 mm has declined, the increasing trend in 7-day maximum precipitation, coupled with no significant change in total annual precipitation and highly variable short-term rainfall, points to a rising risk of unexpected extreme precipitation events. Precipitation patterns in the Kathmandu Valley remain highly irregular across seasons, except during summer. ENSO exhibits a negative correlation with annual precipitation, extreme precipitation indices, and the PCI but shows a positive correlation with the annual and summer PCI as well as 1-day maximum precipitation, emphasizing its significant influence on precipitation variability. These findings highlight the urgent need for targeted climate adaptation strategies and provide valuable insights for hydrologists, meteorologists, policymakers, and urban planners to enhance climate resilience and improve flood management in the Kathmandu Valley.

1. Introduction

Climate change is reshaping precipitation patterns at local, regional, and global scales, with significant consequences for hydrological cycles and extreme weather events [1]. The rapid rise in global average temperatures has increased atmospheric water vapor concentrations, thereby intensifying extreme precipitation events [2]. As a key component of the Earth’s hydrological cycle, precipitation is experiencing dynamic transformations under the influence of global warming, resulting in notable changes in its frequency, intensity, and spatial distribution [3]. The acceleration of climate change further amplifies hydrometeorological disasters such as floods, droughts, and landslides [4]. South Asia, in particular, is among the world’s most disaster-prone regions, witnessing an overall rise in extreme precipitation with spatially heterogeneous patterns [5]. Nepal is especially vulnerable, ranking fourth globally as the most climate hazard-prone country [6].
Numerous studies have explored precipitation patterns using both observed and projected datasets and applied various analytical approaches globally. Sun et al. (2021) [7] investigated extreme precipitation trends at global, continental, and regional scales using the one-day maximum (RX1day) and five-day maximum (RX5day) precipitation indices. Their results show that nearly two-thirds of global observation stations exhibit significant upward trends in extreme precipitation, particularly across Asia, Europe, and North America, with pronounced increases in regions such as central and eastern North America, northern Central America, northern Europe, the Russian Far East, eastern Central Asia, and East Asia. Similarly, Donat (2016) [8] examined total and extreme precipitation variations in wet and dry regions using both observational data and global climate model outputs. The study found that precipitation has historically increased in wet regions and is likely to continue rising, whereas dry regions may experience a sharp increase in extreme precipitation events by the late 21st century. Additionally, Papalexiou and Montanari (2019) [9] analyzed global precipitation trends from 1964 to 2013 and concluded that both the intensity and frequency of precipitation increased significantly over this period.
While global studies highlight broad trends, local investigations reveal more heterogeneous patterns. Safdar et al. (2023) [10] analyzed precipitation trends in Pakistan during the winter and pre-monsoon seasons from 2008 to 2018, reporting a decline in winter precipitation and a reduction in rainy days for both seasons. Similarly, Aditya et al. (2021) [11] employed the Mann–Kendall test and Sen’s slope estimator to examine rainfall variability in West Kalimantan, Indonesia. Their findings indicate a declining annual precipitation trend in the Mempawah region, while the Kubu Raya region exhibited an increasing annual precipitation trend between 2000 and 2019. The study further identified a significant precipitation decrease of −33.2 mm/year in Sungai Kunyit, suggesting a potentially drier future for the area. A comparable downward trend was observed in India’s Thoubal River watershed, where precipitation declined by 10.3 mm/year, accompanied by considerable variability [12]. Another study on India’s precipitation patterns, with ref. [13] analyzing data from 2001 to 2018, reported decreasing precipitation in the Indo-Gangetic Plain and in Northeast India due to a weakening of the southwesterly moisture flow, while northwestern India experienced an increasing trend. In southern India, precipitation declined because of a northward shift in sinking air masses over the equatorial region. In Bangladesh, Jihan et al. (2025) [14] projected an overall increase in precipitation by 480.38 mm, with the most pronounced rise occurring during storm-prone months.
Situated along the southern slopes of the central Himalayas, Nepal is highly vulnerable to extreme precipitation events because of its complex topography and dynamic atmospheric interactions. The country’s summer monsoon primarily originates from the Bay of Bengal, supplemented by mid-latitude cyclonic systems that produce exceptionally heavy rainfall when interacting with monsoonal flows. Additionally, moisture-laden systems originating from the Arabian Sea and the Bay of Bengal further contribute to extreme precipitation, increasing the risk of both pluvial and fluvial flooding [15]. Several studies have reported a rise in intense daily precipitation trends across Nepal, significantly contributing to flash floods in various regions [16,17,18]. For instance, Chhetri et al. (2020) [19] investigated flooding in the Banke and Bardiya districts, attributing extreme flood events to overnight heavy rainfall in central–western Nepal.
Nepal’s climate is influenced by both the summer monsoon and westerly circulation systems. The summer monsoon is driven by southeasterly winds that transport moisture from the Bay of Bengal, whereas moisture-laden winds from the Mediterranean Sea govern the westerly circulation. In addition to these large-scale systems, Nepal’s complex topography is critical in shaping local weather conditions, resulting in substantial spatial variability in precipitation over short distances [20]. Shrestha et al. (2019) [21] analyzed precipitation trends in the Koshi and Kaligandaki river basins from 1981 to 2015 and found that precipitation rapidly decreased with elevation in the Kaligandaki basin, whereas the Koshi basin displayed the opposite trend. Orographic effects and rain-shadow phenomena further contribute to distinct spatial and temporal variations in precipitation patterns across the country [22,23].
Luo et al. (2024) [24] analyzed extreme precipitation trends in Nepal using 11 precipitation indices developed by the World Meteorological Organization’s Expert Team on Climate Change Detection and Indices (ETCCDI) for the period 1971–2015 based on APHRODITE data. Their findings indicate an overall decline in extreme precipitation trends, although the number of maximum consecutive wet days increased at varying rates across western and eastern Nepal. This study also highlights the significant influence of the South Asian monsoon on Nepal’s precipitation indices. Similarly, Lamichhane et al. (2024) [4] employed the PCI to investigate precipitation patterns across Nepal from 1990 to 2020, with particular attention to the role of El Niño–Southern Oscillation (ENSO) on PCI variability. Their results revealed that monthly precipitation in Nepal exhibits moderate to strong irregularity, with lower elevation regions experiencing greater variability than mountainous areas. Furthermore, annual precipitation trends show an increasing rate of 0.53 mm per decade, while ENSO-driven variability is notably and inversely correlated with the Niño 3.4 index across most regions of Nepal.
The Kathmandu Valley, situated in the central Himalayas, is characterized by bowl-shaped topography and a single drainage outlet at Chovar. Rapid urban expansion has intensified the impacts of extreme precipitation, resulting in frequent urban flooding [25]. For instance, on 6 September 2021, The Kathmandu Post reported that 121.5 mm of rainfall caused severe inundation in multiple areas, including Balkhu, Kuleshwor, Narephant, Balaju, and Mulpani, as well as along major roadways. These extreme precipitation events often lead to traffic disruptions, casualties, disturbances for pedestrians and school children, and broader socioeconomic consequences. The severity of such impacts in the Kathmandu Valley is amplified due to the high population exposure.
Although several hydrometeorological studies have been conducted in the Kathmandu Valley, most have concentrated on flood mapping rather than long-term precipitation trends [26,27,28,29,30,31,32]. While Prajapati et al. (2021) [33] analyzed precipitation days from 1971 to 2015, their focus was primarily on spatial rainfall distribution and interstation comparisons. Consequently, a significant research gap remains regarding the historical trends in extreme precipitation intensity, frequency, and variability, as well as the influence of ENSO on extreme precipitation events and the PCI in the Kathmandu Valley.
This study addresses these gaps by analyzing extreme precipitation patterns in the Kathmandu Valley, focusing on frequency, intensity, seasonal and annual variability, and the influence of ENSO. The Mann–Kendall test and Sen’s slope estimator are employed to assess precipitation trends from 1980 to 2022 using extreme precipitation indices recommended by the World Meteorological Organization (WMO) and the PCI. Additionally, this study investigates the effects of ENSO using the Niño 3.4 index. The findings offer valuable insights for hydrologists, urban planners, and policymakers seeking to improve flood forecasting and disaster preparedness by better understanding historical precipitation extremes.

2. Materials and Methods
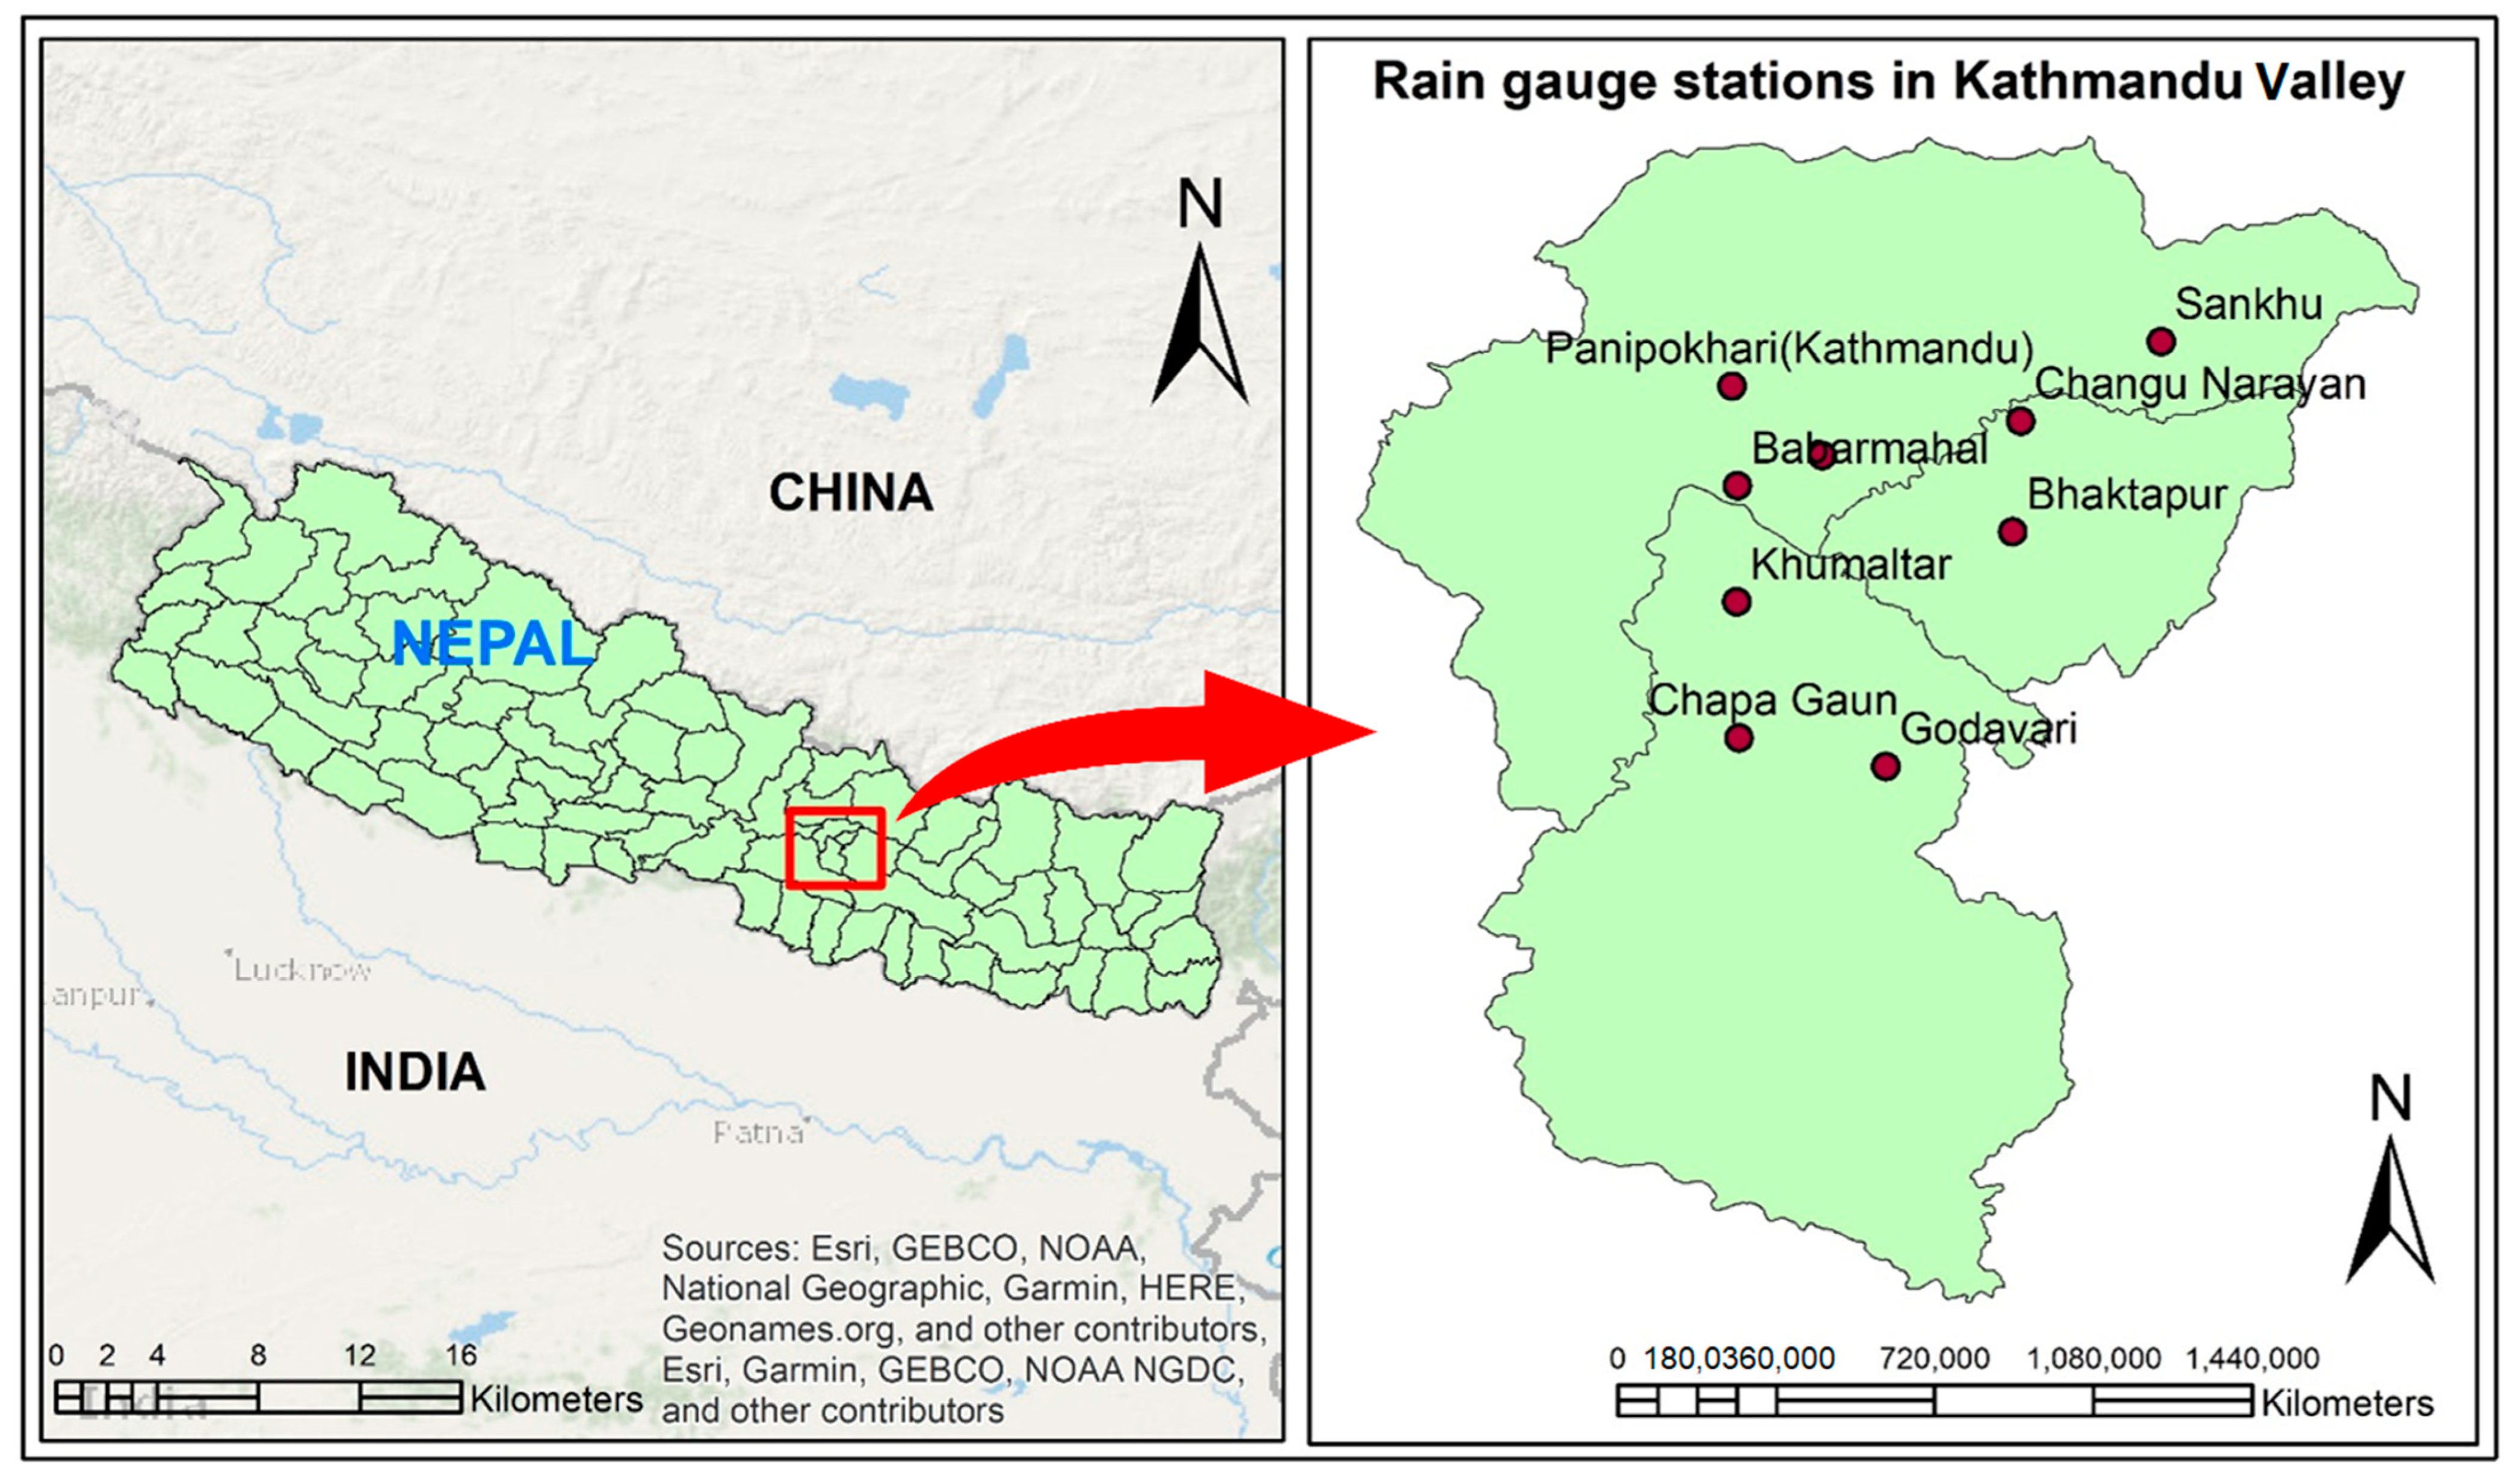
2.1. Study Area

The study area, illustrated in Figure 1, is located in the central Himalayan region of Nepal and encompasses the capital city, Kathmandu, along with the districts of Bhaktapur, Kathmandu, and Lalitpur. Several major rivers, including the Bagmati, Bishnumati, Manohara, Hanumante, and Dhobikhola, traverse through the Kathmandu Valley. Geographically, it lies between 27°32′13″–27°49′10″ N latitude and 85°11′31″–85°31′38″ E longitude [34]. The Kathmandu Valley covers an area of approximately 664 km2. The Kathmandu Valley ranges in elevation from 1350 m above sea level (masl) in the lowlands to nearly 2800 masl in the surrounding hills. The valley is home to roughly 24% of Nepal’s urban population which is estimated to be 3.3 million and projected to reach 3.8 million by 2031 [30], making it particularly vulnerable to climate-induced hazards, including extreme precipitation events [35]. The region experiences four distinct seasons—summer, autumn, spring, and winter—and falls within a subtropical to temperate climate zone. The average annual precipitation is approximately 1778 mm, most of which occurs between June and September. The temperature in the valley varies throughout the year, with recorded highs reaching 23.8 °C and lows dropping to 11.4 °C [36].

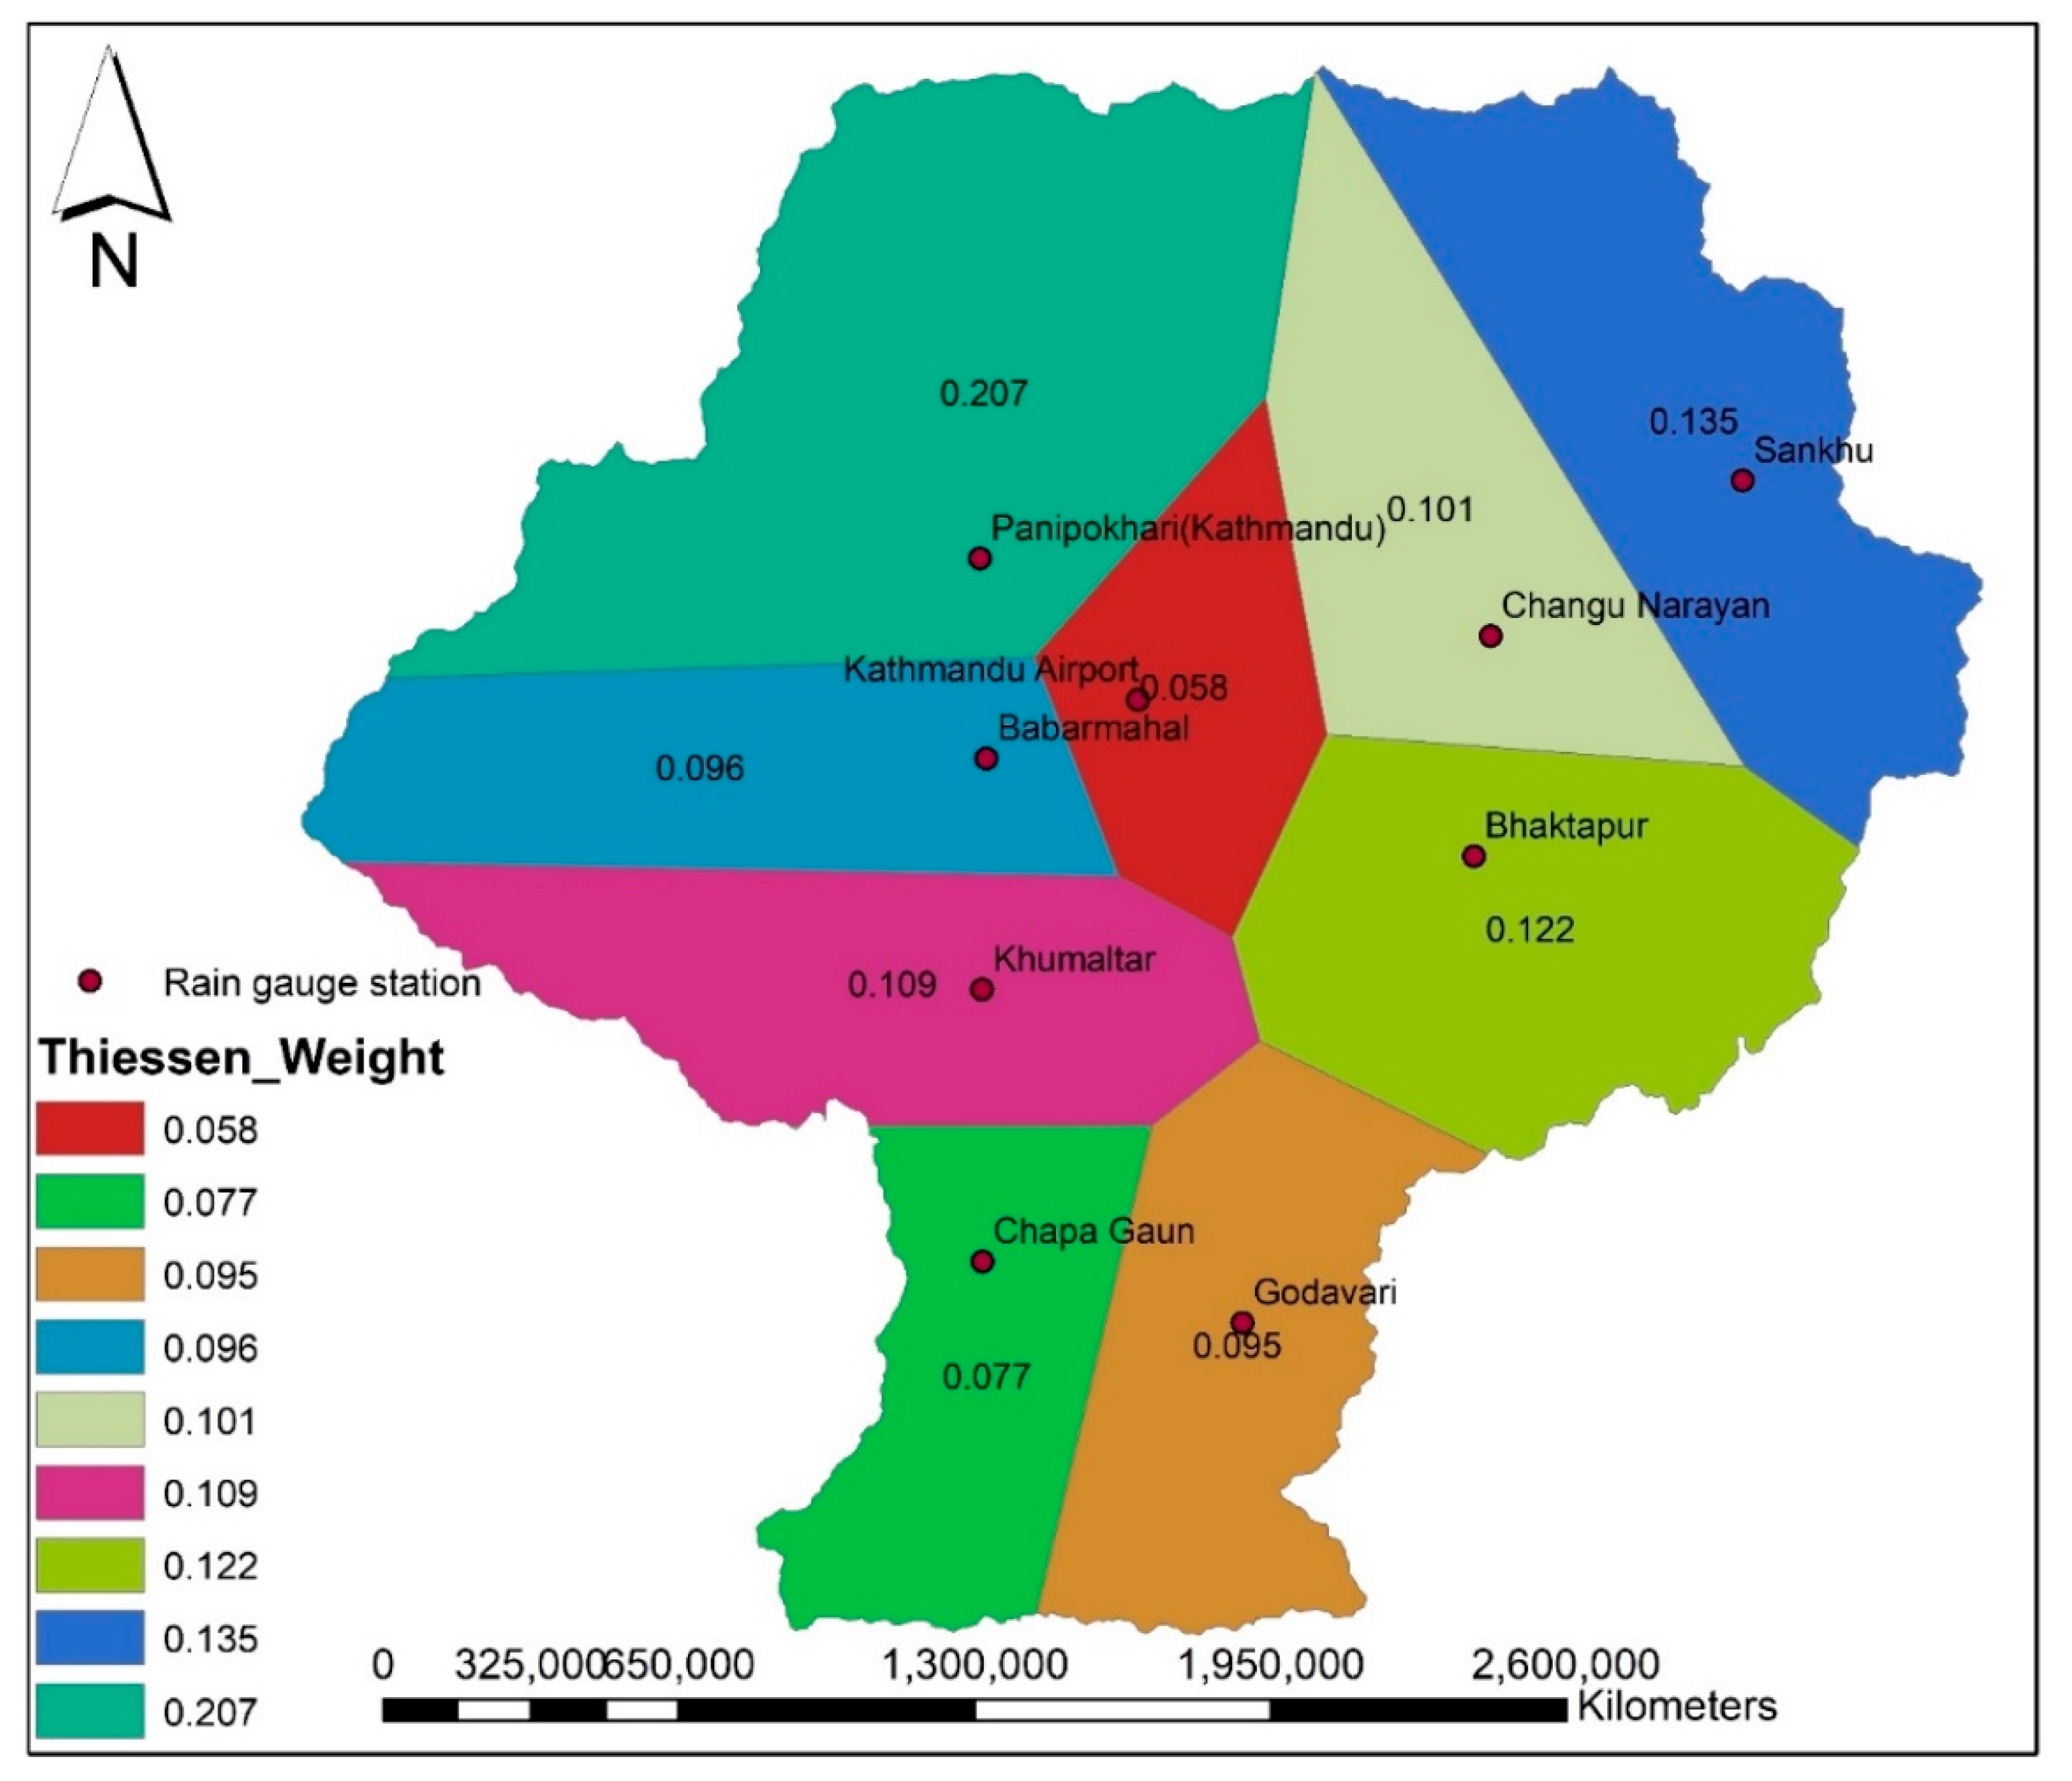
2.2. Data Preparation

2.2.1. Observed Station Data

This study used daily observed rainfall data from nine rain gauge stations in the Kathmandu Valley covering the period from 1980 to 2022. The data were obtained from Nepal’s Department of Hydrology and Meteorology (DHM) [37]. Missing values in daily precipitation data, which accounted for less than 5% of the dataset, were filled in using data from nearby stations for the corresponding periods.
Given the spatial variability of precipitation across the Kathmandu Valley, it is essential to estimate the average precipitation in a manner that accounts for the unequal distribution of stations and the differing areas each station represents. Therefore, the average precipitation across the valley was estimated using the Thiessen polygon method. This approach delineates the area influenced by each station and assigns station-specific weights based on their respective catchment areas, ensuring that the computed average precipitation accurately reflects the spatial distribution of rainfall. The Thiessen polygon weights for each station are illustrated in Figure 2. The average daily precipitation of the Kathmandu Valley was calculated using the following equation [38]:
P = P 1 W 1 + P 2 W 2 + P 3 W 3 + + P n W n
where P1, P2, P3,…, and Pn represent the daily precipitation values at the respective stations, and W1, W2, W3,…, and Wn are the corresponding Thiessen polygon weights. The Thiessen polygon weights (W) were determined as follows:
W 1 = A 1 A 1 + A 2 + A 3 A n ,   W 2 = A 2 A 1 + A 2 + A 3 A n ,   . . .   W n = A n A 1 + A 2 + A 3 A n
where A1, A2, A3, , and An denote the areas of the Thiessen polygons corresponding to each station.

2.2.2. ENSO Index

This study investigates the influence of tropical SST variations on precipitation patterns, PCI, and extreme precipitation indices. Specifically, SST anomalies in the Niño 3.4 region (5° N–5° S, 120° W–170° W) were used for analysis [4]. The SST anomalies were obtained from the Niño 3.4 index based on data from the Extended Reconstructed Sea Surface Temperature version 5 (ERSST V5) provided by the National Weather Service Climate Prediction Center, a division of NOAA accessed on 1 January 2025 (https://www.cpc.ncep.noaa.gov/data/indices/) [39]. The Niño 3.4 index, which has been widely used in previous studies [4,40,41,42,43], is available at a monthly resolution. This study assessed the relationship between ENSO and extreme precipitation and the PCI on annual and seasonal timescales from 1980 to 2022.

2.3. Data Analysis

2.3.1. Average Precipitation

This study analyzed the mean monthly precipitation in the Kathmandu Valley from 1980 to 2022. The precipitation dataset was initially processed using the Thiessen polygon method to account for spatial variability and was further analyzed to calculate the average precipitation for each month across the study period. The temporal distribution of precipitation was then visualized using a histogram to illustrate the monthly variations throughout the year.

2.3.2. Precipitation Trend Analysis (Mann–Kendall Test)

The Mann–Kendall statistical test, first introduced by Mann (1945) [44], is a widely used non-parametric method for detecting trends in time series data, particularly in the fields of hydrology and climatology [12]. One of the key advantages of this test is that it does not require the data to follow any specific distribution. It assumes that the time series is independently and identically distributed and is unaffected by serial correlation over time [24]. The null hypothesis (H0) of the Mann–Kendall test posits that there is no trend in the dataset, meaning that the observations are randomly ordered. In contrast, the alternative hypothesis (H1) indicates a trend within the time series [45].
In this study, the Mann–Kendall test statistic (S) was computed on an annual, seasonal, and monthly basis using the following equation:
S = i = 1 n 1 j = i + 1 n s g n ( x j x i )
where n is the number of observations, and xi and xj are the data values at time indices i and j, respectively. The sign function sng(xj − xi) is defined as follows:
s n g x j x i = + 1   i f   x j x i > 0   0   i f   x j x i = 0 1   i f   x j x i < 0
For datasets where n > 10, the test statistics S is approximately normally distributed with a mean of zero [12,24]. The variance of S is calculated as follows:
V a r S = n n 1 2 n + 5 i = 1 m t t 1 2 t + 5 18
where m is the number of tied groups, and t represents the number of tied values in each group.
For n > 10, the standardized normal variable Z is computed as follows:
Z = S 1 V a r ( S )   i f   S > 0 0   i f   S = 0 S + 1 V a r ( S )   i f   S < 0
A positive Z-value indicates an upward trend in the time series, whereas a negative Z-value signifies a downward trend. The statistical significance of the identified trend is evaluated against a predefined significance level.

2.3.3. Trend Magnitude Estimation (Sen’s Slope)

Sen’s slope (β) estimator is a non-parametric method used to quantify the magnitude of trends in time series data. It is widely employed in hydrology and climatology because of its robustness against outliers and applicability to data that do not follow a normal distribution [12]. This method calculates the slope between all possible pairs of data points and uses the median of these slopes to provide a reliable estimate of the overall trend magnitude. In this study, Sen’s slope (β) was calculated on an annual, seasonal, and monthly basis using the following equation:
β = m e d i a n x i x j i j
where xi and xj are the data values at time steps ti and tj, respectively. A positive value of β indicates an upward trend, whereas a negative value signifies a downward trend in the dataset.

2.3.4. Extreme Precipitation Indices

Precipitation indices, summarized in Table 1 and recommended by the WMO, were used to evaluate precipitation characteristics in the Kathmandu Valley. These indices capture both the intensity and frequency of extreme precipitation events [24,46,47] and are widely used in hydrological and climatological studies because of their robustness in representing temporal and spatial variations in precipitation patterns.
This study categorizes precipitation indices into two main types: intensity-based and frequency-based. Intensity-based indices measure the magnitude of precipitation events and include the maximum 1-day (RX1day), 3-day (RX3day), 5-day (RX5day), and 7-day (RX7day) precipitation amounts. Threshold-based indices, such as very wet days (R95pTOT) and extremely wet days (R99pTOT), represent the total precipitation on days exceeding the 95th and 99th percentile thresholds, respectively. The Simple Daily Intensity Index (SDII) was also used to estimate the average precipitation on wet days.
Frequency-based indices assess the occurrence of extreme precipitation events, including the number of heavy precipitation days as follows: R10 mm, R20 mm, R35 mm, corresponding to days with precipitation exceeding 10 mm, 20 mm, and 35 mm, respectively. The longest consecutive dry days (CDDs, defined as precipitation <1 mm) and consecutive wet days (CWDs, defined as precipitation >1 mm) were also analyzed to evaluate extended dry and wet periods.
All indices were derived from daily precipitation records from 1980 to 2022 to identify trends in extreme precipitation events within the study area. To better understand temporal changes, trends were analyzed for the entire study period (1980–2022) and separately for two decades (1980–2001 and 2002–2022) using the Pettitt test, providing a clearer view of recent climate trends.

2.3.5. Precipitation Concentration Index (PCI)

The PCI, introduced by Oliver (1980) [48], is widely used to assess the temporal distribution of precipitation across the 12 months of the year. It serves as a vital tool for evaluating the uniformity of irregularity of precipitation on both seasonal and annual scales, ranging from evenly distributed precipitation to highly irregular precipitation patterns [49], according to Table 2 thresholds. Variability in precipitation concentration significantly influences hydrological hazards such as floods, droughts, landslides, and soil erosion, as it reflects imbalances in precipitation distribution throughout the year [50]. In recent years, the PCI has gained increasing recognition in hydrological research for its ability to characterize precipitation variability [51,52]. In this study, the PCI was determined on both an annual and seasonal basis for 1980–2022 [4]. Daily average precipitation, estimated using the Thiessen polygon method, was aggregated into monthly totals for the Kathmandu Valley. The monthly precipitation values were then used to calculate the PCI using the following equations [4]:
P C I   y e a r l y = i = 1 12 P i 2 ( i = 1 12 P i ) 2 × 100  
P C I   S e a s o n = i = 1 n P i 2 ( i = 1 n P i ) 2   ( n 12 × 100 )  
where Pi represents the monthly precipitation for each month within the season, i represents the specific month, and n denotes the number of months within the season under consideration. The PCI values were converted to percentages by multiplying the results by 100 in both equations.

3. Results

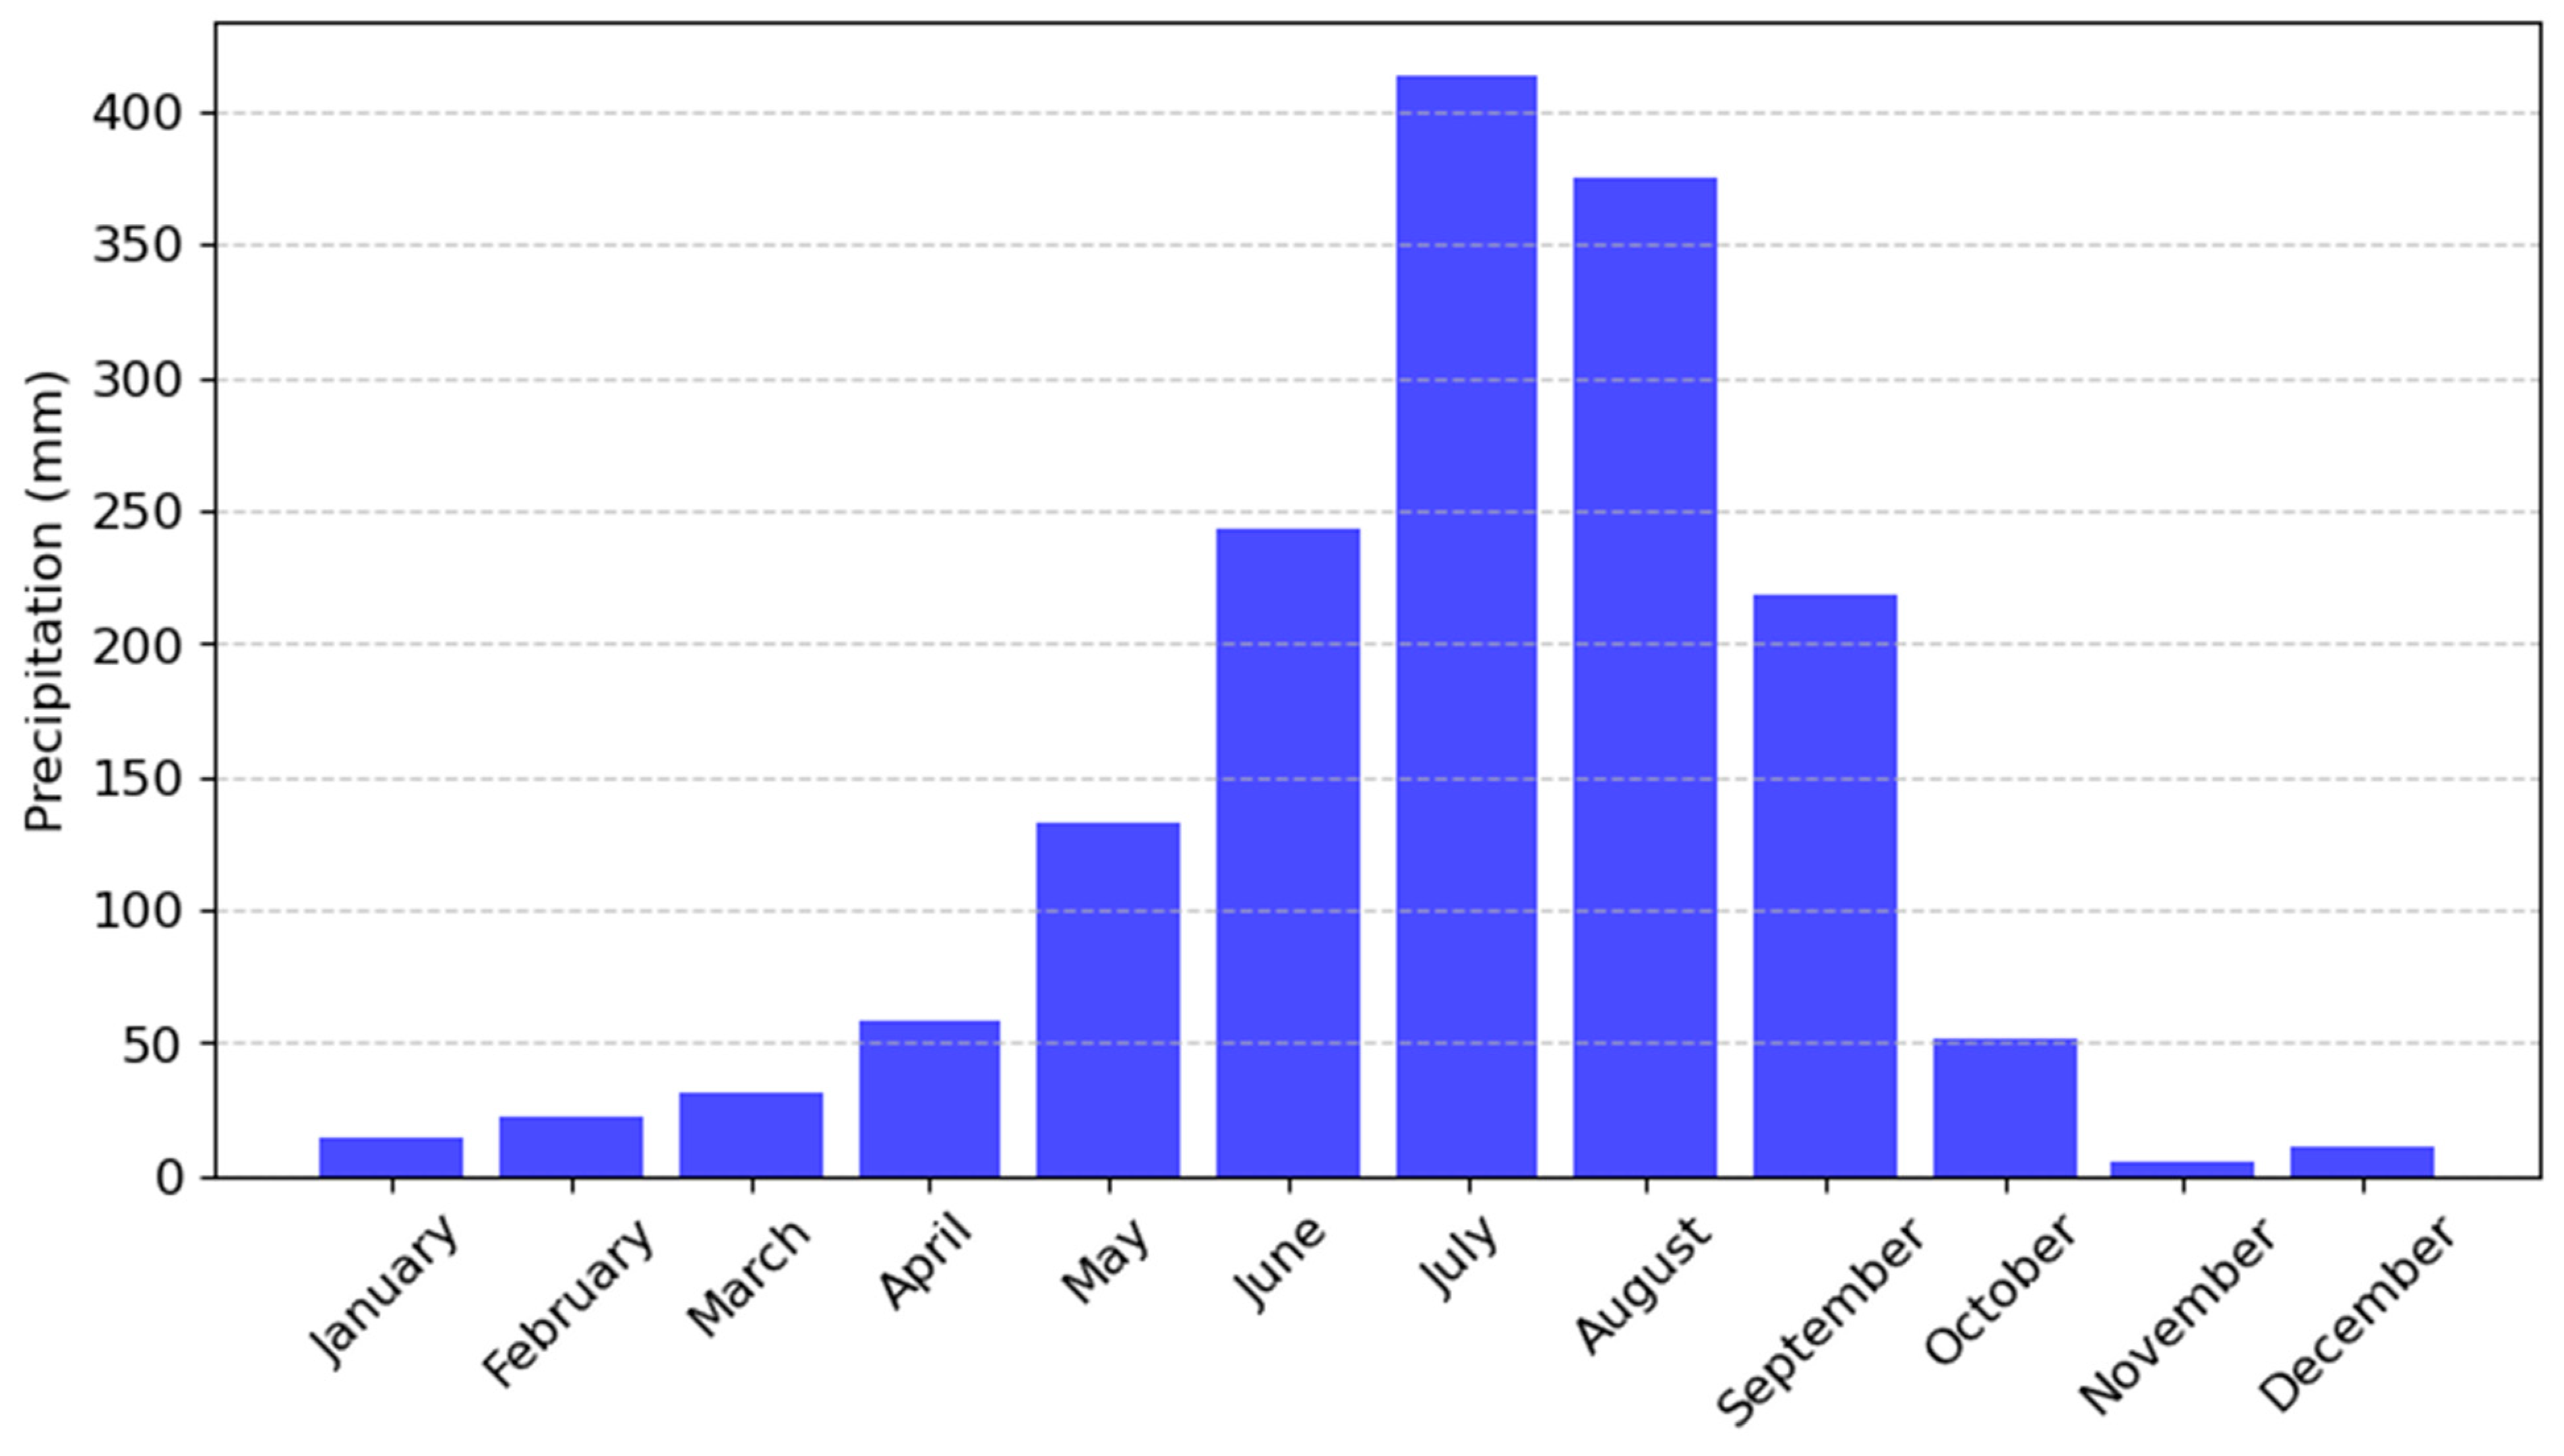
3.1. Monthly Average Precipitation

Figure 3 presents the monthly average precipitation in the Kathmandu Valley from 1980 to 2022, revealing a clear seasonal pattern. The highest rainfall is recorded in July (425 mm), followed by August (375 mm), while June and September receive between 220 mm and 245 mm. In contrast, the driest months are January, February, March, November, and December, with precipitation levels below 50 mm. April, May, and October receive moderate rainfall ranging from 50 mm to 135 mm. The data show that approximately 80% of the total annual precipitation occurs during the monsoon months of June, July, August, and September, with the remaining 20% distributed across the other eight months. This highlights the region’s pronounced dependence on seasonal rainfall.

3.2. Precipitation Trends and Variability

Table 3 presents the results of the Mann–Kendall trend analysis for precipitation at monthly, seasonal, and annual scales, focusing on statistically significant trends. The seasonal classifications used in this study are winter (December–February), spring (March–May), summer (Monsoon) (June–August), and autumn (September–November). Among all the periods analyzed, only November, December, and the spring season exhibit statistically significant precipitation trends at the 0.05 significance level (p < 0.05). Specifically, November shows a declining trend of −0.035 mm/year (p = 0.03), December demonstrates a declining trend of −0.031 mm/year (p = 0.02), and spring shows an increasing trend of 1.17 mm/yr (p = 0.04). These significant downward trends suggest an increase in aridity during the late autumn and early winter months, which may have implications for water availability in the dry season, whereas the spring season shows more water availability. For the remaining months and seasons and the annual scale, although positive or negative slopes were observed, the associated p-values exceed 0.05, indicating no statistically significant trends. In other time intervals, the precipitation is highly fluctuating.
Figure 4 illustrates the annual and seasonal precipitation variations in the Kathmandu Valley from 1980 to 2022, showing substantial fluctuations over time. The highest annual precipitation was recorded in 2002 (2061.6 mm), while the lowest occurred in 2009 (1155.7 mm). As summarized in Table 3, the mean annual precipitation is 1577.1 mm with a coefficient of variation (CV) of 14.2%, indicating relatively low variability. The standard deviation is 224.7 mm from the mean. Among the seasons, the summer (monsoon) season exhibits the greatest variability in precipitation, with values ranging from 703 mm to 1386.8 mm. Peak summer rainfall occurred in 2002, followed by 1995 (1325 mm) and 2003 (1300 mm). The average precipitation during this season is 1031 mm, with a standard deviation of 166 mm and a CV of 16.1%. The autumn season is the second-largest contributor to annual precipitation, with values ranging between 199.2 mm and 567.8 mm, an average of 275.8 mm, and a standard deviation of 92.9 mm. The highest autumn precipitation occurred in 1985, followed by 2007. Spring precipitation shows an increasing trend, peaking at 368.7 mm in 2002, followed by 350 mm in 2011. The minimum recorded value is 104.5 mm, with an average of 221.8 mm and a standard deviation of 67.9 mm. Winter contributes the least to annual precipitation, with near-zero precipitation in several years. The highest winter precipitation was recorded in 1997 (143.1 mm), highlighting its minimal contribution to the region’s overall water availability.

3.3. Temporal Patterns of Extreme Precipitation Indices

Extreme precipitation indices are categorized into various groups, each capturing different characteristics of extreme precipitation events. High-intensity indices include maximum precipitation over specific durations: one day (RX1day), three days (RX3day), five days (RX5day), and seven days (RX7day). Percentile-based indices capture extreme precipitation events based on statistical thresholds, including R95pTOT (precipitation exceeding the 95th percentile) and R99pTOT (precipitation exceeding the 99th percentile). Frequency-based indices measure the number of days with heavy rainfall, including R10mm (days with precipitation ≥ 10 mm), R20mm (days with precipitation ≥ 20 mm), and R35mm (days with precipitation ≥ 35 mm). Dry and wet spell indices quantify the duration of extreme conditions: consecutive dry days (CDDs) reflect extended dry periods (precipitation < 1 mm), while consecutive wet days (CWDs) indicate sustained wet conditions (precipitation > 1 mm). Finally, the Simple Daily Intensity Index (SDII) represents the average precipitation on wet days, thereby providing insights into the overall intensity of precipitation events throughout the year.

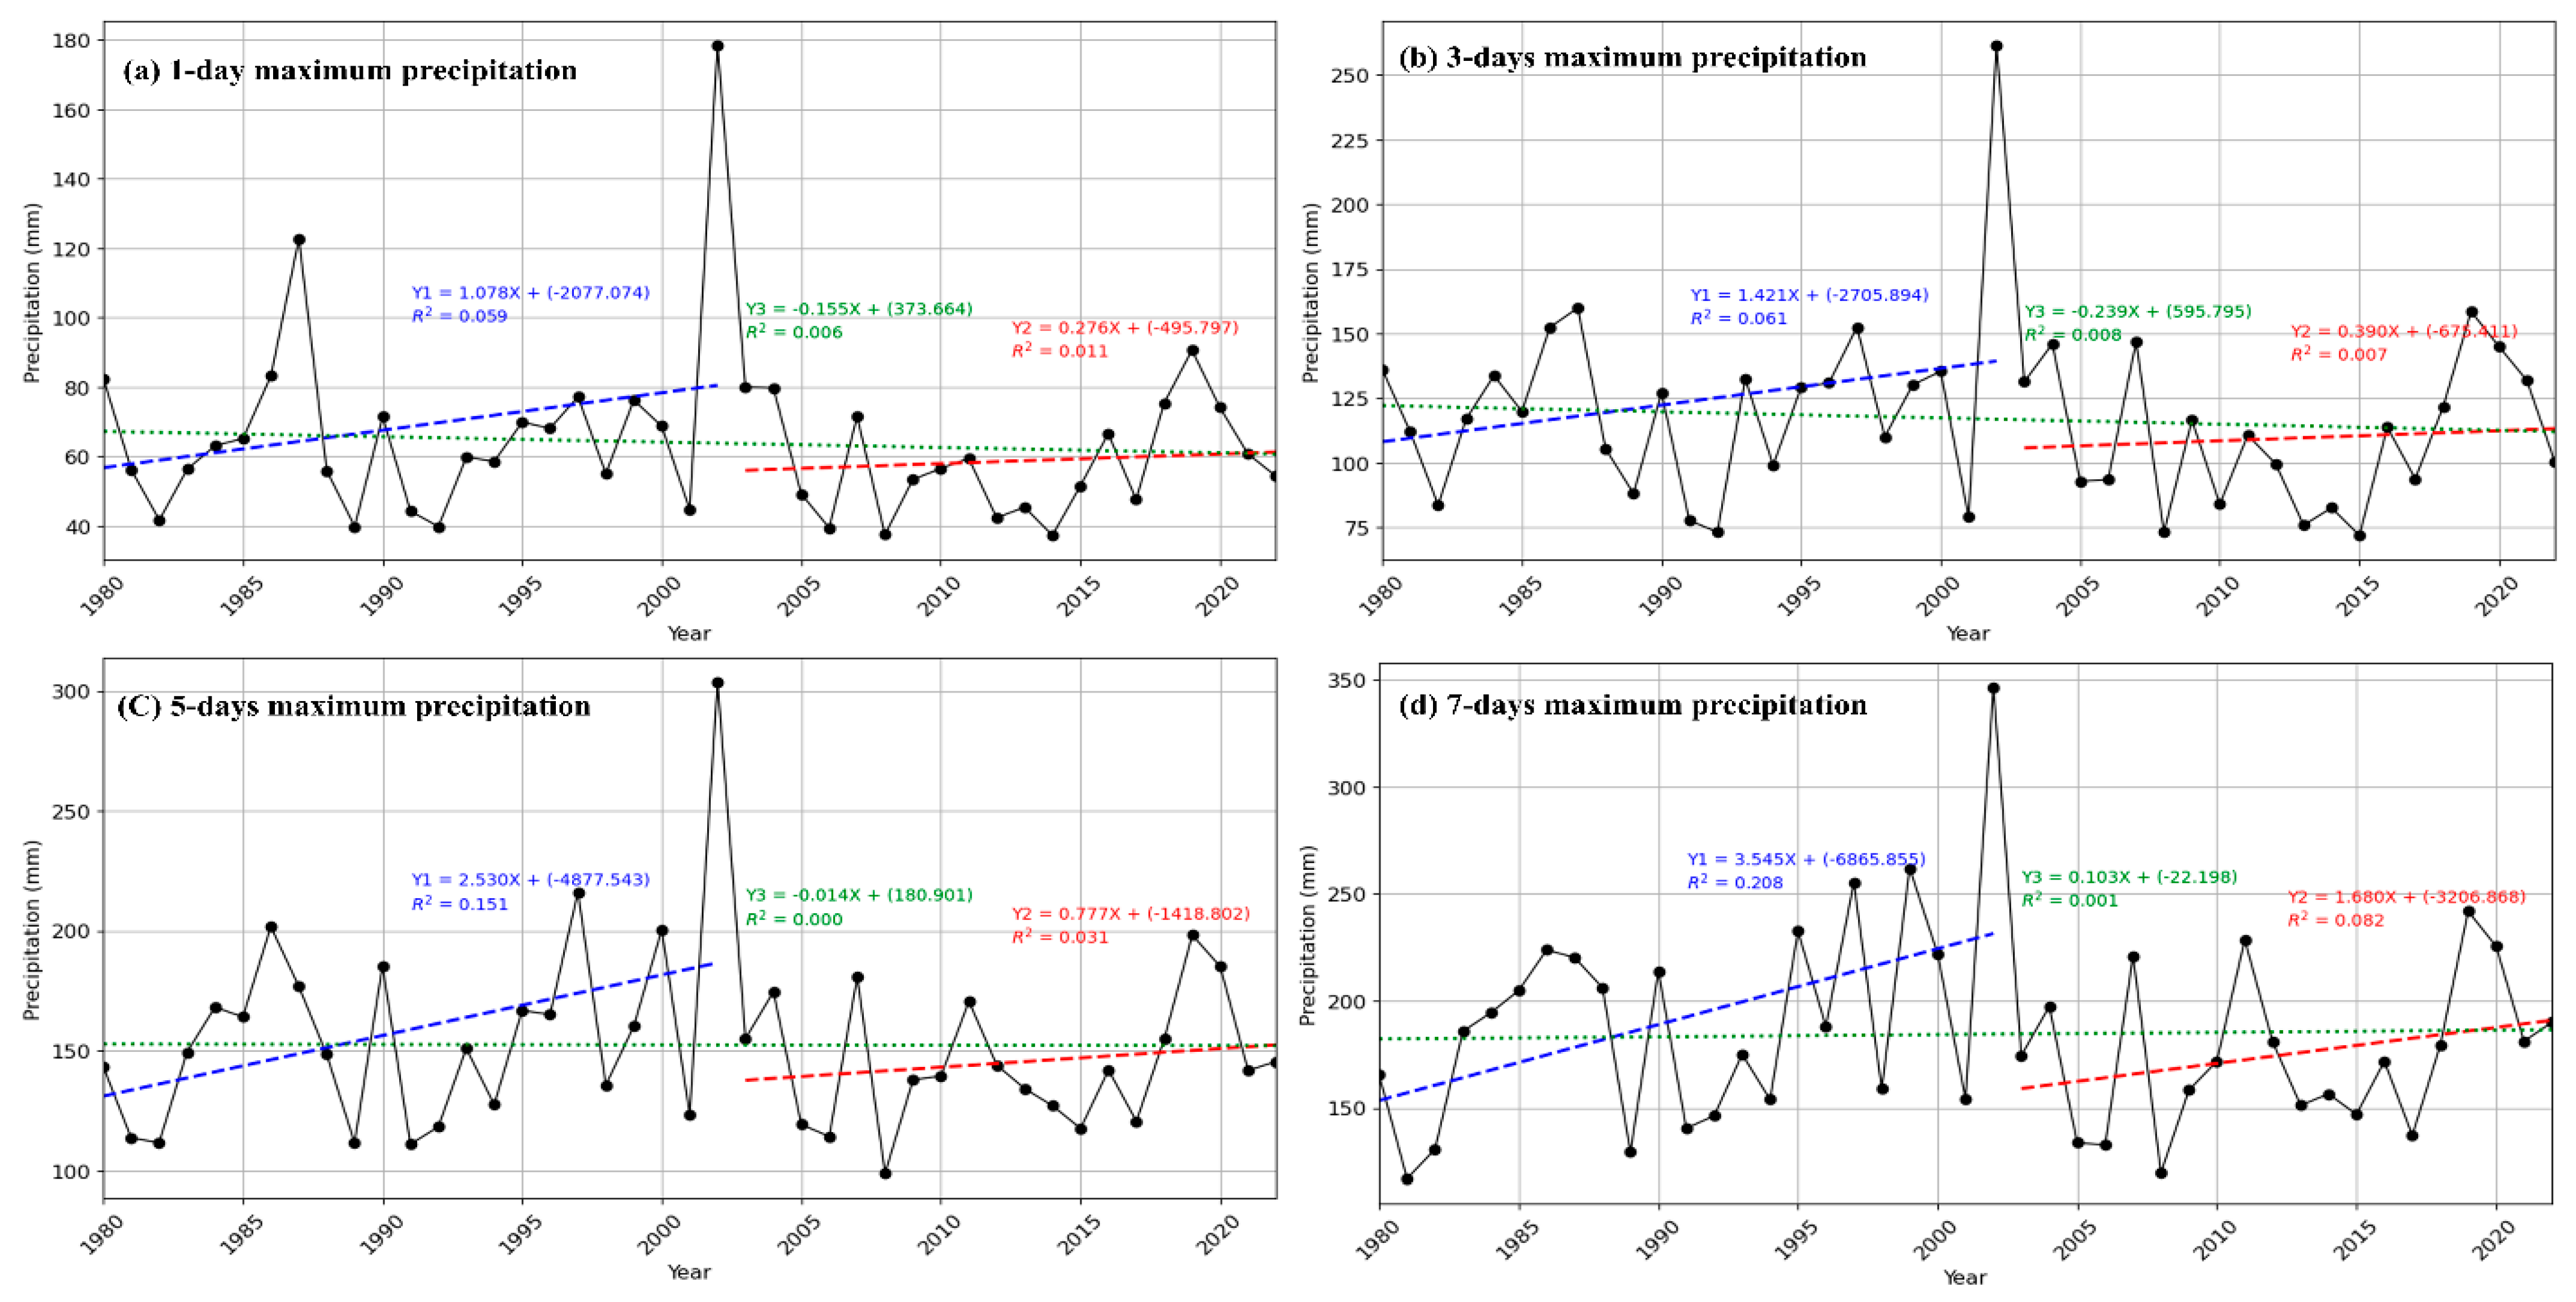
3.3.1. High-Intensity Precipitation Indices

Maximum 1-Day (RX1day), 3-Day (RX3day), 5-Day (RX5day), and 7-Day (RX7day) Precipitation

Figure 5 illustrates the temporal patterns of maximum precipitation over different durations—RX1day, RX3day, RX5day, and RX7day—from 1980 to 2022. Each subplot presents observed data along with trend lines for the entire study period (1980–2022) and two sub-periods (1980–2002 and 2003–2022), allowing for a comparative analysis of decadal changes. Over the full period, RX1day, RX3day, and RX5day exhibit no significant increasing or decreasing trend (Table 4), while RX7day shows a slightly increasing trend of 0.1 mm/year. A similar type of fluctuation is seen in the decadal analysis for RX1day, RX3day, and RX5day, but an increasing trend of precipitation in RX7day is significant in both decadal time intervals (Table 5). In 2002, the maximum precipitation values ranged from 178 mm to 346 mm across all indices. RX1day precipitation increased sharply between 1982 and 1987 but declined significantly during 1988–1989. A similar pattern is evident for RX3day, which experienced a slight decline in 1985. RX5day and RX7day increased between 1982 and 1986, followed by a sharp decline from 1987 to 1999. From 1989 to 2001, all indices experienced considerable interannual fluctuations, peaking in 2002.

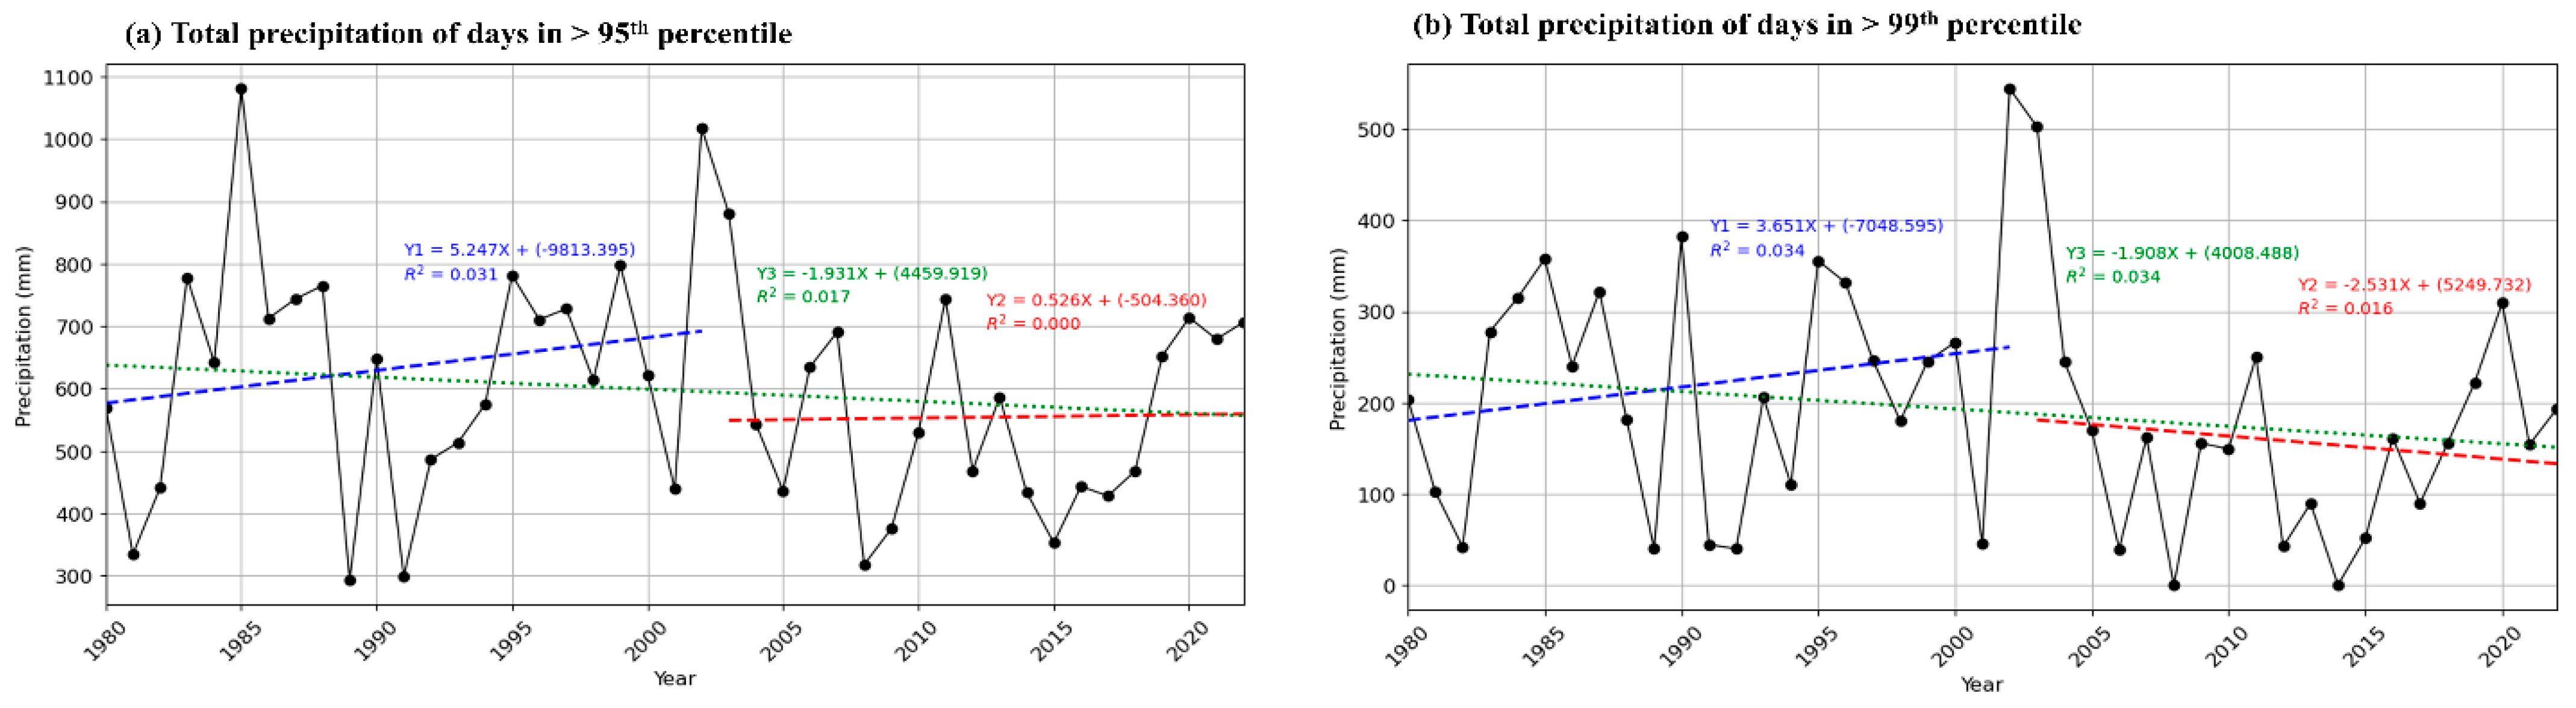
Total Precipitation in R95pTOT and R99pTOT

Figure 6 presents the temporal variation in the total precipitation associated with extreme rainfall days, with subplot (a) representing days exceeding the 95th percentile (R95pTOT) and subplot (b) those exceeding the 99th percentile (R99pTOT), covering the period from 1980 to 2022. Trend lines are included for the entire study period as well as for two decadal intervals to assess long-term and short-term patterns. Over the full study period, both indices exhibit highly fluctuating precipitation, with a decreasing trend of R99pTOT at 1.9 mm/year being significant (Table 4). However, the decadal analysis reveals a more nuanced picture. From 1980 to 2002, R95pTOT shows a trend of precipitation increasing by 5.24 mm/year (Table 5), while for 2003–2022 both indices show highly fluctuating precipitation over the study period. For R95pTOT, the total precipitation increased sharply from 334 mm in 1981 to a peak of 1080 mm in 1985, followed by a rapid decrease to 293 mm in 1989 and 299.9 mm in 1991. The index then fluctuated, reaching a secondary peak of 1017 mm in 2002. After 2002, R95pTOT remained relatively stable, with a slight initial decline until 2005, followed by intermittent fluctuations with 705 mm recorded in 2022. In the case of R99pTOT, precipitation initially declined for three consecutive years before rising from 41.7 mm in 1982 to 357 mm in 1985. Between 1985 and 2001, the values fluctuated significantly, ranging from 40 mm to 382 mm and peaking at 544 mm in 2002. A continuous decline was observed for the next four years, reaching 39 mm in 2006. From 2006 to 2022, the index exhibited extreme variability, fluctuating between 0 mm and 309 mm.

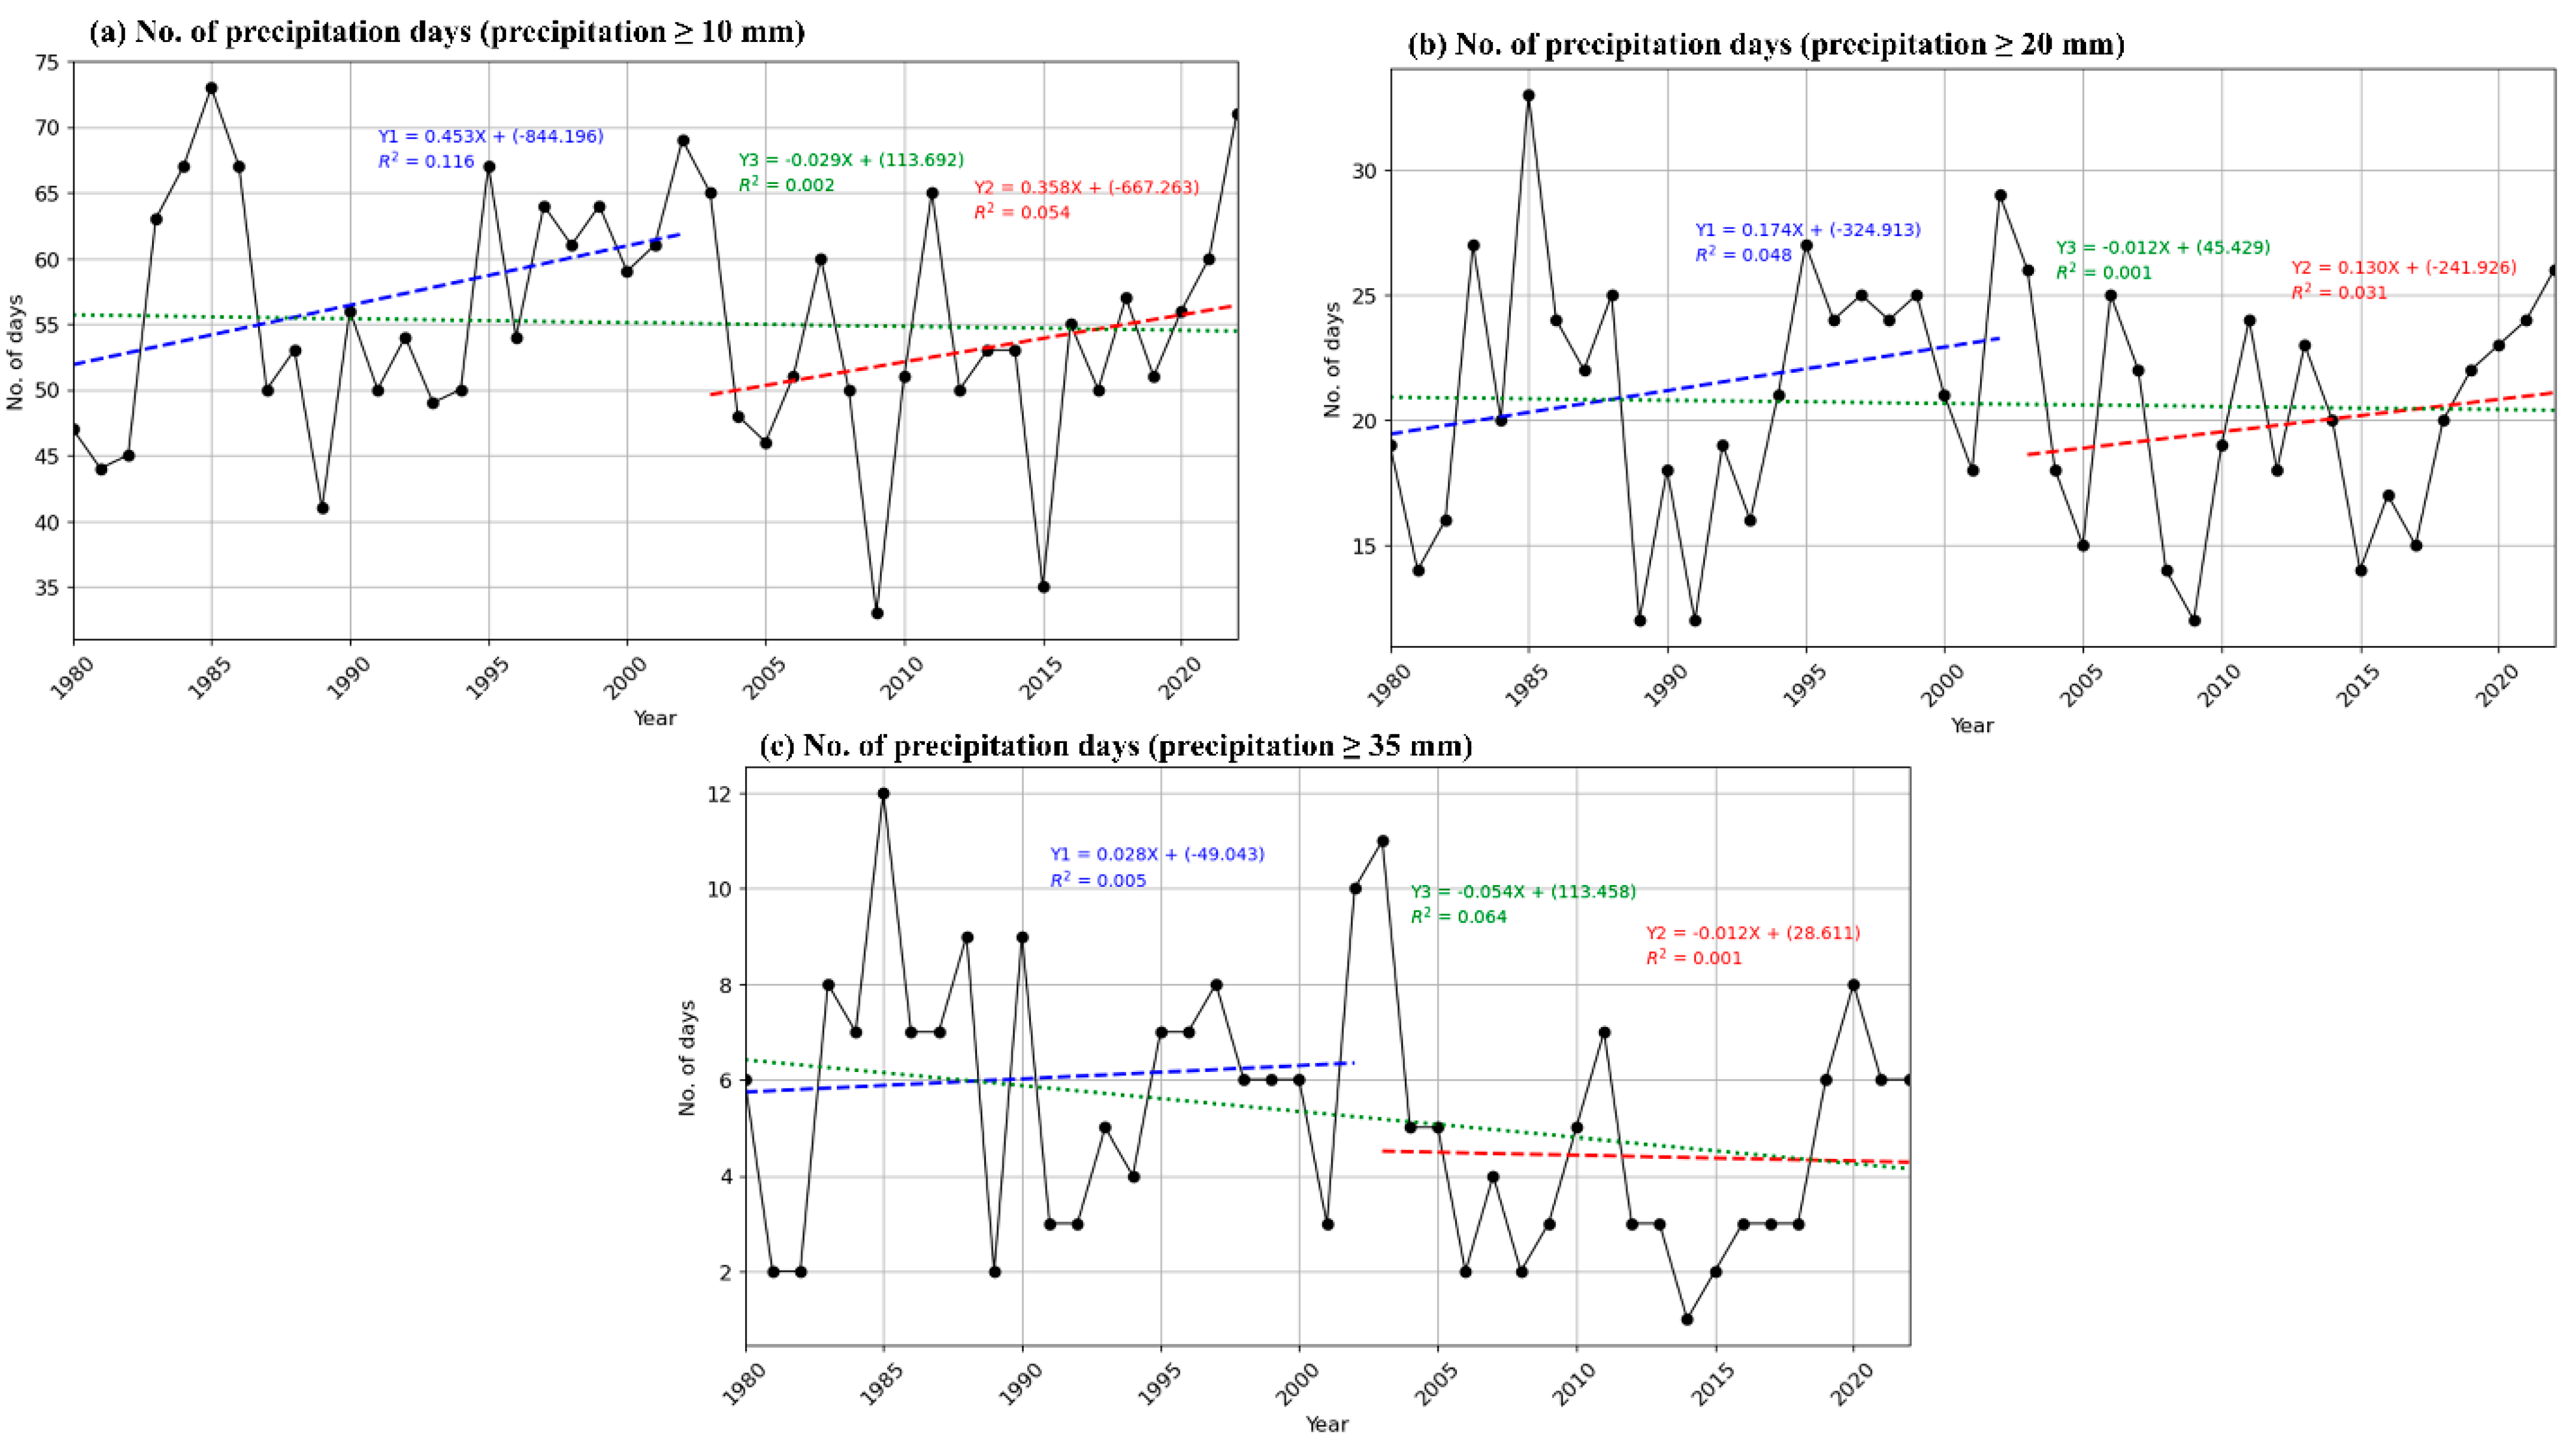
3.3.2. Precipitation Days at Different Thresholds

This study evaluates precipitation days based on three intensity thresholds: ≥10 mm (heavy precipitation days), ≥20 mm (very heavy precipitation days), and ≥35 mm (extreme precipitation days), as illustrated in Figure 7. Over the entire study period (1980–2022), the number of precipitation days shows a decreasing trend (−0.05 days/year) for extreme precipitation with precipitation ≥ 35 mm (Table 4), whereas for heavy and very heavy precipitation, an increasing or decreasing trend is not significant. Precipitation days ≥ 10 mm exhibit high interannual variability, increasing steadily through the early 1980s and peaking around 2002, followed by fluctuating patterns in subsequent years. Similarly, precipitation days ≥ 20 mm show pronounced fluctuations, with peaks in 1958 and in 2002, followed by a period of relative stabilization. In contrast, precipitation days ≥ 35 mm remain relatively low throughout the study period in both decadal analyses.

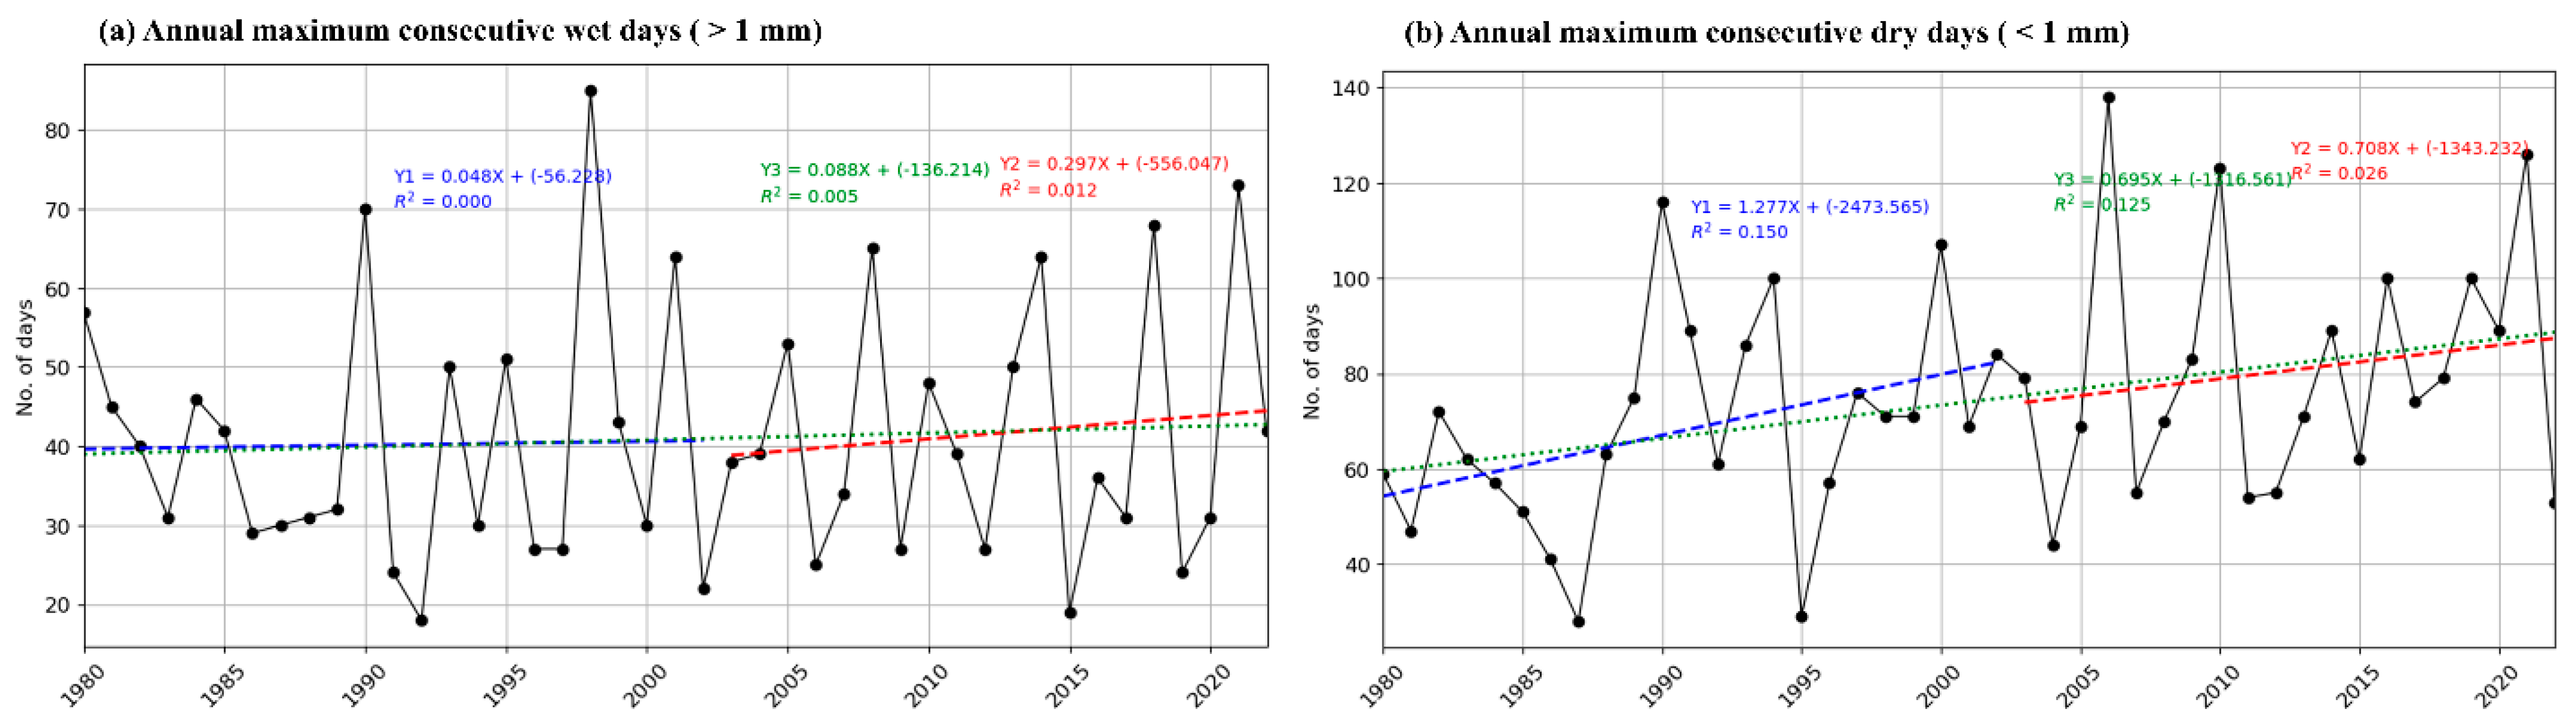
3.3.3. Annual Maximum Consecutive Wet and Dry Days

Figure 8 shows the trends in CWDs and CDDs. As shown in Figure 8a, CWDs display an overall fluctuation with no significant increasing trend. In contrast, Figure 8b shows a more pronounced increasing trend in CDDs at 0.69 days/year, indicating a notable rise in the duration of dry spells over the study period (Table 4). Decadal analysis reveals further details: between 1980 and 2002, consecutive wet days’ increased trend is not significant, while consecutive dry days rose more sharply at 1.27 days/year with a 9% significant level with a continue rising trend at 0.708 days/year for 2003–2022 (Table 5) with a 4% significant level. Interannual variability is notable for both indices, with peaks in CWDs observed in the late 1990s and early 2000s, followed by fluctuations in subsequent years. Conversely, CDDs show a more consistent and pronounced upward trend, with peak values occurring more frequently after 2000, indicating an overall increase in prolonged dry periods across the Kathmandu Valley.

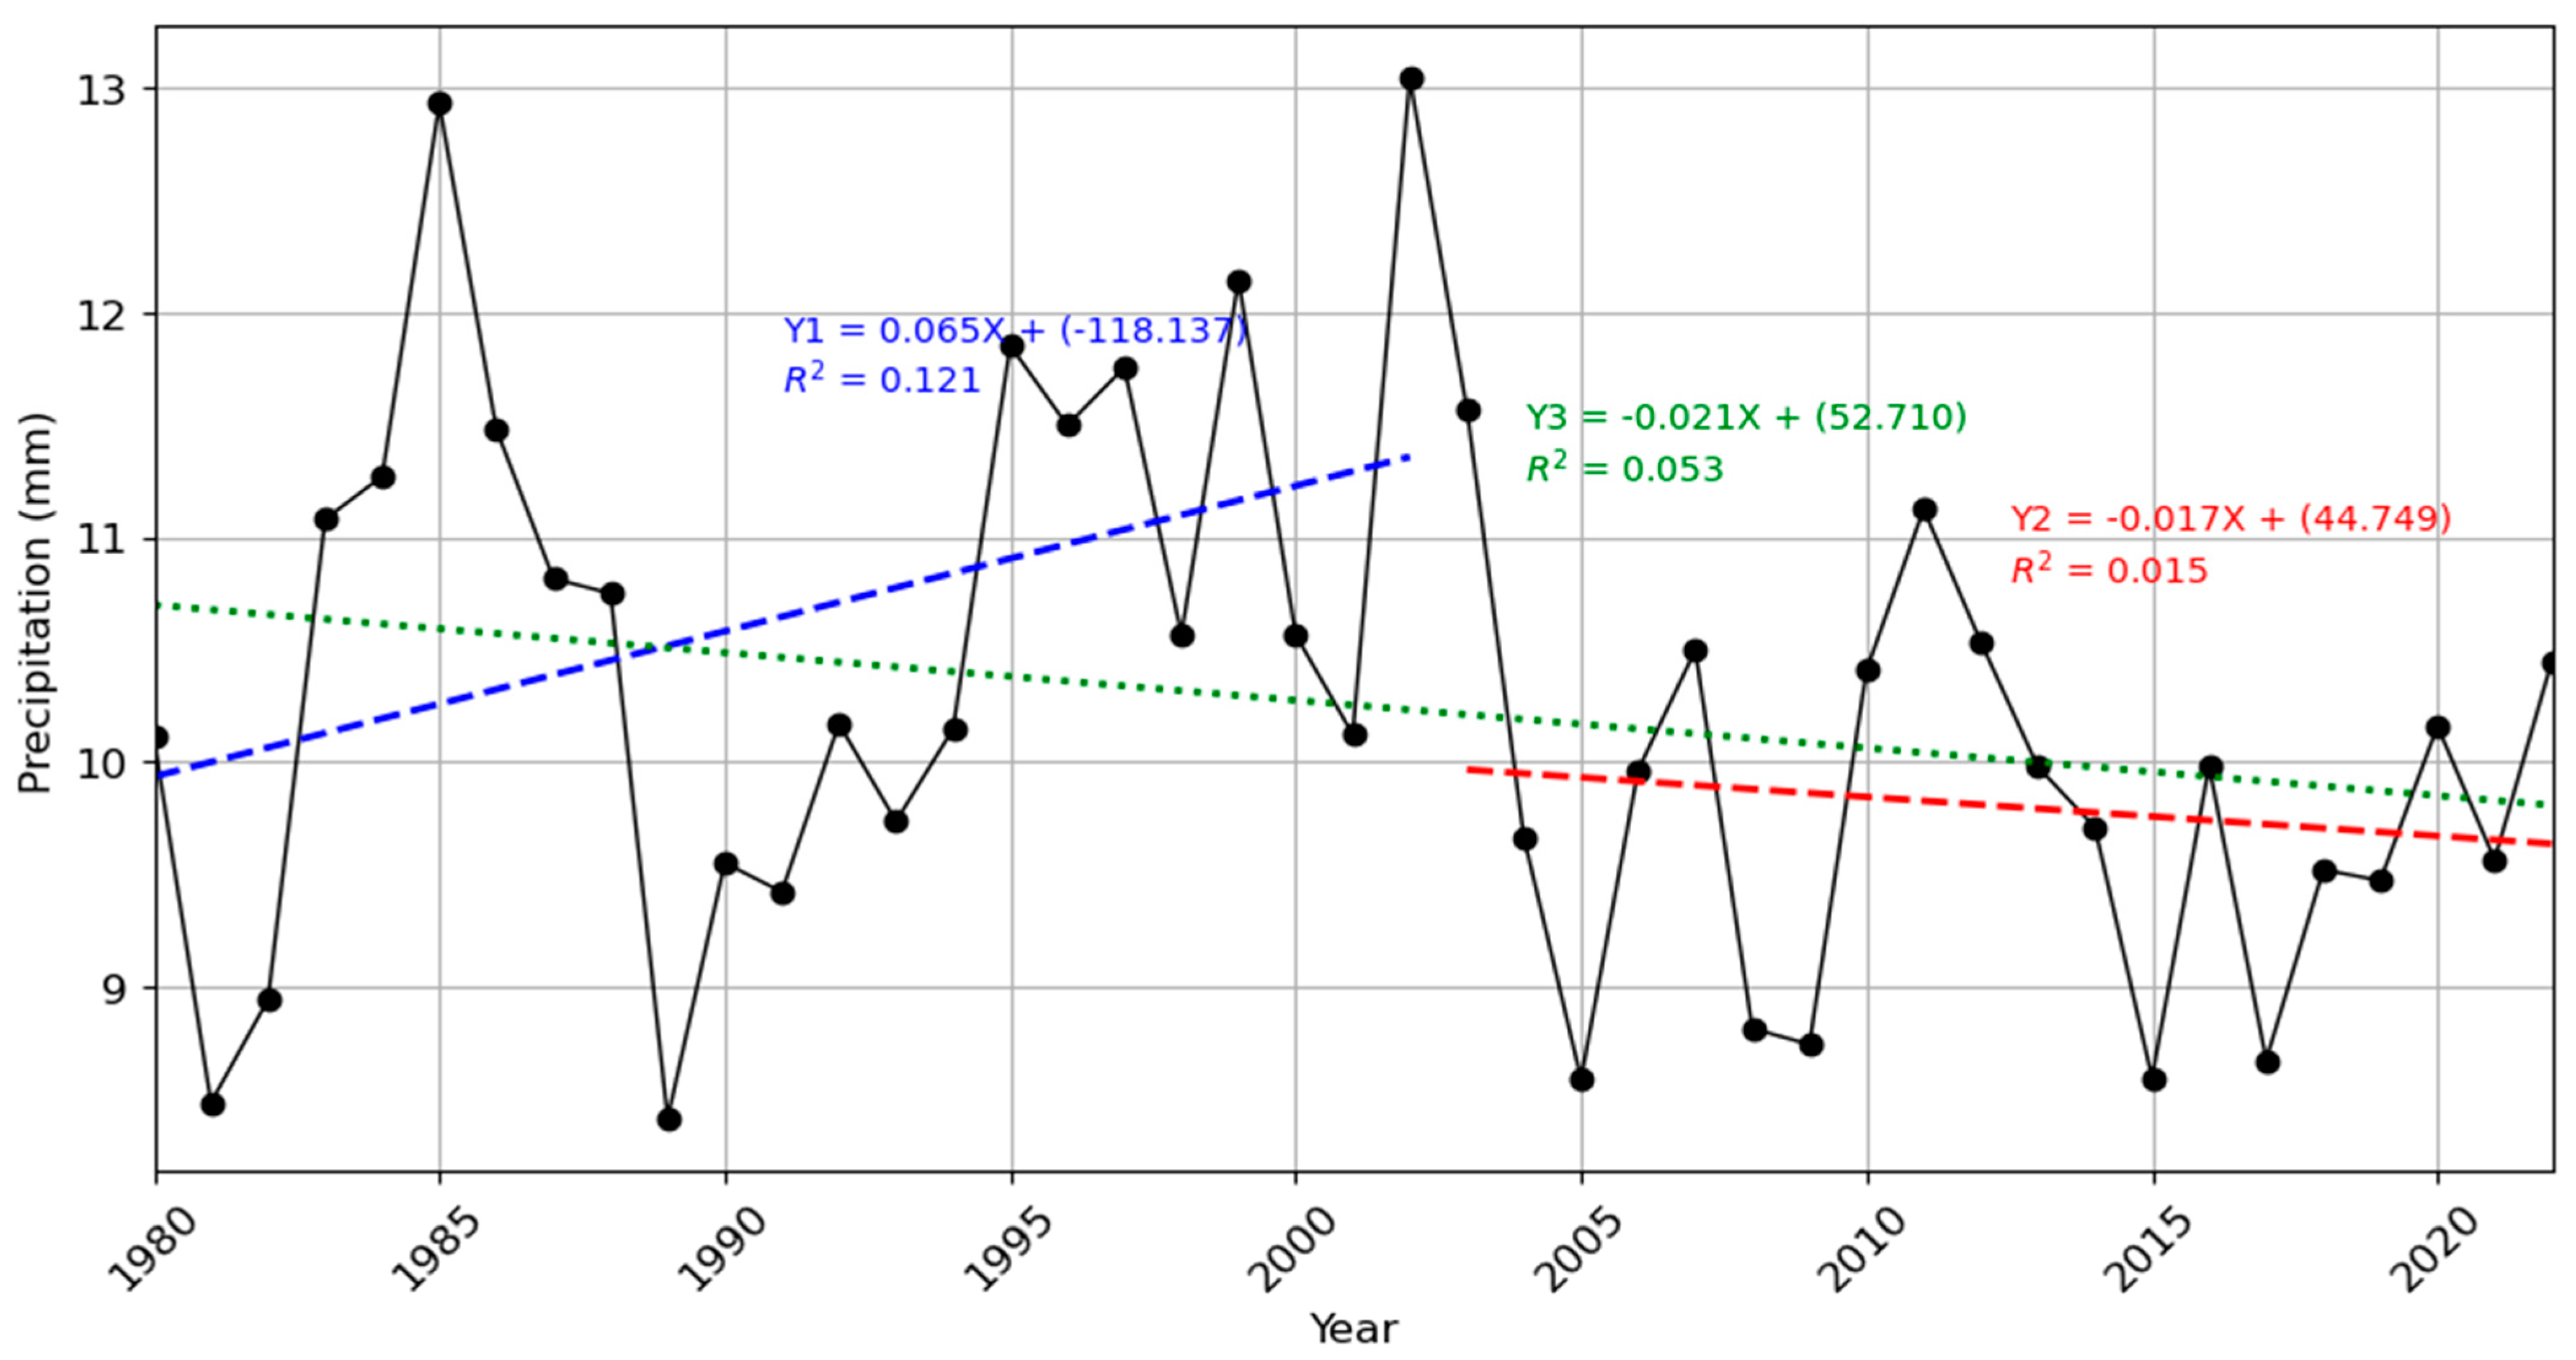
3.3.4. Average Precipitation on Wet Days

Figure 9 illustrates the temporal variation in the average precipitation on wet days, showing an overall fluctuation over the study period (1980–2022). The decadal analysis also reveals no significant increasing or decreasing trend. Initially, the average precipitation increased from 8.5 mm in 1981 to a peak of 12.9 mm before declining to 8.4 mm in 1989. Following this decline, values fluctuated annually, reaching a maximum of 13 mm in 2002. Thereafter, a continuous decline was observed over the next three years, followed by a period of relative stability. From 2005 to 2022, the average precipitation on wet days remained within the range of 8.5–11.1 mm, with noticeable interannual variability throughout the period.

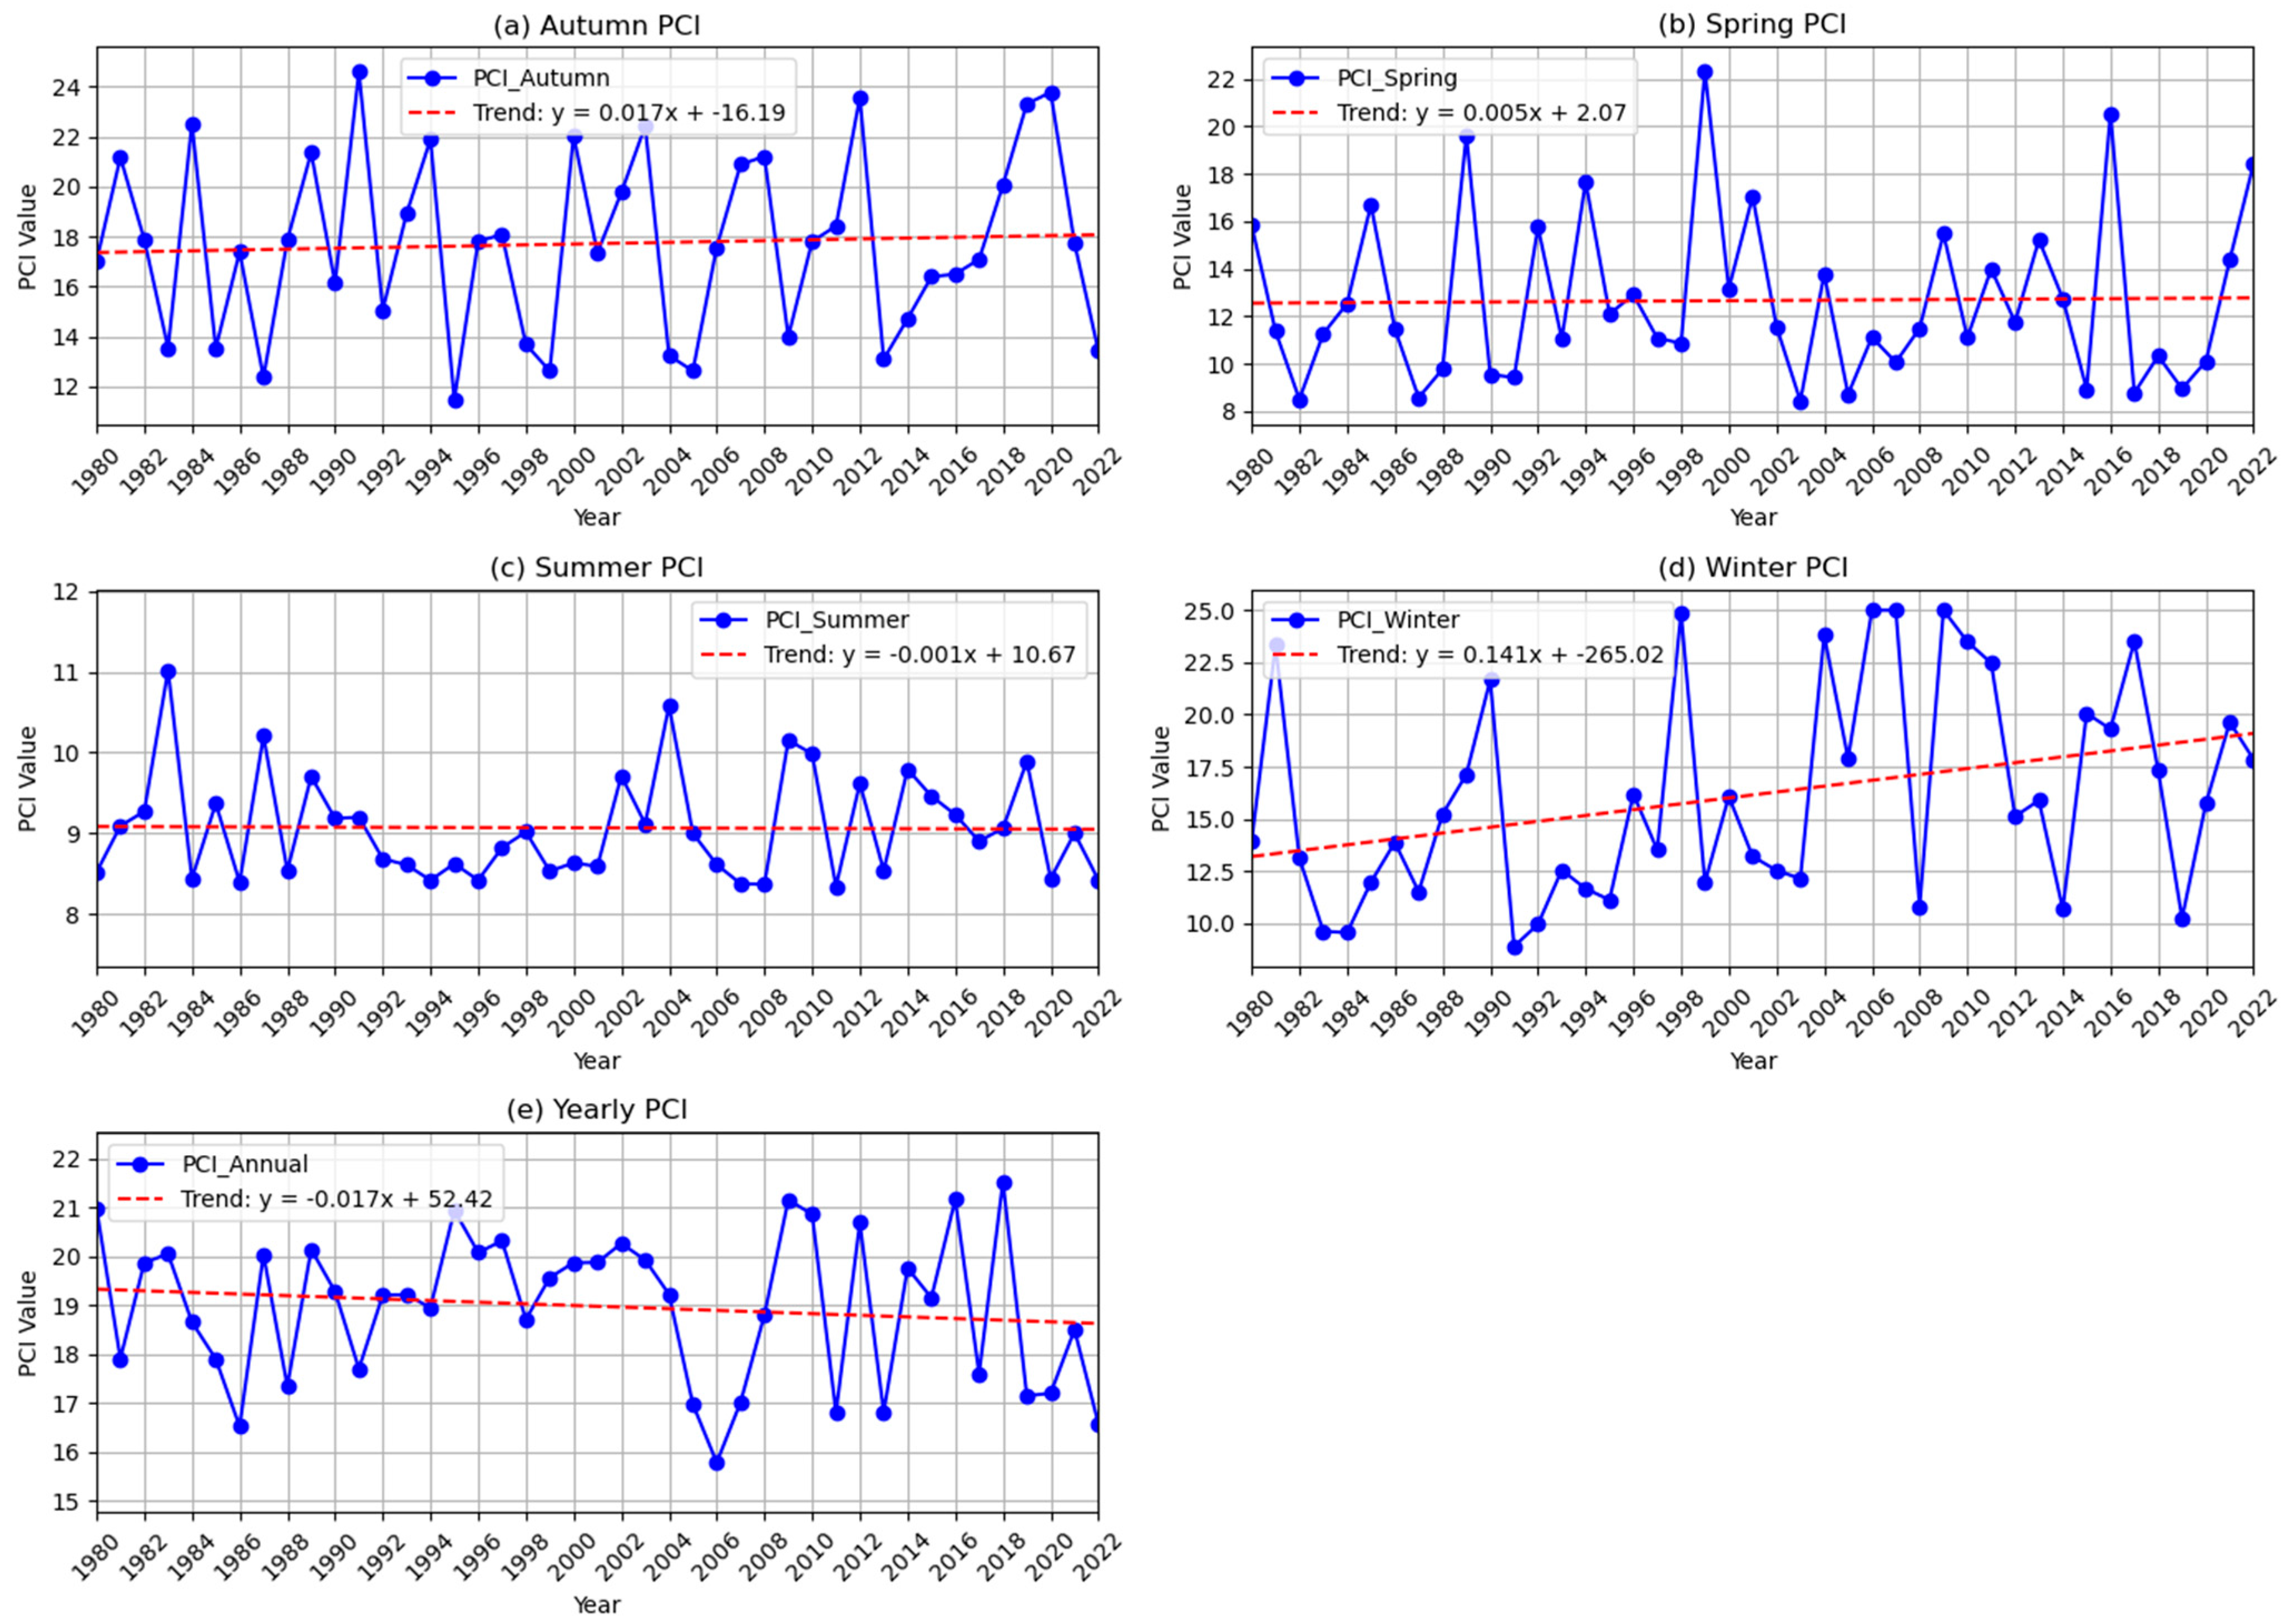
3.4. Precipitation Concentration Index

Figure 10 presents the PCI for the Kathmandu Valley from 1980 to 2022, analyzed on both seasonal and annual scales.
The results show an increasing trend in the PCI during winter at a rate of 1.4 per decade with a 5% significant level (Table 4), whereas for autumn, spring, summer, and annual, there is no significant increasing or decreasing trend that exists. The average PCI values for the annual, autumn, and winter seasons are 18.98, 17.7, and 16.1, respectively, indicating irregular precipitation during these periods. In contrast, the average PCI values for summer and spring are 9 and 12.7, respectively, suggesting uniform and moderately concentrated precipitation during these seasons. In autumn, 17 years fall under the “irregular rainfall” category, while 13 years are classified as “strongly irregular.” During spring, most years (22) exhibit moderate rainfall concentrations, with 10 years exhibiting uniform distribution, 9 years classified as irregular, and 2 years classified as very irregular. For winter, 17 years fall into the moderate category, whereas 11 years are strongly irregular, including 3 years in which the PCI exceeded 25—indicating that most precipitation during those years occurred within approximately one-third of the season. Although spring generally maintains a more uniform rainfall distribution over time, the annual PCI analysis reveals that only 6 years experienced strongly irregular precipitation, whereas the remaining years indicate irregular rainfall distribution across the Kathmandu Valley.

3.5. Mann–Kendall Trend Analysis of Extreme Precipitation for 1980–2022 with Decadal Segmentation (1980–2002 and 2003–2022)

Table 4 presents the results of the Mann–Kendall trend analysis for extreme precipitation indices and the PCI. The analysis reveals that the trends for RX7day, R99pTOT, R35mm, and CDDs are statistically significant at the 5% significance level (p < 0.05), indicating notable changes in these extreme precipitation characteristics over time. Additionally, the PCI for winter exhibits a significant increasing trend, suggesting a shift toward more uneven precipitation distribution during this season. In contrast, the trends for the remaining precipitation indices and seasonal/annual PCI are not statistically significant (p > 0.05), implying that no consistent long-term trends were detected for these variables during the study period. Similarly, Table 5 depicts the results of the Mann–Kendall statistical test for extreme precipitation indices over the periods 1980–2002 and 2003–2022. The analysis reveals a significant increasing trend in RX7day precipitation, with Sen’s slope values of 3.48 for 1980–2002 and 1.76 for 2003–2022, both significant at the 5% level. Additionally, R95pTOT shows a significant upward trend during 1980–2002, with a Sen’s slope of 5.07 at the 5% significance level. The results also indicate a significant increase in consecutive dry days (CDDs) for 2003–2022, with a Sen’s slope of 1.00 at the 5% level, while a similar increasing trend in CDDs is observed for 1980–2002 with a Sen’s slope of 1.43, significant at the 10% level. For the remaining precipitation indices, although some trends are either increasing or decreasing, these are not statistically significant at the 10% level.

3.6. Influence of ENSO on Precipitation

The Niño 3.4 index exhibits both positive and negative correlations with precipitation indices in the Kathmandu Valley, Nepal. A negative correlation indicates that regional precipitation tends to be lower than average during warm anomaly phases in the eastern tropical Pacific (El Niño events). Figure 11 presents the correlation coefficients between various precipitation indices, the PCI, and the Niño 3.4 index, along with their corresponding levels of statistical significance. Total annual precipitation shows a negative correlation of −0.25 with the Niño 3.4 index, which is significant at the 0.1 level. Similarly, the R10mm index demonstrates a stronger negative correlation of −0.35, significant at the 0.05 level, while the R20mm index shows a negative correlation of −0.21, significant at the 0.1 level. The CWDs are also negatively correlated with Niño 3.4 (−0.32), with significance at the 0.05 level. For seasonal variability, the spring PCI exhibits a significant negative correlation of −0.35 with Niño 3.4 at the 0.05 level. In contrast, the annual PCI shows a positive correlation of 0.25, which is significant at the 0.1 level. Additionally, RX1day exhibits a positive correlation of 0.24, which is significant at the 0.1 level.

4. Discussion

Rapid urbanization and reduced infiltration areas in the Kathmandu Valley have heightened the impact of even minor precipitation events, resulting in frequent waterlogging and flooding. These occurrences routinely disrupt traffic, affect pedestrians, and cause property damage and loss of life. This study investigated extreme precipitation in terms of intensity, frequency, and variability using a suite of precipitation indices recommended by the WMO and supported by previous research [53,54,55,56,57,58,59,60]. The Mann–Kendall statistical test and Sen’s slope estimator were applied to the precipitation data from 1980 to 2022 to assess trends.
Monthly precipitation analysis reveals that most of the annual rainfall is concentrated between June and September, with July (425 mm) and August (375 mm) having the highest totals. This pronounced seasonality is largely driven by the Indian summer monsoon, which transports moisture-laden southeasterly winds from the Bay of Bengal [61]. Long-term precipitation trends indicate a slight decline in winter, summer, autumn, and annual precipitation totals, while spring precipitation exhibits an increasing trend of 1.17 mm/year. Notably, July shows a marginal upward trend of 0.2 mm/year, reinforcing its role as the wettest month and a key contributor to flood risk in the Kathmandu Valley. During the wettest months (July and August), minimum precipitation levels range from 247 mm to 260 mm, while the maximum values range from 567 mm to 621 mm. This wide range significantly increases the potential for flooding. These findings are consistent with those of Prajapati and Talchabhadel et al. (2021) and Dhital and Kayastha (2013) [33,62], who identified July and August as the peak flood months. Similarly, Pradhan-Salike and Raj Pokharel (2017) [63] attributed pluvial flooding in the valley to intense, short-duration rainfall events.
Extreme precipitation analysis from 1980 to 2022 reveals an overall increasing trend in RX7day by 0.1 mm/year. However, the decadal analysis (1980–2001 and 2002–2022) indicates sharp fluctuations in extreme precipitation across the RX1day, RX3days, and RX5days indices with an increasing trend for RX7days precipitation being significant. Similar patterns of fluctuations of precipitation are observed for the percentile-based indices R95pTOT and R99pTOT for decadal analysis, whereas a decreasing trend of R99pTOT is significantly observed for 1980 to 2022. These findings suggest that short-duration precipitation demonstrates inconsistency and long-term precipitation shows a slightly increasing trend, which are both partially contradictory to the findings of Luo et al. (2024) [24], who reported a long-term decline in extreme precipitation with highly fluctuation events over Nepal due to the weakening of the South Asian Monsoon circulation, followed by a post-2003 shift toward increasing extreme precipitation, particularly in western Nepal. This trend aligns with broader regional patterns, including a threefold increase in widespread extreme rainfall events over central India between 1950 and 2015, contributing to more frequent flash floods and significant socioeconomic losses [64]. In 2002, Nepal faced an anomalous monsoon with extreme rainfall in the east and center and drought in the west. On 23 July 2002, Kathmandu recorded its highest 24 h rainfall in 14 years (177.0 mm), with nearby areas like Khokana (300.1 mm) and Thankot (249.2 mm) also experiencing record rain. This caused severe flooding and disruptions in the Kathmandu Valley [65].
In the Kathmandu Valley, the number of precipitation days at all thresholds (≥35 mm) declined between 1980 and 2022. Despite this decline, the RX7day index exhibited an increasing trend, suggesting more intense rainfall events over fewer days—intensifying flood risk. Although consecutive wet days (CDDs) showed a slight increase, the average precipitation on wet days declined, indicating a shift toward more extreme precipitation events without a corresponding increase in total rainfall volume. These trends are further supported by Luo et al. (2024) [24], who observed a decrease in moderate rainfall days (R10 mm, R20 mm) and increased extreme precipitation variability. The severe flooding events of September 2024, which brought 239.7 mm of rainfall in just 24 h and resulted in over 200 fatalities and widespread displacement [66], underscore the urgent need for adaptive infrastructure and enhanced disaster preparedness strategies in the Kathmandu Valley.
The PCI analysis reveals an annual PCI value of 18.9, indicating an overall irregular precipitation distribution. This finding aligns with the results of Lamichhane et al. (2024) [4], who reported PCI values across Nepal ranging from 14.06 (moderate) to 25.34 (strongly irregular), with increasing precipitation irregularity particularly evident in lowland regions. While their national analysis identified an increasing PCI trend of 0.53 per decade, the Kathmandu Valley exhibited an increasing trend of the PCI by 1.4 per decade in the winter season. A similar type of increasing PCI value has been observed in China [67] and India [68], where precipitation irregularity has been attributed to climate variability and shifts in monsoon dynamics. Similarly, Rahman and Islam (2019) [69] reported PCI values ranging from 0.57 to 0.632 in Bangladesh, indicating slightly higher precipitation variability than in Nepal.
The influence of ENSO on precipitation patterns across the Asia–Pacific region, including Nepal, is well established [2,70,71,72,73]. Several studies [4,74,75] confirm that during El Niño events, the westward shift of the Pacific warm pool toward the central and eastern Pacific results in the weakening of the Walker circulation and trade winds, along with reduced oceanic upwelling. These processes amplify positive SST anomalies in the eastern Pacific, disrupt global precipitation patterns, and weaken the summer monsoon. Concurrently, the western Pacific cools due to diminished convection, while the Indian Ocean warms as a delayed response through atmospheric teleconnections—independent of the Indian Ocean Dipole (IOD) [40]. In this study, annual precipitation, extreme precipitation indices, and overall precipitation variability in the Kathmandu Valley were negatively correlated with the Niño 3.4 index, consistent with the findings of Lamichhane et al. (2024) [4,24] and Luo et al. (2024) [4,24]. However, positive correlations were observed for the annual PCI (0.25), the summer PCI (0.36), and 1-day maximum precipitation (RX1day, 0.24), suggesting that ENSO influences not only the total precipitation amounts but also the temporal concentration and the occurrence of high-intensity, short-duration events.

5. Conclusions

This study investigates precipitation patterns in the Kathmandu Valley using observed data from 1980 to 2022, with a focus on trends in precipitation intensity, frequency, and concentration at both annual and seasonal scales. By applying the PCI and a set of extreme precipitation indices, this study also assesses the influence of the El Niño–Southern Oscillation (ENSO) on extreme precipitation events in the region.
The results indicate a slight overall increase in long-term precipitation across the Kathmandu Valley with inconsistent short-term precipitation. The spring precipitation exhibits an increasing trend of 1.17 mm per year, with November and December exhibiting an upward trend. The remaining months and seasons show high-fluctuation short-term precipitation contributing to heightened flood risks. The analysis of extreme precipitation indices reveals sharp inconsistency in RX1day, RX3day, and RX5day from 1980 to 2022, while RX7day exhibits a slight increase of 0.1 mm/year. Similarly, decadal analysis reveals a fluctuation trend across all extreme precipitation indices, including R95pTOT, which emphasizes the growing risk of pluvial and fluvial flooding in the valley. The annual precipitation patterns in the Kathmandu Valley are highly irregular, particularly during autumn and winter, whereas summer precipitation remains relatively evenly distributed. ENSO analysis indicates a negative correlation with annual precipitation, extreme precipitation indices, and overall precipitation variability, while showing a positive correlation with the annual and summer PCI and 1-day maximum precipitation (RX1day). ENSO analysis indicates a negative correlation with annual precipitation, extreme precipitation indices, and overall precipitation variability, while showing a positive correlation with the annual and summer PCI and 1-day maximum precipitation (RX1day). Although some of these correlations are statistically significant, they align with established climatic mechanisms. Previous studies demonstrate that El Niño events typically weaken monsoon circulation and reduce moisture transport across Nepal, leading to below-normal rainfall [4,24]. In contrast, La Niña phases enhance moisture influx, often resulting in above-normal rainfall. These mechanisms support the observed variability in precipitation patterns in the Kathmandu Valley, though the influence of ENSO is controlled by local topography and regional atmospheric conditions.
Although this study is limited to a single geographic region with a restricted number of observation stations, its findings are applicable to other areas with similar topographic and climatic conditions throughout the Himalayan region. Future research should incorporate additional climatic variables—such as temperature, humidity, and wind speed—alongside global climate model (GCM) data to improve projections of future precipitation trends and their hydrological implications.

Author Contributions

D.C.: methodology, software, conceptualization, data curation, formal analysis, investigation, writing the original draft. R.L.R.: conceptualization, review and editing. A.O.Y.: writing. N.N.S.: editing. J.P.: analysis. A.F.T.: data collection. J.W.R.: software. D.S.: software. J.-O.L.: review. J.-S.H.: supervision, funding acquisition. All authors have read and agreed to the published version of the manuscript.

Funding

This work was supported by the National Research Foundation of Korea (NRF) grant funded by the Korea government (MSIT) (No. RS-2021-NR060108) and supported by the Korea Institute of Energy Technology Evaluation and Planning (KETEP) and the Ministry of Trade, Industry & Energy (MOTIE) of the Republic of Korea (No. RS-2022-KP002719).

Data Availability Statement

The original contributions presented in this study are included in the article. Further inquiries can be directed to the corresponding author.

Conflicts of Interest

The authors declare that they have no known competing financial interests or personal relationships that could have appeared to influence the work reported in this paper.

References

  1. Summary for Policymakers. In Climate Change 2022—Impacts, Adaptation and Vulnerability; Cambridge University Press: Cambridge, UK, 2023; pp. 3–34. [CrossRef]
  2. An, D.; Eggeling, J.; Zhang, L.; He, H.; Sapkota, A.; Wang, Y.-C.; Gao, C. Extreme precipitation patterns in the Asia–Pacific region and its correlation with El Niño-Southern Oscillation (ENSO). Sci. Rep. 2023, 13, 11068. [Google Scholar] [CrossRef] [PubMed]
  3. Sun, G.; Tiwari, K.R.; Hao, L.; Amatya, D.; Liu, N.; Song, C. Climate change and forest hydrology in future forests. In Future Forests: Mitigation and Adaptation to Climate Change; Elsevier: Amsterdam, The Netherlands, 2024; pp. 95–124. [Google Scholar] [CrossRef]
  4. Lamichhane, D.; Bao, Q.; Dhital, Y.P.; Devkota, R.; Bhattarai, U.; Nepal, B.; Pokharel, A.K.; Dawadi, B. Precipitation Concentration Variability and Its Association with Geographical Factors and ENSO Over Nepal from 1990 to 2020. Earth Syst. Environ. 2024, 8, 1–17. [Google Scholar] [CrossRef]
  5. Karki, R.; Hasson, S.U.; Schickhoff, U.; Scholten, T.; Böhner, J. Rising Precipitation Extremes across Nepal. Climate 2017, 5, 4. [Google Scholar] [CrossRef]
  6. Pandey, V.P.; Shrestha, D.; Adhikari, M. Characterizing natural drivers of water-induced disasters in a rain-fed watershed: Hydro-climatic extremes in the Extended East Rapti Watershed. J. Hydrol. 2021, 598, 126383. [Google Scholar] [CrossRef]
  7. Sun, Q.; Zhang, X.; Zwiers, F.; Westra, S.; Alexander, L.V. A Global, Continental, and Regional Analysis of Changes in Extreme Precipitation. J. Clim. 2021, 34, 243–258. [Google Scholar] [CrossRef]
  8. Donat, M.G.; Lowry, A.L.; Alexander, L.V.; O’Gorman, P.A.; Maher, N. Addendum: More extreme precipitation in the world’s dry and wet regions. Nat. Clim. Change 2016, 6, 508–513. [Google Scholar] [CrossRef]
  9. Papalexiou, S.M.; Montanari, A. Global and Regional Increase of Precipitation Extremes Under Global Warming. Water Resour. Res. 2019, 55, 4901–4914. [Google Scholar] [CrossRef]
  10. Safdar, F.; Mahmood, F.; Khan, M.Z.A.; Arshad, M. Observed and predicted precipitation variability across Pakistan with special focus on winter and pre-monsoon precipitation. Environ. Sci. Pollut. Res. 2023, 30, 4510–4530. [Google Scholar] [CrossRef] [PubMed]
  11. Aditya, F.; Gusmayanti, E.; Sudrajat, J. Rainfall trend analysis using Mann-Kendall and Sen’s slope estimator test in West Kalimantan. IOP Conf. Ser. Earth Environ. Sci. 2021, 893, 012006. [Google Scholar] [CrossRef]
  12. Rahaman, M.H.; Saha, T.K.; Masroor, M.; Roshani; Sajjad, H. Trend analysis and forecasting of meteorological variables in the lower Thoubal river watershed, India using non-parametrical approach and machine learning models. Model Earth Syst. Environ. 2024, 10, 551–577. [Google Scholar] [CrossRef]
  13. Maharana, P.; Agnihotri, R.; Dimri, A.P. Changing Indian monsoon rainfall patterns under the recent warming period 2001–2018. Clim. Dyn. 2021, 57, 2581–2593. [Google Scholar] [CrossRef]
  14. Jihan, M.A.T.; Popy, S.; Kayes, S.; Rasul, G.; Maowa, A.S.; Rahman, M. Climate change scenario in Bangladesh: Historical data analysis and future projection based on CMIP6 model. Sci. Rep. 2025, 15, 7856. [Google Scholar] [CrossRef] [PubMed]
  15. Subba, S.; Ma, Y.-M.; Ma, W.-Q.; Han, C.-B. Extreme precipitation detection ability of four high-resolution precipitation product datasets in hilly area: A case study in Nepal. Adv. Clim. Change Res. 2024, 15, 390–405. [Google Scholar] [CrossRef]
  16. Bell, R.; Fort, M.; Götz, J.; Bernsteiner, H.; Andermann, C.; Etzlstorfer, J.; Posch, E.; Gurung, N.; Gurung, S. Major geomorphic events and natural hazards during monsoonal precipitation 2018 in the Kali Gandaki Valley. Geomorphology 2021, 372, 107451. [Google Scholar] [CrossRef]
  17. Fernando, N.S.; Shrestha, S.; Saurav, K.; Mohanasundaram, S. Investigating major causes of extreme floods using global datasets: A case of Nepal. Prog. Disaster Sci. 2022, 13, 100212. [Google Scholar] [CrossRef]
  18. Khatri, S.K.; Hamal, R.; Poudel, K.R.; Poudel, K.P.; Paudel, N. Rainfall patterns and hazard susceptibility analysis of Pokhara City, Nepal: Implication of climate change. Theor. Appl. Climatol. 2025, 156, 146. [Google Scholar] [CrossRef]
  19. Chhetri, T.B.; Dhital, Y.P.; Tandong, Y.; Devkota, L.P.; Dawadi, B. Observations of heavy rainfall and extreme flood events over Banke-Bardiya districts of Nepal in 2016–2017. Prog. Disaster Sci. 2020, 6, 100074. [Google Scholar] [CrossRef]
  20. Adhikari, N.; Gao, J.; Yao, T.; Yang, Y.; Dai, D. The main controls of the precipitation stable isotopes at Kathmandu. Tellus B Chem. Phys. Meteorol. 2020, 72, 1721967. [Google Scholar] [CrossRef]
  21. Shrestha, S.; Yao, T.; Kattel, D.B.; Devkota, L.P. Precipitation characteristics of two complex mountain river basins on the southern slopes of the central Himalayas. Theor. Appl. Clim. 2019, 138, 1159–1178. [Google Scholar] [CrossRef]
  22. Karki, R.; Talchabhadel, R.; Aalto, J.; Baidya, S.K. New climatic classification of Nepal. Theor. Appl. Clim. 2015, 125, 799–808. [Google Scholar] [CrossRef]
  23. Shrestha, S.; Yao, T.; Adhikari, T.R. Analysis of rainfall trends of two complex mountain river basins on the southern slopes of the Central Himalayas. Atmos. Res. 2019, 215, 99–115. [Google Scholar] [CrossRef]
  24. Luo, Y.; Wang, L.; Hu, C.; Hao, L.; Sun, G. Changing Extreme Precipitation Patterns in Nepal Over 1971–2015. Earth Space Sci. 2024, 11, e2024EA003563. [Google Scholar] [CrossRef]
  25. Shrestha, M.; Acharya, S.C. Assessment of historical and future land-use–land-cover changes and their impact on valuation of ecosystem services in Kathmandu Valley. Land Degrad. Dev. 2020, 32, 3731–3742. [Google Scholar] [CrossRef]
  26. Chaudhary, U.; Shah, M.A.R.; Shakya, B.M.; Aryal, A. Flood Susceptibility and Risk Mapping of Kathmandu Valley Watershed. Sustainability 2024, 16, 7101. [Google Scholar] [CrossRef]
  27. Danegulu, A.; Karki, S.; Bhattarai, P.K.; Pandey, V.P. Characterizing urban flooding in the Kathmandu Valley, Nepal: The influence of urbanization and river encroachment. Nat. Hazards 2024, 120, 10923–10947. [Google Scholar] [CrossRef]
  28. Magar, B.G.; Poudel, J.M.; Paudel, B.; Pokharel, B. Climate change in outskirts of Kathmandu Valley: Local perception and narratives. Nat. Hazards 2024, 120, 8103–8120. [Google Scholar] [CrossRef]
  29. Kc, S.; Shrestha, S.; Ninsawat, S.; Chonwattana, S. Predicting flood events in Kathmandu Metropolitan City under climate change and urbanisation. J. Environ. Manag. 2021, 281, 111894. [Google Scholar] [CrossRef]
  30. Mesta, C.; Cremen, G.; Galasso, C. Urban growth modelling and social vulnerability assessment for a hazardous Kathmandu Valley. Sci. Rep. 2022, 12, 6152. [Google Scholar] [CrossRef]
  31. Prajapati, R.; Upadhyay, S.; Talchabhadel, R.; Thapa, B.R.; Ertis, B.; Silwal, P.; Davids, J.C. Investigating the nexus of groundwater levels, rainfall and land-use in the Kathmandu Valley, Nepal. Groundw. Sustain. Dev. 2021, 14, 100584. [Google Scholar] [CrossRef]
  32. Shrestha, D.; Basnyat, D.B.; Gyawali, J.; Creed, M.J.; Sinclair, H.D.; Golding, B.; Muthusamy, M.; Shrestha, S.; Watson, C.S.; Subedi, D.L.; et al. Rainfall extremes under future climate change with implications for urban flood risk in Kathmandu. Int. J. Disaster Risk Reduct. 2023, 97, 103997. [Google Scholar] [CrossRef]
  33. Prajapati, R.; Talchabhadel, R.; Silwal, P.; Upadhyay, S.; Ertis, B.; Thapa, B.R.; Davids, J.C. Less rain and rainy days—Lessons from 45 years of rainfall data (1971–2015) in the Kathmandu Valley, Nepal. Theor. Appl. Climatol. 2021, 145, 1369–1383. [Google Scholar] [CrossRef]
  34. Shrestha, S.; Semkuyu, D.J.; Pandey, V.P. Assessment of groundwater vulnerability and risk to pollution in Kathmandu Valley. Sci. Total. Environ. 2016, 556, 23–35. [Google Scholar] [CrossRef]
  35. Bharti, P.; Biswas, A. Predicting Urban Growth of Kathmandu Valley Using Artificial Intelligence. J. Geovisualization Spat. Anal. 2024, 8, 40. [Google Scholar] [CrossRef]
  36. Shrestha, S.; Neupane, S.; Mohanasundaram, S.; Pandey, V.P. Mapping groundwater resiliency under climate change scenarios: A case study of Kathmandu Valley. Environ. Res. 2020, 183, 109149. [Google Scholar] [CrossRef]
  37. DHM. Available online: https://www.dhm.gov.np/ (accessed on 4 March 2025).
  38. Ridwan, W.M.; Sapitang, M.; Aziz, A.; Kushiar, K.F.; Ahmed, A.N.; El-Shafie, A. Rainfall forecasting model using machine learning methods: Case study Terengganu. Ain Shams Eng. J. 2021, 12, 1651–1663. [Google Scholar] [CrossRef]
  39. Climate Prediction Center—Monitoring & Data: Current Monthly Atmospheric and Sea Surface Temperatures Index Values. Available online: https://www.cpc.ncep.noaa.gov/data/indices/ (accessed on 4 March 2025).
  40. Ehsan, M.A.; Tippett, M.K.; Robertson, A.W.; Singh, B.; Rahman, M.A. The ENSO Fingerprint on Bangladesh Summer Monsoon Rainfall. Earth Syst. Environ. 2023, 7, 617–627. [Google Scholar] [CrossRef]
  41. Lenssen, N.J.L.; Goddard, L.; Mason, S. Seasonal Forecast Skill of ENSO Teleconnection Maps. Weather. Forecast. 2020, 35, 2387–2406. [Google Scholar] [CrossRef]
  42. Sahoo, M.; Yadav, R.K. Teleconnection of Atlantic Nino with summer monsoon rainfall over northeast India. Glob. Planet. Change 2021, 203, 103550. [Google Scholar] [CrossRef]
  43. Yang, Y.-M.; Park, J.-H.; An, S.-I.; Wang, B.; Luo, X. Mean sea surface temperature changes influence ENSO-related precipitation changes in the mid-latitudes. Nat. Commun. 2021, 12, 1495. [Google Scholar] [CrossRef]
  44. Mann, H.B. Nonparametric Tests Against Trend. 1945. Available online: https://www.jstor.org/stable/1907187 (accessed on 1 January 2025).
  45. Ahmed, I.A.; Shahfahad; Dutta, D.K.; Baig, M.R.I.; Roy, S.S.; Rahman, A. Implications of changes in temperature and precipitation on the discharge of Brahmaputra River in the urban watershed of Guwahati. Environ. Monit. Assess. 2021, 193, 518. [Google Scholar] [CrossRef]
  46. Obuobie, E.; Osei, M.A.; Addi, M.; Agyekum, J.; Akurugu, B.A.; Bazaanah, P.; Gaisie-Essilfie, F.A.; Appiah, G. Analysis of spatio-temporal trends in climate extremes in the Lower Volta Basin. Theor. Appl. Clim. 2025, 156, 120. [Google Scholar] [CrossRef]
  47. Zhang, X.; Alexander, L.; Hegerl, G.C.; Jones, P.; Tank, A.K.; Peterson, T.C.; Trewin, B.; Zwiers, F.W. Indices for monitoring changes in extremes based on daily temperature and precipitation data. Wires Clim. Change 2011, 2, 851–870. [Google Scholar] [CrossRef]
  48. Oliver, J.E. Monthly Precipitation Distribution: A Comparative Index. Prof. Geogr. 1980, 32, 300–309. [Google Scholar] [CrossRef]
  49. Bandar, Q.K.A.; Muslih, K.D. Spatial assessment of precipitation concentration and seasonality in Iraq. Theor. Appl. Clim. 2025, 156, 134. [Google Scholar] [CrossRef]
  50. Du, J.; Yu, X.; Zhou, L.; Li, X.; Ao, T. Less concentrated precipitation and more extreme events over the Three River Headwaters region of the Tibetan Plateau in a warming climate. Atmospheric Res. 2024, 303, 107311. [Google Scholar] [CrossRef]
  51. Bhattacharyya, S.; Sreekesh, S. Assessments of multiple gridded-rainfall datasets for characterizing the precipitation concentration index and its trends in India. Int. J. Clim. 2021, 42, 3147–3172. [Google Scholar] [CrossRef]
  52. Tolika, K. On the analysis of the temporal precipitation distribution over Greece using the Precipitation Concentration Index (PCI): Annual, seasonal, monthly analysis and association with the atmospheric circulation. Theor. Appl. Climatol. 2019, 137, 2303–2319. [Google Scholar] [CrossRef]
  53. Amiri, M.A.; Gocić, M. Analyzing the applicability of some precipitation concentration indices over Serbia. Theor. Appl. Clim. 2021, 146, 645–656. [Google Scholar] [CrossRef]
  54. Balling, R.C.; Kiany, M.S.K.; Roy, S.S.; Khoshhal, J. Trends in Extreme Precipitation Indices in Iran: 1951–2007. Adv. Meteorol. 2016, 2016, 2456809. [Google Scholar] [CrossRef]
  55. De Lima, M.I.P.; Santo, F.E.; Ramos, A.M.; Trigo, R.M. Trends and correlations in annual extreme precipitation indices for mainland Portugal, 1941–2007. Theor. Appl. Climatol. 2015, 119, 55–75. [Google Scholar] [CrossRef]
  56. Gocic, M.; Shamshirband, S.; Razak, Z.; Petković, D.; Ch, S.; Trajkovic, S. Long-Term Precipitation Analysis and Estimation of Precipitation Concentration Index Using Three Support Vector Machine Methods. Adv. Meteorol. 2016, 2016, 7912357. [Google Scholar] [CrossRef]
  57. Michiels, P.; Gabriels, D.; Hartmann, R. Using the seasonal and temporal Precipitation concentration index for characterizing the monthly rainfall distribution in Spain. CATENA 1992, 19, 43–58. [Google Scholar] [CrossRef]
  58. Petković, D.; Gocic, M.; Trajkovic, S.; Milovančević, M.; Šević, D. Precipitation concentration index management by adaptive neuro-fuzzy methodology. Clim. Change 2017, 141, 655–669. [Google Scholar] [CrossRef]
  59. Ryan, C.; Curley, M.; Walsh, S.; Murphy, C. Long-term trends in extreme precipitation indices in Ireland. Int. J. Clim. 2021, 42, 4040–4061. [Google Scholar] [CrossRef]
  60. Sarr, M.A.; Zoromé, M.; Seidou, O.; Bryant, C.R.; Gachon, P. Recent trends in selected extreme precipitation indices in Senegal—A changepoint approach. J. Hydrol. 2013, 505, 326–334. [Google Scholar] [CrossRef]
  61. Chhetri, R.; Pandey, V.P.; Talchabhadel, R.; Thapa, B.R. How do CMIP6 models project changes in precipitation extremes over seasons and locations across the mid hills of Nepal? Theor. Appl. Clim. 2021, 145, 1127–1144. [Google Scholar] [CrossRef]
  62. Dhital, Y.; Kayastha, R. causes and impacts of flooding in the Bagmati River Basin. J. Flood Risk Manag. 2013, 6, 253–260. [Google Scholar] [CrossRef]
  63. Pradhan-Salike, I.; Pokharel, J.R. Impact of Urbanization and Climate Change on Urban Flooding: A case of the Kathmandu Valley. J. Nat. Resour. Dev. 2017, 7, 56–66. [Google Scholar] [CrossRef]
  64. Roxy, M.K.; Ghosh, S.; Pathak, A.; Athulya, R.; Mujumdar, M.; Murtugudde, R.; Terray, P.; Rajeevan, M. A threefold rise in widespread extreme rain events over central India. Nat. Commun. 2017, 8, 708. [Google Scholar] [CrossRef]
  65. Society of Hydrologists and Meteorologists-Nepal. SOHAM_Newsletter_Vol-1_-No-1_October-Novermber-2002. Available online: https://soham.org.np/newsletter/soham-nepal-newsletter-8/ (accessed on 1 January 2025).
  66. Durbar, S. A Preliminary Loss and Damage Assessment of Flood and Landslide National Disaster Risk Reduction and Management Authority Preliminary Loss and Damage Assessment of Flood and Landslide September 2024 Published by Government of Nepal Ministry of Home Affairs National Disaster Risk Reduction and Management Authority. 2024. Available online: www.bipad.gov.np (accessed on 12 March 2025).
  67. Guo, E.; Wang, Y.; Jirigala, B.; Jin, E. Spatiotemporal variations of precipitation concentration and their potential links to drought in mainland China. J. Clean. Prod. 2020, 267, 122004. [Google Scholar] [CrossRef]
  68. Nandargi, S.S.; Aman, K. Precipitation concentration changes over India during 1951 to 2015. Sci. Res. Essays 2018, 13, 14–26. [Google Scholar] [CrossRef]
  69. Rahman, S.; Islam, A.R.M.T. Are precipitation concentration and intensity changing in Bangladesh overtimes? Analysis of the possible causes of changes in precipitation systems. Sci. Total. Environ. 2019, 690, 370–387. [Google Scholar] [CrossRef] [PubMed]
  70. Rashid, I.U.; Abid, M.A.; Almazroui, M.; Kucharski, F.; Hanif, M.; Ali, S.; Ismail, M. Early summer surface air temperature variability over Pakistan and the role of El Niño–Southern Oscillation teleconnections. Int. J. Clim. 2022, 42, 5768–5784. [Google Scholar] [CrossRef]
  71. Shrestha, A.; Kostaschuk, R. El Niño/Southern Oscillation (ENSO)-related variablity in mean-monthly streamflow in Nepal. J. Hydrol. 2005, 308, 33–49. [Google Scholar] [CrossRef]
  72. Kadel, I.; Yamazaki, T.; Iwasaki, T.; Abdillah, M.R. Projection of future monsoon precipitation over the central Himalayas by CMIP5 models under warming scenarios. Clim. Res. 2018, 75, 1–21. [Google Scholar] [CrossRef]
  73. Xu, Z.X.; Takeuchi, K.; Ishidaira, H. Correlation between El Niño-Southern Oscillation (ENSO) and precipitation in South-east Asia and the Pacific region. Hydrol. Process. 2003, 18, 107–123. [Google Scholar] [CrossRef]
  74. Izumo, T.; Lengaigne, M.; Vialard, J.; Luo, J.-J.; Yamagata, T.; Madec, G. Influence of Indian Ocean Dipole and Pacific recharge on following year’s El Niño: Interdecadal robustness. Clim. Dyn. 2013, 42, 291–310. [Google Scholar] [CrossRef]
  75. Leupold, M.; Pfeiffer, M.; Watanabe, T.K.; Reuning, L.; Garbe-Schönberg, D.; Shen, C.-C.; Brummer, G.-J.A. El Niño-Southern Oscillation and internal sea surface temperature variability in the tropical Indian Ocean since 1675. Clim. Past 2021, 17, 151–170. [Google Scholar] [CrossRef]
Figure 1. Study area with rain gauge stations.
Water 17 01397 g001
Figure 2. Thiessen polygon of the Kathmandu Valley.
Water 17 01397 g002
Figure 3. Monthly average precipitation in Kathmandu Valley from 1980 to 2022.
Water 17 01397 g003
Figure 4. Seasonal and annual precipitation trends in the Kathmandu Valley from 1980 to 2022 with dotted trend line slopes: blue (annual, −1.14), green (summer, −1.68), purple (autumn, −0.79), red (spring, 1.28), and yellow (winter, 0.05) mm/year.
Water 17 01397 g004
Figure 5. Time series of maximum-intensity precipitation.
Water 17 01397 g005
Figure 6. Time series of 95th and 99th percentile precipitation.
Water 17 01397 g006
Figure 7. Precipitation days under different precipitation thresholds.
Water 17 01397 g007
Figure 8. Annual consecutive wet and day days [(a) wet days (b) dry days].
Water 17 01397 g008
Figure 9. Wet-day average precipitation from 1980 to 2022.
Water 17 01397 g009
Figure 10. Time series of annual and seasonal precipitation concentration index.
Water 17 01397 g010
Figure 11. Correlation between the Nino 3.4 index and precipitation indices.
Water 17 01397 g011
Table 1. Extreme precipitation indices.
Precipitation IndicesAbbreviationUnitDescription
Maximum 1-day precipitation amountRX1daymmIntensity of precipitation
Maximum 3-day precipitation amountRX3daymmIntensity of precipitation
Maximum 5-day precipitation amountRX5daymmIntensity of precipitation
Maximum 7-day precipitation amountRX7daymmIntensity of precipitation
Total precipitation on days exceeding the 95th percentile (very wet days)R95pTOTmmIntensity of precipitation
Total precipitation on days exceeding the 99th percentile (extremely wet days)R99pTOTmmIntensity of precipitation
Count of days with precipitation ≥ 10 mm (heavy precipitation days)R10 mmdaysFrequency of precipitation
Count of days with precipitation ≥ 20 mm (very heavy precipitation days)R20 mmdaysFrequency of precipitation
Count of days with precipitation ≥ 35 mm (extreme precipitation days)R35 mmdaysFrequency of precipitation
Maximum number of consecutive dry days (precipitation < 1 mm)CDDsdaysFrequency of precipitation
Maximum number of consecutive wet days (precipitation > 1 mm)CWDsdaysFrequency of precipitation
Simple Daily Intensity Index (SDII)—average precipitation on wet daysSDIImm/dayIntensity of precipitation
Table 2. Precipitation concentration threshold index.
PCI ThresholdDescription
<10Uniform
11–15Moderate
16–20Irregular
>20Strongly irregular
Table 3. Results of the Mann–Kendall test for precipitation trends in the time series (1980–2022).
PeriodMin (mm)Max (mm)Mean (mm)SD (mm)CV (%)Mann–Kendall Z-ValueMann–Kendall p-ValueSen’s Slope (mm/year)Trend
January070.214.417.6121.8−0.180.86−0.006NS
February083.722.421.093.80.540.590.106NS
March0.298.631.024.077.40.120.910.024NS
April2.2136.458.234.058.40.950.130.361NS
May44.2251.2132.650.337.90.370.170.211NS
June90.4559.6242.797.540.2−0.320.75−0.419NS
July247.2621.6413.295.223.00.140.890.226NS
August260.1567.1375.367.217.9−1.370.17−0.866NS
September103.4430.4218.474.834.3−0.030.97−0.016NS
October1.3201.651.950.898.00.180.860.042NS
November064.25.611.3202.5−2.240.03−0.035
December078.611.419.3168.4−2.390.02−0.031
Winter0.2143.148.332.767.7−0.160.88−0.088NS
Summer703.31386.91031.2166.016.1−0.830.41−1.661NS
Spring104.5368.7221.867.930.61.370.041.174
Autumn119.2567.8275.892.933.7−0.120.91−0.125NS
Annual1155.72061.61577.1224.714.2−0.450.65−0.806NS
NS = not significant; ↑ = increasing trend; ↓ = decreasing trend.
Table 4. Results of the Mann–Kendall statistical test for extreme precipitation in the time series (1980–2022).
Precipitation IndicesMean (mm)SD (mm)CV (%)Mann–Kendall Z-ValueMann–Kendall p-ValueSen’s Slope (mm/year)
RX1day61.2717.3127.92−0.060.60−0.17
RX3day113.5626.1622.76−0.080.47−0.26
RX5day148.7329.0119.270.010.96−0.04
RX7day180.4538.3220.980.050.03 *0.08
R95pTOT586.83173.5129.21−0.080.44−2.00
R99pTOT182.63118.0963.89−0.160.03 *−1.96
R10mm54.749.0016.250.030.75−0.03
R20mm20.454.8223.28−0.010.95−0.01
R35mm5.172.6250.14−0.180.05 *−0.05
CDDs73.8124.9233.360.240.02 *0.69
CWDs41.3116.1038.510.010.900.09
PRCPTOT1550.62215.3813.72−0.050.67−1.12
SDII10.191.0810.51−0.170.11−0.02
PCI—autumn17.723.6420.320.040.680.02
PCI—spring12.663.5127.380.020.860.01
PCI—summer9.070.667.24−0.010.920.00
PCI—winter16.155.1131.280.230.03 *0.14
PCI—annual18.981.537.95−0.070.50−0.02
Note: * = statistically significant at 5% significance level.
Table 5. Results of the Mann–Kendall statistical test for extreme precipitation in the time series (1980–2002 and 2003 to 2022).
1980–20022003–2022
Precipitation IndicesMean (mm)SD (mm)CV (%)Mann–Kendall Z-ValueMann–Kendall p-ValueSen’s Slope (mm/year)Mean (mm)SD (mm)CV (%)Mann–Kendall Z-ValueMann–Kendall p-ValueSen’s Slope (mm/year)
RX1day64.5618.6628.200.090.610.3157.9915.6226.280.120.460.49
RX3day119.2124.5420.090.080.650.62107.9127.0924.500.130.420.80
RX5day153.5331.6320.100.200.221.56143.9326.0117.640.170.290.91
RX7day186.9241.9721.910.330.04 *3.48173.9734.0719.110.240.05 *1.76
R95pTOT625.16189.3629.560.140.03 *5.07548.49150.9126.850.100.574.45
R99pTOT213.62113.6751.930.080.652.21151.64116.8475.190.040.79−2.5
R10mm56.108.9715.600.200.200.5053.389.0516.540.180.260.40
R20mm21.145.3424.650.170.290.2519.764.2521.000.160.330.17
R35mm6.002.6342.720.040.810.004.332.3953.920.090.580.00
CDDs67.5223.2033.540.270.09 **1.4380.1025.5331.110.220.04 *1.00
CWDs39.9016.1839.56−0.140.38−0.3042.7116.3037.24−0.020.900.00
PRCPTOT1581.39210.7213.000.070.702.431519.86220.6914.170.120.466.17
SDII10.561.2011.110.210.200.079.810.828.18−0.080.65−0.02
Note: * = statistically significant at 5% significance level; ** = statistically significant at 10% significance level.
Disclaimer/Publisher’s Note: The statements, opinions and data contained in all publications are solely those of the individual author(s) and contributor(s) and not of MDPI and/or the editor(s). MDPI and/or the editor(s) disclaim responsibility for any injury to people or property resulting from any ideas, methods, instructions or products referred to in the content.

