
Effectiveness of Water-Sensitive Urban Design Techniques on Stormwater Quantity Management at a Residential Allotment Scale


Abstract
1. Introduction
Observed Performance of WSUD Techniques for Managing Stormwater Quantity
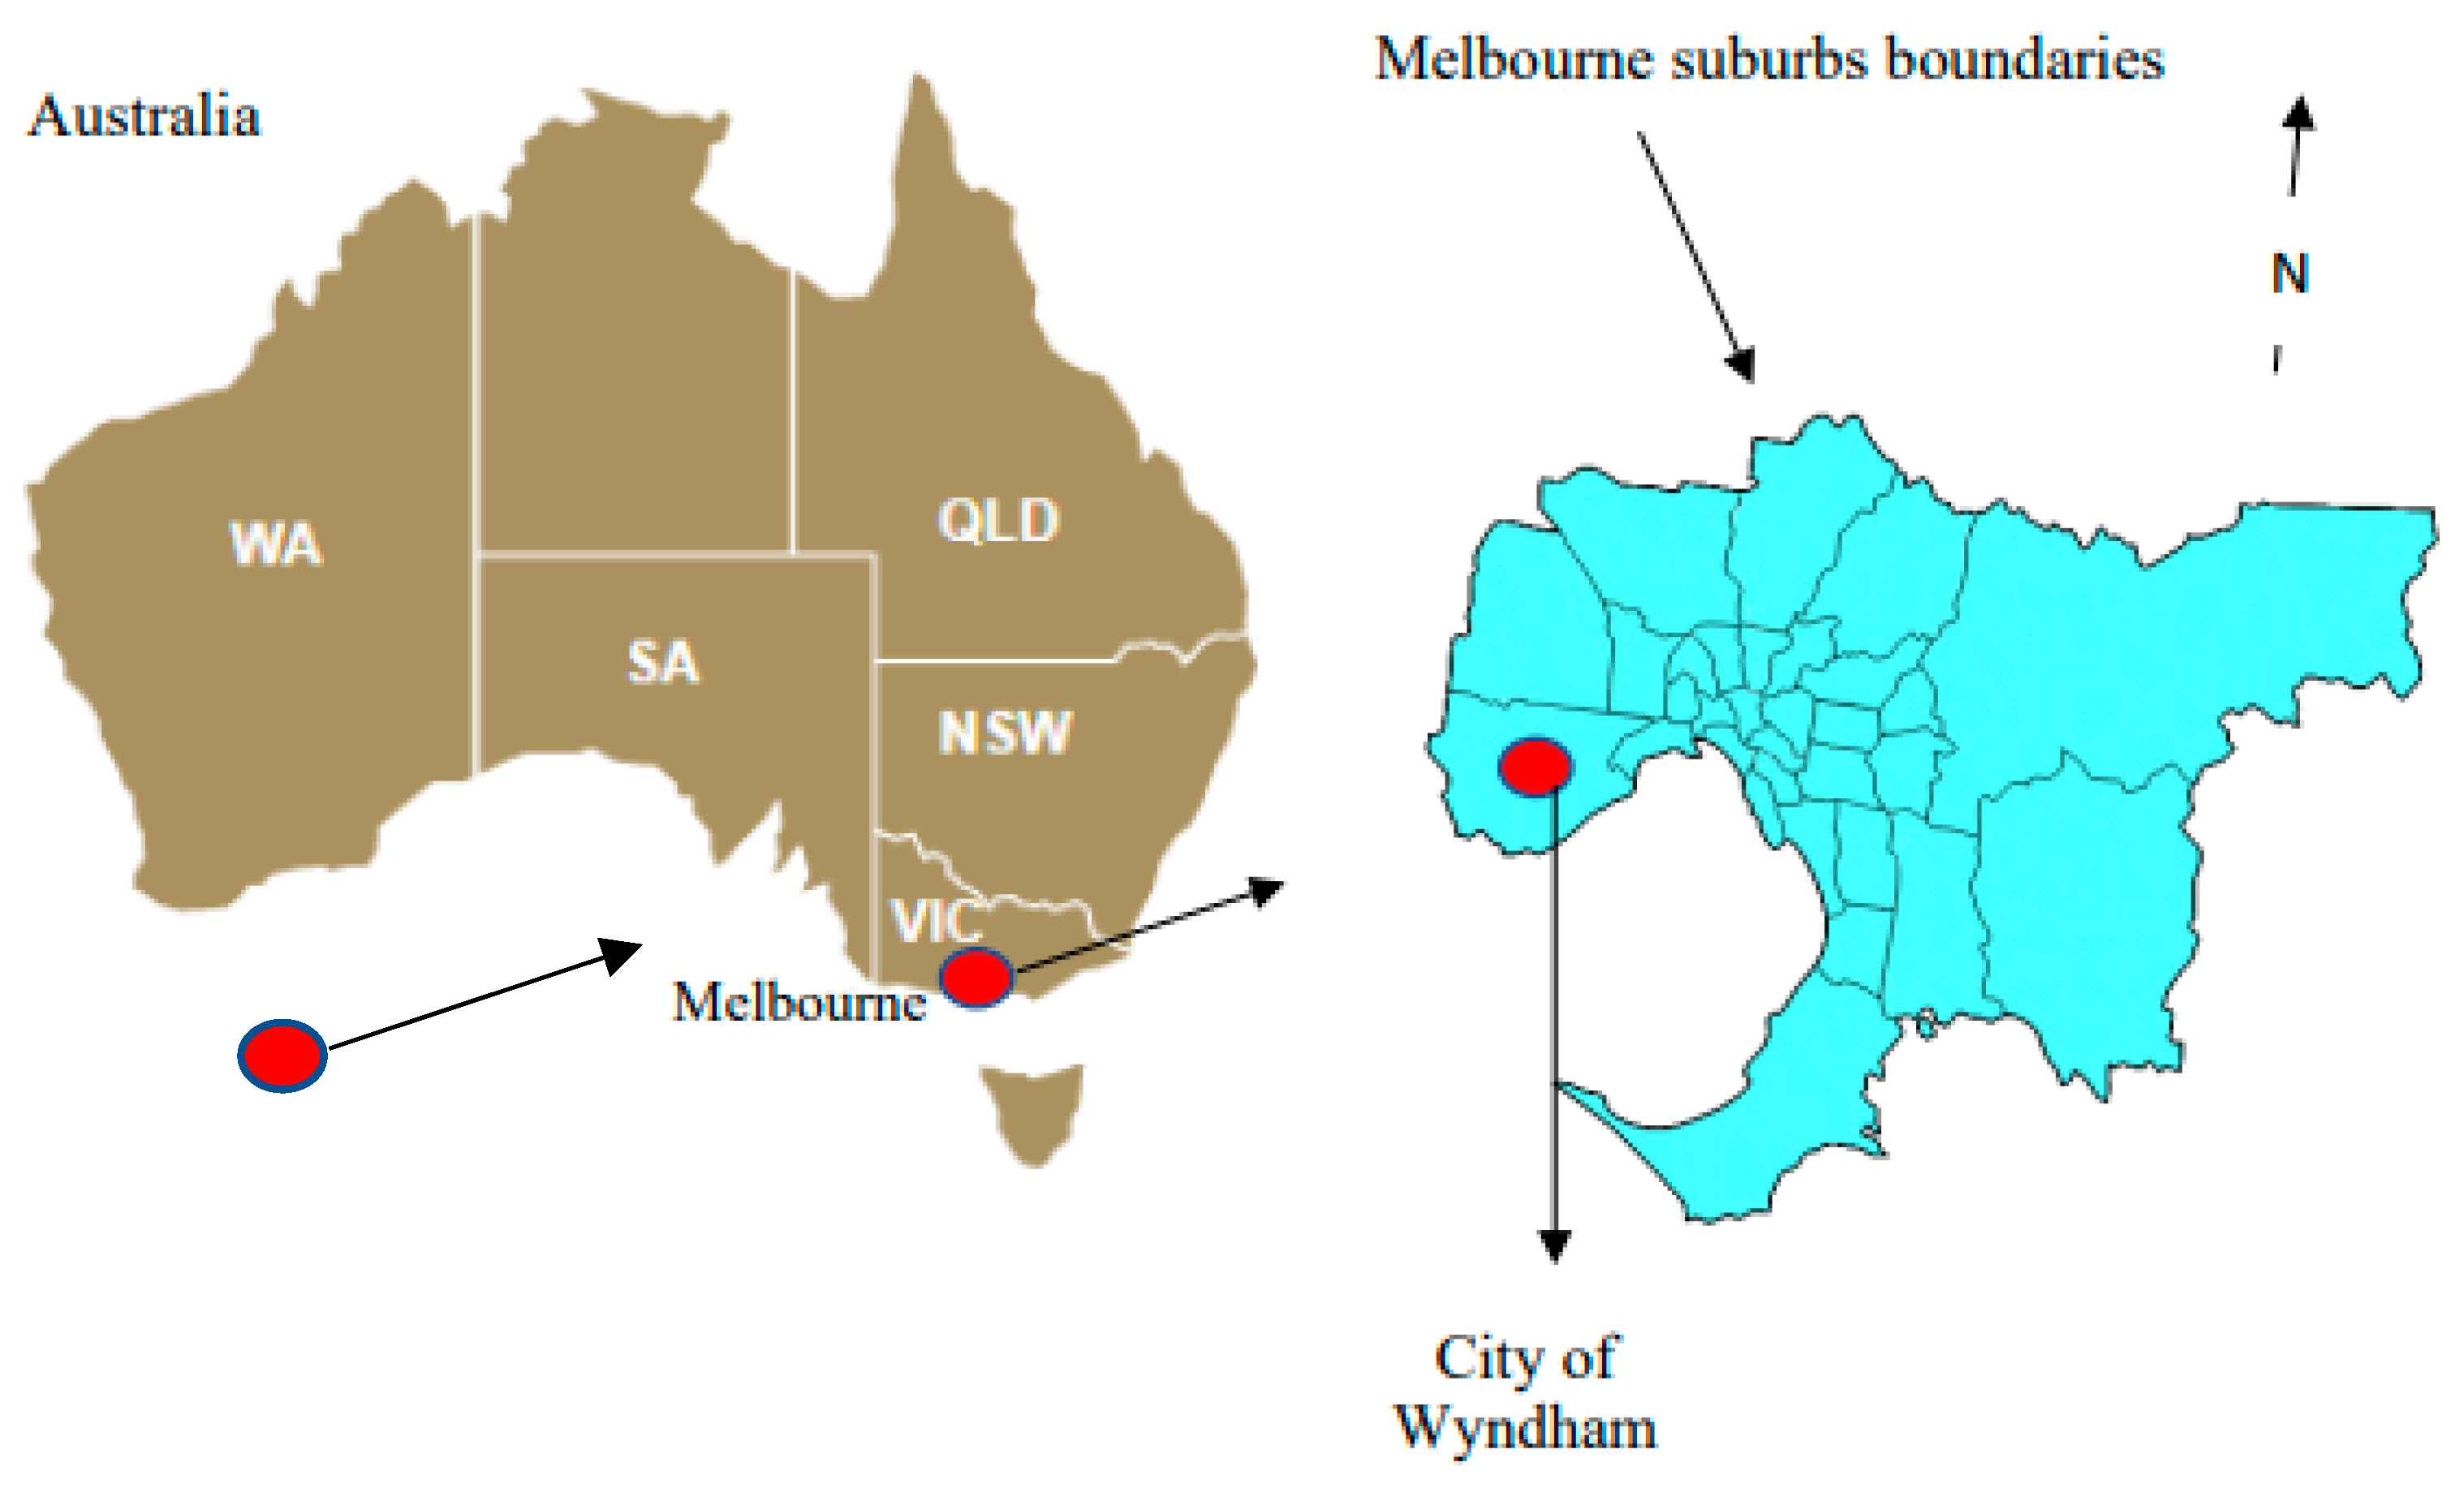
2. Study Area
3. Research Methodology
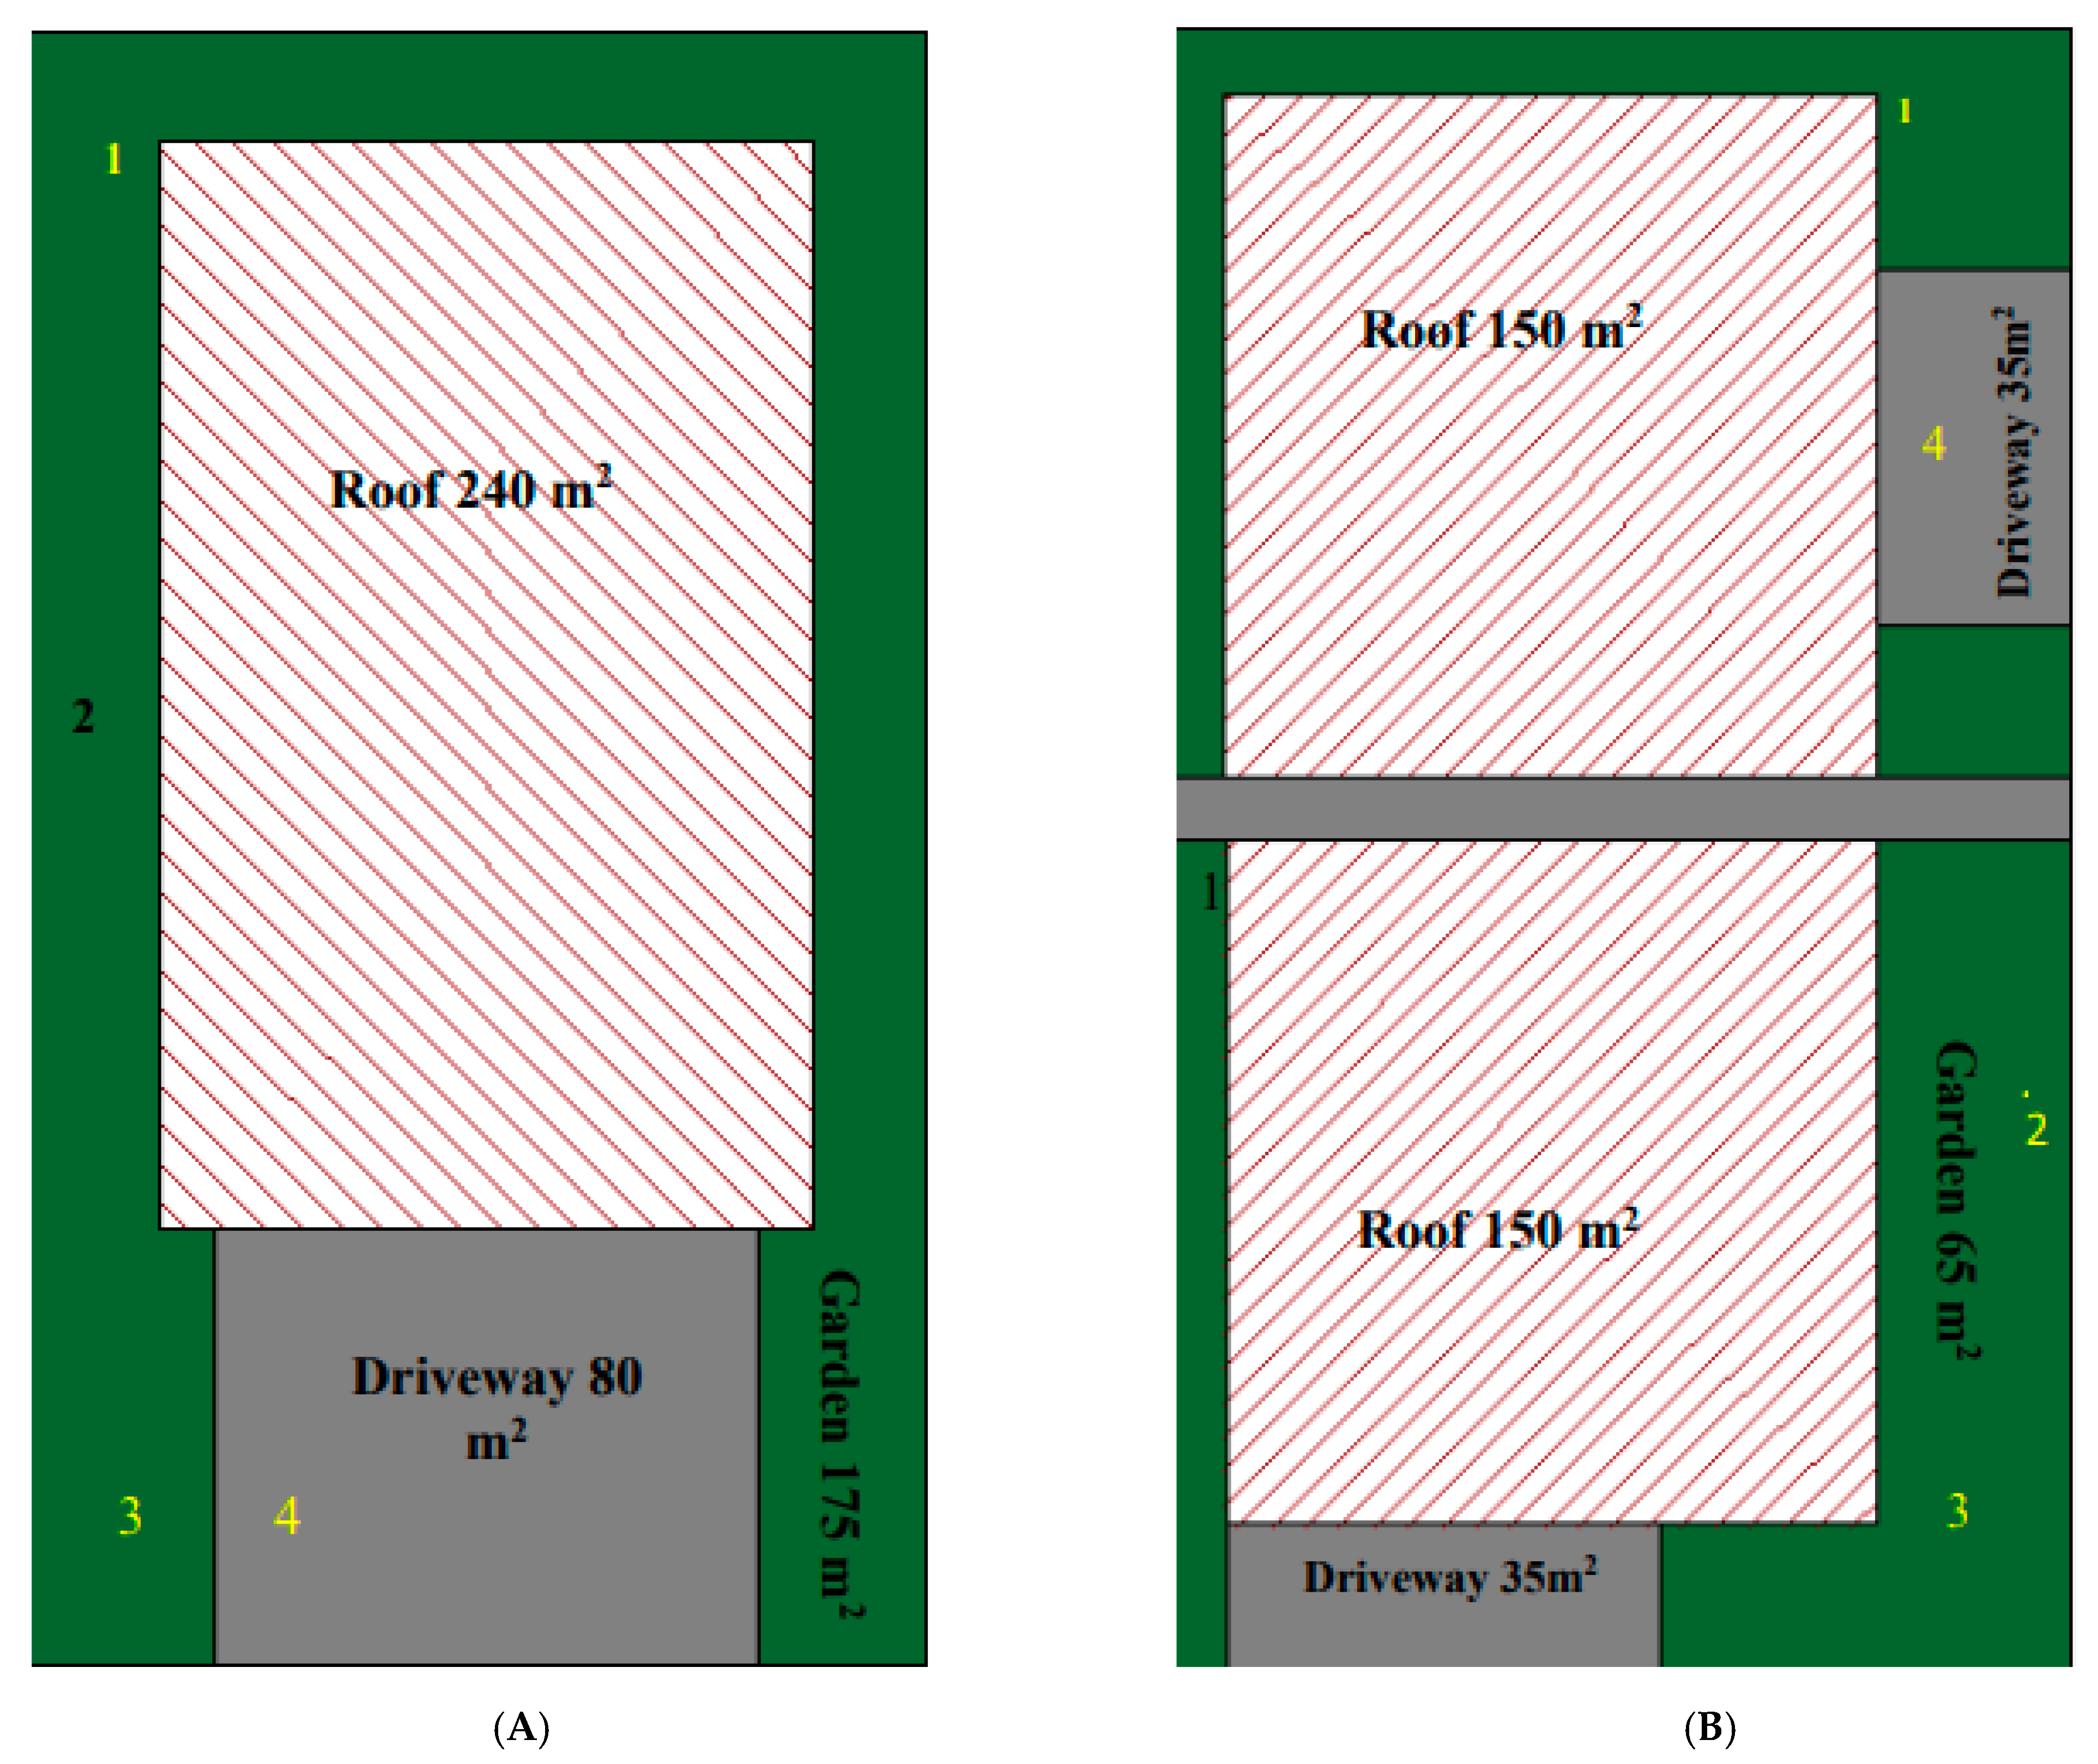
3.1. Step 1: Understand the Size of Components of a Residential Allotment in the Study Area
3.2. Step 2: Select Suitable WSUD Techniques for the Selected Residential Allotment
3.3. Step 3: Define Suitable Stormwater Management Target
3.4. Step 4: Development of Scenarios for WSUD Techniques Assessment
3.5. Step 5: Stormwater Model Development and Application
- -
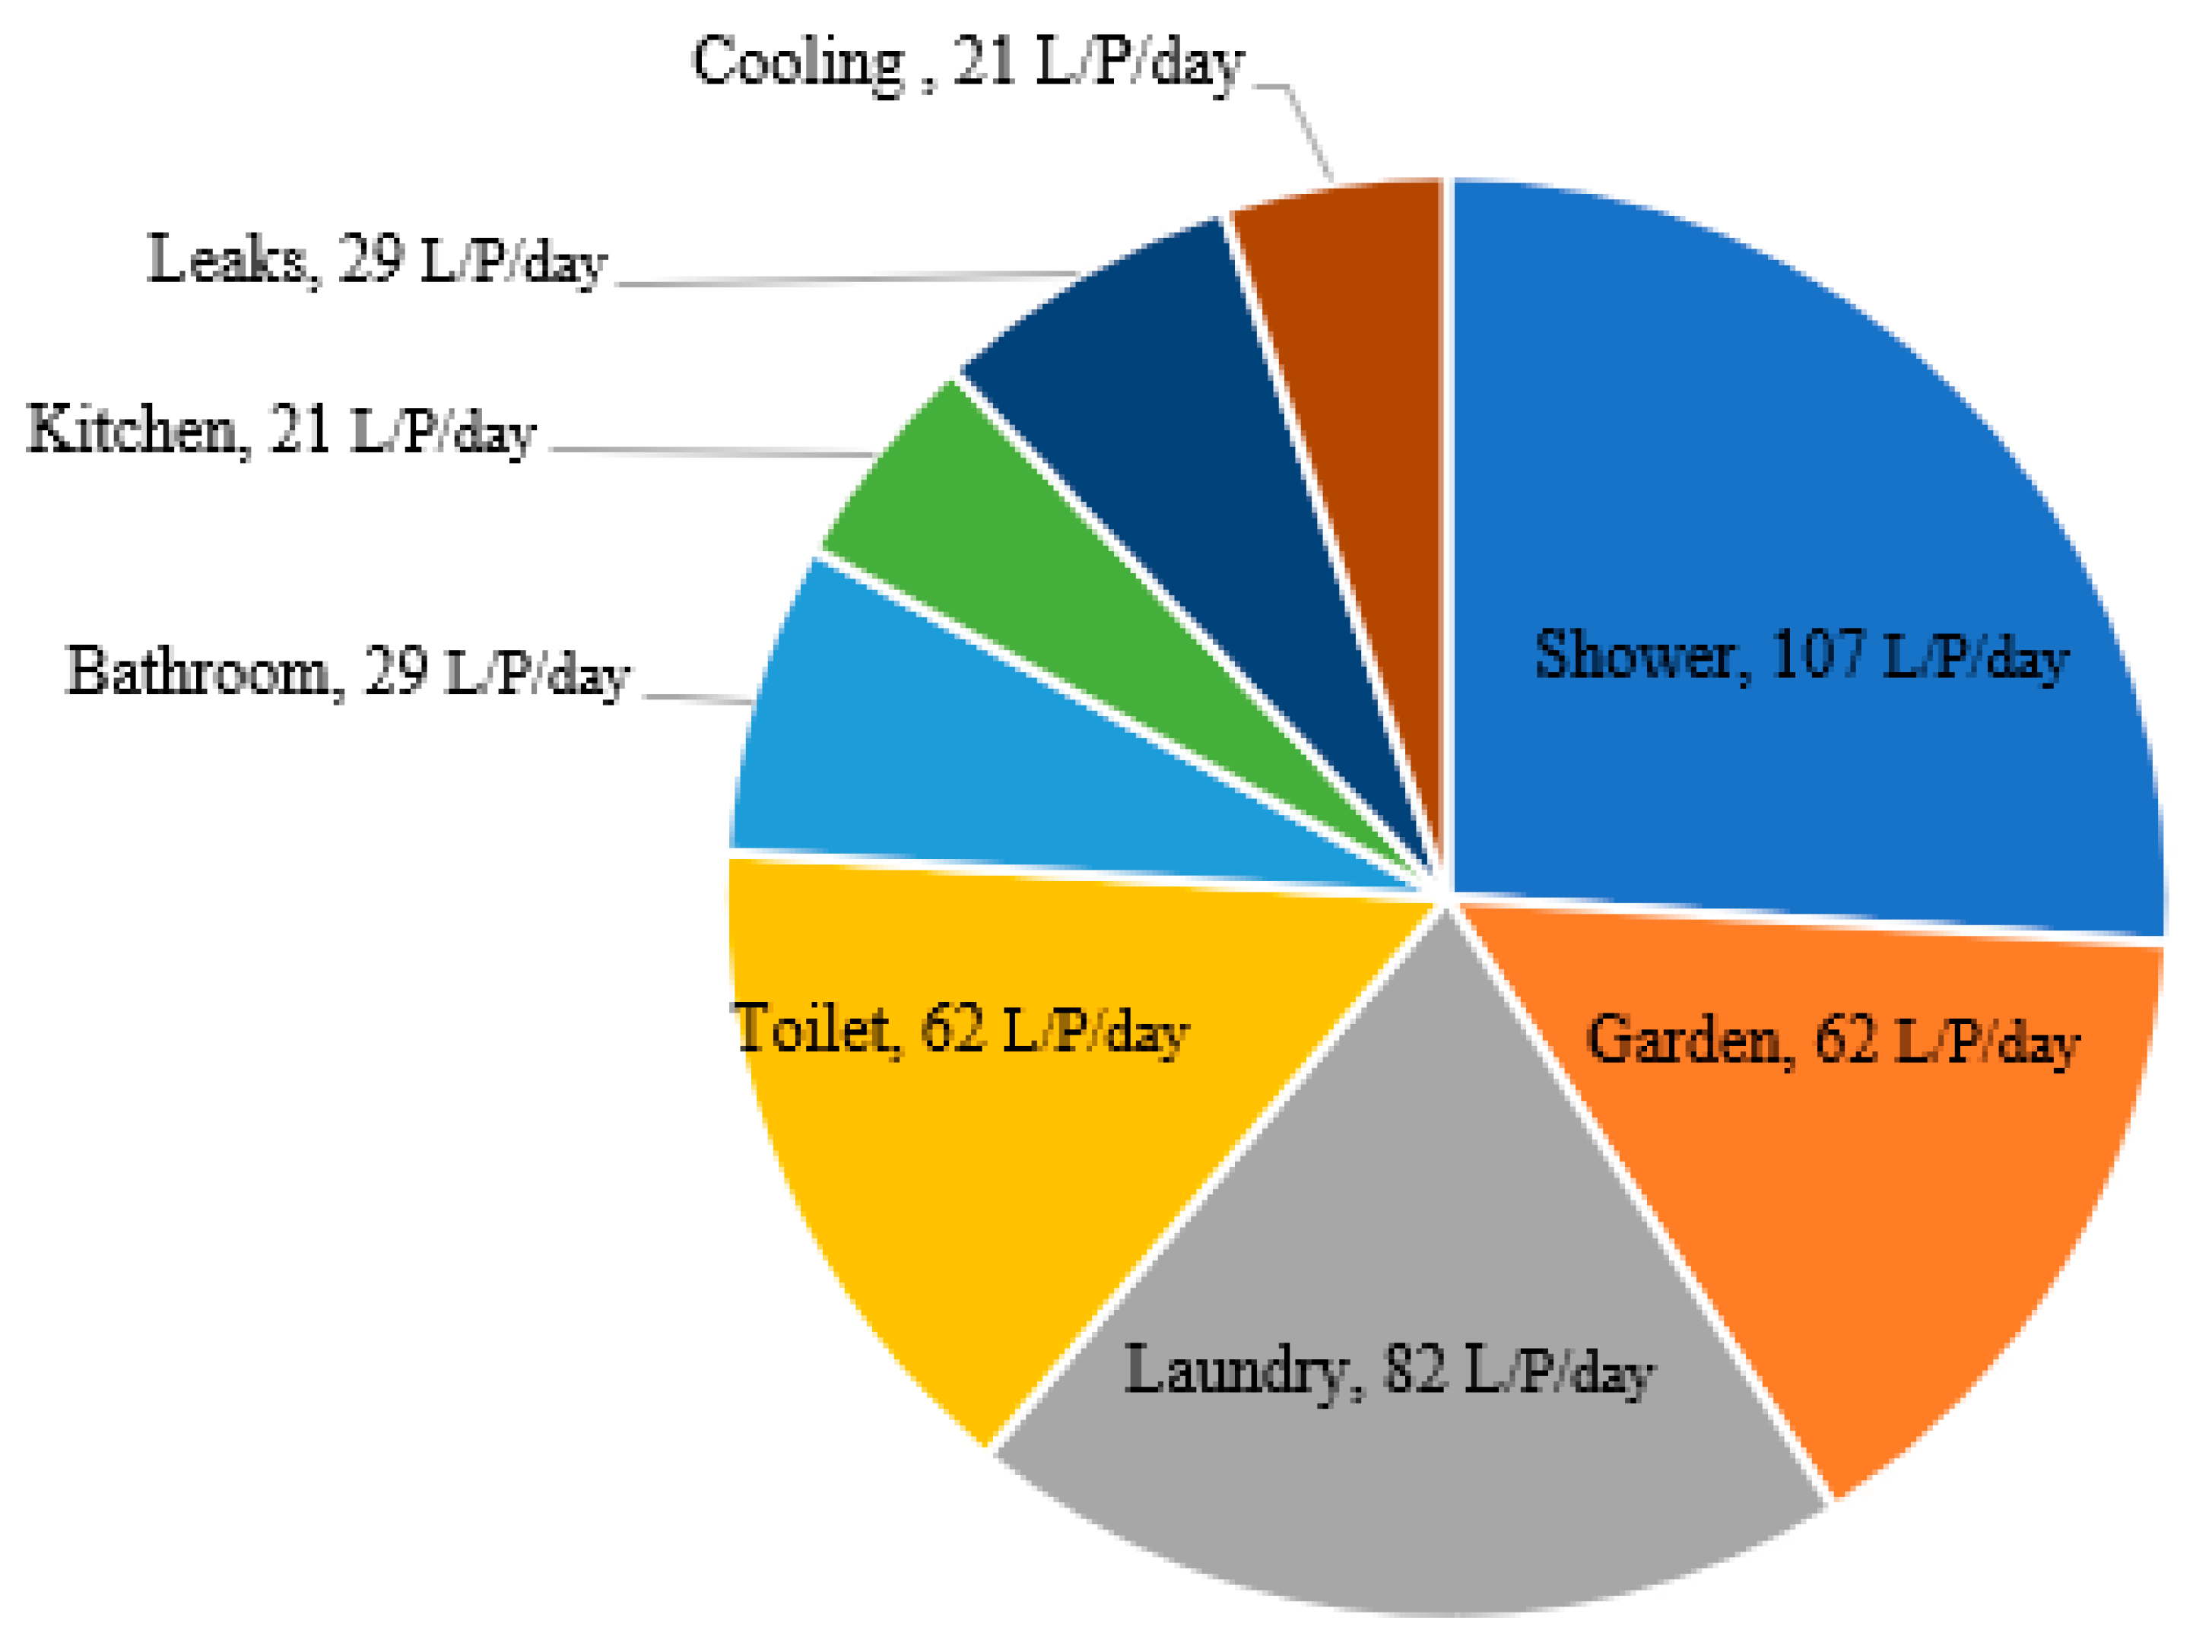
- Toilet flushing usage plus laundry and a garden requirement for current household usage for 3 kL and 5 kL tanks were assumed as 206 L/day.
- -
- Toilet flushing usage plus laundry and a garden requirement for future household usage for 3 kL and 5 kL tanks were assumed as 226 L/day by a 10% increase for the future demand.
4. Scenario Modeling Results
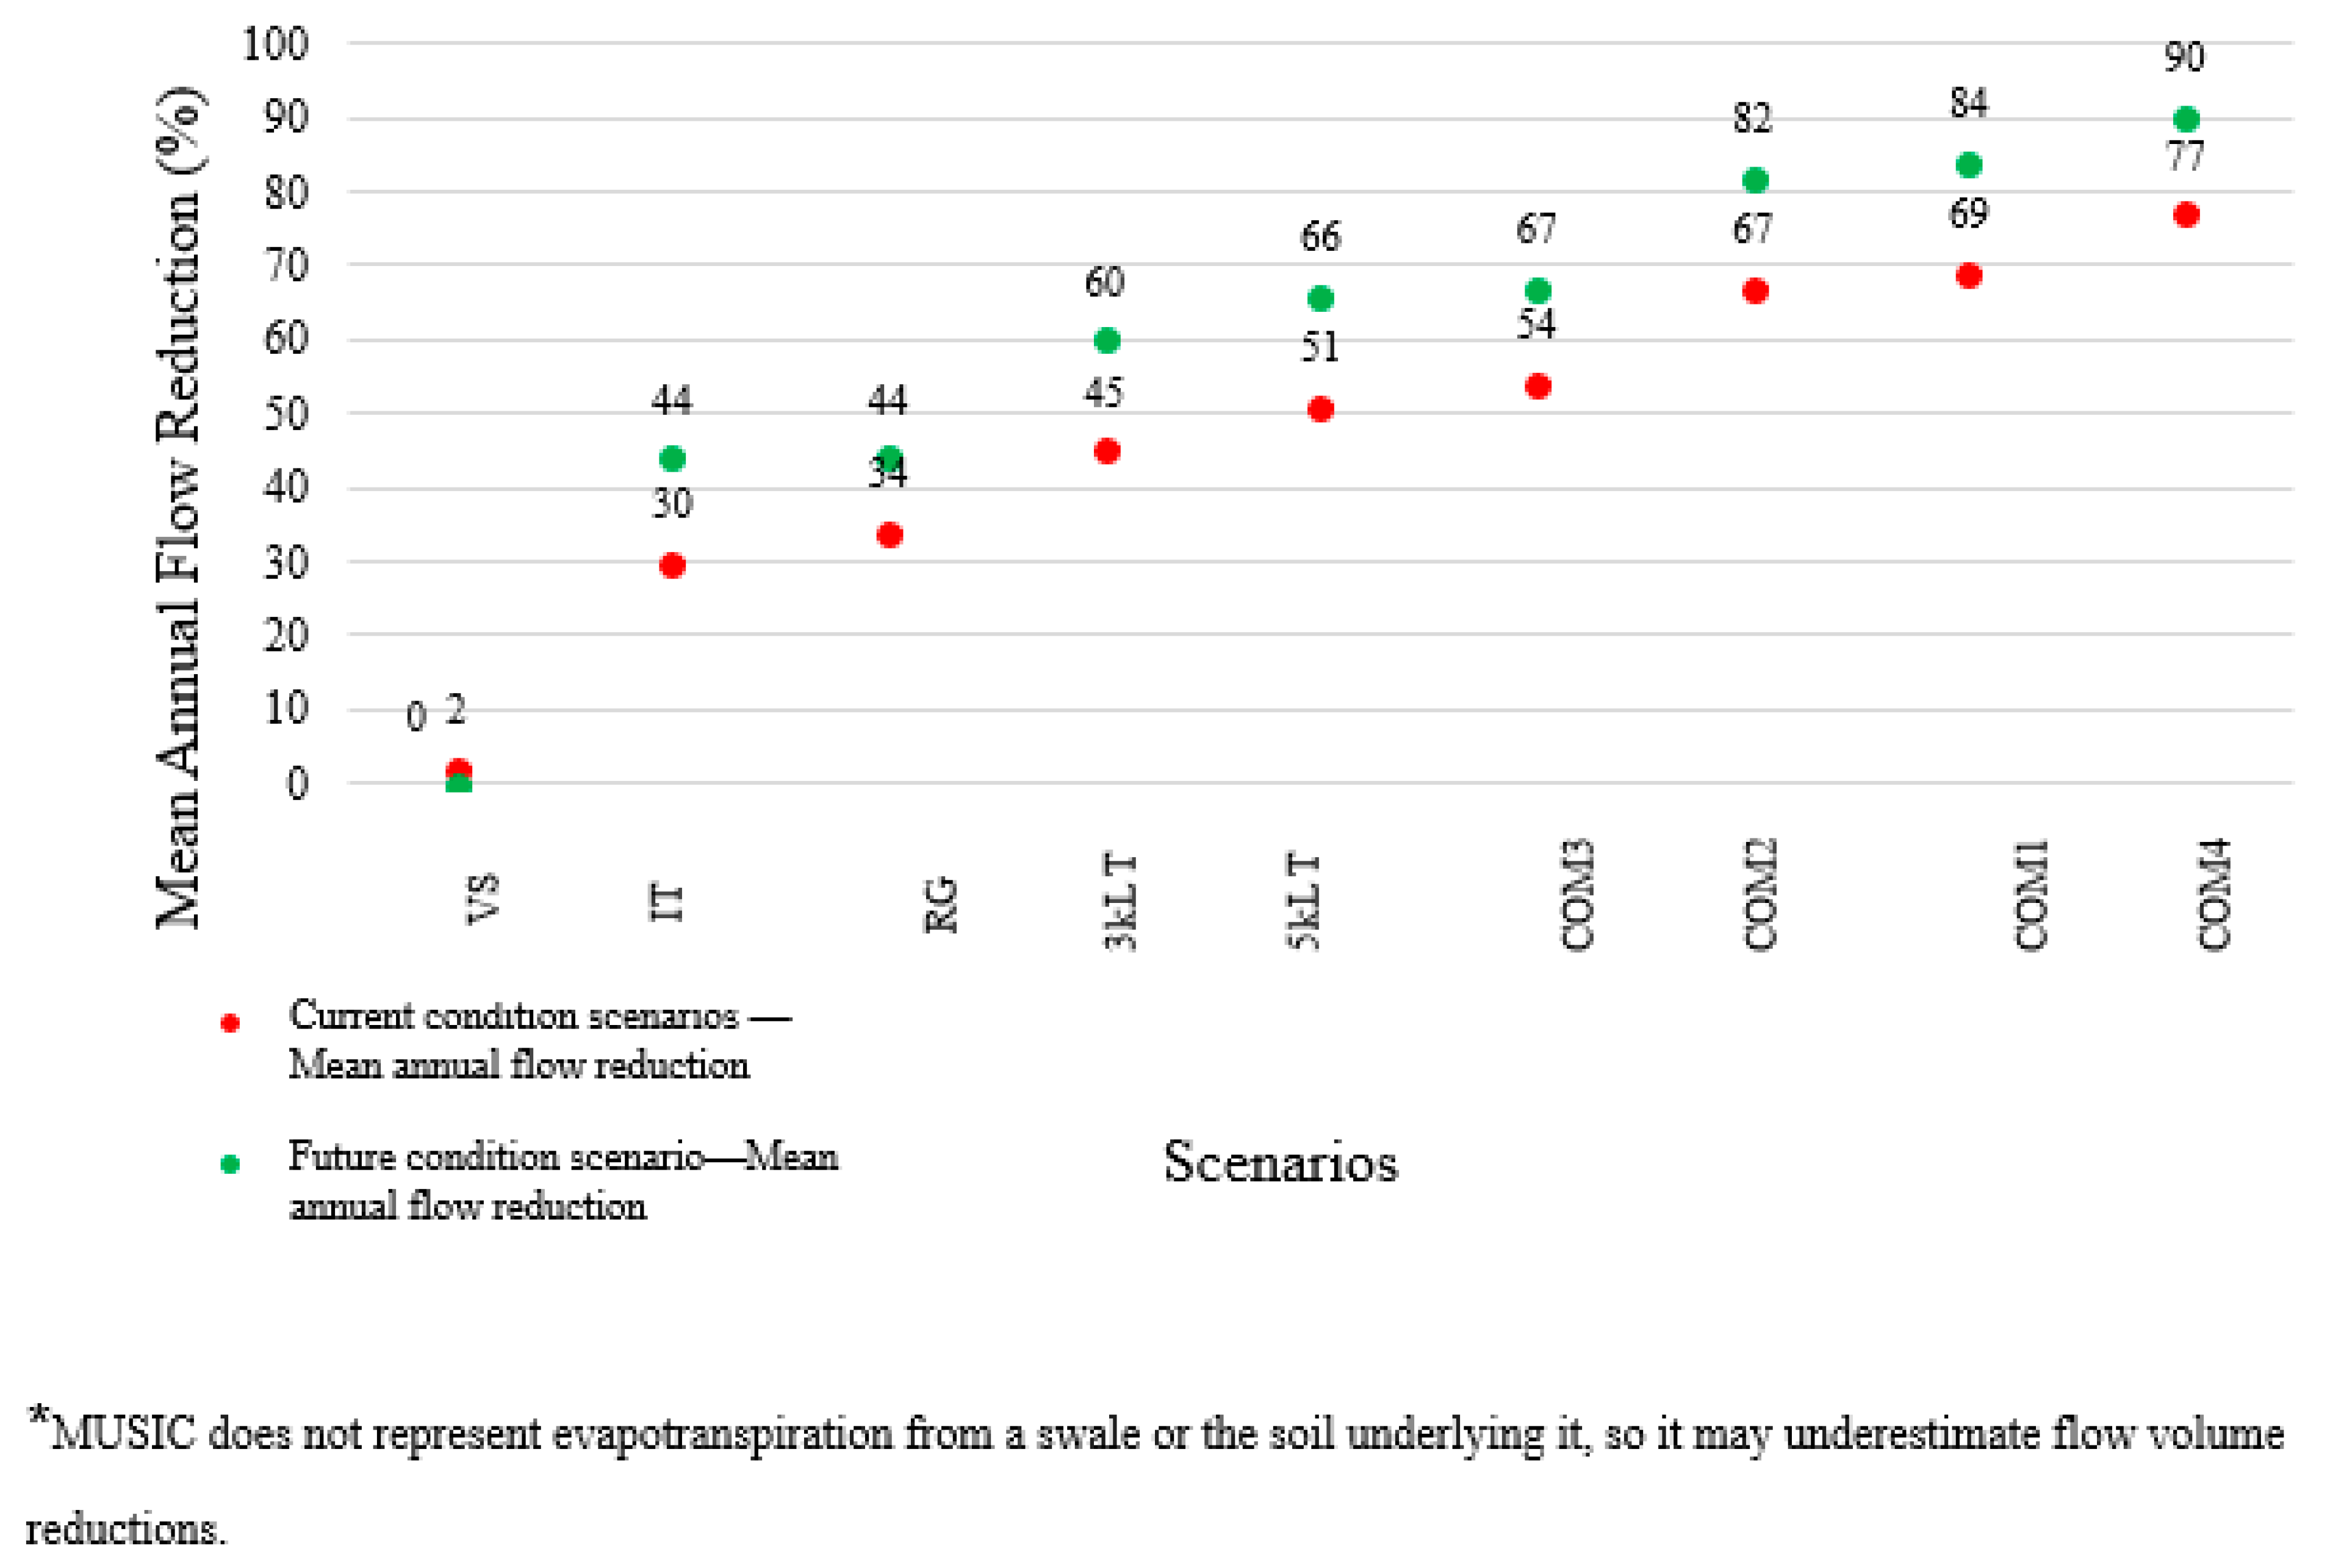
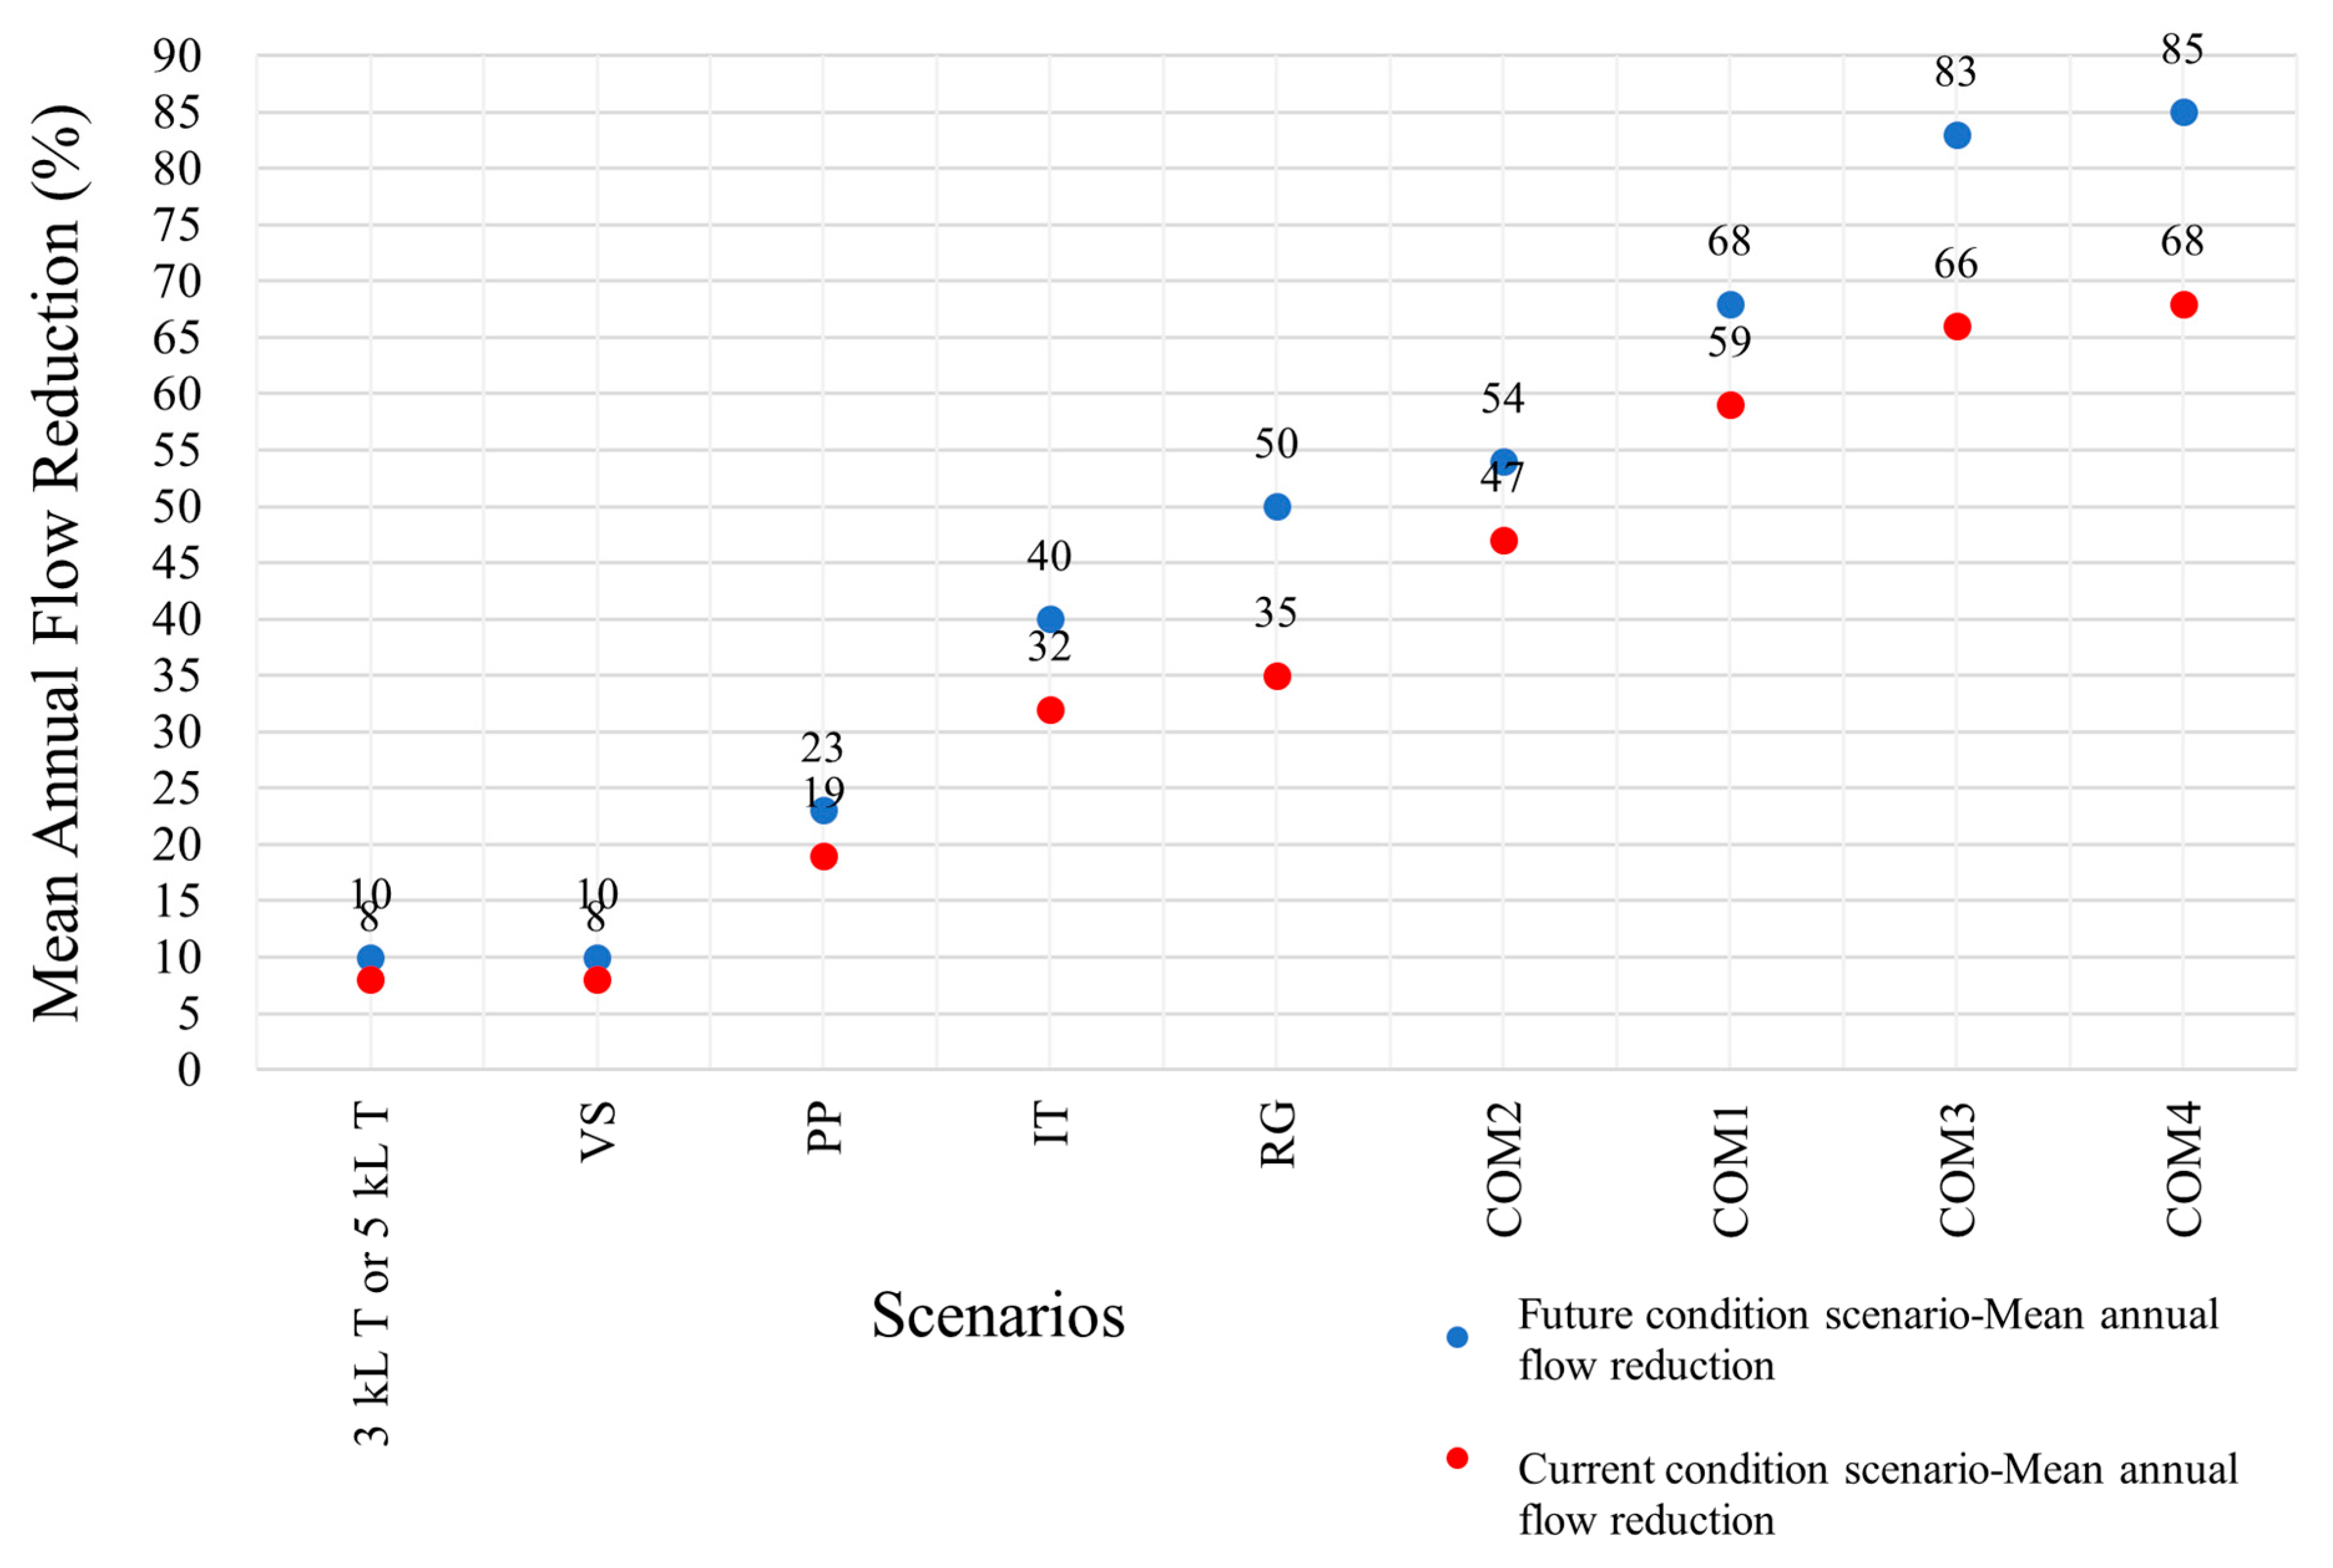
4.1. Mena Annual Flow Reduction
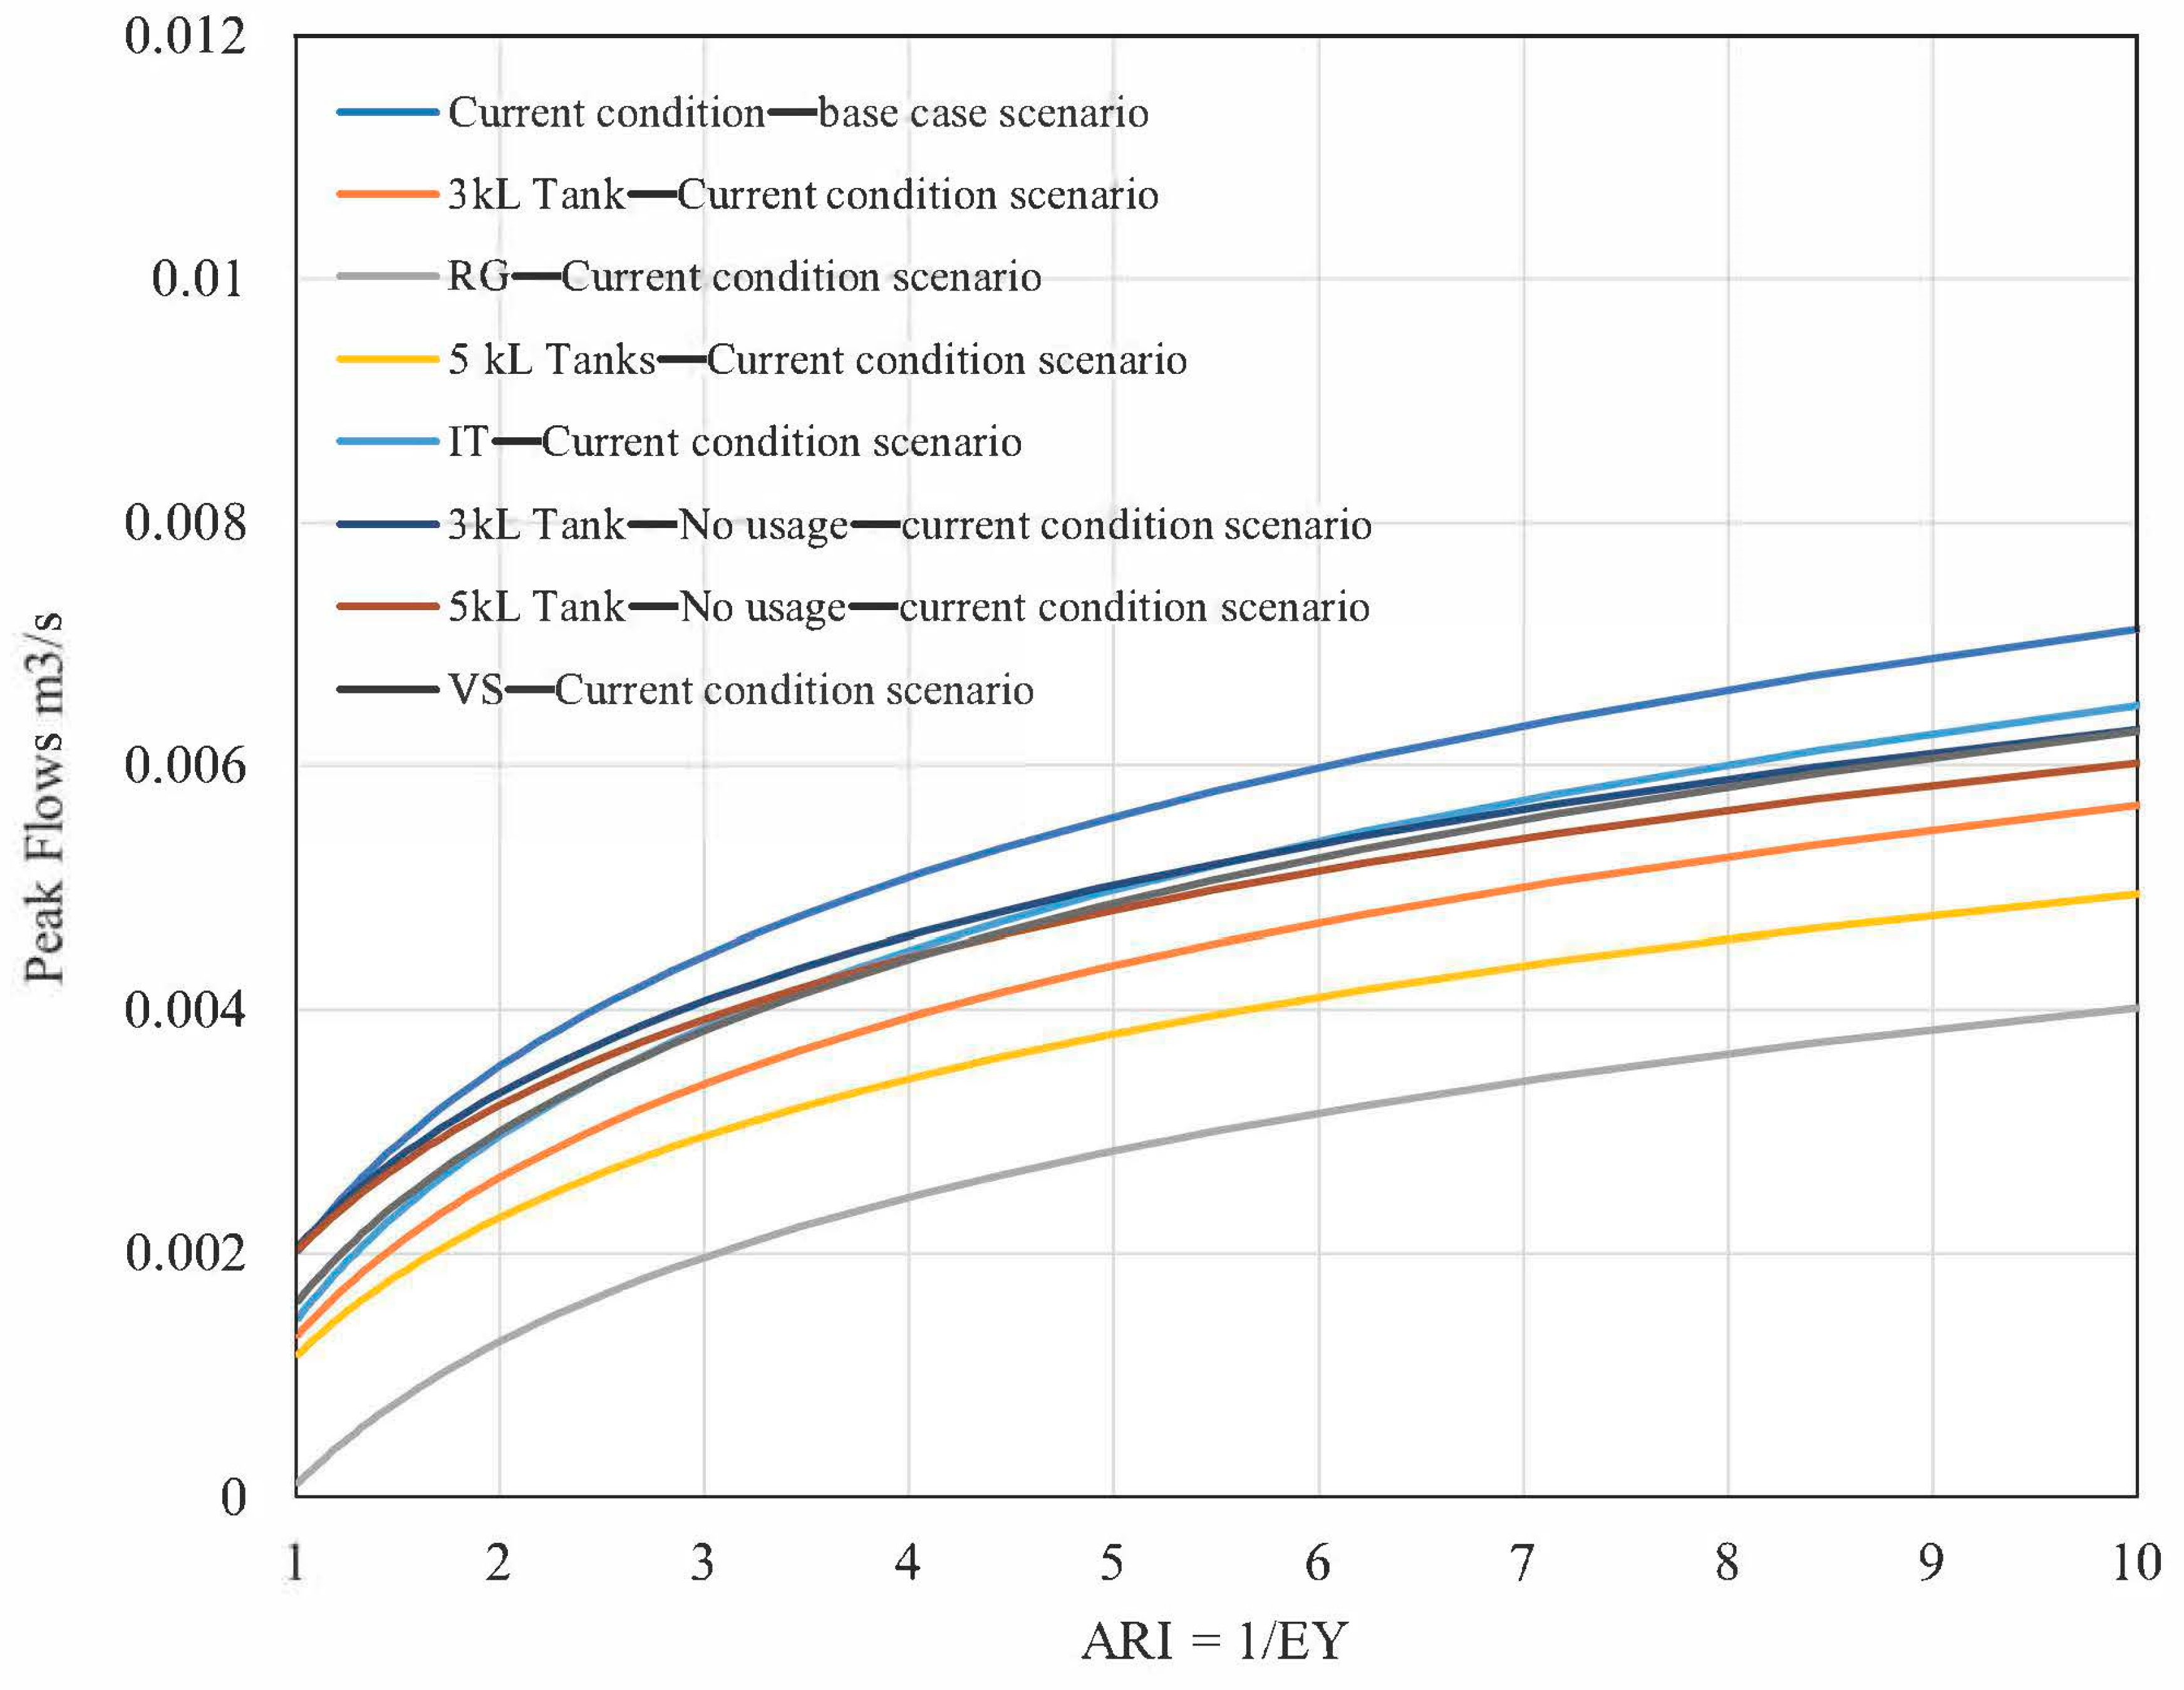
4.2. Peak Flow Size Reduction in the MUSIC Model
4.2.1. Combination of Techniques Under Current Household Conditions
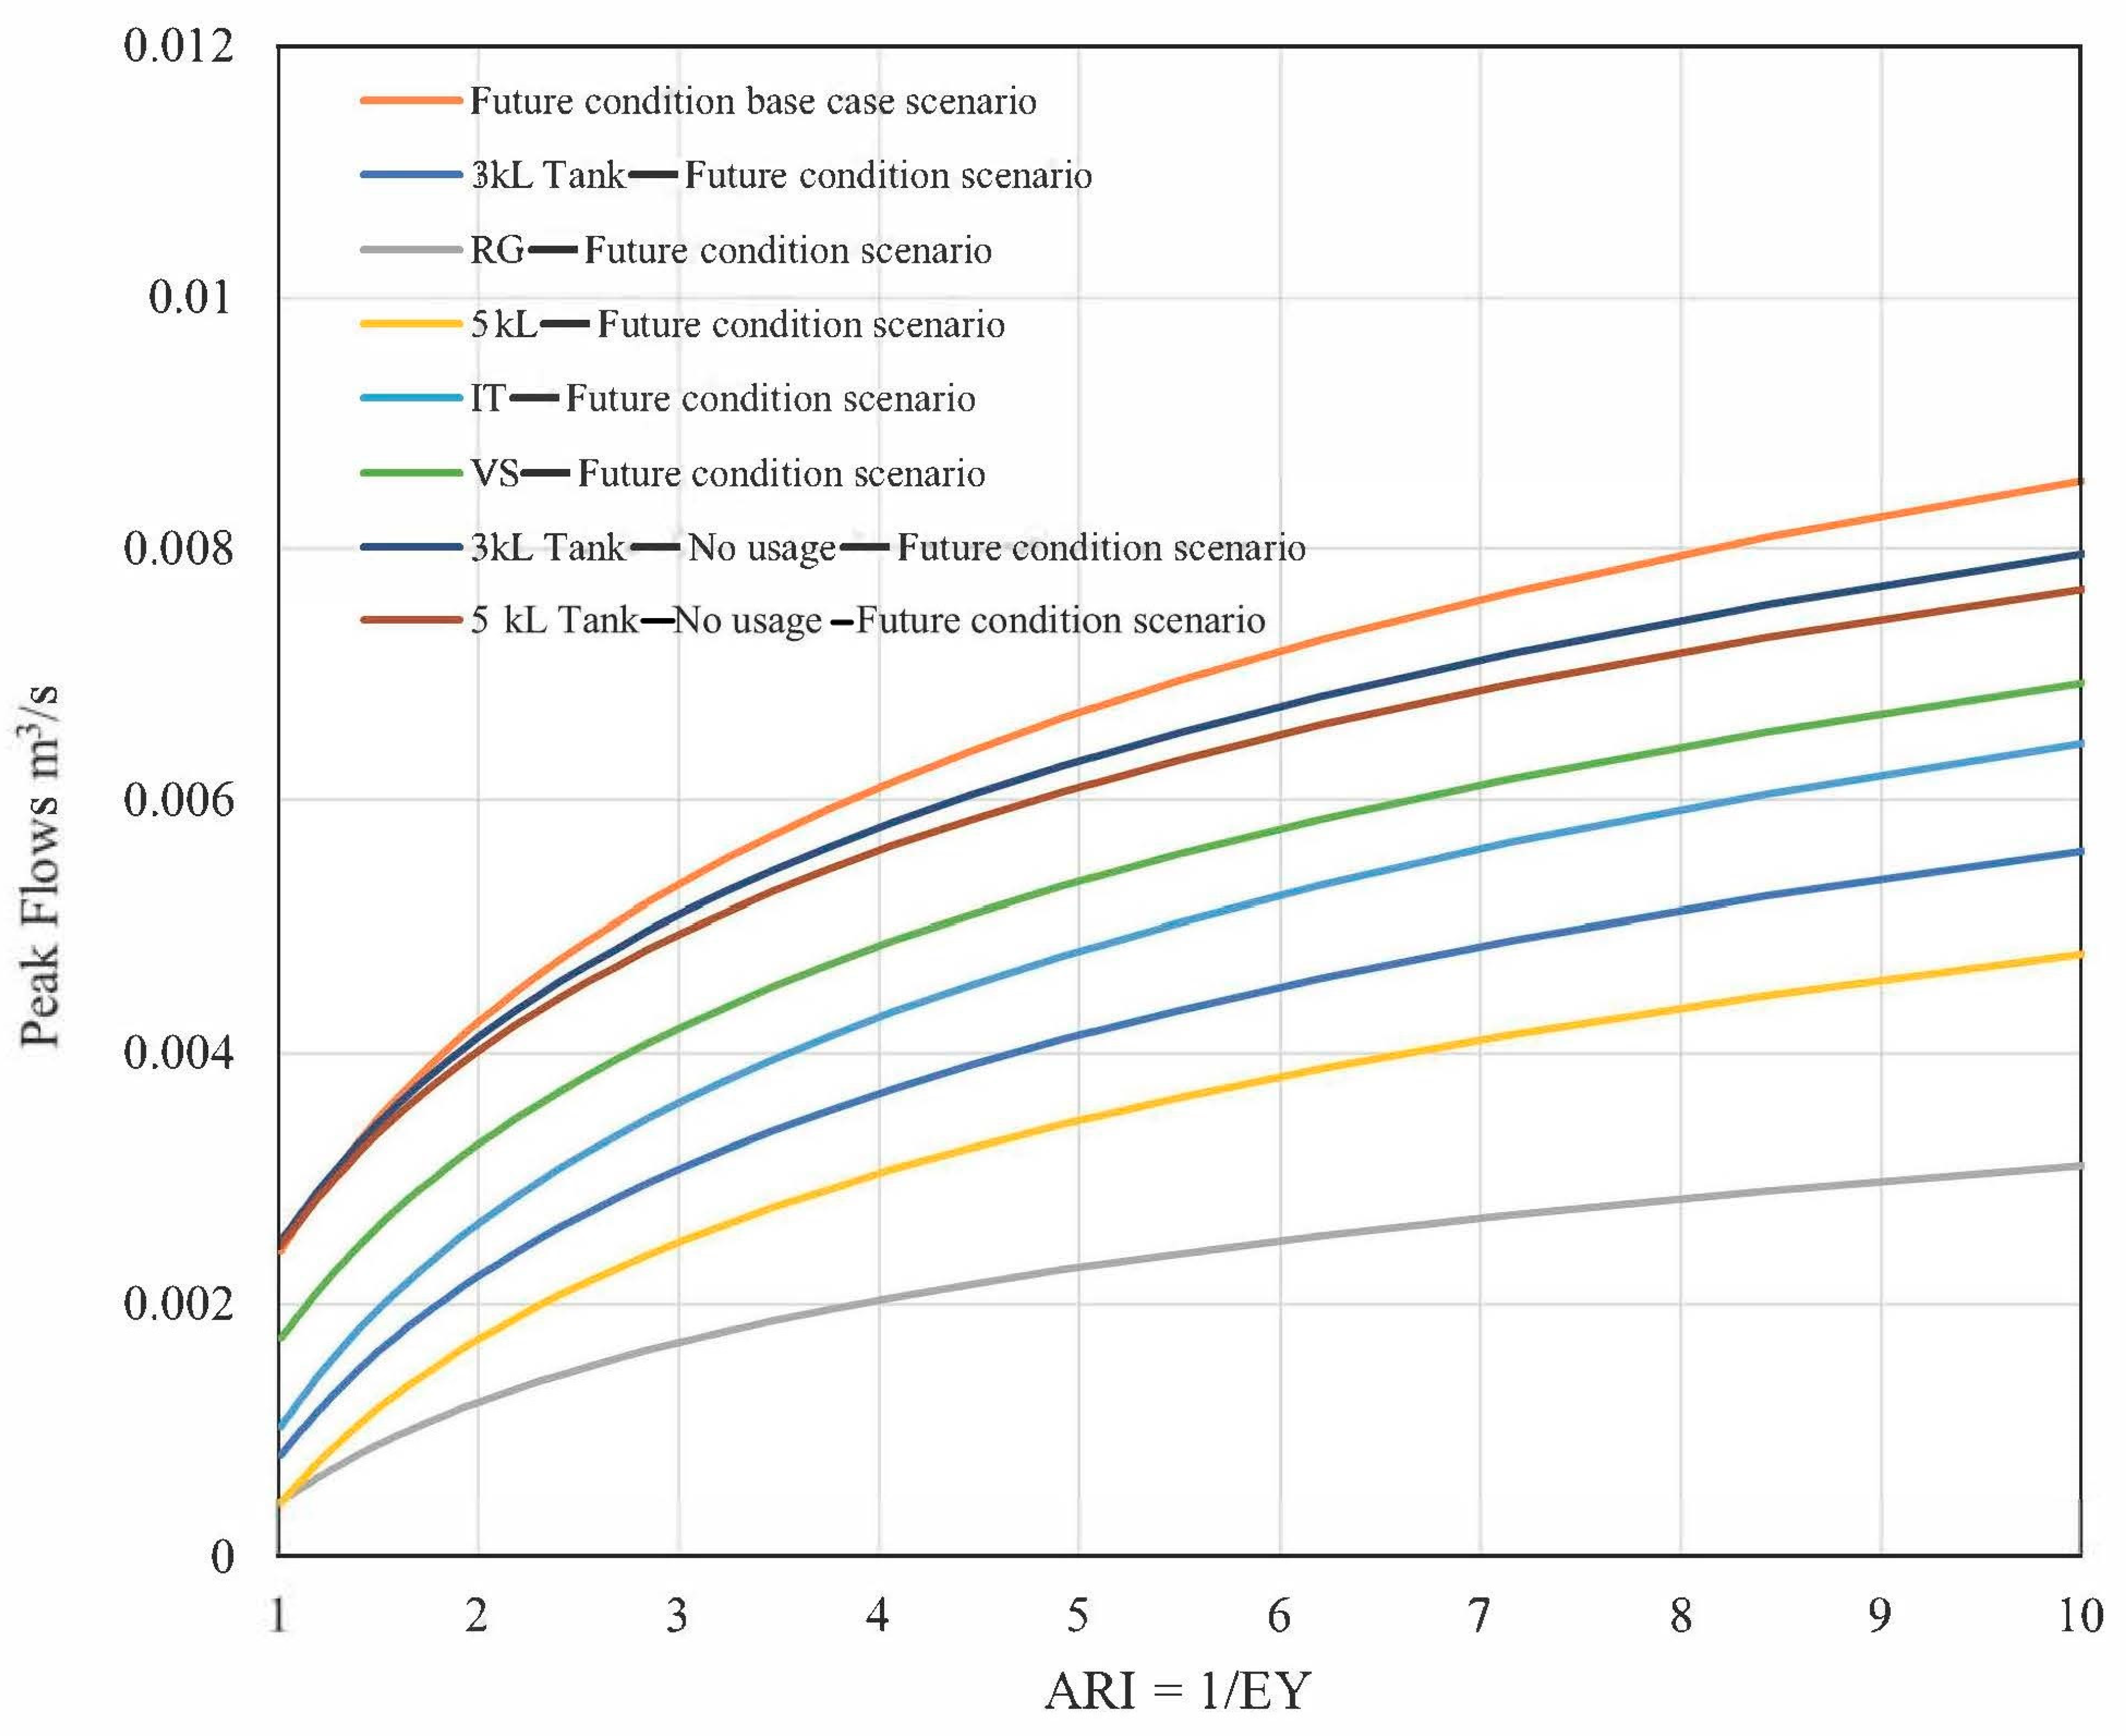
4.2.2. Individual Techniques Under Future Household Conditions with Dual Occupancy
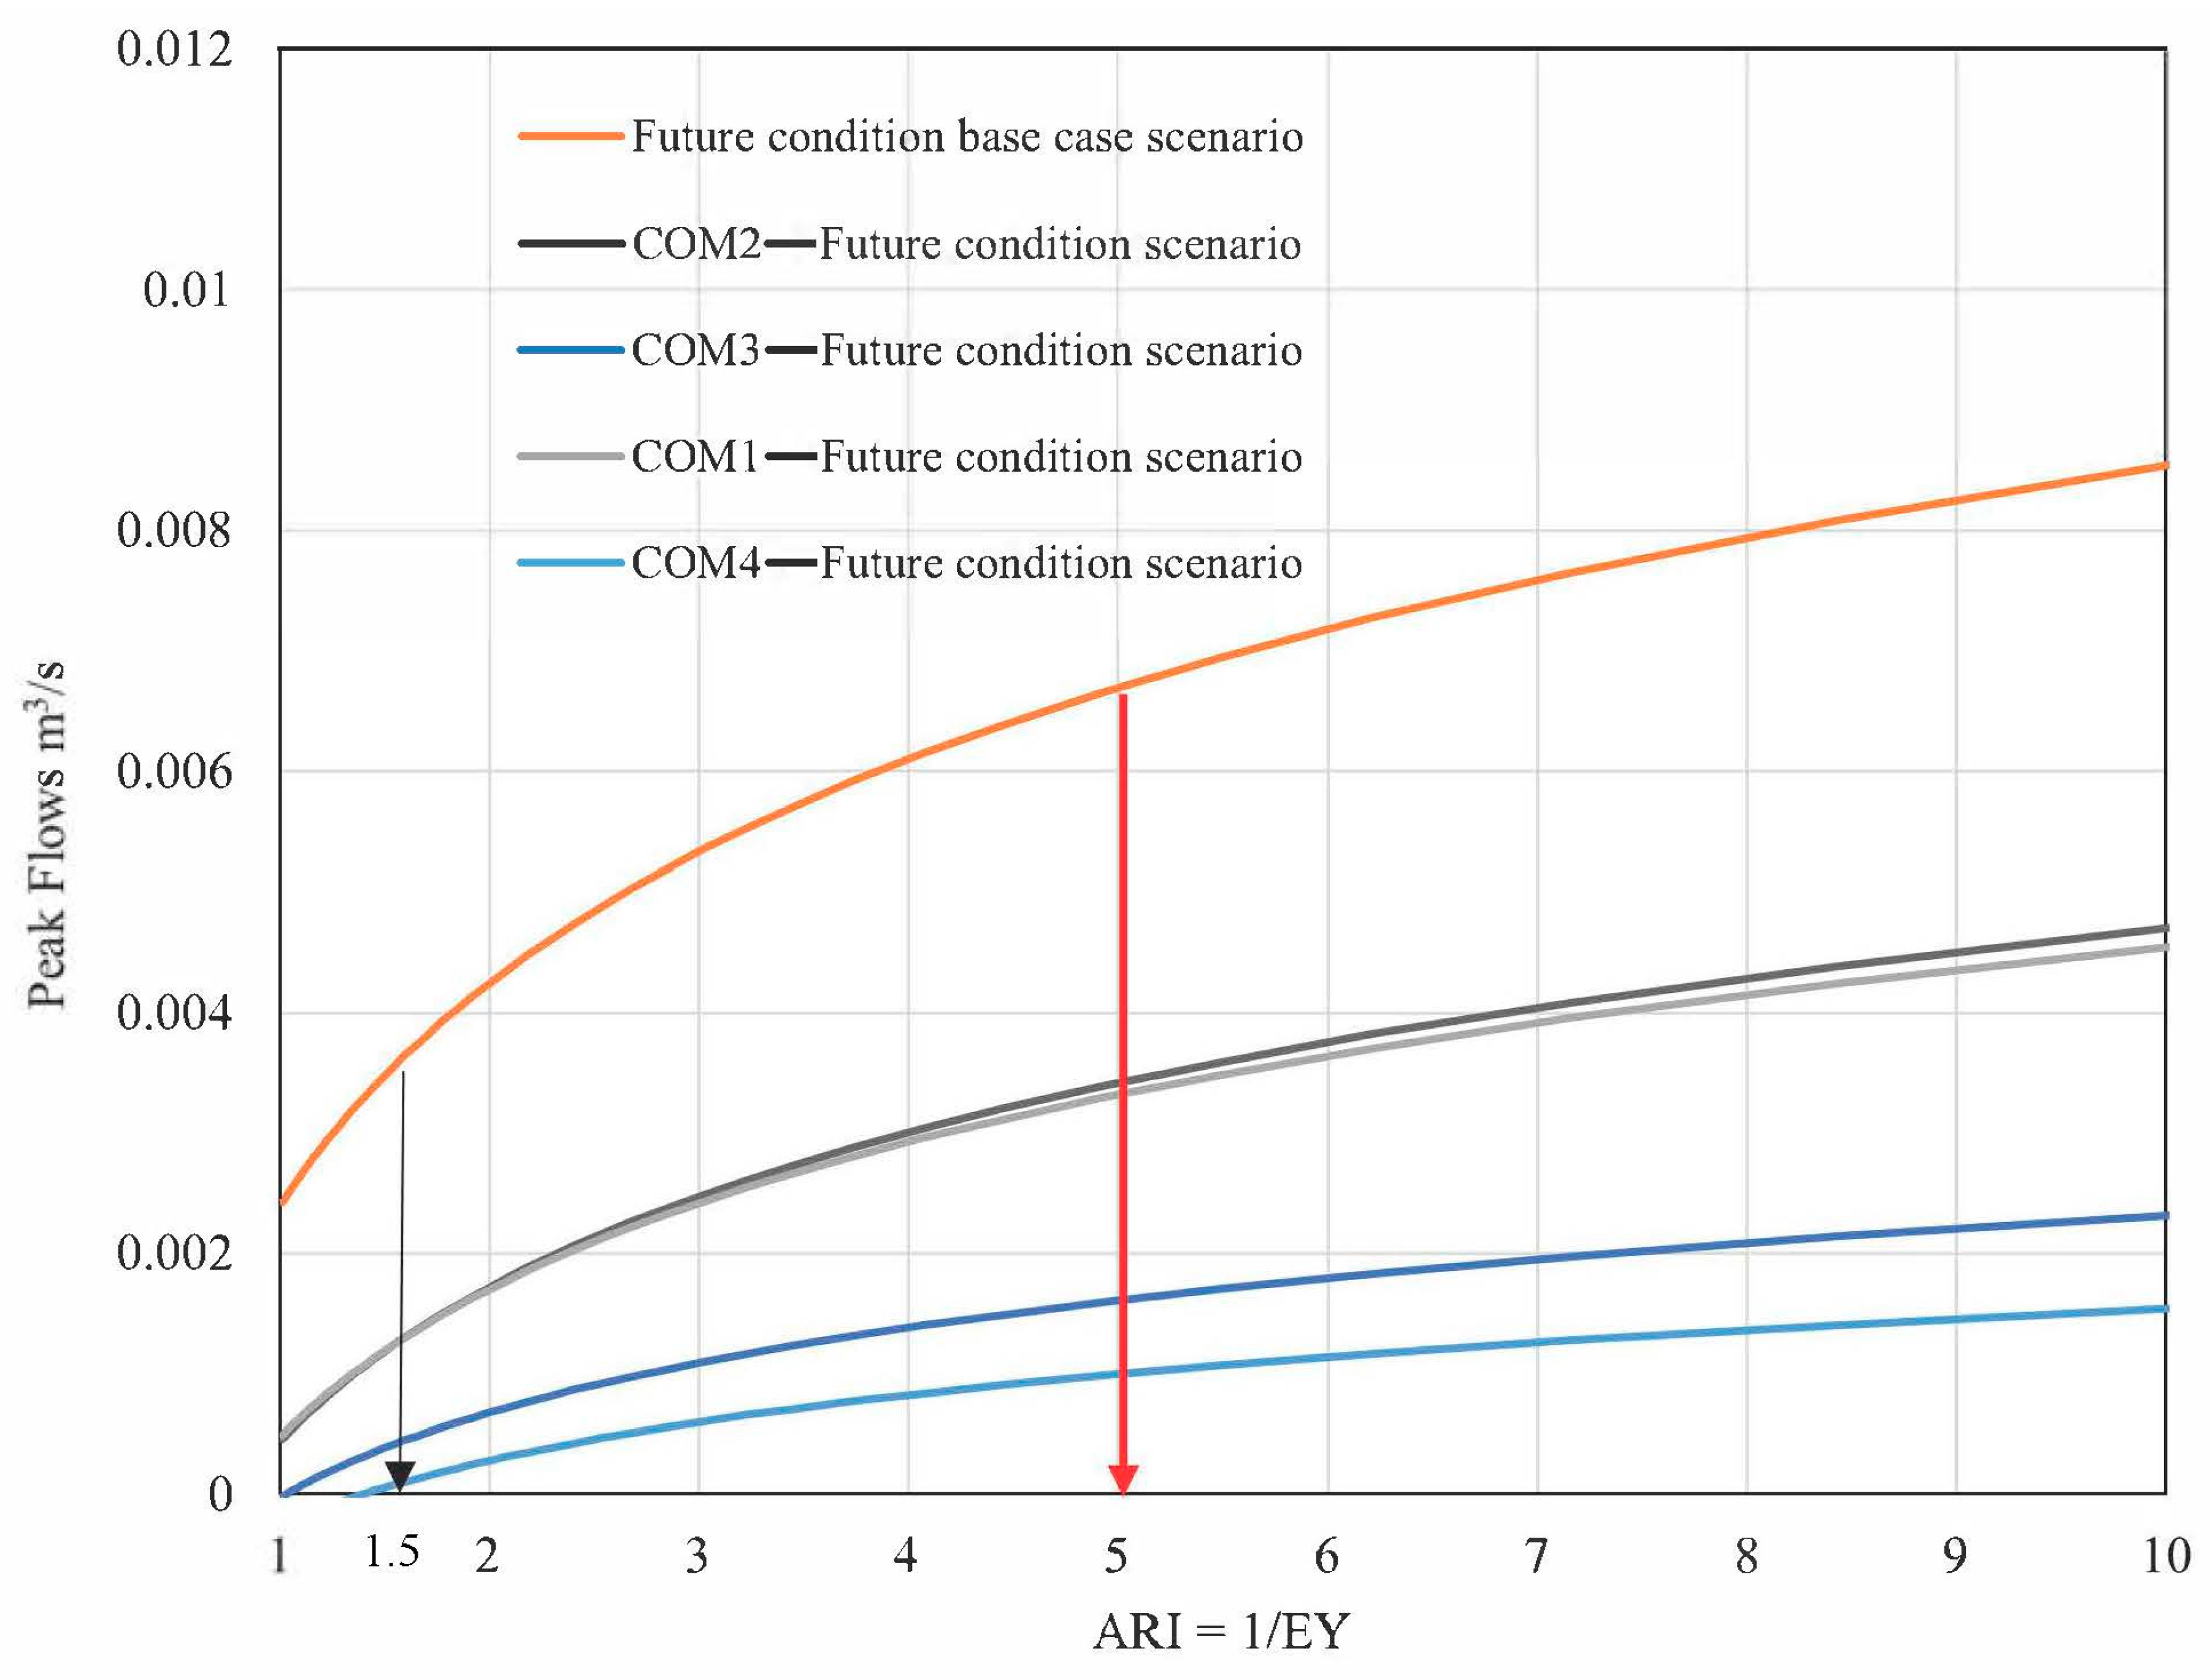
4.2.3. Combination of Techniques Under Future Household Conditions
4.3. Mean Annual Flow Reduction and Peak Flow Reduction in the PCSWMM Model
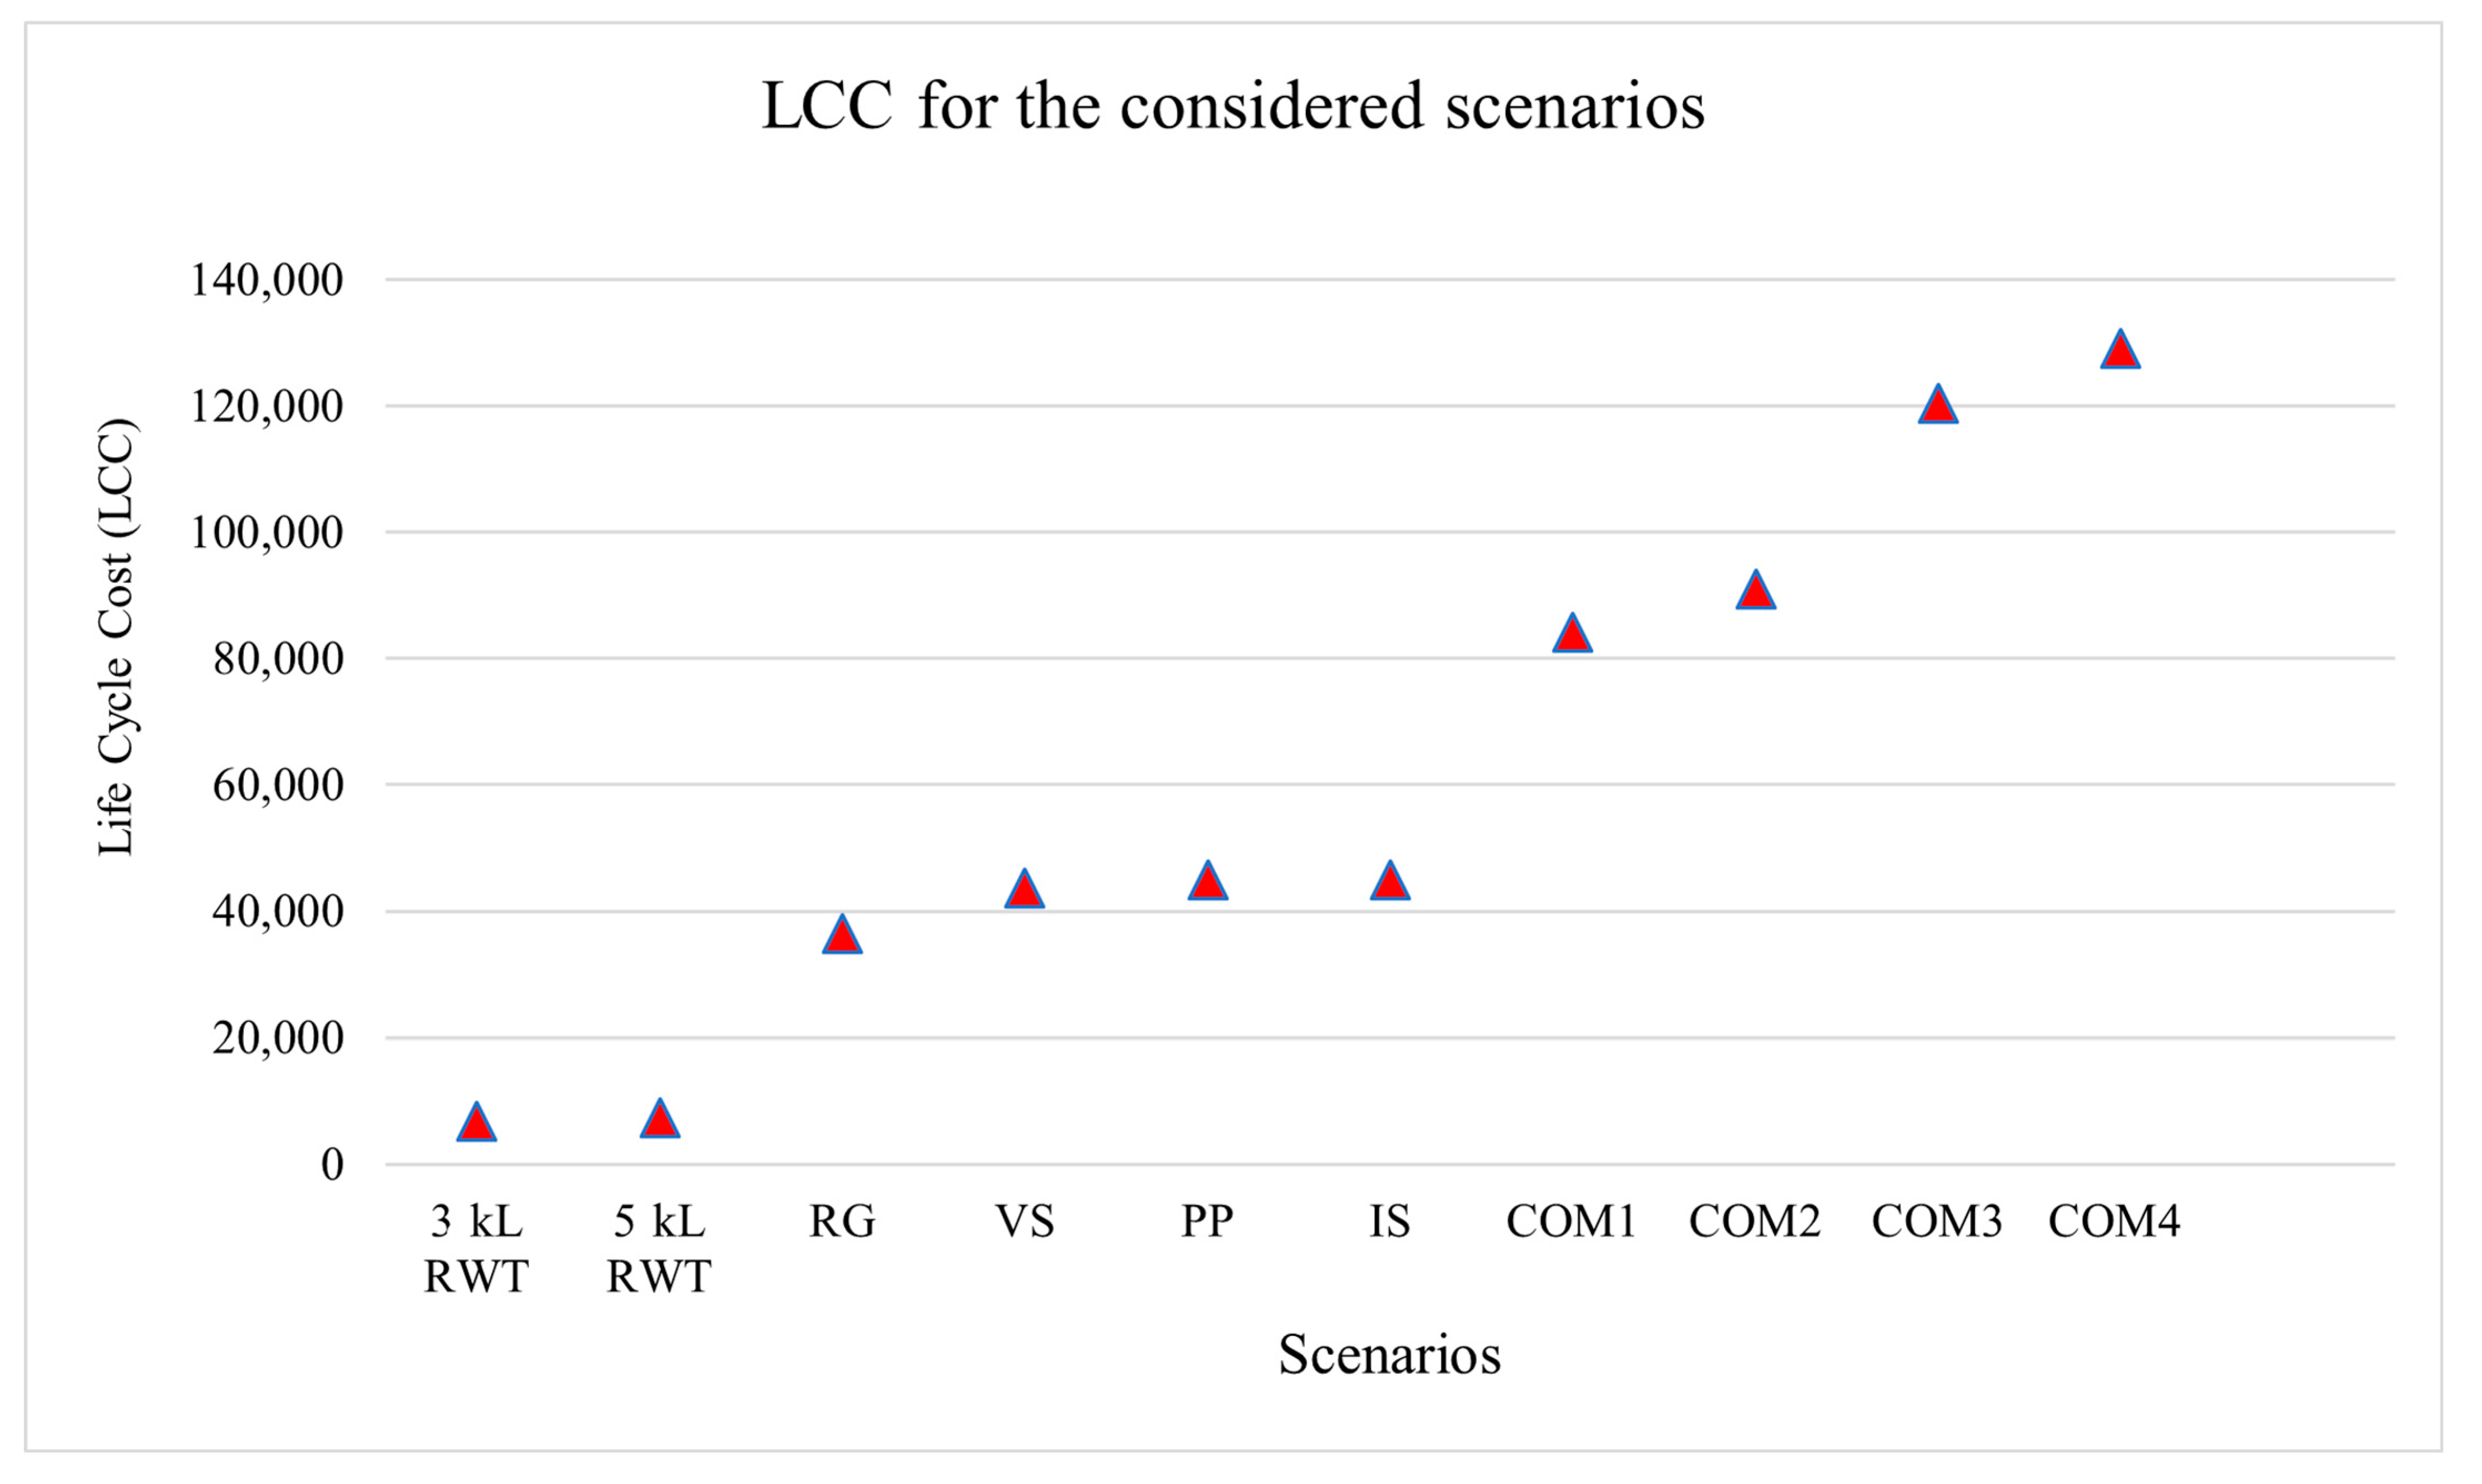
5. Scenario Comparison Using Life Cycle Cost (LCC) Analysis
6. Conclusions
Author Contributions
Funding
Data Availability Statement
Acknowledgments
Conflicts of Interest
Appendix A


References
- Zhang, Y.; Grant, A.; Sharma, A.; Chen, D.; Chen, L. Alternative water resources for rural residential development in Western Australia. Water Resour. Manag. 2010, 24, 25–36. [Google Scholar]
- Ahammed, F. A review of water sensitive urban design technologies and practices for sustainable stormwater management. Sustain. Water Resour. Manag. 2017, 3, 269–282. [Google Scholar]
- Akhter, M.S.; Hewa, G.A. The use of PCSWMM for assessing the impacts of land use changes on hydrological responses and performance of WSUD in managing the impacts at Myponga catchment, South Australia. Water 2016, 8, 511. [Google Scholar] [CrossRef]
- Ladson, A.R. Using WSUD to restore predevelopment hydrology. In Approaches to Water Sensitive Urban Design; Sharma, A., Gardner, T., Begbie, D., Eds.; Chapter 10; Elsevier: Amsterdam, The Netherlands, 2019. [Google Scholar]
- Trudeau, M.P.; Richardson, M. Change in event-scale hydrologic response in two urbanising watersheds of the Great Lakes St Lawrence Basin 1969–2010. J. Hydrol. 2015, 523, 650–662. [Google Scholar]
- Duncan, H.P.; Fletcher, T.D.; Vietz, G. The Feasibility of Maintaining Ecologically and Geomorphically Important Elements of the Natural Flow Regime in the Context of a Superabundance of Flow: Stage 1—Kororoit Creek Study Hugh; Melbourne Waterway Research-Practice Partnership: Melbourne, Australia, 2014. [Google Scholar]
- Fletcher, T.D.; Vietz, G.; Walsh, C.J. Protection of stream ecosystems from urban stormwater runoff: The multiple benefits of an ecohydrological approach. SAGE J. 2014, 38, 543–555. [Google Scholar]
- Rashetnia, S.; Sharma, A.K.; Ladson, A.R.; Browne, D.; Yaghoubi, E. A scoping review on Water Sensitive Urban Design aims and achievements. Urban Water J. 2022, 19, 453–467. [Google Scholar]
- Whelans, C.; Halpern, G.M.; Thompson, P. Policy Planning and Management Guidelines for Water Sensitive Urban (Residential) Design; Whelans: Perth, Australia, 1994. [Google Scholar]
- Benedict, M.; McMahon, E. Green Infrastructure Linking Landscapes and Communities; Island Press: Washington, DC, USA, 2006. [Google Scholar]
- Fletcher, D.T.; William, S.; Hunt, W.F.; Richard, A.; Butler, D.; Arthur, S.; Trowsdale, S.; Barraud, S.; Semadeni-Davies, A.; Bertrand-Krajewski, J.; et al. SUDS, LID, BMPs, WSUD and more—The evolution and application of terminology surrounding urban drainage. Urban Water J. 2015, 12, 525–542. [Google Scholar] [CrossRef]
- Jia, H.; Wang, Z.; Zhen, X.; Clar, M. The sponge city program and its implications for urban stormwater management. Sustain. Cities Soc. 2020, 55, 102066. [Google Scholar]
- Qiao, X.; Kristoffersson, A.; Randrup, T.B. A review of green infrastructure for stormwater management in cities. Water 2019, 11, 393. [Google Scholar]
- Gonçalves ML, R.; Zischg, J.; Rau, S.; Sitzmann, M.; Rauch, W.; Kleidorfer, M. Modelling the effects of introducing low impact development in a tropical city: A case study from Joinville, Brazil. Sustainability 2018, 10, 728. [Google Scholar] [CrossRef]
- Lloyd, S.D.; Wong, T.H.F.; Chesterfield, C.J. Water Sensitive Urban Design—A Stormwater Management Perspective (Industry Report No. 02/10); Cooperative Research Centre for Catchment Hydrology: Melbourne, Australia, 2002. [Google Scholar]
- Lloyd, S.D. Water Sensitive Urban Design in the Australian Context, Synthesis of a Conference Held 30–31 August 2000, Melbourne, Australia; Cooperative Research Centre for Catchment Hydrology: Clayton, Australia, 2001. [Google Scholar]
- Stagge, J.H.; Davis, A.P.; Jamil, E.; Kim, H. Performance of grass swales for improving water quality from highway runoff. Water Resour. 2012, 20, 6731–6742. [Google Scholar] [CrossRef] [PubMed]
- Trowsdale, S.A.; Simcock, R. Urban stormwater treatment using bioretention. J. Hydrol. 2011, 397, 167–174. [Google Scholar] [CrossRef]
- Yang, H.; Florence, D.C.; McCoy, E.L.; Dick, W.A.; Grewal, P.S. Design and hydraulic characteristics of a field scale bi-phasic bioretention raingarden system for stormwater management. Water Sci. Technol. 2009, 59, 1863–1872. [Google Scholar] [CrossRef]
- Davis, A.P.; Hunt, W.F.; Traver, R.G.; Clar, M. Performance of bioretention systems in urban stormwater management: A review. Water Environ. Res. 2020, 92, 1071–1082. [Google Scholar]
- Hatt, B.E.; Fletcher, T.D.; Deletic, A. Hydrologic and pollutant removal performance of stormwater biofiltration systems at the field scale. J. Hydrol. 2009, 365, 310–321. [Google Scholar] [CrossRef]
- Lucke, T.; Nicholas, P. The pollution removal and stormwater reduction performance of street-side bioretention basins after ten years in operation. Sci. Total Environ. 2015, 536, 784–792. [Google Scholar] [CrossRef]
- Hoban, A.T. Facing the MUSIC: A review of bioretention performance. In Proceedings of the 2017 Joint IECA National Conference and Stormwater Queensland Conference, Brisbane, Australia, 11–12 October 2017. [Google Scholar]
- Ackerman, D.; Stein, E.D. Evaluating the effectiveness of best management practices using dynamic modelling. J. Environ. Eng. 2008, 134, 628–663. [Google Scholar] [CrossRef]
- Barrett, M.E. Performance comparison of structural stormwater best management practice. Water Environ. Res. 2005, 77, 78–86. [Google Scholar] [CrossRef]
- Gomes UA, F.; Heller, L.; Pena, J.L. A national program for large scale rainwater harvesting: An individual or public responsibility? Water Resour. Manag. 2012, 26, 2703–2714. [Google Scholar] [CrossRef]
- Fewkes, A. A review of rainwater harvesting in the UK. Struct. Surv. 2012, 30, 174–194. [Google Scholar] [CrossRef]
- Ward, S.; Memon, F.A.; Butler, D. Rainwater Harvesting: Model-based design evaluation. Water Sci. Technol. 2010, 61, 85–96. [Google Scholar] [CrossRef]
- Australian Bureau of Statics (ABS). Available online: http://www.abs.gov.au/AUSSTATS/abs@.nsf/DetailsPage/4602.0.55.003Mar%202010? (accessed on 20 August 2018).
- Yazdi, S.K.; Scholz, M. Combined bio-filtration, water detention and infiltration system treating road runoff. In Proceedings of the 10th British Hydrological Symposium, Oxford, UK, 15–17 September 2008; pp. 353–358. [Google Scholar]
- Walsh, C.J.; Pomeroy, C.A.; Burian, S.J. Hydrologic Modelling Analysis of a Passive, Residential Rainwater Harvesting Program in an Urbanized, Semi-Arid Watershed. J. Hydrol. 2014, 508, 240–253. [Google Scholar]
- Campisano, A.; Modica, C. Optimal sizing of storage tanks for domestic rainwater harvesting in Sicily (Italy). Water 2014, 6, 2332–2347. [Google Scholar]
- Argue, R.J. WSUD: Basic Procedures for ‘Source Control’ of Stormwater—A Handbook for Australian Practice; The University of South Australia: Adelaide, Australia, 2013. [Google Scholar]
- Beecham, S.; Pezzaniti, D.; Kandasamy, J. Stormwater treatments using permeable pavements. Water Manag. 2012, 165, 161–170. [Google Scholar]
- Freni, G.; Mannina, G.; Viviani, G. Urban stormwater quality management: Centralised versus source control. J. Water Resour. Plan. Manag. 2010, 136, 268–278. [Google Scholar] [CrossRef]
- Ullate, E.G.; Lopez, E.C.; Fresno, D.C.; Bayon, J.R. Analysis and contrast of different pervious pavements for management of stormwater in parking area in Northern Spain. Water Resour. Manag. 2011, 25, 1525–1535. [Google Scholar]
- Bean, E.Z.; Hunt, W.F.; Bidelspach, D.A. Field survey of permeable pavement surface infiltration rates. J. Irrig. Drain. Eng. 2007, 133, 249–255. [Google Scholar]
- Kuang, X.; Sansalone, J.; Ying, G.; Ranieri, V. Pore-structure models of hydraulic conductivity for porous pavement. J. Hydrol. 2011, 399, 148–157. [Google Scholar] [CrossRef]
- Hsieh, P.C.; Chen, Y.C. Surface water flow over a pervious pavement. Int. J. Numer. Anal Methods Geo-Mech. 2012, 37, 1095–1105. [Google Scholar]
- Lucke, T.; Beecham, S. Field investigation of clogging in a permeable pavement system. Build. Res. Inf. 2011, 39, 603–615. [Google Scholar]
- Siriwardene, N.R.; Deletic, A.; Fletcher, T.D. Clogging of stormwater gravel infiltration systems and filters: Insights from a laboratory study. Water Resour. 2007, 41, 1433–1440. [Google Scholar]
- Myers, B.; Chacko, P.; Tjandraatmadja, G.; Cook, S.; Umapathi, S.; Pezzanitti, D.; Sharma, A.K. The Status of Water Sensitive Urban Design in South Australia; Goyder Institute for Water Research Technical Report Series No. 13/11; Goyder Institute for Water Research: Adelaide, South Australia, 2013. [Google Scholar]
- Department of Planning and Local Government. Water Sensitive Urban Design Technical Manual for the Greater Adelaide Region; Government of South Australia: Adelaide, Australia, 2010. [Google Scholar]
- Lerer, S.M.; Arnbjerg-nielsen, K.; Mikkelsen, P.S. A Mapping of Tools for Informing Water Sensitive Urban Design Planning Decisions—Questions. Asp. Context Sensit. 2015, 7, 993–1012. [Google Scholar]
- MUSIC Guidelines. Input Parameters and Modelling Approaches for MUSIC Users in Melbourne Water’s Service Area. 2018. Available online: https://www.clearwatervic.com.au/user-data/private-storage-files/melbourne_water_music_guidelines_update_draft_jan-2016.pdf (accessed on 17 March 2025).
- Melbourne Water. Stormwater Strategy; Melbourne Water: Melbourne, Australia, 2013. [Google Scholar]
- The Best Practice Environmental Management Guidelines: Stormwater; Victoria Stormwater Committee: Wangaratta, VIC, Australia, 1999.
- Alley, W.M.; Veenhuis, J.E. Effective impervious area in urban runoff modelling. J. Hydraul. Eng. 1983, 109, 313–319. [Google Scholar]
- Ball, J.E.; Powell, M. Inference of catchment modelling system control parameters. In Proceedings of the UDM ’98: Developments in Urban Drainage Modelling, London, UK, 21–24 September 1998; Volume 1, pp. 313–320. [Google Scholar]
- Ghobadi, C.; Athuraliya, A.; Gan, K.; Jones, C.; Nelson, L.; Quillam, M.; Redhead, M.; Siriwardene, N. Water Appliance Stock Survey and Usage Pattern Melbourne 2012; Smart Water Fund: Melbourne, Australia, 2013. [Google Scholar]
- Wyndham City Council. Water Needs Information; Dalton Consultant Engineers Pty Ltd.: Melbourne, Australia, 2018. [Google Scholar]
- James, W.; Rossman, L.A.; James, W.R.C. User’s Guide to SWMM 5, 13th ed.; Computational Hydraulics International (CHI): Guelph, ON, Canada, 2010. [Google Scholar]
- Rossman, L. Storm Water Management Model User’s Manual Version 5.1—Manual; EPA/600/R-14/413 (NTIS EPA/600/R-14/413b); US EPA Office of Research and Development: Washington, DC, USA, 2015. [Google Scholar]
- Standards Australia. AS/NZS 4536:1999 Life Cycle Costing An Application Guide; Standards Australia: Homebush, NSW, Australia, 1999. [Google Scholar]
- Taylor, A. Structural Stormwater Quality BMP Cost/Size Relationship Information from the Literature; Cooperative Research Centre for Catchment Hydrology: Melbourne, Australia, 2005; pp. 53–64. [Google Scholar]


| Reference | % Reduction (Mean Annual Volume Flow) | % Reduction (Peak Flow) | Storm/Event |
|---|---|---|---|
| [19] | 42% | 70% | 24 h 180 mm |
| [21] | 33% | 80% | Real storms |
| [18] | 55% | - | - |
| [22] | 61% | 79–93% | 30 min 39% AEP event |
| [23] | 59% | - | Real storms |
| Total Area (m2) | Roof Area (m2) | Paved Area and Driveway (m2) | Garden and Lawn Area (m2) |
|---|---|---|---|
| 495 | 240 (49%) | 80 (16%) | 175 (35%) |
| 495 | 300 (60%) | 90 (18%) | 105 (22%) |
| Development Type/Systems | Rainwater Tanks | Rain Garden (Bioretention) | Green Roofs | Permeable Pavements | Infiltration Trenches | Gross Pollutant Traps | Swales and Buffer Strips | Sedimentation Basins | Constructed Wetlands |
|---|---|---|---|---|---|---|---|---|---|
| Single residential development | ✓ | ✓ | ✓ | ✓ | ✓ | ||||
| Residential subdivision development | ✓ | ✓ | ✓ | ✓ | ✓ | ✓ | ✓ | ||
| Residential multi-unit development | ✓ | ✓ | ✓ | ✓ | ✓ | ✓ | |||
| Streetscape development | ✓ | ✓ | ✓ | ✓ | ✓ | ||||
| Vehicle parking areas (including driveways and access ways on public or private property) | ✓ | ✓ | ✓ | ✓ | ✓ | ✓ | ✓ | ||
| Commercial and industrial development | ✓ | ✓ | ✓ | ✓ | ✓ | ✓ | ✓ | ||
| Publicly owned land | ✓ | ✓ | ✓ | ✓ | ✓ | ✓ |
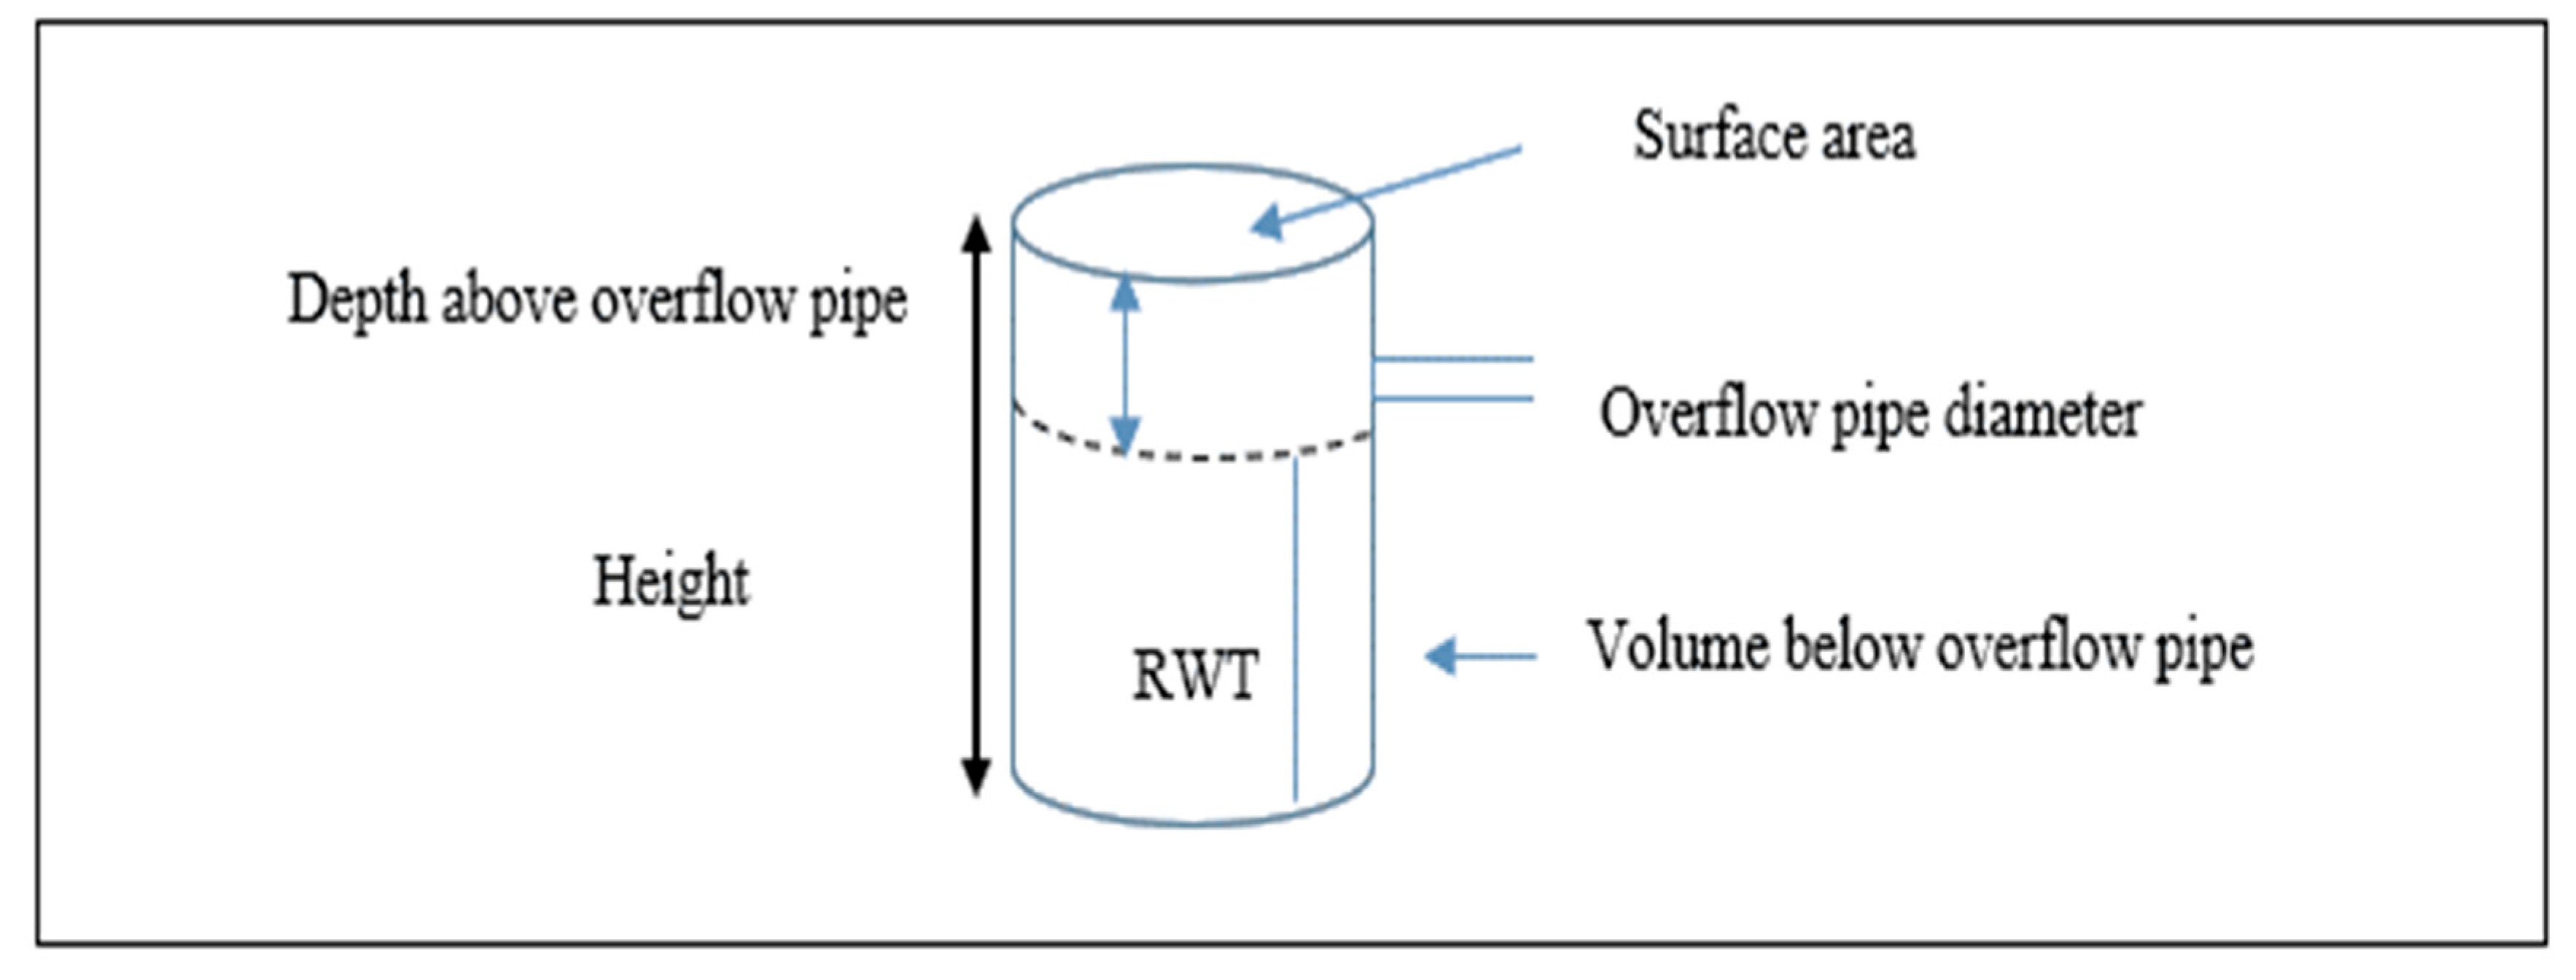
| Parameters | 3 kL Rainwater Tank—Input Values | 5 kL Rainwater Tank—Input Values |
|---|---|---|
| Volume (kL) | 3 | 5 |
| Initial volume (kL) | 1 | 1 |
| Surface area (m2) | 3 | 5 |
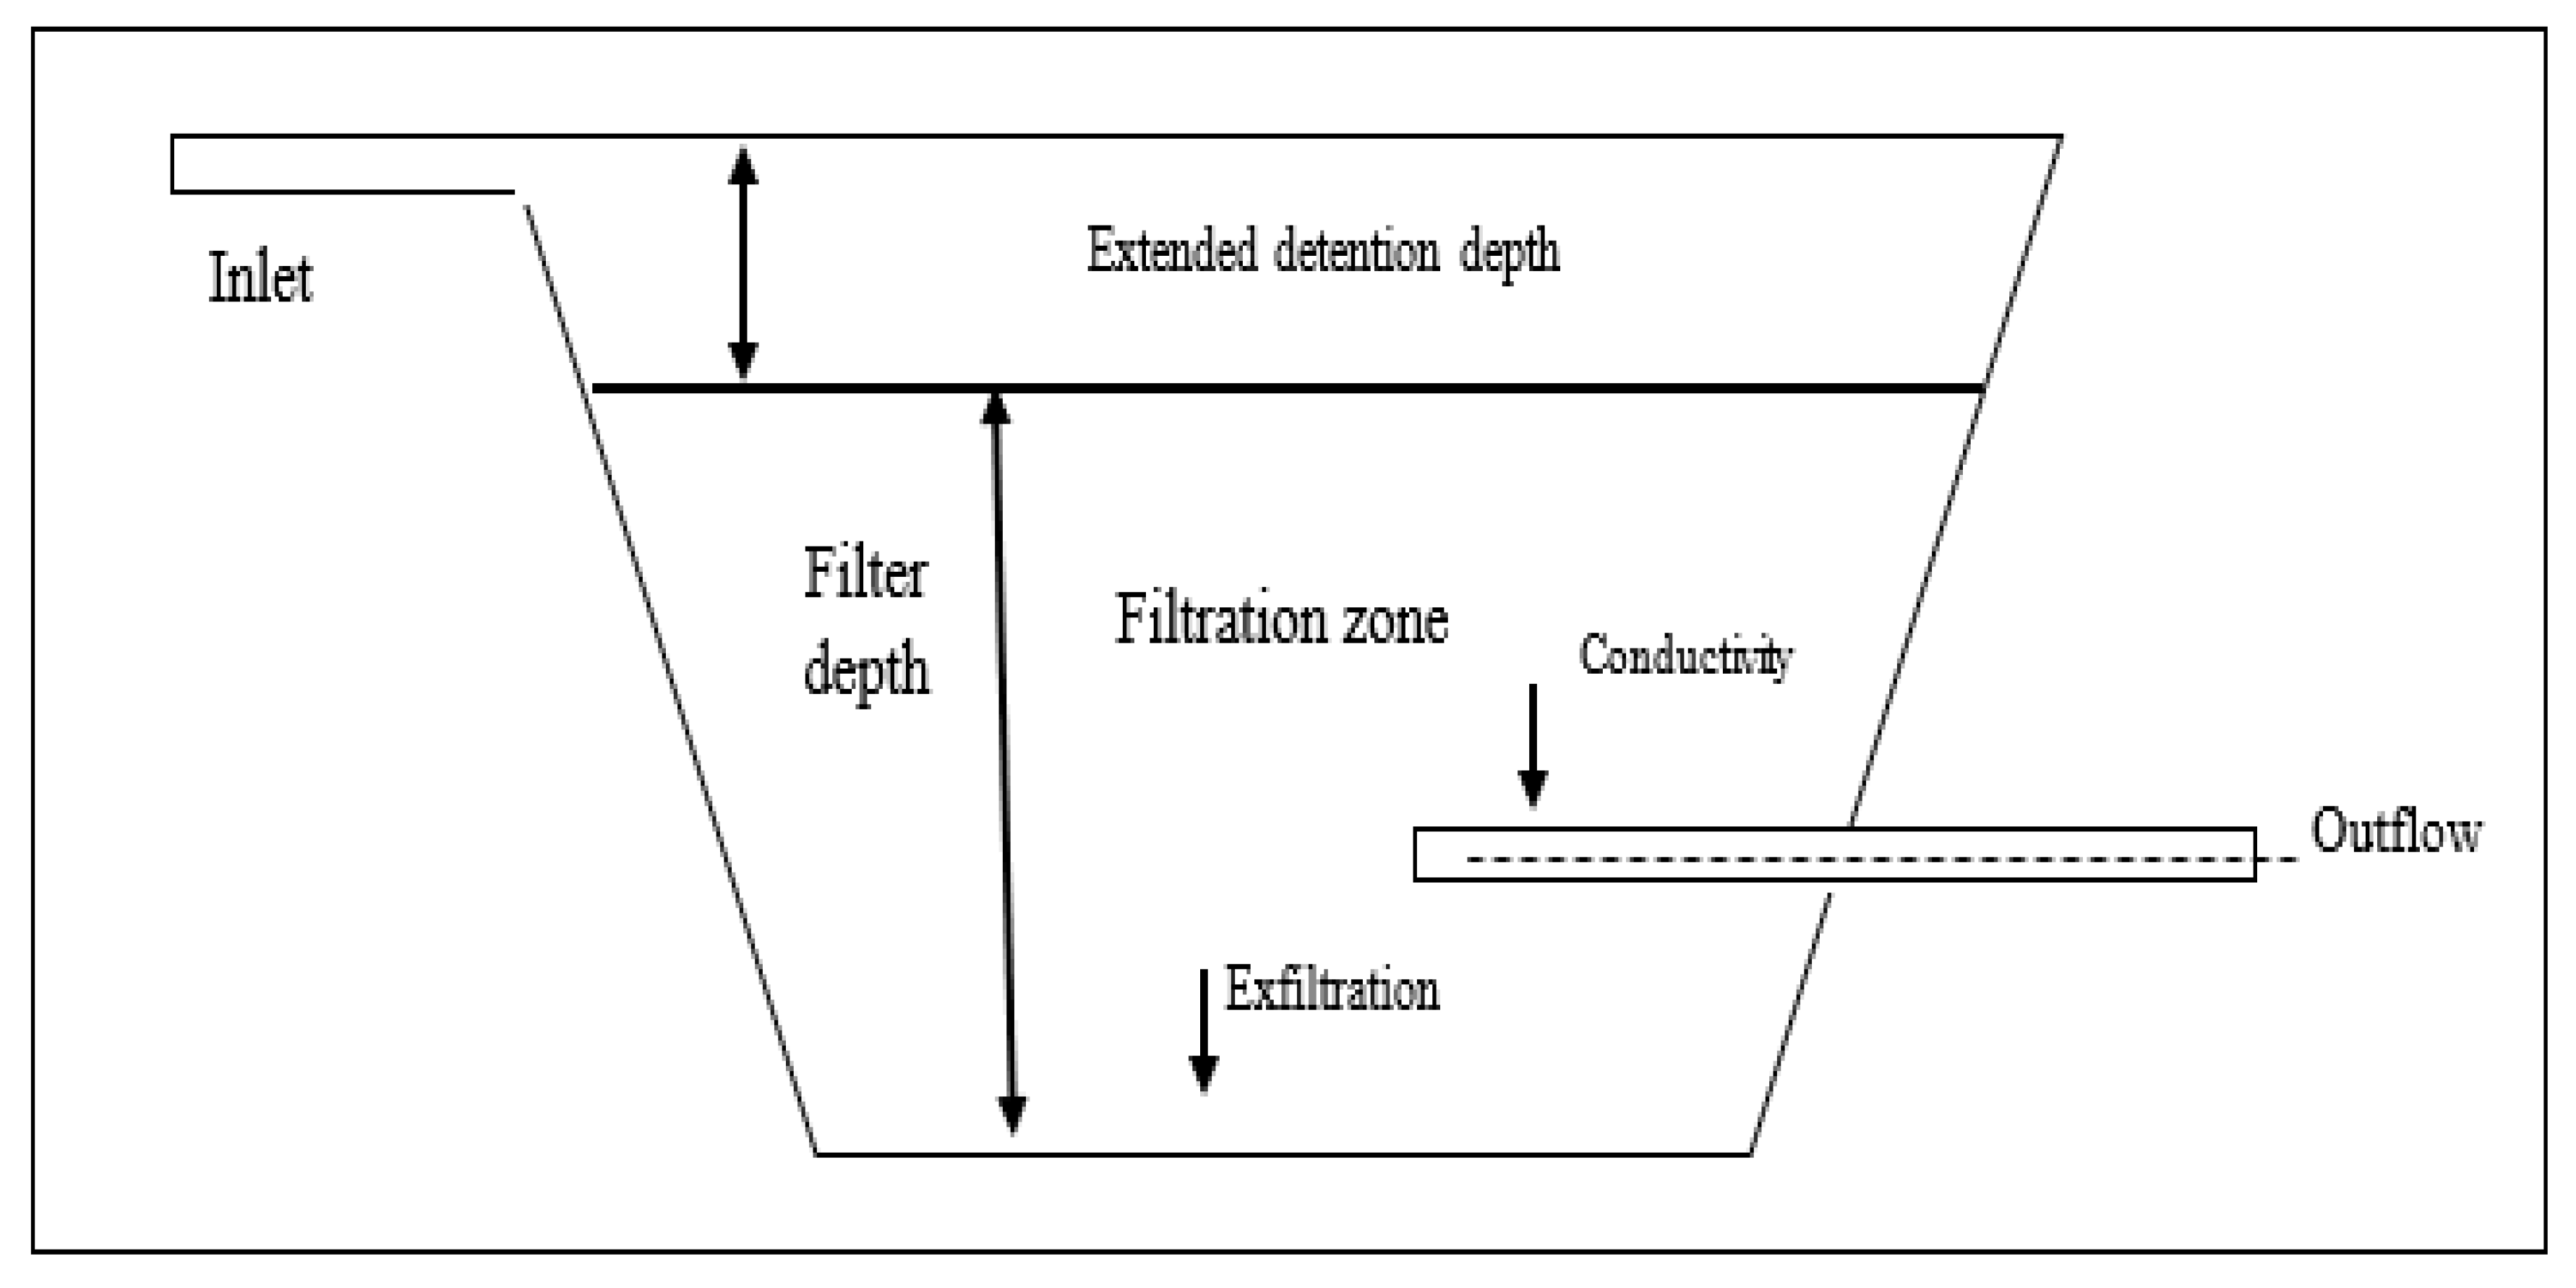
| Infiltration trench—Input values | ||
| Extended detention depth (EDD) (m) | 0.01 | |
| Pond surface area (m2) | 6 | |
| Filter area (m2) | 6 | |
| Filter media perimeter (m) | 10 | |
| Exfiltration rate(mm/h) | 0.36 | |
| Depth of media (m) | 0.5 | |
| Width (m) | 2 | |
| Length (m) | 3 | |
| Rain garden—Input values | ||
| EDD (m) | 0.35 | |
| Surface area (m2) | 7 | |
| Filter area (m2) | 7 | |
| Filter media perimeter (m) | 12.3 | |
| Exfiltration rate (mm/h) | 0.36 | |
| Filter depth (m) | 0.5 | |
| Vegetated swale—Input values | ||
| Vegetation height (m) | 0.8 | |
| Bed slope (%) | 3 | |
| Length (m) | 5 | |
| Top width (m) | 2 | |
| Base width (m) | 2 | |
| Depth (m) | 0.5 | |
| No | System | Current Scenarios | Future Scenarios |
|---|---|---|---|
| 1 | * 3 kL tank (3 kL T) |
|
|
| 2 | * 5 kL tank (5 kL T) |
|
|
| 3 | Infiltration trench (IT) |
|
|
| 4 | Rain garden (RG) |
|
|
| 5 | Vegetated swale (VS) |
|
|
| 6 | Permeable pavement (PP) |
|
|
| 7 | Combination of a 3kL tank and a rain garden (COM1) |
|
|
| 8 | Combination of a 3kL tank and an infiltration trench (COM2) |
|
|
| 9 | Combination of a rain garden and an infiltration trench (COM3) |
|
|
| 10 | Combination of a 3 kL tank, a rain garden, and an infiltration trench (COM4) |
|
|
| Parameters | References | Final Calibrated/Measured Values |
|---|---|---|
| Area (ha) | Available GIS layer | 495 m2 |
| Zoning | WCC MUSIC guideline (mixed area) | Residential |
| EIA/TIA (impervious and pervious percentage) | Calculated for the household for the current condition | 64 and 80% |
| Soil Storage Capacity (SSC) | Initial values from the WCC MUSIC guideline | 120 |
| Soil Initial Storage (IS) | Initial values from the WCC MUSIC guideline | 25 |
| Field Capacity (FC) | Initial values from the WCC MUSIC guideline | 65 |
| System | Reduction Range for 1- to 2-Year Events | Reduction Range for 2- to 5-Year Events | Reduction Range for >5-Year Events |
|---|---|---|---|
| 3 kL Tank | Min 26% to max 34% | Min 22% to max 26% | Min18% to max 21% |
| 5kL Tank | Min 35% to max 42% | Min 32% to max 35% | Min 28% to max 32% |
| 3 kL Tank—no usage | Min 3% to max 4% | Min 4% to max 5% | Min 5% to max 10% |
| 5 kL Tank—no usage | Min 3% to max 8% | Min9% to max 13% | Min 13% to max 18% |
| IT—1 m depth | Min 16% to max 27% | Min 11% to max 16% | Min 5 to max 10% |
| RG—0.5 m depth | Min 50% to max 70% | Min 40 to max 50% | Min 32 to max 40% |
| VS –0.5-meter length | Min 15 to max 22% | Min 12 to max 15% | Min 10 to max 12% |
| System | Reduction Percentage Rage for 1- to 2-Year Events | Reduction Percentage Range for 2- to 5-Year Events | Reduction Percentage Range for Events > 5 |
|---|---|---|---|
| COM1 | Min 42% to max 45% | Min 38% to max 42% | Min 35% to max 37% |
| COM2 | Min 39% to max 51% | Min 33% to max 38% | Min 27% to max 32% |
| COM3 | Min 70% to max 100% | Min 60% to max 75% | Min 37% to max 55% |
| COM4 | Min 80% to max 100% | Min 65% to max 85% | Min 50% to max 60% |
| System | Reduction Percentage for 1- to 2-Year Events | Reduction Percentage for 2- to 5-Year Events | Reduction Percentage for Events > 5 |
|---|---|---|---|
| 3 kL Tank x 2 | Min 48% to max 65% | Min 38% to max 47% | Min 30% to max 38% |
| 5 kL Tank x 2 | Min 60% to max 80% | Min 49% to max 59% | Min 38% to max 48% |
| 3 kL Tank—no usage x 2 | Min 1% to max 3% | Min 3% to max 5% | Min 5% to max 8% |
| 5 kL Tank—no usage x 2 | Min 1% to max 5% | Min 5% to max 8% | Min 8% to max 11% |
| IT—1-m depth x 2 | Min 39% to max 57% | Min 28% to max 38% | Min 19% to max 28% |
| RG—0.5 m depth x 2 | Min 67% to max 82% | Min 60% to max 70% | Min 57% to max 60% |
| VS—0.5 m length x 2 | Min 23% to max 28% | Min 20% to max 23% | Min 17% to max 20% |
| System | Reduction Percentage for 1- to 2-Year Events | Reduction Percentage for 2- to 5-Year Events | Reduction Percentage for Events > 5 |
|---|---|---|---|
| COM1 | Min 60% to max 80% | Min 50% to max 60% | Min 41% to max 50% |
| COM2 | Min 60% to max 80% | Min 50% to max 60% | Min 40% to max 50% |
| COM3 | Min 80% to max 100% | Min 75% to max 84% | Min 76% to max 86% |
| COM4 | Min 90% to max 100% | Min 85% to max 90% | Min 77% to max 86% |
| Parameters | 3 kL Rainwater Tank—Input Values | |
|---|---|---|
| Volume (kL) | 3 | |
| Width (m) | 0.9 | |
| Height (m) | 1.2 | |
| Surface area (m2) | 2.5 | |
| 5 kL Rainwater tank—Input values | ||
| Volume (kL) | 5 | |
| Diameter (m) | 1.15 | |
| Height (m) | 1.2 | |
| Surface area (m2) | 4.2 | |
| Infiltration trench—Input values | ||
| Berm height (m) | 0.2 | |
| Vegetation volume (%) | 0.6 | |
| Storage thickness (m) | 0.3 | |
| Drain coefficient | 3 | |
| Void ratio | 0.6 | |
| Seepage rate (mm/hr) | 0.36 | |
| Surface slope | 1 | |
| Rain garden—Input values | ||
| Berm height (m) | 0.3 | |
| Vegetation volume | 0.6 | |
| Storage thickness (m) | 7 | |
| Void ratio | 0.6 | |
| Seepage rate (mm/hr) | 0.36 | |
| Conductivity (mm/hr) | 100 | |
| Vegetated swale—Input values | ||
| Berm height (m) | 0.3 | |
| Vegetation volume | 0.8 | |
| Surface roughness | 0.015 | |
| Surface slope | 3 | |
| Side slope | 5 | |
| Top width (m) | 2 | |
| Length (m) | 5 | |
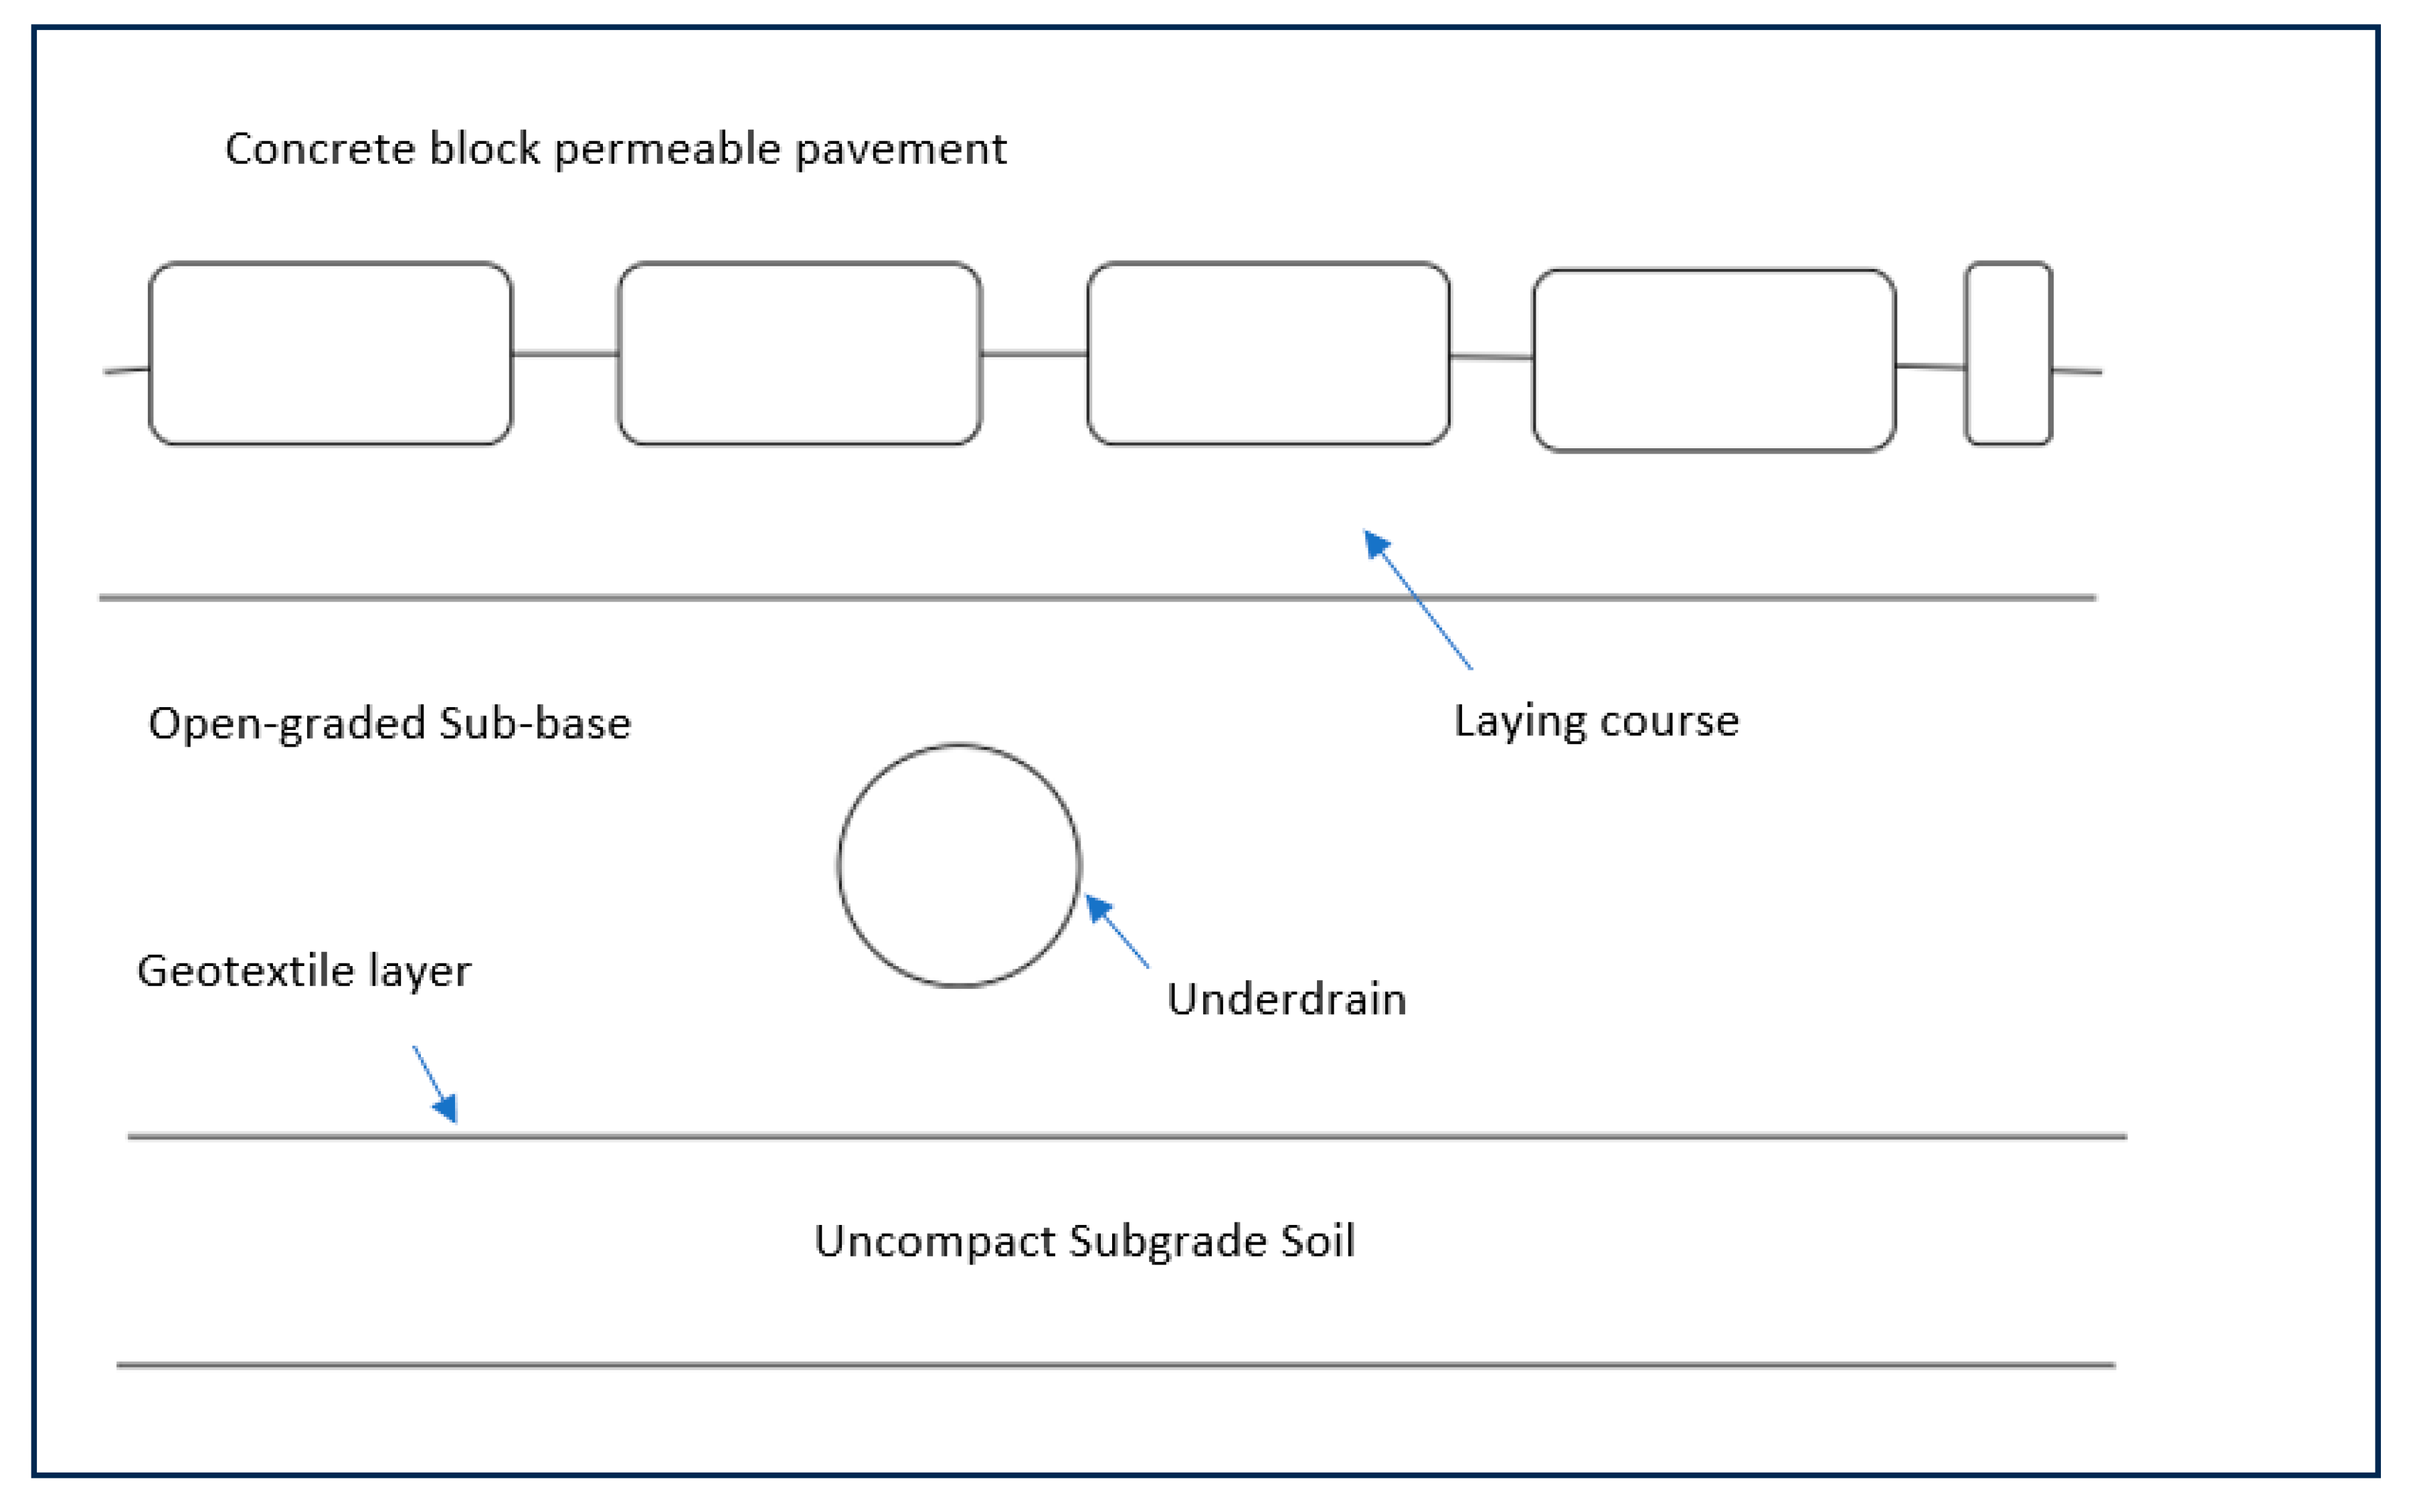
| Permeable pavement—Input values | ||
| Surface | Berm height (m) | 0.2 |
| Surface slope % | 1 | |
| Surface roughness | 0.015 | |
| Pavement | Thickness (m) | 0.2 |
| Void ratio | 0.15 | |
| Permeability (mm/hr) | 254 | |
| Soil | Thickness (m) | 0.5 |
| Porosity fraction | 0.5 | |
| Field capacity | 0.28 | |
| Conductivity (mm/hr) | 100 | |
| Storage | Thickness | 0.45 |
| Void ratio | 0.2 | |
| Seepage rate (mm/hr) | 0.36 | |
| Clogging factor | 0 | |
| Underdrain | Drain coefficient (mm/hr) | 25.6 |
| Drain exponent | 0.5 | |
| Drain offset height (m) | 0.02 |
Disclaimer/Publisher’s Note: The statements, opinions and data contained in all publications are solely those of the individual author(s) and contributor(s) and not of MDPI and/or the editor(s). MDPI and/or the editor(s) disclaim responsibility for any injury to people or property resulting from any ideas, methods, instructions or products referred to in the content. |
© 2025 by the authors. Licensee MDPI, Basel, Switzerland. This article is an open access article distributed under the terms and conditions of the Creative Commons Attribution (CC BY) license (https://creativecommons.org/licenses/by/4.0/).
Share and Cite
Rashetnia, S.; Sharma, A.K.; Ladson, A.R.; Browne, D.; Yaghoubi, E. Effectiveness of Water-Sensitive Urban Design Techniques on Stormwater Quantity Management at a Residential Allotment Scale. Water 2025, 17, 899. https://doi.org/10.3390/w17060899
Rashetnia S, Sharma AK, Ladson AR, Browne D, Yaghoubi E. Effectiveness of Water-Sensitive Urban Design Techniques on Stormwater Quantity Management at a Residential Allotment Scale. Water. 2025; 17(6):899. https://doi.org/10.3390/w17060899
Chicago/Turabian StyleRashetnia, Samira, Ashok K. Sharma, Anthony R. Ladson, Dale Browne, and Ehsan Yaghoubi. 2025. "Effectiveness of Water-Sensitive Urban Design Techniques on Stormwater Quantity Management at a Residential Allotment Scale" Water 17, no. 6: 899. https://doi.org/10.3390/w17060899
APA StyleRashetnia, S., Sharma, A. K., Ladson, A. R., Browne, D., & Yaghoubi, E. (2025). Effectiveness of Water-Sensitive Urban Design Techniques on Stormwater Quantity Management at a Residential Allotment Scale. Water, 17(6), 899. https://doi.org/10.3390/w17060899