Article

Estimating Peak Flows in Streams During the Flash Flood Event of 29 October 2024 in Spain: An Empirical Approach

Cavanilles Institute of Biodiversity and Evolutionary Biology, Universitat de València, 46980 Valencia, Spain
*
Author to whom correspondence should be addressed.
Water 2025, 17(21), 3177; https://doi.org/10.3390/w17213177
Submission received: 26 September 2025 / Revised: 29 October 2025 / Accepted: 2 November 2025 / Published: 6 November 2025
(This article belongs to the Special Issue Spatial Analysis of Flooding Phenomena: Challenges and Case Studies)

Abstract

The present study focuses on the extraordinary isolated high-level depression event that occurred on 29 October 2024 over the eastern Iberian Peninsula (Spain). The emphasis of the study is on the Turia and Magro river basins and the Albufera of Valencia lagoon basin, with particular attention given to the hydrological implications of the event in these areas. It is an established fact that episodes of intense precipitation give rise to flash floods. This recurrent phenomenon has significant economic and human impacts, and is particularly prominent in the Mediterranean region, including the Valencian Community (Eastern Spain). The estimation of peak flows at key sites in the basins was achieved through the utilization of an empirical methodological approach based on fieldwork to obtain the wetted cross-section of each site of analysis. Utilizing the existent official flow-measuring data network, an estimation was made of the average velocity of the water. The results indicate that flows in several locations exceeded the carrying capacity of the watercourses, leading to substantial flooding and overflows. The maximum estimated peak flow was determined to be 5678 m3 s−1 in the Poyo ephemeral stream and 4198 m3 s−1 in the Magro river. The results were validated using the Manning equation and related stream parameters (such as roughness and slope), obtaining a normalized root mean squared error of 3.62% and normalized mean absolute error of 2.26%. This analysis identified bottlenecks in the hydrographic network and emphasized the necessity to enhance detailed knowledge of the hydraulic capacity of watercourses. This helps with the purpose of flood risk management in the event of extreme future events accentuated by climate change.

1. Introduction

The Mediterranean region is particularly vulnerable to extreme weather events, such as isolated high-level depressions (IHDs), which could become more frequent and intense in the context of global climate change. Such events can result in the occurrence of flash flooding, defined as a rapid rise in water levels over a brief period. This phenomenon often surpasses the response capacity of both ecosystems and human infrastructures. In the Valencian Community of Spain, flash floods are a well-known phenomenon due to their recurrence and the significant economic damage and loss of life they cause [1,2]. It is evident that such occurrences are also characteristic of regions experiencing monsoons and of tropical hurricane counties. For instance, the Ganges River floods and the Mississippi river overflow as a result of continuous or extreme rainfall are well documented. In the period spanning five days during the Millennium Flood of 2000, India experienced an accumulation of 1200 mm of rainfall [3], accompanied by a peak flow of 10,400 m3 s−1. This event led to the unfortunate loss of over 400 lives. In the United States, the Great Flood of 2011 [4] saw a total of 500 mm of rainfall recorded over a period of six days. The flow rate of the river was estimated at 65,000 m3 s−1. The economic impact was estimated at approximately USD 2 billion and 348 lives were lost, despite the implementation of significant preventive measures in the affected area. There have also been extraordinary floods in Australia; for example, the 2022 Maribyrnong River flooding debacle in Melbourne, Victoria, where 500 houses were affected but no fatalities were reported [5]. According to Jonkman, Oceania has the lowest flood fatality rate of any region in the world [6].
A distinguishing feature of the Mediterranean basins is the pronounced disparity in altitude between the coastal mountain ranges and the coastline, with mountains reaching elevations of 1000 m above sea level and a distance from the coast of 50 km or less [1]. This results in average slopes of 2%, which increase significantly in headwater sections. Given the scarcity and irregularity of rainfall, which occurs on only a few days per year and with high intensity, the hydrographic basin is characterized by the presence of ephemeral temporary streams [2]. These channels serve to convey water exclusively during the period of rainfall and for a duration of up to one week thereafter. An ephemeral stream is referred to in Spanish as a “barranco” or “rambla”, while it is known as a “ravine” in English, as defined by the Collins Dictionary. They are water courses that only have a flow when there is a period of rainfall that accumulates about 30 to 50 mm in 4 h. For the purposes of this study, we use ravine or ephemeral stream, or “stream” for short.
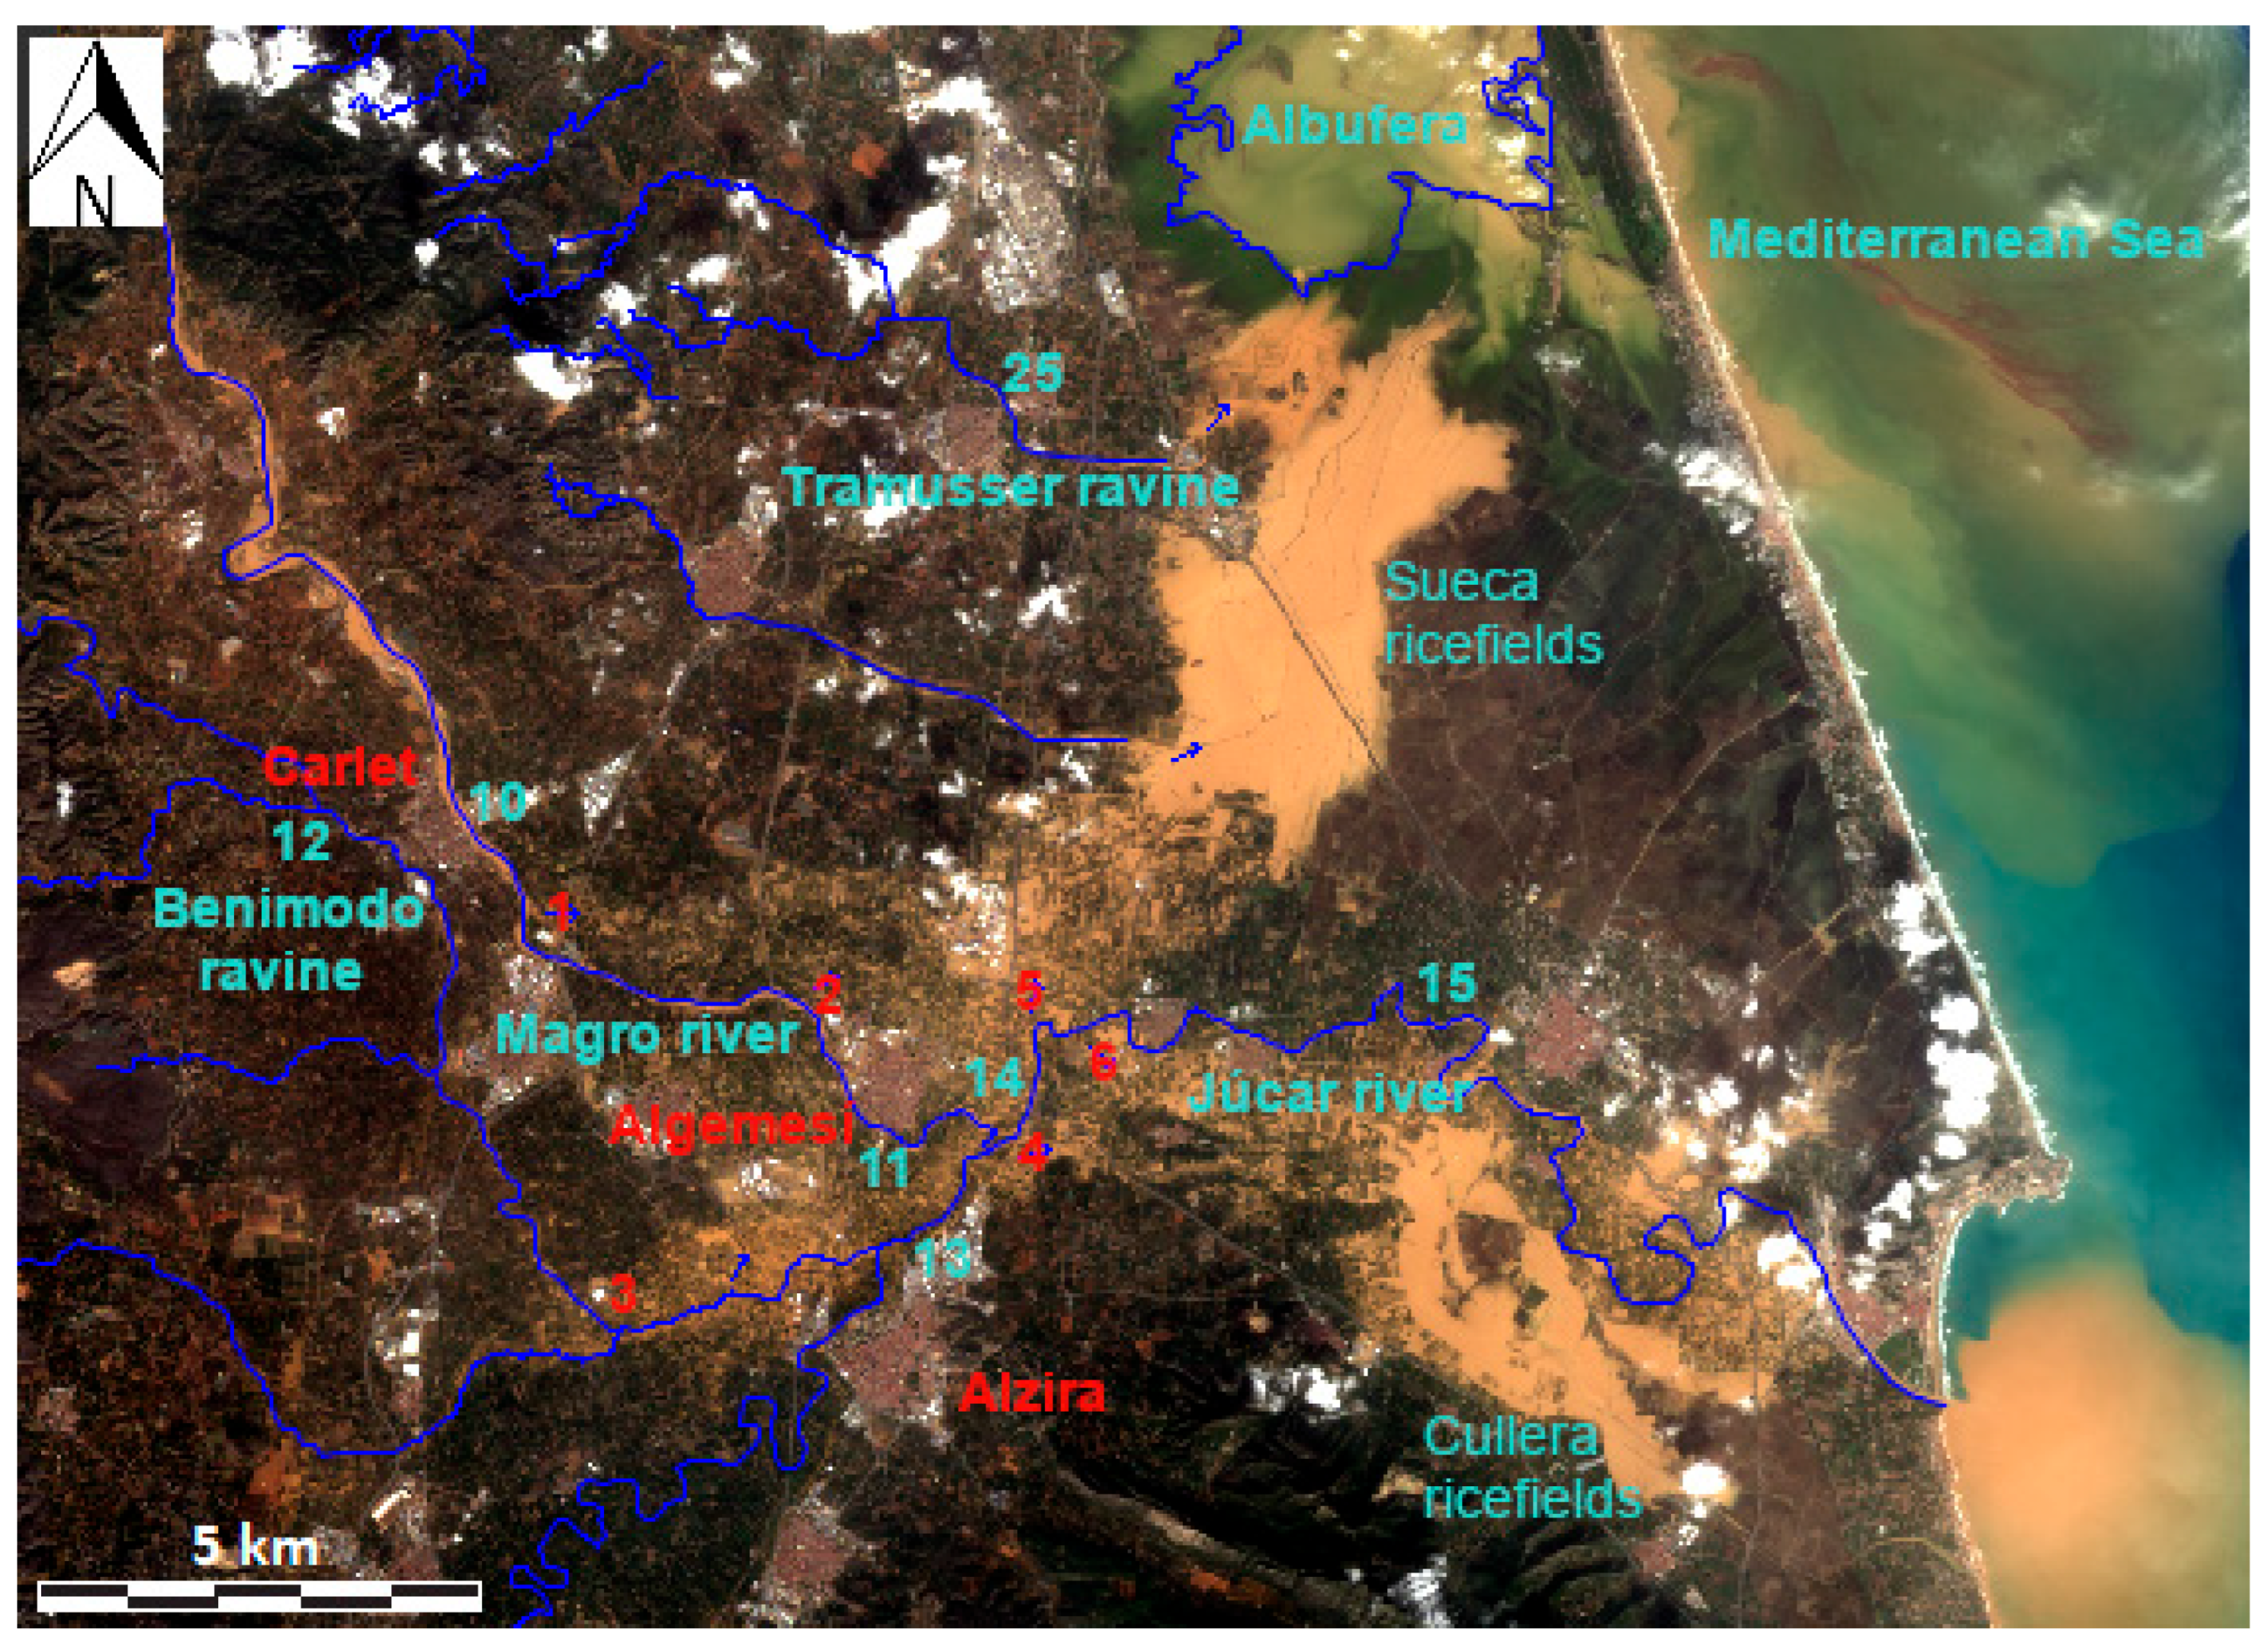
On 29 October 2024, an exceptional storm event, initiated by an IHD, occurred in the eastern part of the Iberian Peninsula, exerting a profound impact on the catchment areas of the Turia and Magro rivers and the Poyo stream [7]. The precipitation was characterized by high intensity and magnitude, manifesting in recurrent, brief episodes during a period of only ten hours and mainly in the middle section of the hydrographic basins, where the slope of the land exceeds 2%. This phenomenon resulted in multiple flood pulses [8], but the nature of flooding that occurred was clearly fluvial. Surface runoff water was rapidly mobilized, resulting in the sudden transformation of typically dry ephemeral streams into the rivers, with considerable volumes of water flowing to the sea as tributaries of the Jucar and Turia rivers and into the Albufera lagoon (flowing by the Poyo and other minor streams). The limited transport capacity of the watercourses in many sites resulted in substantial flooding that exceeded the limits of the river banks, with extensive areas of the alluvial plains near the coast experiencing inundation, extending more than 10 km away from the primary watercourses (Figure 1) [7,9]. Recent assessments of the consequences of this event in Europe have concluded that the results were catastrophic [10,11]. According to government reports, the material damage was estimated at approximately EUR 20 billion, and there were 228 deaths.
Since 1989, real-time monitoring networks have been in operation under the title of the Automatic Hydrological Information System (SAIH) of the Jucar Basin Authority (CHJ). The information from these networks is made available to the stakeholders via a web service in real time, with a delay of only 15 min in the presentation of the data (SAIH Jucar) [12]. The sporadic and unpredictable nature of these events frequently restricts the analytical and evaluative capabilities of the flow data collected by the SAIH. These systems consist of direct and continuous rainfall and level gauges at various sites, riverbeds and reservoirs. These gauges have been under consideration since their initial installation in 1987 by CHJ technicians [13].
A variety of methodologies exist for the monitoring of watercourses. The timed volume method, also referred to as volumetric flow, is a direct measurement technique employed in cases where a small stream converges at a singular point [14]. The experimental procedure entails the measurement of the time required to fill a vessel of known volume. This is followed by the calculation of the average flow rate [15]. This technique is regarded as being simple, economical, and precise for streams of limited size. However, it is not considered to be suitable for wide streams [14].
Velocity–area methods are predicated on the principle of flow continuity, whereby the velocity of the water is measured and multiplied by the cross-sectional area of the flow [16]. The following techniques are covered: the float method, the dilution-gauging method, the trajectory method, the current meter method, the acoustic Doppler current profiler method, and the electromagnetic method. The float method is a technique that involves the placement of a floating object in the current. The time taken for the object to travel a known distance is then measured [16]. The system is characterized by its simplicity and cost-effectiveness. However, its precision is compromised by water turbulence [17]. The dilution method is a process that involves the introduction of a tracer (e.g., common salt) into the water sample. This is followed by the measurement of its concentration. The flux is then calculated using the measured concentration and known amount of tracer introduced [18]. The model has been demonstrated to be accurate for turbulent flows [19]. However, the use of certain chemical tracers requires explicit permission [20]. In the trajectory method, the total water flow is directed through a pipe [21], and the flow rate is determined by measuring the velocity of the outflowing stream. The accuracy of the measurement is irrefutable; nevertheless, it does necessitate the expertise of trained personnel and complex calculations [22]. In the conventional meter method, a rotating device is employed to measure the velocity of water at specific points in the flow cross-section [23,24]. The flow rate is determined by multiplying the velocity by the area [25]. The instrument has been demonstrated to possess a high degree of precision. However, it is costly and appropriate for all categories of streams accessible from walkways, and this is the common method used by technicians of the CHJ. The acoustic Doppler profiler method utilizes sound waves to measure the velocity of particles suspended in the water. This enables the calculation of the flow rate on a continuous basis [25]. While the method is accurate and non-invasive, it is expensive and requires the use of electronic equipment, as well as trained personnel [26]. The electromagnetic method, predicated on Faraday’s law, quantifies the water velocity through the magnetic field generated in the flow [27]. The accuracy of this method has been thoroughly documented [28] and also is used by CHJ specialists. However, it is imperative to acknowledge that its application is exclusively suitable for currents that can be channeled.
Another methodology that can be employed is the constricted channel flow methodology, which applies the Navier–Stokes equations. This methodology involves the construction of a water passage of known dimensions and geometry. Subsequently, physical calculation is applied to determine the circulating flow. The constriction method in question enables the flow rate to be determined using a predefined table or estimated using a weir equation. The equation under consideration incorporates three variables: the flow rate, the height of the water level, and the width of the crest [29,30]. The flume method involves the construction of an artificial open-cut flow structure, which serves to reduce the area of the channel and modify its slope. This phenomenon leads to an augmentation in velocity and a modification in the volume of water that traverses the channel [31] and is also used by the CHJ in some site gauging work.
The final methodologies are non-contact in nature and include two techniques: remote sensing and particle image velocimetry (PIV). The remote sensing method is employed to estimate the river flow from space. This method utilizes ground-based measurements and satellite data to generate empirical curves that link the water surface area to the flow [32,33]. Particle image velocimetry (PIV) is a method of measuring fluid flow that utilizes lasers and cameras to capture the movement of particles in water. This process facilitates the calculation of the flow velocity [34,35]. The technology under discussion is characterized by its high level of accuracy; however, it is important to note that its implementation is limited by the necessity for highly specialized equipment and by its applicability to flat terrain [36,37].
The substantial increase in the frequency and severity of flooding events is attributed to the effects of climate change, a trend that is projected to intensify in the coming decades. In this context, there is an urgent need to improve our understanding of flood dynamics [38]. This challenge is particularly evident in the Mediterranean region, where isolated high-level depression (IHD) episodes give rise to flash floods with recurring economic and human impacts.
The evaluation of such extreme events necessitates the employment of both accurate and robust methodologies. However, traditional approaches to estimating return periods often lack reliability under extreme flow conditions, as indicated by the review conducted by González-Cao et al. [38]. This inherent limitation in conventional methods contributes to the challenges associated with future modeling, particularly in terms of adapting non-stationary Intensity–Frequency–Duration (IFD) practices in the context of a changing climate. The limited availability of projected precipitation records at sub-daily or sub-hourly time scales represents a significant impediment to research in this area, as highlighted in the study by Balacumaresan et al. [39].
In consideration of the sporadic and unpredictable nature of these phenomena and the constraints on data collection by real-time systems, such as the SAIH, this study employed a post-event empirical methodology. This approach, predicated on the physical evidence left by the flood, facilitates the estimation of the maximum flows reached at key points in the Turia, Magro, and Poyo basins. The fundamental objective is to provide an accurate hydrological characterization of the October 2024 event, thereby identifying the limitations of the hydraulic capacity of the channels and providing essential data for future flood risk management. The post-event empirical analysis developed here provides a crucial methodological innovation by offering estimates of peak flows in a recent disaster scenario where the measurement infrastructure was overwhelmed, providing flows that were indiscernible through other means. The method under discussion addresses the phenomenon of extreme rainfall and its implications for urban/stormwater flooding risk and was validated by calculating the flow according to Manning’s equation. It should be noted that González-Cao et al. [38] previously highlighted the historical use of this equation in the reconstruction of peak discharges, and its fundamental role in hydraulic modeling. The selection of the roughness parameter, otherwise known as the Manning coefficient, has been shown to exert a significant influence on the numerical outcomes of the simulations. Consequently, the calibration undertaken in this study provides essential empirical data for the development of future models.

2. Materials and Methods

2.1. Study Area

The study area encompasses the critical regions impacted by the storm of 29 October 2024, in the eastern region of the Iberian Peninsula. These regions include the lower basins of the Magro river (a tributary of the Jucar), the Turia river, and the Poyo stream, along with other minor ephemeral streams flowing into the Albufera of Valencia lagoon. The territory in question is located at the following geographical coordinates: 39.729° N, −0.978° W, 38.973° N, −0.180° W.
The Magro river was the focus of this study, with research conducted from its downstream point at the Forata reservoir to its confluence with the Jucar river. The Turia river was assessed downstream of the Loriguilla reservoir. An extensive study was conducted on the Poyo stream, encompassing its middle and lower sections, extending from the town of Chiva to its mouth at the Albufera of Valencia lagoon. The drainage area of these basins extends across a county that exhibits a pronounced altitudinal gradient from the inland mountainous regions at an altitude of approximately 1000 m above sea level to the expansive Valencian coastal plain, characterized by channel gradients of 2% in the streams. The alluvial plain associated with these channels, distinguished by its convex structure due to sedimentation, was the primary area affected by the floods. This is a very important aspect to consider in order to understand why flooding occurs in this area. The convexity of the territory due to the effect of fluvial sedimentation means that the areas near the riverbed are higher than the plains several kilometers away such that the waters overflow from the margins of the riverbed and extend to areas lower than the riverbed itself, even following the layout of old paleochannels, in the direction of the old marine gulf that is currently the Albufera of Valencia. This detail can be seen in Figure 1 (observed in earthy color) as the flooded plains between the riverbeds and the lagoon.
The floodwaters followed their natural or modified course, with those of the Magro and Turia flowing towards the sea and those of the Poyo stream flowing towards the Albufera of Valencia. The Albufera lagoon is a shallow, eutrophicated coastal lagoon located to the south of the city of Valencia (see Figure 1). The formation of the Albufera is attributable to the accumulation of sediments from the Turia and Jucar rivers during the last 6000 years. The Albufera lagoon currently receives flows from various ephemeral streams, with the Poyo stream (also known as the Torrent–Massanassa stream in its final stretch) being a primary tributary. It is noteworthy that the lower course of the Poyo stream has undergone artificial modification throughout history, with its waters currently flowing towards the Albufera after undergoing alterations to its course in the 18th century [40].
The Jucar Basin Authority (CHJ) has established a network of gauging points, which are integrated into the Automatic Hydrological Information System (SAIH). The SAIH was initiated following the significant flood caused by the bursting of the Tous dam in 1982 [41]. The primary objective of the SAIH was to enhance the control of such events, and the system’s data are publicly accessible both in real time and through the web service (SAIH Jucar) [12]. The cartographic representation of areas susceptible to flooding, as well as the delineation of affected regions, is facilitated by cartographic tools such as the Cartographic Viewer of the Regional Government (GVA visor) [42].

2.2. Field Work

The methodology employed in this study was established in a post-event empirical approach, prioritizing direct field observation and the integration of available data to characterize the hydrological response to a flash flood event. In contrast to conventional methods that model rainfall-to-flow conversion, such as the Rational Method [43], this approach focuses on the physical evidence left behind by the flood. The empirical method allows for simplicity in calculation based on simple visual observation of the water level when a table of correspondence between the height and measured or estimated flow has been constructed, which allows the variable to be measured quickly.
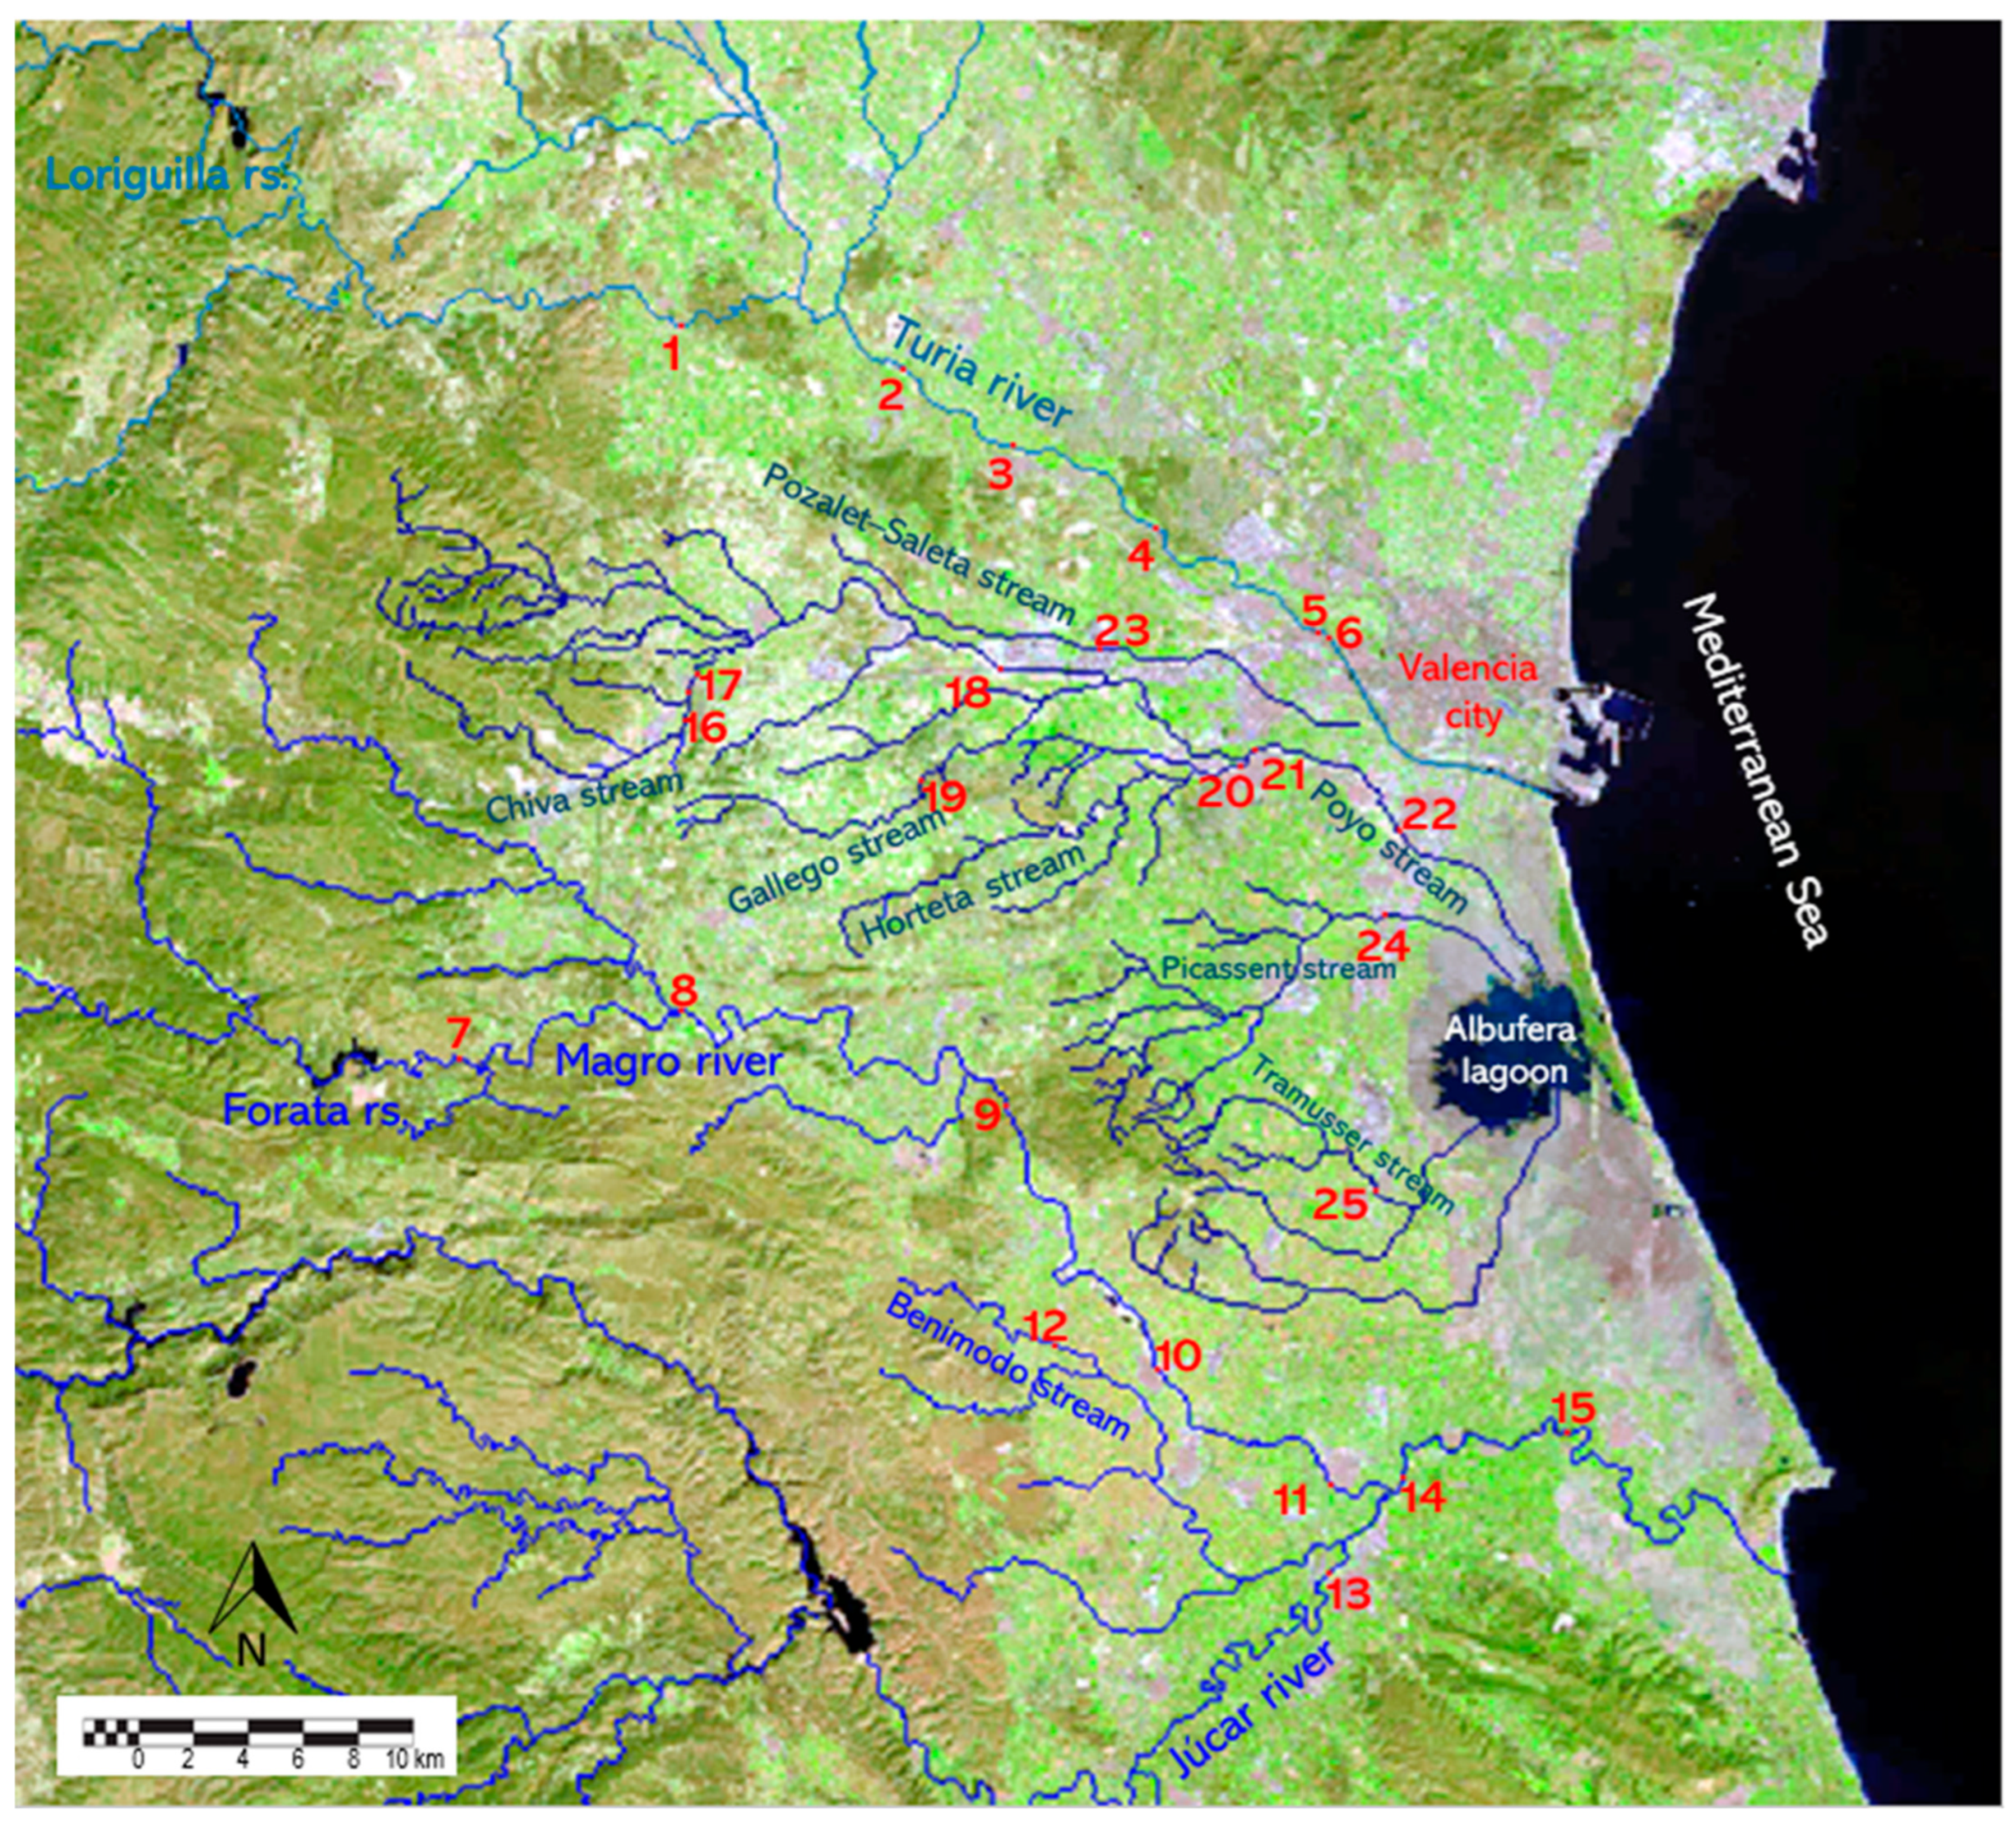
A preliminary study of the three areas of interest (Magro–Jucar river, Turia river, and Albufera basin; Figure 2) was conducted to identify the most significant points for the hydrological assessment. The selection of these measurement points was made on the basis of their affiliation with the Official Hydrological Measurement Network, which is integrated within the SAIH framework. In addition to these points, the study encompassed select points belonging to the Official Network of Visual Observation of Floods in Riverbeds, as illustrated in Figure A1 and Figure A2. Furthermore, supplementary points of interest were selected for measurement purposes, as outlined in this study.
The evaluation of these sites was conducted using gauging data collected by the CHJ through the SAIH during the event. This data was publicly accessible via the web service [12]. The measurement sites were visited to obtain their dimensions (maximum level of water and width of the channel) and calculate the wetted river cross-section. A photograph of the site was taken for the purpose of illustration, and the dimensions of the site were measured with a Nikon Forestry II Laser Rangefinder (Nikon Corp., Tokyo, Japan). The site’s cross-section was then sketched with computer-assisted drawing software, and the cross-sectional area was evaluated according to the sketch.
The fieldwork included site visits to the affected watercourses, wherein a meticulous inspection of the 25 sites was conducted. These visits were conducted between December 2024 and January 2025, at a time when access to the affected areas was no longer compromised and the water footprint of the floods at various locations remained identifiable.
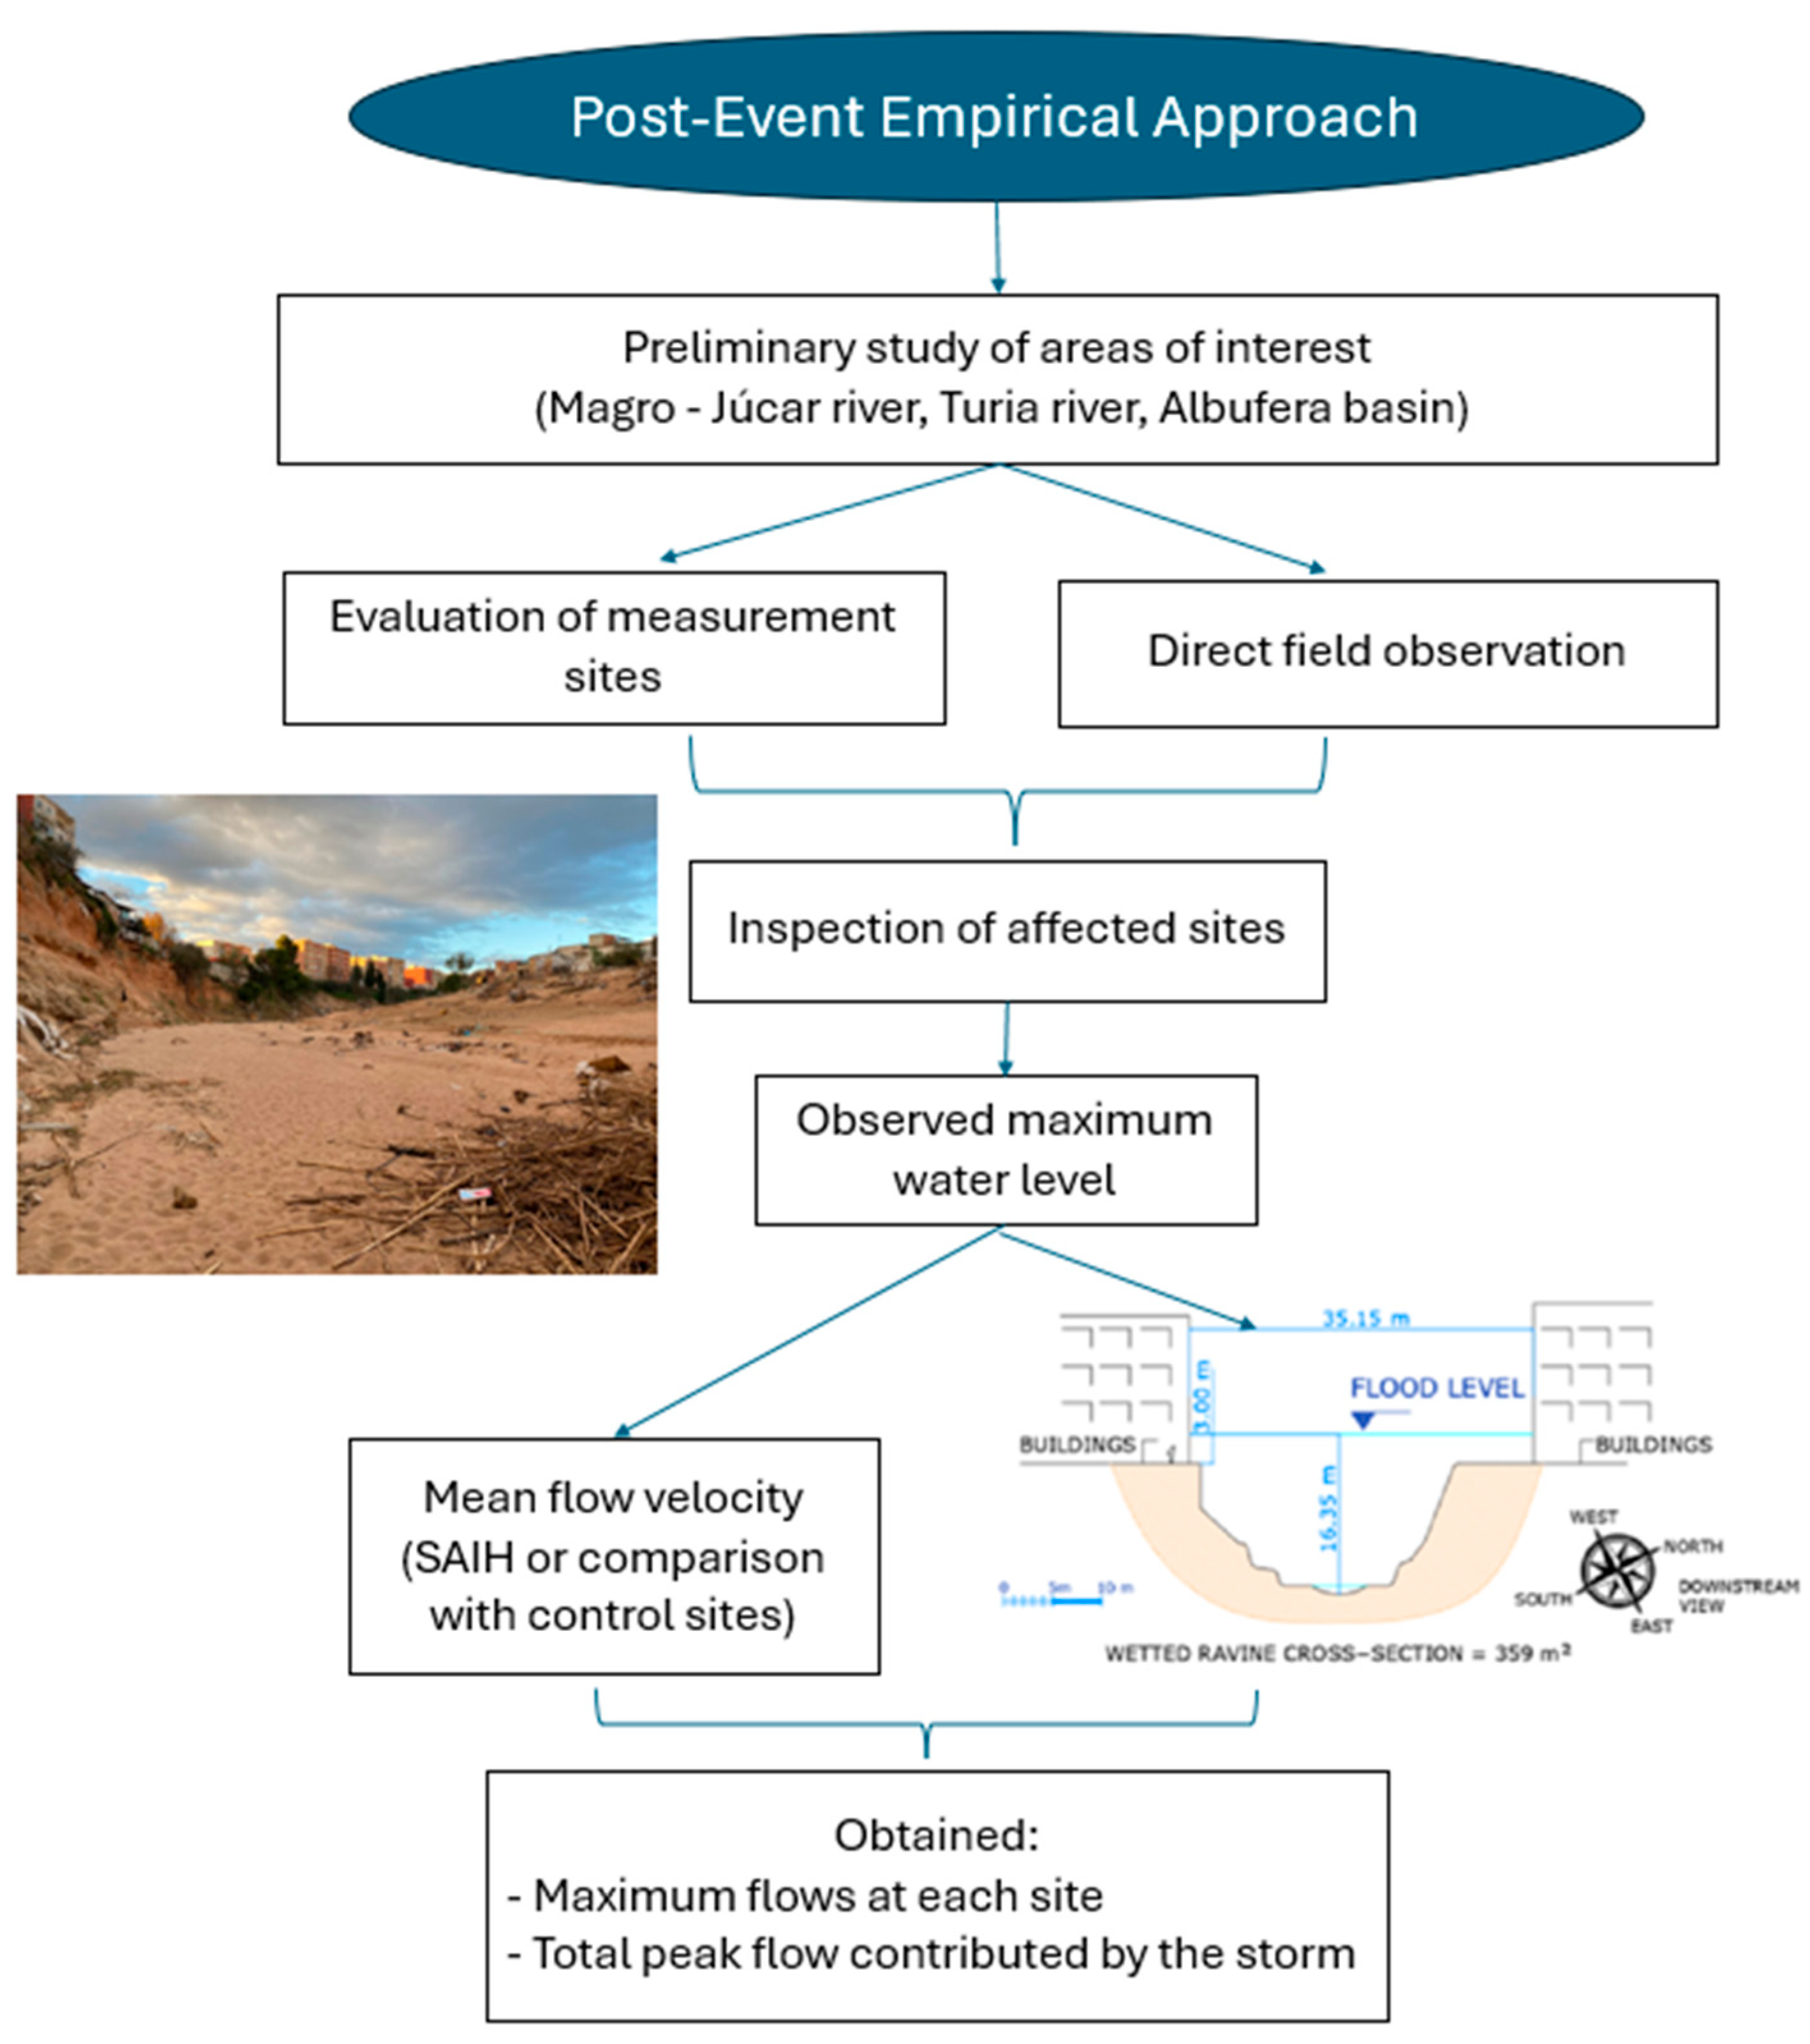
A number of 25 interesting points were identified, examined, and sketched. Additionally, cross-sections of the channel were documented. The maximum height attained by the water level during the flood event was meticulously observed, with the height in certain instances requiring estimation through visual assessment of the evident marks left by the plant debris that was transported and deposited along the banks and structures. The utilization of the aforementioned data permitted the estimation of the wetted cross-sectional area that was occupied by the water level at the flood’s peak at these specific points. The graphic and illustrative materials were deposited in a publicly accessible database called Zenodo [44]. The flow diagram of works is presented in Figure 3.
Another question is of particular importance. The observations conducted for the present study demonstrated that it is not feasible to ascertain the duration of the flood peak, the number of flood peaks, the time of concentration, or the time of the descent curve exclusively using the SAIH [12]. These inquiries will be addressed in forthcoming studies, in which the relationship between the rainfall and flow will be evaluated based on detailed data concerning rainfall in the territory. However, it can be assumed that the Poyo riverbeds are the result of direct runoff caused by rainfall, given that this stream was dry prior to the event. Conversely, the Magro, Jucar, and Turia riverbeds demonstrated a component of pre-existing basic runoff, although this is of minimal relevance when compared with the direct runoff [45].
Subsequent data analysis focused on determining the mean flow velocity at the wet cross-section measurement points. This variable is of paramount importance, yet its estimation is intricate. In order to accomplish the aforementioned objective, the following methodology was employed. The SAIH [12] was employed to download the recorded gauging data during the flood. These values are the official data of the Jucar Basin Authority (CHJ) and are calculated according to the hydrological procedure established by hydrologists of the organization. These measures were utilized as a means of comparative analysis. The system was utilized to measure the flow rate, which was then compared with the estimated cross-section of the water level at that site. This comparison was used to calculate the average velocity:
V = Q/S
where V = velocity (m s−1), Q = flow (m3 s−1), and S = cross-sectional area (m2).
In instances where direct gauging data were not available, the water velocity was estimated through comparison with the official control sites. This estimation process considered the geomorphological and slope characteristics of each section of the riverbed. In this case, the estimations in the Magro river were based on the average velocity data obtained at the Huerto Mulet gauging station (site 14), which is located downstream in the Jucar river. The application of this method at other points was justified by the continuity of the characteristics of the riverbed. Furthermore, the data from the gauging stations on the Turia river (sites 2 and 6) were utilized to estimate an average velocity applicable to other sections of this basin, which shares geomorphological characteristics with the Jucar basin. In the Poyo stream, the mean velocity data from the gauging on the A-3 motorway (site 18, Figure A1) was employed to estimate flows in other sections. However, it should be noted that this gauging does not capture the entire basin affected.
Finally, the flow was calculated at each of the points of interest, including those where direct gauging was not obtained. This calculation was based on the estimated cross section of the water level and the average velocity determined or estimated:
Q = V × S
where Q = flow (m3 s−1), V = velocity (m s−1), and S = cross-sectional area (m2).
To validate the procedure for calculating water velocity at control sites, flow rate calculation using Manning’s formula was also used [46]. To this end, field data of the maximum height of the water level, the measurements of the cross-section, and the values of the slope of the river section in which the measurement site is located were used. From this data, the parameters of the cross-sectional area, the hydraulic radius, and the slope were obtained. The hydraulic radius was calculated by measuring the wetted cross-sectional area and dividing by the wetted perimeter. The roughness was provided by bibliographic experimental values, from 0.17 in concrete clean beds to 0.30 and more in beds with obstacles, trees, rocks, vegetation, and so on [47].
Q = 1 n   A   R 2 / 3   S
where Q is the flow (m3 s−1), A is the cross-sectional area (m2), n is the roughness of the riverbed, R is the hydraulic radius (m), and S is the slope of the stream segment (m/km).
For the Poyo stream, at site 18, the water follows the surface of the riverbed and flows like a waterfall after crossing the weir. The estimation focused on calculating broad-crested weir flow rates using the equation of this type of hydrological construction [48]:
Q = C × L × H1.5
where Q is the discharge (m3 s−1), C is the coefficient of discharge, L is the length of the weir (m), and H is the upstream water level (m). Usually, C is 2.5 according to Bazin parameters.
The results obtained were plotted for validation against our empirical measured data and estimated data from applying the Manning Equation (3). Validation used the statistical correlation coefficient between the two measures, namely, the normalized root mean squared error (nRMSE) and mean absolute error (MAE):
n R M S E =   R M S E r a n g e   o b s e r v e d   d a t a
M A E = 1 n i = 1 n x i x
where RMSE = root mean squared error, n = the number of errors, and |xix| = absolute error. Values less than 15% were considered as low differences between the empirical measures and Manning calculations.
This process enabled a quantitative evaluation of the hydrological event, with the maximum flows at each location obtained and the total peak flow contributed by the storm determined.
To study the probability of the rainfall and flood event, the affected basins of the Turia river, Poyo ravine, and Magro river were considered, considering the general mathematical probability, based on the data of maximum average daily flows of the last eighty years collected by the hydraulic administration in its databases.
The measurements obtained in situ were subsequently employed to delineate the sections in accordance with the requisite dimensions, utilizing the AutoCAD 2023 software developed by Autodesk Inc. (San Rafael, CA, USA). Subsequently, the surface area (m2) of the wetted cross-section was determined through area integration, as illustrated in the figures (see the Supplementary Materials [44]). The numerical results obtained were subsequently organized into a tabular format using the Excel spreadsheet (Microsoft Inc., Redmond, WA, USA) to perform the section and flow calculations.

3. Results

The sampling points were located as follows: six in the Turia river basin, nine in the Jucar river basin, and ten in the Albufera basin. The precise locations of these points are described in Table 1 and illustrated in Figure 2. We indicate the sites included in the Official Network measurements in Table 1.
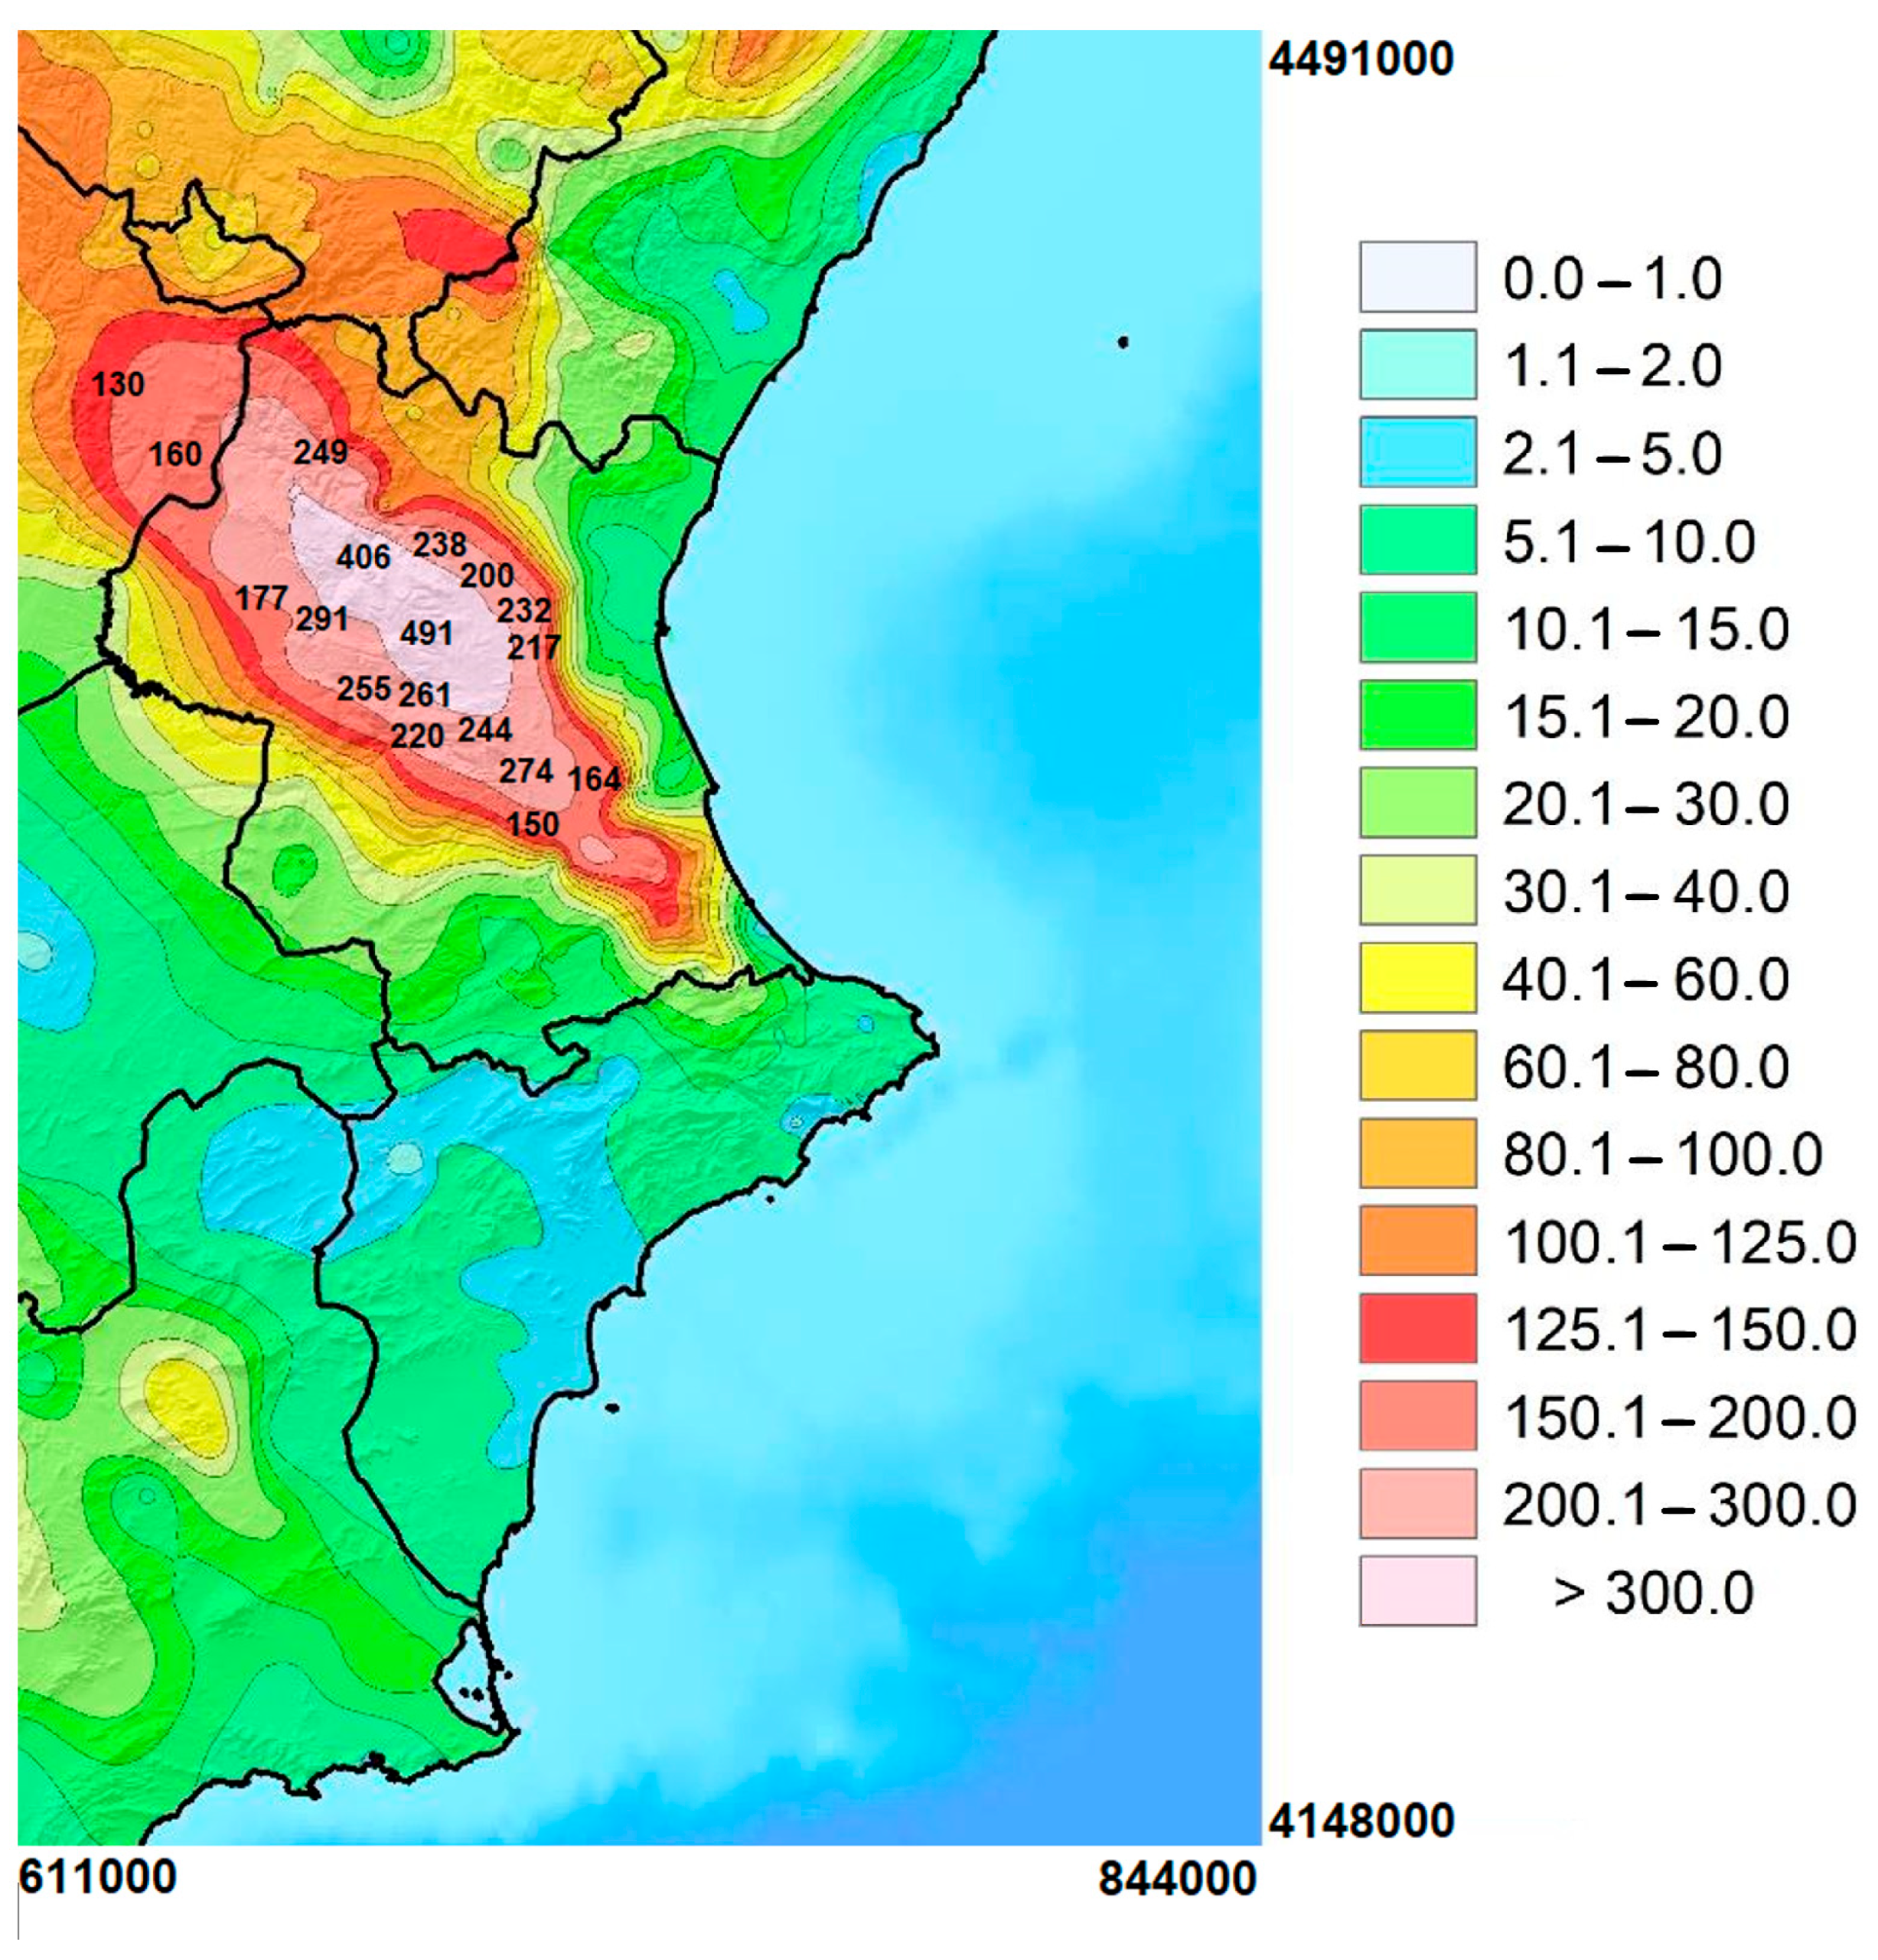
Precipitation measurements were recorded at numerous gauging stations, and the resulting numerical data were previously documented in a published article [49]. However, the distribution map is presented in Figure A3, which highlights the maximum recorded precipitation amounts over 24 h, with 491 mm in the Poyo stream basin, 406 mm in the Turia river basin, and 291 mm in the Magro river basin. Nonetheless, the majority of the precipitation was concentrated within a span of approximately 12 h, specifically between 10 a.m. and 10 p.m. on 29 October 2024.
Rainfall measurements are influenced by storm wind speeds. Gusts measured between 30 and 60 km/h alter the measurement conditions of the rain gauge. In these cases, rainfall measurements are considered to be underestimated by between 10% and 15%, meaning that the amounts collected would be greater than those indicated.
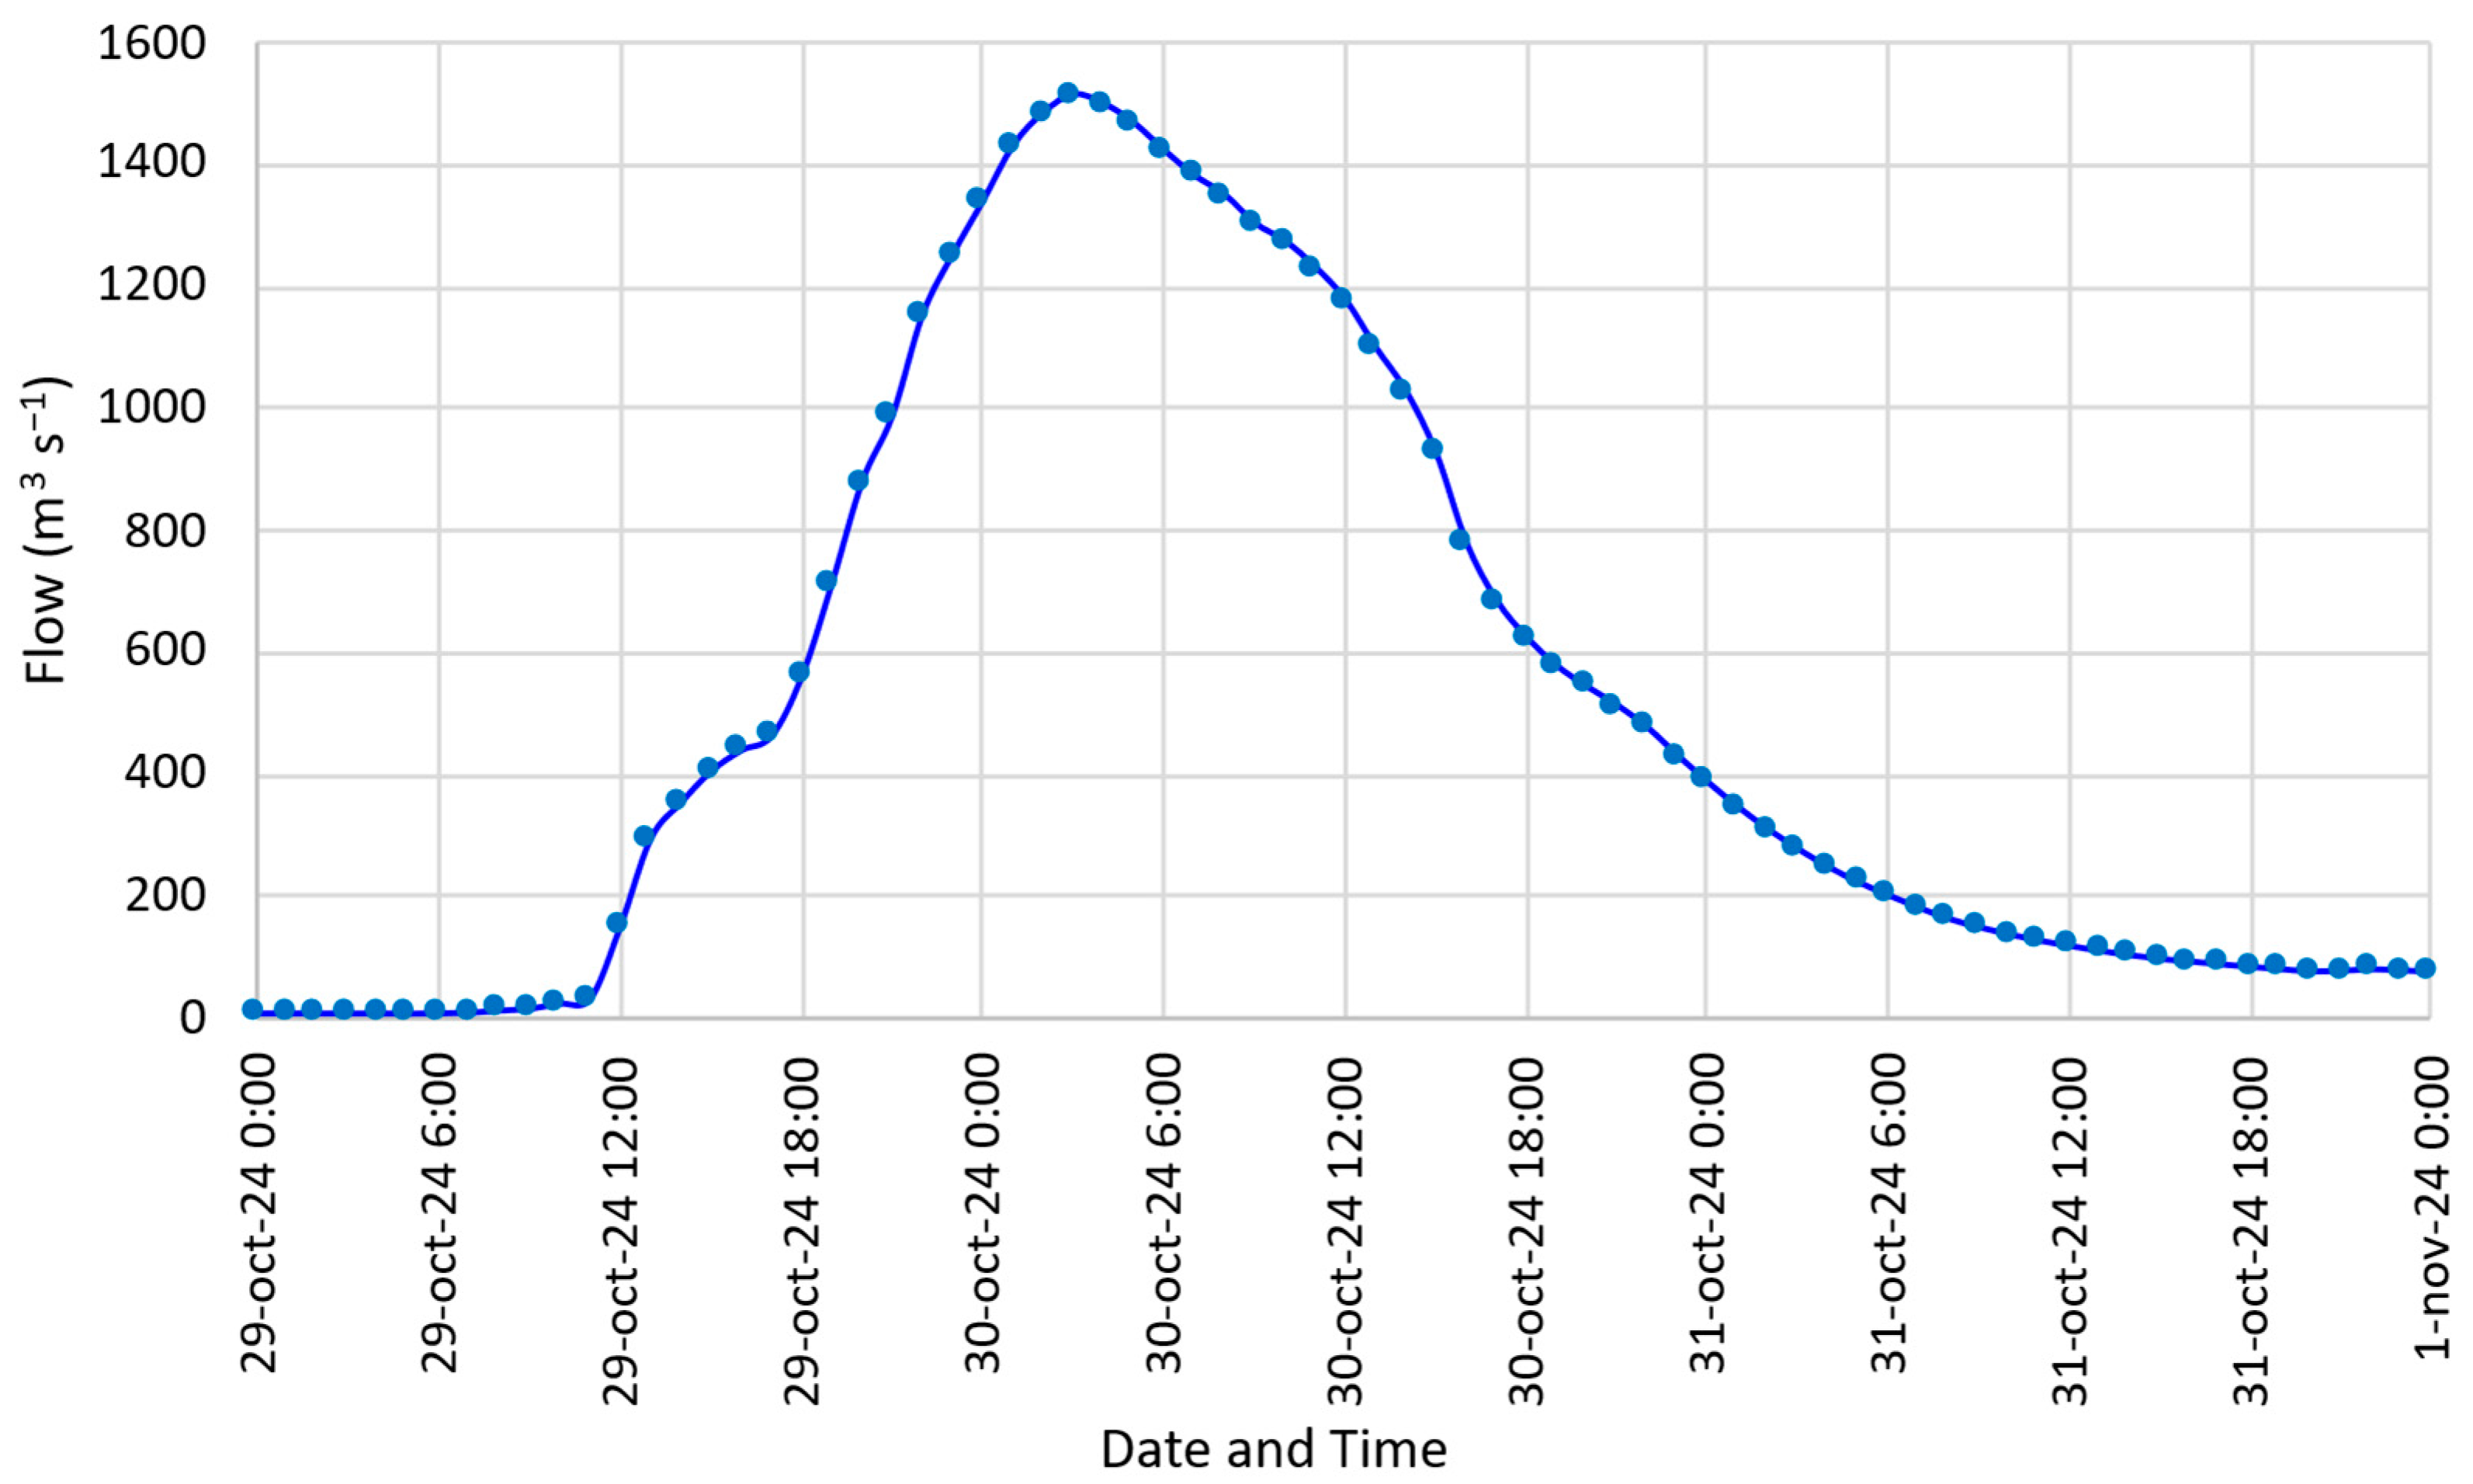
In the context of the study, the velocity of the water was evaluated using verifiable information obtained from the Huerto Mulet Official Measuring Gauge Station (site 14), which is located on the Jucar river downstream of the Forata reservoir (site 7). The SAIH at this station maintained its functionality, facilitating the acquisition of comprehensive flood data (see Figure 4). The flood had a substantial impact on the surrounding measuring infrastructures, resulting in the destruction of numerous measuring points (sites 2, 4, 7, 9, 18, and 22). Consequently, the data available at the onset of the episode on the upstream section is the only reliable source of information.
At this site, the water level reached a height of 11.81 m. The flow peak was 1500 cubic meters per second, and the wetted cross-sectional area was measured as 603 square meters (see Figure 5). Therefore, the mean water velocity in Huerto Mulet was estimated at 2.5 m per second, as calculated by applying Equation (1).
The calculation by Manning’s formula (Equation (3)) requires knowing the slope of the river section (1.2 m/km) and the roughness of the channel (0.18%) since it is regular silt without obstacles and concrete side walls. The calculation of the hydraulic radius was performed using the measured dimensions of the section, which resulted in 7.83 m. Applying the parameters to this site, the result obtained was a velocity of 2.40 m s−1, so the flow measured by this system resulted in 1448 m3 s−1 which is 4% lower than that estimated by the empirical method previously.
The implementation of the average velocity, as calculated by Equation (2), on analogous sites examined within the same basin yielded an estimated flow of 4198 cubic meters per second (m3 s−1) through the Magro River within the municipality of Carlet (site 10). This substantial flow had a considerable impact on the bridge within the town, resulting in significant damage. A study was conducted downstream of Carlet, within the municipality of Algemesí, to ascertain the volume of water passing through the riverbed in question. The study determined that the section of the riverbed in question (site 11) only permitted the flow of 608 m3 s−1. The estimated flow in Carlet surpassed the capacity of the riverbed at the municipality’s exit, leading to flooding in Algemesí and its surrounding areas. The volume of water that overflowed and caused the flooding in Algemesí was calculated to be 3590 m3 s−1. This calculation was based on an estimated 4198 m3 s−1 passing through Carlet, with a deduction of 608 m3 s−1 of the channel capacity in Algemesí. The results of the study are presented in Table 2. The Supplementary Materials Section at the end of manuscript presents links to short videos that show some views of the waters at sites 10 and 11.
It is noteworthy that the Jucar river did not inundate the Alzira area, with a flow at site 13 of nearly 2000 m3 s−1, even though the county is historically prone to flooding from the Jucar river. However, on this occasion, the Jucar did not flood the city because the waters of the Magro reached the Jucar downstream of the town. The flow capacity through the river at Poliñá del Jucar (site 14) was 1500 m3 s−1, which resulted in a total flow of just over 6000 m3 s−1. Subsequently, the water overflowed into the Albufera on the left bank and into the Cullera rice paddy marsh on the right bank (see Figure 1, which shows a view obtained by the Landsat-8 satellite on 30 October).
Within the Turia river, a watercourse characterized by its similarity in slope and geomorphological characteristics to the Jucar, but with the riverbed more modified, two measurement sites were identified. The data obtained from these sites enabled the estimation of the water velocity to be 2.2 m per second when applying Equation (1). At Repartiment (site 6), a flow rate of 1974 m3 s−1 was observed. This flow was able to pass through this section of the river to the sea with ease, as it was modified and designed to allow a maximum flow of 5000 m3 s−1. The results pertaining to the Turia river are presented in Table 3.
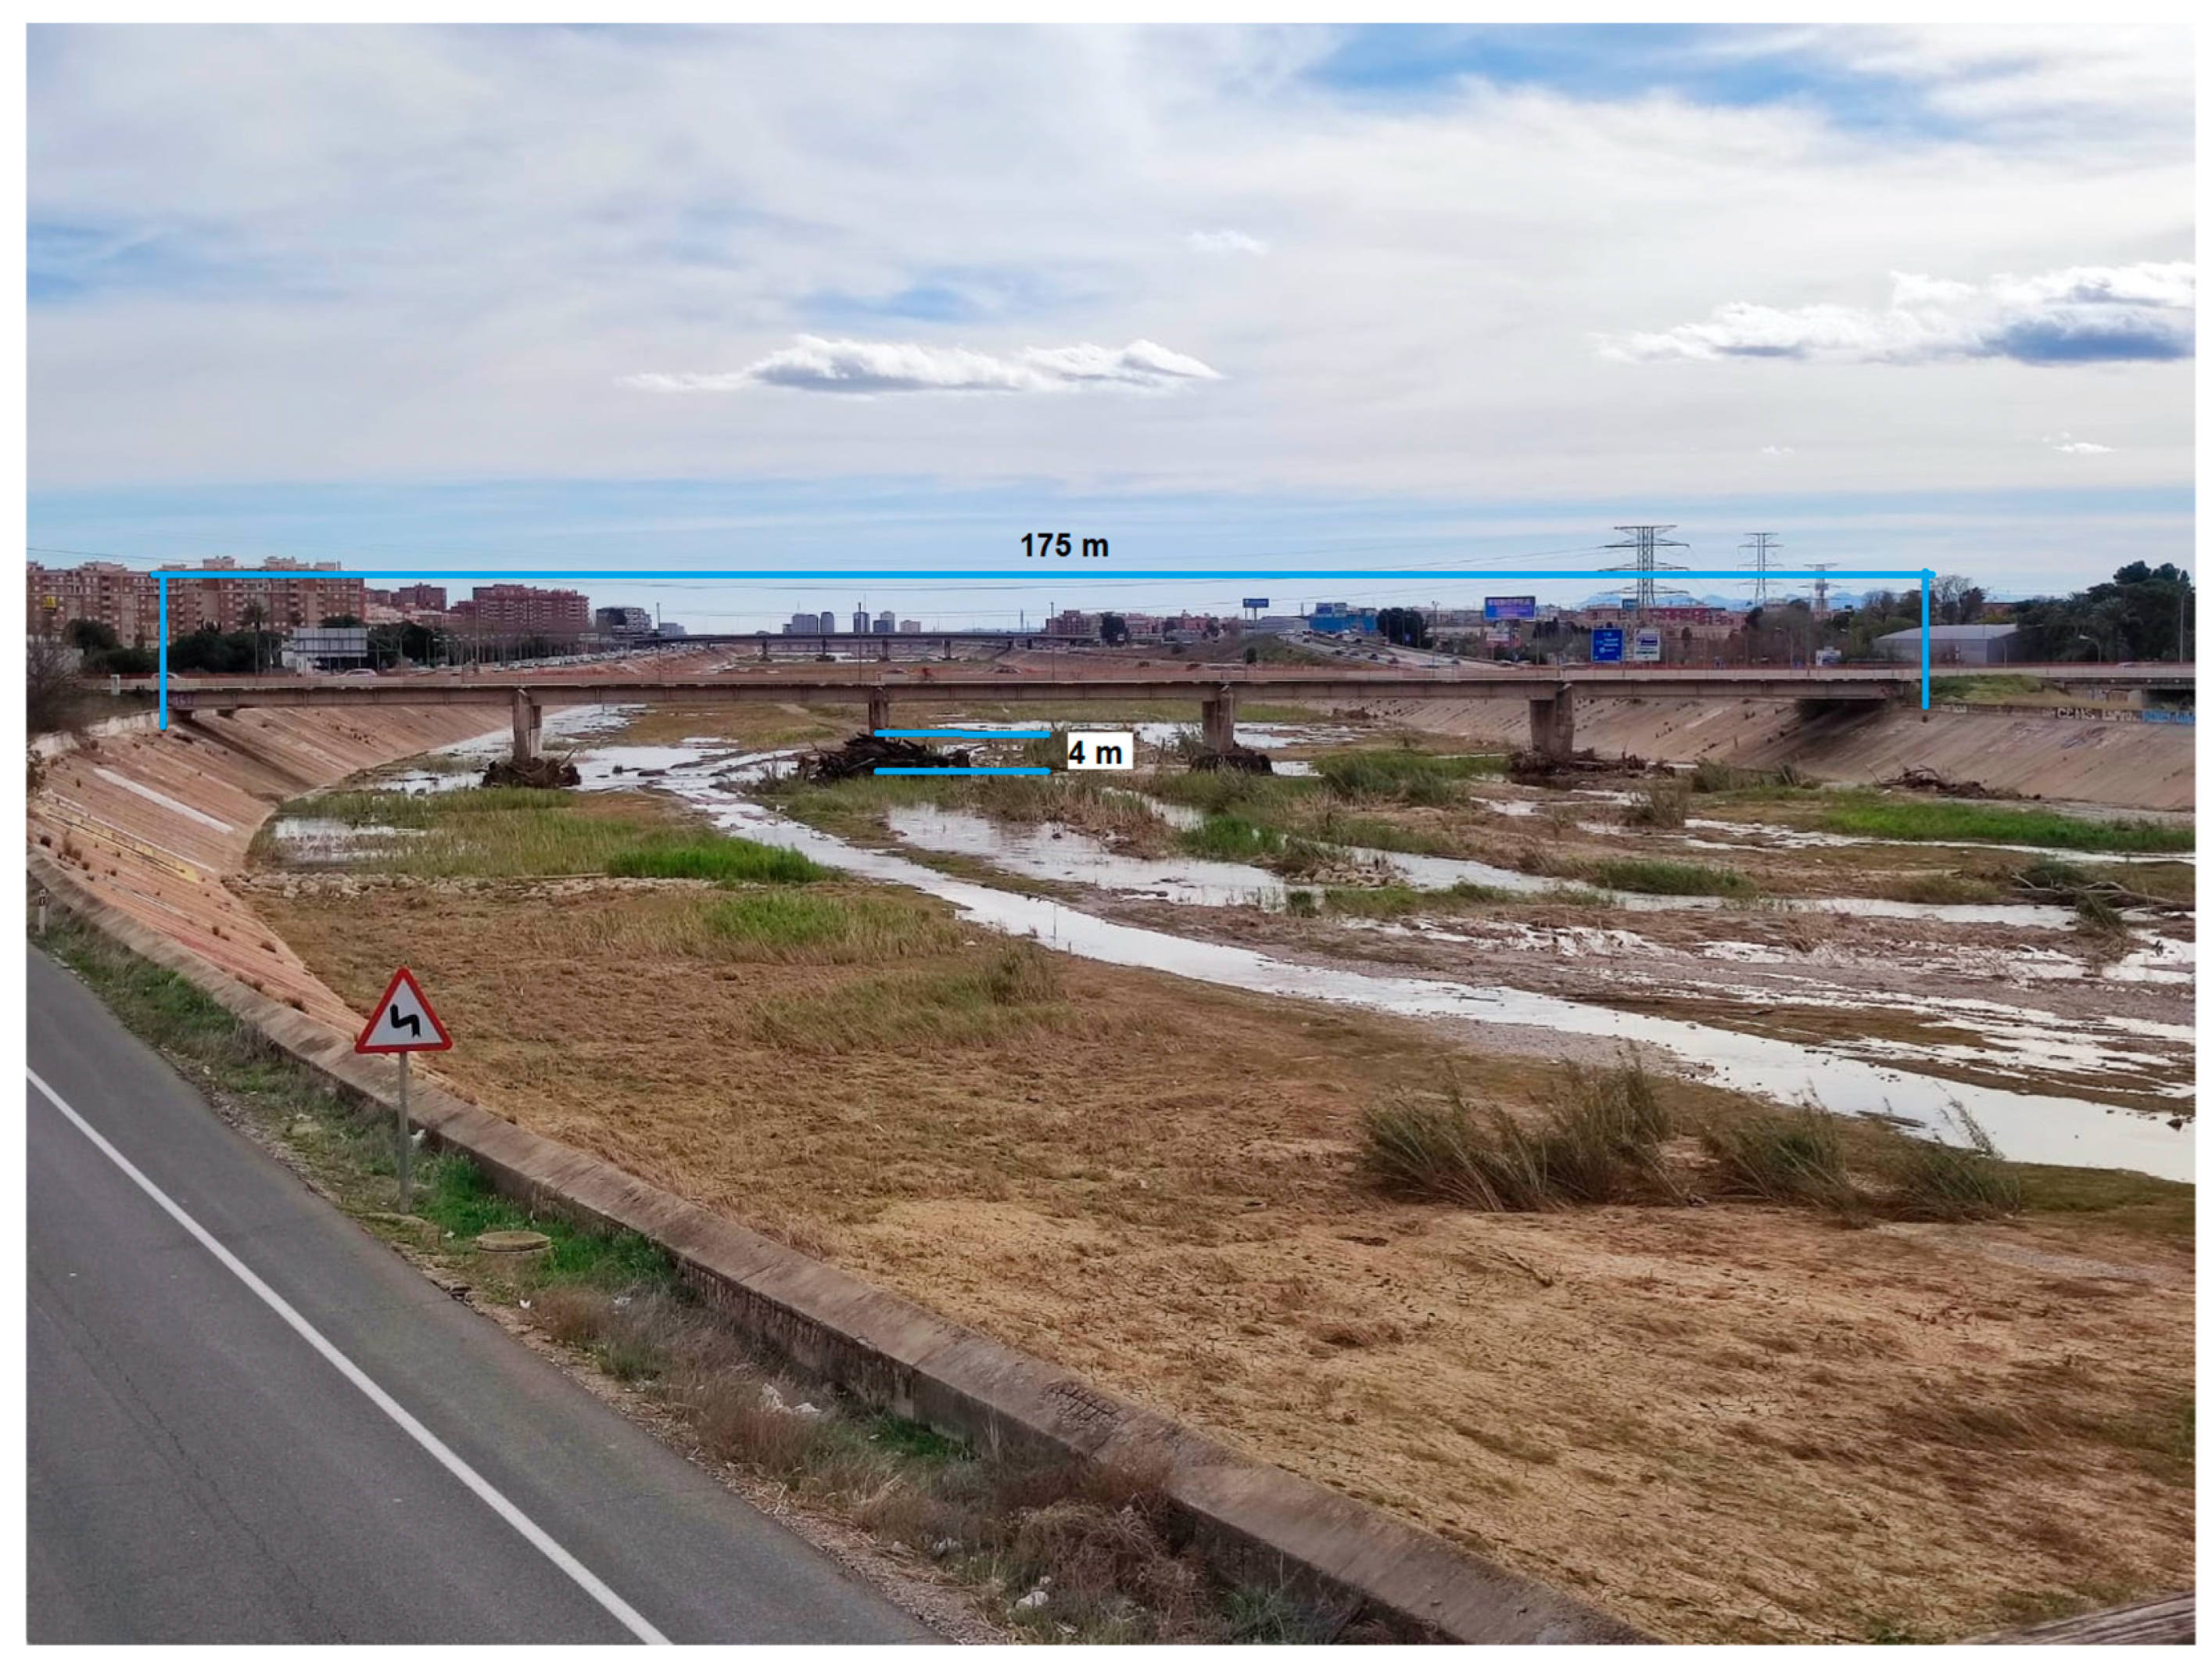
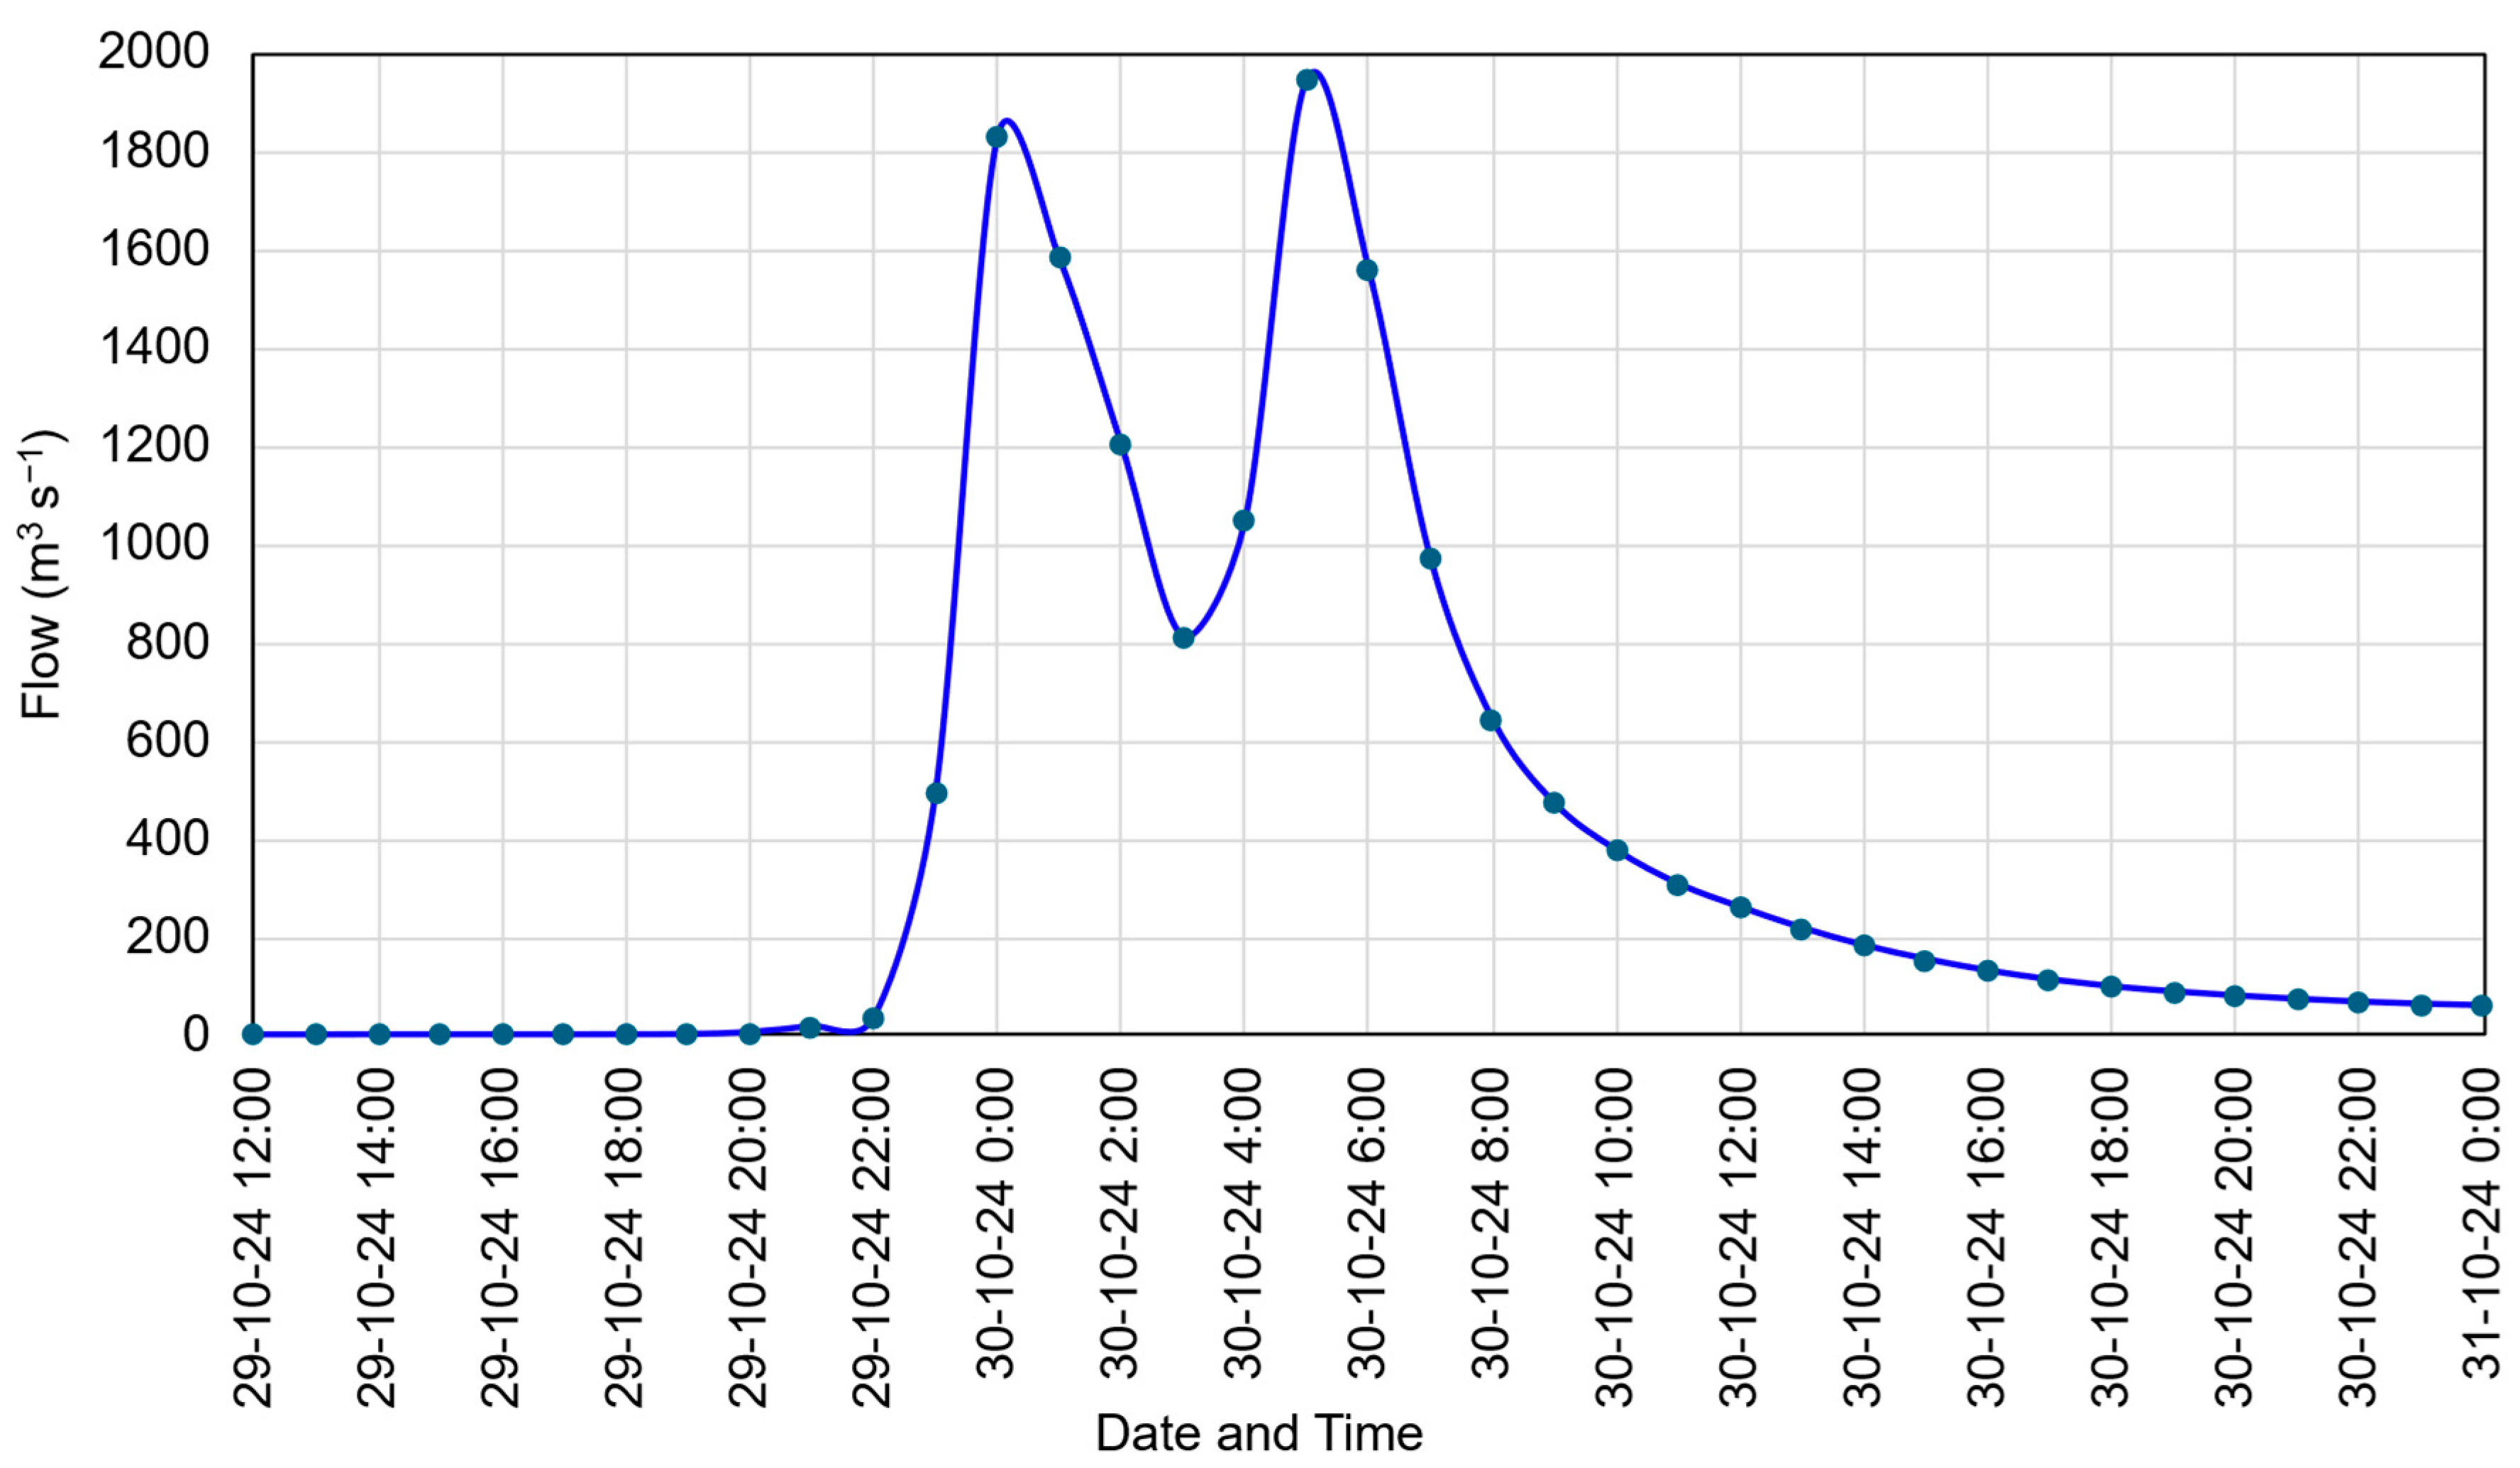
The records obtained from site 6 indicate two peaks of flow with a delay of five hours during the flood. The temporal alignment of these events was meticulously observed in the time series of data collected by the SAIH, as evidenced by Figure 6. A comprehensive visual representation of site 6 is provided in Figure A4.
With regard to the Poyo stream, the only measurement site that is currently available is located at the intersection with the Madrid A-3 motorway (site 18). This specific measurement is designed to represent water originating from Cheste; nevertheless, it excludes water from the southern mountains, which experienced the most substantial precipitation during the event in question. Consequently, the measurement from this gauge was only representative of half the area of the basin. However, the registered data set, which included 2280 m3 s−1, was considered in the analysis. This data set enabled the calculation of an average velocity of 3.5 m s−1, as calculated using Equation (1). This mean water velocity is considered unusual due to the constructed layout of the site as a broad-crested weir. For this site, we applied the equation of the weir (Equation (4)), and the result for a water level of 5.5 m was 3225 m3 s−1, which was more than the registered value because the measuring system was damaged by the flood at about a 4.5 m water level. The velocity of 2.5 m s−1 was applied to the remaining sections of the stream, specifically at the site where the Poyo stream confluents the Horteta stream (site 21). A flow rate of 5678 m3 s−1 was estimated at this location. This estimated flow far exceeded the transport capacity of the Poyo stream itself downstream of Torrent, where the section of the riverbed could only accommodate approximately 800 m3 s−1 at the height of Paiporta. Therefore, in the tabulation of the results, the flows were estimated considering a probable velocity of 2.5 m per second, as illustrated in Table 4.
The Torrent measurement point (site 21) has been observed to accumulate flows that pass through sites 18, 19, and 20. Nevertheless, it is imperative to acknowledge that point 21 encompasses minor tributaries that were not assessed in the present study. The ephemeral streams of Canaleja, Sechara, and Pelos have the capacity to contribute to the flow reaching the estimated total at site 21.
It is evident that the flood’s extensive and devastating impact on the area between Torrent and the Albufera can be attributed to the fact that a maximum of 5678 to 6250 m3 s−1 of water could have passed through Poyo stream by Torrent, and that only approximately 700 m3 s−1 could have passed through Massanassa (site 22), where water had already overflowed by 1 m as the lateral walls were raised.
Furthermore, contributions from the Picassent stream (site 24) and Tramusser (site 25), which are minor streams that flow into the Albufera Lagoon, also reached the Albufera, with their flow spreading over the western area of the rice fields in the first case and the southwestern area in the second case. As shown in Figure 1, the waters of Tramusser stream display a more pronounced orange coloration in comparison with those located to the east, which are characterized by the overflow of the Jucar and Magro rivers.
Finally, the Pozalet stream (site 23), also known as the Saleta stream in the town of Aldaia, merits mention. The channel under consideration is in proximity to the Poyo stream, situated to the north of it, and shares a parallel route, though it possesses an independent basin. The riverbed’s initial course became hidden within the orchards that were established between Xirivella and Picanya, and its paleochannel ultimately terminated at the Turia river. However, the construction of the diversion of the New Turia riverbed has resulted in the detention of its waters by this infrastructure, with the stream only spilling over into the river when the water level exceeds the lateral retaining walls of the Turia river. This has resulted in the formation of a damming area upstream and a flood on the right bank of the new Turia riverbed. Approximately 10 m3 s−1 of the flow is diverted through a channel to the Poyo stream before reaching the town of Aldaia. The consequence of this was that the calculated flow of approximately 455 m3 s−1 overflowed in several locations around the A-3 motorway where the “Bonaire” shopping center is located. This flow circulated towards the town. A part of it was diverted towards the Poyo stream, and most of it was directed towards the town following its channelling through a 15 m-wide channel, which could barely accommodate 60 m3 s−1. This caused significant damage to the houses near the riverbed. As a result, the waters advanced towards the newly formed Turia riverbed, where they converged with the flooding caused by the Poyo stream. This combination led to substantial inundation of the surrounding fields and urban areas.
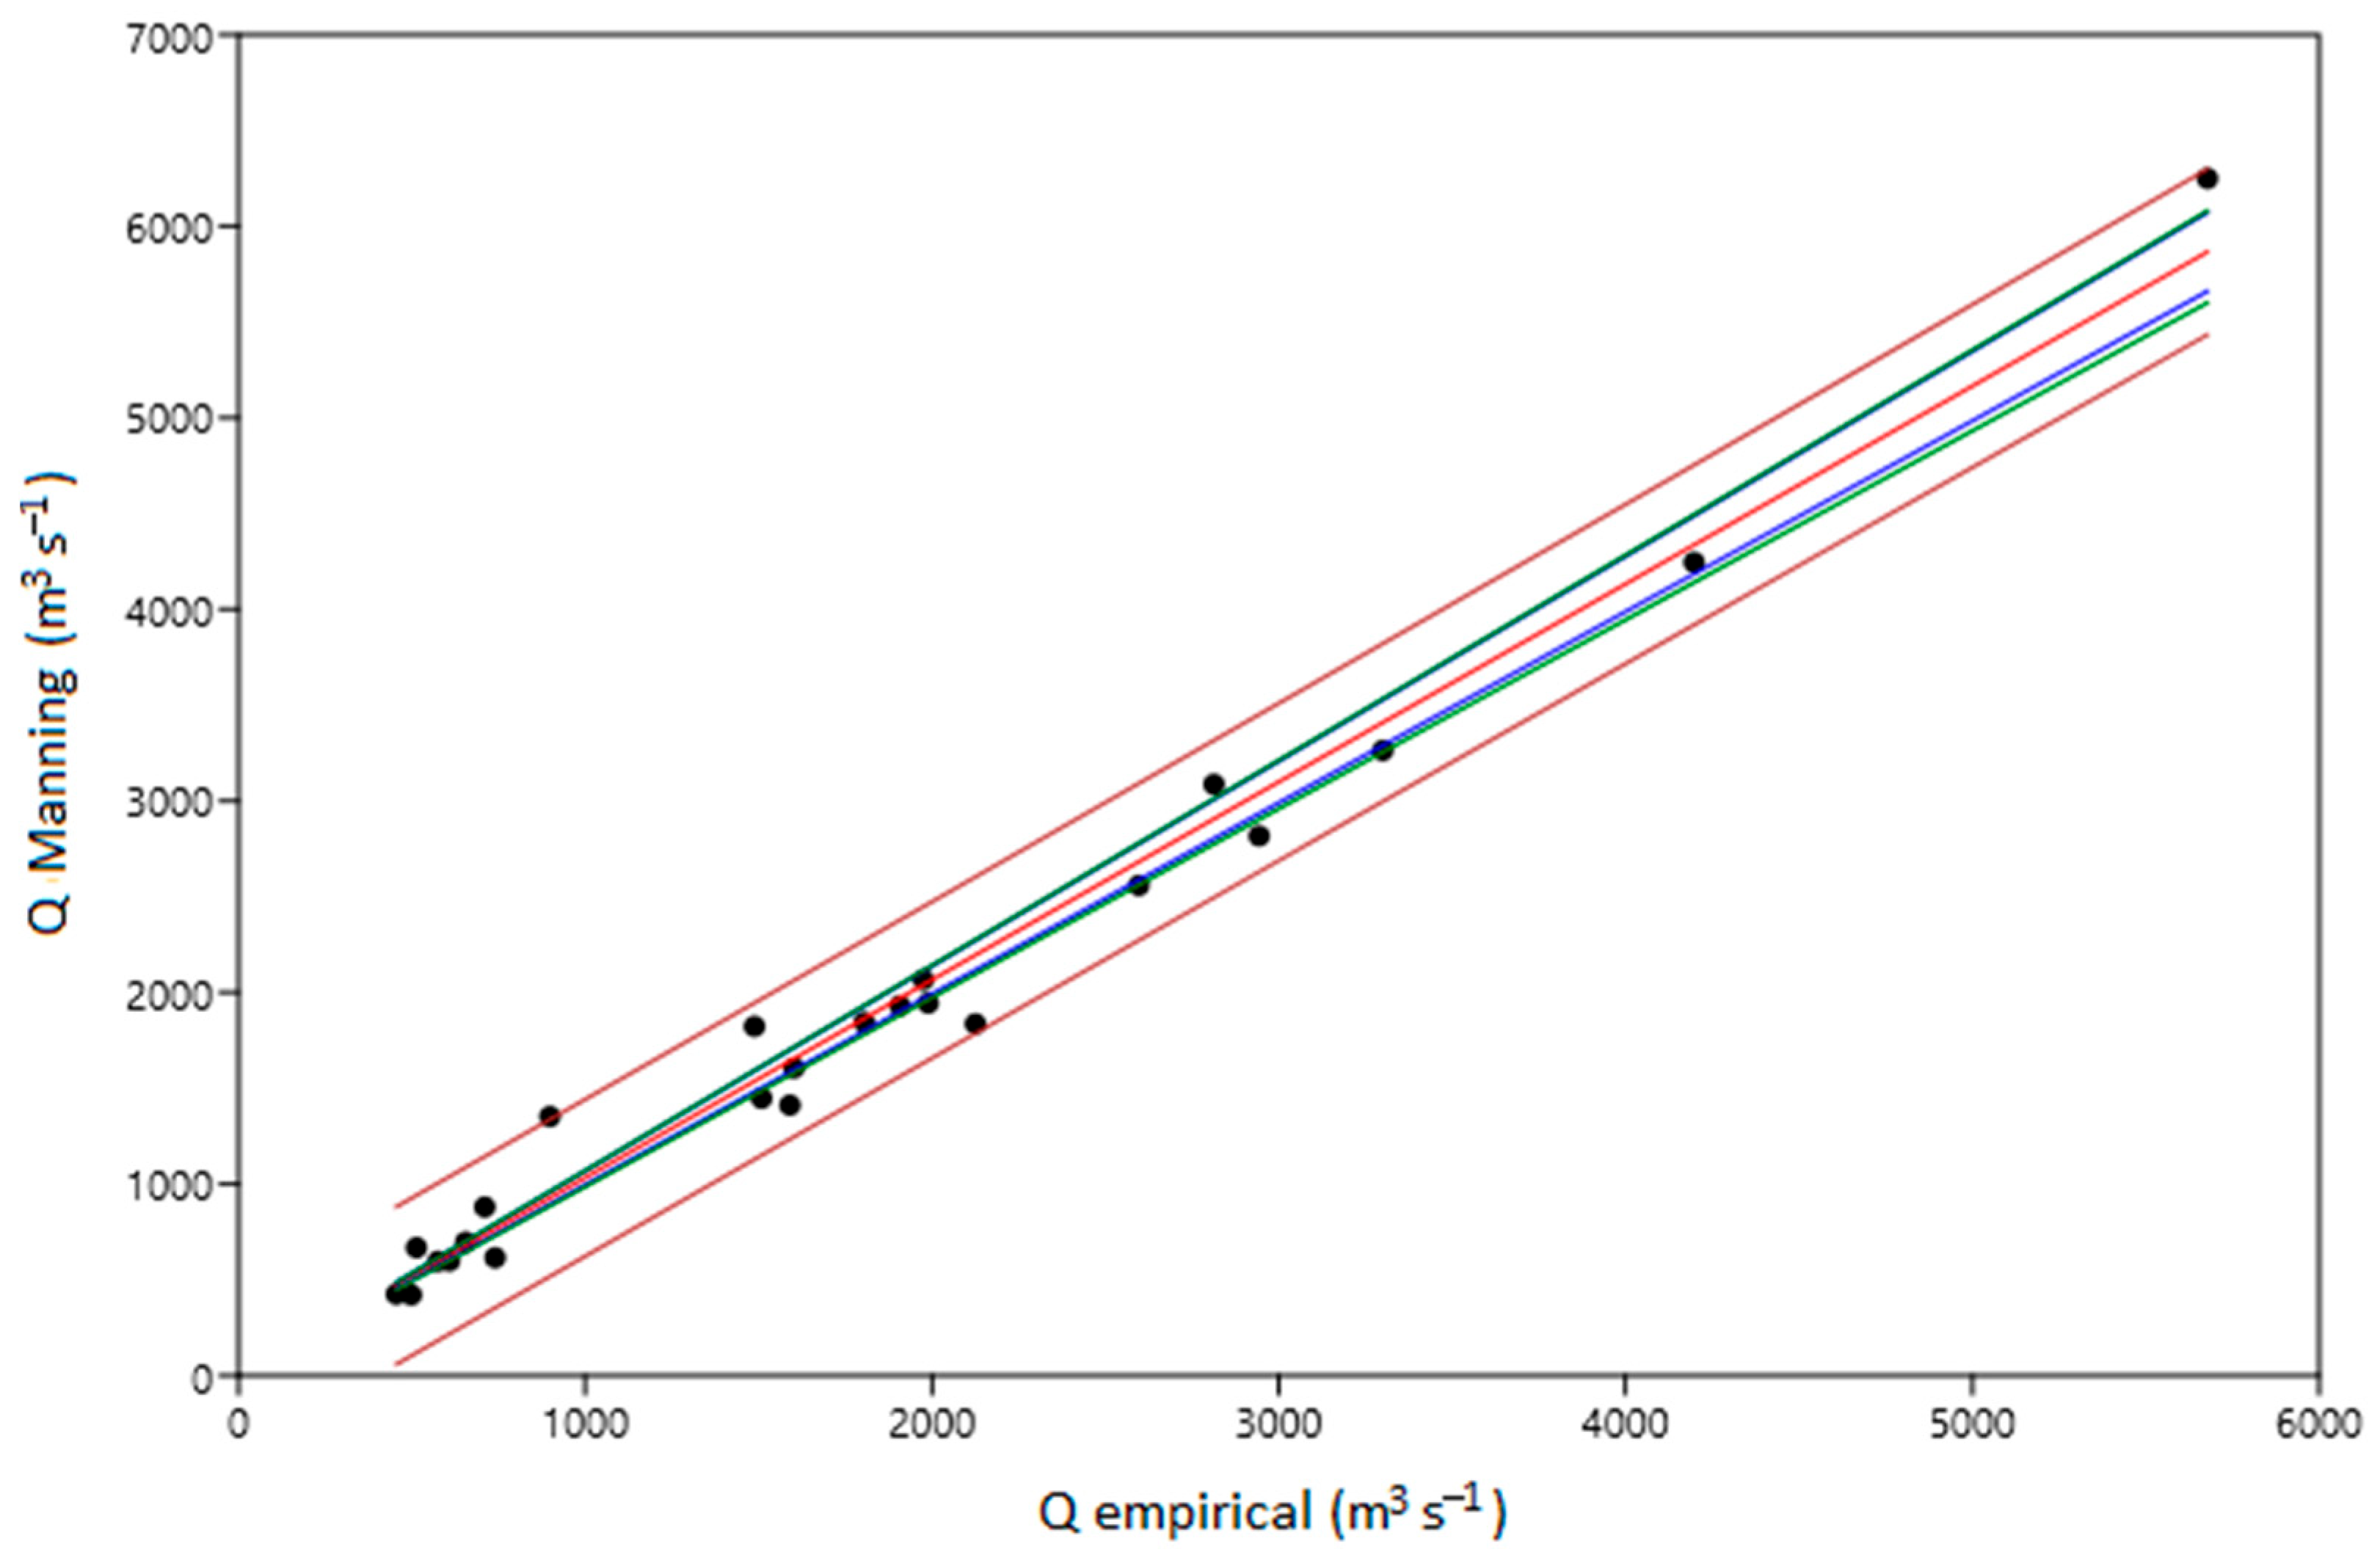
To validate the procedure of calculation by the empirical method, we calculated the determination coefficient from the analysis of measured discharge in control sites against the estimated value by applying the Manning equation (Figure 7). We obtained a coefficient of 0.9905 for the 24 sites measured, with a p-value < 0.001. Site 18 was excluded because we used the weir equation for the estimation, not the Manning equation.
To demonstrate the validity of this methodology, we calculated nRMSE and nMAE between the two data sets, obtaining values of nRMSE = 3.62% and nMAE = 2.26%, which indicate small differences that fall within the usual intervals of hydrological measurement estimates. In fact, the graphical representation (Figure 7) shows how all measurement values are within the 95% confidence forecast interval.
It is noteworthy that the residents of the affected areas reported that the initial overflow occurred around 7 p.m. in the Poyo and Jucar basins, as depicted in Figure 4. This is consistent with the subsequent dissipation of the floodwaters, which occurred at around 3 a.m. on 30 October. This led to an accumulation of approximately 8 h of flooding in the streets of the towns, resulting in a layer of fine sediment with variable thickness. The sediment exhibited a clayey nature, which significantly complicated its removal due to its plasticity and adhesion properties. In the Turia basin, the flood’s ascent is documented at site 6 at approximately 10:00 p.m. However, no towns were inundated, except some houses near the riverbed for site 1.
To calculate the total contributions, it is necessary to consider the quantities for each basin. Regarding the Turia river, the 1974 m3 s−1 measurement obtained at Quart de Poblet (site 5) is considered. With respect to the Albufera basin, the 5678 m3 s−1 measurement recorded in Torrent in the Poyo stream (site 21) is considered. The following measurements were recorded in other various streams not confluent with the aforementioned: 455 m3 s−1 in Ribarroja on the Pozalet (site 23), 740 m3 s−1 in Beniparrell on the Picassent stream (site 24), 498 m3 s−1 in Almussafes (site 25) on the Tramusser, 4198 m3 s−1 in Carlet on the Magro river (site 11), and 1975 m3 s−1 in Alzira on the Jucar river (site 13). The total flow value was 15,518 m3 s−1, which could appear to be a rather excessive figure. However, an estimation of the volume of water that inundated the rice fields, the Albufera lagoon, and the adjacent areas to the south of the Jucar riverbed reveals a total volume of water of approximately 223 hm3. This figure aligns with the extent of the observed flooding and the levels that were recorded on 30 October 2024 in many places, including the rice fields and Albufera lagoon.
The Turia and Jucar rivers, which collectively contributed approximately 3654 m3 s−1 of water to the Mediterranean Sea, exemplify the substantial volume of water that is transported by these rivers. The coloration of the water due to suspended materials and the accumulation of floating vegetation on coastal beaches can be observed in Figure 1. After the initial inundation, the excess water from the Albufera lagoon and rice fields was discharged into the sea during a week [49].
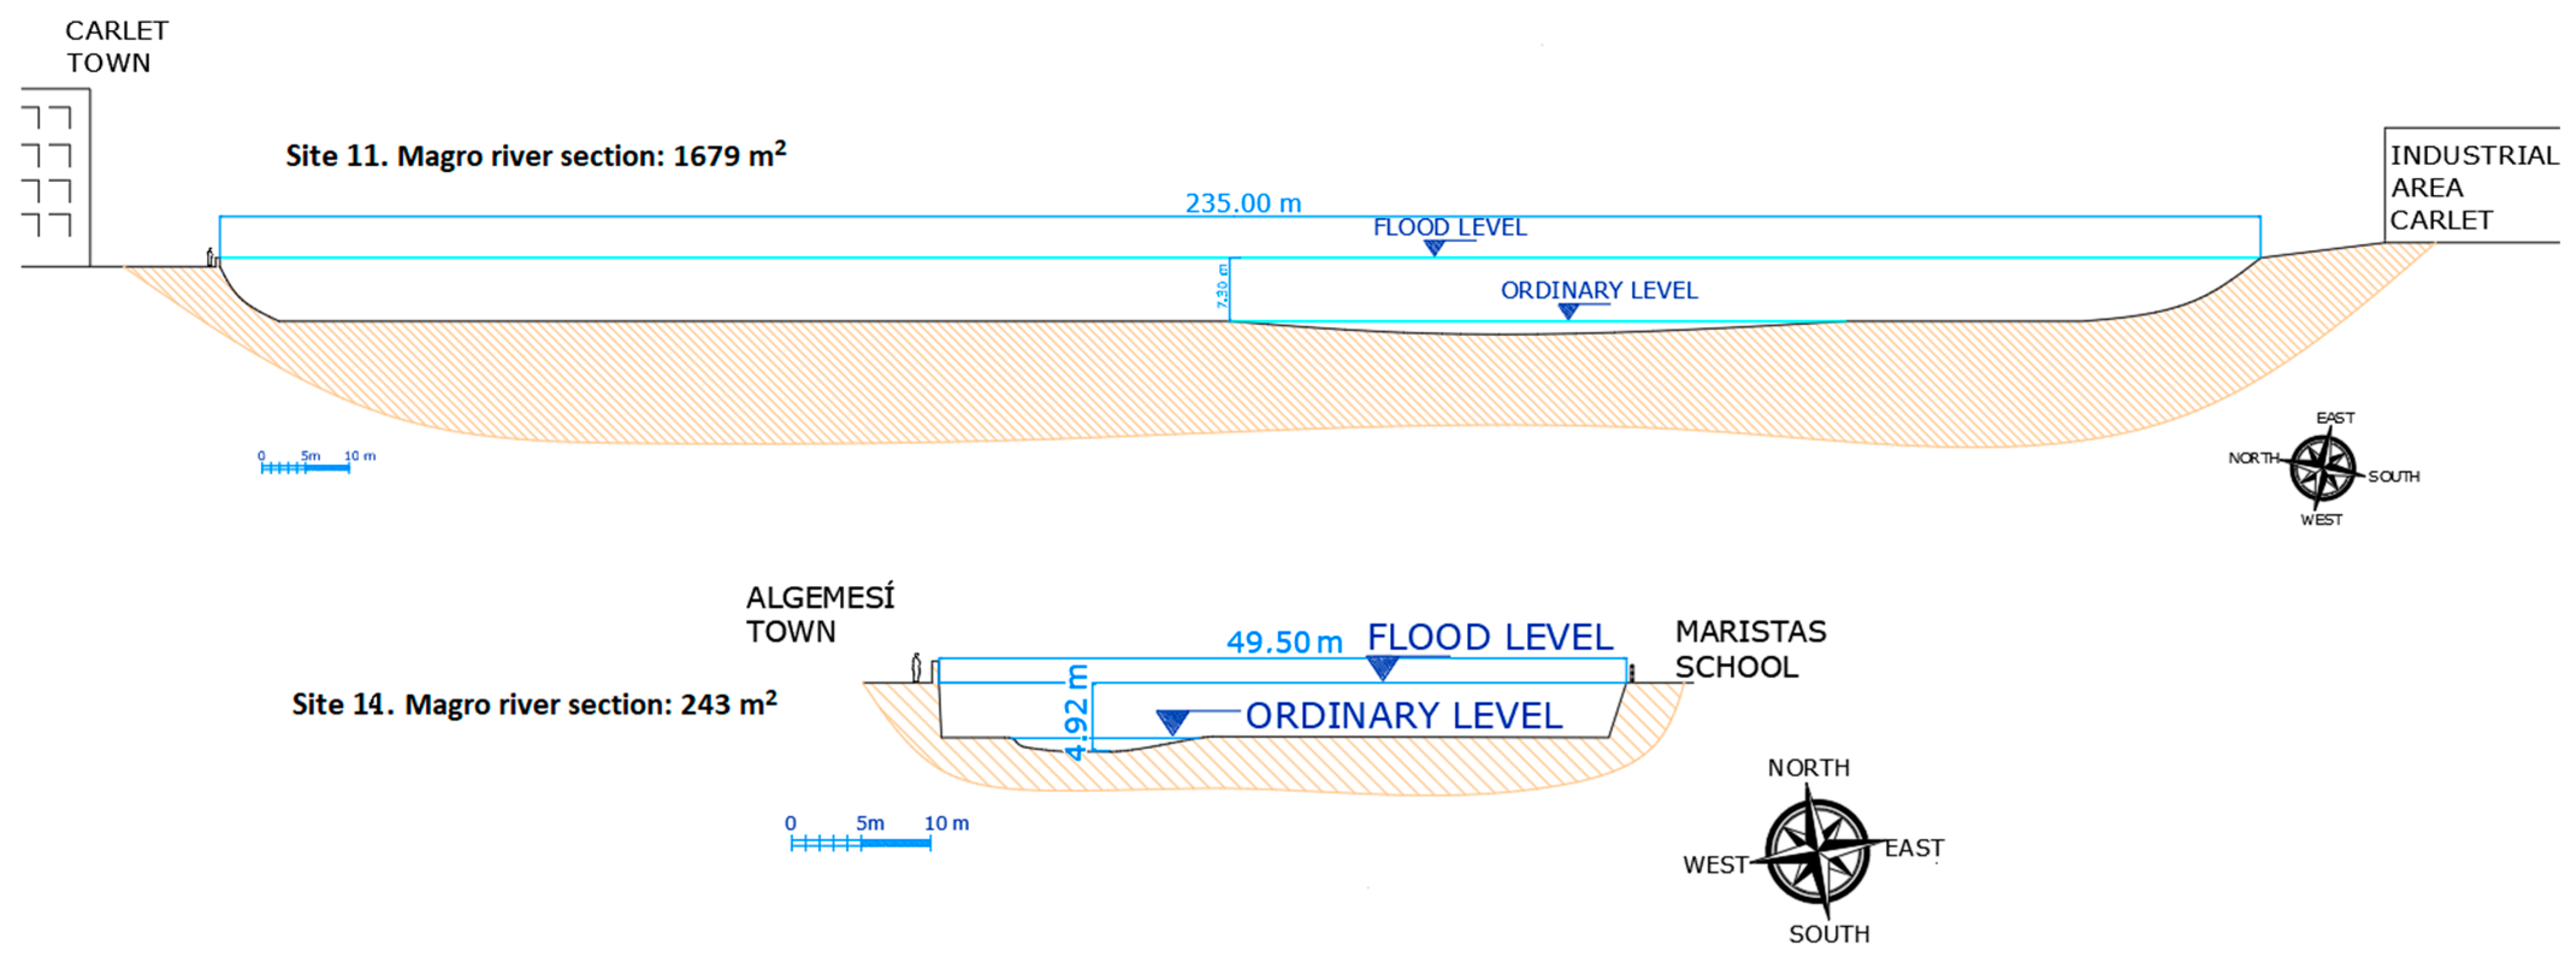
A thorough examination of the circulating flows revealed the “bottlenecks” in the hydrological drainage network, which manifested as examples where the downstream section of a channel was smaller in size than the upstream section. The obstruction of the flow of water downstream precipitates an accumulation in the upstream territory, an increase in the level of the channel, and an eventual overflow when the maximum level of the cross-section is attained. In the Turia river, no point has been observed from Pedralba (site 1) to the sea where this narrowing occurs; the design of the new Turia riverbed allows for passage at a maximum flow of up to 5000 m3 s−1. Consequently, as this flow was not reached, the water circulated along its designated course without exiting its fluvial terraces of maximum flooding. However, this phenomenon does not occur in the Jucar river and its tributary, the Magro. A study of the Magro river, up to Carlet (site 10), revealed that its section permitted the flow of 4198 m3 s−1 without incident in the city. However, from this point onward, the riverbed undergoes a gradual narrowing over 10 km of distance, which finally reduces its capacity to approximately 600 m3 s−1 within the channelled section of Algemesí (site 11). Wetted cross-sections of these sites are presented in Figure 8, with 1679 m2 being the first one and only 243 m2 being the second one. As demonstrated in Figure 9, the overflows on the left bank are apparent (mark 1), with most of the flow traversing the fields and proceeding towards the rice fields of Sueca and the Albufera of Valencia and just in the town of Algemesí (mark 2) flooding the streets and houses.
A comparable phenomenon was observed in the Jucar river. The Benimodo stream transported 575 m3 s−1 and its riverbed disappeared before the Jucar riverbed; then, the water flooded the area (Figure 9, mark 3). After the confluence of Jucar with its tributary, the Magro, the transport capacity of the river was such that it was unable to transport 1000 m3 s−1 without overflowing. Consequently, overflows were observed on both the left bank, directed towards the Sueca rice fields and the Albufera lagoon (mark 5), and on the right bank (mark 4 and 6), extending towards the rice fields of Cullera situated to the south, an area that also experienced inundation.
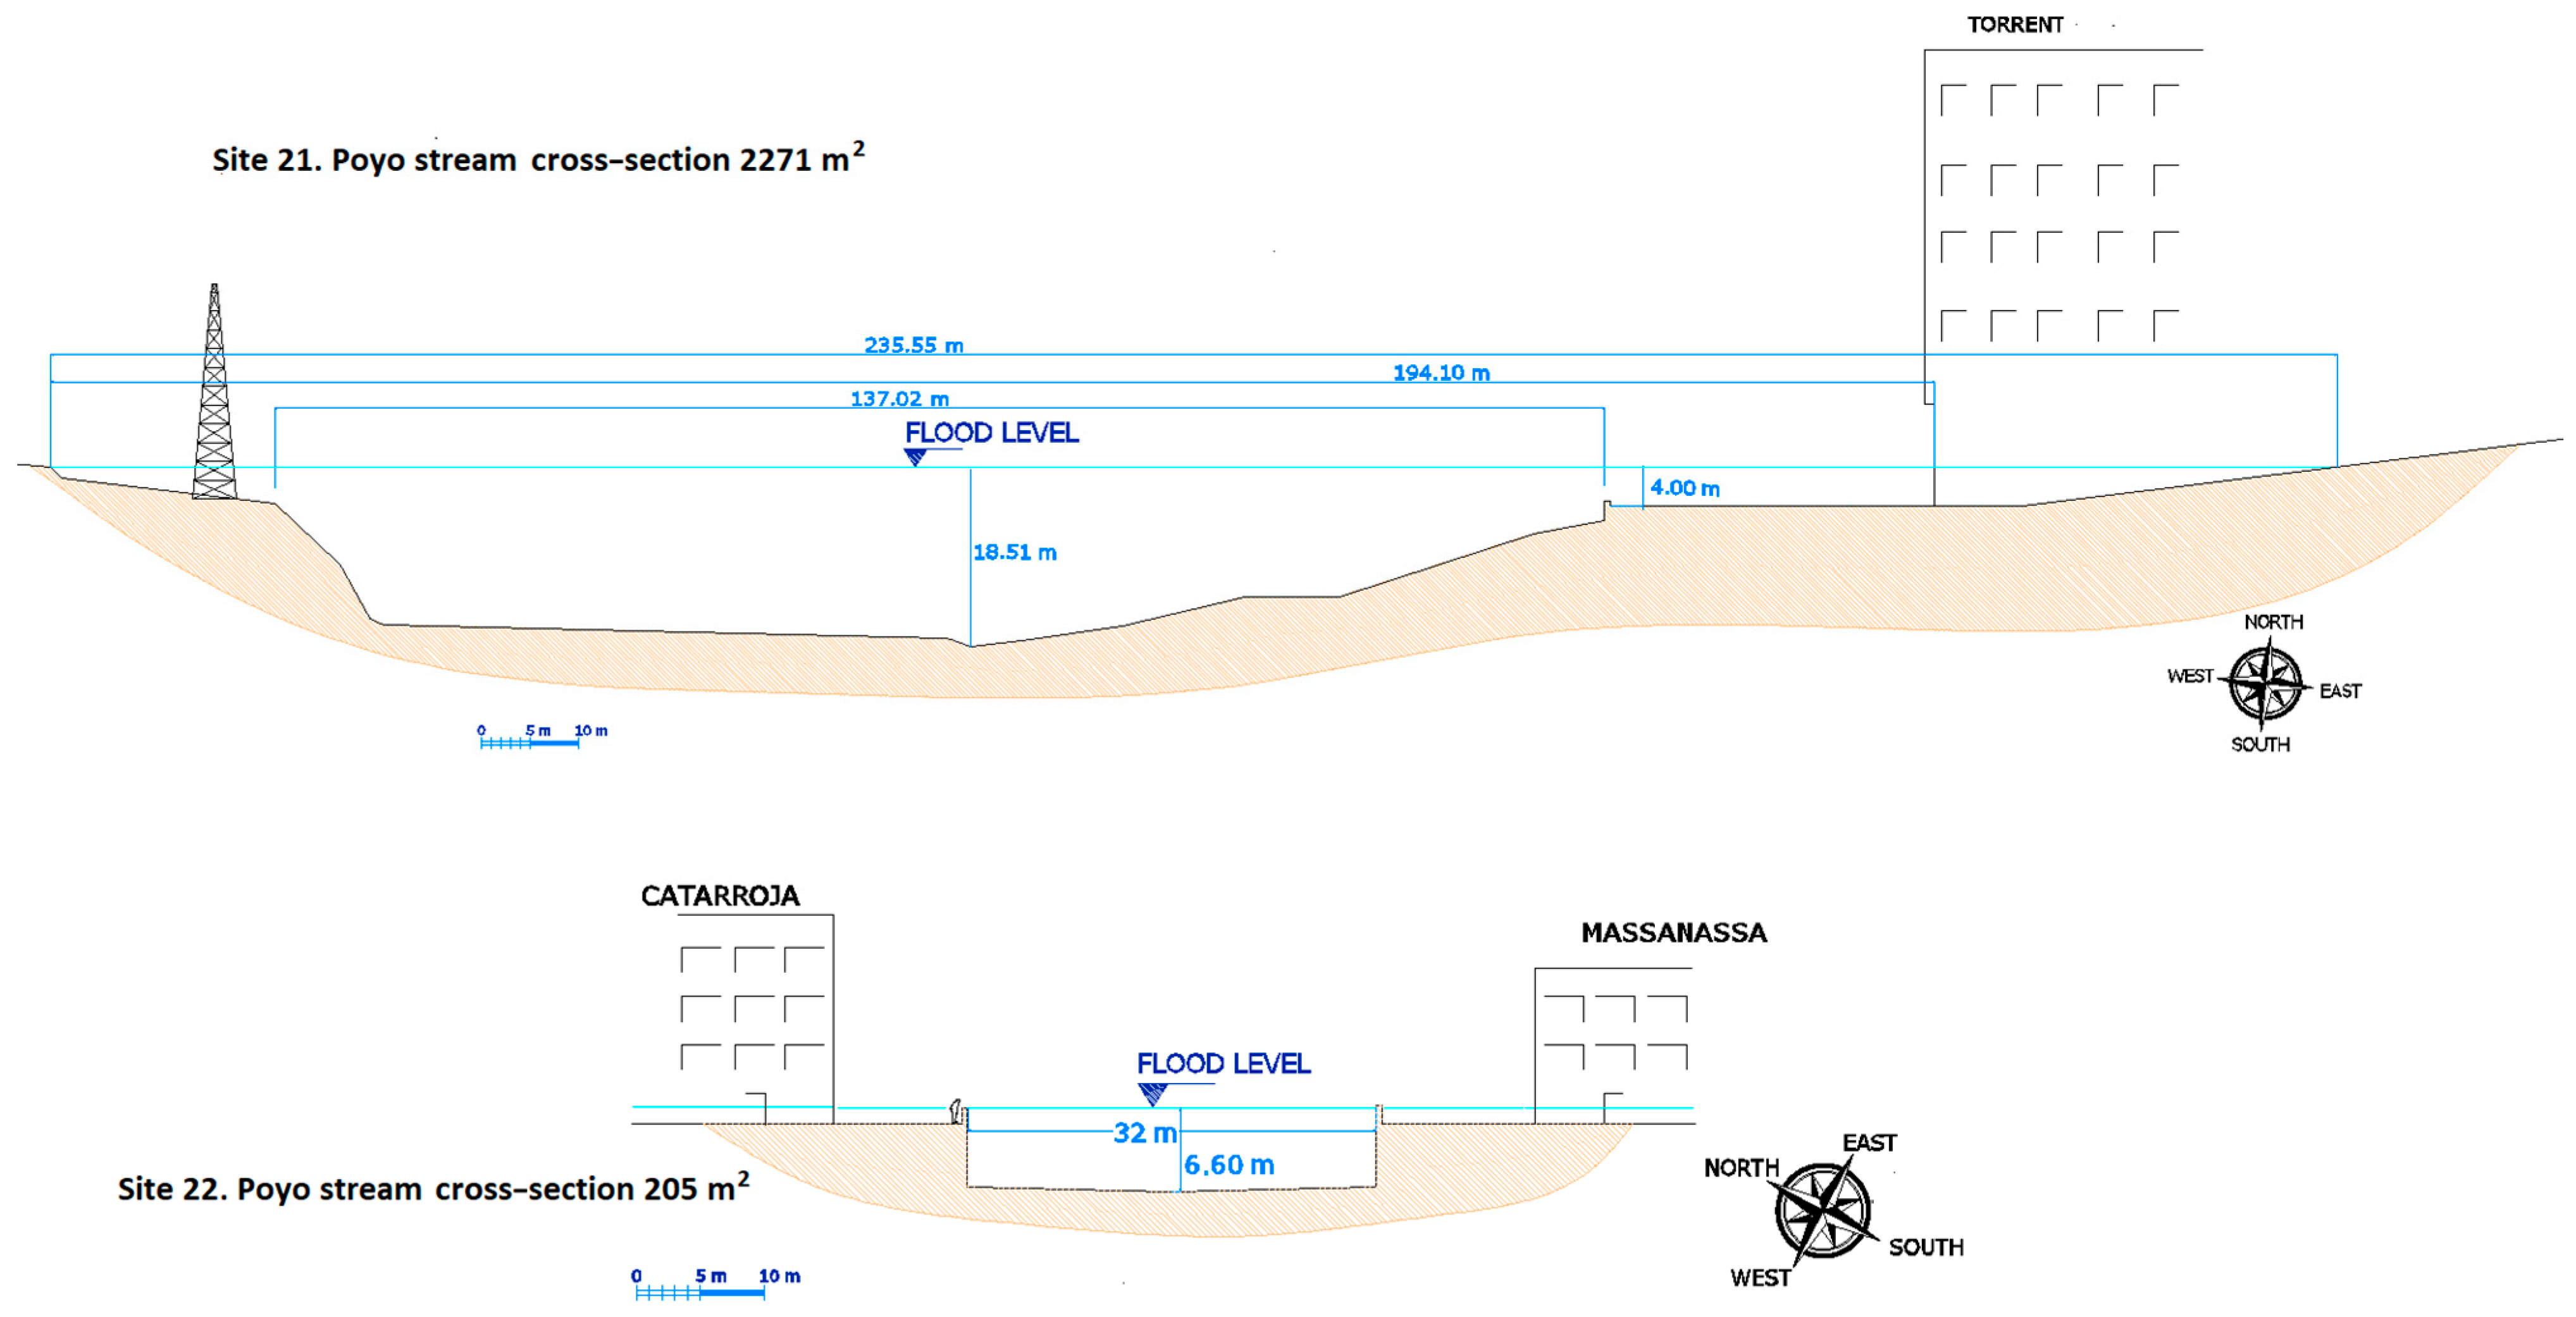
The situation is more complex in the Poyo basin. The presence of areas where the riverbed overflows naturally is indicative of the terrain’s lack of slope. This phenomenon is not unprecedented in history. The configuration of the extant drainage network appears to have been modified by human activity and the convexity as a result of sediment accumulation, possibly due to the periodic flooding that has occurred since time immemorial [36]. However, the confluence of the Poyo and Horteta streams in Torrent city (site 21) has been observed to be a point of hydrological significance, with a cross-section measuring 2271 m2 and a recorded water level depth of approximately 18 m in the deepest section of the stream [40]. The circulation of the flow is restricted in two ways. First, it is unable to pass through the modified channel in the next town Picanya, where the riverbed is located crossing the urban center. Second, the channel has been constricted due to urban growth, reducing its capacity to 300 m2 at the next town Paiporta and 205 m2 downstream in the crossing between Catarroja and Massanassa. Consequently, the “bottleneck” that occurs downstream of Torrent, extending slightly further on as the section narrows (Figure 10), resulted in the overflow becoming generalized within the span of only 8 km separating Torrent and Massanassa (site 22) and flowing to the rice fields of the Albufera. This led to significant flooding, resulting in numerous casualties and substantial material damage.
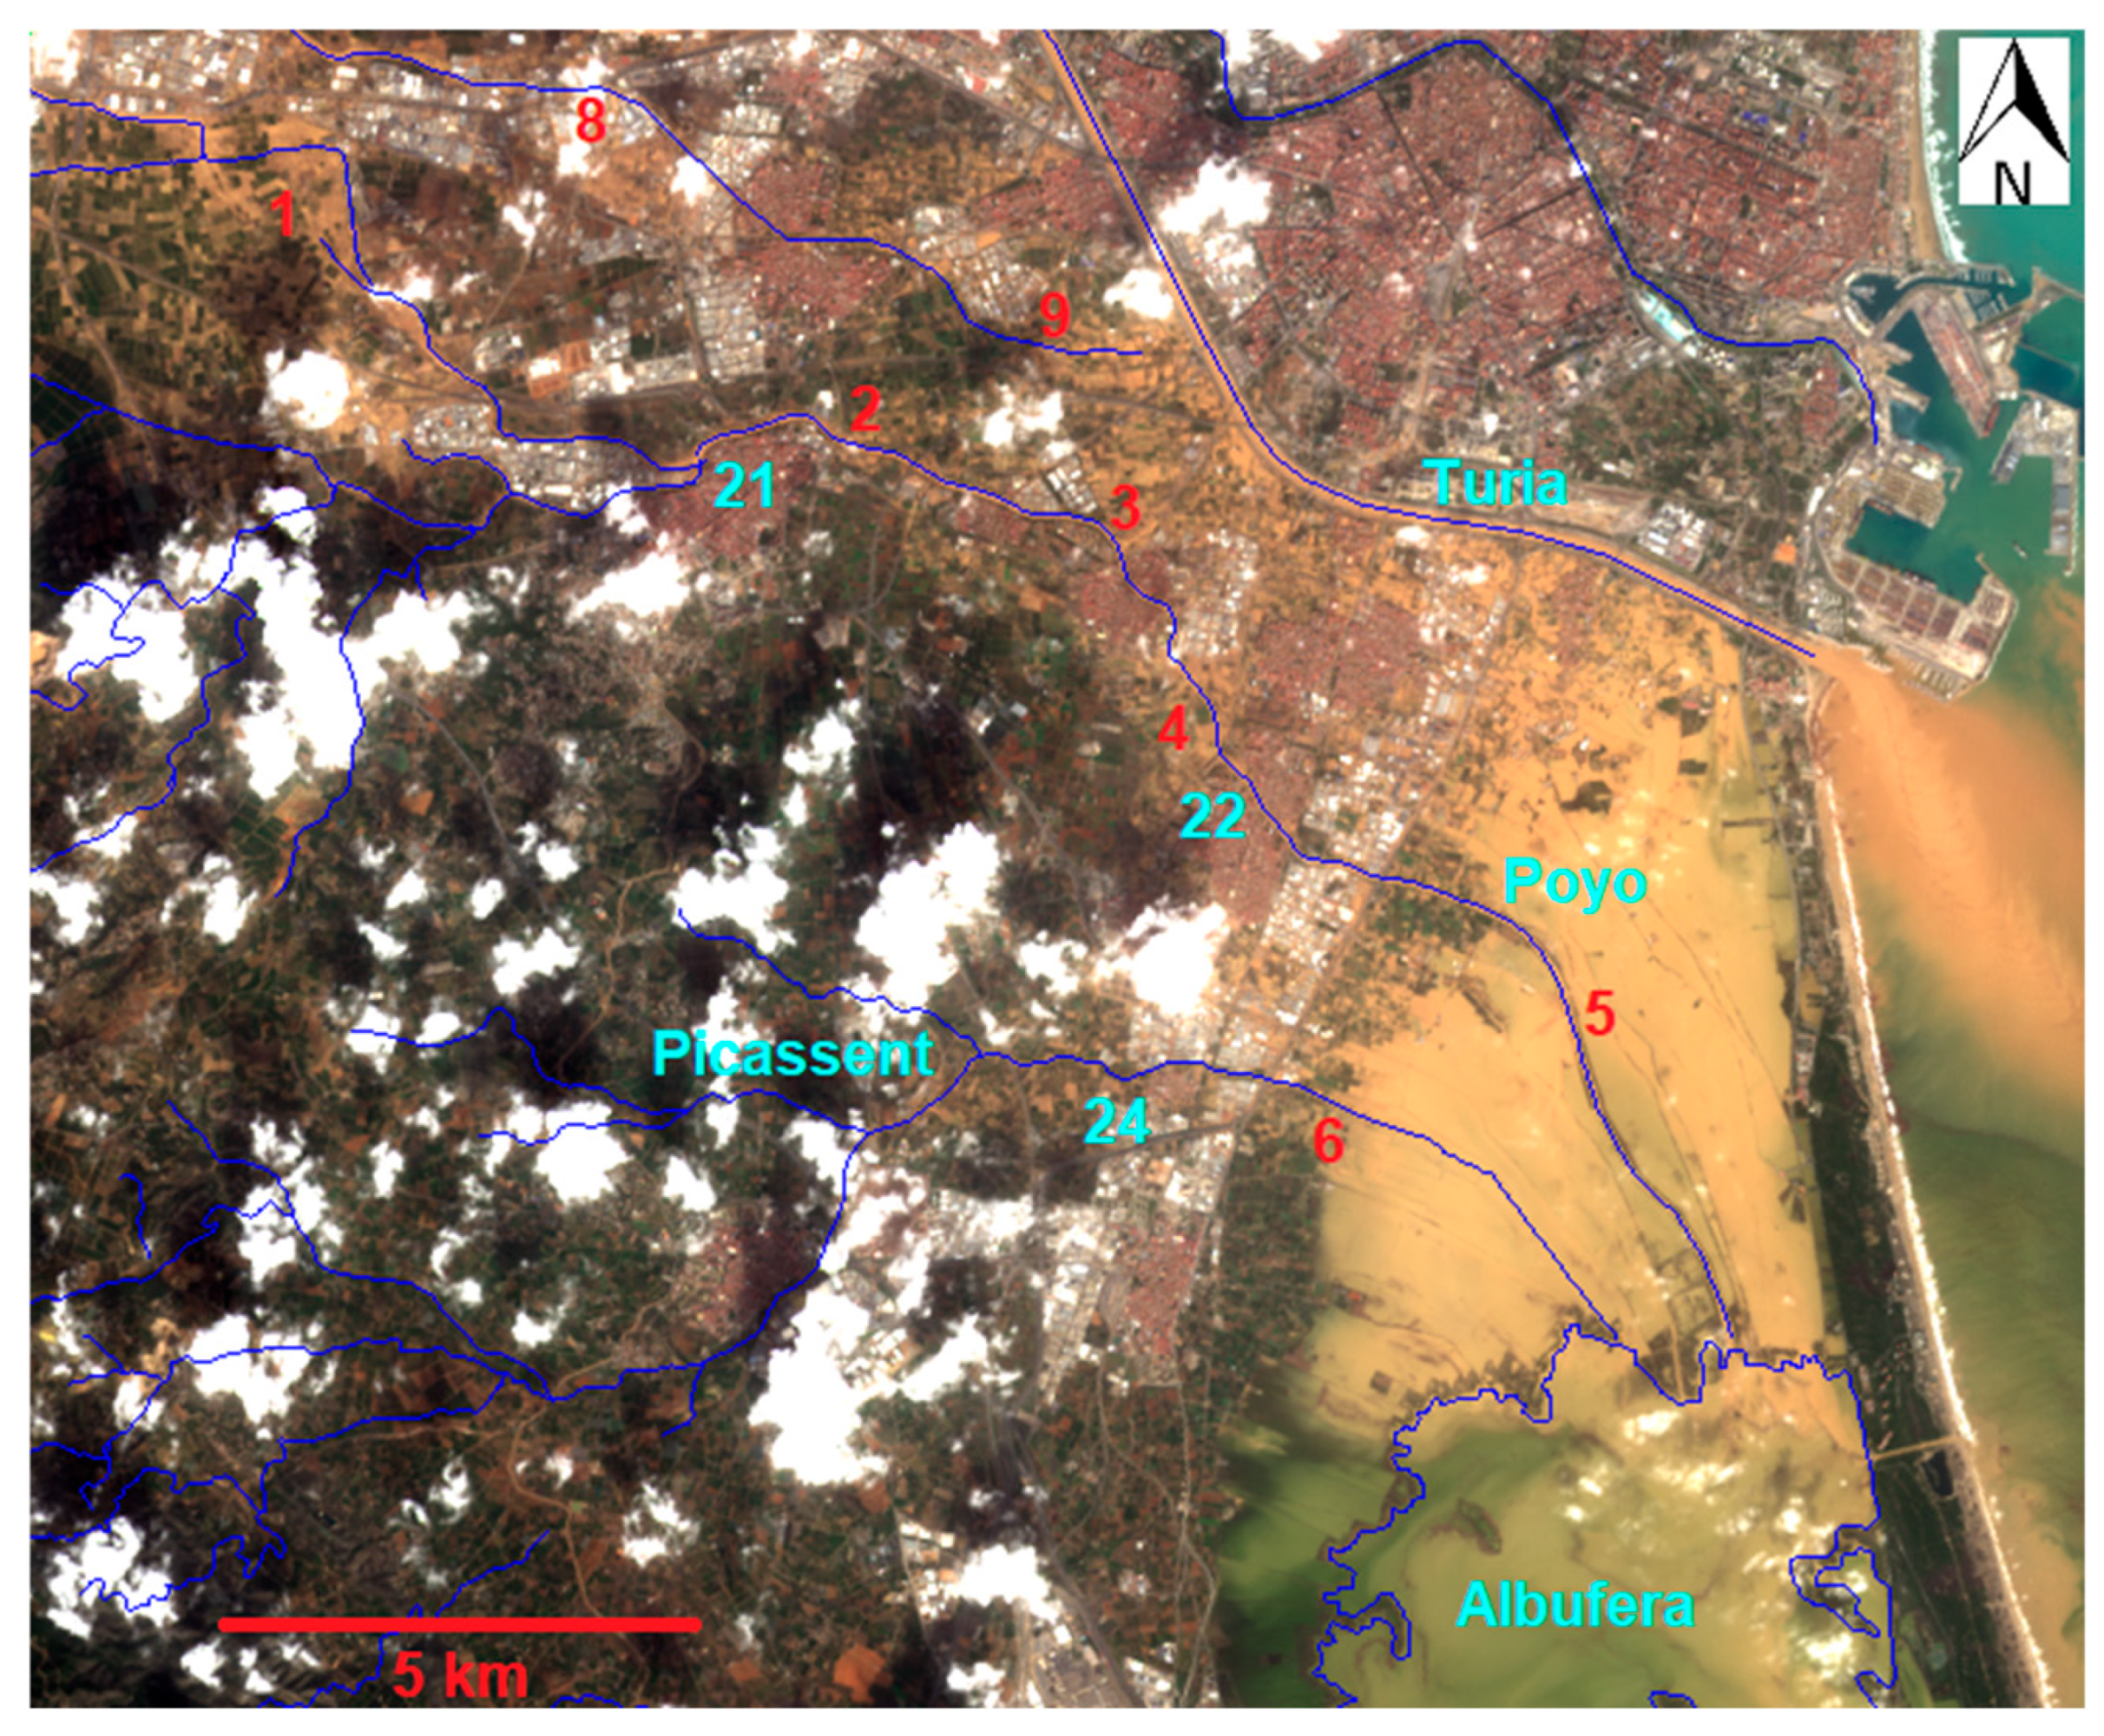
Previous to control site number 21, there is a historic flood area considered an endorheic area called “Pla de Quart” (Figure 11, mark 1), where the waters extend into the county and a constructed channel during the 18th century [36] of only 10 m wide flows to site 21, with a width of 110 m. But 2 km down (mark 2), the width is reduced to 73 m and overflowed the left bank before Picanya town. The cross by Paiporta town reduces the width to 58 m and overflowed the left bank in mark 3, and finally the width is reduced to 35 m before Massanassa (site 22) and overflowed the right bank (mark 4).
The flow damaged the embankment of Poyo stream between the rice fields and water extended widely into the paddies (mark 5). The Picassent stream (site 24) ends in the rice fields at mark 6, reducing the width from 30 m to only 4 m and the waters also extended into the paddies.
Finally, the Pozalet stream (site 23) merits mention, despite its present-day disappearance, as it was formerly located at the exit of the Ribarroja industrial estate. The waters of this stream were dispersed in the surrounding area following the depression of the paleochannel, which is today occupied by buildings of Aldaia town and agricultural land. The outflow of 455 m3 s−1 could not avoid inundating all the areas (Figure 11, mark 8 and 9) in its direction towards the sea. It is imperative to ascertain solutions to the issues pertaining to water circulation.
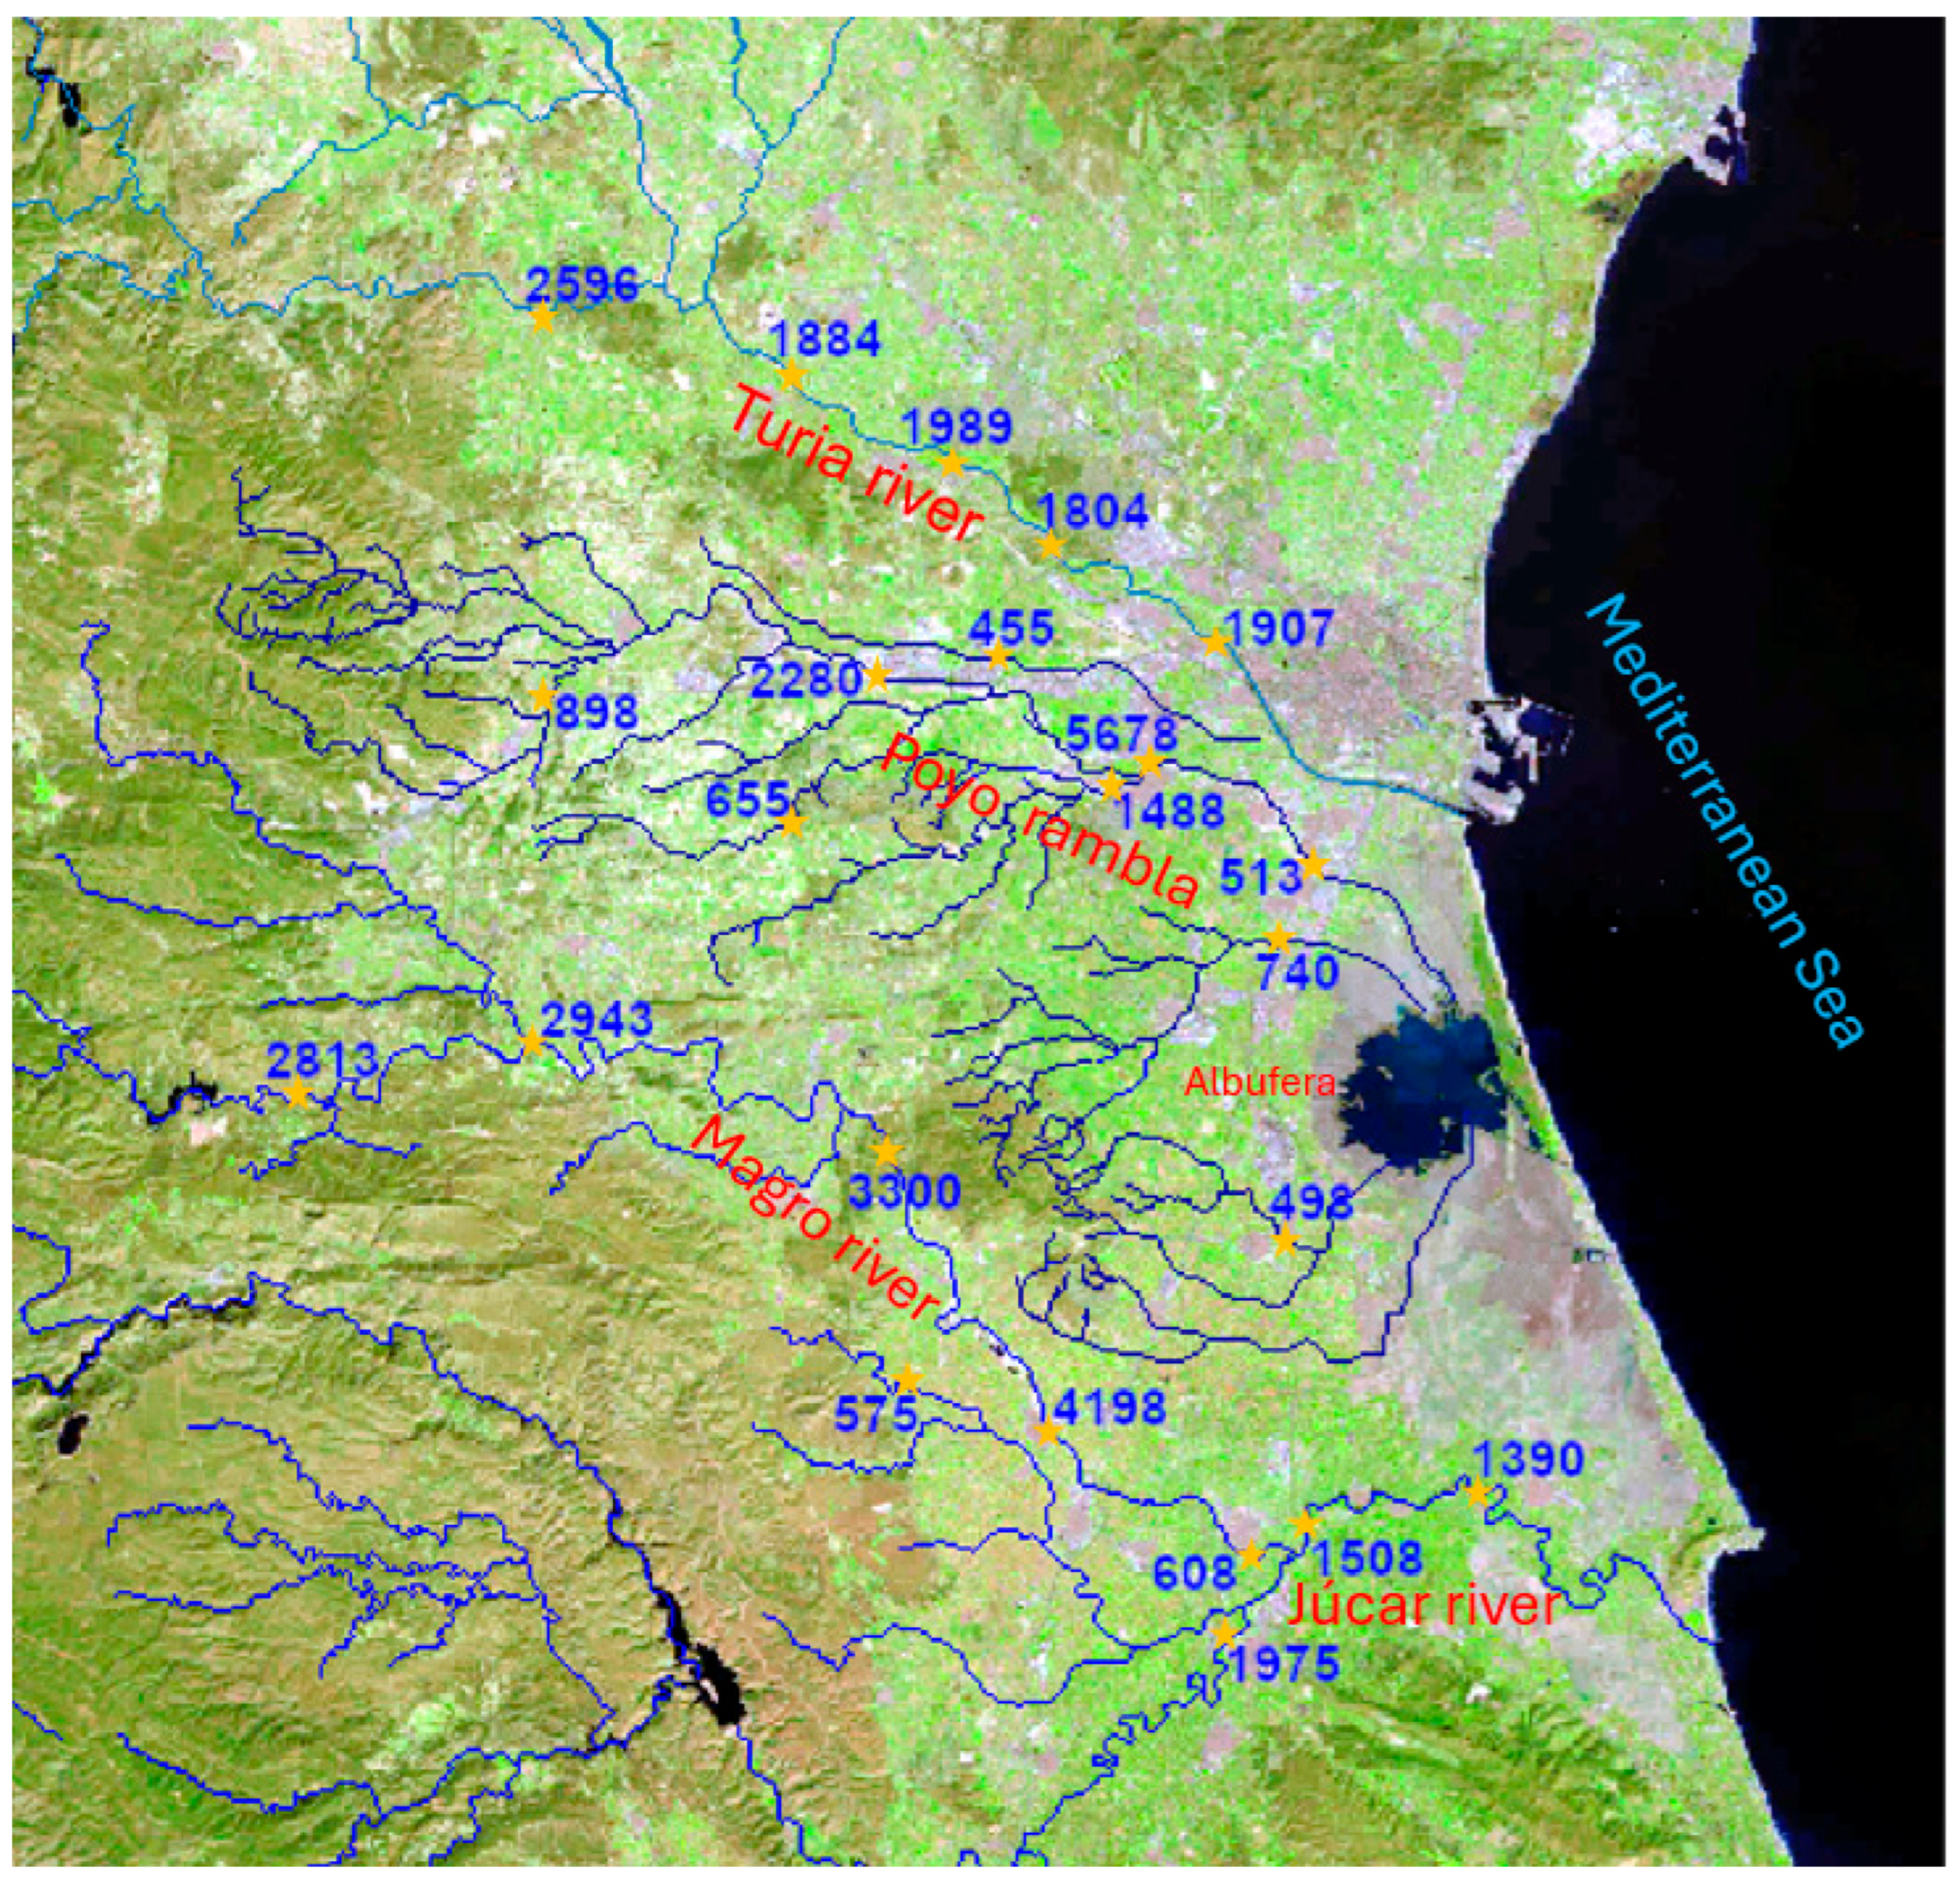
Figure 12 presents a synopsis of the flows passing through each channel, as depicted in Figure 2 and Table 1. This analysis elucidates the phenomenon of peak flows and the occurrence of narrowing in the downstream channel, which causes the overflow of water when the size of the riverbed downstream is smaller than upstream.

4. Discussion

Rainfall in the Mediterranean basin exhibits distinct characteristics compared with monsoon regions or the Mississippi basin. In such regions, flooding is caused by rainfall that while not characterized by high intensity, persists over an extended duration. For instance, in the Great Flood of 2011 [4], daily accumulations of between 50 and 100 mm were recorded for several days; however, in the Ganges Millennium Flood of 2000 [3], rainfall exceeded 100 mm per day for a week. This phenomenon occurs when there is continuous and persistent rainfall distributed evenly over a considerable expanse of territory over an extended period. However, in the Mediterranean region, storms are more frequent and occur over smaller areas (in the case of the study, only about 1500 km2), with a duration of approximately 16 h. These storms result in significant precipitation, with a maximum accumulation of 767 mm over that period [49]. The average precipitation for the area is 385 mm (rain gauges: n = 7, standard deviation = 209 mm, minimum = 244 mm), indicating a total volume of approximately 578 hm3. According to our estimate, 40% of the rainfall was transformed into runoff, a finding that aligns with recent studies conducted on cultivated soils, drylands, and urbanized areas [50].
Considering this data, we can affirm that the event of 29 October 2024 is regarded as one of the most disastrous in the history of the Valencian Community and Spain in terms of casualties (228 deaths) and economic losses (estimated at the time of this study at more than EUR 20 billion). In order to provide a suitable perspective on the magnitude of this hydrological occurrence, it is necessary to compare it with previous extreme episodes in the region. The historic flood of 1957 in Valencia, caused by the Turia river, had two peak flows of approximately 2500 and 3700 m3 s−1 as it passed through the city [51], resulting in the flooding of more than 30 km2 of the urban and coastal area, with 81 deaths [52]. As was the case in 2024, two flow peaks were also observed; however, these peaks were of a slightly less magnitude. The 1982 Tous dam breach on the Jucar river resulted in a flow of 10,000 m3 s−1 in the lower basin, leading to 20–25 fatalities [41,53] and economic losses exceeding EUR 330 million [54]. A comparative analysis of the 2024 event reveals a substantial increase in the number of casualties when compared with the floods of 1957 and 1982. When evaluated against other significant Mediterranean events, the Valencia flood of 2024 was found to be more substantial in terms of casualties and damage than the most notable floods in France in 2002 [55] or Italy in the period 1990–2006 [10]. The Algerian event in 2001 [56] was the only event to have a higher number of deaths.
In relation to the methodological framework, the empirical method allowed us to satisfy the primary objective of this study, which was to estimate the peak flows in the primary channels associated with the 29 October 2024 flash flood event within the designated hydrological network. The adoption of an analytical and empirical approach in this study over more complex methods, such as statistical or machine learning (ML) methods, is justified by several factors. Balacumaresan et al. [39] highlighted that despite the existence of stochastic techniques for rainfall disaggregation, such as the Bartlett–Lewis or Random Cascade models, these are characterized by a high degree of complexity and the requirement of extensive statistical efforts, which renders them less suitable for routine industrial practice. Conversely, analytical/empirical approaches offer simplicity and transparency regarding the underlying concepts and provide an advantage by allowing focus on specific aspects of modeling. In the aftermath of a disaster, the requirement for rapid and verifiable estimates serves to underscore the importance of empirical methodologies.
Regarding the main contributions of this study, in relation to the implications for climate change, this study makes a substantial contribution to risk management in a world affected by it. González-Cao et al. [38] emphasized the importance of numerical modeling of past floods for improving return period estimates and reducing uncertainties. The peak flow data and the identification of “bottlenecks” obtained empirically in this study are an essential input and a critical validation basis for future detailed hydraulic simulations (using 1D or 2D models). This review [38] highlights the critical influence of the selection of the roughness coefficient (Manning) on the numerical outcomes of simulations, the robustness of which is demonstrated in this study through an R2 of 0.99. Consequently, the roughness values calibrated empirically in this study (e.g., 0.18% in Huerto Mulet) are valuable input data for refining future models. The same review demonstrates that a significant proportion of historical flood reconstructions concentrate on the analysis of the causes of obstruction (e.g., debris accumulation on bridges or timber transport causing blockages). In contrast to the extant literature on numerical flood modeling, the present study provides a complementary perspective by identifying that structural and anthropogenic reduction in the channel cross-sectional area itself is a primary mechanism of overflow. This empirical evidence can be used to improve flow simulations and mitigation planning.
Understanding the frequency and magnitude of floods is fundamental for designing flood protection infrastructure and for implementing appropriate mitigation measures. In this sense, the main limitations of this study are our results of a probability of 8.8% for the Jucar river basin and 2.5% for the Turia and Poyo basins (see Table A1) and the return period of 12 years considering the three basins. The primary reason for this is that despite its proximity to reality when considered in conjunction with the historical records that have been consulted since the 13th century, these records have not been incorporated into the calculation [57]. This is due to the absence of methods for estimating flow during that period, which has rendered it impossible to ascertain the true magnitude of the events in question. Consequently, the data set encompasses only the peak values from the last 80 years. The data demonstrates that according to these 80 years of records, the October 2024 event was the most important in the Poyo basin, the second in the Turia basin, and the third in the Jucar basin.
In terms of governance implications, the empirical identification of the flows that were reached and the flooded areas, particularly the “bottlenecks,” serves to reinforce the necessity of enhancing the hydrological monitoring network. The regional territorial planning tool for flood risk prevention (acronym PATRICOVA) has been shown to establish risk levels and return periods in a conservative manner. The flood of October 2024 had an impact on areas that had not previously been included in the risk limits, including areas to the south and west of the city of Valencia; towns such as Paiporta, Benetússer, Sedaví, Albal, and Xirivella; and areas in the Magro basin (Algemesí, Carlet). A recent study demonstrated the necessity of considering these factors [58]. It is imperative to update the PATRICOVA to incorporate these regions within the designated risk boundaries, adjusting the zoning and land use regulations accordingly. The magnitude of the 2024 event underscores the imperative to fortify monitoring and management strategies. This is a critical aspect given the predicted increase in both frequency and intensity of IHDs in the context of climate change.
Besides the political and socioeconomic implications, ecological implications must also be considered. From this point of view, this phenomenon had a substantial impact on the downstream ecosystems, including the Albufera of Valencia lagoon. A hydrochemical analysis [49] conducted on the lake in the post-event period revealed significant alterations in crucial water quality parameters. It is evident that conductivity exhibited a substantial decline, reaching 82% below pre-IHD values. This decline is attributable to the considerable influx of freshwater from the drainage basin. Nutrient levels exhibited notable fluctuations, marked by a substantial increase in nitrate and a concurrent decrease in total phosphorus. Notwithstanding the lagoon’s demonstrable recovery to pre-event conditions within 20–30 days, indicative of the system’s resilience, the magnitude of the transport of dissolved and suspended material by the flood remains indisputable. Moreover, an examination of Figure 1 reveals that a substantial sediment layer has accumulated in various regions of the lagoon. The detailed quantification and composition of this substantial sediment deposit is a fundamental aspect of understanding the long-term ecological impact. Consequently, one of the future studies will concentrate on research of the accumulated sediment volumes and their chemical properties, thereby augmenting this comprehensive evaluation of the impact of the October 2024 IHD. It is recommended that future research endeavors concentrate on the fields of urban planning and hydraulic engineering, with a view to enhancing the region’s resilience to extreme events. It is imperative to examine the relationship between the magnitude of the October 2024 event and the escalating challenges posed by intensifying flooding due to climate change. This necessitates the urgent modernization of land use planning instruments and the adaptation of communities to rising flood risks. From a hydraulic engineering perspective, it is essential to utilize the empirical findings of this study, particularly the location of “bottlenecks” in the hydrographic network and calibrated roughness values, to guide structural interventions that enhance the capacity of channels and control structures. Furthermore, future studies should incorporate extreme precipitation analysis. The disaggregation methodology could be applied to develop climate-refined Intensity–Frequency–Duration (IFD) curves, which are essential for hydraulic infrastructure design and flood mitigation. The integration of these data into numerical simulations has been demonstrated to enhance conventional methods of estimating return periods, thereby facilitating the development of appropriate mitigation practices and the construction of climate-resilient infrastructure.
5. Conclusions

The primary objective of this study was to conduct a hydrological assessment of the isolated high-level depression (DANA) event of 29 October 2024, employing a post-event empirical approach to estimate the maximum flows. This method, founded upon the analysis of physical evidence and the wet cross-section at 25 sampling points, yielded flow estimates in a disaster scenario where the measurement infrastructure was overwhelmed. The findings indicate maximum flows of 5678 m3 s−1 in the Poyo ravine (site 21) and 4198 m3 s−1 in the Magro river (site 10). The total estimated flow contributed by the storm to the basins was 15,518 m3 s−1. The validity of this empirical procedure was rigorously tested using Manning’s equation, yielding a strong coefficient of determination (R2 of 0.9905) and low errors (nRMSE = 3.62% and nMAE = 2.26%).
Notwithstanding the robustness of the empirical approach, this study is subject to inherent limitations. The primary concern pertains to the impracticability of incorporating historical flood records dating back to the 13th century within recurrence analyses. This is attributable to the dearth of methodologies for estimating flow during that historical era, which consequently restricts probability calculations to the span of the last 80 years. In this context, the probability of flooding is 8.8% for the Jucar basin and 2.5% for the Turia and Poyo basins. Moreover, the inherent limitations of the SAIH (Automatic Hydrological Information System) and the destruction of several measurement points during the extreme event in question prevented the accurate determination of key hydrological parameters. These parameters include the peak flow duration and the decline curve. It is therefore evident that further research is required in this area.
The conclusions drawn from this study are of significant socioeconomic and ecological importance. The empirical identification of “bottlenecks” in the hydrographic network, such as the drastic reduction of the wet cross-section of the Magro River from 1679 m2 to only 243 m2 between Carlet and Algemesí, explains the overflows and highlights the need to improve the capacity of the river channels. In terms of the social impact, the October 2024 event is considered to be among the most catastrophic, with an estimated 228 fatalities and material losses that exceeded EUR 20 billion. From an ecological standpoint, the impact on the Albufera of Valencia was severe, with an 82% decrease in water conductivity below pre-DANA values and the deposition of a layer of sediment at the bottom of the lagoon. In order to inform future territorial planning tools such as PATRICOVA, it is essential to utilize these findings to update structural interventions that enhance hydraulic resilience, utilizing empirically calibrated roughness values (e.g., 0.18% in Huerto Mulet). Future research directions should include detailed analysis of the chemical composition and volume of accumulated sediments, as well as the application of extreme precipitation disaggregation methodologies to develop Intensity–Frequency–Duration (IFD) curves adapted to climate change.

Supplementary Materials

The following supporting information can be downloaded from https://doi.org/10.5281/zenodo.15492754, which includes graphical materials (pictures of each site and the original sketches in high resolution).

Author Contributions

Conceptualization, R.M. and J.S.; methodology and field work, R.M.; formal analysis, R.M., J.V.M., and J.S.; investigation, R.M.; data curation, J.S.; writing—original draft preparation, N.C.-T. and R.M.; writing—review, drawing, and editing, R.M., J.V.M., and N.C.-T.; supervision, J.S. All authors have read and agreed to the published version of the manuscript.

Funding

This research received no external funding.

Data Availability Statement

Landsat-8 images can be downloaded from https://earthexplorer.usgs.gov/ (acessed on 30 october 2024) and were licensed to J.S. for research purposes. Some public videos that show the velocity of the water: Site 10, Carlet: https://www.youtube.com/shorts/XXZiNfd-ypc (accessed on 15 September 2025) during the peak flood. Site 11, Algemesí: https://www.youtube.com/shorts/v5Cw7nPAt24 (accessed on 15 September 2025) before the overflood. Site 16, Chiva: https://www.youtube.com/shorts/LpWirSLG7LI during the peak flood (accessed on 15 September 2025).

Conflicts of Interest

The authors declare no conflicts of interest.

Abbreviations

The following abbreviations are used in this manuscript:
CHJJucar Basin Authority
IHDIsolated high-level depression
SAIHAutomatic Hydrological Information System
RGBRed–green–blue colors

Appendix A

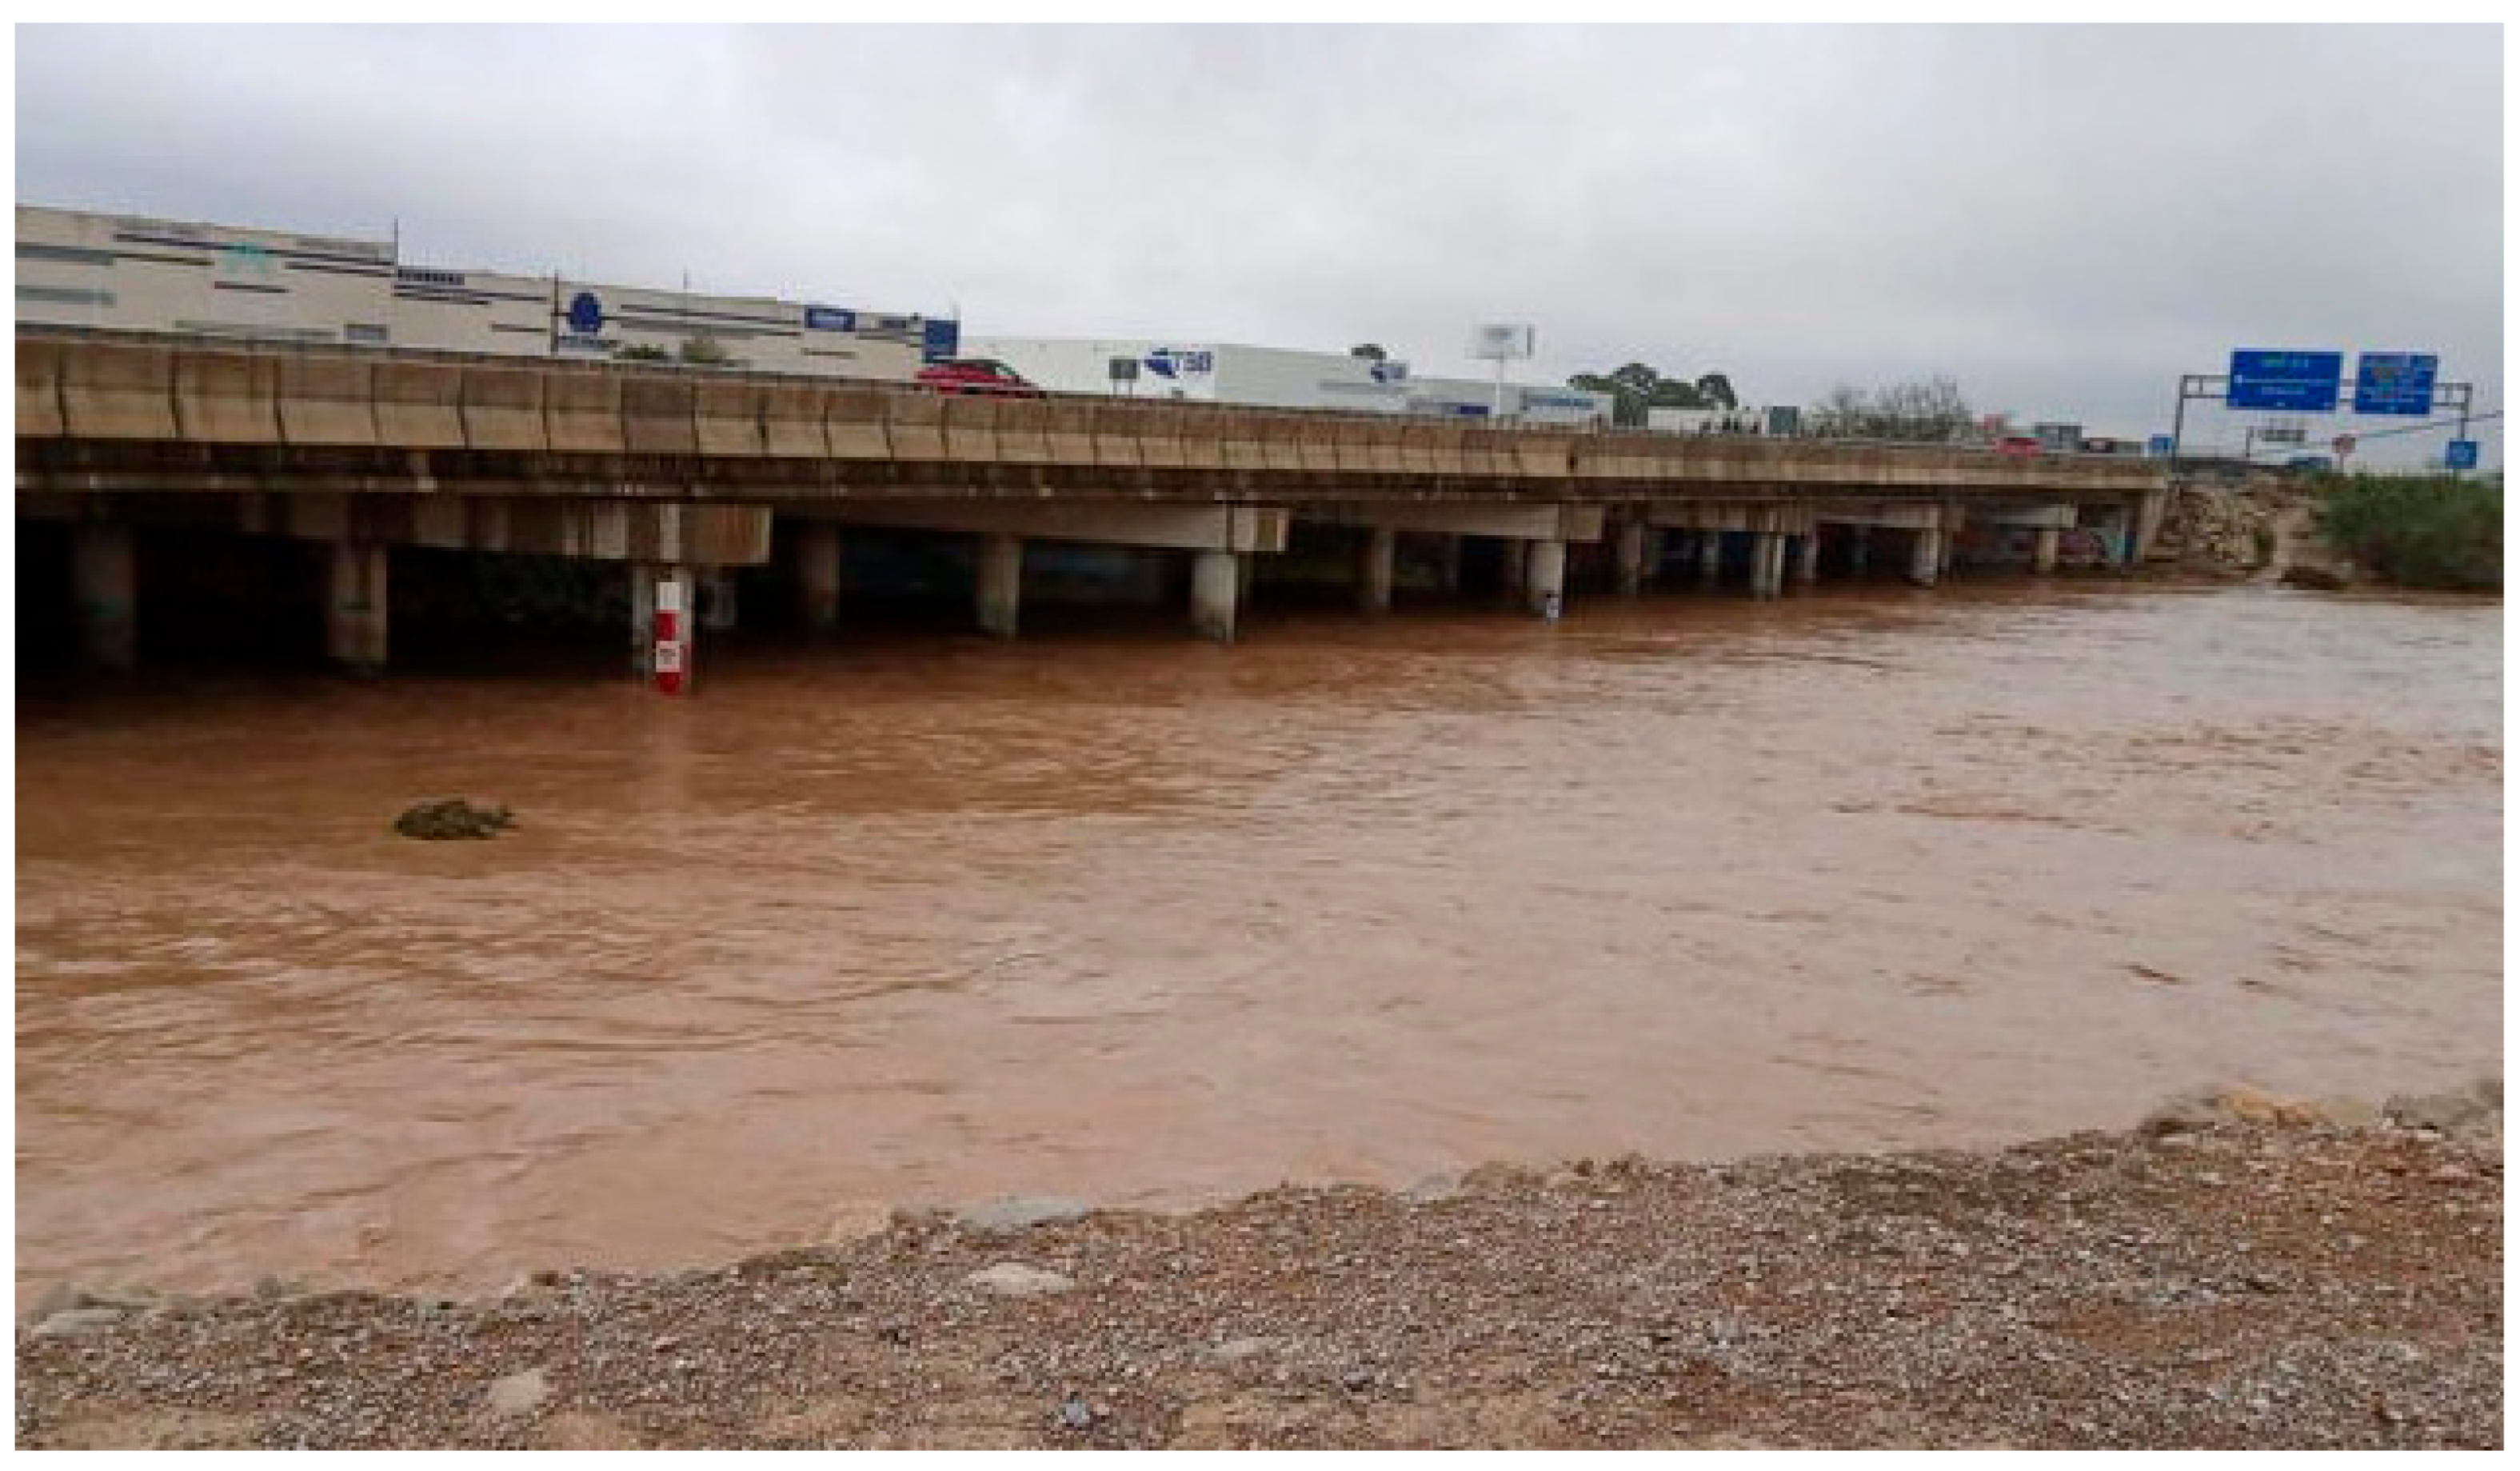
Figure A1. The Poyo stream (site 18) on 29 October 2024 14:00, showing the red/white scale to visually evaluate the level of the water in the riverbed. The level of water was about 1.2 m at that moment; each color is 0.5 m high.
Water 17 03177 g0a1
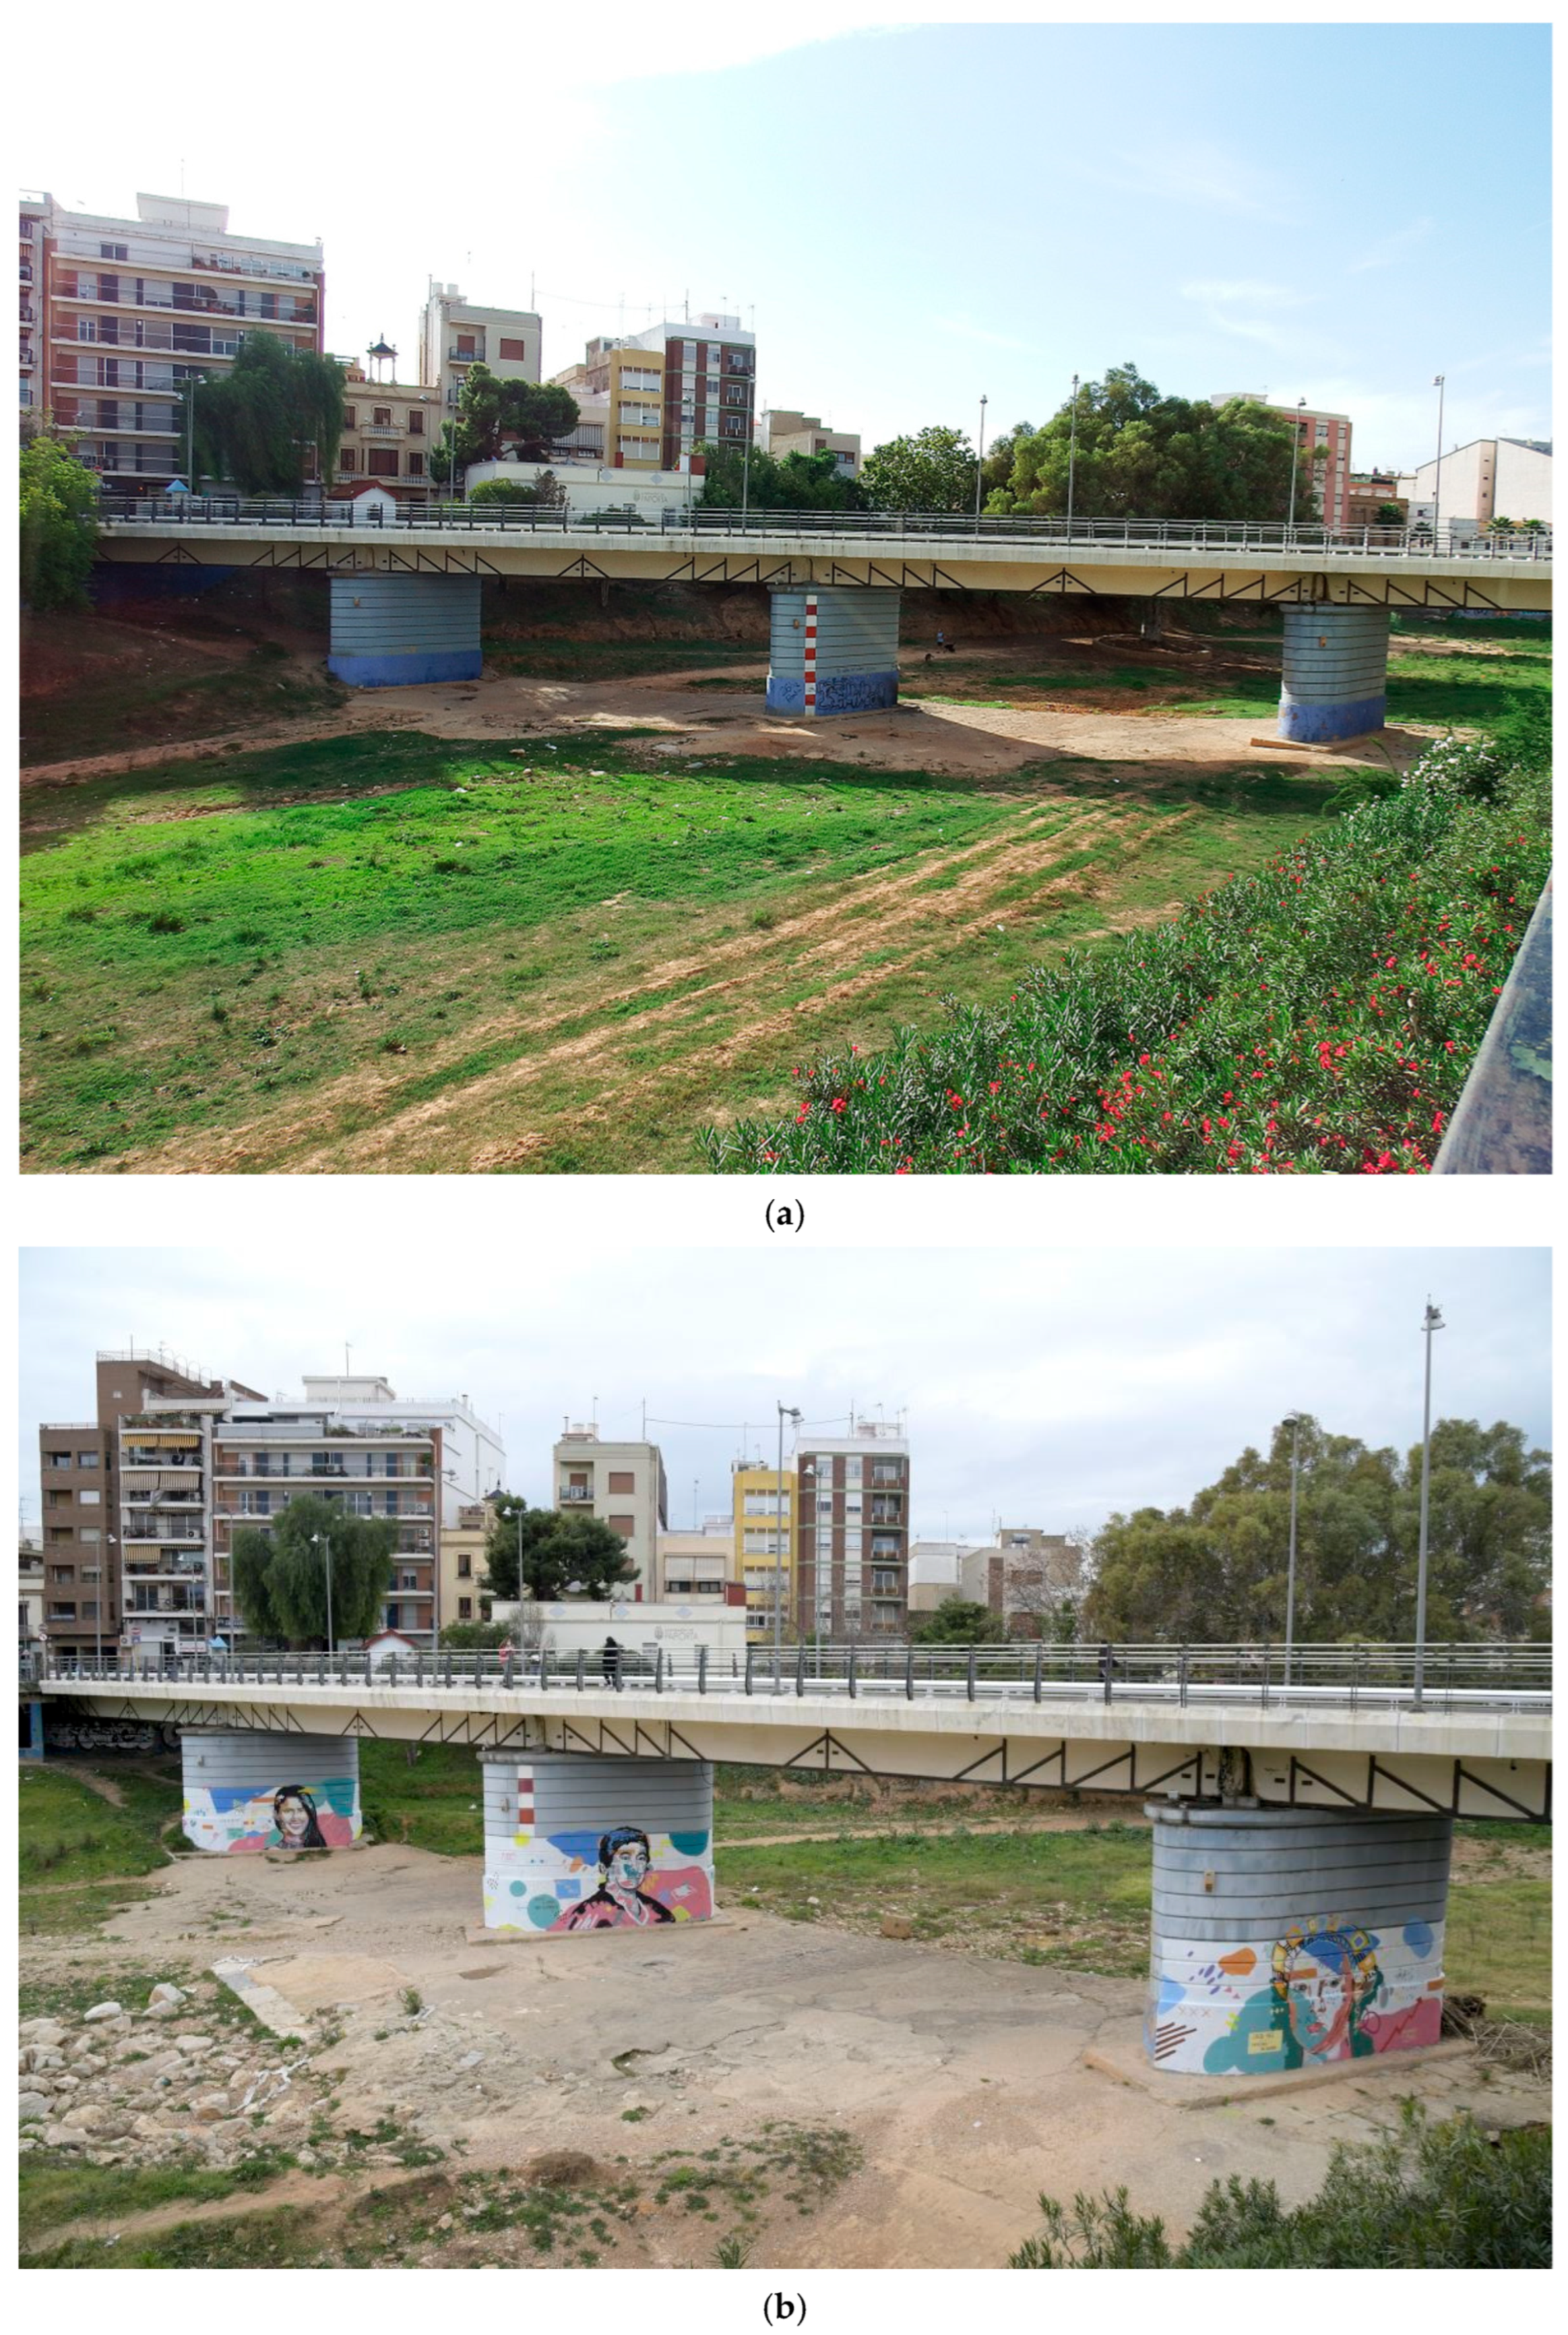
Figure A2. (a) The Poyo stream in Paiporta city (between site 21 and site 22) and the old bridge in the year 2017. The flood level scale is very visual and painted in the central column. (b) But after that, it was painted over by the local authorities with some “urban art” and became out of service. Source pictures: Wikimedia Commons.
Water 17 03177 g0a2
Figure A3. Map of daily accumulated rainfall (mm) as recorded on 29 October 2024. UTM corner coordinates zone 30S [42].
Water 17 03177 g0a3
Figure A4. Calculated wet Turia river cross-section (m2) at the location of measurement site 6. The materials accumulated, namely, tree trunks and reeds, by the water current can be seen by the columns of the bridge, which made it possible to calculate the maximum water level reached at this place. Picture taken in November 2024.
Water 17 03177 g0a4
Table A1. Results of the probability and return periods estimated for the Jucar and Turia rivers, with the maximum daily mean flow data recorded from 1944 to present. We considered the daily values of the flood that cause extreme flooding and economic losses [54].
SiteSite NameYearMax Flow
(m3 s−1)
Probability
(%)
Return Period
(Years)
14Jucar–Huerto Mulet1982–198316001.380
2024–202510642.540
1987–19887953.827
1948–19497355.020
1953–19547356.316
1958–19595057.513
2008–20094558.811
4Turia–La Presa1957–195825001.080
2024–202515782.540

References

  1. Camarasa, A.M. Flash-flooding of ephemeral streams in the context of climate change. Geogr. Res. Lett. 2021, 47, 121–142. [Google Scholar] [CrossRef]
  2. Camarasa, A.M.; Segura, F. Flood events in Mediterranean ephemeral streams (ramblas) in Valencia region, Spain. Catena 2001, 45, 229–249. [Google Scholar] [CrossRef]
  3. Das, S.; Bandyopadhyay, S. The Millennium Flood of the Upper Ganga Delta, West Bengal, India: A Remote Sensing Based Study. In Applied Geomorphology and Contemporary Issues; Mandal, S., Maiti, R., Nones, M., Beckedahl, H.R., Eds.; Geography of the Physical Environment; Springer: Cham, Switzerland, 2022. [Google Scholar] [CrossRef]
  4. Camillo, C.A. Divine Providence: The 2011 Flood in the Mississippi River and Tributaries Project; Mississippi River Commission: Vicksburg, MS, USA, 2012.
  5. FitzGerald, G.; Du, W.; Jamal, A.; Clark, M.; Hou, X.Y. Flood fatalities in contemporary Australia (1997–2008). Emerg. Med. Australas. 2010, 22, 180–186. [Google Scholar] [CrossRef]
  6. Jonkman, S.N. Global perspectives on loss of human life caused by floods. Nat. Hazards 2005, 34, 151–175. [Google Scholar] [CrossRef]
  7. Grau-Bove, J.; Higha, R.; Orr, S.; Kumar, P. Short note on the mapping of heritage sites impacted by the 2024 floods in Valencia, Spain. arXiv 2024, arXiv:2411.08717. [Google Scholar] [CrossRef]
  8. Rombeek, N.; Hrachowitz, M.; Uijlenhoet, R. Torrential rainfall in Valencia (Spain) recorded by personal weather stations preceding and during the 29 October 2024 floods. EGUsphere 2025, 1–29. [Google Scholar] [CrossRef]
  9. Sapountzis, M.; Stathis, D. Relationship between Rainfall and Run-off in the Stratoni Region (N. Greece) after the storm of 10th February 2010. Glob. NEST J. 2014, 16, 420–431. [Google Scholar] [CrossRef]
  10. Llasat, M.C.; Llasat-Botija, M.; Prat, M.A.; Porcu, F.; Price, C.; Mugnai, A.; Yair, Y. High-impact floods and flash floods in Mediterranean countries: The FLASH preliminary database. Adv. Geosci. 2010, 23, 47–55. [Google Scholar] [CrossRef]
  11. Faccini, F.; Luino, F.; Paliaga, G.; Sacchini, A.; Turconi, L.; de Jong, C. Role of rainfall intensity and urban sprawl in the 2014 flash flood in Genoa City, Bisagno catchment (Liguria, Italy). Appl. Geogr. 2018, 98, 224–241. [Google Scholar] [CrossRef]
  12. SAIH Jucar. Automatic Hydrological Information System. Available online: https://saih.chj.es (accessed on 29 October 2024).
  13. Jimenez, P.A.; Gonzalez-Rouco, J.F.; Montavez, J.P.; Garcia-Bustamantea, E.; Navarro, J. Climatology of wind patterns in the northeast of the Iberian Peninsula. Int. J. Climatol. 2009, 29, 501–525. [Google Scholar] [CrossRef]
  14. Shope, C.L.; Bartsch, S.; Kim, K.; Kim, B.; Tenhunen, J.; Peiffer, S.; Park, J.-H.; Ok, Y.S.; Fleckenstein, J.; Koellner, T. A weighted, multi-method approach for accurate basin-wide streamflow estimation in an ungauged watershed. J. Hydrol. 2013, 494, 72–82. [Google Scholar] [CrossRef]
  15. Lawson, T.B. Fundamentals of Aquacultural Engineering, 2nd ed.; Springer: New York, NY, USA, 1995. [Google Scholar]
  16. Harmel, R.D.; Smith, D.R.; King, K.W.; Slade, R.M. Estimating storm discharge and water quality data uncertainty: A software tool for monitoring and modeling applications. Environ. Model. Softw. 2009, 24, 832–842. [Google Scholar] [CrossRef]
  17. Hilgersom, K.P.; Luxemburg, W.M.J. Technical Note: How image processing facilitates the rising bubble technique for discharge measurement. Hydrol. Earth Syst. Sci. 2012, 16, 345–356. [Google Scholar] [CrossRef]
  18. Flury, M.; Wai, N.N. Dyes as tracers for vadose zone hydrology. Rev. Geophys. 2003, 41, 2.1–2.37. [Google Scholar] [CrossRef]
  19. Gordon, N.D.; McMahon, T.A.; Finlayson, B.L.; Gippel, C.J.; Nathan, R.J. Stream Hydrology: An Introduction for Ecologists, 2nd ed.; John Wiley and Sons: Chichester, UK, 2004; ISBN 0470843578. [Google Scholar]
  20. Moore, R.D. Introduction to salt dilution gauging for streamflow measurement: Part 1. Streamline Watershed Manag. Bull. 2004, 7, 20–23. [Google Scholar]
  21. Salguero, L.; Quinones, A.; Ackerman, L. Wastewater Flow Management; US Environmental Protection Agency Science and Ecosystem Support Division: Athens, GA, USA, 2008.
  22. Liu, H.; Shao, Q.; Kang, C. Flow characteristics and cavitation effect of the submerged water jet discharged from a central-body nozzle. World J. Eng. Tech. 2014, 2, 281. [Google Scholar] [CrossRef]
  23. Briggs, M.A.; Lautz, L.K.; McKenzie, J.M. A comparison of fibre-optic distributed temperature sensing to traditional methods of evaluating groundwater inflow to streams. Hydrol. Process. 2012, 26, 1277–1290. [Google Scholar] [CrossRef]
  24. Hamilton, A.S.; Moore, R.D. Quantifying Uncertainty in Streamflow Records. Can. Water Resour. J. 2012, 37, 3–21. [Google Scholar] [CrossRef]
  25. Chauhan, M.S.; Kumar, V.; Dikshit, P.K.S.; Dwivedi, S.B. Comparison of discharge data using ADCP and current meter. Int. J. Adv. Earth Sci. 2014, 3, 81–86. [Google Scholar]
  26. Flener, C.; Wang, Y.; Laamanen, L.; Kasvi, E.; Vesakoski, J.-M.; Alho, P. Empirical Modeling of Spatial 3D Flow Characteristics Using a Remote-Controlled ADCP System: Monitoring a Spring Flood. Water 2015, 7, 217–247. [Google Scholar] [CrossRef]
  27. Herschy, R.W. Streamflow Measurement; Elsevier: London, UK, 1985. [Google Scholar] [CrossRef]
  28. van Gent, M.R.; van Thiel de Vries, J.S.; Coeveld, E.M.; de Vroeg, J.H.; van de Graaff, J. Large-scale dune erosion tests to study the influence of wave periods. Coast. Eng. 2008, 55, 1041–1051. [Google Scholar] [CrossRef]
  29. Ghodsian, M. Supercritical flow over rectangular side weir. Can. J. Civ. Eng. 2003, 30, 596–600. [Google Scholar] [CrossRef]
  30. Emiroglu, M.E.; Bilhan, O.; Kisi, O. Neural networks for estimation for discharge capacity of triangular labyrinth side-weir located on a straight channel. Expert Syst. Appl. 2011, 38, 867–874. [Google Scholar] [CrossRef]
  31. Ancey, C.; Davison, A.C.; Böhm, T.; Jodeau, M.; Frey, P. Entrainment and Motion of Coarse Particles in a Shallow Water Stream down a Steep Slope. J. Fluid Mech. 2008, 595, 83–114. [Google Scholar] [CrossRef]
  32. Bjerklie, D.M.; Moller, D.; Smith, L.C.; Dingman, S.L. Estimating discharge in rivers using remotely sensed hydraulic information. J. Hydrol. 2005, 309, 191–209. [Google Scholar] [CrossRef]
  33. Tan, M.L.; Latif, A.B.; Pohl, C.; Duan, Z. Streamflow modelling by remote sensing: A contribution to digital earth. IOP Conf. Ser. Earth Environ. Sci. 2014, 18, 012060. [Google Scholar] [CrossRef]
  34. Tauro, F.; Olivieri, G.; Petroselli, A.; Porfiri, M.; Grimaldi, S. Flow monitoring with a camera: A case study on a flood event in the Tiber River. Environ. Monit. Assess. 2016, 188, 118. [Google Scholar] [CrossRef]
  35. Stamhuis, E.J. Basics and principles of particle image velocimetry (PIV) for mapping biogenic and biologically relevant flows. Aquat. Ecol. 2016, 40, 463–479. [Google Scholar] [CrossRef]
  36. Adrian, R.J.; Westerweel, J. Particle Image Velocimetry; Cambridge University Press: Cambridge, UK, 2010. [Google Scholar]
  37. Hauet, A.; Creutin, J.D.; Belleudi, P. Sensitivity study of large-scale particle image velocimetry measurement of river discharge using numerical simulation. J. Hydrol. 2008, 349, 178–190. [Google Scholar] [CrossRef]
  38. González-Cao, J.; Barreiro-Fonta, H.; Fernández-Nóvoa, D.; García-Feal, O. Enhancing Flood Risk Management: A Review on Numerical Modelling of Past Flood Events. Hydrology 2025, 12, 133. [Google Scholar] [CrossRef]
  39. Balacumaresan, H.; Hossain, I.; Imteaz, M. Disaggregation of climate-projected rainfall using an empirical approach for design rainfall estimation. Am. J. Environ. Sci. Eng. 2025, 9, 59–67. [Google Scholar] [CrossRef]
  40. Faus, A. La ciudad de Valencia ante las riadas del Turia de 1776. Cuad. De Geogr. 1999, 65–66, 123–142. [Google Scholar]
  41. Alcrudo, F.; Mulet, J. Description of the Tous Dam Break Case Study (Spain). J. Hydraul. Res. 2007, 45, 45–57. [Google Scholar] [CrossRef]
  42. GVA Visor. Visor de Cartografía (Cartographic Viewer). Available online: https://visor.gva.es/visor/ (accessed on 15 November 2024).
  43. Smith, A.A.; Lee, K.B. The rational method revisited. Can. J. Civ. Eng. 1984, 11, 854–862. [Google Scholar] [CrossRef]
  44. Muñoz, R.; Soria, J.M.; Molner, J.V. Graphical materials for the evaluation of flows during an extreme flash flood event in the eastern Iberian Peninsula in October 2024. Zenodo 2025, 15492754. [Google Scholar] [CrossRef]
  45. Linsley, R.K. The relation between rainfall and runoff. J. Hydrol. 1967, 5, 297–311. [Google Scholar] [CrossRef]
  46. Holland, P.G. Manning formula. In Encyclopedia of Hydrology and Water Resources; Herschy, R.W., Fairbridge, R.W., Eds.; Encyclopedia of Earth Science; Springer: Dordrecht, The Netherlands, 1998. [Google Scholar] [CrossRef]
  47. Salah Abd Elmoaty, M.; El-Samman, T.A. Manning roughness coefficient in vegetated open channels. Water Sci. 2020, 34, 124–131. [Google Scholar] [CrossRef]
  48. Parílková, J.; Ríha, J.; Zachoval, Z. The influence of roughness on the discharge coefficient of a broad-crested weir. J. Hydrol. Hydromech. 2012, 60, 101. [Google Scholar] [CrossRef]
  49. Soria, J.M.; Muñoz, R.; Campillo-Tamarit, N.; Molner, J.V. Flash-Flood-Induced Changes in the Hydrochemistry of the Albufera of Valencia Coastal Lagoon. Diversity 2025, 17, 119. [Google Scholar] [CrossRef]
  50. Wang, Y.; Li, S.; Hu, C.; Ren, J.; Liu, P.; Zhao, C.; Zhu, M. Analysis of Surface Runoff Characteristics in Zhengzhou City under Extreme Rainfall Conditions. Sustainability 2024, 16, 6980. [Google Scholar] [CrossRef]
  51. Cánovas, M. Avenidas motivadas por las lluvias extraordinarias de los días 13 y 14 de octubre de 1957. Rev. Obras Públicas 1958, 106, 59–68. [Google Scholar]
  52. Romero-Aloy, M.J.; Almenar-Muñoz, M.; Fullana-Serra, V. En torno a la riada de 1957 en la ciudad de Valencia. Scr. Nova. Rev. Electrónica De Geogr. Y Cienc. Soc. 2019, 23, 622. [Google Scholar]
  53. Rosselló, V.M. La revinguda del Xúquer i el desastre de la Ribera. 20–21 octubre 1982: Una perspectiva geogràfica. Cuad. De Geogr. 1983, 32–33, 3–38. [Google Scholar]
  54. Serra-Llobet, A.; Tàbara, J.D.; Sauri, D. The Tous Dam disaster of 1982 and the origins of Integrated Flood Risk Management in Spain. Nat. Hazards 2013, 65, 1981–1998. [Google Scholar] [CrossRef]
  55. Legrand, P.; Brugnot, G.; Baumont, G. Rétour D’experience Des Inondations de Septembre de 2002 Dans les Départaments du Gard, de L’herault, du Vaucluse, des Bouches de Rhône, de l’Ardèche et de la Drôme. Contribution du Groupe d’Appui et D’expertise Scientifique 2003 (on CD-ROM). Available online: https://www.vie-publique.fr/files/rapport/pdf/034000547.pdf (accessed on 7 April 2025).
  56. Argence, S.; Lambert, D.; Richard, E.; Söhne, N.; Chaboureau, J.P.; Crépin, F.; Arbogast, P. High resolution numerical study of the Algiers 2001 flash flood: Sensitivity to the upper-level potential vorticity anomaly. Adv. Geosci. 2006, 7, 251–257. [Google Scholar] [CrossRef]
  57. Ministerio de Obras Públicas y Urbanismo. Las Inundaciones en la España Peninsular (Floods in Mainland Spain). Dirección General de Obras Hidráulicas. 1988. Available online: https://www.proteccioncivil.es/catalogo/naturales/cnih/cnih2014/PDF/B6/Documenta2/CTEI_JUCAR.pdf (accessed on 10 August 2025).
  58. Cánovas-García, F.; Vargas Molina, J. An exploration of exposure to river flood risk in Spain using the National Floodplain Mapping System. Geomat. Nat. Hazards Risk 2024, 16, 2421405. [Google Scholar] [CrossRef]
Figure 1. Study area, including the most significant watercourses and the areas that were flooded on 29 October 2024. The image shows yellow-orange coloring to denote suspended material. The existent hydrological network is delineated by blue lines, with arrows indicating the overflow points of the watercourses. City names are presented in red text and river names in blue. The image was modified from the Landsat-8 false color RGB image of 30 October 2024.
Water 17 03177 g001
Figure 2. The map details the locations of the measurement sites in the studied watercourses over a recent Landsat-8 image of the territory: 1, Pedralba; 2, Vilamarxant; 3, 18, and 23, Riba-roja; 4, Manises; 5, Quart de Poblet; 6, Repartiment; 7, Macastre; 8, Turís; 9, Llombai; 10 and 12, Carlet; 11, Algemesí; 13, Alzira; 14, Polinyà del Jucar; 15, Riola; 16 and 17, Chiva; 19, Calicanto; 20 and 21, Torrent; 22, Massanassa; 24, Picassent; 25, Almussafes.
Water 17 03177 g002
Figure 3. Workflow methodology employed at each study site visited. Picture and sketch by R.M.
Water 17 03177 g003
Figure 4. Flow data registered by the SAIH at the Huerto Mulet gauging station (site 14).
Water 17 03177 g004
Figure 5. Measures of the wet cross-section in Huerto Mulet gauge station (site 14).
Water 17 03177 g005
Figure 6. Data collected each hour by the SAIH at the Repartiment gauging station (site 6) in Turia river.
Water 17 03177 g006
Figure 7. Validation of estimated flow according to empirical method against the calculated flow according the Manning equation (n = 24, r = 0.9905, p < 0.001). The blue line indicates 95% interval regression and the brown line the 95% forecast interval.
Water 17 03177 g007
Figure 8. Cross-sections of Magro river at site 10 (Carlet) and site 11 (Algemesí) showing the reduction of the wetted section, from 1679 m2 to 243 m2, explaining why the water overflowed between these measurement points at several sites.
Water 17 03177 g008
Figure 9. Details of Magro and Jucar river areas and rice fields near the Albufera lagoon. Sites of control are indicated by blue numbers; overflood sites marked by red numbers.
Water 17 03177 g009
Figure 10. Cross sections of Poyo stream at site 21 (Torrent) and site 22 (Catarroja), showing the reduction in the wetted cross-section, from 2271 m2 to 205 m2, explaining why the water overflowed before this measurement point at several points.
Water 17 03177 g010
Figure 11. Details of Poyo and Picassent stream areas and rice fields near the Albufera lagoon. Sites of control indicated by blue numbers; overflowed sites marked by red numbers.
Water 17 03177 g011
Figure 12. Calculated peak flows (m3 s−1) in the location of the measurement sites (denoted with a star) in the studied watercourses (same sites as presented in Figure 2).
Water 17 03177 g012
Table 1. The sites of measurement and location in the geographical coordinate system, indicating the latitude and longitude.
SiteBasinRiverbedSite TownGeo LatGeo Long
1TuriaTuriaPedralba #39.5978−0.7216
2TuriaTuriaVillamarchante *#39.5811−0.6217
3TuriaTuriaRiba-roja #39.5491−0.5624
4TuriaTuriaManises *39.5195−0.5039
5TuriaTuriaQuart de Poblet *39.4864−0.4429
6TuriaTuriaRepartiment #39.4849−0.4383
7JucarMagroMacastre *39.3441−0.8257
8JucarMagroTurís39.3583−0.7266
9JucarMagroLlombai *39.3114−0.5766
10JucarMagroCarlet #39.2321−0.5199
11JucarMagroAlgemesí #39.1846−0.4368
12JucarBenimodoCarlet *39.2269−0.5408
13JucarJucarAlzira39.1551−0.4448
14JucarJucarPoliñá del Jucar *39.1883−0.4099
15JucarJucarRiola *#39.2031−0.3372
16PoyoChivaChiva #39.4729−0.7189
17PoyoChivaChiva39.4752−0.7182
18PoyoPoyoRiba-roja *#39.4734−0.5829
19PoyoGallegoCalicanto #39.4344−0.6184
20PoyoHortetaTorrent39.4379−0.4723
21PoyoPoyoTorrent #39.4404−0.4716
22PoyoPoyoMassanassa *#39.4102−0.4021
23PozaletPozaletRiba-roja39.4872−0.5381
24PicassentPicassentBeniparrell #39.3827−0.4029
25TramusserTramusserAlmussafes #39.2833−0.4143
Notes: * Site included in SAIH Jucar gauging network. # Site included in official network for visual flood level measuring.
Table 2. Results of the Jucar river sites indicating the wetted cross-section and hydraulic parameters to estimate the flows.
SiteSite NameWet Cross-Section Estimation (m2)Hydraulic Radius
(m)
Roughness
(%)
Slope
(%)
SAIH Flow
(m3 s−1)
Estimated Flow
(m3 s−1)
Manning Flow
(m3 s−1)
7Magro–Macastre112512.970.450.050-28133087
8Buñol–La Roda Noria11777.250.350.050-29432818
9Magro–Llombai13208.520.350.043-33003263
10Magro–Carlet16796.970.250.030-41984246
11Magro–Algemesí2434.190.170.026-608599
12Benimodo–Carlet2304.180.200.040-575597
13Jucar–Alzira7909.300.200.014-19752067
14Jucar–Huerto Mulet6037.830.180.012150015081448
15Jucar–Riola6367.990.180.010-15901412
Table 3. Results of the Turia river sites indicating the wetted cross-section and hydraulic parameters to estimate the flows.
SiteSite NameWet Cross-Section Estimation (m2)Hydraulic Radius
(m)
Roughness
(%)
Slope
(%)
SAIH Flow
(m3 s−1)
Estimated Flow
(m3 s−1)
Manning Flow
(m3 s−1)
1Pedralba11805.870.260.030-25962559
2Villamarchante9663.850.220.029176321251836
3Ribarroja9045.340.250.031-19891945
4La Presa8207.510.300.031-18041845
5Quart de Poblet8673.950.170.023197419071932
6Repartiment7284.070.200.030 16021606
Table 4. Results of the Poyo stream sites indicating the wetted cross-section and hydraulic parameters to estimate the flows.
SiteSite NameWet Cross-Section Estimation (m2)Hydraulic Radius
(m)
Roughness
(%)
Slope
(%)
SAIH Flow
(m3 s−1)
Estimated Flow
(m3 s−1)
Manning Flow
(m3 s−1)
16Crossing Chiva3596.240.270.090 8981352
17Below Chiva2844.540.250.080 710880
18Poyo (A3)6304.480.150.035228015753225
19Gallego2623.990.250.070 655697
20Horteta5957.490.250.040 14881823
21Torrent22719.270.300.035 56786250
22Massanassa2054.600.180.045 513668
23Pozalet1822.370.180.056 455425
24Picassent2962.920.170.030 740616
25Tramusser1993.440.170.025 498422
Disclaimer/Publisher’s Note: The statements, opinions and data contained in all publications are solely those of the individual author(s) and contributor(s) and not of MDPI and/or the editor(s). MDPI and/or the editor(s) disclaim responsibility for any injury to people or property resulting from any ideas, methods, instructions or products referred to in the content.