Abstract
Bathing water quality (BWQ) monitoring and prediction are essential to safeguard public health by informing bathers about the risk of exposure to faecal indicator bacteria (FIBs). Traditional monitoring approaches, such as manual sampling and laboratory analysis, while effective, are often constrained by delayed reporting, limited spatial and temporal coverage, and high operational costs. The integration of artificial intelligence (AI), particularly machine learning (ML), with automated data sources such as environmental sensors and satellite imagery has offered novel predictive and real-time monitoring opportunities in BWQ assessment. This systematic literature review synthesises current research on the application of AI in BWQ assessment, focusing on predictive modelling techniques and remote sensing approaches. Following the PRISMA methodology, 63 relevant studies are reviewed. The review identifies dominant modelling techniques such as Artificial Neural Networks (ANN), Deep Learning (DL), Decision Tree (DT), Random Forest (RF), Multiple Linear Regression (MLR), Support Vector Machine (SVM), and Hybrid and Ensemble Boosting algorithms. The integration of AI with remote sensing platforms such as Google Earth Engine (GEE) has improved the spatial and temporal solution of BWQ monitoring systems. The performance of modelling approaches varied depending on data availability, model flexibility, and integration with alternative data sources like remote sensing. Notable research gaps include short-term faecal pollution prediction and incomplete datasets on key environmental variables, data scarcity, and model interpretability of complex AI models. Emerging trends point towards the potential of near-real-time modelling, Internet of Things (IoT) integration, standardised data protocols, global data sharing, the development of explainable AI models, and integrating remote sensing and cloud-based systems. Future research should prioritise these areas while promoting the integration of AI-driven BWQ systems into public health monitoring and environmental management through multidisciplinary collaboration.
1. Introduction
Safeguarding the quality of bathing waters is a crucial public health and environmental priority [1,2]. Recreational waters, ranging from beaches and lakes to rivers, are integral to human well-being and environmental sustainability [2,3]. However, these waters are vulnerable to contamination from a variety of sources, including stormwater runoff, wastewater discharge, and agricultural activities [4,5,6]. BWQ monitoring is essential to detect and mitigate such contamination, with a primary focus on microbiological parameters such as Escherichia coli (E. coli) and intestinal Enterococci, which are associated with serious health risks, including gastrointestinal illnesses, respiratory infections, and, in extreme cases, death [7,8,9,10,11,12]. FIOs, such as E. coli and intestinal Enterococci, can serve as proxies for waterborne pathogens and provide crucial insights into the potential health risks for bathers [1,13]. Maintaining high BWQ is essential not only to prevent gastrointestinal infections and other waterborne illnesses, but also to make sure that recreational waters are kept safe and enjoyable for all users.
Globally, regulatory frameworks, such as the European Union’s Bathing Water Directive (2006/7/EC), the U.S. Environmental Protection Agency (USEPA) guidelines, and the World Health Organization (WHO) Recreational Water Quality Criteria, mandate stringent monitoring protocols to safeguard public health and ecological integrity [1,2,14,15]. BWQ monitoring relies heavily on traditional methods, which typically involve manual sampling and the laboratory analysis of faecal indicator organisms (FIOs) [15,16,17,18,19] to ensure legal compliance and to provide beachgoers with information on the risks of exposure to waterborne pathogens [1,2,10,14,15]. While effective, these methods are labour-intensive, costly, and time-consuming, often requiring 18 to 72 h to yield results, thereby limiting their responsiveness to dynamic environmental changes [20,21]. The Environmental Protection Agency (USEPA) recommends a threshold of 235 CFU/100 mL for E. coli in recreational waters [15]. Similarly, Health Canada sets a stricter threshold of 200 E. coli per 100 mL of water for safe bathing [19]. In Europe, the rBWD (2006/7/EC) mandates monitoring at least two faecal bacteria types, such as E. coli and Enterococci, to safeguard public health and complement other EU water directives [14]. The Directive classifies water quality for E. coli into four categories: Insufficient, Adequate, Good, and Excellent, with thresholds of 250 CFU/100 mL for “Excellent” and 500 CFU/100 mL for “Good” and “Sufficient”. BWQ can be influenced by factors such as complex pollutants (chemical, physical, and biological) and nutrient overloads, intense rainfalls, tidal patterns, and anthropogenic activities [22,23,24,25]. Detailed information about the levels of FIBs under different regulatory criteria is provided below.
Under the U.S. Environmental Protection Agency’s (EPA) 2012 Recreational Water Quality Criteria (RWQC), states are required to adopt one illness-rate benchmark statewide and apply both the geometric mean (GM) and Statistical Threshold Value (STV) concurrently. For Option A (36 NGI/1000), the criteria specify the following: Enterococci GM 35 and STV 130 cfu/100 mL (marine and fresh water); E. coli GM 126 and STV 410 cfu/100 mL (fresh water only). For Option B (32 NGI/1000), the corresponding values are Enterococci GM 30 and STV 110 cfu/100 mL; E. coli GM 100 and STV 320 cfu/100 mL. In both cases, the GM must not exceed the selected value in any 30-day interval, and no more than 10% of samples may exceed the STV within the same period. Beach Action Values (BAVs) serve as precautionary triggers, defined as follows: for 36 NGI, Enterococci 70 cfu/100 mL, E. coli 235 cfu/100 mL, and qPCR Enterococcus spp. 1000 cce/100 mL; and for 32 NGI, Enterococci 60 cfu/100 mL, E. coli 190 cfu/100 mL, and qPCR Enterococcus spp. 640 cce/100 mL [1].
Under the European Union Bathing Water Directive (2006/7/EC), classification is based on percentile (95th and 90th percentiles). For inland waters, the percentile concentration values defining Excellent, Good, and Sufficient quality are Intestinal enterococci: 200 (95th), 400 (95th), 330 (90th) cfu/100 mL, and E. coli: 500 (95th), 1000 (95th), and 900 (90th) cfu/100 mL, respectively. For coastal and transitional waters, the corresponding values are intestinal Enterococci 100 (95th), 200 (95th), 185 (90th) cfu/100 mL, and E. coli: 250 (95th), 500 (95th), and 500 (90th) cfu/100 mL [2].
The Canadian Recreational Water Quality Guidelines establish primary-contact thresholds as follows. For freshwater, the geometric mean should not exceed 200 E. coli/100 mL (based on a minimum of five samples), with a single-sample maximum of 400 E. coli/100 mL. For marine waters, the geometric mean should not exceed 35 Enterococci/100 mL (minimum of five samples) and the single-sample maximum should not exceed 70 Enterococci/100 mL. These values are summarised in the guideline tables. For cyanobacterial risk, the guideline specifies total cyanobacteria ≤ 100,000 cells/mL or total microcystins ≤ 20 µg/L (expressed as microcystin-LR), with the 20 µg/L value representing the recreational water benchmark [3].
In recent years, the emergence of AI, particularly ML and DL, has ushered in a transformative era for BWQ assessment. AI techniques, such as ANNs, SVM, and Long Short-Term Memory (LSTM) networks, offer powerful tools for real-time monitoring, predictive modelling, and spatial analysis, addressing the limitations of conventional approaches [26,27,28]. These models can integrate diverse environmental parameters such as turbidity, temperature, and precipitation to forecast FIO levels with greater accuracy and timeliness than conventional approaches [26,27,29]. Furthermore, AI-driven systems can support early warning mechanisms, optimise resource allocation, and enhance decision-making processes in water quality management [30].
Despite the growing body of literature on AI applications in BWQ monitoring, existing studies often focus on specific regions, water types (e.g., freshwater vs. coastal), or modelling techniques, thereby limiting their generalisability [10,31,32,33]. A comprehensive synthesis that evaluates AI-driven BWQ assessment across diverse geographic and environmental contexts is urgently needed to bridge these knowledge gaps and inform future research and policy. This systematic review aims to critically examine the state-of-the-art applications of AI in BWQ assessment, with a focus on emerging trends, persistent challenges, and future opportunities. Specifically, it addresses the following research questions:
- What are the key parameters influencing bathing water quality?
- Which AI-based modelling techniques are most effective for BWQ prediction?
- What are the significant research gaps and future directions in AI-driven BWQ assessment?
To achieve these objectives, the review employs the PRISMA methodology to identify and analyse relevant studies, compares modelling approaches, and proposes a conceptual framework for AI-based BWQ prediction. By offering a holistic perspective, this study seeks to advance the scientific understanding of AI’s role in BWQ management and support the development of more resilient and responsive monitoring systems.
2. Review Methodology
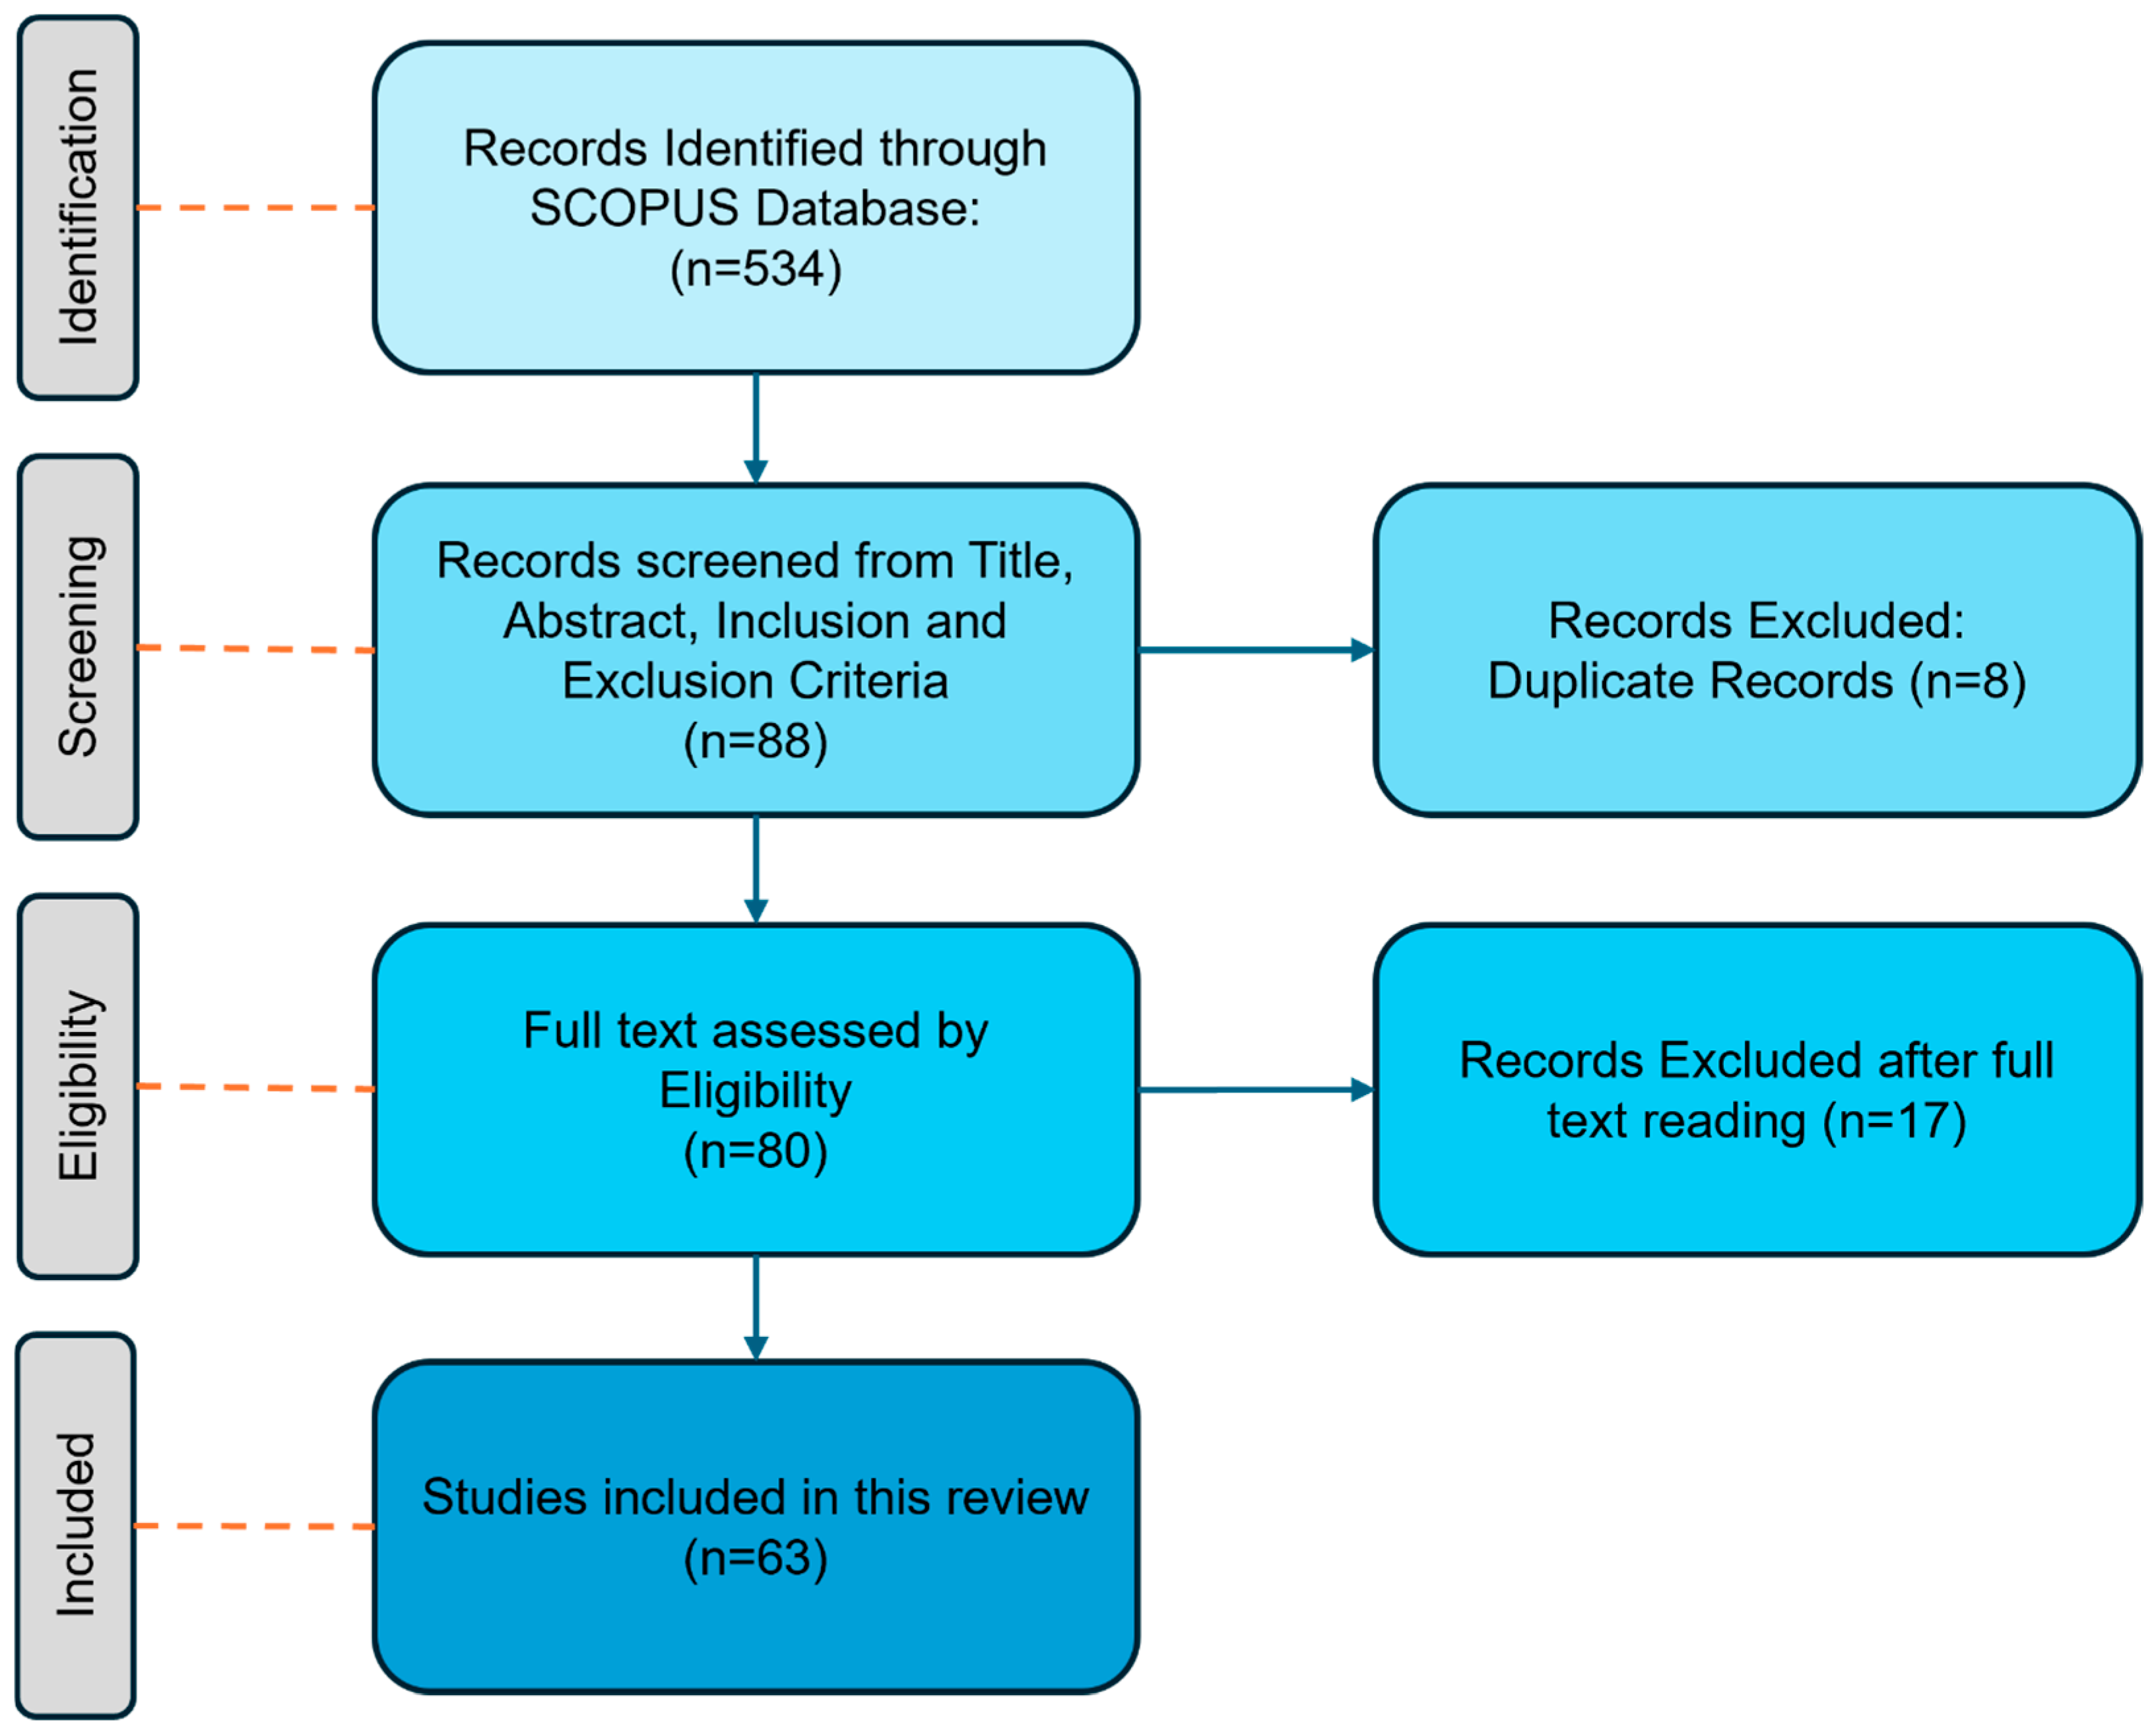
This systematic literature review adhered to the PRISMA (Preferred Reporting Items for Systematic Reviews and Meta-Analyses) [34] guidelines to ensure transparency, reproducibility, and methodological rigour (Figure 1). The framework comprises four stages, namely, Identification, Screening, Eligibility, and Inclusion [35], which were applied to select studies on AI-enabled BWQ prediction using FIB outcomes.
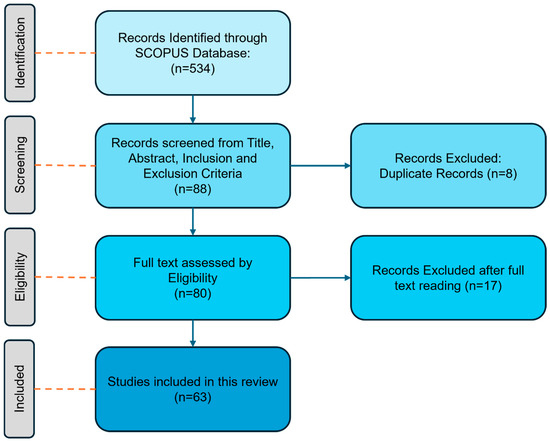
Figure 1.
A systematic PRISMA methodological approach was adopted in this study.
The identification phase involved the creation of twenty keyword sets, each containing two search terms, to comprehensively capture relevant studies on FIBs, AI, and BWQ. The keyword search queries are shown in Table 1 while the detailed search strings are provided in Table A1 (Appendix A).

Table 1.
List of keywords used in the identification process.
Searches were conducted in the Scopus database using these keywords to identify peer-reviewed articles. The filtering process helped eliminate irrelevant studies, as shown in Table 2, refining the search results to articles most relevant to BWQ prediction using AI techniques.

Table 2.
The inclusion and exclusion criteria that were followed within this study.
Following the initial search, 534 studies were retrieved. To refine the dataset, an initial screening was conducted based on reading the title and abstract. The exclusion criteria at this stage included the following:
- Studies not focused on BWQ prediction.
- Non-English publications.
- Studies outside the publication timeframe (2001–2024).
After this preliminary screening, 446 studies were excluded, leaving 88 studies that met the inclusion criteria. An additional 8 duplicate studies were identified and removed, resulting in 80 unique studies proceeding to the next phase.
In this phase, full-text articles of the 80 shortlisted studies were assessed. A further 17 studies were excluded due to the following:
- A focus on water quality assessments other than BWQ.
- The use of alternative water quality scaling parameters rather than FIBs.
- A lack of alignment with the Bathing Water Directive (BWD) standards.
To be considered for synthesis, a study needed to meet all three key focus areas outlined in Table 2.
Following the eligibility assessment, 63 studies were selected for this review. These studies give insights into the value of AI-driven approaches in BWQ prediction, covering a diverse range of methodologies, environmental parameters, and predictive modelling techniques.
For each study, the following parameters are reported: location, parameters, modelling techniques, best performing model, and performance metrics.
3. Parameters Influencing BWQ
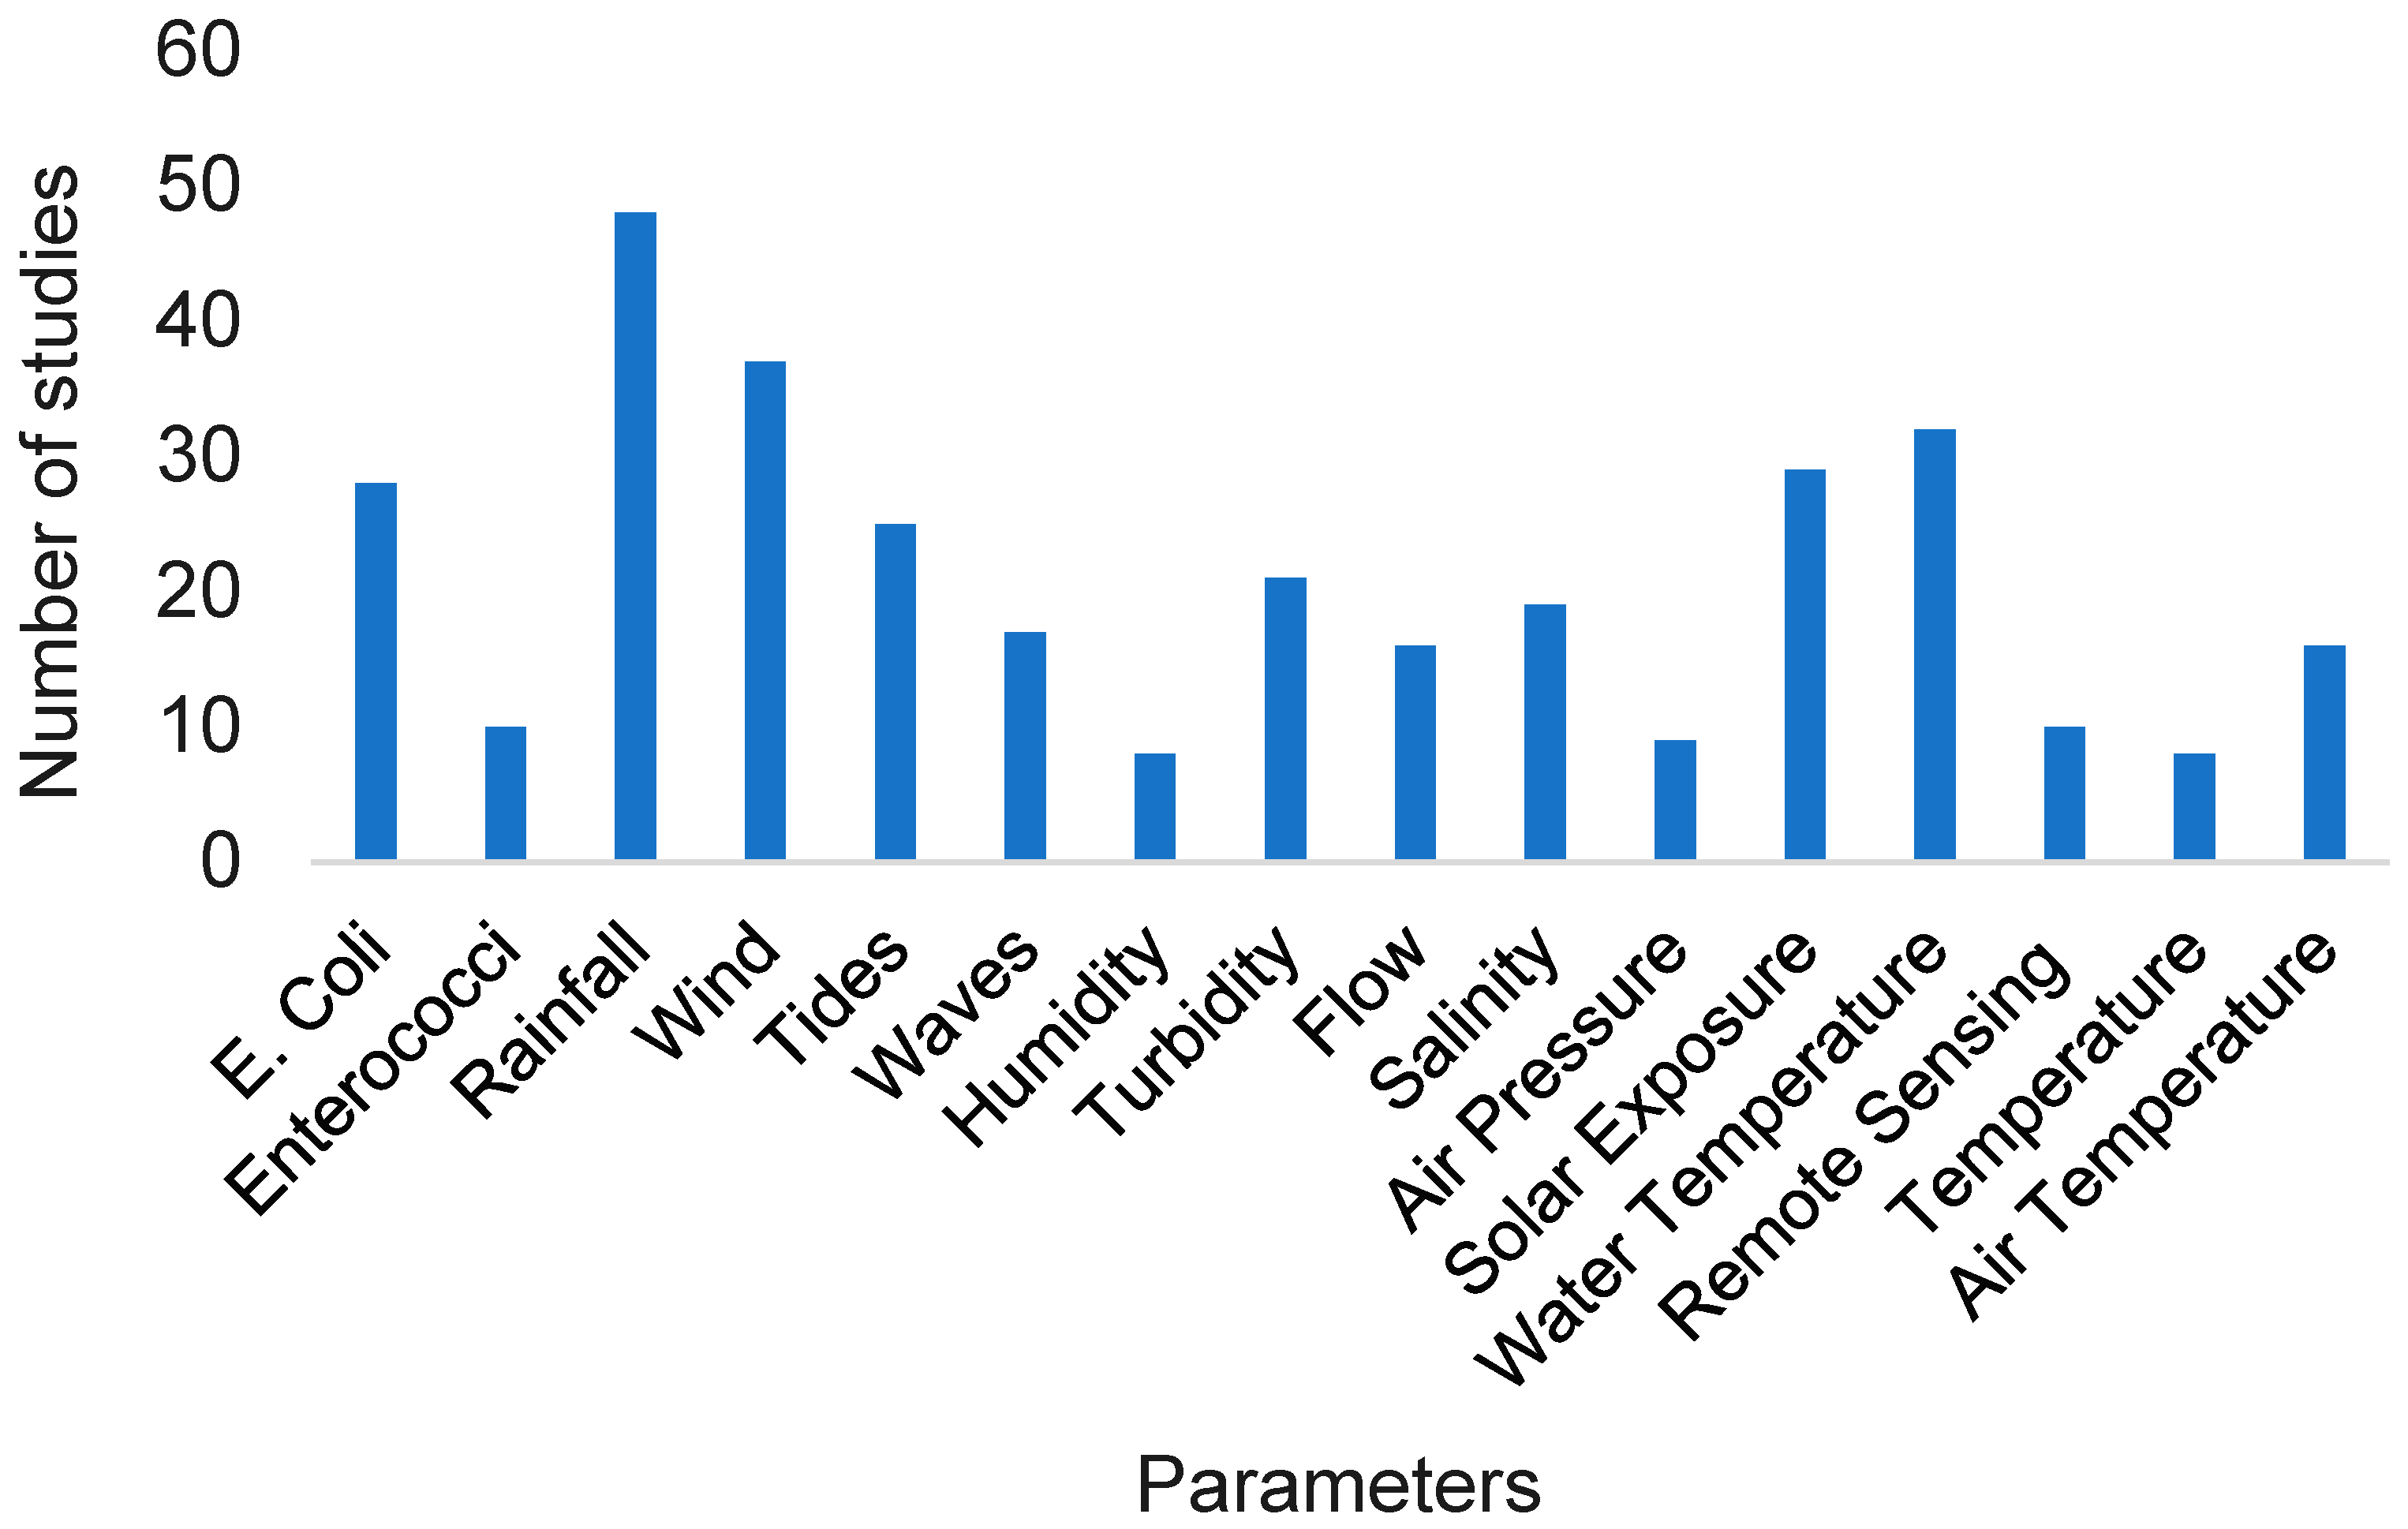
Recent studies emphasise the importance of identifying the environmental parameters that shape BWQ, thereby enabling more accurate predictive models. Various factors, including FIB concentrations, meteorological conditions, and hydrological parameters, play a critical role in affecting BWQ, as illustrated in Figure 2 and Table 3.
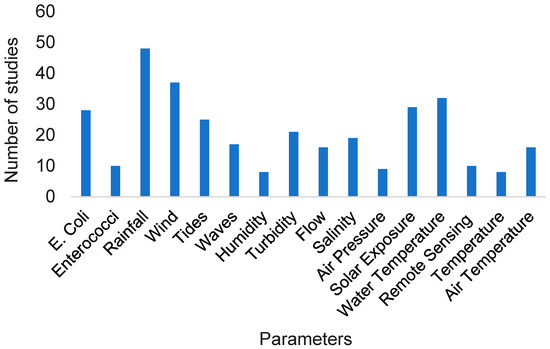
Figure 2.
Most widely used parameters for modelling bathing water quality.

Table 3.
Summary of key influencing factors.
3.1. FIBs and Contamination Sources
Elevated FIB levels are frequently detected in marine and freshwater environments, with excessive concentrations associated with seaweed [13], and swimmer activity during peak recreational seasons at densely populated beaches further exacerbates contamination levels [14]. Extreme weather events, such as combined sewer overflows, can transport contaminants from urban or agricultural sources into recreational and coastal waters, causing sharp increases in bacterial pollution [4]. The decay rate of the FIBs is further modulated by parameters such as turbidity and salinity [15]. Coastal areas affected by sea-level rise have reported recurrent Enterococci exceedances [16].
Quantification methods include ISO 9308-1 and 9308-3 standards and membrane filtration on mEI agar, which remain widely used to enumerate bacteria at bathing sites [36,37,38]. These methods, particularly when applied at peak bathing times, provide crucial datasets for modelling contamination dynamics.
3.1.1. Sampling Strategies and Standardisation
Sampling frequencies vary across studies, ranging from weekly [19] to biweekly [20], while in some employ geometric means of the last five E. coli counts to enhance statistical robustness [21]. To improve contamination detection, samples are often collected during high-use periods (e.g., 11:30 a.m. or 6:00 p.m. [38,39], within a broader 5 a.m. to 9 p.m. time range, having the highest frequency of collection at 11:00 a.m. [19], or between 9:00 a.m. and 10:00 a.m.) [23]. Some studies applied log transformations to E. coli concentration data to correct for skewness and variance, ensuring more reliable predictive modelling [16,40,41].
3.1.2. Regulatory Thresholds and Sampling Depth
International regulatory agencies have defined threshold limits for safe recreational water. Health Canada sets a limit of 200 CFU/100 mL of E. coli [3], while the United States Environmental Protection Agency (USEPA) standard is slightly higher at 235 CFU/100 mL [26]. In Europe, the Bathing Water Directive (2006/7/EC) mandates the classification of waters into four quality categories based on E. coli and Enterococci counts.
Sampling depth is also standardised: water samples should be collected 20–30 cm below the surface to minimise variability and ensure comparability across studies [15,21].
3.2. Meteorological and Hydrodynamic Factors
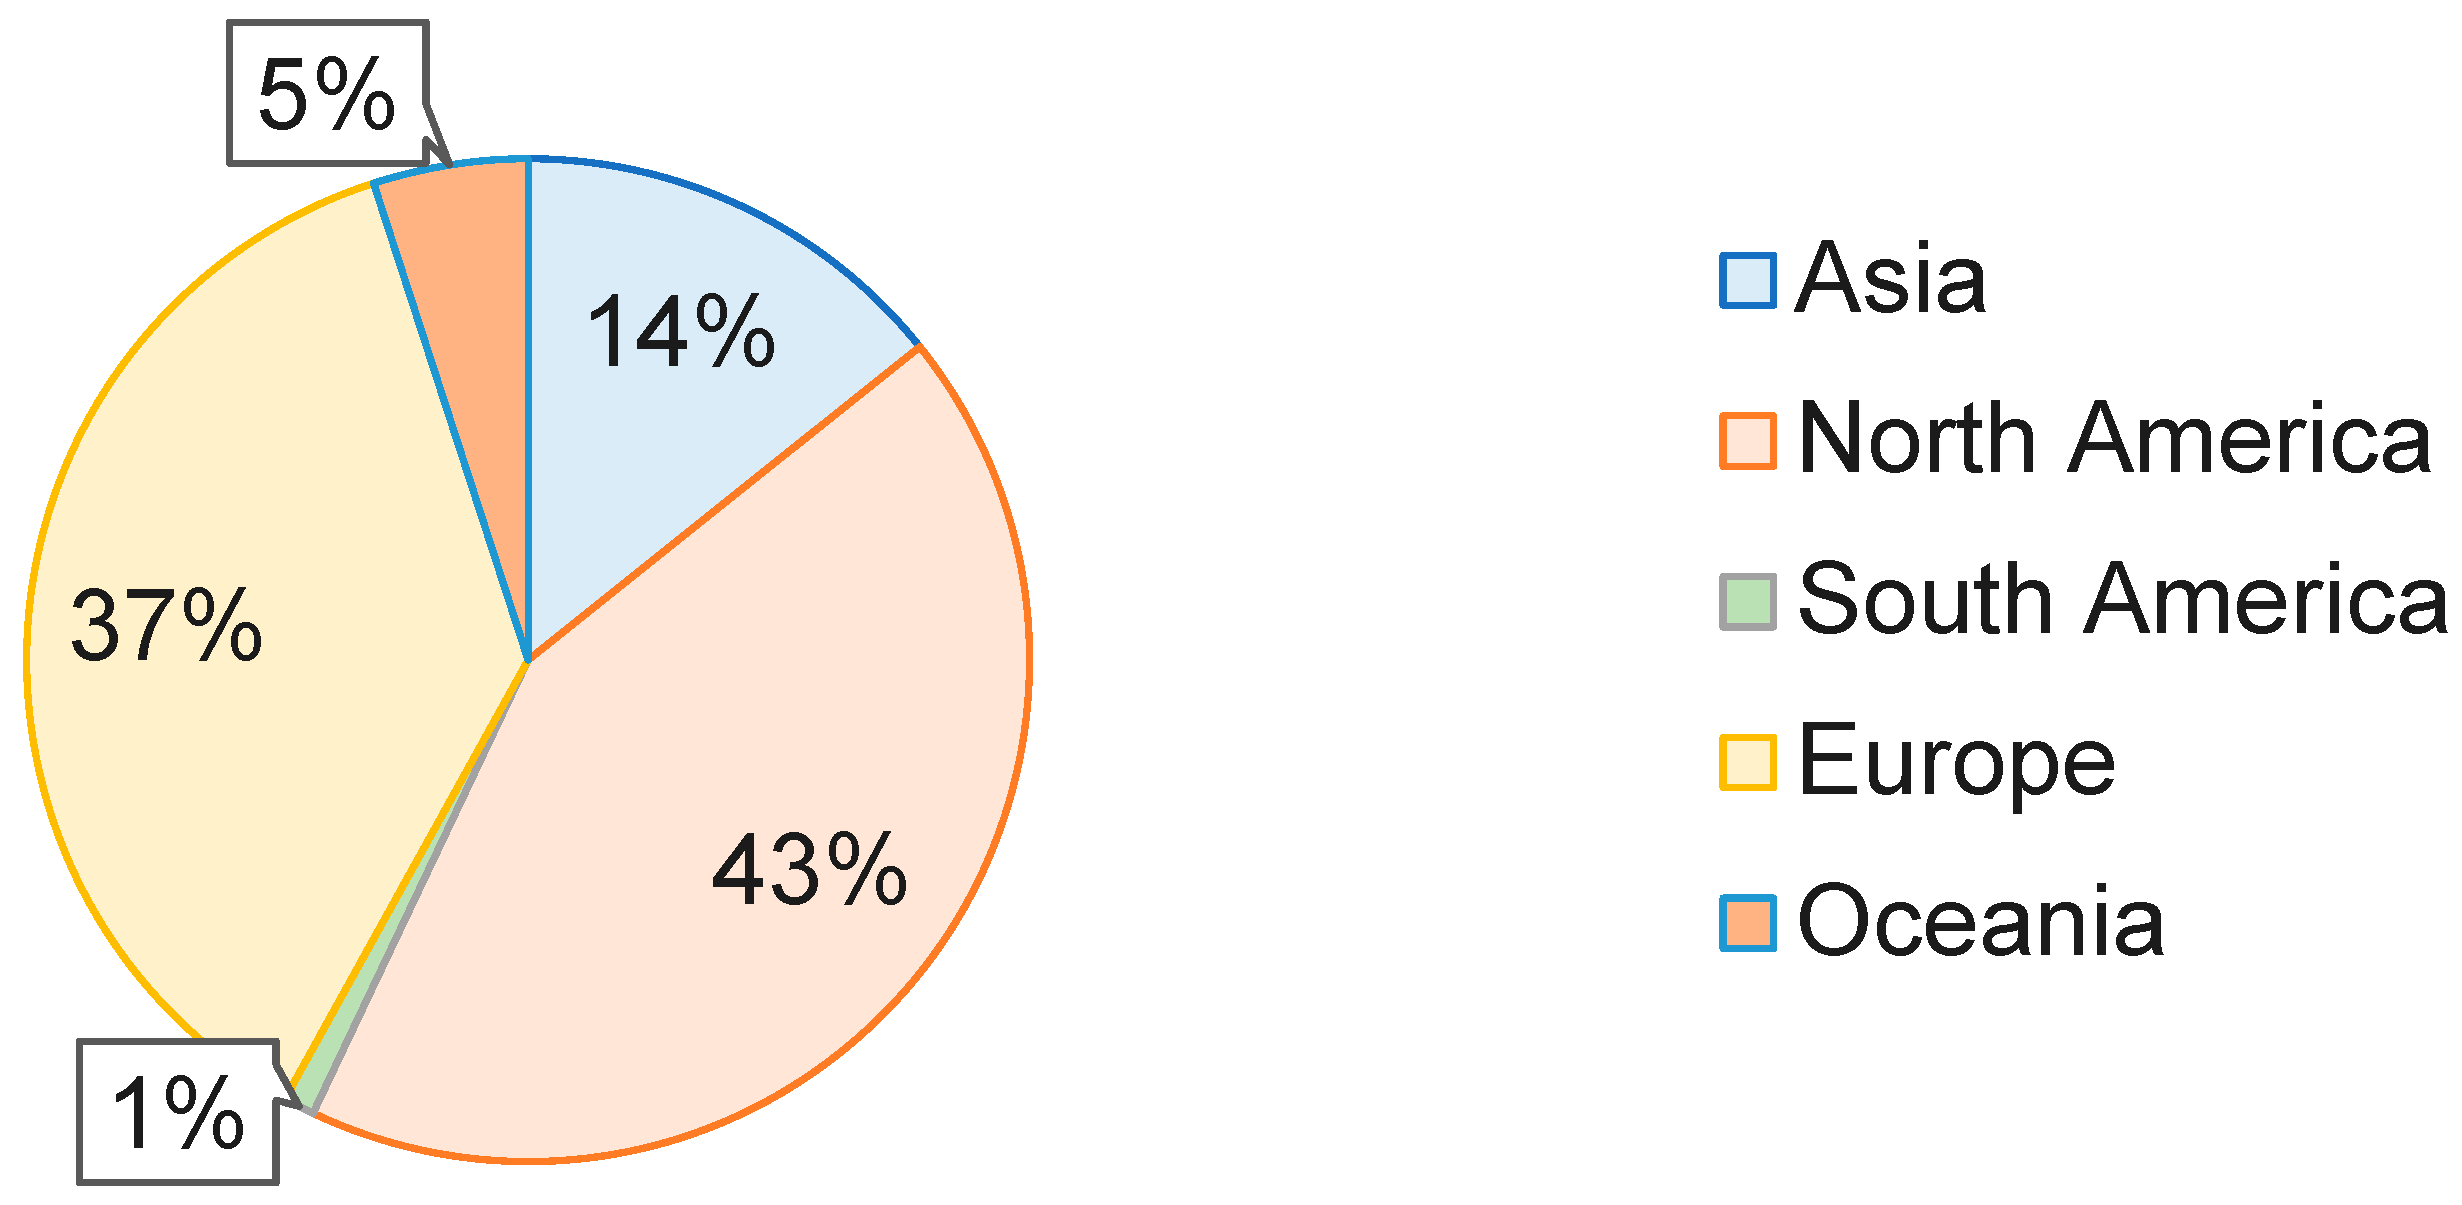
Meteorological and hydrodynamic parameters are of core importance in the distribution and persistence of FIOs at bathing sites. They affect the contamination transport, dilution, and survival rates, directly impacting water quality and public health. Among them, rainfall, tidal movements, wave action, wind dynamics, sunlight exposure, and salinity levels are the most significant, as highlighted in previous studies. The geographical classification of the studies can be seen in Figure 3.
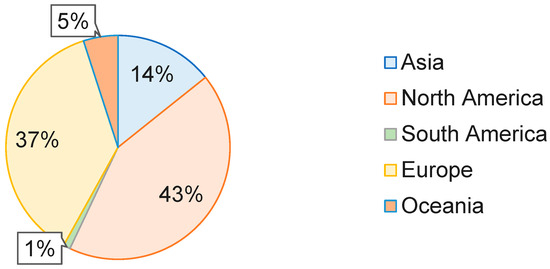
Figure 3.
Geographical classification of the studies under review.
3.2.1. Rainfall and Runoff
Rainfall is the key indicator of FIB levels, with high-intensity storms often overwhelming drainage systems, leading to overflowing sewers, increased runoffs from farmlands, and elevated contamination [4]. Studies incorporate daily, cumulative, or hourly rainfall measurements, often with lag periods of three to seven days, to quantify impacts [2,3,16,25]. Rainfall has been used as a catchment component of the models [28]. Log-transformed rainfall datasets are used to address skewed distributions [23].
3.2.2. Tides and Waves
Tides and currents redistribute FIBs from their source to distant bathing waters in coastal regions [29]. Flood tides can elevate FIB concentrations by mixing polluted waters, whereas ebb tides dilute them [7]. Numerous studies took into account tidal parameters, including tidal range, which is the average difference between the previous high and low tide. Additionally, the tidal cycle, including neap and spring tides, as well as the tidal state (ebb and flood) within a 24 h cycle, was analysed [19]. Wave characteristics, such as the dominant (DPD) and average (APD) wave periods [23], wave height, and direction [28,29,30], also affect bacterial dispersion.
3.2.3. Wind Speed and Direction
Wind speed and direction influence FIB transport, particularly high wind speeds, which resuspend FIBs from shoreline sediments [6,7]. Nevertheless, wind speed is only significant when the collection site is close to a source like a sewer outfall downstream [33]. In the studies reviewed, various wind-related datasets were considered in relation to BWQ prediction. Most commonly, wind speed and direction were analysed across multiple studies [2,16,32]. In addition, gust speed was examined in some cases [5]. The impact of on-shore [21] and offshore winds [35] were also explored as influential factors affecting water conditions. These datasets were used as features for understanding the dynamics of the bathing waters.
3.2.4. Sunlight Exposure and Salinity Effects
Sunlight and salinity are critical to FIB persistence in bathing waters [9,16]. Solar radiation contributes to bacterial inactivation by damaging DNA and cellular structures [35]. In the reviewed studies, multiple solar-related parameters were utilised, such as cumulative solar exposure, total sunshine hours over defined intervals (24/48/72 h), cloud cover, and UV index (including cumulative UV exposure and maximum UV dose) [19]. Additionally, weather parameters such as air and water temperature [15,35], last day solar radiation [21], and water surface temperature [2,18,35] were also analysed across several studies.
These standard parameters can be utilised to develop a BWQ predictive model. However, the selection of input features should be guided by the size, quality, and availability of the dataset to minimise the risk of overfitting.
4. Predictive Modelling Approaches
4.1. Model Comparison
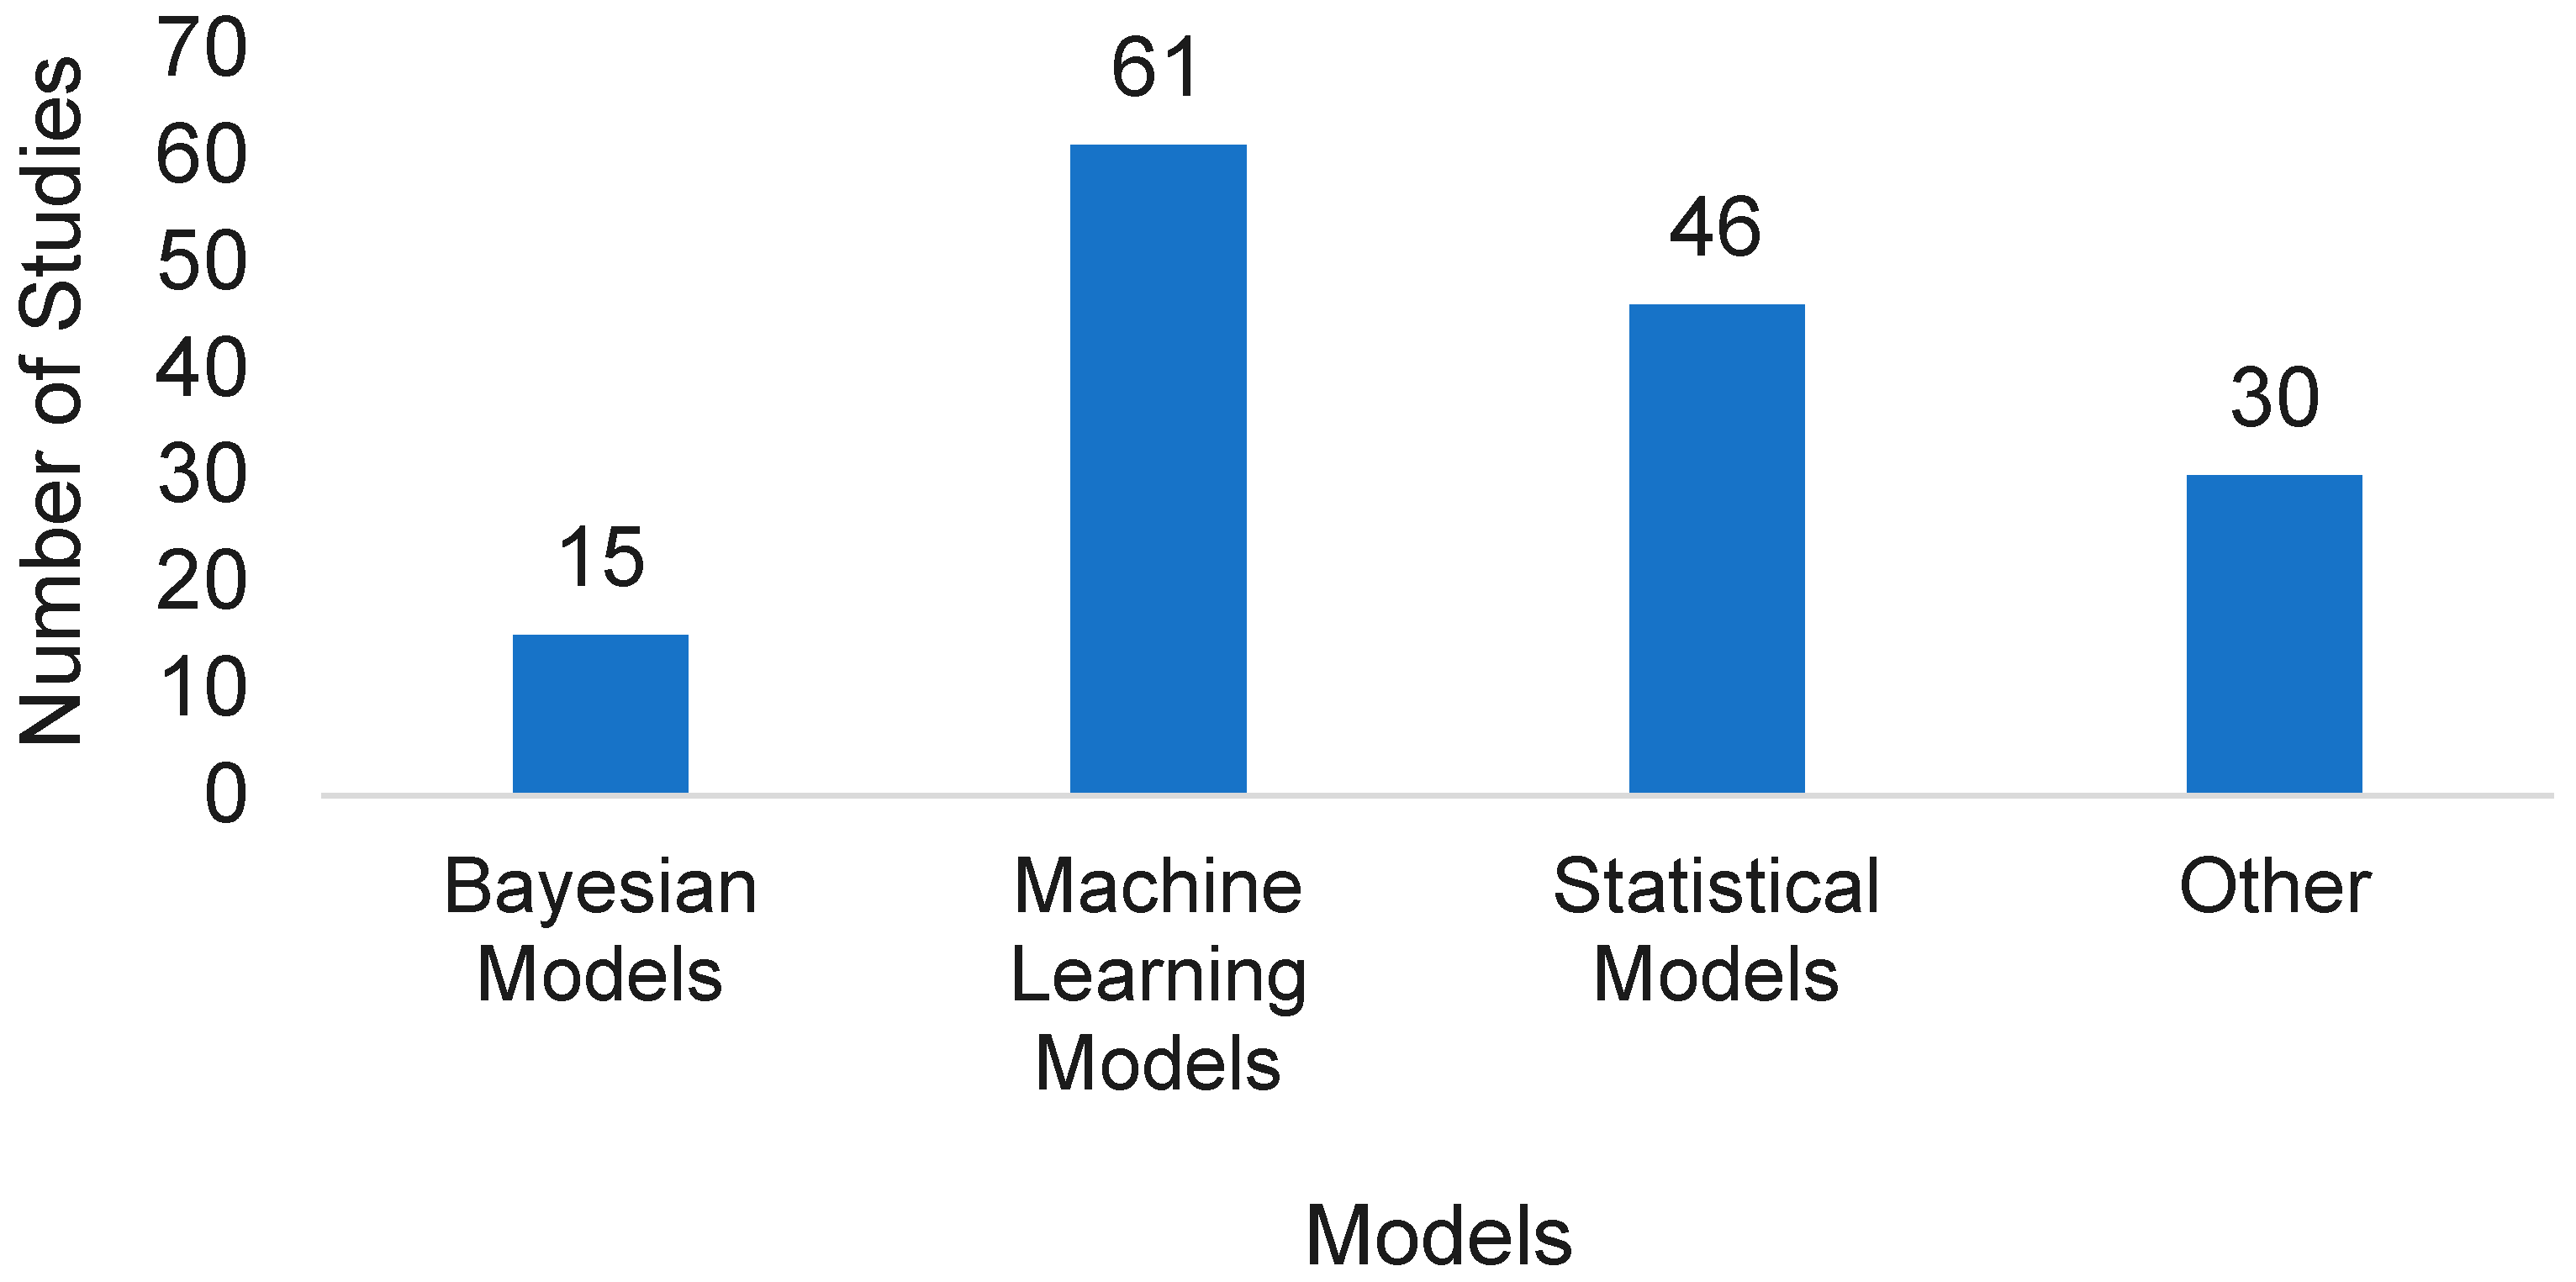
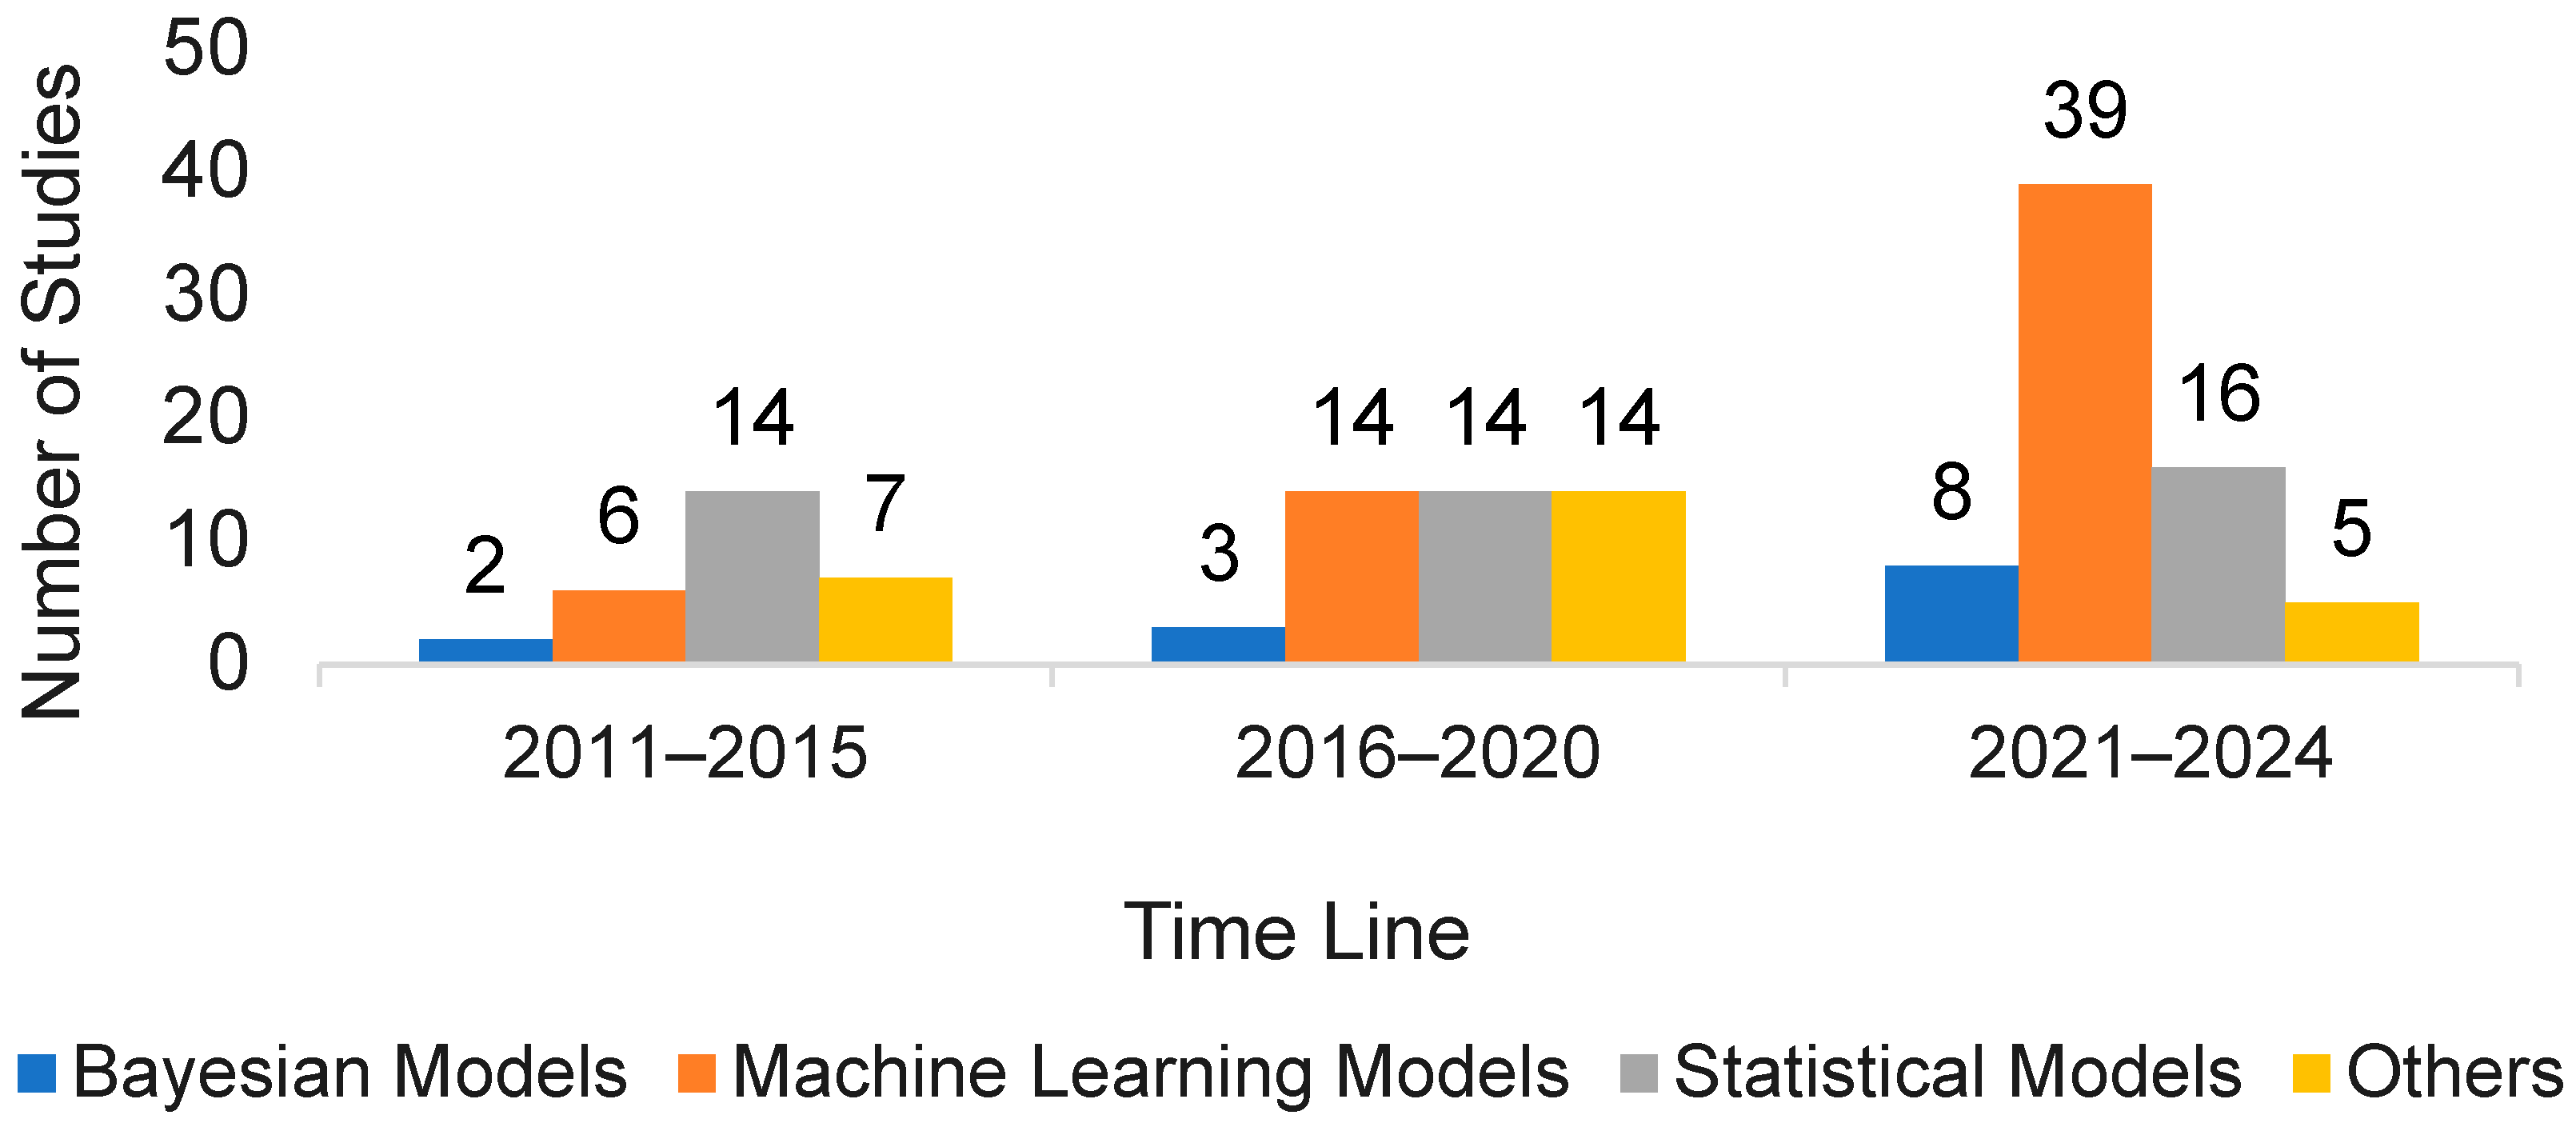
The review covers studies from 2001 to 2024. Between 2001 and 2005, most studies employed traditional statistical approaches to analyse BWQ. For instance, several studies employed statistical regression models [5,42]. In addition, Boehm and Weisberg [43] applied analyses of variance (ANOVAs) to study water quality trends, reflecting an early reliance on classical statistical methods during this period. In the 2011–2015 period, significant advancements in predictive modelling were observed. Shutler et al [44] introduced AlgaRisk, a web portal for water quality prediction, while Thoe et al [23] compared five models, including an ANN and classification trees (CT), finding that the ANN model reduced errors in beach postings. A 3D deterministic hydrodynamic model was also built to forecast water quality every day [45]. Brooks et al [46] automated the MLR model using PLS. From 2016 to 2020, ML models began to dominate BWQ prediction. ANN and SVR techniques were shown to perform well, with ANNs typically outperforming SVR [47]. A modelling technique combining two models using MLR and CTs was recommended; according to the author, MLR struggles to capture “very poor” WQ levels as the E. coli concentration exceeds 610 count/100 mL, and CT is more accurate [48]. Brooks et al [49] compared 14 regression methods, concluding that RFs were the most accurate for water quality predictions across seven beaches. Between 2021 and 2024, Bayesian approaches gained traction, and studies explored the use of Bayesian updating for data-scarce environments [6], with semi-naïve Bayesian networks (BNs) transferred across multiple sites [19]. Figure 4 illustrates the trend in the choices of the models by researchers for the period of 2001–2024. The “Other” category consists of process-based, hydrodynamic, and baselines (Geometric Mean), whereas Figure 5 shows the trend of models changed with time from 2011 to 2024. Other studies employed Bayesian log-normal mixed effects regression models [5] as well as used the Cogent Confabulation classifier [50]. Various algorithms, such as DTs, ANNs, and Bayesian belief networks, performed well [18], while optimised neural networks showed superior results in other studies [37]. Bourel et al. [38] tested 52 candidate algorithms and found that stratified RFs and SVMs (especially when combined with techniques like SMOTE) were identified as top performers for water quality prediction.
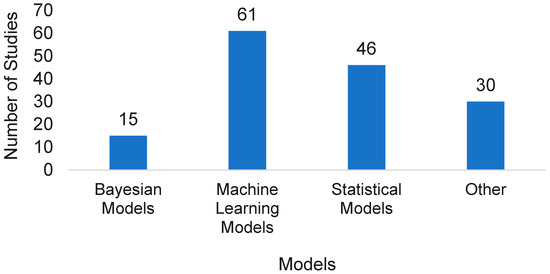
Figure 4.
Number of models and their classification used in the reviewed studies.
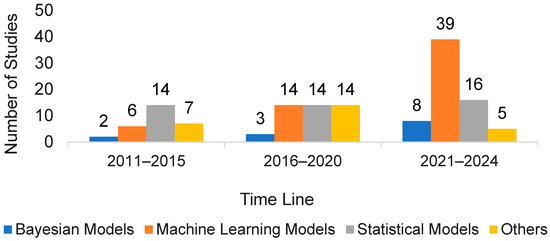
Figure 5.
Trend of models in use.
4.2. Modelling Approaches Employed for Predicting BWQ
Given below are some commonly used modelling techniques in the field of BWQ monitoring and prediction.
4.2.1. Bayesian Networks
Bayesian models offer a robust approach to improving BWQ predictions by effectively managing uncertainty and adapting to different hydrological conditions. For example, state/cluster-based Bayesian methods, like manual state setting and Dirichlet process clustering, outperform traditional models such as RF and zero-model, reducing the risk of missed pollution events and enhancing the management of water security [6]. In addition, Bayesian regression modelling has been used to set up an early warning system based on European bathing water legislation [51]. Complex variable interactions can be investigated using Bayesian belief networks (BBNs) for the prediction of FIBs in real time [52]. Bayesian log-normal mixed-effects regression models have also been used to estimate geometric predictors for E. coli concentrations [5]. Integrating BNs into ML pipelines allows for flexible calibration and validation methods [19]. Inference and interval estimates were improved through Bayesian-MLR by applying a log-normal residual distribution to match the high variance of FIB concentrations, while principled feature selection was supported by the leave-one-out information criterion (LOO-IC) to prevent overfitting and ensure realistic predictions [53]. Traditional methods were surpassed by Bayesian belief networks (BBNs), which achieved over 75% accuracy for FIBs and E. coli by leveraging probabilistic integration of hydrometeorological and turbidity parameters, thereby offering a practical solution for real-time, risk-based microbial monitoring in limited-resource contexts [39]. Semi-naïve BN structures were found to be transferable across estuarine sites without the significant loss of predictive performance, while also providing a transparent framework to visualise Enterococci distributions, stormwater impacts, and health risk uncertainties under varying conditions [19]. Integrated Bayesian learners within a stacking framework were also found to be promising, with the inclusion of BN models shown to enhance the capture of nonlinear dependencies and uncertainty, thereby improving the robustness of BWQ predictions [35]. BN-based approaches have demonstrated superior robustness, transparency, and adaptability compared to traditional methods.
4.2.2. Artificial Neural Networks
ANNs are highly effective in solving complex, nonlinear problems due to their powerful parallel processing capabilities and flexible training mechanisms, such as backpropagation, which allow them to adjust network weights and thresholds [30,39,49,53]. These attributes make ANNs particularly well suited for modelling FIOs at extreme concentrations, both high and low [54]. ANNs are typically composed of three layers: input, hidden, and output, interconnected through nodes [23]. The input nodes represent parameters and the output nodes represent the target variable [55]. In the field of water resources, ANNs are utilised effectively in tasks like algal prediction and water quality forecasting [18]. ANNs can emulate complex process models with minor losses of accuracy while shortening forecasting run time [56]. Deep Neural Networks (DNNs), a more advanced version of ANNs, have demonstrated superior performance in predicting coastal water quality [36]. Additionally, ANN models have shown better predictive accuracy compared to Support Vector Regression (SVR) when forecasting levels of E. coli and Enterococci in training and validation phases [47]. Complex nonlinear relationships were effectively modelled by a multilayer perceptron (MLP), which employed adaptive learning and backpropagation to minimise prediction error [55,56]. ANNs were also reported as being relatively simple to implement, capable of delivering rapid responses in real time, and effective at handling dynamic and noisy datasets [57]. More recently, a federated learning approach enhanced by knowledge distillation was applied, with the FedKD framework outperforming baseline federated and centralised models by achieving near-perfect scores in accuracy, precision, recall, and F1 at selected monitoring stations [58].
4.2.3. Decision Tree
CT outperformed MLR, BLR, PLS, and ANN when forecasting FIB exceedances, with CT achieving a positive correlation of 80% with observed exceedances and performing particularly well under rainfall and flow-dominated conditions [59]. Subsequent work confirmed that CTs could detect between 44% and 69% of high-risk events, while maintaining low false alarm rates [48]. The comparative analysis of five modelling techniques also demonstrated that CTs and ANNs substantially outperformed existing beach advisory methods, with CTs correctly predicting 42% of exceedances, showing the utility of data-driven models for timely warnings on Californian beaches [23]. Searcy et al [60] carried out a study on short-term, high-frequency (HF) beach sample collection to train predictive models. RF consistently performed better than Generalised Least Squares (GLS) and ANNs. More recently, RF again achieved the highest median AUC of 0.60 over BLR, SVM, and GBM, all of which outperformed persistence benchmarks, offering a framework capable of supporting timely public warnings by beach management authorities [20].
4.2.4. Multiple Linear Regression
MLR is the most commonly utilised modelling technique in predicting FIB concentrations, particularly in beach environments [18,21]. The foundation of MLR and other early forecasting techniques, such as linear regression and logistic regression, has also facilitated classification tasks, predicting binary dependent variables from a set of independent variables [18]. Furthermore, recent investigations have incorporated least-angle regression (LARS) modelling to evaluate the efficacy of statistical predictive techniques [17]. Logistic regression can capture binary exceedance probabilities, providing clearer decision support for beach closures [61]. Data-based MLR models have been noted as being simple to set up, effective in capturing general trends, and preferable for routine daily forecasting [8,60]. The adaptability of MLR has been demonstrated through location-specific tuning and the incorporation of additional features such as sky–weather conditions, with such models outperforming persistence approaches and achieving accuracies of up to 78% [62]. Integration with physically based hydrological models has further improved MLR performance by capturing storm-driven nonlinear bacterial spikes and reducing false alarms by 73% [59]. The deployment of MLR within daily systems, such as the WATERMAN platform in Hong Kong, has resulted in more accurate advisories than traditional monitoring [63]. Logistic regression has been highlighted for its ability to predict exceedances in advance and provide interpretable risk estimates, thereby overcoming laboratory delays and better aligning with managerial decisions [64]. Site-specific MLR models have also been implemented within decision-support systems using real-time inputs, achieving up to 88% correct predictions of advisories and proving transferable to other coastal settings [65].
4.2.5. Support Vector Machines
ML algorithms, particularly SVMs, have emerged as effective tools in water resource management for water quality monitoring, and are recognised as a leading advanced technique of statistical learning. The SVM is widely utilised within this domain [15,50]. Like Linear Discriminant Analysis (LDA), SVMs aim to identify hyperplanes that separate different groups of observations; however, the SVM distinguishes itself by maximising the margin of separation between these groups without necessitating specific assumptions about the data distribution, a flexibility that LDA lacks. When data cannot be perfectly linearly separated, SVMs can map observations into a higher-dimensional space, where achieving separation becomes more feasible [18].
4.2.6. Hybrid and Ensemble Models
Hybrid and ensemble models are emerging by integrating DL, ML, and statistical techniques, outperforming their standalone counterparts; for example, to avoid unnecessary iterations, DL models could be improved with other techniques like event-triggered learning, and ensemble frameworks can also merge the strengths of various forecasting models to boost prediction accuracy. However, simply combining multiple models could lead to an increase in complexity and could result in overfitting; therefore, optimal weight assignment is required for the integration of the different models [66]. A combined modelling approach has also been proposed by using CT and MLR, as the linear models have been considered weak at capturing occasional poor WQ events [48]. In certain cases, it might be a better option to make an ensemble of models to explore the range of forecasting outcomes and assess trade-offs in speed and accuracy; when models of varying structures and complexity are included in the ensemble approaches, it can tackle not only data and parameter selection uncertainty, but also structural uncertainty [67]. Different ensemble approaches might be used just by working with multiple datasets used to train models, which intend to reduce the generalisation error of various base algorithms [66]. Ensemble techniques are also effective in lowering both bias and variance in prediction results [68]. To enhance representation, process-based physical information can be incorporated into DL frameworks to depict complex flow and chemical transport in various water bodies, using a multi-task learning framework that models related water quality (WQ) parameters simultaneously, which can further improve the model’s robustness, particularly under sparse data scenarios [66]. Džal et al [69] developed and tested the WQ_Model (a combination of an ANN and RF) that could forecast FIB exceedances using only routine monitoring data, which yielded an overall accuracy of 80.6%. Zhang et al [70] aimed to build fast predictive models for log-transformed E. coli concentrations by applying three ANN structures (NIO, NAR, and NARX) together with a wavelet-assisted NAR (WA-NAR) hybrid model. The NARX models outperformed all others and yielded the strongest results (R2 = 0.94; RMSE = 0.07).
4.3. Overall Synthesis of ML Algorithms
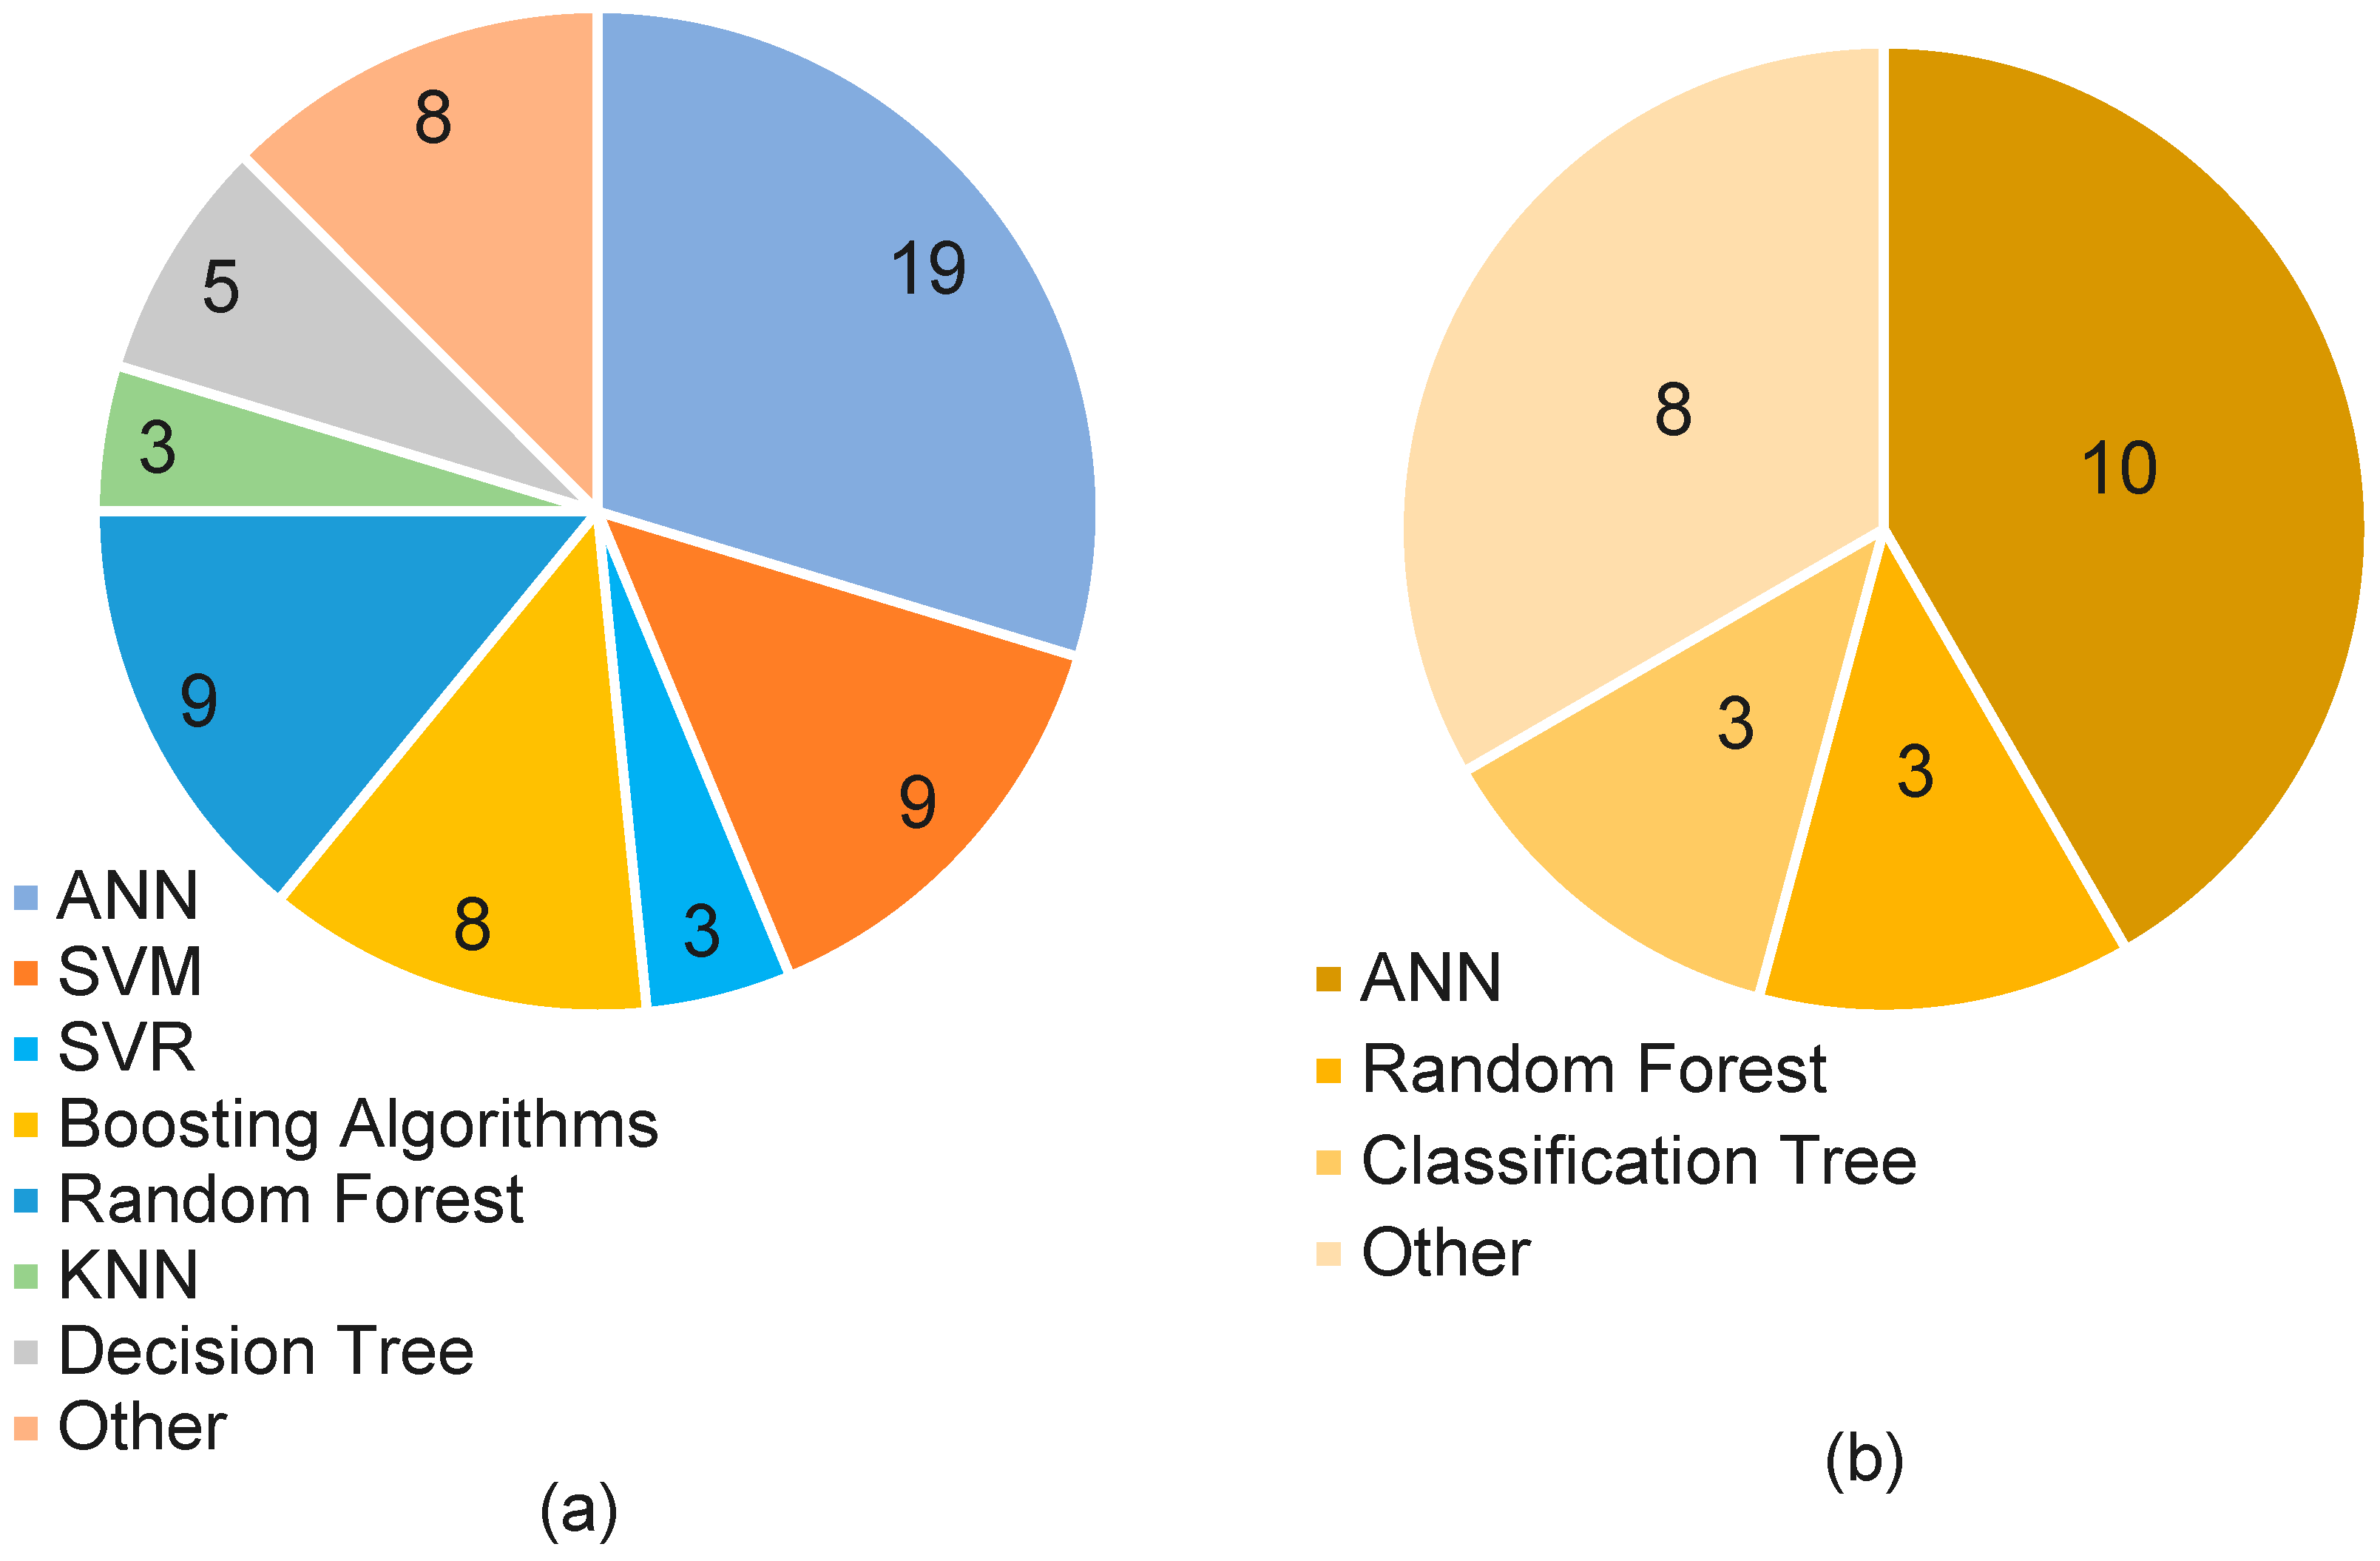
Among the ML algorithms, ANNs were used in 19 studies, followed by RF (9), SVM (9), Boosting algorithms (8), DT (5), K-Nearest Neighbours (3), Support Vector Regression (3), and eight other ML models, as shown in Figure 6a. Out of 63 studies taken into account, it has been observed that many researchers used multiple models or different models from the same category. For example, Džal et al [69] used RF, ANNs, and a hybrid model of ANNs and RF, while Zhang et al [70] used different variations of ANNs like NIO, NAR, and NARX. Therefore, finding the best-performing ML model for each study is crucial. It was observed that ANNs were the best performers in 10 studies, followed by RF (3), CT (3), and other ML models (8), as illustrated in Figure 6b. It should also be noted that these are statistics from the reviewed studies. For instance, ten studies found the ANN to be the best-performing model in their respective contexts. These results should not be interpreted as direct model comparisons, as each study used different datasets and experimental conditions.
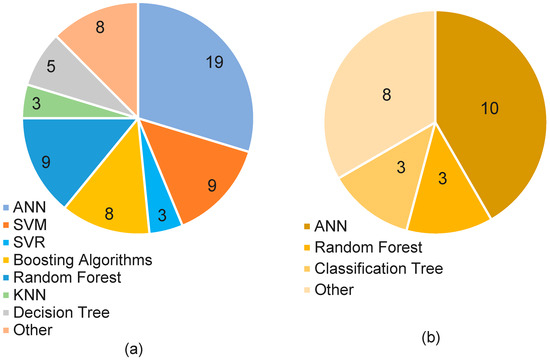
Figure 6.
(a) Number of machine learning models used in the studies and (b) number of times machine learning models performed best.
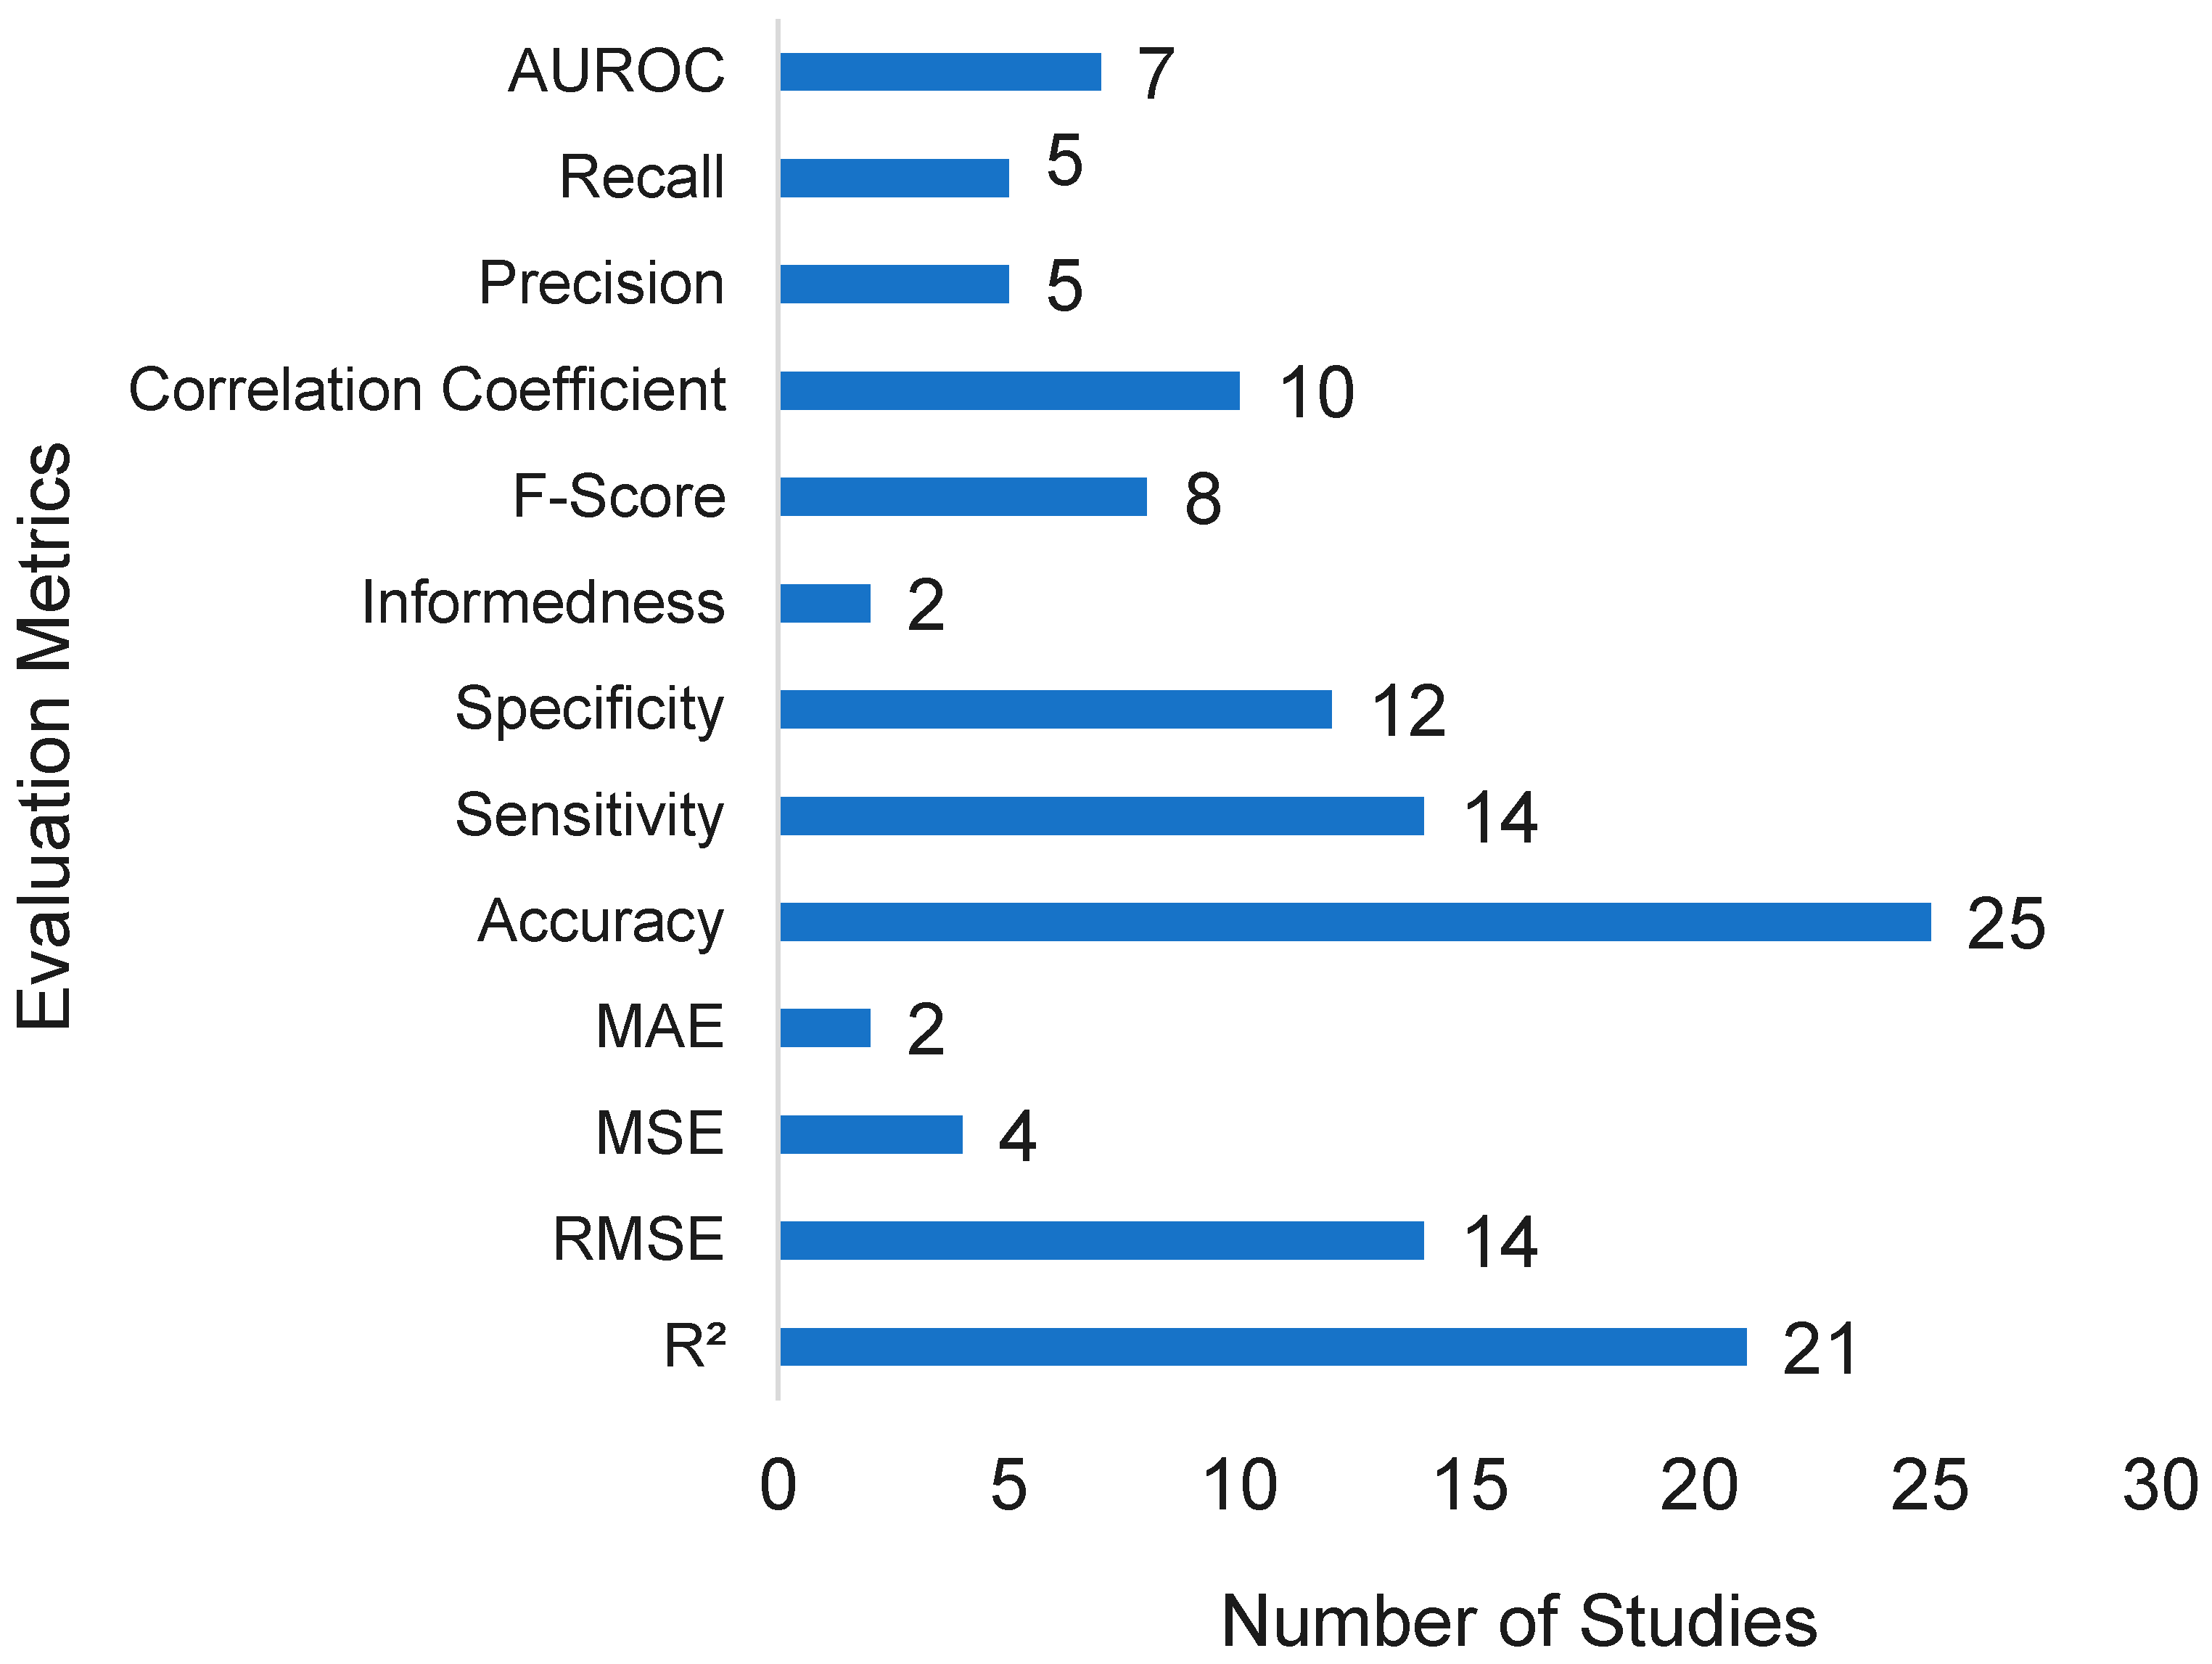
Various evaluation metrics have been used throughout the studies. Among the preferred metrics, Accuracy was used in 25 out of 63 studies, followed by R2 (21), RMSE (14), Sensitivity (14), Specificity (12), and more, as shown in Figure 7. Kendall’s tau correlation, AIC (Akaike’s Information Criterion), and others were among the least appearing metrics. Table A2 in the Appendix A summarizes the key details of the reviewed studies, including the best-performing models, parameter settings, regions examined, and the metrics used.
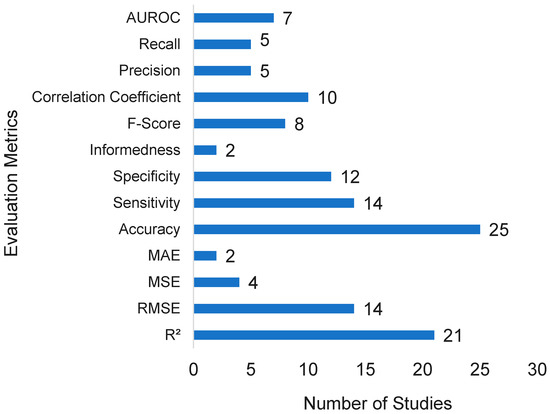
Figure 7.
Statistics of the evaluation metrics used in the sixty-three reviewed studies.
5. Remote Sensing in Bathing Water Quality Prediction
The remote sensing approach provides an alternative method of data collection, wherein information is acquired via satellites, drones, and other aerial platforms. Parameters such as chl-a, turbidity, and total suspended solids (TSSs), which are critical for BWQ predictive modelling, can be derived from satellite-based data and accessed through the Google Earth Engine (GEE) platform. GEE is a cloud-based computing environment designed for large-scale environmental data analysis, offering extensive satellite imagery and remote sensing datasets [37]. It hosts a multi-petabyte, analysis-ready data catalogue integrated with a high-performance, parallel computation service accessible via an API and web-based integrated development environment (IDE). This framework enables the analysis of both public and private geospatial datasets (e.g., Landsat, Sentinel-1/2, climate, and land-cover data) using server-side operators that automatically distribute computational tasks [71].
In optically complex (Case-2) waters, two major challenges arise. The first is adjacency effects, whereby photons from bright land surfaces scatter into the sensor’s field of view, distorting water reflectance, particularly in small or narrow water bodies [72]. The second is the critical importance of atmospheric correction (AC) for accurate water colour retrievals. Most AC algorithms were originally developed for multispectral sensors; therefore, the development of water-colour-specific and emerging hyperspectral algorithms is essential for coastal applications [73]. To ensure cross-sensor algorithm portability and the generation of consistent long-term time series, the POLYMER spectral-matching AC algorithm is frequently employed. POLYMER separates water signals from atmospheric and surface contributions, improves coverage under thin cloud and sun-glint conditions, and can be applied to multiple sensors, enhancing product consistency. POLYMER v4.12 AC has been implemented in harmonised multi-mission chlorophyll-a products such as GlobColour (merging SeaWiFS, MERIS, MODIS, VIIRS, and OLCI data with multiple blending schemes) and OC-CCI v5.0 (which applies band-shifting to MERIS, bias correction, per-pixel uncertainties, and blended algorithms such as OCI/OCx/OC5) [73,74].
Within the context of BWQ prediction, GEE is particularly advantageous for extracting key parameters such as chlorophyll-a (chl-a) [75], turbidity [70,71], and land use information [42]. Its strong parallel-processing capabilities allow for the efficient handling of large-scale data operations, including cropping, stitching, and analysis, thereby enhancing the efficiency of research on water quality prediction [11,49]. Table 4 summarises some of the most important parameters and sensors used in BWQ prediction, along with the satellites employed for data acquisition. Numerous studies have utilised satellite-derived data to monitor coastal parameters; for example, a ten-year dataset of culturable Enterococci was analysed alongside satellite-derived sea surface temperature (SST), direct normal irradiance (DNI), and turbidity data [76]. Other investigations have examined Chl-a, total suspended matter (TSM), and coloured dissolved organic matter (CDOM) to assess seasonal variations in water quality [77]. Chl-a has been monitored as a proxy for detecting and mapping algal blooms on a national scale [75], given its significance for managing water resources and maintaining marine ecosystem stability [31]. Similarly, turbidity has been tracked due to its importance as a key indicator of water quality [78]. The Sentinel-3 satellite, equipped with the Ocean and Land Colour Instrument (OLCI), has been widely employed to retrieve hyperspectral data for BWQ assessment [48,73,74]. Furthermore, hydro-meteorological variables such as cloud cover significantly influence solar radiation, which, in turn, affects water quality dynamics [79].

Table 4.
Satellite sensors that are used in capturing various parameters.
6. Identified Research Gaps and Future Directions
Despite substantial progress in applying AI and RS to BWQ prediction, several research gaps remain. Addressing these will be critical to advancing both scientific understanding and operational management. One of the main challenges is the difficulty in accurately predicting short-period faecal contamination episodes at bathing sites, particularly with the conditions of data scarcity and unbalanced datasets, including existing supervised learning models like RF and zero-model [6]. Challenges in selecting the ideal training data size and handling uncertainty, especially in modelling hydrological variations, need attention [19]. Furthermore, incomplete data on key variables such as wind speed/direction, water temperature, and wave height restrict comprehensive analysis, while factors like microbial tracking and seasonal changes, both of which could influence E. coli levels, are often underexplored [5]. Models that rely on climatological nutrient data frequently fail to account for sudden increases in nutrient concentration levels [44]. Another critical issue is the inability of current models to adequately capture the nonlinear dynamics of the atmosphere [4]. Furthermore, water quality models encounter substantial uncertainty when transforming large datasets into numerical formats, and choosing the best algorithm for essential inputs in water research continues to be challenging [36]. Research gaps and limitations in the domain of modelling for BWQ are summarised in Table 5.

Table 5.
Limitations and required improvements for future research.
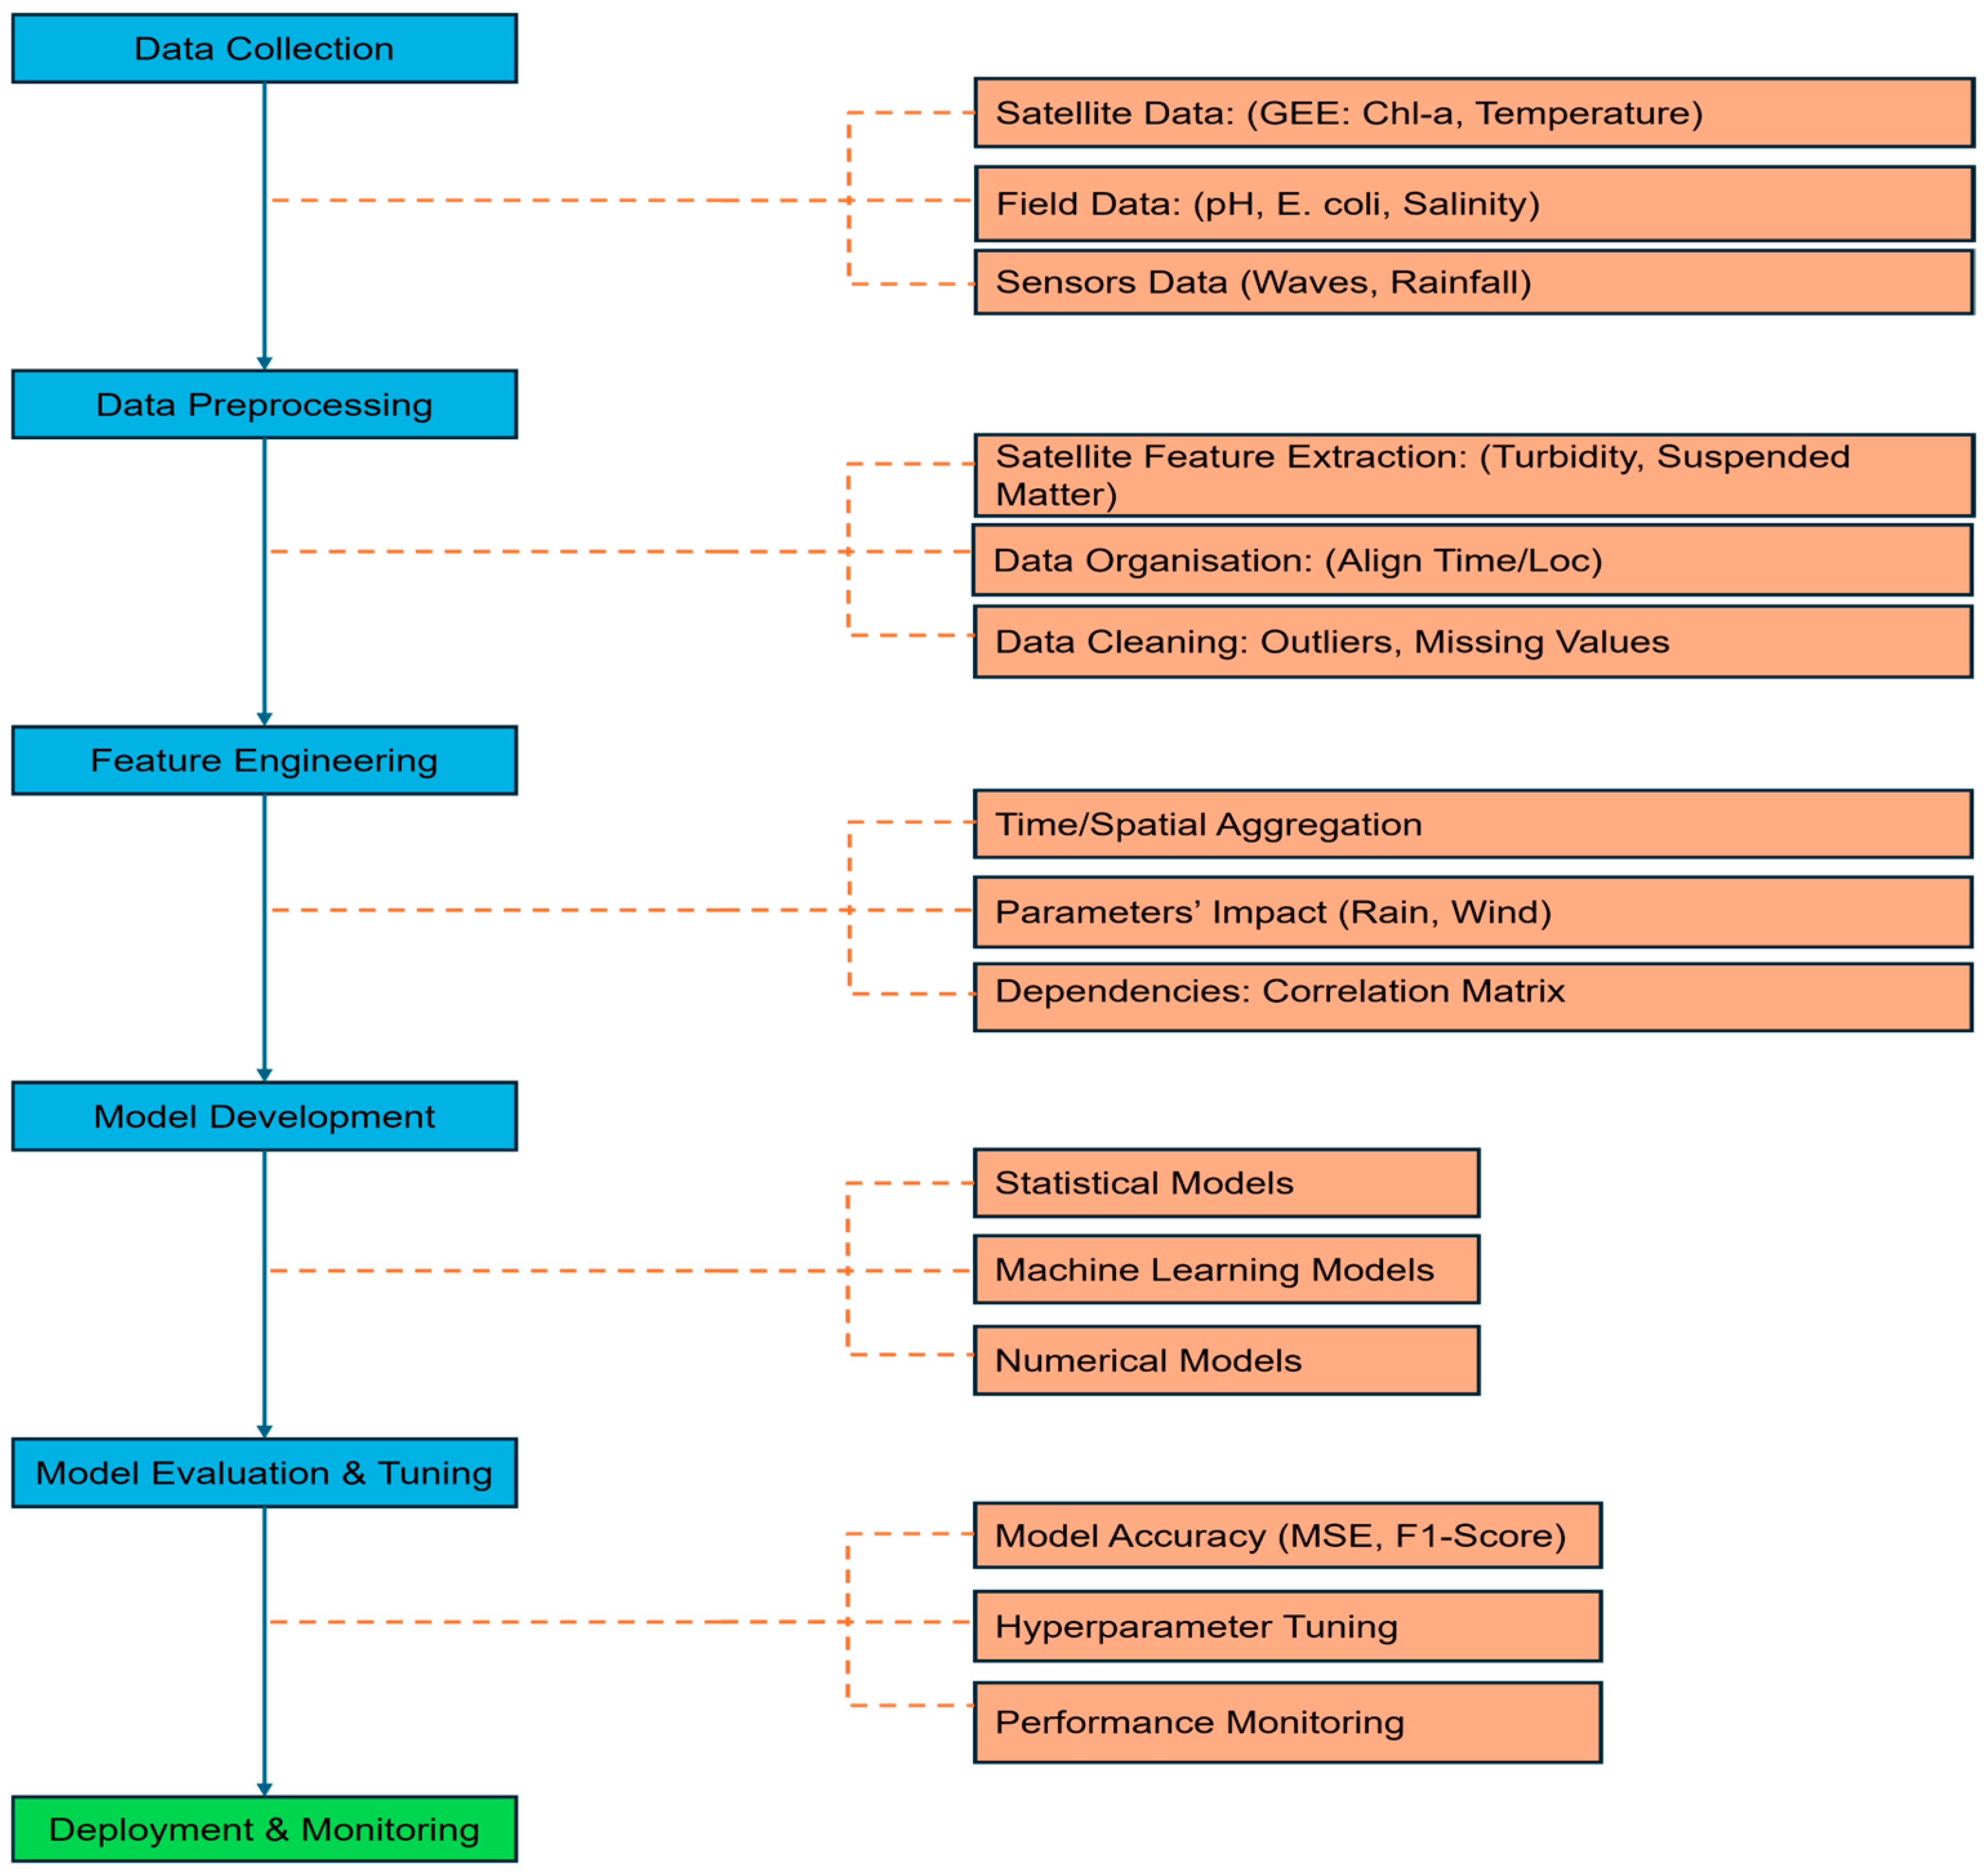
Future research in the field of BWQ prediction should focus on modelling approaches capable of handling limited or uninformative data to ensure reliable and effective water quality management [6]. A more comprehensive understanding of how E. coli levels vary over time and between beaches could result in improved predictive modelling and better beach management strategies [5]. Furthermore, integrating river flow data or other proxies for nutrient availability into coastal water monitoring systems is crucial for improving the accuracy of predictions, particularly for issues related to nutrients, such as harmful algal blooms [44]. Future research should investigate combining satellite and UAV data to enhance prediction accuracy and expand spatial coverage [50], as illustrated in Table 5. Based on this review, a framework of BWQ prediction is illustrated in Figure 8.
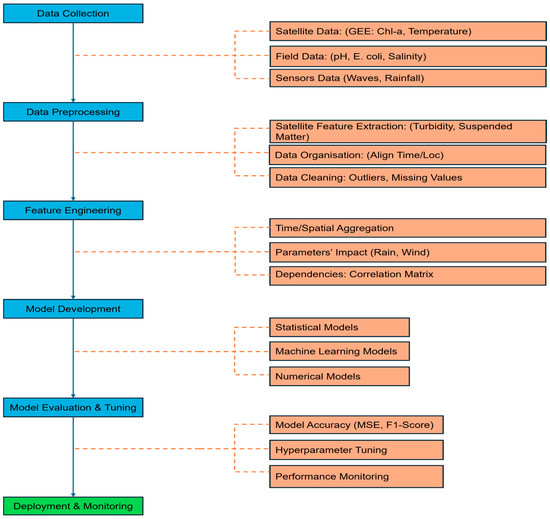
Figure 8.
Framework for bathing water quality modelling and prediction.
7. Conclusions
This systematic review has critically examined the evolving role of AI in BWQ assessment, synthesising insights from 63 peer-reviewed studies that span diverse geographic contexts, modelling techniques, and data integration strategies. By encompassing both freshwater and coastal environments, and evaluating a wide spectrum of data-driven techniques ranging from traditional statistical models to advanced ML and hybrid approaches, the review offers a holistic perspective on the state of AI-driven BWQ prediction.
Key parameters influencing BWQ were identified in a sequential hierarchy, with rainfall and tidal movements emerging as the most significant contributors due to their direct role in FIB dispersion. Other influential factors included wind dynamics, sunlight, and salinity.
The analysis highlights a clear transition in the field over the span of 2001–2024 from traditional statistical approaches to more sophisticated nowcasting frameworks powered by advanced ML models such as ANNs, DL, DT, RF, MLR, SVM, and ensemble-based algorithms to accurately predict BWQ at near real time. The integration of satellite-derived data from remote sensing platforms, notably Google Earth Engine, has further expanded the spatial–temporal coverage and granularity of BWQ assessments, enabling scalable and cost-effective monitoring solutions. These dominant modelling approaches have demonstrated superior predictive performance, particularly in handling complex, nonlinear, and site-specific data. However, no single model emerged as being universally optimal; rather, model performance was highly context-dependent, influenced by data availability, environmental variability, and the nature of the prediction task.
Despite these advancements, the review identifies several persistent challenges that constrain the full deployment of AI in BWQ monitoring. These include the limited availability of high-resolution, real-time environmental data; the underdevelopment of short-term faecal pollution prediction models; and the opacity of complex AI algorithms, which impedes their interpretability and regulatory acceptance. Moreover, the lack of standardised data protocols and global data-sharing frameworks hinders cross-regional model generalisability and collaborative innovation. Short-term FIB prediction remains limited, particularly under conditions of data scarcity and measurement uncertainty. Regional disparities in data availability, the underutilisation of integrated real-time remote sensing with predictive models, and limited accessibility in developing regions continue to hinder the global scalability of AI-based BWQ systems. Looking forward, future research should prioritise the development of hybrid modelling approaches that combine the strengths of multiple AI techniques, incorporate real-time environmental data, and adapt to site-specific conditions. Future research should prioritise the development of explainable AI (XAI) models, the integration of Internet of Things (IoT) devices for real-time data acquisition, and the fusion of cloud-based analytics with remote sensing technologies. Emphasis should also be placed on capturing short-term environmental events such as stormwater surges and tidal fluctuations, and deploying advanced sensor networks near bathing sites to enable near-real-time BWQ monitoring. Establishing open-access data repositories and promoting multidisciplinary collaboration among environmental scientists, data engineers, public health professionals, and policymakers will be essential to operationalising AI-driven BWQ systems within public health and environmental governance frameworks.
In conclusion, AI offers a powerful toolkit for advancing BWQ assessment, with the potential to shift monitoring paradigms from reactive monitoring to proactive and from localised to globally scalable. Realising this potential will require sustained investment in data infrastructure, algorithmic transparency, and cross-sectoral partnerships that align technological innovation with public health priorities and sustainability goals.
Author Contributions
M.U.S.K.: Data Curation, Formal Analysis, Investigation, Methodology, Validation, Visualisation, Writing—Original Draft. A.Y.B.: Writing—Review and Editing. R.R.: Writing—Review and Editing. M.S.: Conceptualisation, Funding Acquisition, Methodology, Project Administration, Resources, Supervision, Writing—Review and Editing. All authors have read and agreed to the published version of the manuscript.
Funding
This work was carried out as part of the AI4Coasts project (Grant Agreement No. OSO/23/DF/003) funded by the Marine Institute Ireland through the Our Shared Ocean programme.
Data Availability Statement
All data underlying this review are derived from published sources. The full search strings and per-study extraction table are provided in the Appendix A.
Conflicts of Interest
The authors declare no conflicts of interest.
Appendix A

Table A1.
Detailed keyword search.
Table A1.
Detailed keyword search.
| Serial Number | Search Keywords | Search Strings | Number of Studies |
|---|---|---|---|
| 1 | Artificial intelligence AND intestinal Enterococci | (TITLE-ABS-KEY (Artificial Intelligence) AND TITLE-ABS-KEY (Intestinal Enterococci)) AND PUBYEAR = 2024 AND (LIMIT-TO (LANGUAGE, “English”)) | 1 |
| 2 | Bathing beaches AND machine learning | (TITLE-ABS-KEY (Bathing beaches) AND TITLE-ABS-KEY (Machine learning)) AND PUBYEAR > 2017 AND PUBYEAR < 2025 AND PUBYEAR > 2017 AND PUBYEAR < 2025 AND (LIMIT-TO (LANGUAGE, “English”)) | 18 |
| 3 | Bathing water quality AND machine learning | (TITLE-ABS-KEY (Bathing water QUALITY) AND TITLE-ABS-KEY (Machine learning)) AND PUBYEAR > 2012 AND PUBYEAR < 2025 AND PUBYEAR > 2012 AND PUBYEAR < 2025 AND (LIMIT-TO (LANGUAGE, “English”)) | 23 |
| 4 | Bathing water quality AND neural networks | (TITLE-ABS-KEY (Bathing water QUALITY) AND TITLE-ABS-KEY (Neural Networks)) AND PUBYEAR > 2000 AND PUBYEAR < 2025 AND PUBYEAR > 2002 AND PUBYEAR < 2025 AND (LIMIT-TO (LANGUAGE, “English”)) | 19 |
| 5 | Bathing water quality AND prediction model | (TITLE-ABS-KEY (Bathing water QUALITY) AND TITLE-ABS-KEY (Prediction model)) AND PUBYEAR > 2000 AND PUBYEAR < 2025 AND PUBYEAR > 2001 AND PUBYEAR < 2025 AND (LIMIT-TO (LANGUAGE, “English”)) AND (LIMIT-TO (SUBJAREA, “ENGI”)) | 22 |
| 6 | Bathing water quality AND Sentinel | (TITLE-ABS-KEY (Bathing Water QUALITY) AND TITLE-ABS-KEY (Sentinel)) AND PUBYEAR > 2000 AND PUBYEAR < 2025 AND PUBYEAR > 2004 AND PUBYEAR < 2025 AND (LIMIT-TO (LANGUAGE, “English”)) | 10 |
| 7 | Bathing water quality AND time series analysis | (TITLE-ABS-KEY (Bathing Water QUALITY) AND TITLE-ABS-KEY (Time SERIES analysis)) AND PUBYEAR > 2000 AND PUBYEAR < 2025 AND PUBYEAR > 2004 AND PUBYEAR < 2025 AND (LIMIT-TO (LANGUAGE, “English”)) | 15 |
| 8 | E. coli AND machine learning | (TITLE-ABS-KEY (E. coli) AND TITLE-ABS-KEY (Machine learning)) AND PUBYEAR > 2000 AND PUBYEAR < 2025 AND PUBYEAR > 2005 AND PUBYEAR < 2025 AND (LIMIT-TO (DOCTYPE, “ar”) OR LIMIT-TO (DOCTYPE, “cp”)) AND (LIMIT-TO (SUBJAREA, “ENGI”) OR LIMIT-TO (SUBJAREA, “COMP”)) AND (LIMIT-TO (LANGUAGE, “English”)) AND (LIMIT-TO (EXACTKEYWORD, “Machine Learning”) OR LIMIT-TO (EXACTKEYWORD, “Machine-learning”) OR LIMIT-TO (EXACTKEYWORD, “E. coli”)) | 157 |
| 9 | Faecal indicator bacteria AND bathing water quality | (TITLE-ABS-KEY (Faecal Indicator Bacteria) AND TITLE-ABS-KEY (Bathing Water QUALITY)) AND PUBYEAR > 2000 AND PUBYEAR < 2025 AND (LIMIT-TO (SUBJAREA, “ENGI”)) AND (LIMIT-TO (LANGUAGE, “English”)) AND (EXCLUDE (EXACTKEYWORD, “Quantitative Analysis”)) | 53 |
| 10 | Faecal indicator bacteria AND machine learning | (TITLE-ABS-KEY (Faecal Indicator Bacteria) AND TITLE-ABS-KEY (Machine learning)) AND PUBYEAR > 2000 AND PUBYEAR < 2025 AND (LIMIT-TO (LANGUAGE, “English”)) AND (LIMIT-TO (EXACTKEYWORD, “Bathing Water”) OR LIMIT-TO (EXACTKEYWORD, “Bathing Water Quality”) OR LIMIT-TO (EXACTKEYWORD, “Beach Water Qualities”) OR LIMIT-TO (EXACTKEYWORD, “Machine Learning Models”) OR LIMIT-TO (EXACTKEYWORD, “Bathing Beaches”) OR LIMIT-TO (EXACTKEYWORD, “Machine-learning”) OR LIMIT-TO (EXACTKEYWORD, “Artificial Intelligence”) OR LIMIT-TO (EXACTKEYWORD, “Machine Learning”)) AND (LIMIT-TO (SUBJAREA, “ENGI”) OR LIMIT-TO (SUBJAREA, “COMP”) OR LIMIT-TO (SUBJAREA, “ENVI”)) | 25 |
| 11 | Faecal indicator bacteria AND neural networks | (TITLE-ABS-KEY (Faecal Indicator Bacteria) AND TITLE-ABS-KEY (Neural Networks)) AND PUBYEAR > 2000 AND PUBYEAR < 2025 AND (LIMIT-TO (LANGUAGE, “English”)) | 30 |
| 12 | Faecal pollution AND bathing water quality | (TITLE-ABS-KEY (Faecal Pollution) AND TITLE-ABS-KEY (Bathing Water QUALITY)) AND PUBYEAR > 2000 AND PUBYEAR < 2025 AND (LIMIT-TO (LANGUAGE, “English”)) AND (LIMIT-TO (DOCTYPE, “ar”) OR LIMIT-TO (DOCTYPE, “cp”) OR LIMIT-TO (DOCTYPE, “re”)) AND (LIMIT-TO (EXACTKEYWORD, “Bathing Beaches”)) AND (LIMIT-TO (SUBJAREA, “ENGI”)) | 15 |
| 13 | Faecal pollution AND neural networks | (TITLE-ABS-KEY (Faecal Pollution) AND TITLE-ABS-KEY (Neural Networks)) AND PUBYEAR > 2000 AND PUBYEAR < 2025 AND (LIMIT-TO (LANGUAGE, “English”)) AND (LIMIT-TO (DOCTYPE, “ar”) OR LIMIT-TO (DOCTYPE, “cp”) OR LIMIT-TO (DOCTYPE, “re”)) AND (LIMIT-TO (SUBJAREA, “ENGI”) OR LIMIT-TO (SUBJAREA, “COMP”)) | 15 |
| 14 | Faecal indicator bacteria AND artificial intelligence | (TITLE-ABS-KEY (Faecal Indicator Bacteria) AND TITLE-ABS-KEY (Artificial Intelligence)) AND PUBYEAR > 2000 AND PUBYEAR < 2025 AND (LIMIT-TO (LANGUAGE, “English”)) | 11 |
| 15 | Google Earth Engine AND water quality | (TITLE-ABS-KEY (Google Earth Engine) AND TITLE-ABS-KEY (Water QUALITY)) AND PUBYEAR > 2000 AND PUBYEAR < 2025 AND (LIMIT-TO (LANGUAGE, “English”)) AND (LIMIT-TO (SUBJAREA, “ENGI”)) AND (LIMIT-TO (DOCTYPE, “ar”) OR LIMIT-TO (DOCTYPE, “cp”) OR LIMIT-TO (DOCTYPE, “cr”)) | 42 |
| 16 | Neural networks AND E. coli | (TITLE-ABS-KEY (Neural Networks) AND TITLE-ABS-KEY (E. coli)) AND PUBYEAR > 2000 AND PUBYEAR < 2025 AND (LIMIT-TO (LANGUAGE, “English”)) AND (LIMIT-TO (SUBJAREA, “ENGI”)) AND (LIMIT-TO (EXACTKEYWORD, “Machine Learning”) OR LIMIT-TO (EXACTKEYWORD, “Forecasting”)) AND (LIMIT-TO (DOCTYPE, “ar”) OR LIMIT-TO (DOCTYPE, “cp”)) | 17 |
| 17 | Neural networks AND intestinal Enterococci | (TITLE-ABS-KEY (Neural Networks) AND TITLE-ABS-KEY (Intestinal Enterococci)) AND PUBYEAR > 2000 AND PUBYEAR < 2025 AND (LIMIT-TO (LANGUAGE, “English”)) | 7 |
| 18 | Recreational waters AND neural network | (TITLE-ABS-KEY (Recreational waters) AND TITLE-ABS-KEY (Neural network)) AND PUBYEAR > 2000 AND PUBYEAR < 2025 AND (LIMIT-TO (LANGUAGE, “English”)) AND (LIMIT-TO (SUBJAREA, “ENGI”) OR LIMIT-TO (SUBJAREA, “COMP”)) | 23 |
| 19 | Recreational waters AND remote sensing | (TITLE-ABS-KEY (Recreational waters) AND TITLE-ABS-KEY (Remote sensing)) AND PUBYEAR > 2000 AND PUBYEAR < 2025 AND (LIMIT-TO (LANGUAGE, “English”)) AND (LIMIT-TO (SUBJAREA, “ENGI”)) AND (EXCLUDE (DOCTYPE, “ch”)) | 27 |
| 20 | Satellite images AND bathing water quality | (TITLE-ABS-KEY (Satellite images) AND TITLE-ABS-KEY (Bathing water QUALITY)) AND PUBYEAR > 2000 AND PUBYEAR < 2025 AND (LIMIT-TO (LANGUAGE, “English”)) | 4 |

Table A2.
Important information extracted from reviewed studies.
Table A2.
Important information extracted from reviewed studies.
| Name | Country | Best Performing Model | Parameters | Metrics | |
|---|---|---|---|---|---|
| 1 | A critical review of model construction and performance for nowcast systems for faecal contamination in recreational beaches | Uruguay | This is a review study. | ||
| 2 | A physical descriptive model for predicting bacteria level variation at a dynamic beach | Canada | PDM | Precipitation, creek discharge, turbidity, wind speed/direction, lag time, wave height (excluded later), water temperature (excluded), currents | Accuracy |
| 3 | A predictive model of recreational water quality based on adaptive synthetic sampling algorithms and machine learning | New Zealand | MLP-ANN | Rainfall (1 d, 2 d, 3 d, total), wind speed and direction, solar hours | Accuracy, Sensitivity, Specificity |
| 4 | Daily beach water quality forecast: 3D deterministic model vs. statistical model | Hong Kong | Overall accuracy (MLR) and Sensitivity (3D model) | Rainfall, solar radiation, predicted tide level, prevailing onshore wind speed, salinity, water temperature, and previous E. coli concentration | Overall Accuracy, Sensitivity |
| 5 | Daily forecasting of Hong Kong beach water quality by multiple linear regression models | Hong Kong | MLR-DW | Day-1, Day-2, Day-3 rainfall, previous day solar radiation, wind speed, water temperature, tide level, ANN-predicted salinity, and 5-sample geometric mean of E. coli (lnEC5) | Overall Accuracy |
| 6 | Daily prediction of marine beach water quality in Hong Kong | Hong Kong | ANN | Beach E. coli count, rainfall, wind speed, wind direction, global solar radiation, tide level, tidal range, water temperature, salinity, turbidity, dissolved oxygen, pH, beach user | Overall Accuracy, Sensitivity, Specificity, Correlation Coefficient, R2 |
| 7 | Development of decision support system for managing and using recreational beaches | United States | MLR (Model 3) | Salinity, wind speed type, tide type, wind direction, rainfall 3 days before, rainfall in last 48 h, tidal water level | LCC (Linear Correlation Coefficient) |
| 8 | Development of multiple linear regression models as predictive tools for fecal indicator concentrations in a stretch of the lower Lahn River, Germany | Germany | MLR-EC-ext | E. coli, intestinal enterococci, somatic coliphages, filterable solids, water temperature, conductivity, pH, turbidity, chlorophyll a, dissolved oxygen, nitrite nitrogen, nitrate nitrogen, ammonium nitrogen, total nitrogen bound, phosphate phosphorus, discharge, rainfall, global solar irradiance | R2 |
| 9 | Development of predictive models for determining enterococci levels at Gulf Coast beaches | United States | ANN (RMSE) VB-NL (LCC) | Salinity, water temp, wind speed/type/direction, tide type/level, weather, and various rainfall measures (15 total) | LCC (Linear Correlation Coefficient), RMSE |
| 10 | Estimating bathing water quality from meteorological measurements | Croatia | Logistic Regression | Air temperature, air pressure, wind speed and gust, wind direction, humidity, rain intensity, 24 h rain, UV radiation, solar radiation, interpolated sea level | Accuracy, F1 score, Informedness |
| 11 | Evaluating multiple predictive models for beach management at a freshwater beach in the Great Lakes region | Canada | MLR-W5 | NBirds, day-of-year, turbidity, water temperature, 8–72 h cumulative rainfall, 10 h antecedent wind direction (ranked), wind speed vectors parallel and perpendicular to shoreline, daily air temperature, wave height, plus categorical WeatherRank (sky condition/precipitation). | AUROC, Accuracy |
| 12 | IoT urban river water quality system using federated learning via knowledge distillation | France | DNN-FedKD | Conductivity, TSS, ammonia, NTK, temperature, turbidity, DSLR, DW7, 24 h rain, 48 h rain, E. coli, intestinal Enterococci, conductivity, flow | Accuracy, Precision, Recall, F1-score |
| 13 | Modelling bathing water quality using official monitoring data | Croatia | ANN (E. coli) | E. coli count in last sampling (E. coli count in last bathing season), intestinal Enterococci count in last sampling, salinity, seawater temperature, wind, precipitation category, weather description, highest daily sea level, lowest daily sea level, distance to sewage outlet, air temperature, air temperature on the day before, humidity, humidity on the day before, pressure at weather station level, pressure at weather station level on the day before, pressure tendency, pressure tendency on the day before, relative pressure at sea level, relative pressure at sea level on the day before, wind speed, wind speed on the day before, wind direction, wind direction on the day before, cloud coverage, cloud coverage on the day before, precipitation in the last 24 h, precipitation in the last 24 h on the day before, downward thermal infrared radiative flux, all-sky insolation incident on a horizontal surface, top-of-atmosphere insolation, insolation clearness index, number of tourist overnights | AUC, Sensitivity, Specificity, Informedness, F-score |
| 14 | Modeling system for predicting enterococci levels at Holly Beach | United States | ANN | Salinity; water temperature; wind speed type and direction; water level; tide (9- and 3-category); weather (sunny Y/N); rainfall (current, antecedent and cumulative); solar radiation (antecedent and cumulative); MODIS reflectance data from channels 1 × 10⁷ | Correlation Coefficient, RMSE, MSE |
| 15 | Nonlinear bacterial load–streamflow response on a marine beach | Hong Kong | Load-based MLR | Same-day bacterial load, previous-day load, past E. coli level, solar radiation, tide level, water temperature, wind speed | Correlation Coefficient, RMSE |
| 16 | Prediction of fecal indicator organism concentrations in rivers: the shifting role of environmental factors under varying flow conditions | Germany | Bayesian-MLR (Rhine, 2010/11) | Discharge, 5-day rainfall sum, 3-day global solar irradiance sum, water temperature, pH, dissolved O2, turbidity, conductivity | R2 |
| 17 | Real-time forecast of marine beach water quality in Hong Kong | Hong Kong | MLR | Rainfall, solar radiation, wind speed, tide level, salinity, water temperature, past E. coli data | Overall Accuracy, R2 |
| 18 | Real-time nowcasting of microbiological water quality at recreational beaches: A wavelet and artificial neural network-based hybrid modeling approach | United States | ANN-NARX (model 4) | 24 h rainfall, 4 h water temperature, ln-turbidity (beach and river), ln-discharge (24 h), onshore wind speed, ln-significant wave height, lagged E. coli | R2, RMSE |
| 19 | Remote sensing data driven bathing water quality assessment using Sentinel-3 | Croatia | DT-Selected Bands | Raw reflectance/brightness-temperature values of all SLSTR bands S1–S9, F1–F2, and all 21 OLCI bands | Accuracy, Recall, F1-score, Precision |
| 20 | Some statistical issues related to multiple linear regression modeling of beach bacteria concentrations | United States | MLR (Model-B) | Turbidity (TB, log-transformed), wave height (WH), antecedent 24 h rainfall (RF, √), wind direction (WD, categorised), interactions TB × WH, TB × RF, WH × RF | Index d, R2, Type I errors, Type II errors, RMSE, MAE |
| 21 | Sunny with a chance of gastroenteritis: Predicting swimmer risk at California beaches | United States | CT and BLR-T | Past FIB concentrations, rainfall, number of dry days before a rain event, tide level, solar radiation, cloud cover, wind speed, air pressure, upwelling index, air temperature, water temperature, wave height, wave period, alongshore current, streamflow, storm drain condition | Sensitivity and Specificity, Accuracy |
| 22 | The WATERMAN system for daily beach water quality forecasting: a ten-year retrospective | Hong Kong | MLR (Specifity, Overall Accuracy) 3D Model (Sensitivity, R value) | Daily rainfall (one, two, and three days prior to the day of forecast), solar radiation, predicted tide level, prevailing onshore wind speed, salinity, water temperature, previous E. coli concentration, bacterial load | Pearson R, Overall Accuracy, Sensitivity, Specificity |
| 23 | Using probabilities of enterococci exceedance and logistic regression to evaluate long term weekly beach monitoring data | United States | Logistic Regression | Beach location, air temperature, water temperature, rainfall within 24 h before sampling, rainfall within 3 days before sampling, rainfall within 7 days before sampling, prior hurricanes, tide conditions | Odds Ratio |
| 24 | A new Bayesian approach for managing bathing water quality at river bathing locations vulnerable to short-term pollution | Germany | Bayesian Model | Daily cumulative rainfall (1–7 day lags and 72 h window) and daily mean river flow (same lags) | True-Positive Rate, Predicted Bathing Rate, R2, RMSE |
| 25 | Predicting recreational water quality and public health safety in urban estuaries using Bayesian Networks | Australia | Bayesian Network | Enterococci (cfu/100 mL), electrical conductivity, rainfall, salinity, solar exposure, sunshine duration, cloud cover, wind, sea level, tidal cycle, tidal state, UV index, location | Sensitivity, Specificity, AUROC |
| 26 | Environmental predictors of Escherichia coli concentration at marine beaches in Vancouver, Canada: a Bayesian mixed-effects modelling analysis | Canada | Bayesian log normal mixed-effect model | Previous-day log E. coli geometric mean, 48 h cumulative rainfall, mean salinity, antecedent dry days, 24 h mean air temperature, 24 h mean UV index and study year | R-hat, Bulk ESS, Tail ESS |
| 27 | Evaluating a microbial water quality prediction model for beach management under the revised EU Bathing Water Directive | Ireland | Scenario 2: MIKE11, MIKE3 FM | Precipitation, air temperatures, wind speeds and directions, flow, water level, rainfall, tide level | Accuracy, Hit Rate, False-Alarm Rate, False-Alarm Ratio, Success Index |
| 28 | Performance comparison of the Cogent Confabulation Classifier with other commonly used supervised machine learning algorithms for bathing water quality assessment | Croatia | Random Forest | Full set: 21 spectral bands B01–B21. (b) Chl-a subset: B03, B04, B05, B06, B10, B11 (OCLI) Sentinel 3 | Precision, Recall, F1-score, Accuracy, Confusion Matrix |
| 29 | Forecasting bathing water quality in the UK: A critical review | UK | This is a review study | ||
| 30 | Artificial neural networks as emulators of process-based models to analyse bathing water quality in estuaries | Spain | Delft3D | Sea level, sea boundary salinity, sea boundary temperature, river flow, river temperature, solar radiation, flows of three faecal discharges, tidal water levels, current speeds and directions | R2, Accuracy, Bias Score, Hit Rate, False Alarm Rate, Success Index, Threat Score |
| 31 | Predicting water quality at Santa Monica Beach: Evaluation of five different models for public notification of unsafe swimming conditions | United States | Classification Tree | Past FIB counts (1-day, 30-day, 60-day), rainfall indices (daily, cumulative, first 8 h), tide level and derivatives, wave height/period, along-shore current, storm drain flow category, air and water temperature, solar radiation, cloud cover, air pressure, wind components, up-welling index | Sensitivity, Specificity, Total Correct Prediction, Correlation Coefficient, Root Mean Square Error (RMSE), Adjusted R2 |
| 32 | Bacterial and viral fecal indicator predictive modeling at three Great Lakes recreational beach sites | United States | Least-Angle Regression with Lasso (LARS-lasso) | Rainfall (24 and 72 h), bird counts, wave height, wind speed/direction, water temp, turbidity, dissolved oxygen, conductivity, pH, UV254, DOC, PAR, relative humidity, air temp, human and dog counts, Cuyahoga River discharge (Edgewater only) | SRMSEP and R2 |
| 33 | Coastal water quality modelling using E. coli, meteorological parameters and machine learning algorithms | Greece | Decision Forest, Decision Jungle, and Boosted Decision Tree | Daily temperature (temperature C), relative humidity (%) and precipitation on sampling collection day, pressure, temperature, humidity, rainfall, direction and wind strength | Accuracy, Precision, Recall, F1, AUC |
| 34 | Coastal water quality prediction based on machine learning with feature interpretation and spatio-temporal analysis | Croatia | Catboost Algorithm | Air temperature, salinity, sea temperature, water level, antecedent cumulative precipitation, global horizontal irradiance, antecedent cumulative GHI, antecedent GHI, dewpoint temperature, precipitable water, relative humidity, surface pressure, wind speed, wind direction | R2 and RMSE |
| 35 | Efficacy of monitoring and empirical predictive modeling at improving public health protection at Chicago beaches | United States | Individual model (IM)-MLR | Solar insolation, 24 h precipitation, mean morning air temperature, barometric pressure, wave height, day-of-year | R2, Type I errors, Type II errors |
| 36 | Evaluation of the quality of coastal bathing waters in Spain through fecal bacteria Escherichia coli and Enterococcus | Spain | Correlation | Faecal bacteria, sediment, level of urbanisation, UV rays, salinity, temperature, rainfall, sunshine hours, wave height, wind, livestock, purification, population, population density | R2 |
| 37 | Improving the robustness of beach water quality modeling using an ensemble machine learning approach | United States | The stacking ensemble | 43 environmental variables were collected for Woodlawn Beach, while 29 were collected for Hamburg and Bennett beaches | Accuracy, Mean Squared Error (MSE) |
| 38 | Interpretable tree-based ensemble model for predicting beach water quality | United States | LightGBM | Lake turbidity, wind speed and direction, nearby airport rainfall, bar pressure, lake water level, wave height and direction, cloud cover, water temperature | Precision, Recall, Accuracy, F1-score |
| 39 | Development of a nowcasting system using machine learning approaches to predict fecal contamination levels at recreational beaches in Korea | South Korea | ANN | Tidal level, air temp, water temp, solar radiation, wind direction and speed, WWTP discharge, suspended solids, plus 0, 8, 20, and 40 h antecedent precipitation | R2 and RMSE |
| 40 | Systematic review of predictive models of microbial water quality at freshwater recreational beaches | Canada | This is a review study | ||
| 41 | Predicting fecal indicator organisms in coastal waters using a complex nonlinear artificial intelligence model | United Kingdom | GG-ANN | Washinghouse Brook (m3/s), Brockhole stream (m3/s), Clyne River (m3/s), Brynmill stream (m3/s), River Tawe (m3/s), River Neath (m3/s), River Afan (m3/s), normalized tide level at Mumbles, global radiation (W/m2), temperature (°C), relative humidity (%), rainfall (mm), wind speed to the north (m/s), wind speed to the east (m/s), turbidity (NTU), salinity (ppt) | MSE, R2, Sensitivity and Specificity, Overall Accuracy |
| 42 | Hotspots and main drivers of fecal pollution in Neusiedler See, a large shallow lake in Central Europe | Austria | Principal Component Analysis | Water quality: water temp., pH, conductivity, dissolved O2, total P, NH4–N, NO3–N, chlorophyll-a, Secchi depth, lake level, Wulka discharge Meteorology: air temp., precipitation, wind speed and direction, sunshine hours, global radiation | PCA |
| 43 | On the implementation of reliable early warning systems at European bathing waters using multivariate Bayesian regression modelling | Germany | Bayesian linear regression (Model 3) | Daily river flow Q (1–5 d lags), precipitation P (log-transformed, 1–5 d lags), volume of non-disinfected WWTP discharge (1–5 d lags), interaction terms Q × P and Q × WWTP | Credible Interval (CI), Percentage Coverage |
| 44 | Comparison of different model approaches for a hygiene early warning system at the lower Ruhr River, Germany | Germany | ANN | E. coli, intestinal enterococci, river runoff (Q), water temperature (T), pH value (pH), electric conductivity (EC), turbidity (TU), total organic carbon (TOC), dissolved organic carbon (DOC), spectral adsorption coefficient at 254 nm (SAC254), spectral adsorption coefficient at 436 nm (SAC436), ammonia (NH4+), nitrite (NO2−), nitrate (NO3−), ortho phosphate (o-PO43−), total phosphate (total-PO43−) | Pearson Correlation Coefficient(r) |
| 45 | Partial least squares for efficient models of fecal indicator bacteria on Great Lakes beaches | United States | PLS | Environmental variables such as rainfall, wave height, currents, turbidity (log-transformed), specific conductance, wind speed and direction, air and water temperature, algal-mat index, bird counts | Accuracy, False-Positive & False-Negative Rates, ROC curves. |
| 46 | Simulation tools to support bathing water quality management: Escherichia coli bacteria in a Baltic lagoon | Germany | 3D hydrodynamic model (GETM) and Lagrangian particle tracking model (GITM) | Wind direction/speed, water temperature, pH, turbidity, sediment type, organic matter, bacterial die-off rates, emission volumes | Compared simulated flow fields to actual drifter experiments. |
| 47 | Development of a neural-based forecasting tool to classify recreational water quality using fecal indicator organisms | United States | LVQ | Rainfall volume (V), storm intensity (I), time-since-rain at seven thresholds (t0.01–t1.0), cumulative rain over 24/48/72/168 h (R24–R168), net radiation (Rad), current discharge (Qt) and lagged discharges (Qt-1 … Qt-5); lag-1 faecal coliform (Ct-1) | TP, TN, FN, FP rates, MSE |
| 48 | Nowcasting methods for determining microbiological water quality at recreational beaches and drinking-water source waters | United States | This is a review study | ||
| 49 | Temporal variations analyses and predictive modeling of microbiological seawater quality | Croatia | The SVM/SVR model based on solar radiation + 72 h rainfall | Solar radiation, 72 h antecedent precipitation, water temperature, salinity, wind speed, tide level (final model kept solar radiation + 72 h rain), turbidity, air temperature, pH | Sensitivity, Actual vs. Predicted Curves |
| 50 | Know before you go: Data-driven beach water quality forecasting | United States | Random Forest | tide, wave, in-water quality, streamflow, ocean currents, and calendar factors; instantaneous tide level most common | Sensitivity, Specificity, AUROC |
| 51 | A day at the beach: Enabling coastal water quality prediction with high-frequency sampling and data-driven models | United States | Random Forests | Solar irradiance, air temperature, dew point temperature, owind, awind, sampling hour, sunrise–sunset indicator, solar_noon, tide, tide change 1 h, tide change 2 h, tide stage, tide_gtm, WVHT, average wave period, dominant wave period, Wtemp_B, spring/neap phase, upwelling index, rainfall 3-day total, rainfall 7-day total | R2, MAPE, RMSE, AUROC |
| 52 | Quantitative microbial risk assessment as support for bathing waters profiling | Italy | The linear risk model based on enterococci in Area 3 (R2 = 0.77) | E. coli concentration, Enterococci concentration, accidental ingestion volume (20–50 mL), four pathogen-to-indicator conversion ratios (for HAdV, NoV, V. parahaemolyticus, Salmonella) | t-test, Sensitivity Analysis, R2 |
| 53 | Predicting ‘very poor’ beach water quality gradings using classification tree | Hong Kong | Binary CT | Rainfall day-1, day-2, day-3, 9 h rain, tide level, previous-day solar radiation, wind speed, in situ water temperature, salinity, lnEC5 (log geom. mean of last 5 E. coli samples) | Correct Positives, Correct Negatives, Overall Accuracy |
| 54 | Predicting culturable enterococci exceedances at Escambron Beach, San Juan, Puerto Rico using satellite remote sensing and artificial neural networks | Puerto Rico | ANN ensemble | Direct normal irradiance (DNI), turbidity (MODIS Rrs 645 nm), sea surface temperature (day and night AVHRR), dew point, mean sea-level (MSL), cumulative precipitation (24, 48, 72, 96, 120 h), sampling date | Accuracy, F-Measure, Area under ROC curve (AUC) |
| 55 | Predicting recreational water quality advisories: A comparison of statistical methods | United States | Gradient-boosted Random Forest model (GBM) | River discharge, precipitation, lake current vectors, wave height, wave direction, lake level, water temperature, air temperature, wind vector, percent cloud cover | AUROC, PRESS, Specificity, Sensitivity |
| 56 | Real-time forecasting of Hong Kong beach water quality by 3D deterministic model | Hong Kong | 3D deterministic model (EFDC + JETLAG) | Tidal constituents, wind speed/direction, Pearl River discharge, rainfall (as an empirical loading factor), solar radiation, water temperature, salinity, bathymetry, bottom roughness | Correlation Coefficient, RMSE, Overall Accuracy, Correct-Positive/Correct Negative Rates |
| 57 | Integration of weather conditions for predicting microbial water quality using Bayesian Belief Networks | Canada | BBN | Turbidity, conductivity, water temperature, hardness, air temperature, precipitation (day-of and 3-day sum), season | Accuracy, Cohen’s Kappa (k), Sensitivity, Specificity |
| 58 | Tidal forcing of Enterococci at marine recreational beaches at fortnightly and semidiurnal frequencies | United States | ANOVA | Season (wet/dry), tidal range, tidal stage, and their interaction terms, plus beach physiography (presence of inlet, beach slope, input-slope, beach aspect) | Post hoc comparisons, Geometric Means (GMs) |
| 59 | Long term development of bathing water quality at the German Baltic coast: spatial patterns, problems and model simulations | Germany | GETM (General Estuarine Transport Model) | River discharge, wind speed/direction, current velocity, salinity, temperature, turbidity, pH, decay coefficients of E. coli and Enterococci, rainfall proxies | R2, RMSE |
| 60 | Predictive models for determination of E. coli concentrations at inland recreational beaches | New Zealand | Multiple Linear Regression | Suspended solids, total phosphorus, particulate inorganic phosphate, total nitrogen, stream discharge, antecedent rainfall, weight adjusted rainfall, distance from lake outflow, wind, atmospheric pressure | R2, RMSE, MAE, False Positives, Specificity, False Negatives, Sensitivity, Total Correct Predictions, Accuracy |
| 61 | Modelling faecal indicator concentrations in large rural catchments using land use and topographic data | United Kingdom | Multiple Regression Analyses | Percent area of land-use types (improved pasture, rough grazing, woodland, built-up, reservoir-catchment), slope indices (sin θ, tan θ, tan1.4 θ, tan2 θ, USLE), morphometry (area, min and mean altitude, mean slope), distributed improved-pasture percentages within absolute (<1–10 km) and relative (<20–80%) flow–distance bands. | Pearson Correlation Coefficients, MLR analysis, Geometric Mean, R2 |
| 62 | Long-term water quality analysis reveals correlation between bacterial pollution and sea level rise in the northwestern Gulf of Mexico | United States | Non-Parametric Correlation | Time, population size, sea-level, site type (bayside vs. Gulfside), rainfall episodes, spatial coordinates | Kendall’s Tau Correlation, P-Values |
| 63 | Summer E. coli patterns and responses along 23 Chicago beaches | United States | Linear Regression | Wave height, Julian day, barometric pressure (plus exploratory wind speed, air temperature, rainfall) | AIC (Akaike’s Information Criterion), R2 |
References
- EPA. Recreational Water Quality Criteria; U.S. Environmental Protection Agency: Washington, DC, USA, 2012; pp. 1–69. [Google Scholar]
- EU Bathing Water Directive. Directive 2006/7/EC of the European Parliament and of the Council of 15 February 2006 Concerning the Management of Bathing Water Quality and Repealing Directive 76/160/EEC. 2006. Available online: https://eur-lex.europa.eu/LexUriServ/LexUriServ.do?uri=OJ:L:2006:064:0037:0051:EN:PDF (accessed on 1 November 2024).
- Health Canada. Guidelines for Canadian Recreational Water Quality. 2012. Available online: https://healthycanadians.gc.ca/publications/healthy-living-vie-saine/water-recreational-recreative-eau/alt/pdf/water-recreational-recreative-eau-eng.pdf (accessed on 1 November 2024).
- Krupska, K.U.; Speight, L.; Robinson, J.S.; Gilbert, A.J.; Cloke, H. Forecasting bathing water quality in the UK: A critical review. Wiley Interdiscip. Rev. Water 2024, 11, e1718. [Google Scholar] [CrossRef]
- Desta, B.N.; Tustin, J.; Sanchez, J.J.; Heasley, C.; Schwandt, M.; Bishay, F.; Chan, B.; Knezevic-Stevanovic, A.; Ash, R.; Jantzen, D.; et al. Environmental predictors of Escherichia coli concentration at marine beaches in Vancouver, Canada: A Bayesian mixed-effects modelling analysis. Epidemiol. Infect. 2024, 152, e38. [Google Scholar] [CrossRef]
- Seis, W.; Ten Veldhuis, M.C.; Rouault, P.; Steffelbauer, D.; Medema, G. A new Bayesian approach for managing bathing water quality at river bathing locations vulnerable to short-term pollution. Water Res. 2024, 252, 121186. [Google Scholar] [CrossRef]
- Mohandass, C.; Kumar, S.J.; Ramaiah, N.; Vethamony, P. Dispersion and retrievability of water quality indicators during tidal cycles in coastal Salaya, Gulf of Kachchh (West coast of India). Environ. Monit. Assess. 2010, 169, 639–645. [Google Scholar] [CrossRef]
- He, C.; Post, Y.; Dony, J.; Edge, T.; Patel, M.; Rochfort, Q. A physical descriptive model for predicting bacteria level variation at a dynamic beach. J. Water Health 2016, 14, 617–629. [Google Scholar] [CrossRef]
- Dada, A.C.; Hamilton, D.P. Predictive Models for Determination of E. coli Concentrations at Inland Recreational Beaches. Water. Air. Soil Pollut. 2016, 227, 347. [Google Scholar] [CrossRef]
- Hatvani, I.G.; Kirschner, A.K.T.; Farnleitner, A.H.; Tanos, P.; Herzig, A. Hotspots and main drivers of fecal pollution in Neusiedler See, a large shallow lake in Central Europe. Environ. Sci. Pollut. Res. 2018, 25, 28884–28898. [Google Scholar] [CrossRef]
- Herrig, I.M.; Böer, S.I.; Brennholt, N.; Manz, W. Development of multiple linear regression models as predictive tools for fecal indicator concentrations in a stretch of the lower Lahn River, Germany. Water Res. 2015, 85, 148–157. [Google Scholar] [CrossRef]
- Chudoba, E.A.; Mallin, M.A.; Cahoon, L.B.; Skrabal, S.A. Stimulation of fecal bacteria in ambient waters by experimental inputs of organic and inorganic phosphorus. Water Res. 2013, 47, 3455–3466. [Google Scholar] [CrossRef] [PubMed]
- Swinscoe, I.; Oliver, D.M.; Gilburn, A.S.; Quilliam, R.S. The seaweed fly (Coelopidae) can facilitate environmental survival and transmission of E. coli O157 at sandy beaches. J. Environ. Manag. 2018, 223, 275–285. [Google Scholar] [CrossRef] [PubMed]
- Li, J.; Peng, B.; Wei, Y.; Ye, H. Accurate extraction of surface water in complex environment based on Google Earth Engine and Sentinel-2. PLoS ONE 2021, 16, e0253209. [Google Scholar] [CrossRef]
- Buer, A.L.; Gyraite, G.; Wegener, P.; Lange, X.; Katarzyte, M.; Hauk, G.; Schernewski, G. Long term development of Bathing Water Quality at the German Baltic coast: Spatial patterns, problems and model simulations. Mar. Pollut. Bull. 2018, 135, 1055–1066. [Google Scholar] [CrossRef]
- Powers, N.C.; Pinchback, J.; Flores, L.; Huang, Y.; Wetz, M.S.; Turner, J.W. Long-term water quality analysis reveals correlation between bacterial pollution and sea level rise in the northwestern Gulf of Mexico. Mar. Pollut. Bull. 2021, 166, 112231. [Google Scholar] [CrossRef] [PubMed]
- Cyterski, M.; Shanks, O.C.; Wanjugi, P.; McMinn, B.; Korajkic, A.; Oshima, K.; Haugland, R. Bacterial and viral fecal indicator predictive modeling at three Great Lakes recreational beach sites. Water Res. 2022, 223, 118970. [Google Scholar] [CrossRef] [PubMed]
- Tselemponis, A.; Stefanis, C.; Giorgi, E.; Kalmpourtzi, A.; Olmpasalis, I.; Tselemponis, A.; Adam, M.; Kontogiorgis, C.; Dokas, I.M.; Bezirtzoglou, E.; et al. Coastal Water Quality Modelling Using E. coli, Meteorological Parameters and Machine Learning Algorithms. Int. J. Environ. Res. Public Health 2023, 20, 6216. [Google Scholar] [CrossRef]
- Lloyd, S.D.; Carvajal, G.; Campey, M.; Taylor, N.; Osmond, P.; Roser, D.J.; Khan, S.J. Predicting recreational water quality and public health safety in urban estuaries using Bayesian Networks. Water Res. 2024, 254, 121319. [Google Scholar] [CrossRef] [PubMed]
- Searcy, R.T.; Boehm, A.B. Know Before You Go: Data-Driven Beach Water Quality Forecasting. Environ. Sci. Technol. 2023, 57, 17930–17939. [Google Scholar] [CrossRef] [PubMed]
- Guo, J.; Lee, J.H.W. Development of Predictive Models for “Very Poor” Beach Water Quality Gradings Using Class-Imbalance Learning. Environ. Sci. Technol. 2021, 55, 14990–15000. [Google Scholar] [CrossRef]
- Lušić, D.V.; Kranjčević, L.; Maćešić, S.; Lušić, D.; Jozić, S.; Linšak, Ž.; Bilajac, L.; Grbčić, L.; Bilajac, N. Temporal variations analyses and predictive modeling of microbiological seawater quality. Water Res. 2017, 119, 160–170. [Google Scholar] [CrossRef]
- Thoe, W.; Gold, M.; Griesbach, A.; Grimmer, M.; Taggart, M.L.; Boehm, A.B. Predicting water quality at Santa Monica Beach: Evaluation of five different models for public notification of unsafe swimming conditions. Water Res. 2014, 67, 105–117. [Google Scholar] [CrossRef]
- Federigi, I.; Bonadonna, L.; Bonanno Ferraro, G.; Briancesco, R.; Cioni, L.; Coccia, A.M.; Della Libera, S.; Ferretti, E.; Gramaccioni, L.; Iaconelli, M.; et al. Quantitative Microbial Risk Assessment as support for bathing waters profiling. Mar. Pollut. Bull. 2020, 157, 111318. [Google Scholar] [CrossRef]
- Korajkic, A.; McMinn, B.R.; Harwood, V.J. Relationships between Microbial Indicators and Pathogens in Recreational Water Settings. Int. J. Environ. Res. Public Health 2018, 15, 2842. [Google Scholar] [CrossRef]
- USEPA. Predictive Tools for Beach Notification; U.S. Environmental Protection Agency: Washington, DC, USA, 2010; Volume I, p. 61. Available online: http://water.epa.gov/scitech/swguidance/standards/criteria/health/recreation/upload/P26-Report-Volume-I-Final_508.pdf (accessed on 3 November 2024).
- Nevers, M.B.; Whitman, R.L. Efficacy of monitoring and empirical predictive modeling at improving public health protection at Chicago beaches. Water Res. 2011, 45, 1659–1668. [Google Scholar] [CrossRef] [PubMed]
- Bedri, Z.; Corkery, A.; O’Sullivan, J.J.; Deering, L.A.; Demeter, K.; Meijer, W.G.; O’Hare, G.; Masterson, B. Evaluating a microbial water quality prediction model for beach management under the revised EU Bathing Water Directive. J. Environ. Manag. 2016, 167, 49–58. [Google Scholar] [CrossRef]
- Kim, J.H.; Grant, S.B.; McGee, C.D.; Sanders, B.F.; Largier, J.L. Locating Sources of Surf Zone Pollution: A Mass Budget Analysis of Fecal Indicator Bacteria at Huntington Beach, California. Environ. Sci. Technol. 2004, 38, 2626–2636. [Google Scholar] [CrossRef] [PubMed]
- Whitman, R.L.; Nevers, M.B. Summer E. coli patterns and responses along 23 Chicago beaches. Environ. Sci. Technol. 2008, 42, 9217–9224. [Google Scholar] [CrossRef]
- Aragonés, L.; López, I.; Palazón, A.; López-Ubeda, R.; García, C. Evaluation of the quality of coastal bathing waters in Spain through fecal bacteria Escherichia coli and Enterococcus. Sci. Total Environ. 2016, 566–567, 288–297. [Google Scholar] [CrossRef]
- Zhu, W.D.; Qian, C.Y.; He, N.Y.; Kong, Y.X.; Zou, Z.Y.; Li, Y.W. Research on Chlorophyll-a Concentration Retrieval Based on BP Neural Network Model—Case Study of Dianshan Lake, China. Sustainability 2022, 14, 8894. [Google Scholar] [CrossRef]
- Smith, P.; Carroll, C.; Wilkins, B.; Johnson, P.; Gabhainn, S.N.; Smith, L.P. The effect of wind speed and direction on the distribution of sewage-associated bacteria. Lett. Appl. Microbiol. 1999, 28, 184–188. [Google Scholar] [CrossRef] [PubMed]
- Grbčić, L.; Družeta, S.; Mauša, G.; Lipić, T.; Lušić, D.V.; Alvir, M.; Lučin, I.; Sikirica, A.; Davidović, D.; Travaš, V.; et al. Coastal water quality prediction based on machine learning with feature interpretation and spatio-temporal analysis. Environ. Model. Softw. 2022, 155, 105458. [Google Scholar] [CrossRef]
- Wang, L.; Zhu, Z.; Sassoubre, L.; Yu, G.; Liao, C.; Hu, Q.; Wang, Y. Improving the robustness of beach water quality modeling using an ensemble machine learning approach. Sci. Total Environ. 2021, 765, 142760. [Google Scholar] [CrossRef] [PubMed]
- Uddin, M.G.; Nash, S.; Rahman, A.; Olbert, A.I. Assessing optimization techniques for improving water quality model. J. Clean. Prod. 2023, 385, 135671. [Google Scholar] [CrossRef]
- Wang, X.; Cui, J.; Xu, M. A Chlorophyll-a Concentration Inversion Model Based on Backpropagation Neural Network Optimized by an Improved Metaheuristic Algorithm. Remote Sens. 2024, 16, 1503. [Google Scholar] [CrossRef]
- Bourel, M.; Segura, A.M.; Crisci, C.; López, G.; Sampognaro, L.; Vidal, V.; Kruk, C.; Piccini, C.; Perera, G. Machine learning methods for imbalanced data set for prediction of faecal contamination in beach waters. Water Res. 2021, 202, 117450. [Google Scholar] [CrossRef] [PubMed]
- Aliashrafi, A.; Peleato, N.M. Monitoring Microbial Quality of Source Waters Using Bayesian Belief Networks. In Canadian Society of Civil Engineering Annual Conference; Springer: Singapore, 2023; pp. 229–238. [Google Scholar] [CrossRef]
- Mälzer, H.J.; aus der Beek, T.; Müller, S.; Gebhardt, J. Comparison of different model approaches for a hygiene early warning system at the lower Ruhr River, Germany. Int. J. Hyg. Environ. Health 2016, 219, 671–680. [Google Scholar] [CrossRef]
- Hafeez, S.; Wong, M.S.; Ho, H.C.; Nazeer, M.; Nichol, J.; Abbas, S.; Tang, D.; Lee, K.H.; Pun, L. Comparison of machine learning algorithms for retrieval of water quality indicators in case-ii waters: A case study of hong kong. Remote Sens. 2019, 11, 617. [Google Scholar] [CrossRef]
- Crowther, J.; Bradford, M.; Kay, D.; Francis, C. Modelling Faecal Indicator Concentrations in Large Rural Catchments Using Land Use and Topographic Data. 2002. Available online: https://academic.oup.com/jambio/article/94/6/962/6722154 (accessed on 3 November 2024).
- Boehm, A.B.; Weisberg, S.B. Tidal forcing of enterococci at marine recreational beaches at fortnightly and semidiurnal frequencies. Environ. Sci. Technol. 2005, 39, 5575–5583. [Google Scholar] [CrossRef] [PubMed]
- Shutler, J.D.; Warren, M.A.; Miller, P.I.; Barciela, R.; Mahdon, R.; Land, P.E.; Edwards, K.; Wither, A.; Jonas, P.; Murdoch, N.; et al. Operational monitoring and forecasting of bathing water quality through exploiting satellite Earth observation and models: The AlgaRisk demonstration service. Comput. Geosci. 2015, 77, 87–96. [Google Scholar] [CrossRef]
- Chan, S.N.; Thoe, W.; Lee, J.H.W. Real-time forecasting of Hong Kong beach water quality by 3D deterministic model. Water Res. 2013, 47, 1631–1647. [Google Scholar] [CrossRef]
- Brooks, W.R.; Fienen, M.N.; Corsi, S.R. Partial least squares for efficient models of fecal indicator bacteria on Great Lakes beaches. J. Environ. Manag. 2013, 114, 470–475. [Google Scholar] [CrossRef]
- Park, Y.; Kim, M.; Pachepsky, Y.; Choi, S.; Cho, J.; Jeon, J.; Cho, K.H. Development of a Nowcasting System Using Machine Learning Approaches to Predict Fecal Contamination Levels at Recreational Beaches in Korea. J. Environ. Qual. 2018, 47, 1094–1102. [Google Scholar] [CrossRef] [PubMed]
- Thoe, W.; Choi, K.W.; Lee, J.H.W. Predicting “very poor” beach water quality gradings using classification tree. J. Water Health 2016, 14, 97–108. [Google Scholar] [CrossRef]
- Brooks, W.; Corsi, S.; Fienen, M.; Carvin, R. Predicting recreational water quality advisories: A comparison of statistical methods. Environ. Model. Softw. 2016, 76, 81–94. [Google Scholar] [CrossRef]
- Ivanda, A.; Šerić, L.; Braović, M.; Stipaničev, D. Performance Comparison of the Cogent Confabulation Classifier with Other Commonly Used Supervised Machine Learning Algorithms for Bathing Water Quality Assessment. J. Comput. Inf. Technol. 2022, 30, 1–21. [Google Scholar] [CrossRef]
- Seis, W.; Zamzow, M.; Caradot, N.; Rouault, P. On the implementation of reliable early warning systems at European bathing waters using multivariate Bayesian regression modelling. Water Res. 2018, 143, 301–312. [Google Scholar] [CrossRef]
- Panidhapu, A.; Li, Z.; Aliashrafi, A.; Peleato, N.M. Integration of weather conditions for predicting microbial water quality using Bayesian Belief Networks. Water Res. 2020, 170, 115349. [Google Scholar] [CrossRef]
- Herrig, I.; Seis, W.; Fischer, H.; Regnery, J.; Manz, W.; Reifferscheid, G.; Böer, S. Prediction of fecal indicator organism concentrations in rivers: The shifting role of environmental factors under varying flow conditions. Environ. Sci. Eur. 2019, 31, 59. [Google Scholar] [CrossRef]
- Lam, M.-Y.; Ahmadian, R. Predicting Fecal-Indicator Organisms in Coastal Waters Using a Complex Nonlinear Artificial Intelligence Model. J. Environ. Eng. 2023, 149, 04022093. [Google Scholar] [CrossRef]
- Motamarri, S.; Boccelli, D.L. Development of a neural-based forecasting tool to classify recreational water quality using fecal indicator organisms. Water Res. 2012, 46, 4508–4520. [Google Scholar] [CrossRef]
- García-Alba, J.; Bárcena, J.F.; Ugarteburu, C.; García, A. Artificial neural networks as emulators of process-based models to analyse bathing water quality in estuaries. Water Res. 2019, 150, 283–295. [Google Scholar] [CrossRef] [PubMed]
- Thoe, W.; Wong, S.H.C.; Choi, K.W.; Lee, J.H.W. Daily prediction of marine beach water quality in Hong Kong. J. Hydro-Environ. Res. 2012, 6, 164–180. [Google Scholar] [CrossRef]
- Dahane, A.; Benameur, R.; Naloufi, M.; Souihi, S.; Abreu, T.; Lucas, F.S.; Mellouk, A. IoT Urban River Water Quality System Using Federated Learning via Knowledge Distillation. In Proceedings of the ICC 2024—IEEE International Conference on Communications, Denver, CO, USA, 9–13 June 2024; pp. 1515–1520. [Google Scholar] [CrossRef]
- Thoe, W.; Lee, J.H. wei Nonlinear bacterial load-streamflow response on a marine beach. Hydrol. Process. 2015, 29, 1238–1251. [Google Scholar] [CrossRef]
- Searcy, R.T.; Boehm, A.B. A Day at the Beach: Enabling Coastal Water Quality Prediction with High-Frequency Sampling and Data-Driven Models. Environ. Sci. Technol. 2021, 55, 1908–1918. [Google Scholar] [CrossRef] [PubMed]
- Gambiroža, J.Č.; Kosović, I.N.; Ordulj, M.; Baumgartner, N.; Tomaš, A.V.; Jozić, S. Estimating Bathing Water Quality from Meteorological Measurements. In Proceedings of the 2024 9th International Conference on Smart and Sustainable Technologies (SpliTech), Bol and Split, Croatia, 25–28 June 2024. [Google Scholar] [CrossRef]
- Madani, M.; Seth, R. Evaluating multiple predictive models for beach management at a freshwater beach in the Great Lakes region. J. Environ. Qual. 2020, 49, 896–908. [Google Scholar] [CrossRef]
- Thoe, W.; Lee, J.H.W. Daily Forecasting of Hong Kong Beach Water Quality by Multiple Linear Regression Models. J. Environ. Eng. 2014, 140, 04013007. [Google Scholar] [CrossRef]
- Aranda, D.; Lopez, J.V.; Solo-Gabriele, H.M.; Fleisher, J.M. Using probabilities of enterococci exceedance and logistic regression to evaluate long term weekly beach monitoring data. J. Water Health 2016, 14, 81–89. [Google Scholar] [CrossRef]
- Deng, Z.; Namwamba, F.; Zhang, Z. Development of decision support system for managing and using recreational beaches. J. Hydroinformatics 2014, 16, 447–457. [Google Scholar] [CrossRef]
- Wai, K.P.; Chia, M.Y.; Koo, C.H.; Huang, Y.F.; Chong, W.C. Applications of deep learning in water quality management: A state-of-the-art review. J. Hydrol. 2022, 613, 128332. [Google Scholar] [CrossRef]
- Hipsey, M.R.; Gal, G.; Arhonditsis, G.B.; Carey, C.C.; Elliott, J.A.; Frassl, M.A.; Janse, J.H.; de Mora, L.; Robson, B.J. A system of metrics for the assessment and improvement of aquatic ecosystem models. Environ. Model. Softw. 2020, 128, 104697. [Google Scholar] [CrossRef]
- Gambin, A.F.; Angelats, E.; Gonzalez, J.S.; Miozzo, M.; DIni, P. Sustainable Marine Ecosystems: Deep Learning for Water Quality Assessment and Forecasting. IEEE Access 2021, 9, 121344–121365. [Google Scholar] [CrossRef]
- Džal, D.; Kosović, I.N.; Mastelić, T.; Ivanković, D.; Puljak, T.; Jozić, S. Modelling bathing water quality using official monitoring data. Water 2021, 13, 3005. [Google Scholar] [CrossRef]
- Zhang, J.; Qiu, H.; Li, X.; Niu, J.; Nevers, M.B.; Hu, X.; Phanikumar, M.S. Real-Time Nowcasting of Microbiological Water Quality at Recreational Beaches: A Wavelet and Artificial Neural Network-Based Hybrid Modeling Approach. Environ. Sci. Technol. 2018, 52, 8446–8455. [Google Scholar] [CrossRef]
- Gorelick, N.; Hancher, M.; Dixon, M.; Ilyushchenko, S.; Thau, D.; Moore, R. Google Earth Engine: Planetary-scale geospatial analysis for everyone. Remote Sens. Environ. 2017, 202, 18–27. [Google Scholar] [CrossRef]
- Paulino, R.S.; Martins, V.S.; Novo, E.M.L.M.; Barbosa, C.C.F.; de Carvalho, L.A.S.; Begliomini, F.N. Assessment of Adjacency Correction over Inland Waters Using Sentinel-2 MSI Images. Remote Sens. 2022, 14, 1829. [Google Scholar] [CrossRef]
- Soppa, M.A.; Silva, B.; Steinmetz, F.; Keith, D.; Scheffler, D.; Bohn, N.; Bracher, A. Assessment of Polymer Atmospheric Correction Algorithm for Hyperspectral Remote Sensing Imagery over Coastal Waters. Sensors 2021, 21, 4125. [Google Scholar] [CrossRef]
- Pramlall, S.; Jackson, J.M.; Konik, M.; Costa, M. Merged Multi-Sensor Ocean Colour Chlorophyll Product Evaluation for the British Columbia Coast. Remote Sens. 2023, 15, 687. [Google Scholar] [CrossRef]
- Johansen, R.A.; Reif, M.K.; Saltus, C.L.; Pokrzywinski, K.L. A Broadscale Assessment of Sentinel-2 Imagery and the Google Earth Engine for the Nationwide Mapping of Chlorophyll a. Sustainability 2024, 16, 2090. [Google Scholar] [CrossRef]
- Laureano-Rosario, A.E.; Duncan, A.P.; Symonds, E.M.; Savic, D.A.; Muller-Karger, F.E. Predicting culturable enterococci exceedances at Escambron Beach, San Juan, Puerto Rico using satellite remote sensing and artificial neural networks. J. Water Health 2019, 17, 137–148. [Google Scholar] [CrossRef]
- Prasad, A.; Prasad, P.R.C.; Rao, N.S. Assessing the water quality dynamics in the coastal waters of Kollam (Kerala, India) using Sentinel images. Anthr. Coasts 2024, 7, 10. [Google Scholar] [CrossRef]
- Zhang, Z.; Deng, Z.; Rusch, K.A.; Walker, N.D. Modeling system for predicting enterococci levels at Holly Beach. Mar. Environ. Res. 2015, 109, 140–147. [Google Scholar] [CrossRef]
- Li, L.; Qiao, J.; Yu, G.; Wang, L.; Li, H.Y.; Liao, C.; Zhu, Z. Interpretable tree-based ensemble model for predicting beach water quality. Water Res. 2022, 211, 118078. [Google Scholar] [CrossRef] [PubMed]
- Venter, Z.S.; Barton, D.N.; Chakraborty, T.; Simensen, T.; Singh, G. Global 10 m Land Use Land Cover Datasets: A Comparison of Dynamic World, World Cover and Esri Land Cover. Remote Sens. 2022, 14, 4101. [Google Scholar] [CrossRef]
- Pahlevan, N.; Smith, B.; Alikas, K.; Anstee, J.; Barbosa, C.; Binding, C.; Bresciani, M.; Cremella, B.; Giardino, C.; Gurlin, D.; et al. Simultaneous retrieval of selected optical water quality indicators from Landsat-8, Sentinel-2, and Sentinel-3. Remote Sens. Environ. 2022, 270, 112860. [Google Scholar] [CrossRef]
- Senta, A.; Šerić, L. Remote sensing data driven bathing water quality assessment using sentinel-3. Indones. J. Electr. Eng. Comput. Sci. 2021, 21, 1634–1647. [Google Scholar] [CrossRef]
Disclaimer/Publisher’s Note: The statements, opinions and data contained in all publications are solely those of the individual author(s) and contributor(s) and not of MDPI and/or the editor(s). MDPI and/or the editor(s) disclaim responsibility for any injury to people or property resulting from any ideas, methods, instructions or products referred to in the content. |
© 2025 by the authors. Licensee MDPI, Basel, Switzerland. This article is an open access article distributed under the terms and conditions of the Creative Commons Attribution (CC BY) license (https://creativecommons.org/licenses/by/4.0/).

