Abstract
Forests are pivotal to hydrologic regulation, yet province-wide dynamics across complex terrain remain insufficiently quantified. We quantified Sichuan’s forest water conservation dynamics (1990–2023), coupling the InVEST water yield model with a topographic–hydraulic correction (topographic index, saturated hydraulic conductivity, land-cover-specific flow velocity). The model used precipitation and potential evapotranspiration, land-use/cover, soil texture, and rooting depth, and was calibrated to provincial water resources statistics. Outputs were stratified by elevation and slope and monetized via a replacement cost (reservoir capacity) method. Sichuan exhibited a persistent high-capacity belt along basin–mountain transitions and the southeastern ranges, contrasting with low values on the western plateau; period maxima intensified in 2020–2023. Interannual variability closely tracked precipitation anomalies against largely stable atmospheric demand; per-unit capacity declined monotonically with slope, and total capacity generally increased with elevation, with >3500 m both highest and most variable. Economic value rose overall but fluctuated and showed marked inter-city heterogeneity. We conclude that climate pacing operating on a terrain-anchored template governs Sichuan’s forest water conservation service, supporting precision, slope-aware forest management, and differentiated ecological compensation to stabilize hydrologic regulation under climate variability.
1. Introduction
Forests, as a fundamental component of terrestrial ecosystems, deliver a variety of ecosystem services—including carbon sequestration, biodiversity maintenance, nutrient cycling, soil conservation, and, critically, water regulation [1,2]. Among these, water conservation is particularly pivotal, as it directly influences regional hydrological processes and underpins agricultural production, urban water supply, industrial development, and socioeconomic sustainability [3,4,5]. Through mechanisms such as canopy interception, litter water storage, soil infiltration and storage, vegetation transpiration, and groundwater recharge, forests function as both a “sponge” and a “reservoir” [6]. Specifically, forest ecosystems can effectively reduce surface runoff, delay flood peaks, regulate baseflow, replenish groundwater, and enhance water quality, playing an irreplaceable role in watershed hydrology and mitigating water resource risks [7,8].
With intensified global climate change, the frequency and intensity of extreme weather events—such as heavy rainfall, floods, and droughts—have significantly increased [9]. Climate warming and extreme weather events not only accelerate the water cycle but also redistribute precipitation in space and time, exacerbating water resource conflicts [10]. In this context, the water conservation function of forests has acquired greater strategic significance: it serves as a key measure for addressing climate change and ensuring regional water security, while also providing indispensable “ecological safeguards” for downstream socioeconomic systems [11,12]. Consequently, quantitatively assessing forest water conservation capacity and elucidating its spatial distribution and driving mechanisms are both scientifically meaningful and practically valuable for watershed management, ecological compensation design, and regional sustainable development.
Sichuan Province in southwestern China covers about 486,000 km2 and features diverse terrain from the Hengduan Mountains and eastern Qinghai–Tibetan Plateau in the west to the Sichuan Basin in the east [13,14]. Forests cover ~37% of the province, concentrated along the basin rim, western plateau, and Panxi region, and are vital for water regulation and biodiversity conservation, especially in the Hengduan hotspot and giant panda habitats [15,16]. Hydrologically, Sichuan is a key ecological barrier and headwater source of the upper Yangtze and Yellow Rivers, with tributaries like the Min, Dadu, and Jialing supplying critical water and flood-regulation services to downstream regions [17,18]. Thus, evaluating forest water conservation capacity at the provincial scale is strategically important for Yangtze water security and regional sustainability.
Ecosystem service models have become mainstream tools for quantitatively assessing water conservation [4,10,19]. Among them, the InVEST model (Integrated Valuation of Ecosystem Services and Tradeoffs) is widely utilized across regions and scales due to its simplified representation of ecological processes, flexible data requirements, and spatially explicit outputs [5,20,21,22]. Based on water balance principles, the model integrates precipitation, evapotranspiration, vegetation cover, and soil properties to simulate water yield and regulation at watershed and regional scales, making it particularly suitable for forest water conservation studies [1,4,20,23].
International applications of the InVEST model have demonstrated its effectiveness in tropical, temperate, and arid regions, revealing the significant contributions of forests to water conservation and hydrological security [6,24]. Within China, its usage in national and regional ecosystem assessments has grown notably. For example, in northwestern Sichuan, InVEST-based evaluation from 2007 to 2021 shows an upward trend in water conservation, with spatial patterns correlating with precipitation, evapotranspiration, and elevation gradients [22]. In the Yellow River Basin within Sichuan, InVEST-based analyses identified significant effects of climate and land-use changes on water conservation [25]. More recently, advanced approaches combining InVEST with machine learning have been used to disentangle drivers of water yield at the provincial scale, while spatial econometric analyses have revealed tradeoffs and synergies among multiple ecosystem services such as water yield and soil conservation [26,27,28]. These findings affirm the model’s applicability and explanatory strength in Sichuan’s heterogeneous terrain and diverse climatic conditions.
However, several methodological challenges remain in complex mountainous regions, where hydrological processes are highly nonlinear and spatially heterogeneous. The simplified structure of InVEST and its reliance on the empirical parameter (Z) may constrain predictive fidelity in such regions, as precipitation seasonality, slope-controlled infiltration time, and variations in soil and rooting properties can substantially alter the Budyko partitioning between evapotranspiration and water yield [29,30]. Therefore, local calibration of Z and careful evaluation of soil and land-cover datasets are essential for ensuring spatially robust applications—particularly in western Sichuan, where steep gradients and diverse vegetation types strongly influence runoff generation and water retention [10,20,23].
Despite the model’s widespread adoption, key research gaps remain unaddressed. Most studies focus on specific watersheds or ecological function zones, lacking comprehensive province-wide assessments of forest water conservation. Water conservation differences across geomorphic units, climate zones, and slope types at the provincial level remain inadequately revealed. This study’s aims are as follows: quantify the spatiotemporal patterns of water conservation in Sichuan province’s forests from 1990 to 2023; identify dominant drivers and their interactive effects; and evaluate the efficacy of ecological restoration policies and propose spatially explicit management strategies.
2. Materials and Methods
2.1. Study Area
Sichuan Province (26°03′–34°19′ N, 97°21′–108°12′ E) covers ~486,000 km2 and exhibits a pronounced east–west orographic gradient, rising from 107 m in the Sichuan Basin to 7845 m on the western plateau (Figure 1). The climate is dominantly subtropical monsoon but varies sharply with elevation: the eastern basin has a humid subtropical monsoon climate with mean annual temperature of 16–18 °C and mean annual precipitation of 900–1200 mm, whereas the western plateau is alpine, with a mean annual temperature of 4–12 °C and precipitation of 500–900 mm [13,26].

Figure 1.
Elevation and hydrological features in the Sichuan Province, China.
2.2. Water Yield Model
The InVEST water yield module is a spatially explicit, grid-based annual water balance model grounded in the Budyko hydrothermal equilibrium [29,30]. The model estimates the total annual water yield (Y(x), mm) for each pixel (x) of the study catchment as the total catchment annual precipitation (P) minus the total catchment annual actual evapotranspiration (AET). The formula is expressed as follows:
where and are actual evapotranspiration (mm) and annual precipitation (mm) for pixel x, respectively. is the approximate Budyko curve proposed by Zhang et al. (2004) [30] (Equation (2)), which defines the shape of the curve relating potential evapotranspiration to AET.
where is the potential evapotranspiration and is a non-physical parameter that characterizes the natural climatic–soil properties, both detailed below.
where is the volumetric (mm) plant-available water content. The soil texture and effective rooting depth define , which establishes the amount of water that can be held and released in the soil for plant use. It is estimated as the product of the plant-available water capacity (PAWC) and the minimum of the root-restricting layer depth and vegetation rooting depth (Figure 2). is the annual precipitation on pixel x. Z is an empirical factor, sometimes referred to as “seasonality factor”, which captures the local precipitation pattern and additional hydrogeological characteristics. The 1.25 term is the minimum value of , which can be seen as a value for bare soil (when root depth is 0), as explained by Donohue et al. (2012) [29].
where is the reference evapotranspiration from pixel x and is the plant (vegetation) evapotranspiration coefficient associated with the LULC on pixel x.
where is the average of mean Tmax and Tmin for every month (°C), respectively, TD is the difference between mean Tmax and Tmin for every month (°C), and Ra is the extraterrestrial radiation (MJ/(m2 d)). Radiation data were obtained from the United Nations Food and Agriculture Organization (FAO) Irrigation Drainage Paper.
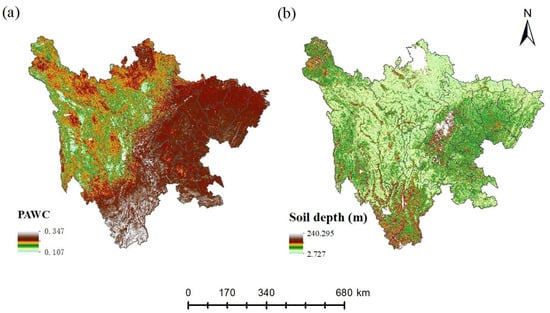
Figure 2.
Spatial distributions of bio-physical characteristics of the Sichuan Province, China: (a) PAWC, plant-available water capacity; (b) soil depth.
2.3. Calculation of Water Conservation
After the water yield is calculated according to the InVEST model, the topographic index (TI), saturated soil hydraulic conductivity (), and velocity coefficient (Vel) are used to correct the water yield to obtain the water conservation [22,23]. The formula for calculation is as follows:
where WR represents the water conservation, Vel denotes the velocity coefficient (which varies according to the land-use/land-cover types, TI denotes the topographic index, denotes the saturated soil hydraulic conductivity (which is calculated according to the soil texture and organic matter), and Y denotes the water yield calculated according to the InVEST model.
2.4. Water Conservation Value Estimation
The shadow project method has been widely applied to assess the water conservation value of ecosystems. This approach conceptualizes ecosystems as natural reservoirs and estimates their economic value by calculating the equivalent construction cost of artificial reservoirs with matching water retention capacities. The calculation formula is expressed as follows:
where E represents the water conservation value (CNY), α denotes the unit reservoir capacity construction cost (CNY/m3), and V indicates the total regional water conservation volume (m3). To ensure data comparability and consistency, this study adopts the 2020 unit reservoir capacity construction cost of 8.4 CNY/m3 in China, without accounting for monetary inflation. This standardization addresses significant historical variations in construction costs, such as the increase from approximately 6.11 CNY/m3 in 2005 to 8.39 CNY/m3 in 2018 (a 37.32% rise).
2.5. Data Acquisition and Preprocessing
The InVEST water yield model requires data on average annual precipitation, average annual potential evapotranspiration, land-use and land-cover, soil depth, elevation, plant-available water content, watersheds, a bio-physical table with attributes of each land-use and land-cover, and the seasonality factor Z [5]. Precipitation and potential evapotranspiration (1990–2023) were obtained from the National Tibetan Plateau/Third Pole Environment Data Center [31,32]. A 30 m digital elevation model (GDEMV2) was processed in ArcGIS 10.8 to derive slope (%), aspect, and flow accumulation. Soil depth data were extracted from the depth-to-bedrock map of China at a spatial resolution of 100 m [33], which was used for subsequent calculations. The root-restricting layer depth and plant-available water content were calculated and utilized in the InVEST model. Soil texture (sand, silt, clay%), organic carbon (%), and bulk density (g/cm3) were extracted from the Harmonized World Soil Database (HWSD v1.2). Saturated hydraulic conductivity (, cm/day) was computed as follows:
Land-use/land-cover (LULC): seven-period LULC maps (1990–2023, 1 km resolution) were obtained from the Resource and Environment Data Cloud Platform (RESDC) (http://www.resdc.cn, accessed on 28 October 2025).
2.6. Model Calibration
In order to evaluate the performance of the InVEST model, we collected water resources statistics for Sichuan Province from the local water resources bulletins (https://slt.sc.gov.cn, accessed on 28 October 2025) for the years 2000, 2005, 2010, 2015, 2020, and 2023. The model was calibrated by adjusting the empirical “Z” parameter of the water yield module to minimize the discrepancy between the simulated total water yield and the statistical data at the provincial scale. The final Z value was determined through an iterative process to achieve the best overall fit across the calibration years, acknowledging that this lumped parameter encapsulates average watershed characteristics but may not capture sub-grid heterogeneity [5,29].
3. Results
3.1. Spatiotemporal Distribution Patterns of Water Yield
Figure 3 shows temporal variations in precipitation (P), potential evapotranspiration (PET), actual evapotranspiration (AET), and water yield (WY) from 1900 to 2023. Precipitation ranged from 721.51 mm in 2006 to 952.87 mm in 1998, with a mean of 860.97 ± 56.90 mm, and exhibited a significant increasing trend (K = 2.16, p < 0.05). PET was relatively stable (867.93–948.71 mm, mean 903.84 ± 20.15 mm) with no significant trend. AET varied between 491.77 mm (1992) and 521.93 mm (2013), averaging 508.19 ± 8.19 mm, and showed a significant decreasing trend (K = −445.29, p < 0.05). Water yield fluctuated widely, from 225.49 mm in 2006 to 418.86 mm in 1998, with a mean of 344.09 ± 45.07 mm.
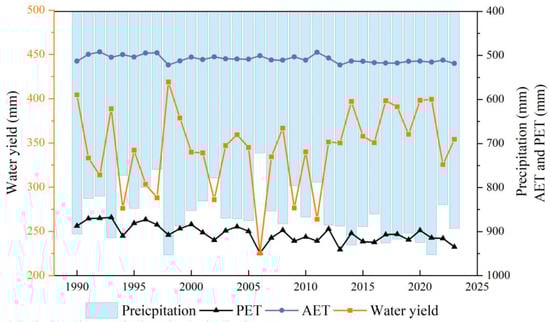
Figure 3.
Annual precipitation, actual evapotranspiration (AET), potential evapotranspiration (PET), and water yield of Sichuan Province during 1990–2023.
Spatially, precipitation showed limited heterogeneity (Figure 4a), being higher in the central, eastern, and southern regions, and lower in the west and northwest. Evapotranspiration displayed a clear northwest–southeast gradient (Figure 4b), indicating marked spatial heterogeneity. The INVEST model results indicate a progressive increase in the multi-year average maximum water yield across four distinct periods (1990–1999, 2000–2009, 2010–2019, and 2020–2023) (Figure 5). The corresponding ranges of multi-year average water yield were 81.30–1033.05 mm yr−1, 77.24–931.09 mm yr−1, 58.07–1160.45 mm yr−1, and 74.14–1185.22 mm yr−1, respectively. Spatially, water yield revealed a distinct east–west gradient across Sichuan’s forested regions (Figure 5), with higher values in the low-elevation Sichuan Basin and adjacent southeastern humid ranges (below 1500 m; Figure 1) and lower values in the western plateau (above 3000 m). Temporally, a modest upward trend was observed across the four study periods, with slightly increased values in the central and southern forest zones and the highest provincial mean during 2020–2023 (1185.22 mm yr−1).
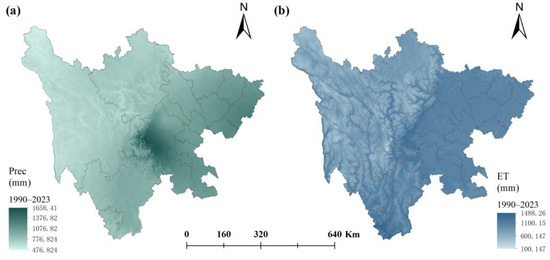
Figure 4.
Spatial distribution of multi-year mean precipitation (a) and evapotranspiration (b) in Sichuan Province (1990–2023).

Figure 5.
Spatial distribution patterns of multi-year water yield across four distinct periods in forest distribution areas of Sichuan Province: (a) 1990–1999; (b) 2000–2009; (c) 2010–2019; (d) 2020–2023.
3.2. Spatiotemporal Characteristics of Water Conservation
Over 1990–2023, total forest water conservation averaged 457.36 × 10⁸ m3, with a maximum of 570.00 × 10⁸ m3 (1998) and a minimum of 275.86 × 10⁸ m3 (2006) (Figure 6). A declining phase occurred during 1990–2006, followed by an increasing phase during 2006–2023; the overall linear trend was weakly positive (1.38 × 10⁸ m3·yr−1; p > 0.05). In 2019–2023, capacity peaked at 548.82 × 10⁸ m3 (2020), decreased to 436.27 × 10⁸ m3 (2022), and rebounded to 478.84 × 10⁸ m3 (2023). Across altitude classes (Figure 7), the >3500 m zone persistently exhibited the highest capacity and the largest interannual amplitude, with a prominent peak near 1998 and secondary highs in 2004–2005, 2015–2017, and 2020–2021; the 2000–3500 m zone ranked second, while the <800 m, 800–1500 m, and 1500–2000 m zones were comparable (43.77–112.84 × 10⁸ m3) and showed synchronous troughs in the mid-2000s and early 2010s. Since 2019, all altitude bands converged to 72.72–127.12 × 10⁸ m3 while retaining the same ranking. By slope class (Figure 8), per-unit-area capacity ranged from 1.59 to 4.52 × 10³ m3·hm−2 and maintained a persistent order of Class I (<3°) > Class II (3–8°) > Class III (8–15°) > Class IV (15–25°) > Class V (>25°); coherent minima occurred around 2006 and 2011 (~1.6–2.1 × 10³ m3·hm−2) and maxima during 1998–2000 and 2013–2017. Interannual amplitude decreased with increasing slope, and the rank order persisted through 2023.
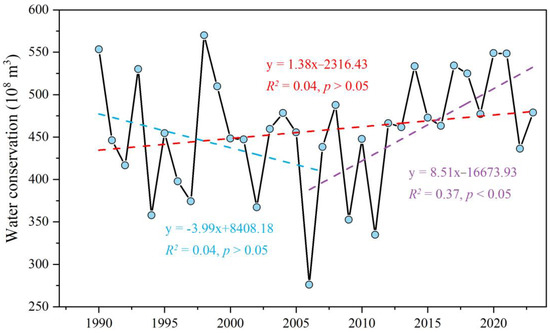
Figure 6.
Interannual dynamics of forest water conservation capacity in Sichuan Province (1990–2023). Note: dashed lines represent trendlines derived from least squares regression, with distinct phases demarcated by color: the red dashed line (1990–2023) illustrates the overall weakly positive trend, while the blue (1990–2005) and purple (2006–2023) lines highlight contrasting patterns of decline and increase, respectively.

Figure 7.
Interannual dynamics of forest water conservation capacity across different altitude gradients (1990–2023).
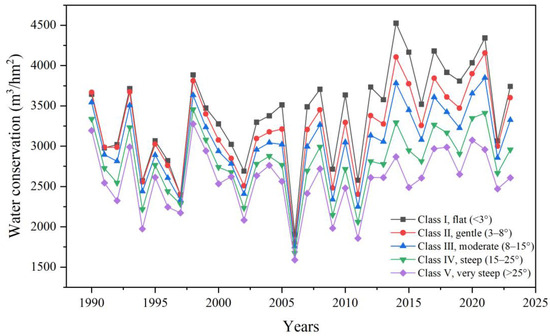
Figure 8.
Interannual dynamics of forest water conservation capacity per unit area under different slope gradations (1990–2023).
Across 1990–2023, forest water conservation capacity in Sichuan displayed persistent and pronounced spatial heterogeneity (Figure 9). High levels were concentrated along the basin–mountain transition and in the southeastern mountains, moderate levels dominated the basin rim and the southwest, and low levels prevailed on the western high-elevation plateau. This spatial framework remained broadly stable across the eight snapshots, with interannual variability expressed mainly as areal expansions or contractions of high-value zones—expansions in 1998, 2015, and 2020, contractions in 2005 and 2010—and a re-emergence of moderate-to-high levels along the transition zone by 2023. Decadal trend mapping (Figure 10) indicates that 1990–1999 was characterized by weak, mostly non-significant change with only scattered significant pixels; during 2000–2009, negative trends expanded, including clusters significant at p < 0.05–0.01 in parts of the basin and the transition belt; in 2010–2019, positive trends became widespread with multiple significant clusters in the transition and southeastern mountainous areas. Over the full period (1990–2023), the province exhibits a mixed pattern, with positive slopes predominating in the eastern and southeastern mountains, localized or weak negative slopes on the western plateau, and extensive areas showing no statistically significant trend.
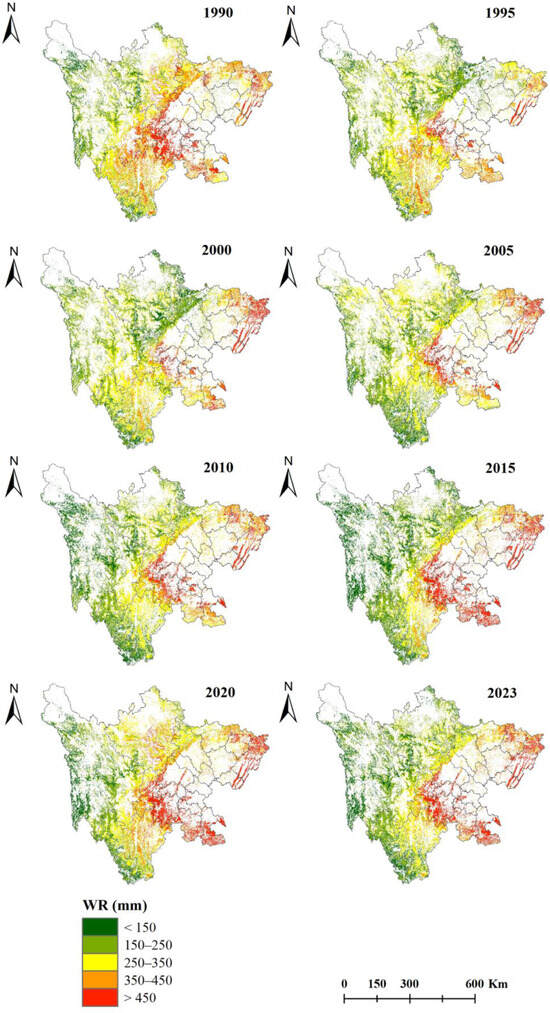
Figure 9.
Spatial distribution patterns of forest water conservation capacity in Sichuan Province, 1990–2023.
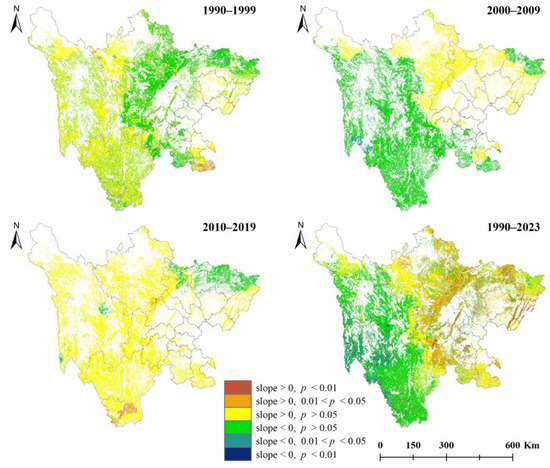
Figure 10.
Spatial patterns of temporal trends in forest water conservation capacity during distinct periods (1990–1999; 2000–2009; 2010–2019; 1990–2023).
3.3. Value of Water Conservation Services
The monetary value of forest water conservation services in Sichuan Province exhibited significant regional disparities from 2005 to 2023 (Table 1). The provincial total surged from CNY 190.473 billion (2005) to CNY 223.403 billion (2023), peaking at CNY 275.907 billion in 2015. Leshan City remained a persistent high-value zone, growing from CNY 22.949 billion to CNY 28.476 billion (24.1%), with a peak of CNY 29.652 billion in 2020. Luzhou City showed a rise-then-decline pattern, reaching CNY 23.730 billion (2015) before dropping to CNY 18.774 billion (−20.9%). Extreme volatility occurred in Zigong City, where the value plummeted 58.6% from CNY 5.502 billion (2015) to CNY 2.276 billion, exhibiting the highest variability (CV = 0.62) province-wide. Chengdu experienced phased growth, peaking at CNY 12.869 billion (2020) then declining to CNY 11.844 billion (−7.9%). Regional contrasts reveal a 16.5% decrease in Mianyang (2015–2023) against an 11.1% increase in Nanchong (2020–2023).

Table 1.
Monetary value of forest water conservation services by prefecture-level city in Sichuan Province (2005–2023, unit: CNY billion).
4. Discussion
4.1. Dynamics and Drivers of Forest Water Conservation Capacity in Sichuan Province
Water conservation is a key regulating ecosystem service that partitions water among surface runoff, soil storage, and subsurface flow, stabilizing regional hydrology, sustaining baseflow in dry periods, and attenuating floods to reduce sedimentation and protect drinking-water sources [3,23]. Its magnitude varies with coupled drivers—climate, soil properties, and land-use/cover—and is sensitive to climate variability and human activities, consistent with prior evidence and this study [7,10,23,34].
Forest ecosystems in Sichuan Province play an irreplaceable role in regional hydrological regulation, yet their water conservation capacity has exhibited complex spatiotemporal dynamics over the past three decades. Temporal dynamics of Sichuan’s forest water conservation capacity are dominated by hydroclimatic pacing rather than monotonic land-cover change. From 1990 to 2023, total water capacity followed a U-shaped trajectory—declining to a province-wide nadir in 2006 and then recovering to a late-2010s/2020 crest—yielding a weak, statistically non-significant linear increase overall (1.38 × 10⁸ m3 yr−1, p > 0.05). This evolution co-occurs with a significant rise in precipitation, statistically stable PET, a slight decline in AET, and corresponding swings in WY, with lows in the 2006 drought year and highs in the late-1990s wet phase (Figure 3 and Figure 6). Interpreted through a Budyko lens, interannual anomalies in precipitation dominate the yearly partitioning between ET and runoff/storage, while catchment attributes modulate the efficiency with which incident water is retained and slowly released—precisely the mechanism expected in humid–subhumid mountain regions [1,29].
Beyond climatic variability, the observed anomalies in AET and WY can also be attributed to ecological restoration, land-use change, and human water consumption. Since the implementation of large-scale ecological restoration programs in China, increased forest coverage and vegetation density have enhanced canopy interception and transpiration, with documented effects on soil moisture storage and baseflow stability through litter and infiltration processes [1,2,7,11]. In urbanized and agricultural zones, intensive water withdrawals and runoff conveyance modifications are associated with larger WY fluctuations, particularly in low-elevation catchments [3,8,17,18]. Under the Budyko energy–water balance framework, these processes jointly regulate the partitioning between evapotranspiration and water yield, producing the observed quasi-stable hydrological patterns across the province [29,30].
Precipitation emerges as the dominant proximate driver of interannual and spatial variance, with land-cover and terrain modulating efficiency. The joint behavior of precipitation, ET, and WY across the four multi-year slices (1990–1999; 2000–2009; 2010–2019; 2020–2023) shows a progressive increase in the period-maximum grid-cell WY culminating in 2020–2023, together with a modest shift in central/southern forest zones (Figure 5). Consistent with InVEST applications across China, precipitation explains the bulk of variance in annual water-related services, while land-cover composition and relief determine the efficiency with which precipitation is converted to yield and storage [4,20,23]. The diminishing “conservation/precipitation” ratio under very wet conditions is likewise anticipated by Budyko-type saturation behavior in humid basins, where incremental rainfall increasingly expresses as quickflow rather than added storage [21,29]. As for AET, it directly participates in the hydrological cycle process. A slight decline in AET affects the temporal and spatial distributions of hydrological elements [20].
The weakly positive but non-significant trend in total forest water conservation capacity suggests a quasi-equilibrium between increasing water inputs and rising evapotranspiration losses. Enhanced precipitation and soil recharge may have been offset by higher canopy interception and transpiration under large-scale reforestation, yielding overall hydrological stability [1,2,7,29]. This balance reflects hydrological resilience—the capacity of forest ecosystems to maintain steady regulation under climatic and anthropogenic fluctuations [29,30]. From a management perspective, this stability is consistent with the sustained maintenance of water conservation functions under restoration and protection programs, while further gains will depend on optimizing forest structure and coordinating regional water use across geomorphic zones [13,15,16].
A quasi-stationary “basin-rim corridor” of high conservation capacity demonstrates that orography anchors spatial heterogeneity while climate modulates its areal extent. High values recur along the basin–mountain transition and in the southeastern ranges, moderate values fringe the basin and southwest, and low values dominate the western plateau (Figure 9); wet years expand and intensify this corridor, whereas dry years contract it, yet the corridor rarely relocates. Independent moisture source diagnostics confirm windward focusing of warm-season precipitation into the Sichuan Basin and adjacent Hengduan Mountains [14], while assessments similarly report long-term concentration of ecosystem services around the basin rim [13]. The coherence between our maps and these external lines of evidence indicates that physiography provides the template on which interannual climate anomalies imprint.
Topography influences climate by affecting regional hydrothermal conditions, thus impacting forest vegetation structure, accumulation of litter under forests, and the physical and chemical properties of soil, and finally governing regional water conservation function [7,18,34,35]. Topography sets first-order constraints on magnitude and efficiency, with elevation organizing totals and slope limiting per-unit-area performance. Total water conservation capacity is persistently largest and most variable above 3500 m, second-ranked in the 2000–3500 m belt, and comparable among lower belts; since 2019, all belts converge into a narrower range while preserving rank (Figure 7). This organization accords with lower atmospheric demand at high altitude and orographic enhancement of precipitation on windward slopes [9,14]. In contrast, per-unit-area capacity displays a strict monotonic order—flat (<3°) > 3–8° > 8–15° > 15–25° > >25°—with minima in 2006 and 2011 and recurrent maxima in 1998–2000 and 2013–2017; interannual amplitude diminishes with slope and the ordering never reverses (Figure 8). Mechanistically, steeper gradients shorten infiltration opportunity time and route a larger fraction of rainfall into quickflow, curtailing activation of near-surface and soil storage, whereas gentle terrain allows more interception, detention, and macropore-assisted infiltration—processes emphasized in ecohydrological extensions to Budyko and identified nationally as key drivers of forest water conservation services [1,2,7,29].
4.2. Policy Implications
The monetary valuation reveals policy-relevant heterogeneity that should directly shape management design. While provincial totals rose overall (Table 1), prefecture-level values were uneven and sometimes volatile, reflecting differential exposure to climatic anomalies, terrain constraints, and development pressures; this pattern argues for differentiated, performance-based ecological compensation that considers not only aggregate water conservation capacity but also temporal stability/resilience and the marginal costs of maintaining unit-area efficiency [3,8]. Because forest water conservation underpins flood attenuation, baseflow support, and sediment regulation for the upper Yangtze, compensation schemes that reward upstream “sponge” functions can internalize downstream benefits and align with national ecological barrier objectives [18]. Translating these valuation signals into practice, management should prioritize quality over area: the post-2006 recovery coincided with large-scale restoration (e.g., Natural Forest Protection; Grain-for-Green), yet the softening after 2020 cautions against reliance on area expansion alone; measures that build soil organic matter, deepen effective rooting, and diversify canopy/litter traits can raise per-unit retention efficiency and buffer climatic volatility [2,11,12]. Strategies must also be slope-specific: on steep lands, emphasize infiltration-enhancing and erosion-reducing practices (e.g., contour hedgerows, mulching, microsite roughness), whereas on gentle terrain and valley bottoms, protect and restore forests and forested wetlands that provide high and stable regulation. Finally, targeting the basin-rim corridor for quality-focused interventions yields biodiversity co-benefits, safeguarding flagship habitats such as those of the giant panda while sustaining hydrological services [16]. To ensure that these slope- and corridor-based strategies are effectively implemented, long-term ecological monitoring and coordinated multi-level governance will be essential. In particular, integrating hydrological observation networks, interdepartmental data sharing, and adaptive policy feedback can translate these spatial strategies into measurable outcomes and sustained management benefits. Together, a pay-for-performance compensation framework—explicitly indexed to capacity, stability, and marginal costs—combined with quality-oriented, slope-aware management can stabilize and enhance Sichuan’s forest water conservation efficiency under increasing climatic variability.
At the city level, the monetary value of forest water conservation services exhibits marked heterogeneity, reflecting spatial disparities in land-use, industrial structure, and governance intensity. Cities with higher forest cover and lower industrial water consumption—such as those located in the southeastern humid ranges—tend to show higher and more stable ecosystem service values. In contrast, rapidly urbanizing and industrialized cities around the basin rim display greater volatility, primarily due to land conversion, infrastructure expansion, and fluctuating industrial water demand [3,8,17,18]. Additionally, differences in local policy execution and ecological compensation investment contribute to uneven valuation outcomes among municipalities [13,15,16,33]. These inter-city contrasts highlight that economic valuation is not solely an outcome of bio-physical processes, but also a reflection of institutional capacity and policy implementation efficiency across administrative units.
4.3. Research Limitations and Future Work
The InVEST model has been broadly used to evaluate ecosystem service functions and has achieved good results [10,20,24]. However, there are some uncertainties in the model related to setup and its simplified algorithm [5,20]. InVEST simplifies process representation (e.g., no explicit hillslope routing or storm temporal structure) and relies on empirical parameters such as Z, which vary across hydroclimates [9]. Input limitations (e.g., generalized soils, rooting depths) can propagate into spatial bias, particularly in complex terrain [34]. It is particularly important to note that the InVEST model estimates long-term mean annual water yield based on the Budyko-type energy–water balance and is therefore not suitable for event-scale hydrological analyses such as floods or short-term droughts. While it effectively captures interannual to decadal variations in hydrological regulation, InVEST cannot represent transient runoff responses or peak-flow dynamics. Consequently, the results of this study should be interpreted within a long-term average context and not extrapolated to event-driven water management decisions without further verification using process-based models [29,36,37]. Future studies should focus on improving model structure and data integration to enhance spatial precision and cross-scale applicability as follows: (1) co-calibrate InVEST with physically based models to capture event dynamics and nonlinear interactions; (2) integrate higher-resolution soil–vegetation datasets and field constraints on rooting/litter hydrology; and (3) apply causal/attribution frameworks (e.g., random forest, structural equation models) to disentangle climate–terrain–LULC interactions and quantify tradeoffs/synergies among hydrological services [8,10,36]. These advances will improve the robustness of spatial targeting for ecological compensation and the design of slope- and corridor-specific management portfolios under a warming, more variable climate.
5. Conclusions
In this study, the water yield ecosystem service of forests was estimated using the InVEST model across Sichuan Province. Sichuan’s forest water conservation capacity showed a province-wide U-shaped evolution during 1990–2023—falling to a nadir in 2006 and then rebounding—with an overall weak, non-significant linear increase of 1.38 × 10⁸ m3·yr−1. Spatially, a persistent high-conservation corridor anchored along the basin–mountain transition and southeastern ranges contrasts with consistently low levels on the western plateau. Topography modulates performance as follows: elevation organizes total capacity (≥3500 m highest and most variable), while per-unit-area efficiency declines monotonically with slope (<3° > 3–8° > 8–15° > 15–25° > >25°). The economic value of these services rose from CNY 190.47 billion to CNY 223.40 billion (2005–2023) but remains uneven across cities. Collectively, the results indicate climate-driven interannual variability on a terrain-anchored template and call for quality-oriented, slope-specific forest management and differentiated ecological compensation to stabilize and enhance unit-area efficiency under a changing climate.
Author Contributions
J.Z.: Data Curation, Software, and Writing—Original Draft. W.Y.: Conceptualization, Investigation, Methodology, Funding Acquisition, and Writing—Review and Editing. R.L.: Supervision and Writing—Review and Editing. P.W. and C.J.: Validation and Formal Analysis. W.Z.: Visualization. All authors have read and agreed to the published version of the manuscript.
Funding
This study was jointly supported by the Sichuan Forestry and Grassland Science and Technology Innovation Team Program “Digital Forestry and Grassland Monitoring and Carbon Sequestration Innovation” (Grant Nos. CXTD2024007 and CXTD2025007) for 2024 and 2025.
Data Availability Statement
The data presented in this study are available through the respective sources. Precipitation and potential evapotranspiration were derived from the following resources available in the public domain: [Precipitation] [10.5281/zenodo.3114194] [31]. [Potential Evapotranspiration] [10.11866/db.loess.2021.001.] [32].
Conflicts of Interest
The authors declare no conflicts of interest.
Abbreviations
The following abbreviations are used in this manuscript:
| AET | actual evapotranspiration |
| AWC | volumetric plant-available water content |
| ET | evapotranspiration |
| FAO | United Nations Food and Agriculture Organization |
| InVEST | Integrated Valuation of Ecosystem Services and Tradeoffs |
| LULC | land-use/land-cover |
| P | precipitation |
| PAWC | plant-available water capacity |
| PET | potential evapotranspiration |
| Ra | extraterrestrial radiation |
| RESDC | Resource and Environment Data Cloud Platform |
| TI | topographic index |
| WR | water conservation |
| WY | water yield |
References
- Brauman, K.A.; Daily, G.C.; Duarte, T.K.; Mooney, H.A. The Nature and Value of Ecosystem Services: An Overview Highlighting Hydrologic Services. Annu. Rev. Environ. Resour. 2007, 32, 67–98. [Google Scholar] [CrossRef]
- Ellison, D.; Morris, C.E.; Locatelli, B.; Sheil, D.; Cohen, J.; Murdiyarso, D.; Gutierrez, V.; van Noordwijk, M.; Creed, I.F.; Pokorny, J.; et al. Trees, Forests and Water: Cool Insights for a Hot World. Glob. Environ. Chang. 2017, 43, 51–61. [Google Scholar] [CrossRef]
- Biao, Z.; Wenhua, L.; Gaodi, X.; Yu, X. Water Conservation of Forest Ecosystem in Beijing and Its Value. Ecol. Econ. 2010, 69, 1416–1426. [Google Scholar] [CrossRef]
- Chen, Q.; Xu, X.; Wu, M.; Wen, J.; Zou, J. Assessing the Water Conservation Function Based on the InVEST Model: Taking Poyang Lake Region as an Example. Land 2022, 11, 2228. [Google Scholar] [CrossRef]
- Sharp, R.; Tallis, H.; Ricketts, T.; Guerry, A.; Wood, S.; Chaplin-Kramer, R.; Nelson, E.; Ennaanay, D.; Wolny, S.; Olwero, N. InVEST 3.2. 0 User’s Guide. Nat. Cap. Proj. 2015, 133. [Google Scholar]
- Guswa, A.J.; Tetzlaff, D.; Selker, J.S.; Carlyle-Moses, D.E.; Boyer, E.W.; Bruen, M.; Cayuela, C.; Creed, I.F.; van de Giesen, N.; Grasso, D.; et al. Advancing Ecohydrology in the 21st Century: A Convergence of Opportunities. Ecohydrology 2020, 13, e2208. [Google Scholar] [CrossRef]
- Gong, S.; Xiao, Y.; Xiao, Y.; Zhang, L.; Ouyang, Z. Driving Forces and Their Effects on Water Conservation Services in Forest Ecosystems in China. Chin. Geogr. Sci. 2017, 27, 216–228. [Google Scholar] [CrossRef]
- Ha, L.T.; Bastiaanssen, W.G.M.; Simons, G.W.H.; Poortinga, A. A New Framework of 17 Hydrological Ecosystem Services (HESS17) for Supporting River Basin Planning and Environmental Monitoring. Sustainability 2023, 15, 6182. [Google Scholar] [CrossRef]
- Cambridge University Press. IPCC Climate Change 2021—The Physical Science Basis: Working Group I Contribution to the Sixth Assessment Report of the Intergovernmental Panel on Climate Change, 1st ed.; Cambridge University Press: Cambridge, UK, 2021; ISBN 978-1-009-15789-6. [Google Scholar]
- He, S.; Qian, H.; Liu, Y.; Zhao, X.; Su, F.; Ma, H.; Guan, Z.; Zhang, T. Water Conservation Assessment and Its Influencing Factors Identification Using the InVEST and Random Forest Model in the Northern Piedmont of the Qinling Mountains. J. Hydrol. Reg. Stud. 2025, 57, 102194. [Google Scholar] [CrossRef]
- Locatelli, B.; Catterall, C.P.; Imbach, P.; Kumar, C.; Lasco, R.; Marín-Spiotta, E.; Mercer, B.; Powers, J.S.; Schwartz, N.; Uriarte, M. Tropical Reforestation and Climate Change: Beyond Carbon. Restor. Ecol. 2015, 23, 337–343. [Google Scholar] [CrossRef]
- Raman, R.; Manalil, S.; Dénes, D.L.; Nedungadi, P. The Role of Forestry Sciences in Combating Climate Change and Advancing Sustainable Development Goals. Front. For. Glob. Chang. 2024, 7, 1409667. [Google Scholar] [CrossRef]
- He, C.; Shao, H.; Xian, W. Spatiotemporal Variation and Driving Forces Analysis of Eco-System Service Values: A Case Study of Sichuan Province, China. Int. J. Environ. Res. Public Health 2022, 19, 8595. [Google Scholar] [CrossRef]
- Zhang, S.; Liu, B.; Ren, G.; Zhou, T.; Jiang, C.; Li, S.; Su, B. Moisture Sources and Paths Associated with Warm-Season Precipitation over the Sichuan Basin in Southwestern China: Climatology and Interannual Variability. J. Hydrol. 2021, 603, 127019. [Google Scholar] [CrossRef]
- Liu, J.; Linderman, M.; Ouyang, Z.; An, L.; Yang, J.; Zhang, H. Ecological Degradation in Protected Areas: The Case of Wolong Nature Reserve for Giant Pandas. Science 2001, 292, 98–101. [Google Scholar] [CrossRef]
- Swaisgood, R.R.; Wang, D.; Wei, F. Panda Downlisted but Not Out of the Woods. Conserv. Lett. 2018, 11, e12355. [Google Scholar] [CrossRef]
- Guo, W.; Zhou, H.; Jiao, X.; Huang, L.; Wang, H. Analysis of Alterations of the Hydrological Situation and Causes of River Runoff in the Min River, China. Water 2022, 14, 1093. [Google Scholar] [CrossRef]
- Wang, Z.-Y.; Li, Y.; He, Y. Sediment Budget of the Yangtze River. Water Resour. Res. 2007, 43, W04401. [Google Scholar] [CrossRef]
- Posner, S.; Verutes, G.; Koh, I.; Denu, D.; Ricketts, T. Global Use of Ecosystem Service Models. Ecosyst. Serv. 2016, 17, 131–141. [Google Scholar] [CrossRef]
- Wu, C.; Qiu, D.; Gao, P.; Mu, X.; Zhao, G. Application of the InVEST Model for Assessing Water Yield and Its Response to Precipitation and Land Use in the Weihe River Basin, China. J. Arid Land 2022, 14, 426–440. [Google Scholar] [CrossRef]
- Yin, G.; Wang, X.; Zhang, X.; Fu, Y.; Hao, F.; Hu, Q. InVEST Model-Based Estimation of Water Yield in North China and Its Sensitivities to Climate Variables. Water 2020, 12, 1692. [Google Scholar] [CrossRef]
- Zhang, R.; Shao, H.; Lim, H. Analysis of Water Conservation Mechanisms in the River Source Area of Northwest Sichuan from the Perspective of Vegetation Cover Zoning. Water 2025, 17, 54. [Google Scholar] [CrossRef]
- Li, M.; Liang, D.; Xia, J.; Song, J.; Cheng, D.; Wu, J.; Cao, Y.; Sun, H.; Li, Q. Evaluation of Water Conservation Function of Danjiang River Basin in Qinling Mountains, China Based on InVEST Model. J. Environ. Manag. 2021, 286, 112212. [Google Scholar] [CrossRef] [PubMed]
- Kim, Y.I.; Engel, B.; Jang, W.S.; Yun, Y.J. Evaluating Wildfire-Induced Changes in a Water-Yield Ecosystem Service at the Local Scale Using the InVEST Model. Water 2025, 17, 1260. [Google Scholar] [CrossRef]
- Yang, Z.; Dai, X.; Lu, H.; Liu, C.; Nie, R.; Zhang, M.; Ma, L.; Li, N.; Liu, T.; He, Y.; et al. Evaluation and Prediction of Water Conservation of the Yellow River Basin in Sichuan Province, China, Based on Google Earth Engine and CA-Markov. Heliyon 2023, 9, e17903. [Google Scholar] [CrossRef]
- Huang, Y.; Feng, T.; Niu, S.; Hao, D.; Gan, X.; Zhou, B. Integrating the Effects of Driving Forces on Ecosystem Services into Ecological Management: A Case Study from Sichuan Province, China. PLoS ONE 2022, 17, e0270365. [Google Scholar] [CrossRef]
- Lu, C.; Sidai, G.; Yangli, L. Discerning Changes and Drivers of Water Yield Ecosystem Service: A Case Study of Chongqing-Chengdu District, Southwest China. Ecol. Indic. 2024, 160, 111767. [Google Scholar] [CrossRef]
- Miao, P.; Li, C.; Xia, B.; Zhao, X.; Wu, Y.; Zhang, C.; Wu, J.; Cheng, F.; Pu, J.; Huang, P.; et al. Incorporating Ecosystem Service Trade-Offs and Synergies with Ecological Sensitivity to Delineate Ecological Functional Zones: A Case Study in the Sichuan-Yunnan Ecological Buffer Area, China. Land 2024, 13, 1503. [Google Scholar] [CrossRef]
- Donohue, R.J.; Roderick, M.L.; McVicar, T.R. Roots, Storms and Soil Pores: Incorporating Key Ecohydrological Processes into Budyko’s Hydrological Model. J. Hydrol. 2012, 436, 35–50. [Google Scholar] [CrossRef]
- Zhang, L.; Hickel, K.; Dawes, W.R.; Chiew, F.H.S.; Western, A.W.; Briggs, P.R. A Rational Function Approach for Estimating Mean Annual Evapotranspiration. Water Resour. Res. 2004, 40, 89–97. [Google Scholar] [CrossRef]
- Peng, S. 1-Km Monthly Precipitation Dataset for China (1901–2024); National Tibetan Plateau/Third Pole Environment Data Center: Beijing, China, 2020. [Google Scholar] [CrossRef]
- Peng, S. 1-Km Monthly Potential Evapotranspiration Dataset for China (1901–2024); National Tibetan Plateau/Third Pole Environment Data Center: Beijing, China, 2022. [Google Scholar] [CrossRef]
- Yan, F.; Shangguan, W.; Zhang, J.; Hu, B. Depth-to-Bedrock Map of China at a Spatial Resolution of 100 Meters. Sci. Data 2020, 7, 2. [Google Scholar] [CrossRef]
- Maurya, S.; Srivastava, P.K.; Gupta, M.; Islam, T.; Han, D. Integrating Soil Hydraulic Parameter and Microwave Precipitation with Morphometric Analysis for Watershed Prioritization. Water Resour. Manag. 2016, 30, 5385–5405. [Google Scholar] [CrossRef]
- Huang, Y.; Kang, A.; Gao, D.; Li, J.; Zhang, H.; Yan, M.; Gan, X.; Zhou, B. Integrated Trade-Offs/Synergies and Interactions Approach to Quantifying the Direct and Indirect Effects of Environmental Factors on Ecosystem Services. Environ. Manag. 2025, 75, 1994–2009. [Google Scholar] [CrossRef] [PubMed]
- Ma, X.; Liu, S.; Guo, L.; Zhang, J.; Feng, C.; Feng, M.; Li, Y. Evolution and Analysis of Water Yield under the Change of Land Use and Climate Change Based on the PLUS-InVEST Model: A Case Study of the Yellow River Basin in Henan Province. Water 2024, 16, 2551. [Google Scholar] [CrossRef]
- Zhang, X.; Liu, J.; Zhu, J.; Cheng, W.; Zhang, Y. Analysis of the Spatiotemporal Patterns of Water Conservation in the Yangtze River Ecological Barrier Zone Based on the InVEST Model and SWAT-BiLSTM Model Using Fractal Theory: A Case Study of the Minjiang River Basin. Fractal Fract. 2025, 9, 116. [Google Scholar] [CrossRef]
Disclaimer/Publisher’s Note: The statements, opinions and data contained in all publications are solely those of the individual author(s) and contributor(s) and not of MDPI and/or the editor(s). MDPI and/or the editor(s) disclaim responsibility for any injury to people or property resulting from any ideas, methods, instructions or products referred to in the content. |
© 2025 by the authors. Licensee MDPI, Basel, Switzerland. This article is an open access article distributed under the terms and conditions of the Creative Commons Attribution (CC BY) license (https://creativecommons.org/licenses/by/4.0/).