Article

Field Assessment of Subsurface Intermittent Water Flow via Porous and Emitting Pipes

1
Alamoudi Water Research Chair, King Saud University, P.O. Box 2460, Riyadh 11451, Saudi Arabia
2
Department of Agricultural Engineering, College of Food & Agriculture Sciences, King Saud University, P.O. Box 2460, Riyadh 11451, Saudi Arabia
*
Authors to whom correspondence should be addressed.
Water 2025, 17(21), 3143; https://doi.org/10.3390/w17213143 (registering DOI)
Submission received: 2 October 2025 / Revised: 23 October 2025 / Accepted: 30 October 2025 / Published: 1 November 2025
(This article belongs to the Section Water, Agriculture and Aquaculture)

Abstract

Efficient water management for irrigation is critical for sustaining plant production in arid and hyper-arid regions, where optimizing emitter type, burial depth, and irrigation scheduling can significantly enhance water-use efficiency and yield. This study evaluated the effects of continuous and intermittent subsurface irrigation using porous (PRP) and emitting (GRP) pipes at two installation depths (25 and 35 cm) on soil water distribution, potato germination, and yield under arid conditions in Saudi Arabia. Soil water content was monitored using volumetric sampling, EnviroSCAN sensors, and HYDRUS modeling, with strong agreement observed among methods (R2 ≥ 0.92). Results showed that shallow emitter placement (25 cm) combined with intermittent irrigation (five pulses, WF5C) maximized soil water retention in the root zone, reducing deep percolation losses. The GRP25cm treatment improved soil water content by up to 140.7% at 30 cm depth and achieved the highest germination (74–83%) and yields (164.5–171.7 kg). In contrast, deeper installations (35 cm) consistently underperformed. Overall, intermittent irrigation enhanced water distribution and plant performance compared with continuous flow, leading to a 40–49% yield increase. These findings highlight the importance of emitter type, placement depth, and irrigation scheduling in optimizing water-use efficiency and plant productivity. The study provides practical recommendations for sustainable irrigation strategies in arid and hyper-arid regions facing increasing water scarcity.

1. Introduction

Global agriculture faces mounting challenges from rising water demand, climate change, and irregular precipitation, necessitating more efficient irrigation practices for sustainable crop production [1,2]. Water resources are increasingly strategic, and improving water use efficiency (WUE) has become a central priority [3,4]. Four major approaches are commonly adopted: minimizing soil and water evaporation, breeding or adopting high-yield and stress-tolerant crops, reallocating limited water to higher-value uses, and optimizing water application systems and schedules [5]. Traditional irrigation methods, such as surface flooding, are increasingly unsustainable due to high losses through evaporation and runoff [6].
Modern irrigation systems—particularly drip and subsurface drip irrigation (SDI)—allow precise application of water and nutrients directly to the plant root zone, thereby enhancing WUE and reducing non-beneficial water losses [7]. SDI enables the safe use of low-quality water, avoiding the health risks and odors often associated with surface irrigation [8]. Numerous studies have demonstrated the advantages of SDI in minimizing soil evaporation, suppressing weed growth, improving root activity, and increasing crop yields [9,10]. Two categories of SDI emitters are typically employed: point-source emitters, which discharge water at discrete outlets, and line-source emitters, characterized by porous or perforated walls suitable for closely spaced crops [11]. For vegetable crops such as potatoes, point-source emitters often achieve superior water distribution compared to line sources. Moreover, SDI can wet a larger soil volume than surface drip systems, leading to significant water savings [12]. Effective water application scheduling and emitter depth significantly influence soil water distribution and crop performance [13].
Porous rubber pipes (PRP) represent an alternative line-source method, but their irregular pore structure often results in variable discharge patterns [14,15]. While laboratory studies have suggested water savings of up to 35% with PRP, their long-term field performance under buried conditions remains inconsistent, raising questions of durability and uniformity [16]. Soil type shapes wetted front geometry, while recycled rubber-based pipes, despite good lab performance, often face durability and pore-size challenges in field conditions [17]. Research gaps persist regarding their compatibility with pulsed or intermittent irrigation schedules, which are increasingly recognized as an effective strategy to improve soil water distribution and reduce percolation losses [18,19,20].
Intermittent, or pulsed, water application divides irrigation into smaller cycles separated by rest periods. This method allows redistribution of water within the soil profile, leading to enhanced lateral movement, better soil aeration, and reduced deep percolation [21,22,23]. In SDI systems, the emitter spacing and depth are critical for optimizing the wetted volume [24]. Additionally, the effectiveness of intermittent water application to reduce plant water stress while managing soluble salts requires further investigation into appropriate criteria and guidelines based on soil types and hydraulic properties [25].
Effective scheduling of water application is crucial for optimizing drip water application systems, as excessive water application diminishes yields while insufficient water application leads to water stress [26]. SDI outperforms surface drip irrigation due to its design and management principles based on soil water movement under unsaturated conditions, where capillary forces dominate [27]. Intermittent water application employs small, frequent water applications to meet plant needs, minimizing leaching and runoff [28]. This approach improves water management by enhancing horizontal soil water content spread in sandy soils while reducing vertical percolation. Studies indicate that dividing water application into multiple pulses can significantly increase plant yields and conserve water; for instance, splitting water application into six pulses yielded a 5.78% increase and 25% water savings in lettuce [29]. Moreover, potato yields rose by 49% under intermittent water application compared to continuous methods [30]. Thus, intermittent water application is instrumental in enhancing yield and WUE in various crops [31].
Continuous irrigation often promotes excessive percolation below the root zone, whereas intermittent application through pulse discharges followed by rest periods can significantly improve water management and application efficiency [32]. Studies have shown that intermittent irrigation can achieve water savings of up to 25% [29]. For instance, increasing pulse frequency to four cycles enhanced water redistribution within the root zone, leading to a 48% increase in potato yields in Egypt, while raising application efficiency to 93.5% and maintaining 25% water savings [33]. Beyond water conservation, intermittent drip irrigation fosters more favorable conditions for root uptake of water and nutrients [23]. Improved aeration is another benefit, as inadequate soil aeration—common in heavy or saline soils—can restrict plant growth [34]. Compared to continuous methods, intermittent irrigation enhances soil aeration and reduces associated stress [35]. Importantly, irrigation frequency should be tailored to soil type: sandy soils typically require higher flow rates with shorter cycles, whereas clay soils benefit from longer intervals [5]. Overall, high-frequency subsurface drip irrigation has been reported to not only increase yields across various crops but also help maintain lower salt concentrations in the root zone [36].
Adequate water availability in the root zone is essential for plant growth, and the WP plays a critical role in crop development [37]. Intermittent drip irrigation, adapted from flood irrigation practices, has been shown to improve water distribution uniformity, enhance yields, and reduce emitter clogging [38]. This approach not only increases water-use efficiency but also lowers fertilizer and chemical requirements by allowing redistribution periods between applications [39]. Adjusting irrigation frequency has been reported to optimize wetted zone geometry, facilitating upward water movement and improving root-zone availability [40]. However, lateral water movement is often constrained by negative pressure, which can promote deep percolation and surface wetting, thereby reducing the efficiency of subsurface drip systems. Field studies confirm the benefits of intermittent irrigation: in sandy soils in Cairo, potato yields increased by 40%, from 4.70 t·ha−1 under continuous irrigation to 6.57 t·ha−1 with four pulses [33]. Similarly, crops in newly reclaimed sandy soils showed a 49% yield increase with expanded wetted soil volume (from 360 cm2 to 465 cm2) under intermittent irrigation [41], while green bean yields improved from 3.92 t·ha−1 under continuous irrigation to 4.78 t·ha−1 under four pulses [42].
Despite numerous studies on subsurface irrigation, limited research has comprehensively examined the combined influence of emitter type, burial depth, and irrigation frequency on soil water distribution, germination, and crop yield under the extreme arid conditions of central Saudi Arabia. Previous investigations have typically focused on individual factors in controlled environments, leaving a clear gap in understanding how these parameters interact in field settings characterized by high evapotranspiration and sandy soils. Addressing this gap, the present study conducts a field-scale evaluation of continuous and intermittent subsurface irrigation using porous and emitting pipes at varying depths, supported by sensor-based monitoring and HYDRUS modeling. The overarching goal is to identify irrigation configurations that maximize water-use efficiency and crop productivity, thereby providing a scientifically grounded framework for sustainable water management in arid and semi-arid agriculture.
Therefore, this study was designed to evaluate the effectiveness of continuous versus intermittent subsurface irrigation regimes using both porous and emitting pipes installed at two depths (25 and 35 cm). Specifically, it aims to (I) analyze soil water distribution patterns at multiple depths using volumetric sampling, EnviroSCAN sensors, and HYDRUS modeling; (II) assess the impact of irrigation strategy on germination and yield of potato; and (III) provide practical recommendations for optimizing WUE and productivity in arid and hyper-arid agricultural systems. By addressing these objectives, the research contributes novel insights into the design and management of subsurface irrigation systems for sustainable water use in water-scarce environments.

2. Materials and Methods

2.1. Study Area

The study was carried out at the College of Food and Agricultural Sciences’ educational farm at King Saud University, located in Riyadh, Saudi Arabia. The precise geographic coordinates of the experiment are 24°44′74″ N latitude and 46°37′52″ E longitude, as depicted in Figure 1. According to the Köppen classification, Riyadh Province is characterized as a hot desert climate (BWh) [43]. Riyadh city is characterized by its substantial exposure to solar energy, averaging an impressive 6.123 kWh/m2 of solar radiation on a daily basis. This high level of solar radiation is instrumental for various applications, particularly in the fields of renewable energy and agricultural practices. The city exhibits significant temperature variation, with peak summer temperatures reaching 47.4 °C, while cooler periods see temperatures decline to approximately 22.0 °C [44]. Such extreme fluctuations create unique climatic challenges and opportunities that are vital for investigating how both environmental and agricultural systems can adapt and thrive. These specific climatic conditions provide invaluable context for the research, ensuring that the findings are not only applicable to the local ecosystem but also extendable to similar environments elsewhere. The educational farm serves as a living laboratory, reinforcing the significance of integrating educational efforts with practical applications in environmental sciences and the agriculture sector.

2.2. Materials

The irrigation system used in this study comprised three integrated components designed to ensure precise and efficient water delivery. The pumping unit incorporated pumps, filters, pressure gauges, fertilizer injectors, flow meters, and valves to regulate and maintain system performance. A computerized control unit, supported by controllers and a network interface, enabled automation and adjustment of irrigation schedules according to plant requirements. The field unit consisted of the main pipeline, sub-mainlines, and lateral pipes, complemented by EnviroSCAN instruments for monitoring soil water content and augers for collecting soil samples, thereby facilitating accurate water management and supporting optimal plant growth.

2.3. Methodology

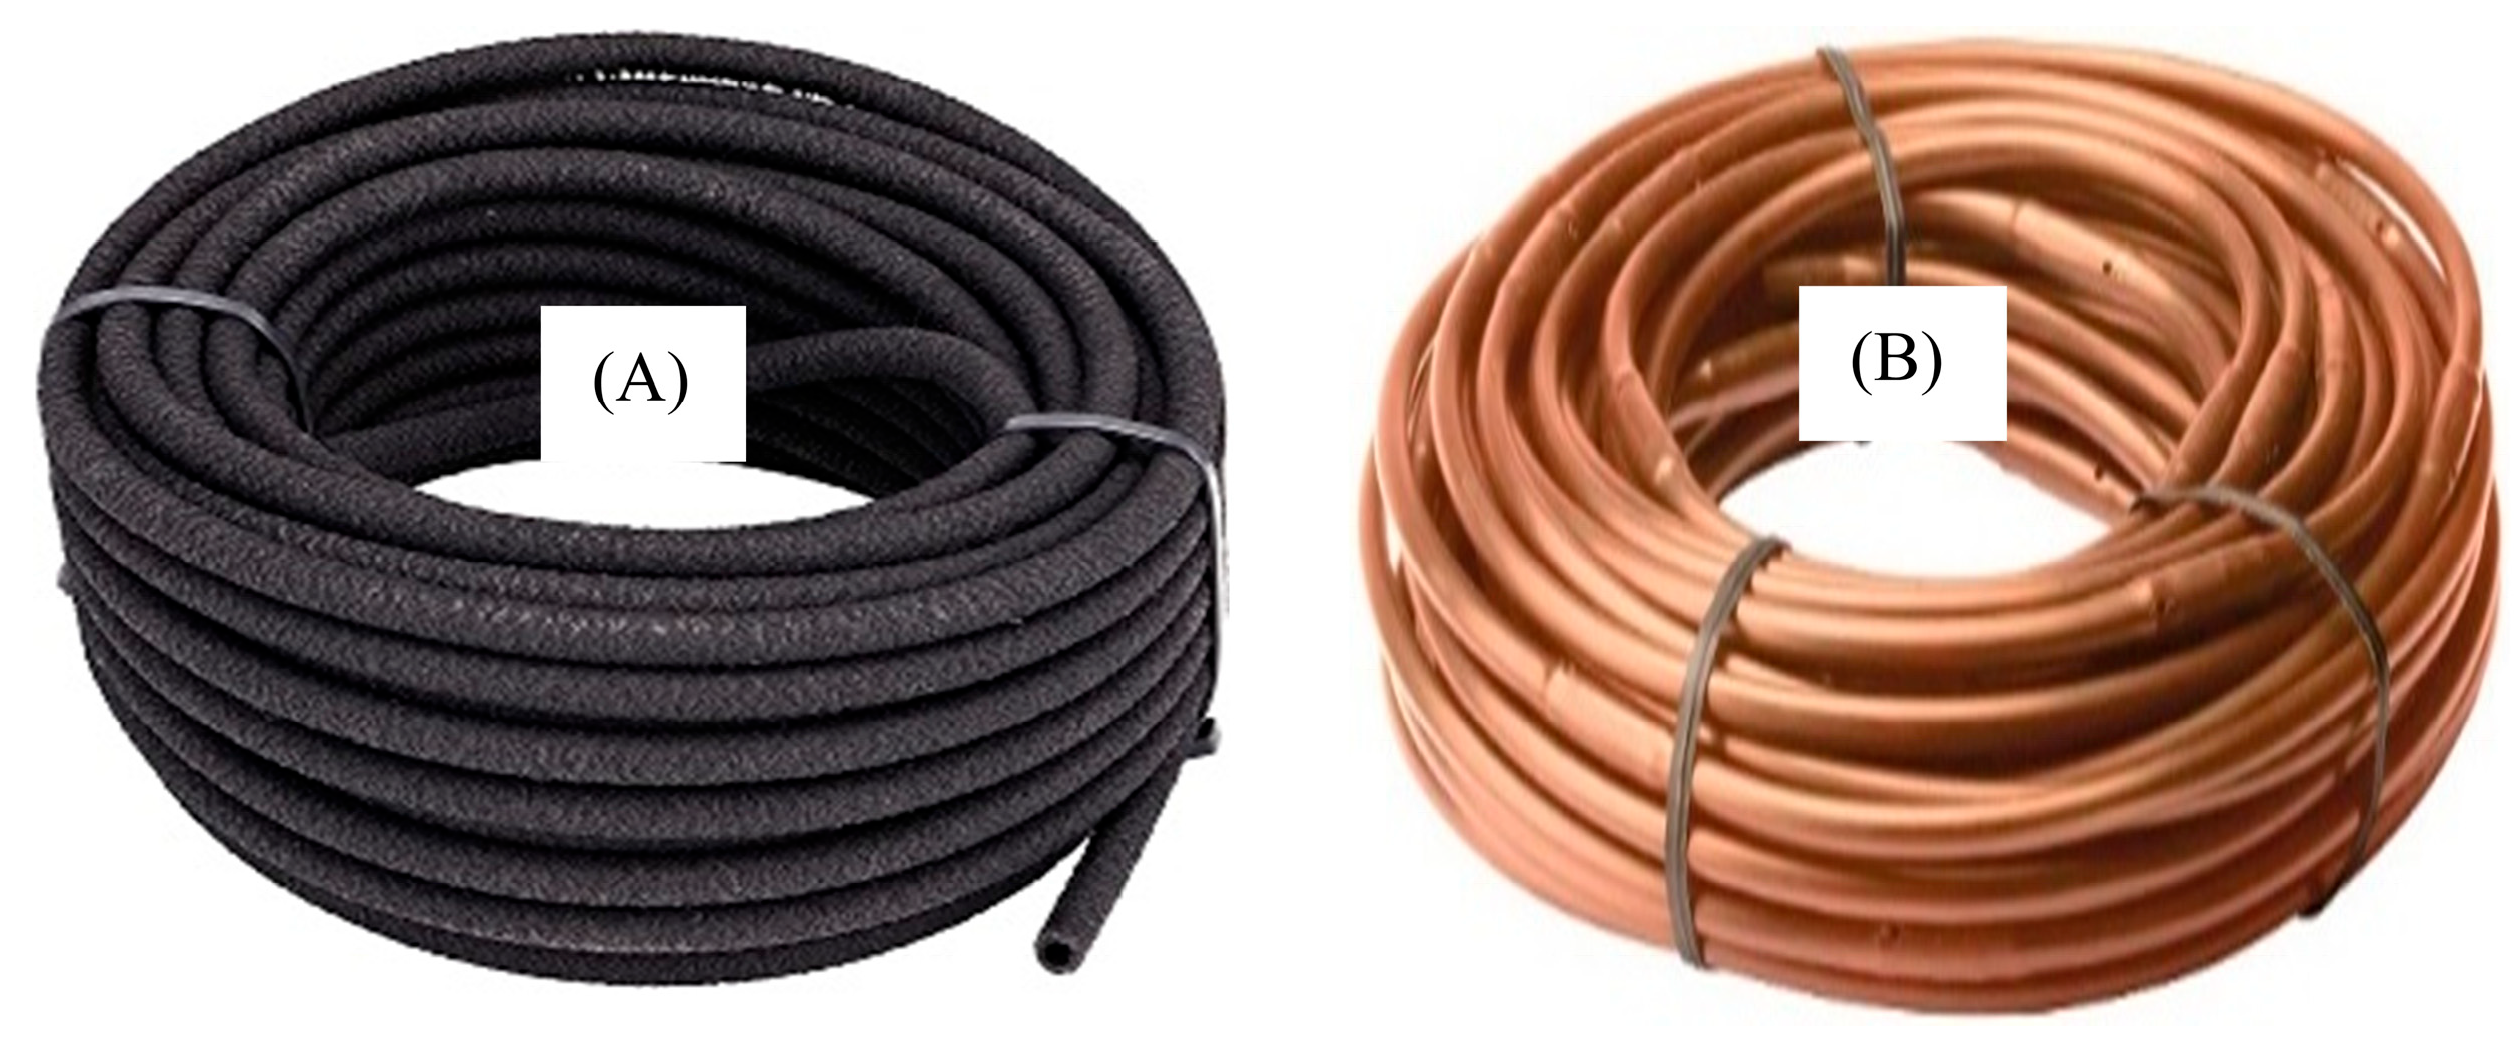
The experiment was conducted on loamy sand soil using municipal water to cultivate potato (Solanum tuberosum) over two growing seasons. Planting depth was maintained at 15 cm, with 50 cm spacing between plants and 75 cm between rows. The irrigation network consisted of lateral pipes 15.3 m in length, with treatments arranged 200 cm apart. Five irrigation regimes were tested: one continuous flow (WF1C) and four intermittent pulse treatments (WF2C–WF5C). Each regime delivered the same total water volume but with different ON/OFF cycles. Two pipe types were evaluated: porous rubber pipes (PRP) representing line-source emitters and emitting pipes (GRP) as point-source emitters as shown in Figure 2. Pipes were installed at two burial depths, 25 cm and 35 cm, to assess the influence of emitter placement on water distribution.

2.3.1. Plant Water Requirements

Plant water requirements (ETplt) were estimated using the KSA form of the Penman–Monteith equation that was proposed by Alazba [45], with daily plant coefficients (Kplt) applied across growth stages. Net irrigation water requirement was calculated by accounting for application efficiency (85%) and leaching requirement (10%) [46]. Soil water content was monitored at five depths (10–50 cm) using both volumetric sampling and EnviroSCAN sensors, providing cross-validation of measurements [47]. Additional verification was carried out using HYDRUS modeling [48]. The field layout included four treatment groups (A–D) with three replicates each, totaling 60 plots. Soil physical and chemical properties [49], were analyzed prior to planting to establish baseline conditions.
E T r e f = λ 1 [ + γ * R n G + γ + γ * K e s e a ]
In which, ETref is the reference evapotranspiration (mm/day), λ is the latent heat of vaporization (MJ/kg), Δ is the slope of the saturation vapor pressure-temperature curve at mean air temperature (kPa/°C), γ is the Psychometric constant (kPa/°C), Rn is net radiation (MJ/m2/day), G is soil heat flux (MJ/m2/day), γ * is the modified psychometric constant (kPa/°C), K is a parameter equal to 1.854 × 10 5 λ / r a T + 273 (MJ/m2/day/kPa), T is air temperature (°C), es is saturation vapor pressure at air temperature (kPa), and ea is actual vapor pressure (kPa). The aerodynamic resistance ra (s/m) is a function of the wind speed measured at a height of 2 m (U2), and of the plant height (hplt), and equals [ 1 l n h p l t 0.0151 u 2 ] , according to Alazba et al. [50].
ETplt (mm/day) is calculated by multiplying the appropriate plant factor (Kplt) during a given growth stage by ETref (mm/day), expressed mathematically according to Ezzeldin et al. [51] as:
E T p l t = K p l t × E T r e f
Kplt values vary with time and age periods of the plant, so for the potato plant was found that in the first stage its value is 0.5, in the second stage its value is 1.15, and in the third stage of the plant in the growth stages it was founded that value is 0.75, but more precisely the Kplt values were calculated daily and by knowing the ETref value and the Kplt values, calculate the ETplt for the plant. The irrigation water requirement in mm (IWR) was calculated using Equation (3), as outlined by Alazba et al. [52]:
I W R = E T p l t W A E × ( 1 L R )
where WAE is the water application efficiency, and LR is the leaching requirement.
To estimate the irrigation requirement at the onset of the season, the ETref of 7.55 mm combined with a plant coefficient (Kplt) of 0.5 yielded ETplt of 3.77 mm. As contributions from runoff, rainfall, and deep percolation were negligible, a leaching requirement of 10% was added. Considering the subsurface drip irrigation system efficiency of 85%, the net irrigation water requirement (NIWR) was calculated using:
N I W R = I W R ( R o + P + E T p l t + D p + P p )
where NIWR is the net irrigation water requirement, IWR the irrigation water requirement, Ro runoff, P precipitation, ETplt plant evapotranspiration, Dp deep percolation, and Pp potential percolation.
For the first day, the NIWR was determined as 4.9 mm. To convert this depth into volume (Equation (5)), the irrigated area per treatment was calculated. Each treatment comprised three lateral lines of 15.30 m length, with drippers covering 0.25 m on each side, resulting in an irrigated area of approximately 23 m2 (3 × 15.30 × 0.5).
Applied water (m3) = Irrigated area (m2) × Applied depth (m) = 23 × (4.9/1000) = 0.11 m3

2.3.2. Treatments

The simulation encompassed 20 treatment configurations, combining two pipe installation depths (25 and 35 cm) with five irrigation regimes (WF1C–WF5C), each differing in application frequency. These treatments were evaluated for two pipe types—emitting (GRP) and porous rubber (PRP)—as summarized in Table 1.

2.3.3. Soil Water Content Determination

Accurate measurement of soil water content was central to this study and was carried out using two complementary approaches. The volumetric method [53], served as a reference standard for evaluating the accuracy of other measurements, while a stationary EnviroSCAN system was employed to monitor changes in soil water content [54]. The latter consisted of 20 probes with 100 sensors in total, recording soil water content at five depths (10–50 cm) across all treatments. The spatial arrangement of pipes, tubers, and measurement points are illustrated in Figure 3.

2.3.4. Preparing the Experiment Site

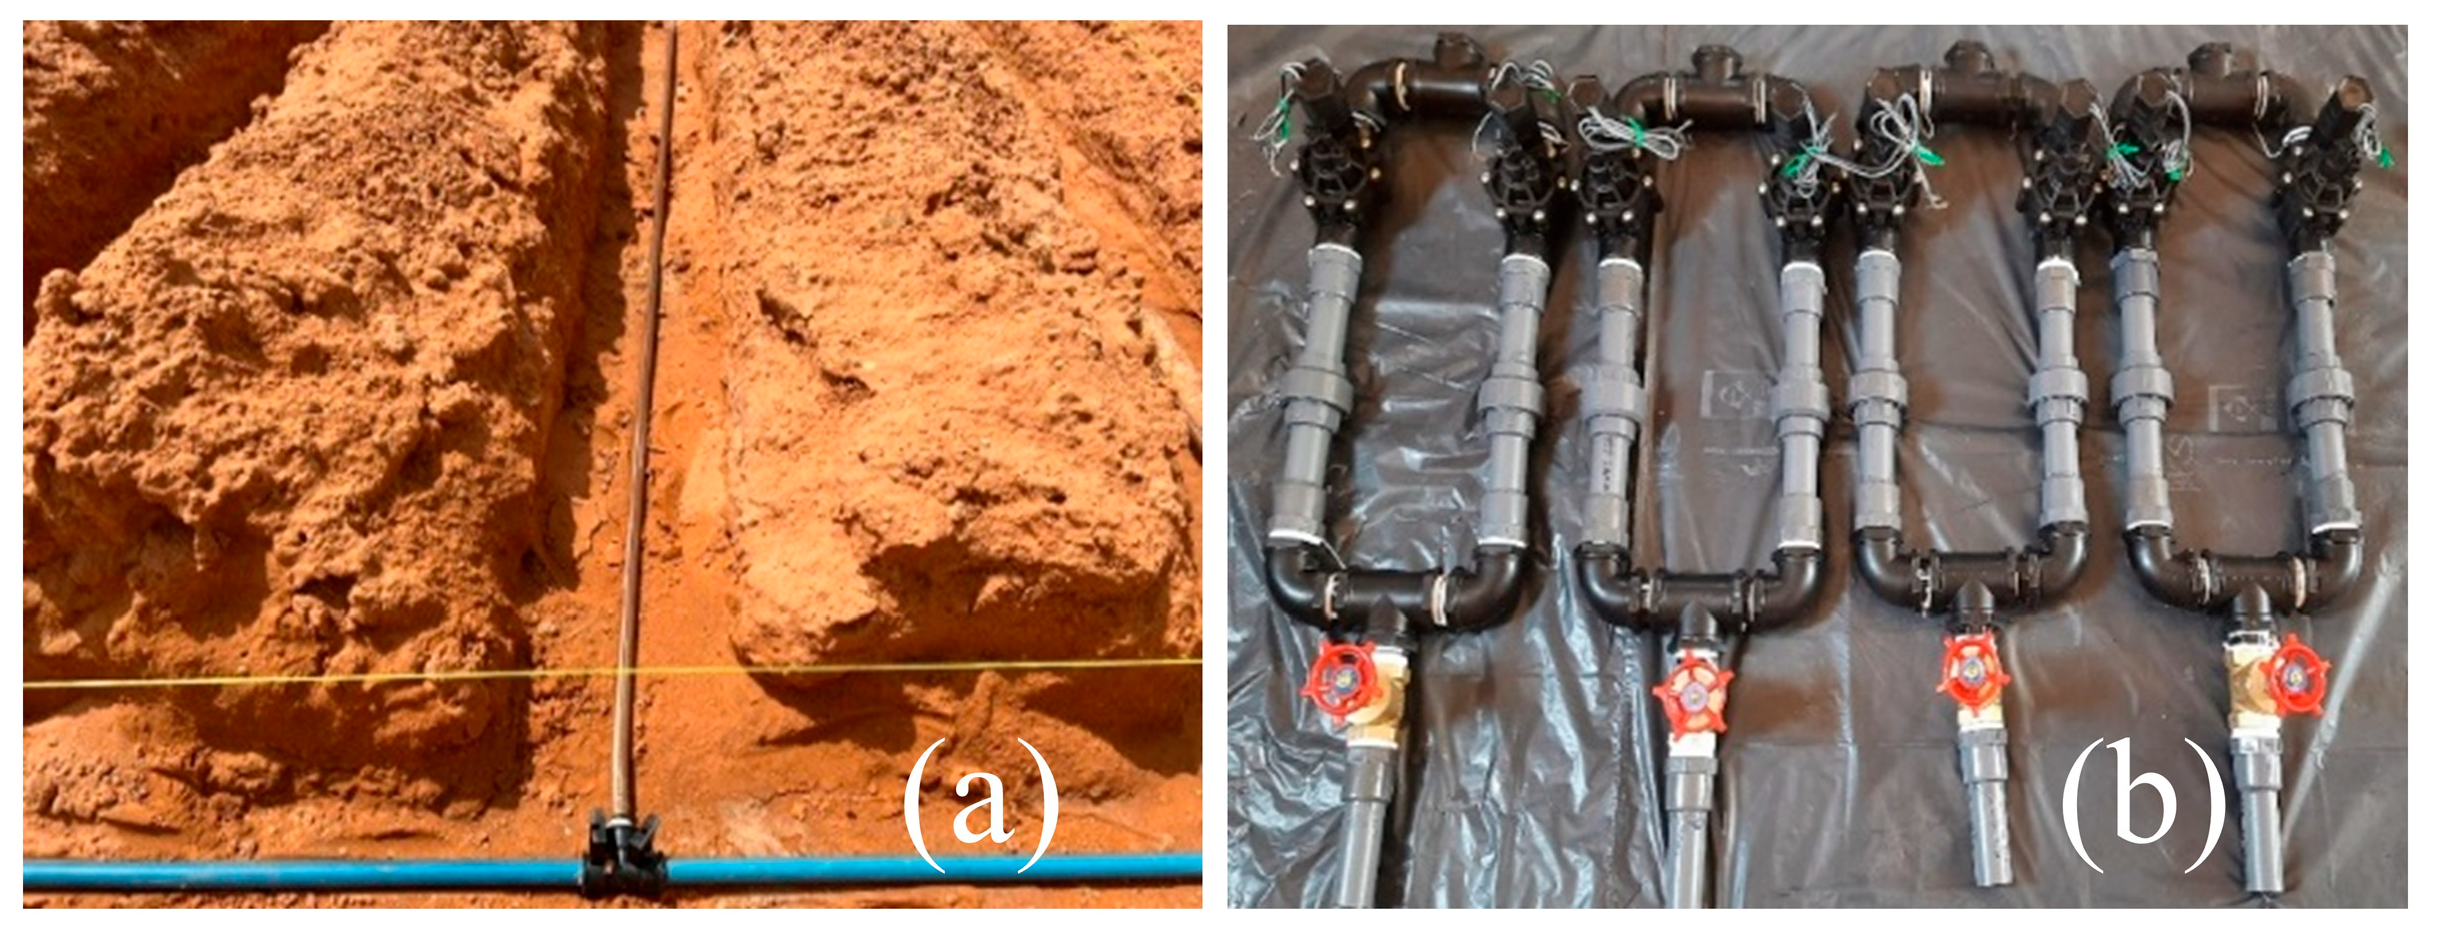
The experimental site was prepared by removing the existing soil to a depth of one meter and replacing it with loamy sand obtained from an approved distributor to ensure uniform texture and uncontaminated conditions. The 30 × 30 m plot was leveled mechanically and manually, after which soil samples were collected from multiple locations for representative analysis. Physical and chemical properties were determined at the College of Food and Agriculture Sciences, King Saud University. The experimental layout consisted of four groups (A–D), each with five treatments and three replicates, yielding 60 samples collected at depths of 0–20 cm, 20–40 cm, and 40–60 cm (Figure 4). Soil mechanical composition was analyzed using the hydrometer method [55], while true density, bulk density, and hydraulic conductivity were determined in the laboratory. Salinity and pH were measured after thorough sample mixing and filtering to characterize the soil environment [56]. Comprehensive laboratory analyses were conducted to determine the key physicochemical properties of the soil, including salinity, pH, bulk density, true density, and hydraulic conductivity. Soil salinity was measured using the electrical conductivity (EC) of a 1:5 soil-to-water extract, determined with a calibrated conductivity meter. Soil pH was assessed in the same extract using a glass electrode pH meter. Bulk density was determined by the core method, which involves oven-drying undisturbed soil samples at 105 °C for 24 h and calculating the ratio of dry mass to the core volume. True density was measured using a pycnometer, based on the displacement of water by a known mass of oven-dried soil particles. Hydraulic conductivity was determined using a constant-head permeameter for coarse-textured samples, following the procedures outlined in the USDA Soil Survey Laboratory Methods Manual. These analyses were performed in the Soil and Water Laboratory, College of Food and Agriculture Sciences, King Saud University, to ensure accuracy and standardization of results. In parallel, the discharge rate of the irrigation system was quantified by measuring tube outflow over one hour under varying pressures, with emitting pipes calibrated to specified disposal rates. Figure 5 illustrates key procedures involved in the chemical analysis and irrigation system setup, including soil excavation to the designated depth, installation of pipes, and assembly of the network components such as fittings, electrical controls, and manual valves. To ensure consistency in the total irrigation volume across treatments (WF1C to WF5C), the study implemented a standardized irrigation control system. An electronic control panel was used to precisely regulate both the timing and duration of water application. Each treatment was equipped with electrically operated valves connected to this panel, allowing for accurate scheduling. Additionally, flow meters were installed at the inlet of each treatment unit to monitor and verify the exact volume of water delivered. These measures ensured uniform water application and enhanced the reliability of experimental comparisons.
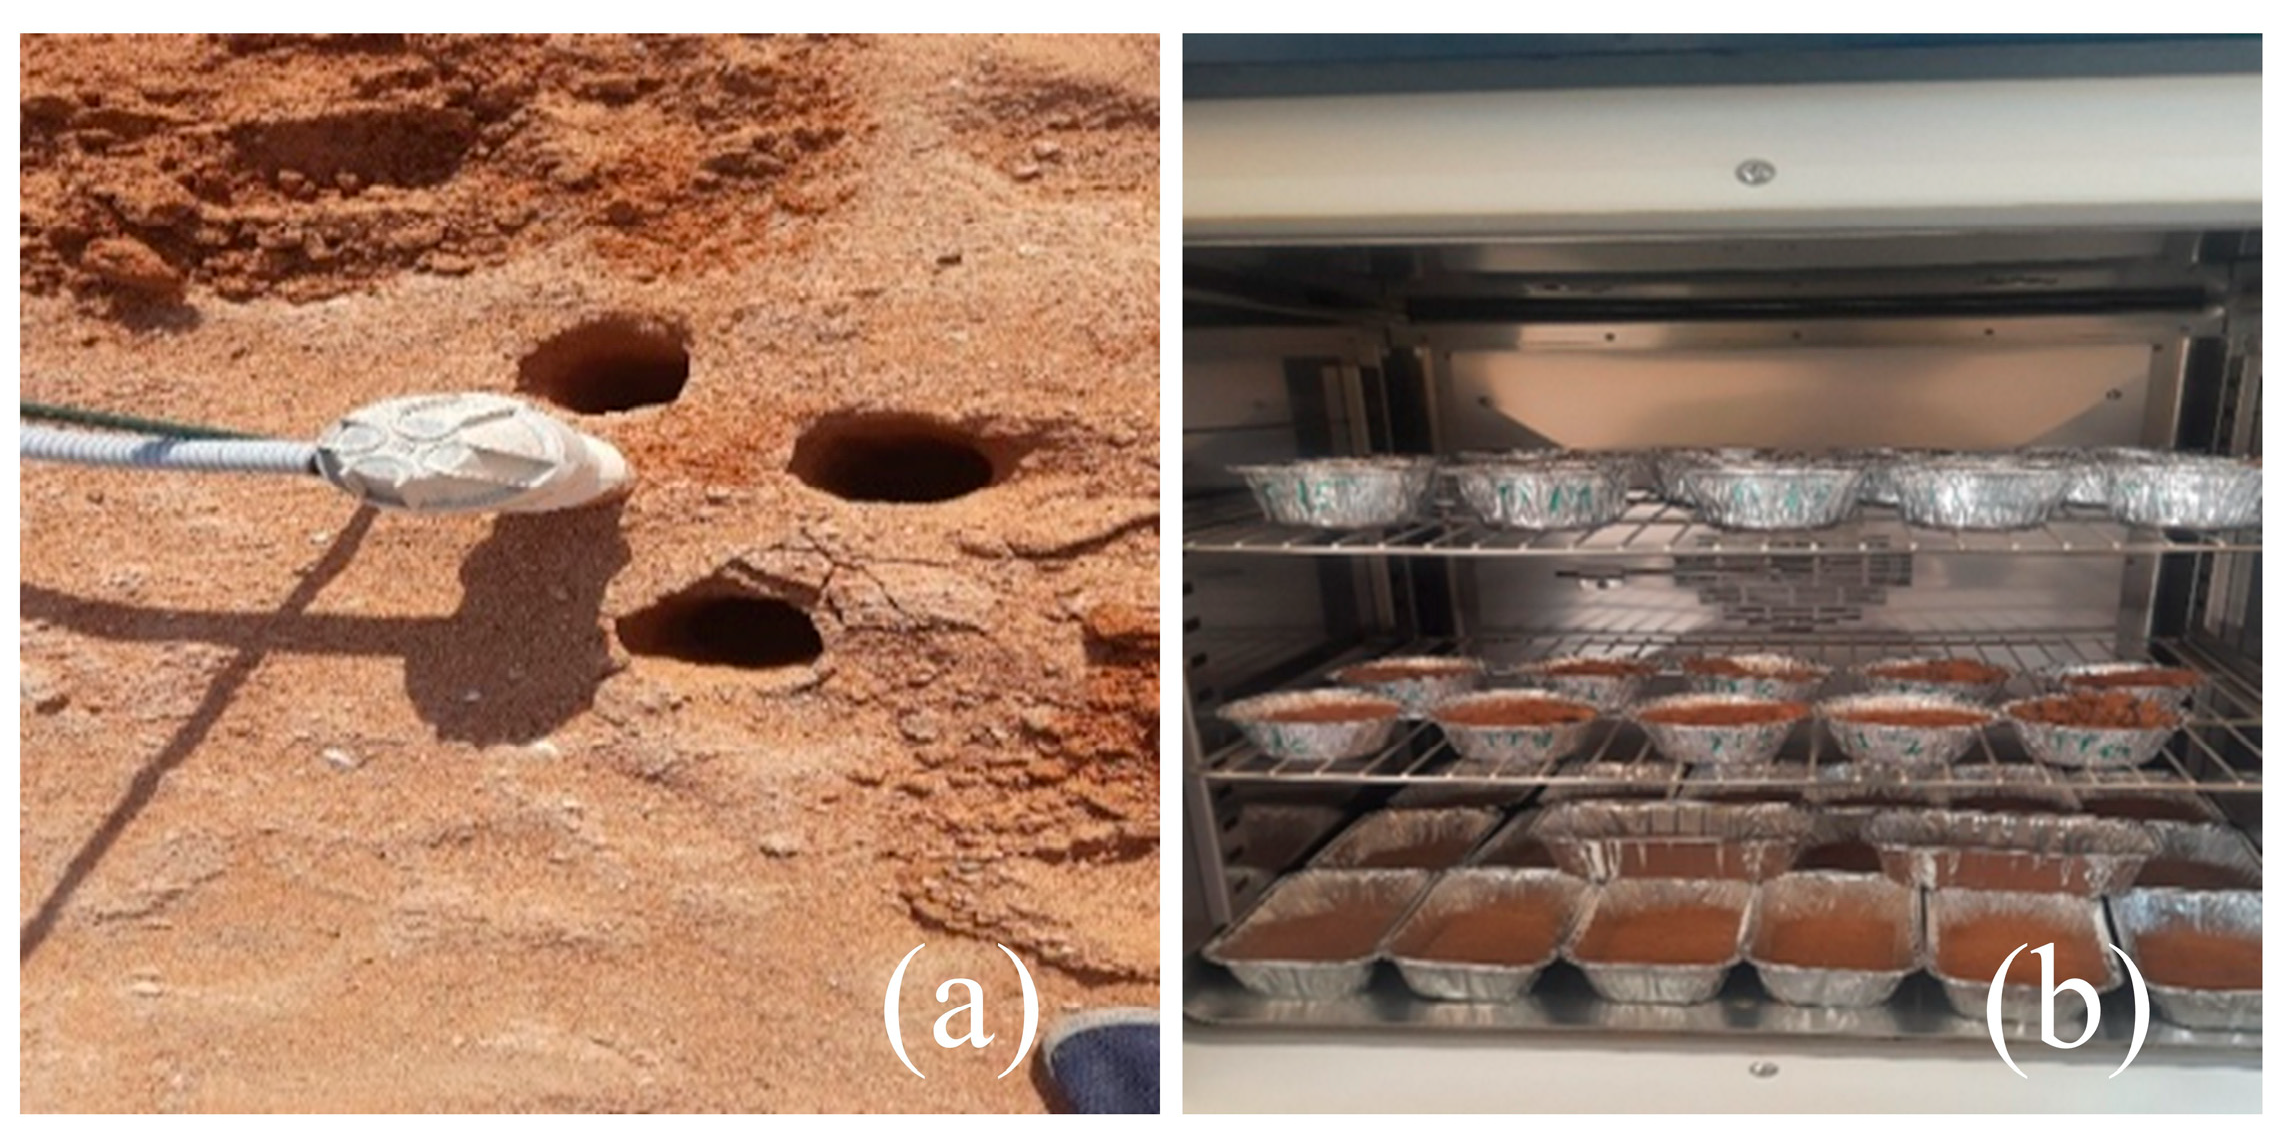
Figure 6 illustrates the key steps involved in measuring soil water content using the volumetric method, including soil drilling with an auger, selecting three sampling points around each sensor, and oven-drying the collected samples to determine moisture content. Samples were weighed fresh, oven-dried at 105 °C for 24 h, and reweighed to determine mass water content. Volumetric water content was then derived from gravimetric water content, expressed as the ratio of water mass to dry soil mass, multiplied by soil density [57]:
θ m = M s + w M s M s
θm is the mass soil water content, Ms+w wet soil mass, Ms the oven-dry soil mass, and Mw: the water mass.

2.3.5. HYDRUS Modeling

Numerical simulations of water flow and root water uptake along the vertical XZ plane were conducted using HYDRUS (2D/3D) version 2.0, following established methodologies. The modeled domain spanned 200 cm in width and 75 cm in depth, consisting of a homogeneous, initially dry soil profile with a pressure head of −1000 cm. A triangular mesh with 15,241 nodes and 30,174 2D elements provided fine spatial resolution near the soil surface and around the emitter, located at depths of 25 cm and 35 cm. Atmospheric conditions were applied at the upper boundary, free drainage at the bottom, and no-flux conditions at the vertical sides. Drippers, represented as 1 cm radius circles, operated under variable flux boundary conditions, delivering 3.41 L/h to target the effective root zone of potato plants situated 15 cm deep. The statistical error metrics used to evaluate model performance include the correlation coefficient (R), coefficient of determination (R2), mean absolute percentage error (MAPE), root mean square error (RMSE), and model efficiency (ME). These metrics provide a comprehensive assessment of the model’s accuracy and reliability, as follows (Equations (7)–(11)).
R = i = 1 n E i E i ¯ C i C i ¯ i = 1 n E i E i ¯ 2 i = 1 n C i C i ¯ 2  
R 2 = i = 1 n E i E i ¯ C i C i ¯ 2 i = 1 n E i E i ¯ 2 · i = 1 n C i C i ¯ 2
M A P E = 1 n i = 1 n E i C i E i × 100
R M S E = i = 1 n E i C i 2 n
M E = 1 i = 1 n E i C i 2 i = 1 n E i E i ¯ 2
where E i is the observed value; C i is the simulated value; n is the number of observations; E i ¯ is the mean of observed values; and C i ¯ is the mean of simulated values.

3. Results and Discussion

The field evaluation of subsurface irrigation systems generated insights into soil properties, water distribution dynamics, plant germination, and yield performance under varying emitter types, installation depths, and irrigation regimes. Results are presented in an integrated manner, with each subsection highlighting the interaction between experimental observations and supporting evidence from prior studies. Particular attention is given to the comparative effects of porous versus emitting pipes, shallow versus deep placement, and continuous versus pulsed water application. This approach allows for a comprehensive assessment of how irrigation design and scheduling jointly influence soil–water relationships and plant productivity in arid and hyper-arid environments.

3.1. Soil Characteristics

To provide a baseline for interpreting irrigation performance, the physical and chemical properties of the experimental soil were first characterized. The soil analyses focused on determining texture, bulk density, true density, pH, and salinity. The mechanical analysis revealed a loamy sand soil type, with an average bulk density of 1.42 g/cm3, which is crucial for understanding water retention and root penetration. Measurements of true density indicated an average value of 2.6 g/cm3. The assessment of soil pH yielded an average value of 7.9, categorizing the soil as slightly alkaline, while the average salinity measurement of 1.01 dS/m indicated relatively low salinity levels conducive to agricultural practices. Results demonstrated that both types of pipes maintained consistent discharge rates of 0.9 gallons/hour/foot, indicating equivalent functionality in terms of water distribution and retention under the investigated pressure conditions. Plant coefficient (Kplt), reference evapotranspiration (ETref), plant evapotranspiration (ETplt), and net water irrigation requirements (NWIR), can be shown in Figure 7.

3.2. Measurement Approaches Validation

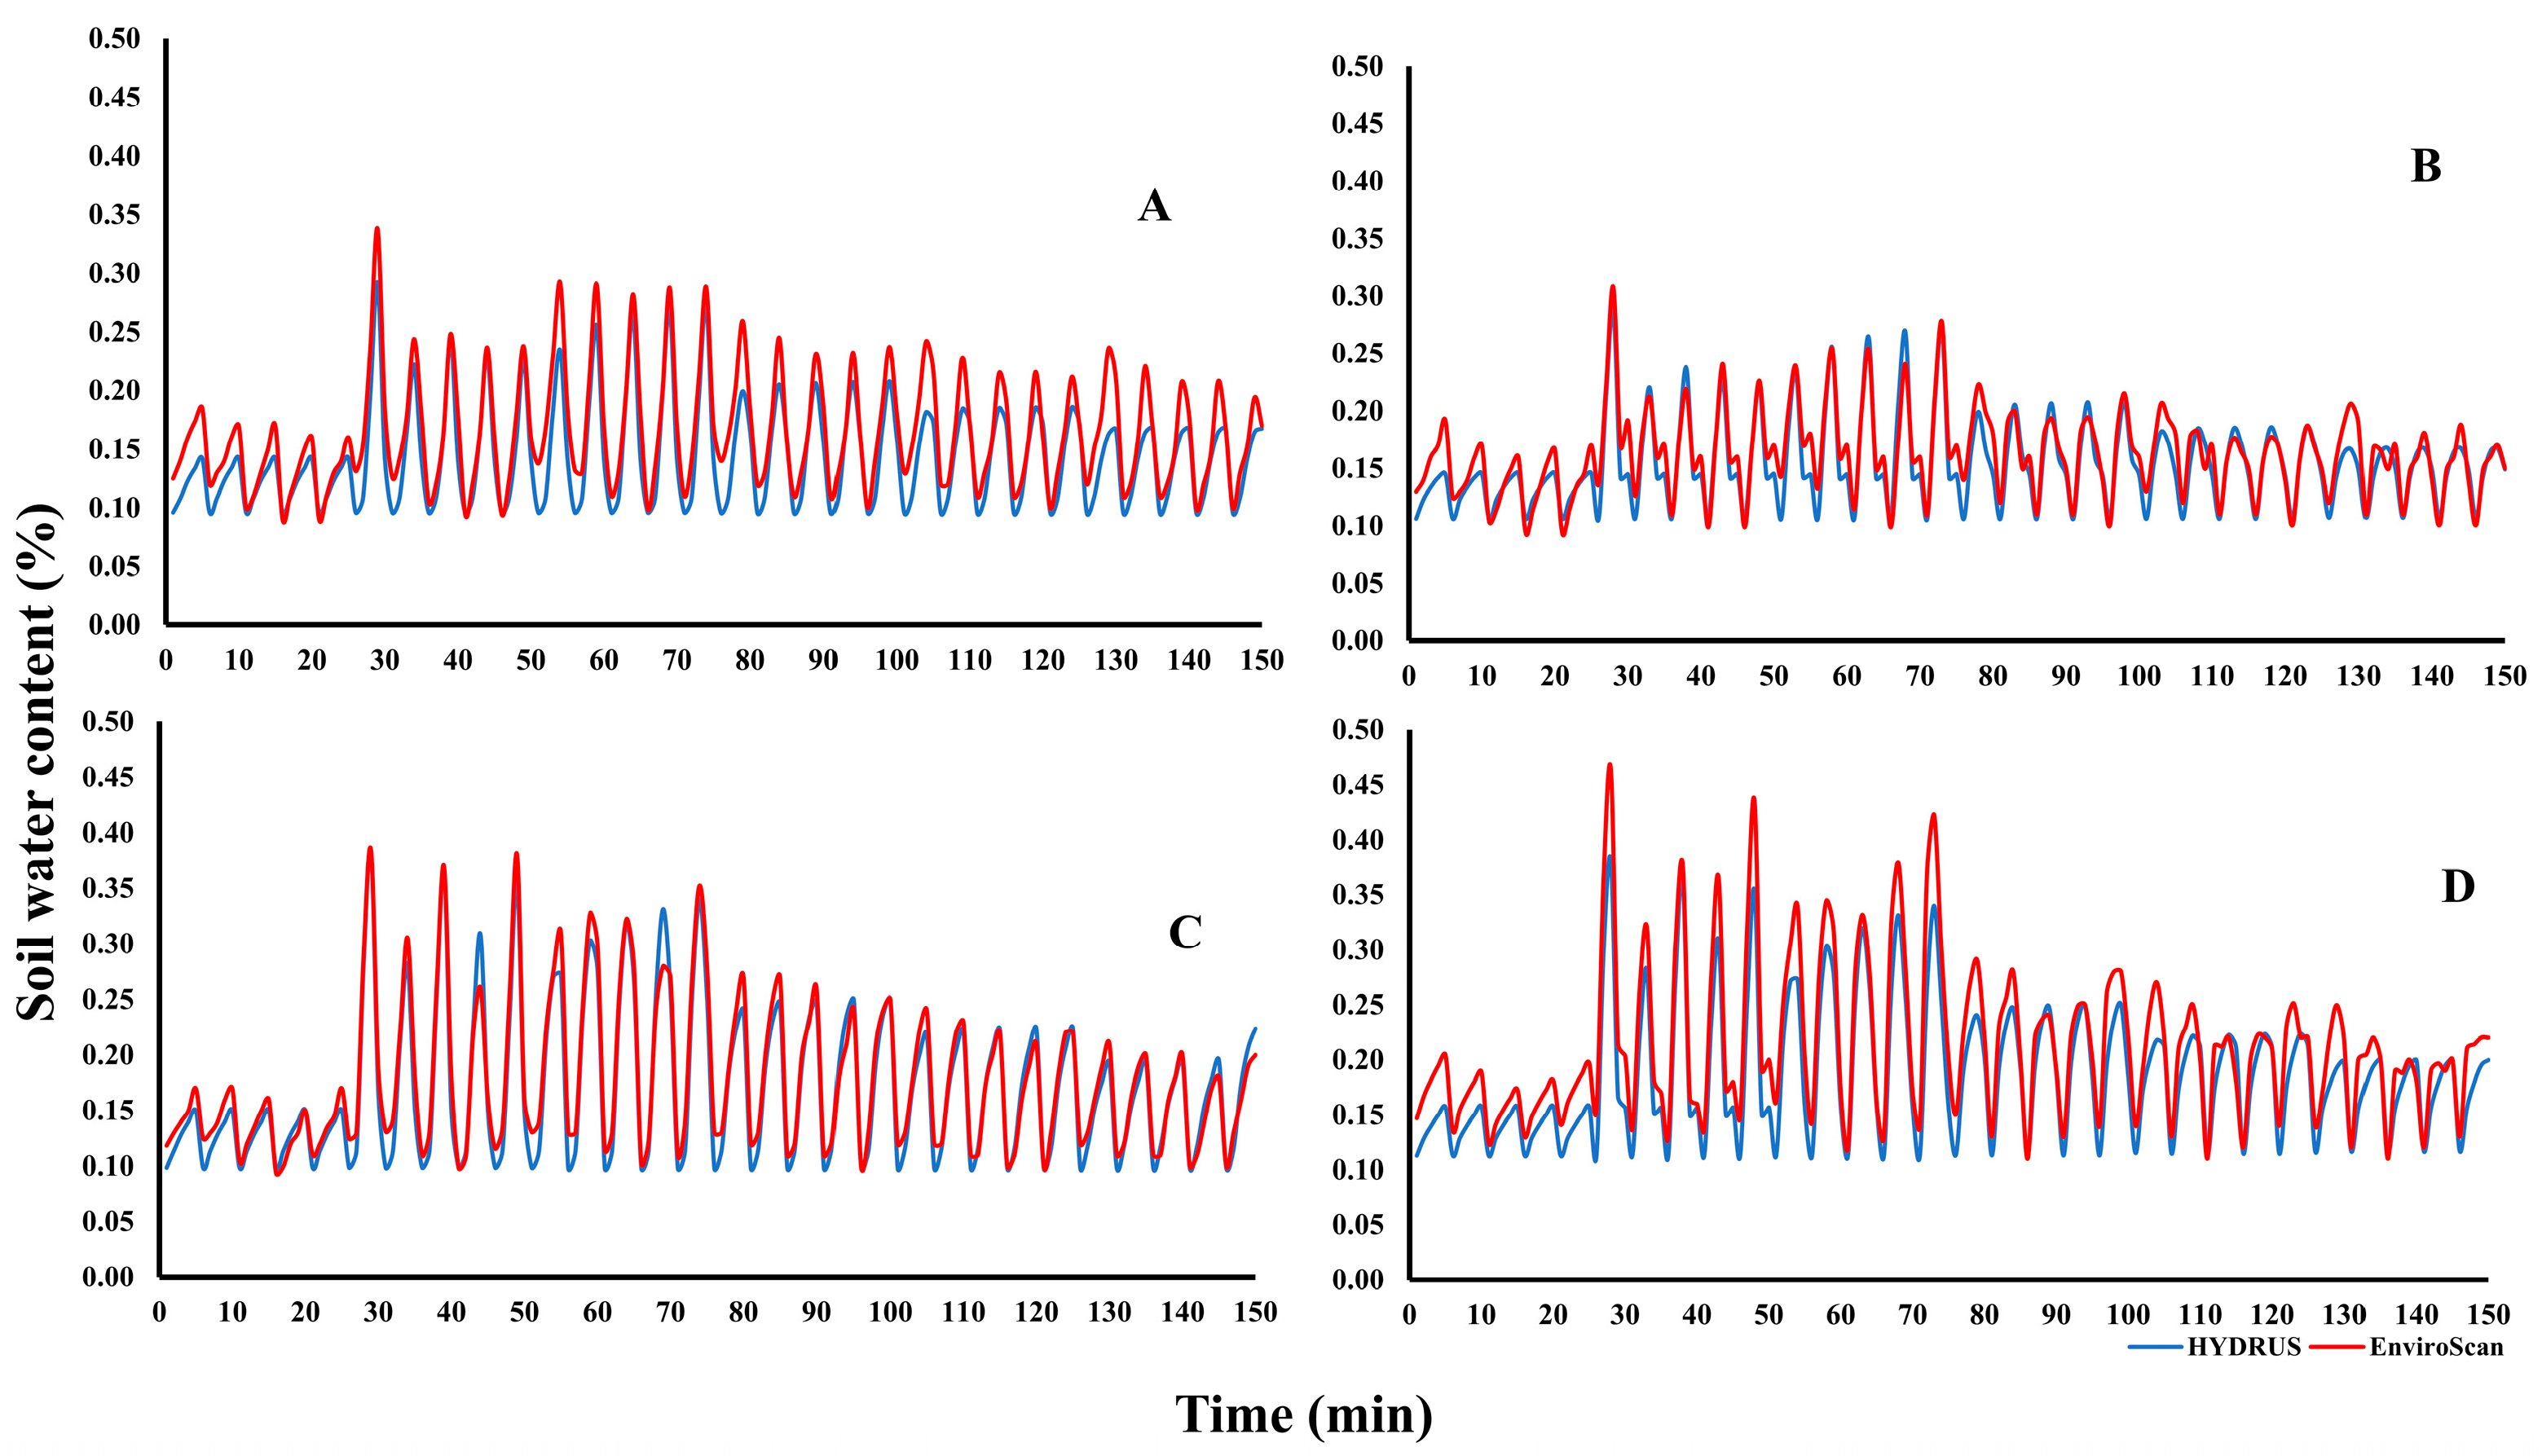
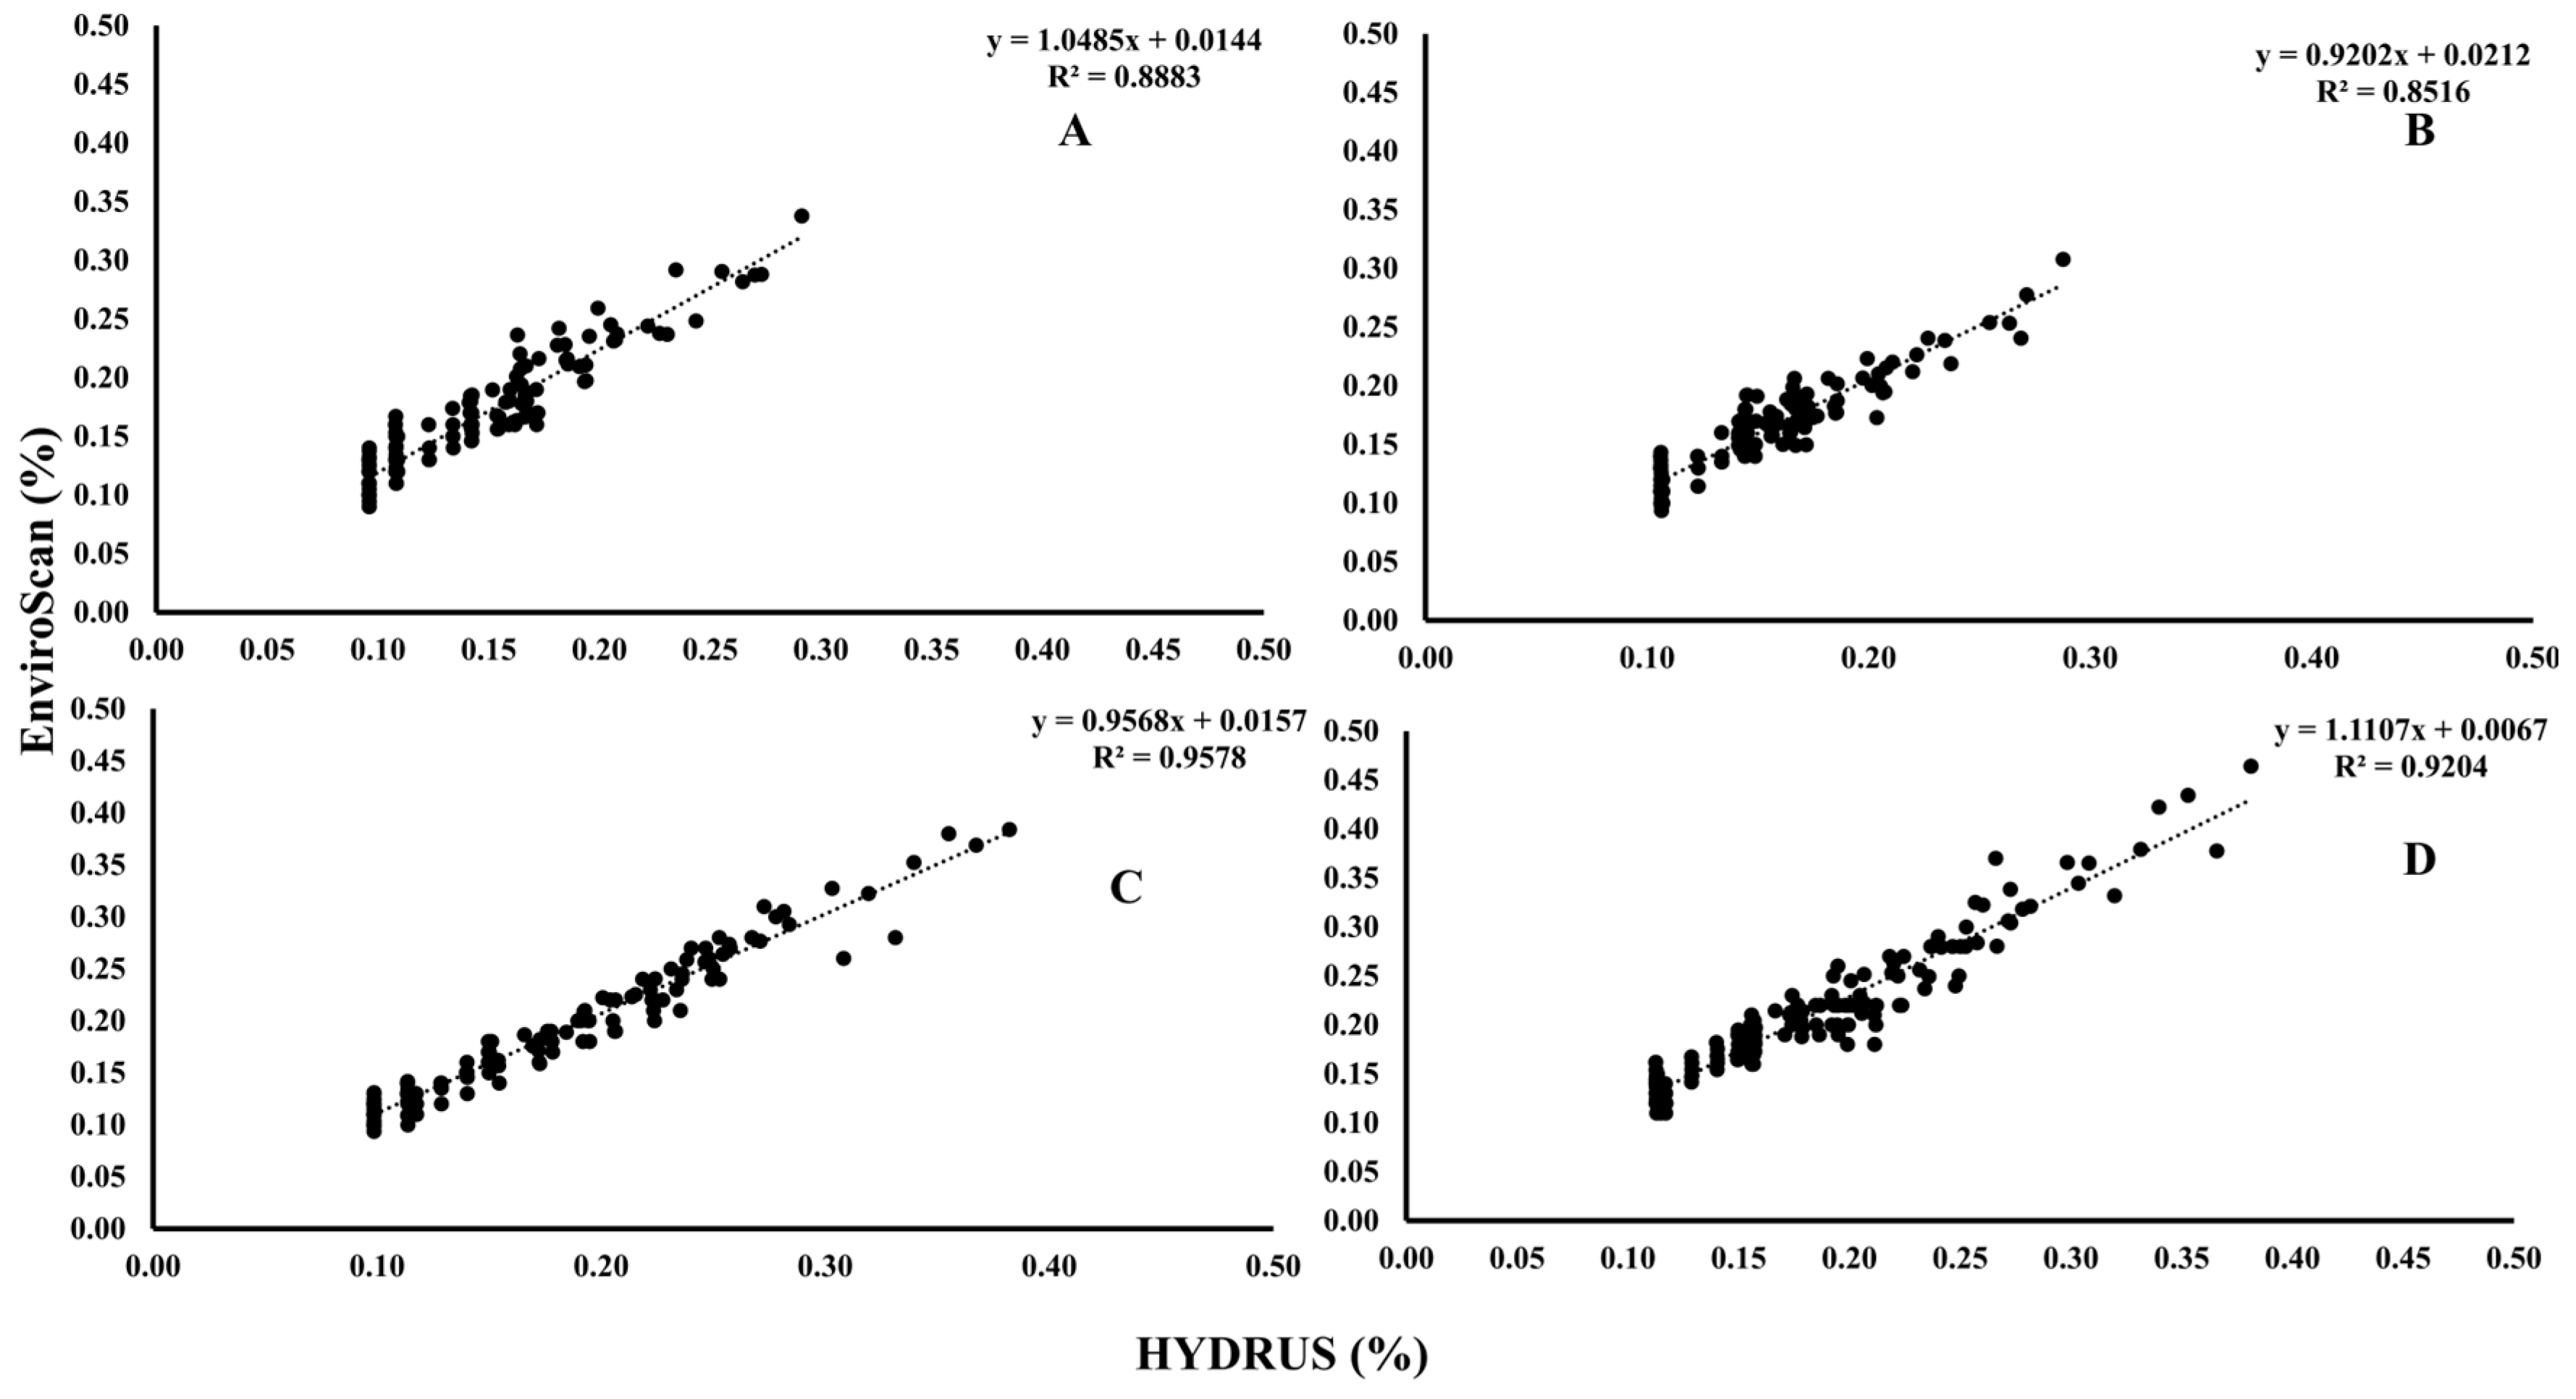
Before assessing treatment effects, soil water content measurements obtained from EnviroSCAN sensors and HYDRUS simulations were validated against volumetric sampling to ensure reliability. A systematic comparison was conducted across four experimental groups: Group A (porous pipes, 35 cm depth), Group B (porous pipes, 25 cm), Group C (emitting pipes, 35 cm), and Group D (emitting pipes, 25 cm). Data from EnviroSCAN devices were correlated with corresponding HYDRUS outputs, as illustrated in Figure 8. Results revealed a strong agreement between field measurements and model predictions, confirming the accuracy of both approaches. This validation strengthens confidence in using integrated sensor–model frameworks for monitoring soil water dynamics, providing a robust basis for optimizing irrigation strategies and improving plant performance.
To evaluate the relationship between field and modeled soil water content, correlations were examined between EnviroSCAN measurements and HYDRUS simulations across four treatment groups differing in pipe type and depth (Figure 9). Strong correlations were observed in all cases. In Group A (PRP35), the correlation coefficient (R) was 0.94 with a determination coefficient (R2) of 0.89, model efficiency (ME) of 0.91, root mean square error (RMSE) of 2.69, and mean absolute percentage error (MAPE) of 0.16. Group B (PRP25) showed R of 0.92, with higher predictive accuracy reflected in ME of 0.95, RMSE of 1.73, and MAPE of 0.09. Group C (GRP35) achieved the highest agreement, with R of 0.98, R2 of 0.96, ME of 0.97, RMSE of 1.64, and MAPE of 0.09. Group D (GRP25) maintained reliability with R of 0.96 and R2 of 0.92, though predictive error was slightly higher (RMSE 3.42; MAPE 0.16). A combined analysis across groups (Figure 10) yielded R of 0.94, R2 of 0.90, and ME of 0.97, confirming strong overall agreement between the two methods.
These results demonstrate that EnviroSCAN sensors provide highly reliable measurements of soil water content, with HYDRUS simulations effectively capturing field dynamics. The close alignment across depths and emitter types reinforces the value of integrating sensor-based monitoring with modeling tools for irrigation research. Such integration enables accurate assessment of soil water behavior, supports more informed irrigation scheduling, and ultimately promotes efficient resource management and sustainable agricultural production under variable environmental conditions.
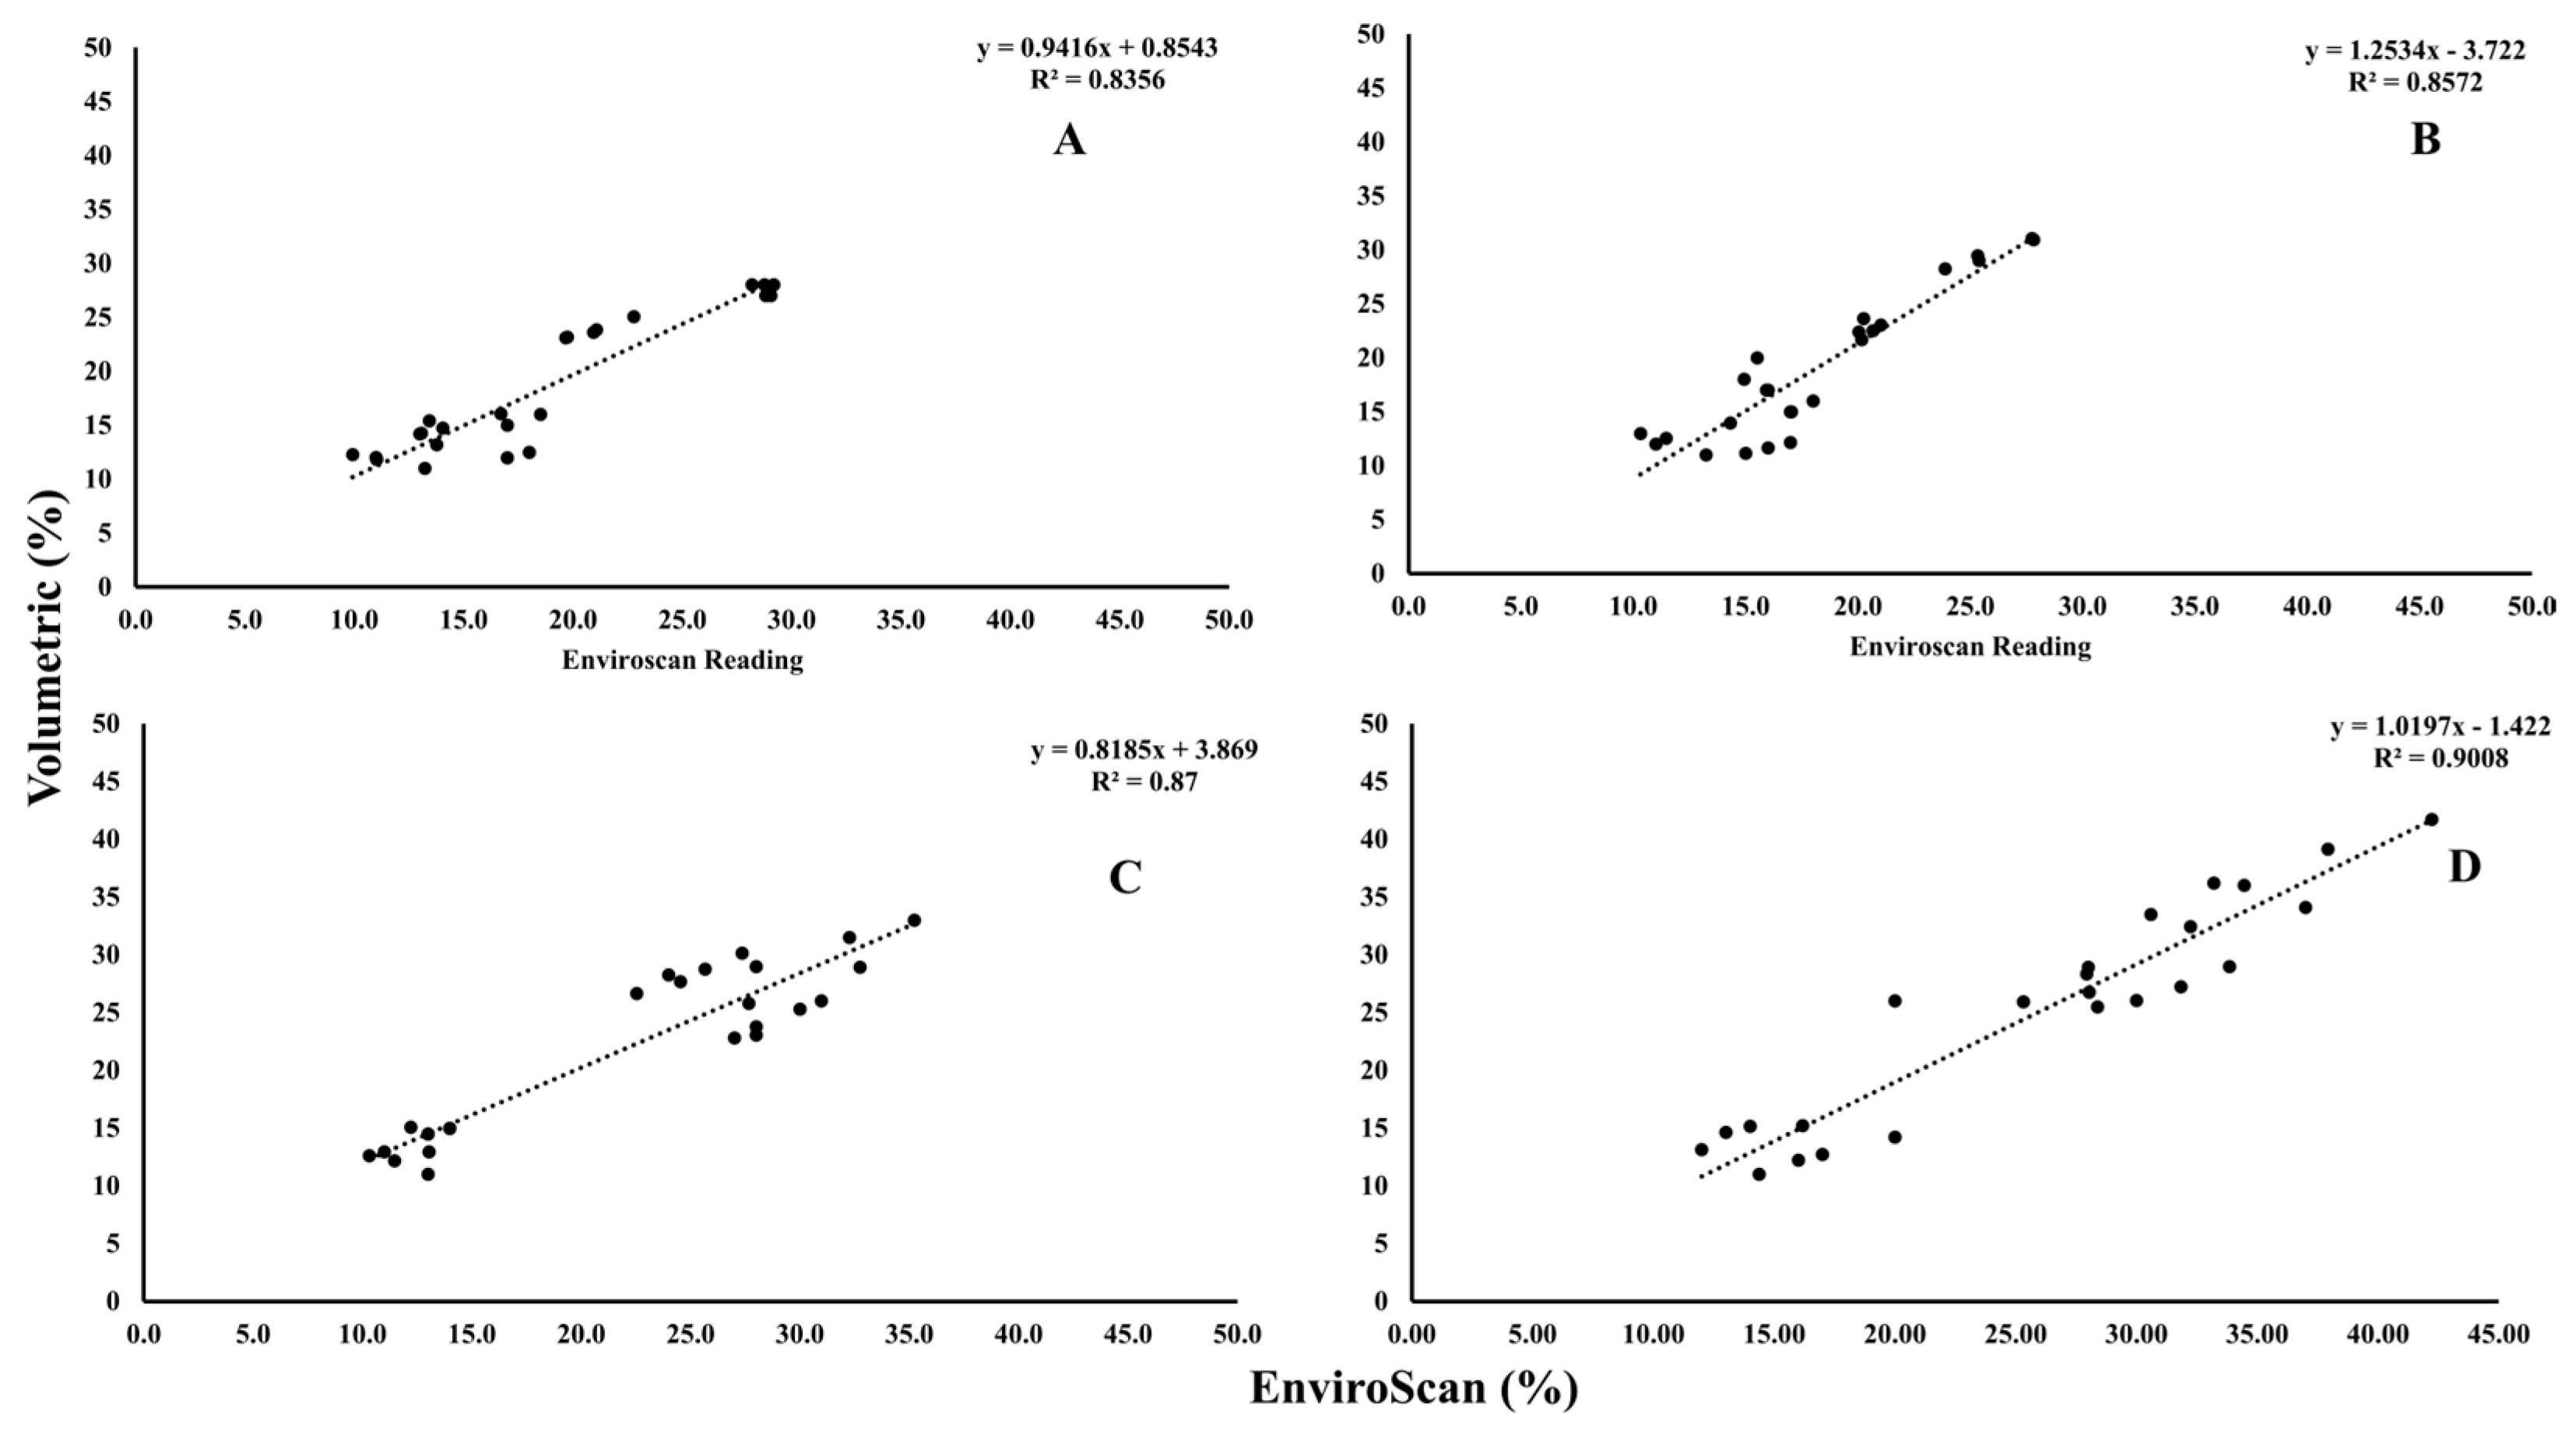
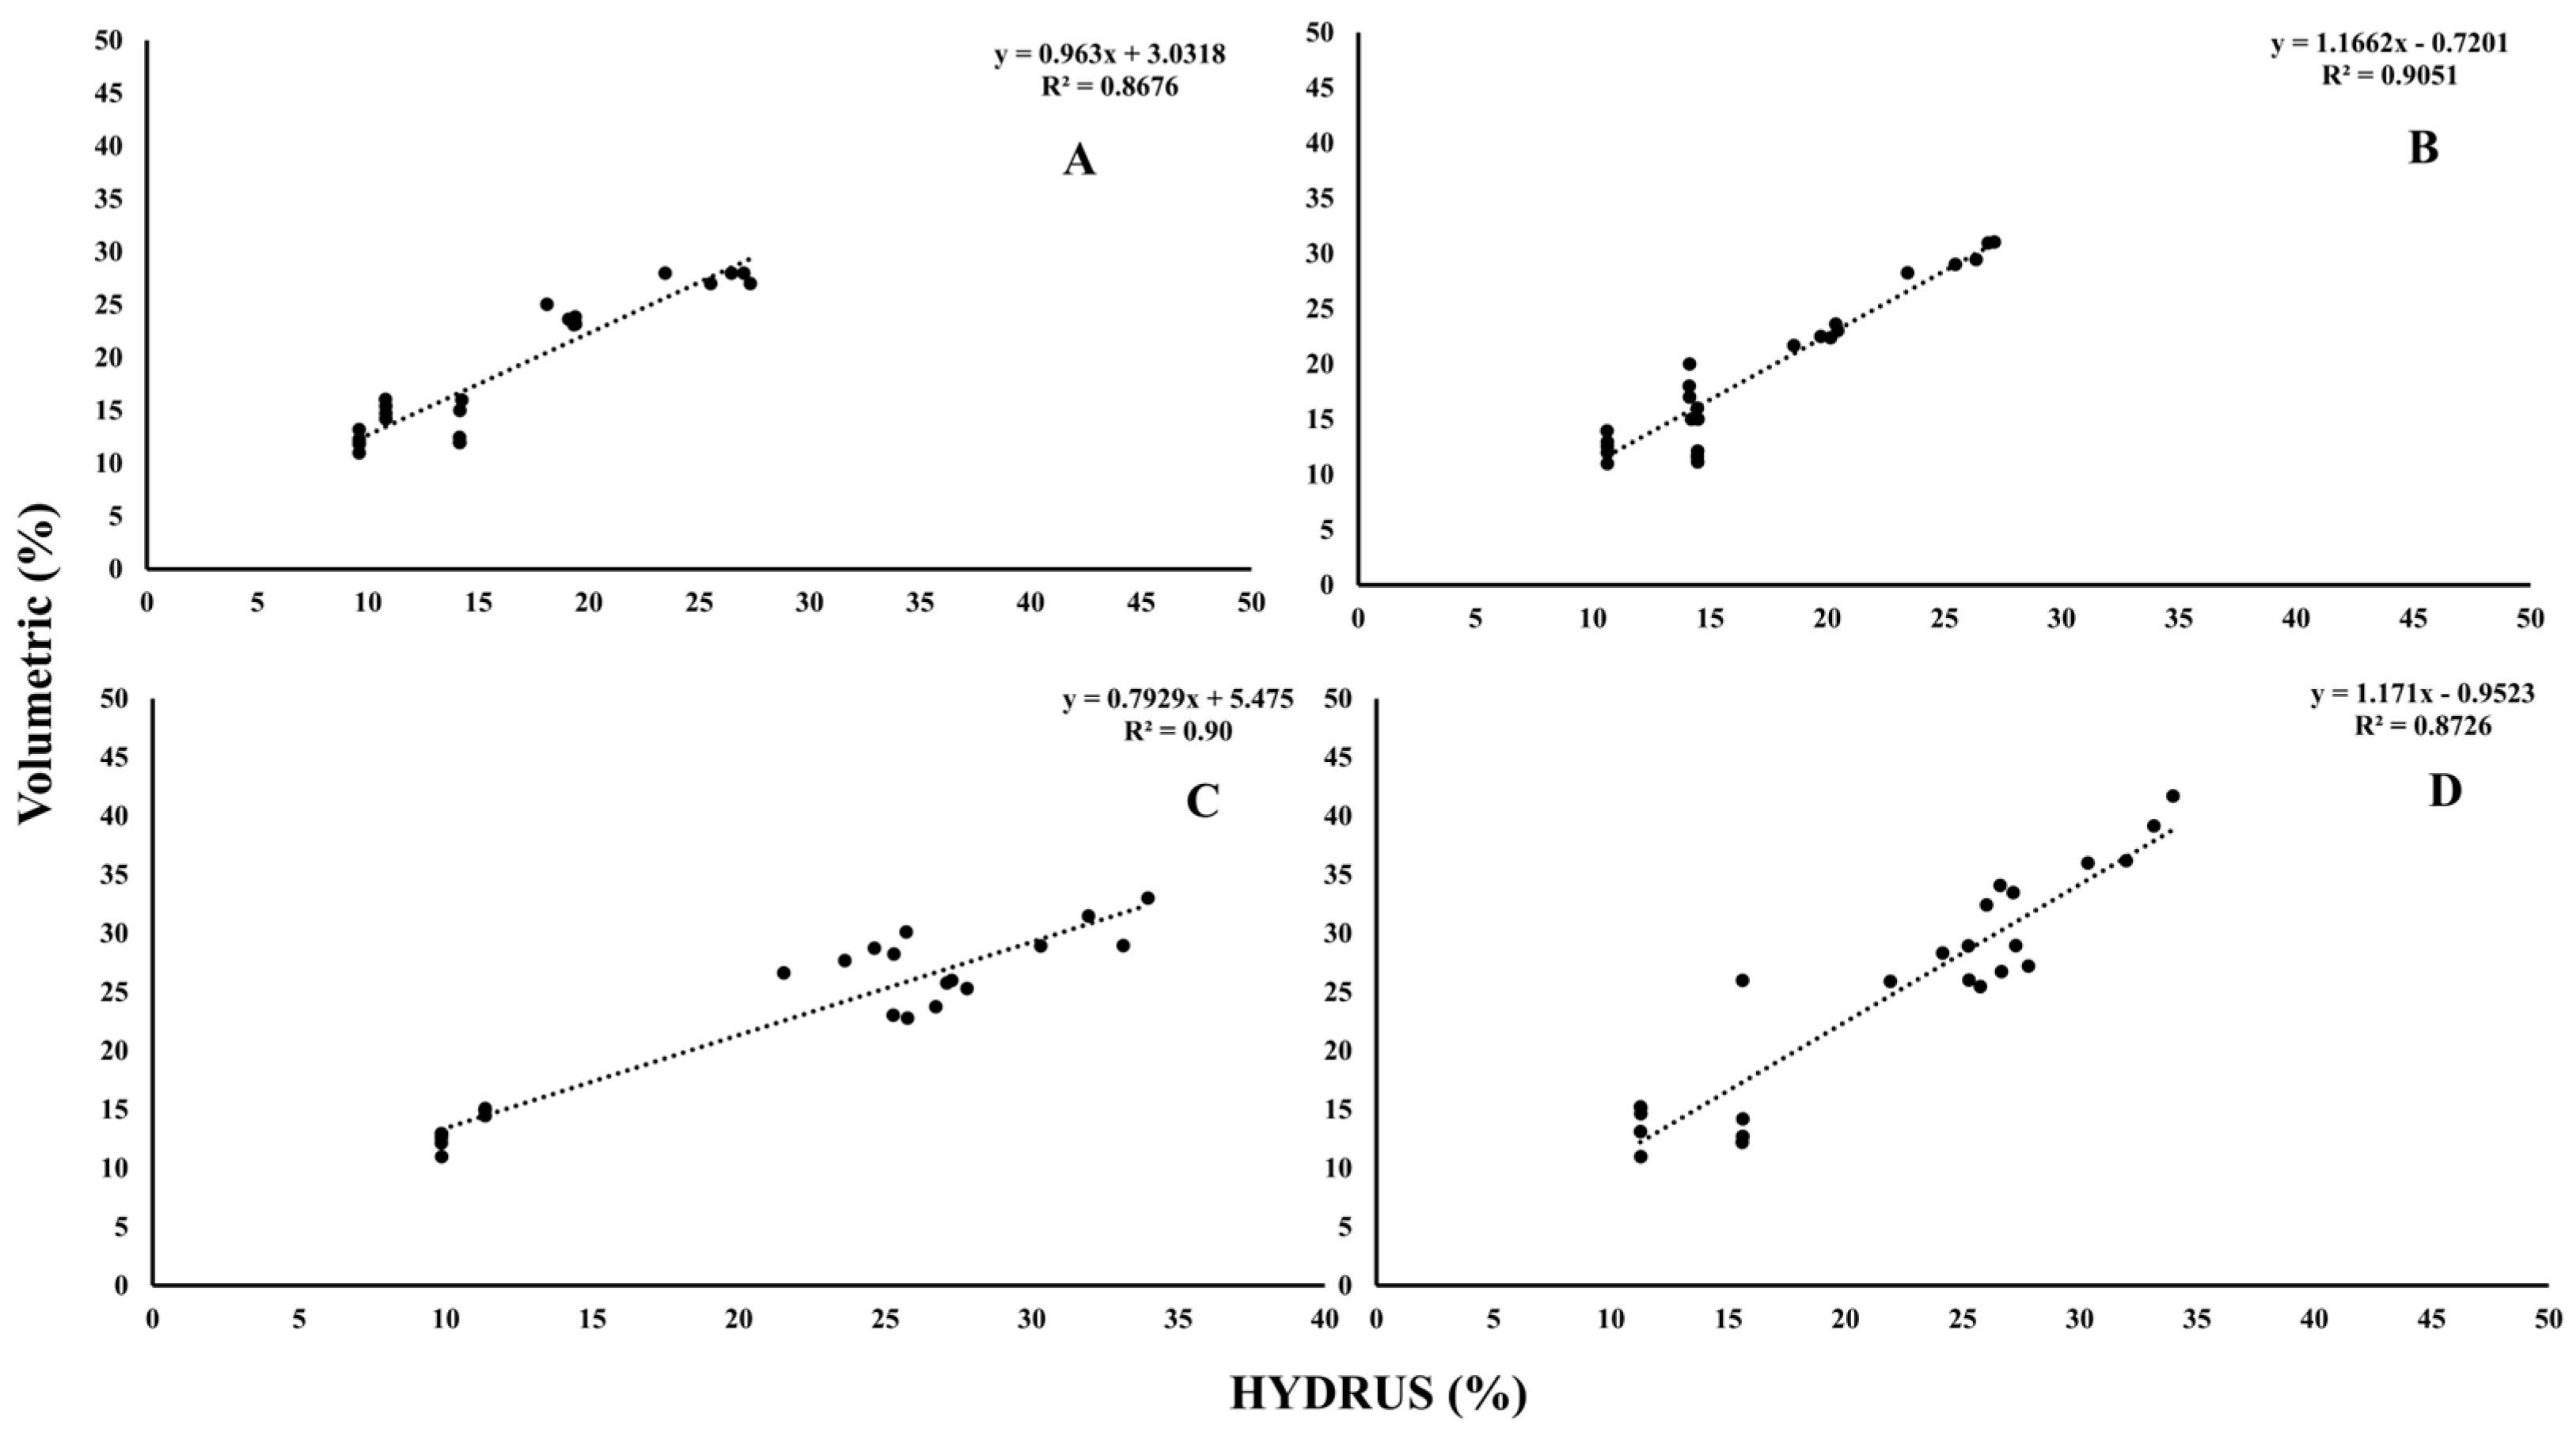
Soil water content was estimated using the volumetric method alongside simultaneous measurements from EnviroSCAN devices at corresponding depths, allowing direct comparison between the two techniques. This dual approach provided a robust assessment of the reliability of sensor-based measurements relative to traditional sampling. Data were collected bi-monthly during both growing seasons, yielding six assessments per season that integrated the two methods. Results (Figure 11) demonstrated strong correlations between volumetric and EnviroSCAN readings across the four experimental groups (A–D), while additional comparisons with HYDRUS simulations (Figure 12) confirmed close alignment between field measurements and model outputs. The consistency observed across methods validates the accuracy of the monitoring framework, reinforcing confidence in the data and improving understanding of soil water dynamics under diverse field conditions.

3.3. Soil Water Distribution

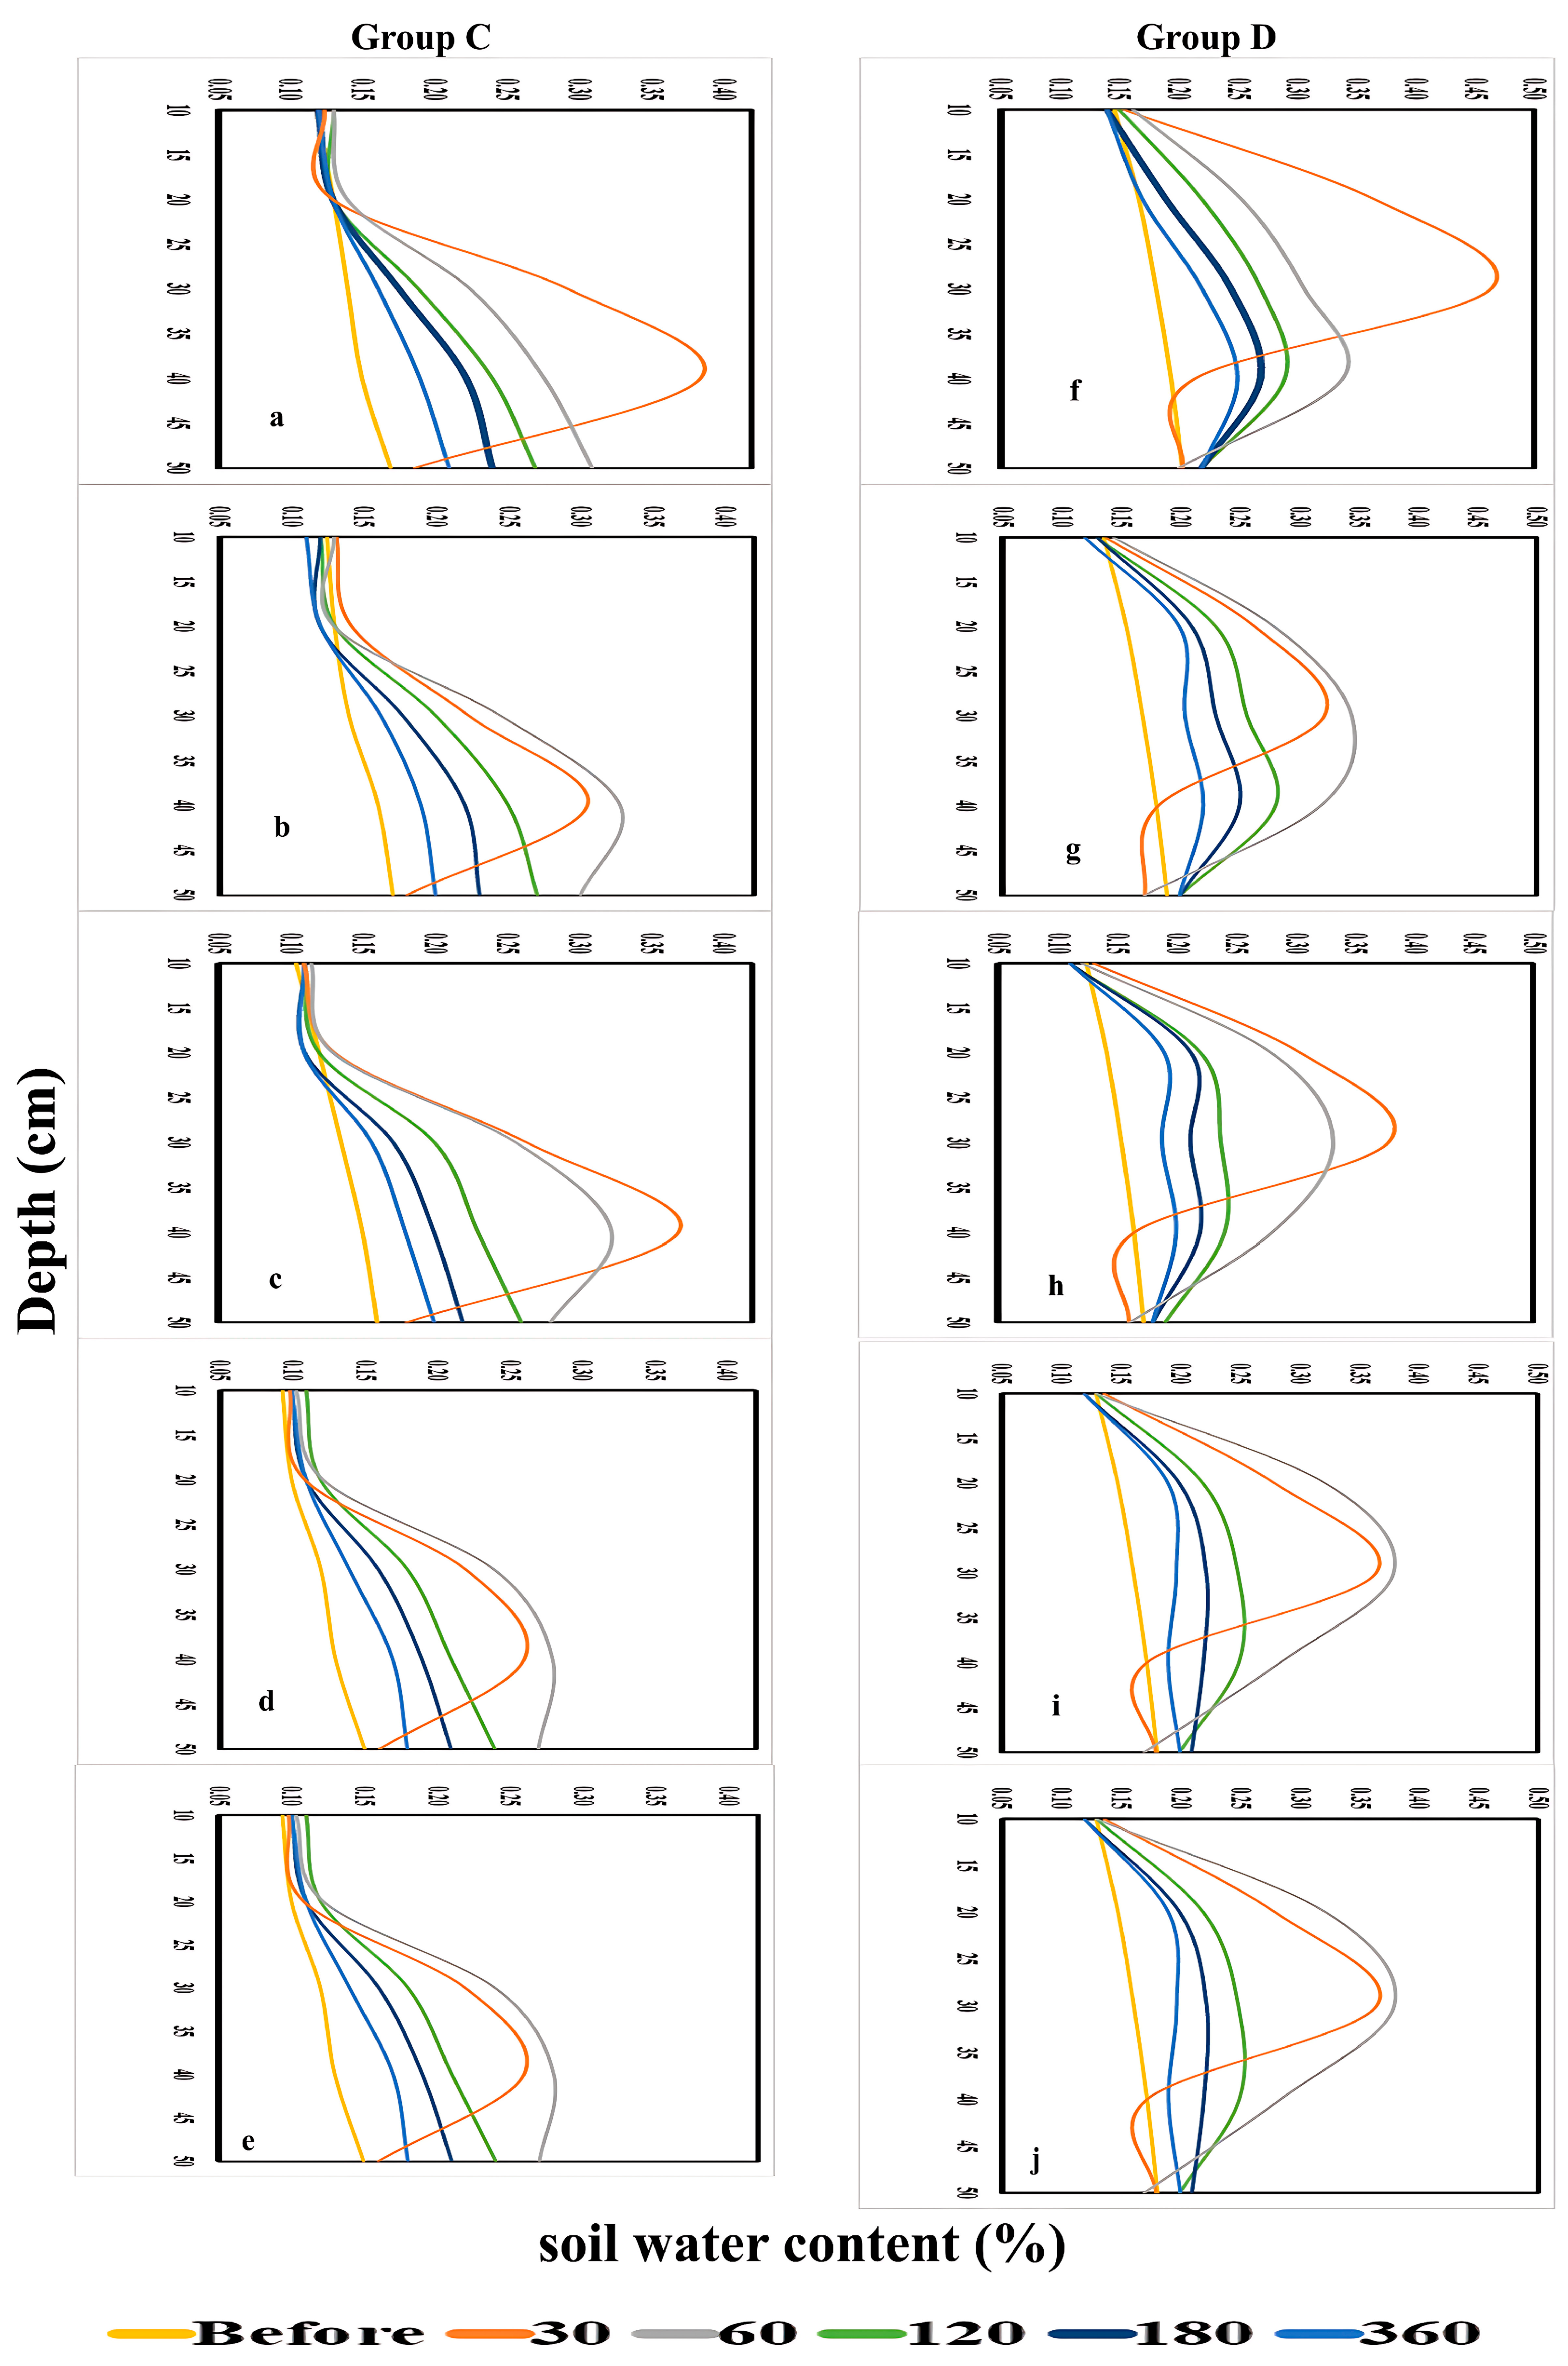
The spatial and temporal distribution of soil water content was evaluated under different emitter types, burial depths, and irrigation regimes to assess their influence on root-zone availability. Soil water content was monitored using EnviroSCAN sensors at depths of 10–50 cm under five irrigation regimes (WF1C–WF5C) over periods of 0–360 min, with results summarized in Figure 13 and Figure 14.
For PRP at 35 cm (Group A), little change was observed at shallow depths (10–20 cm) within the first 30 min, whereas water content at 30 cm increased from 13% to 28% and at 40 cm from 16% to 24%. After 60 min, intermittent irrigation (WF5C) maintained higher retention at 30–40 cm compared with continuous flow, although water content at 50 cm declined as application cycles increased. Over longer durations, deeper layers exhibited consistent gains, with WF5C showing the greatest retention.
In PRP at 25 cm (Group B), shallow layers again remained stable, while water content at 20 cm and 30 cm rose sharply within the first 30 min, from 14% to 22% and 16% to 31%, respectively. WF5C sustained these increases, while WF1C tended to decline over time. Minimal changes occurred at 10 cm and 50 cm, but at intermediate depths, WF5C consistently achieved the highest water retention throughout the monitoring period.
For GRP at 35 cm (Group C), water content remained unchanged at 10–20 cm but increased substantially at deeper layers, reaching 29% at 30 cm and 38% at 40 cm after 30 min. By 60 min, WF5C maintained higher values than WF1C, particularly at 30–40 cm, confirming the advantage of pulsed application. Although increases at 50 cm were smaller, deeper layers retained more water with intermittent regimes across the full 360-min period. In GRP at 25 cm (Group D), significant increases were evident at 20 cm and 30 cm within the first 30 min (17% to 37% and 18% to 46%, respectively), with WF5C maintaining higher values than WF1C. At 40 cm, both regimes showed increases, though WF5C achieved more consistent retention over time. No substantial changes were observed at 10 cm and 50 cm, but intermediate depths (20–30 cm) exhibited clear improvements under pulsed irrigation throughout the experiment. Overall, these results confirm that intermittent irrigation enhanced soil water retention compared with continuous flow, particularly in the root-active layers (20–40 cm). While shallow layers remained largely unaffected, pulsed regimes limited percolation to deeper layers and maintained higher water availability where it is most beneficial for plant uptake.
EnviroSCAN readings revealed distinct soil water dynamics across treatments and depths (Figure 15 and Figure 16). For PRP at 35 cm (Group A), shallow layers (10–20 cm) showed little change within the first 30 min, whereas deeper layers exhibited substantial increases: water content at 30 cm rose to 47.2% under WF1C and 37.7% under WF5C, while at 40 cm it reached 94.3% and 69.6%, respectively. By 60 min, WF5C began to enhance moisture retention at 10–20 cm, with deeper layers continuing to increase over time. At 120–360 min, the upper layers stabilized while 30–40 cm depths showed consistent gains, particularly under WF5C, confirming improved retention at greater depths with pulsed application. In PRP at 25 cm (Group B), shallow layers again remained largely unaffected. At 30 min, WF1C sharply increased soil water content at 20 cm (57.3%) and 30 cm (92.4%), with WF5C displaying more gradual but sustained gains over longer intervals. By 120–180 min, deeper layers maintained stable increases, although a slight decline was noted at 50 cm. These patterns reinforce the long-term retention benefits of pulsed irrigation at intermediate depths.
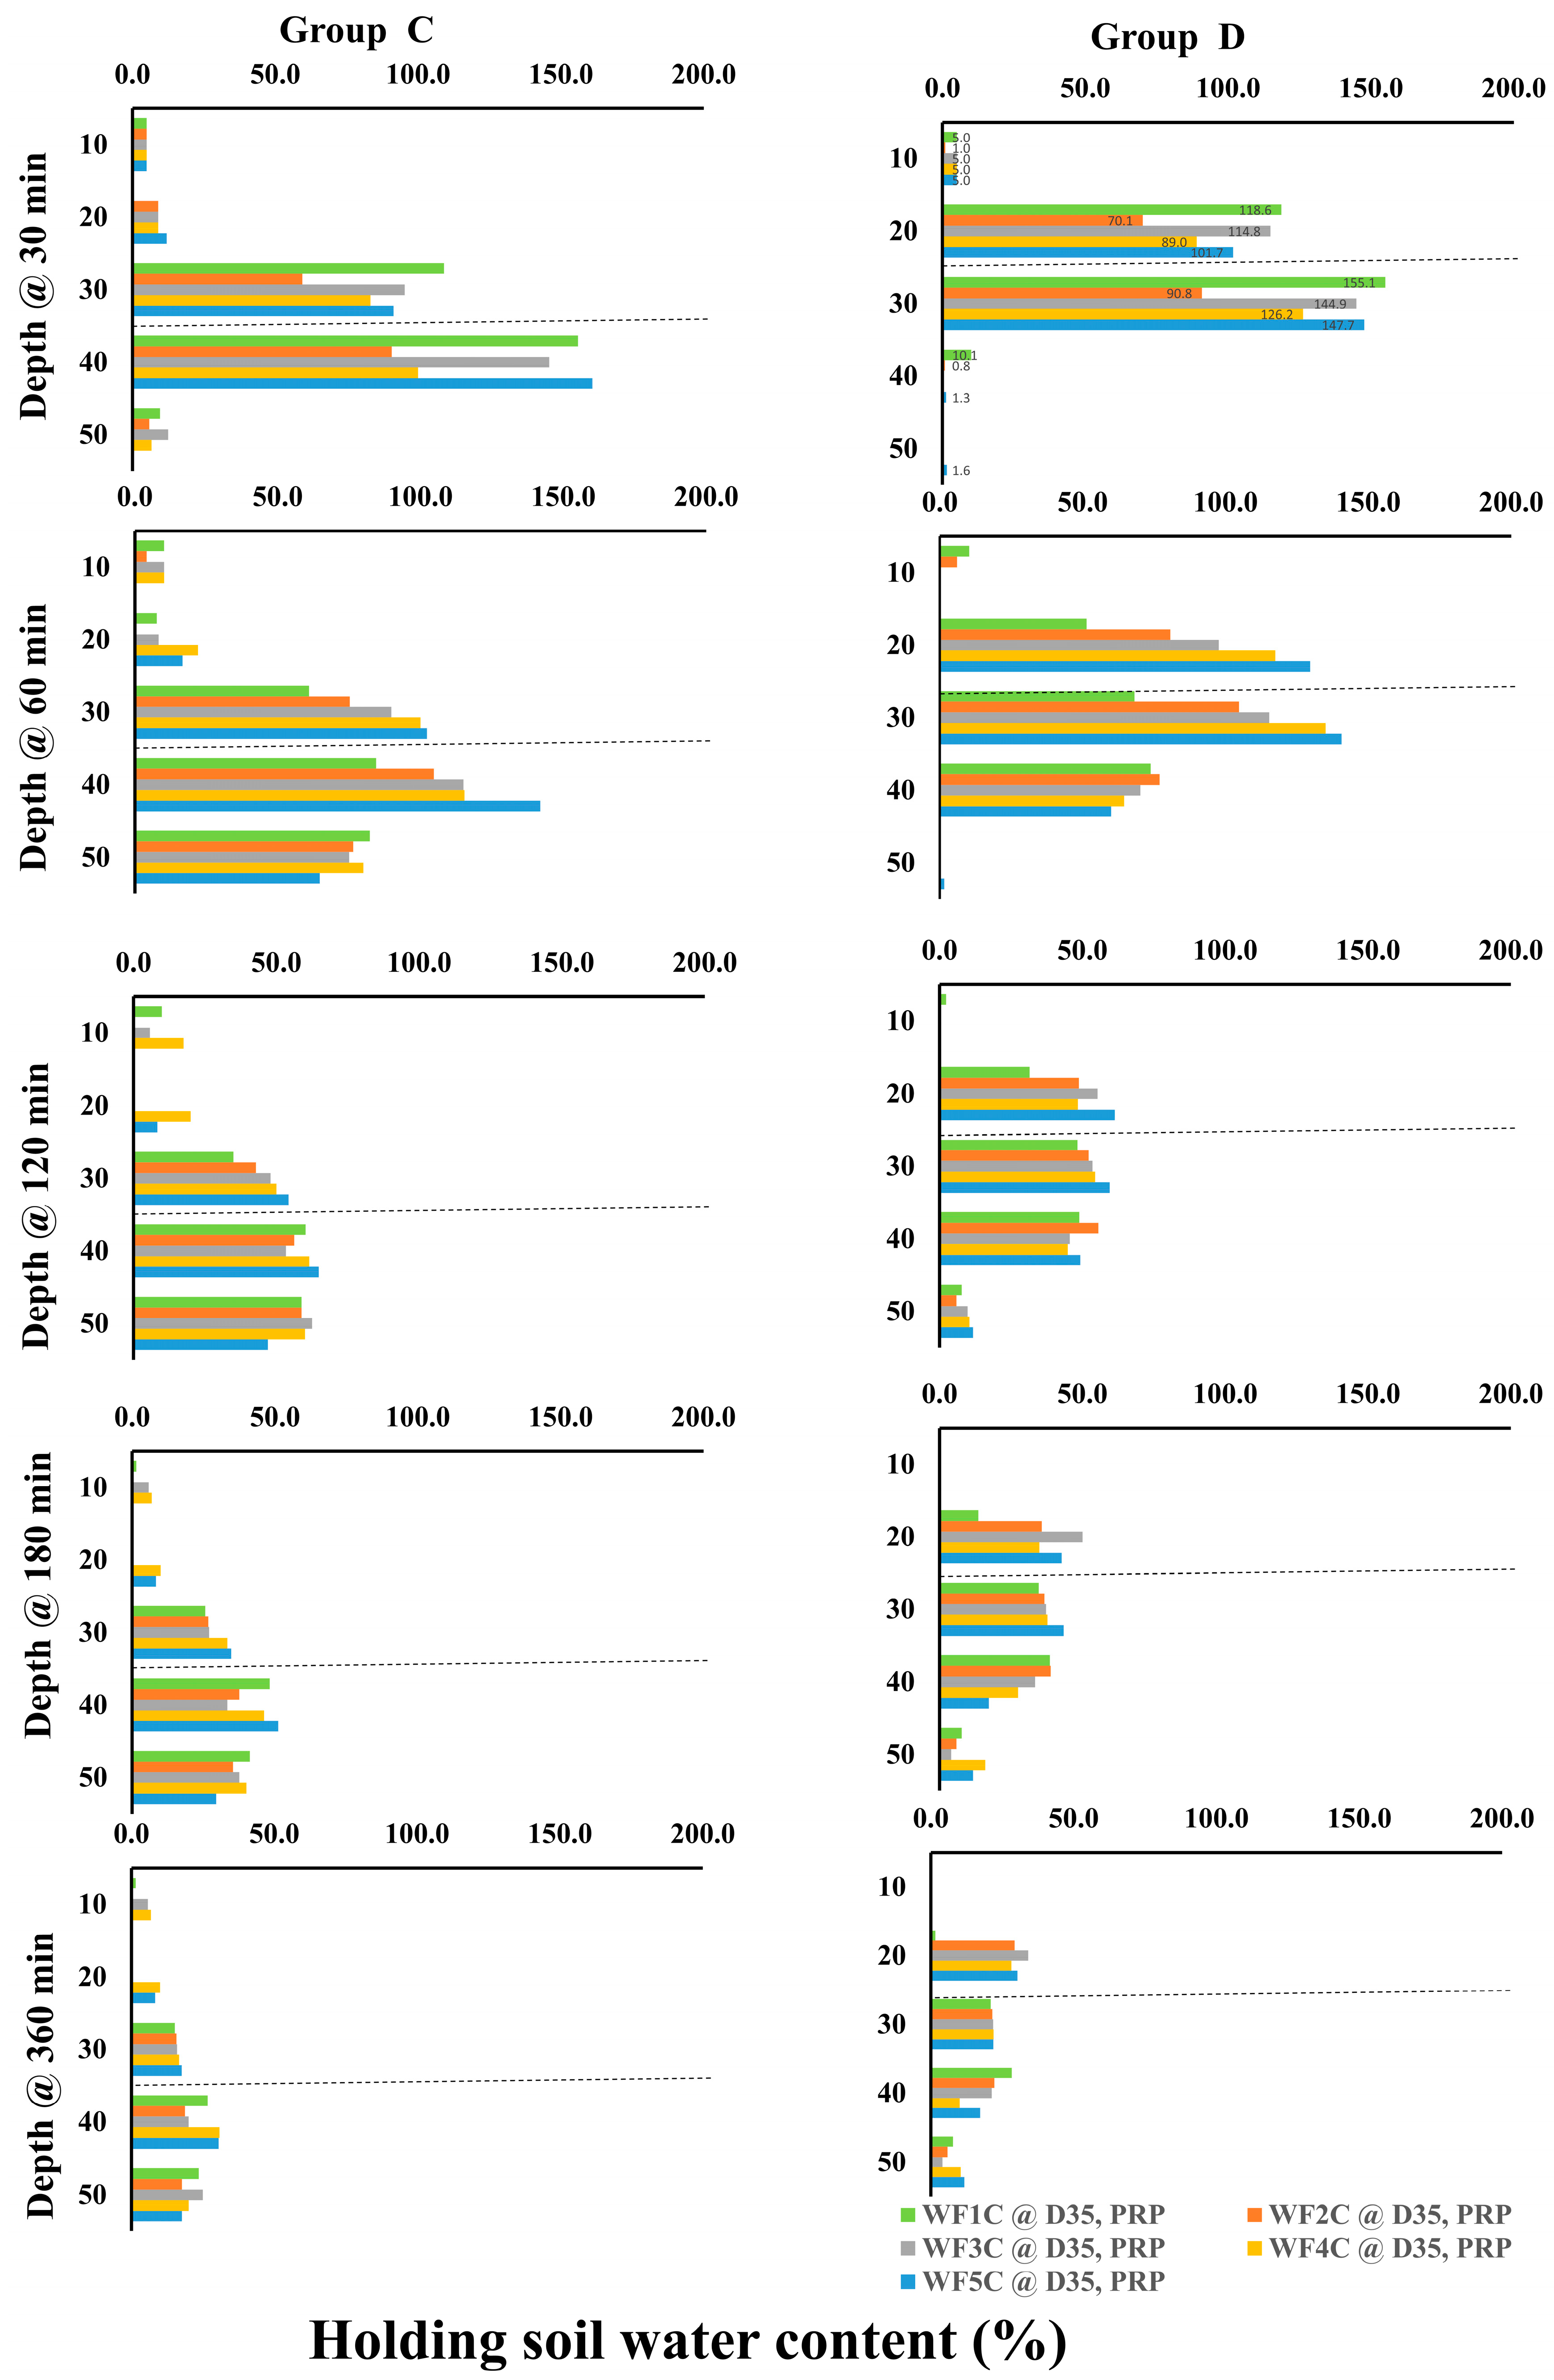
For GRP at 35 cm (Group C), initial stability at 10–20 cm contrasted with large increases at deeper layers: at 30 cm, WF1C and WF5C reached 109.1% and 91.4%, respectively, while at 40 cm they rose to 156% and 161%. Over 60–360 min, WF5C consistently maintained higher values, peaking at 102.3% (30 cm) and 142% (40 cm) after 60 min, before gradually declining at later intervals. Although increases at 50 cm were modest, intermittent irrigation achieved superior retention across most time steps. In GRP at 25 cm (Group D), no treatment effects were observed at 10 cm or 50 cm, but pronounced increases occurred at 20–30 cm. After 30 min, WF1C reached 118.6% at 20 cm and 155.1% at 30 cm, compared with 101.7% and 147.7% under WF5C. By 60 min, WF5C surpassed WF1C, achieving 129.6% at 20 cm and 140.7% at 30 cm. This advantage persisted across longer durations (120–360 min), confirming that the five-cycle regime consistently enhanced water retention in the root-active layers. Collectively, these results demonstrate that intermittent irrigation (WF5C) improved soil water content retention, particularly at 20–40 cm depths, while minimizing excessive percolation below 50 cm. This confirms its superiority over continuous flow in maintaining root-zone water availability.
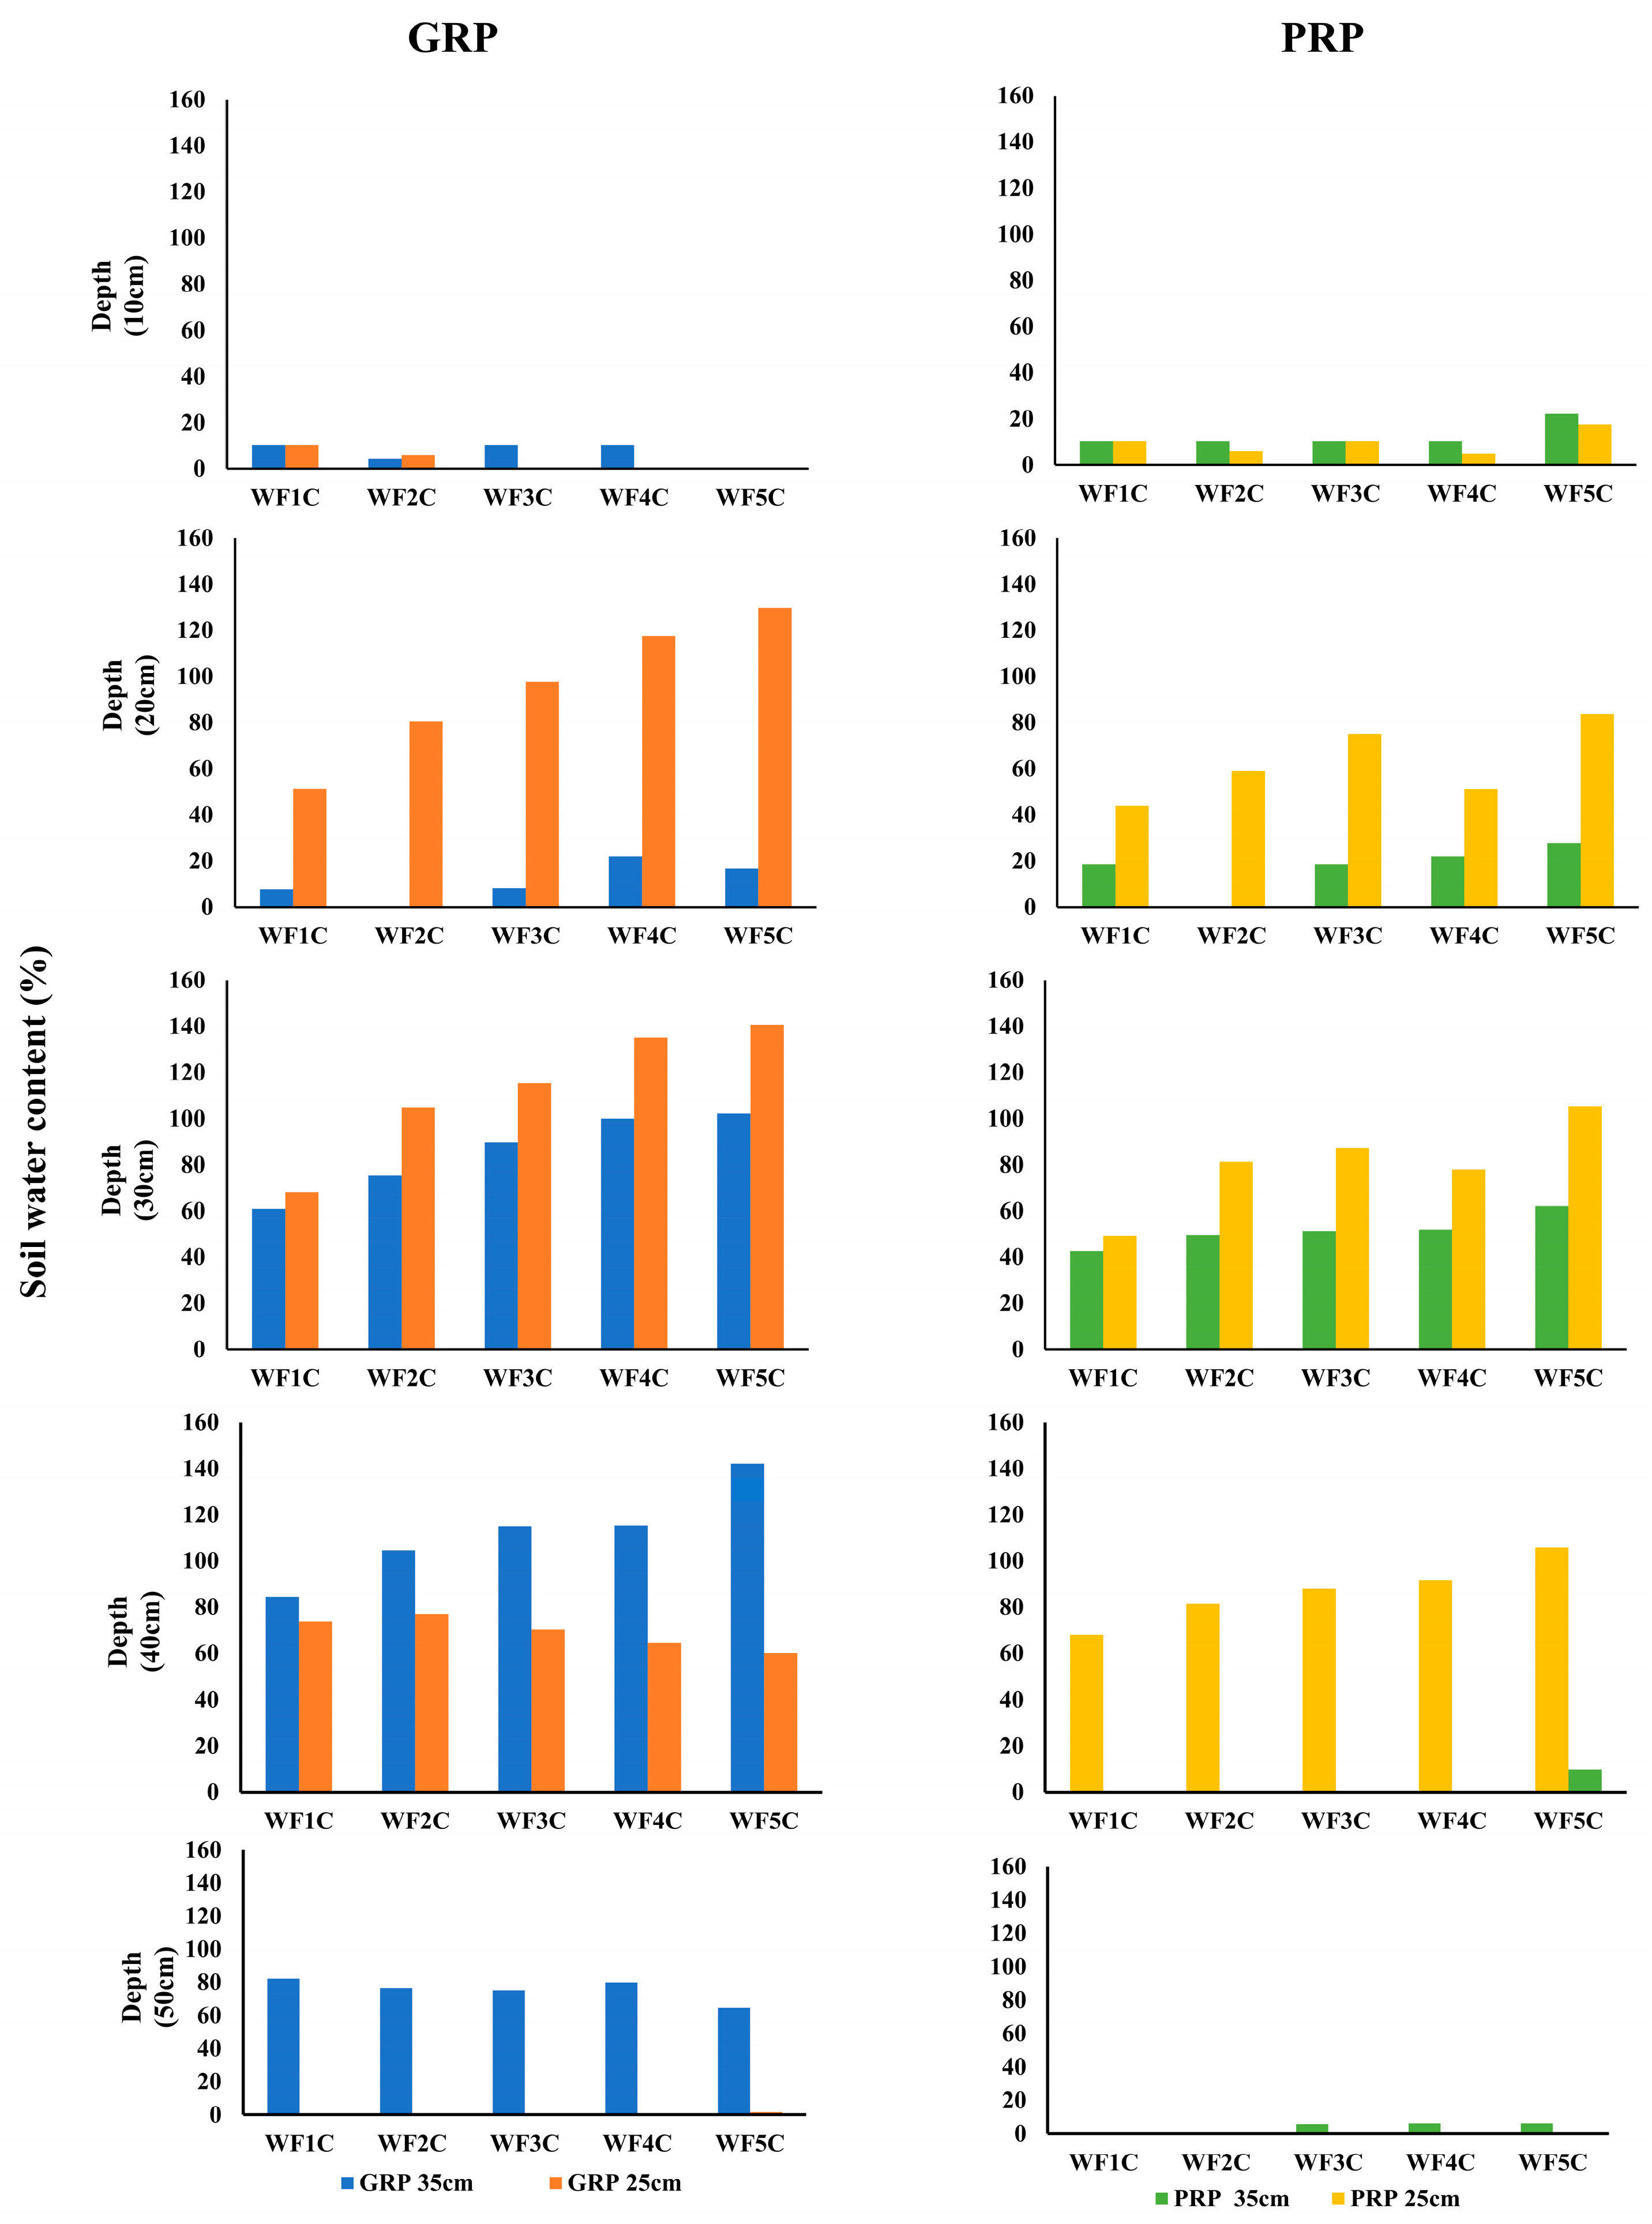
Figure 17 presents the percentage increase in soil water content following irrigation across treatments WF1C–WF5C relative to initial values. At 10 cm depth, changes were negligible across all treatments, regardless of pipe depth. At 20 cm, however, substantial increases were recorded under 25 cm installations: GRP rose from 51.3% (WF1C) to 129.6% (WF5C), while PRP increased from 44% to 83%. At 30 cm, GRP25 treatments achieved the highest gains, rising from 68.1% to 140.7%, compared with PRP25, which ranged from 49% to 105%. Subsurface installations at 35 cm also showed notable increases, with GRP rising from 60.9% to 102% and PRP from 42.5% to 62.3%. At 40 cm, GRP35 recorded the most pronounced increases, from 88.4% (WF1C) to 141.9% (WF5C), whereas PRP25 declined from 73.8% to 59.9% with increasing pulse frequency. At 50 cm, responses were limited; PRP25 showed no significant change, while GRP35 peaked at 84.4% (WF1C) before declining to 64.7% (WF5C), suggesting potential deep drainage losses. Overall, GRP systems demonstrated superior performance, with WF5C achieving increases of up to 260% at 30–40 cm under GRP35 and up to 330% across critical root-zone depths under GRP25, confirming the effectiveness of pulsed subsurface irrigation in enhancing water availability.

3.4. Plant Germination Response

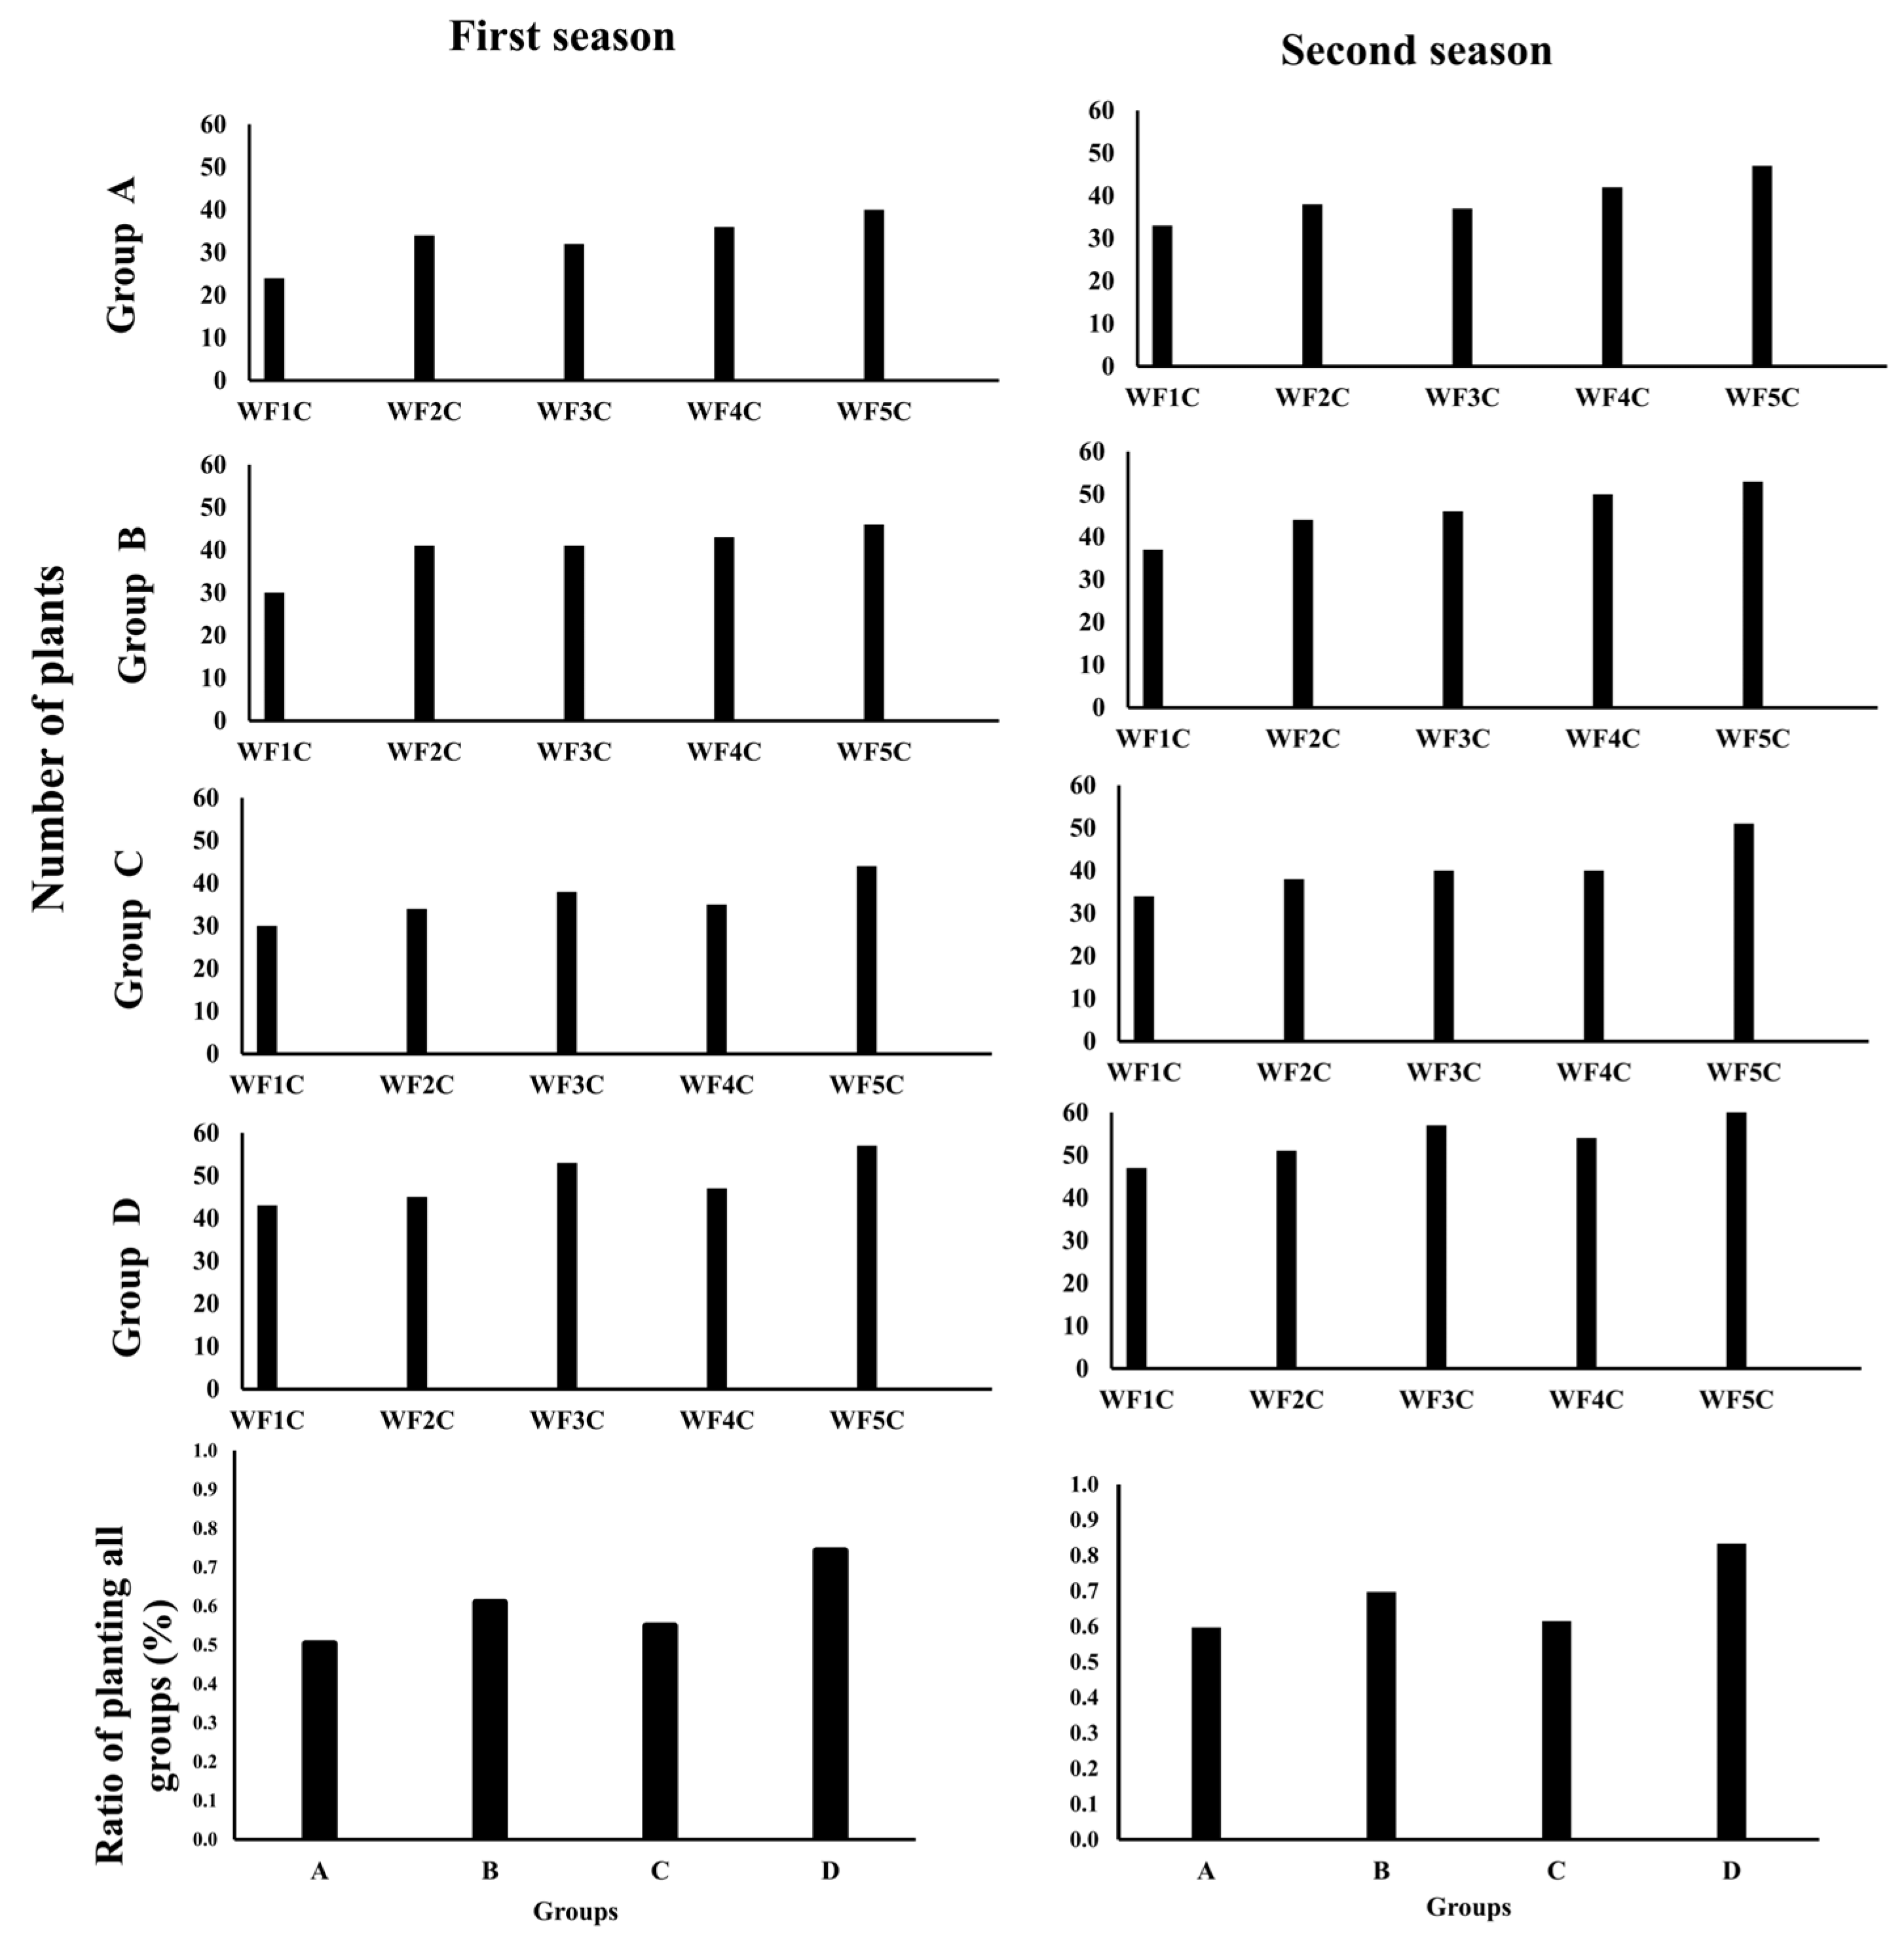
At the end of both growing seasons, plant productivity and germination rates were assessed to evaluate the influence of pipe type, installation depth, and irrigation frequency on plant performance. Data on yield and germination were collected for all experimental groups, allowing identification of treatment-specific trends (Figure 18). Because germination is particularly sensitive to water content in the upper soil layers, treatment effects on emergence were examined across two seasons (Figure 19).
Clear differences were observed among groups, highlighting the role of flow system and pipe type. Groups B (PRP25) and D (GRP25) achieved the highest germination rates, reaching 61% and 74% in the first season and improving to 70% and 83% in the second, respectively. These results underscore the strong performance of shallow installations, particularly with point-source emitters (GRP), which demonstrated a clear advantage in maintaining favorable moisture for seedling emergence. In contrast, deeper installations (Groups A and C) showed lower germination, with first-season rates of 50% and 55%, rising only to 60% and 62% in the second season. Although some improvement occurred, these treatments consistently lagged behind shallower systems. Overall, the findings confirm that emitter type and burial depth strongly affect germination dynamics, with shallow GRP treatments offering the most favorable conditions for plant establishment. This advantage highlights their potential to improve early-stage crop performance and, by extension, overall productivity.

3.5. Yield Performance

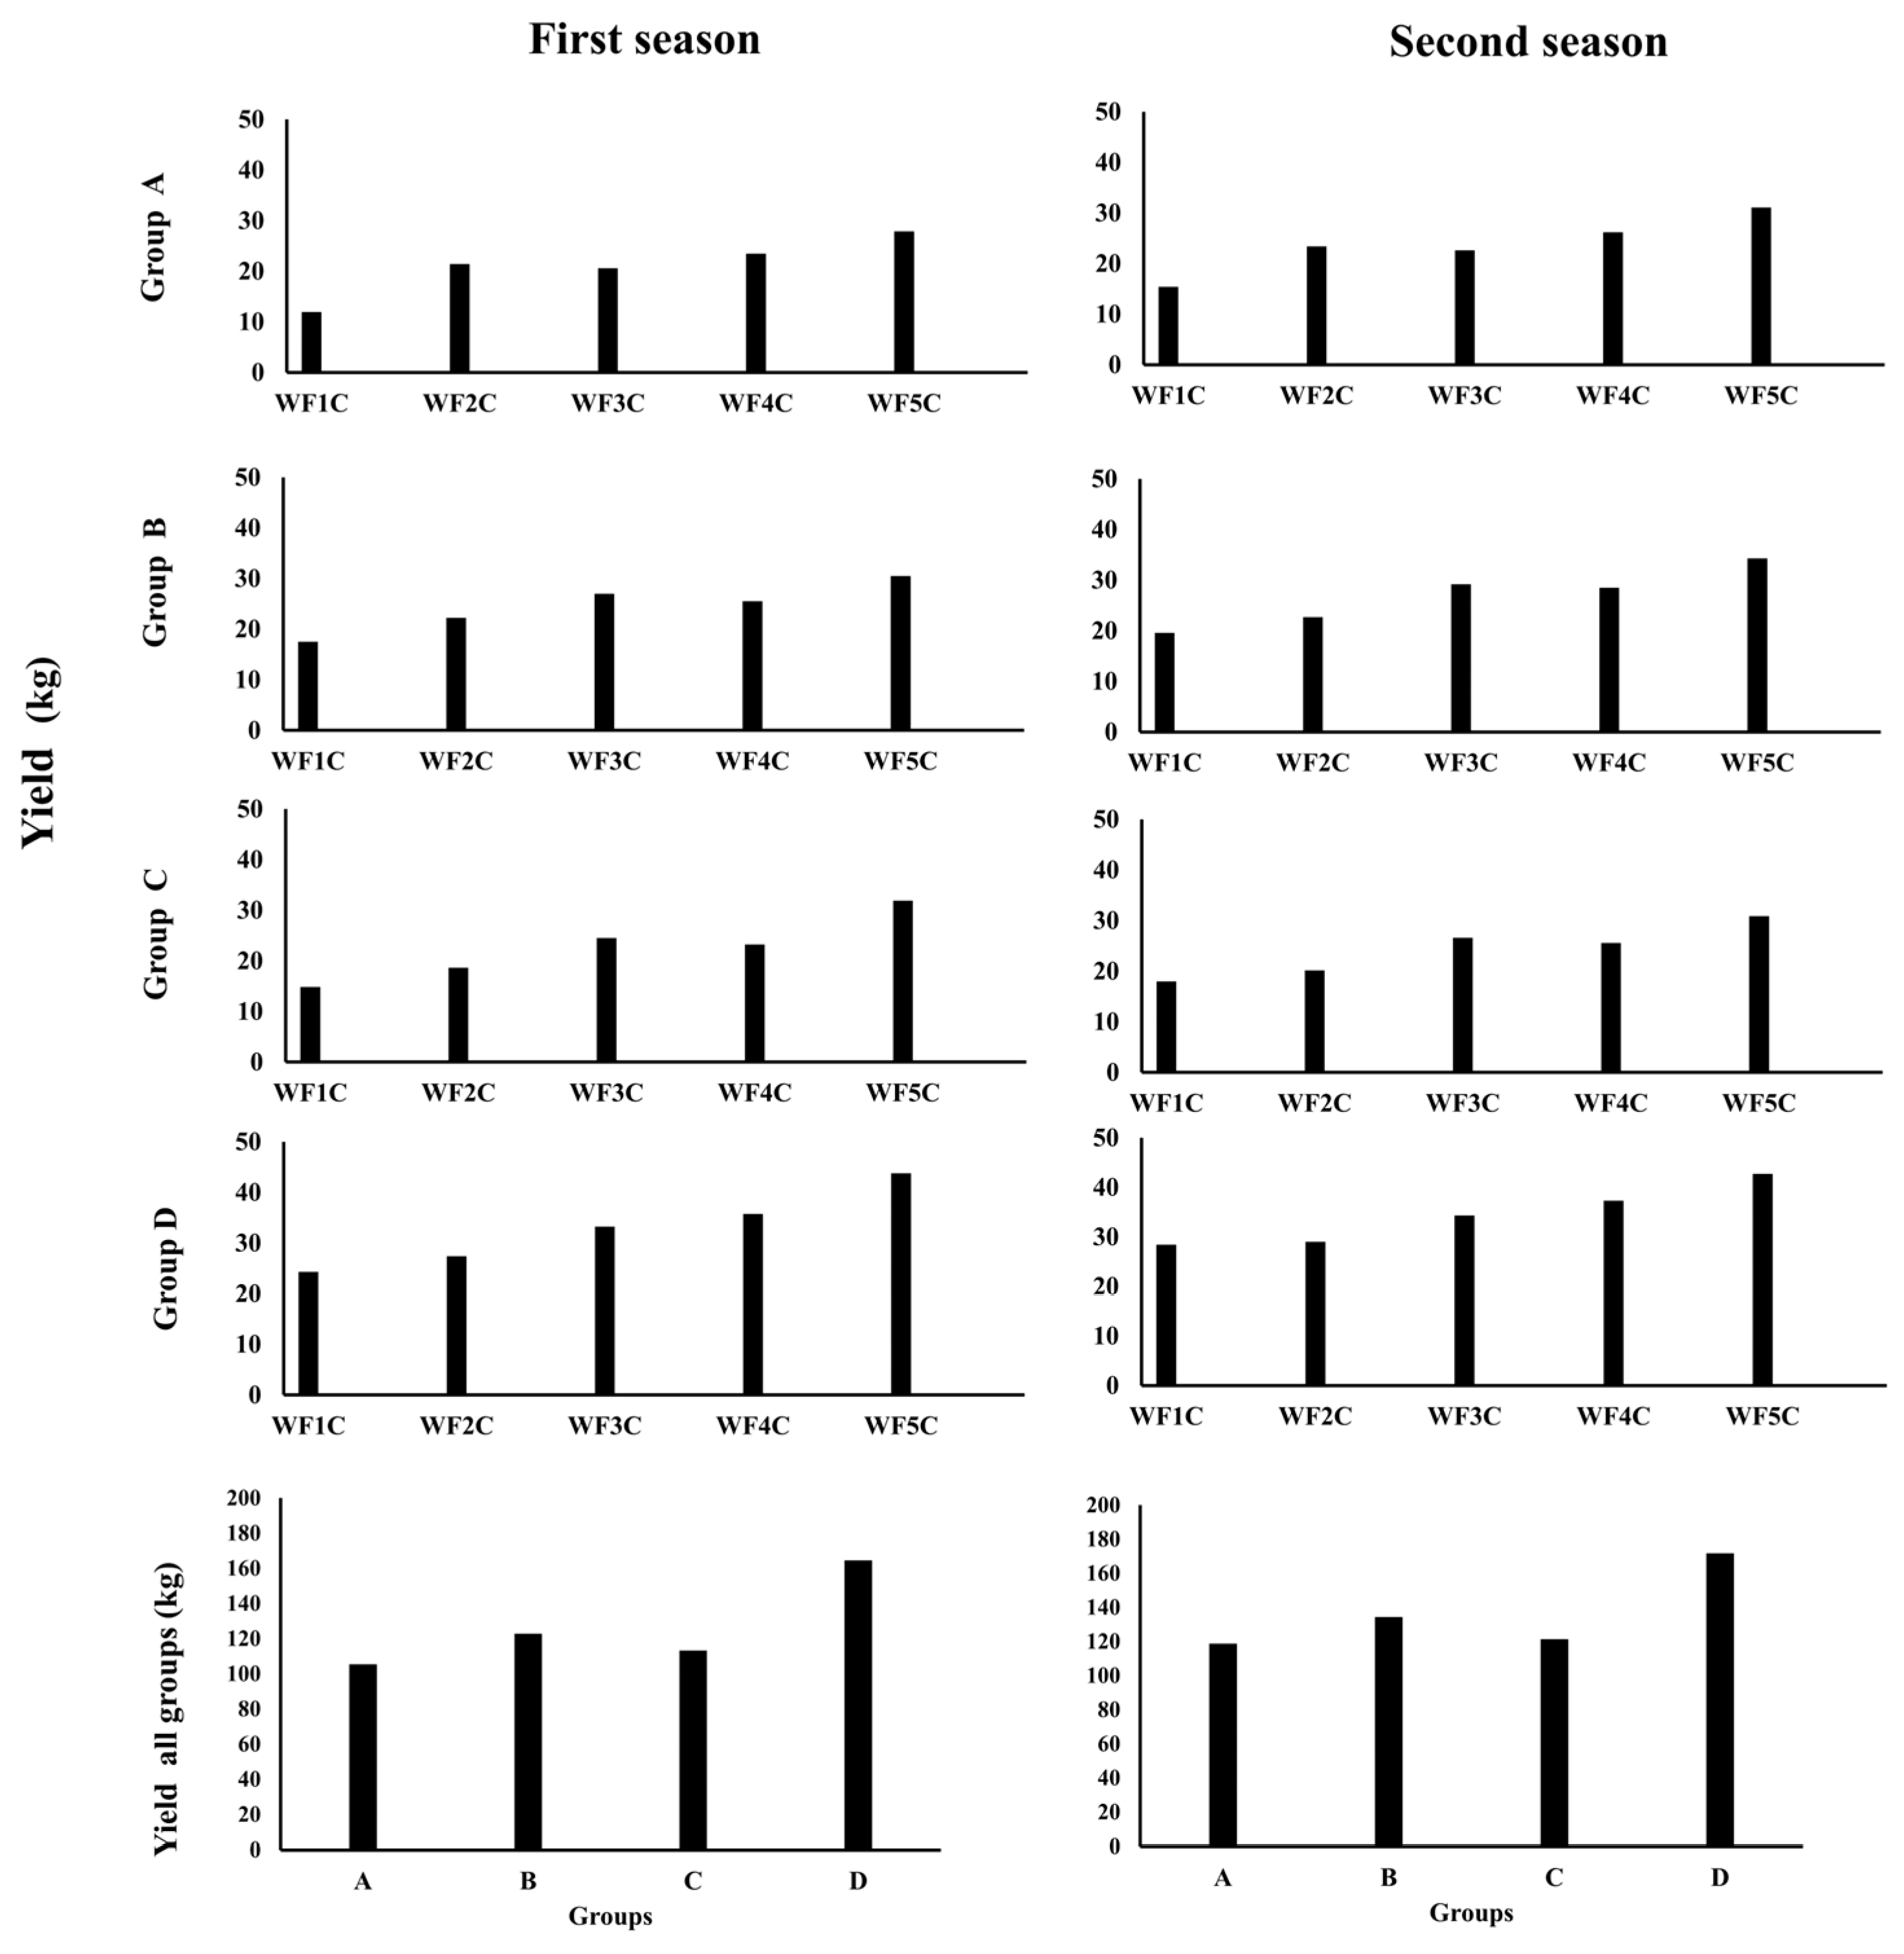
To evaluate the agronomic significance of the irrigation strategies, potato yield was analyzed in relation to emitter type, installation depth, and irrigation frequency (Figure 20). The results revealed clear treatment effects, with Groups B (PRP25) and D (GRP25) consistently outperforming other groups. In the first season, yields reached 122.7 kg and 164.5 kg, respectively, and further increased in the second season to 143.3 kg (Group B) and 171.1 kg (Group D), demonstrating both stability and upward productivity trends. By contrast, Groups A (PRP35) and C (GRP35) produced lower yields in the first season (105.4 and 113.2 kg, respectively) but showed modest improvements in the second (118.7 and 121.3 kg). These findings highlight the advantage of shallower installations (25 cm) and the superior performance of emitting pipes over porous ones in sustaining high plant yields.
Yield responses also reflected the influence of irrigation frequency. Across all groups, productivity increased with the number of irrigation pulses, with WF5C consistently outperforming WF1C. For instance, in Group A, WF5C yields rose from 27.9 kg in the first season to 31.1 kg in the second, compared with only 11.9 and 15.4 kg under WF1C. A similar trend was observed in Group C, where WF5C produced 31.9 and 30.9 kg across the two seasons, more than doubling WF1C yields (14.9 and 18.0 kg). In Group B, WF5C reached 30.5 and 34.3 kg, significantly exceeding WF1C (17.5 and 19.6 kg). The strongest performance was recorded in Group D, where WF5C achieved 43.8 and 42.7 kg across seasons, compared with 24.3 and 28.4 kg under WF1C. Intermediate treatments (WF3C and WF4C) showed some benefits but consistently fell short of WF5C. Overall, the results demonstrate that emitter type, burial depth, and irrigation frequency jointly determine yield outcomes. Emitting pipes installed at 25 cm depth, combined with higher-frequency pulsed irrigation, produced the most favorable results, increasing yields by 40–49% compared with continuous irrigation. These findings confirm the agronomic potential of integrating optimized emitter placement with pulsed scheduling to maximize water-use efficiency and plant productivity in arid regions.
The statistical analysis confirms that both pipe type and installation depth exerted significant effects on potato growth and yield, consistent with the physical principles governing subsurface irrigation efficiency (Table 2). The ANOVA results (p-Value < 0.05 for all tested factors) show that emitter characteristics and burial depth are interdependent in shaping soil moisture dynamics and plant performance. The higher productivity and germination in shallow (25 cm) installations correspond with improved root-zone wetting and reduced percolation losses, in subsurface drip irrigation systems. These findings align with the known benefits of shallower emitters in sandy soils, where rapid drainage and low water-holding capacity require maintaining moisture closer to the surface to support early root development. The superiority of GRP (emitting) pipes over PRP (porous) pipes reflects their greater control over discharge uniformity and localized water delivery, which limits lateral losses and enhances water-use efficiency. In addition, the significant interaction effect between pipe type and depth (p-Value = 0.048) further suggests that hydraulic performance depends not only on emitter design but also on its spatial relation to the crop root zone, reinforcing that optimal design must consider both parameters simultaneously.
In the same context, the productivity gains under intermittent irrigation (WF5C) demonstrate the positive impact of pulsed water application in enhancing water redistribution and reducing deep percolation. This result is attributed to the fact that intermittent supply allows soil macropores to drain between pulses, improving aeration and root metabolic activity. In the present study, yield increased by up to 49% under the WF5C regime, which aligns with these earlier findings and highlights intermittent flow as a viable strategy for arid agriculture. Finally, the model evaluation metrics R2 of (0.94 for productivity, 0.91 for germination rate) and ME of (0.93 for productivity, 0.89 for germination rate) confirm that the developed statistical model accurately captured the main productivity drivers. Low RMSE (4.12 kg for productivity, 3.87 for germination rate) and MAPE (6.3% for productivity, 5.9% for germination rate) values indicate close alignment between predicted and observed data, confirming both the internal consistency of field measurements and the reliability of the regression model for forecasting performance. Across both growing seasons, all treatments showed improvement in productivity and germination, suggesting a degree of soil structural stabilization and enhanced root–soil interaction over time. The sustained advantage of GRP25 treatments emphasizes the stability of the water distribution pattern established during the first season, which likely improved the soil’s hydraulic continuity. Overall, the findings corroborate the hypothesis that integrating optimized emitter design, shallow installation, and pulsed irrigation can substantially improve subsurface water distribution and crop yield in arid regions. The statistical evidence supports the practical potential of intermittent GRP systems as an efficient water management solution under the constraints of Saudi Arabia’s sandy soils and limited freshwater availability.
The results of the present study corroborate findings from previous research employing similar methodologies, highlighting that intermittent (pulsed) water application significantly mitigates deep percolation losses in comparison to continuous flow irrigation. This approach is especially beneficial for loamy sand soils, which exhibit high infiltration rates [58,59,60]. The analyses indicate that increasing the frequency of water addition cycles is associated with a decreased incidence of deep percolation, thereby enhancing water availability within the upper root zone [61]. Furthermore, the study has determined that the optimal depth range for drip emitters lies between 20 and 35 cm. This depth effectively strikes a balance between minimizing evaporation losses and maximizing lateral water distribution [62,63,64]. The findings further indicate that implementing intermittent water addition, combined with extended pauses between applications, results in improved water content retention over longer durations. This observation is supported by other studies, which confirm that intermittent water application markedly enhances soil water distribution, particularly at the 0–15 cm and 15–30 cm depths [65]. In the present investigation, the study also recorded notable water content retention at a depth of 20–40 cm, a zone critical for supporting the active root systems of plants. The application of HYDRUS/2D simulations for loamy sand further substantiates the results, illustrating that intermittent flow irrigation facilitates superior water distribution compared to continuous irrigation methods [58]. Notably, the findings reveal that the application of five cycles of intermittent water significantly improves the soil’s ability to retain higher water content for extended periods when compared to continuous application techniques. In summary, the simulations concerning potato cultivation in loamy sandy soil under subsurface water application suggest that increasing the number of water application cycles to five optimally enhances water content retention at the crucial depth of 20–40 cm within the root zone.

3.6. Practical Implications

The findings of this study provide actionable guidance for farmers, irrigation managers, and policymakers working in arid and hyper-arid regions. Installing emitting pipes at shallow depths (25 cm) and adopting intermittent, pulsed irrigation cycles can significantly improve soil water availability, reduce deep percolation losses, and increase plant yields by up to 49% compared to conventional continuous irrigation. These practices directly contribute to enhancing water-use efficiency and ensuring more sustainable agricultural production under conditions of water scarcity. Extension programs and training workshops should be promoted to increase awareness among farmers about the benefits of pulsed irrigation and to encourage the adoption of soil moisture monitoring tools for informed irrigation scheduling.

3.7. Study Limitations and Future Work

While this study provides robust evidence of the benefits of pulsed subsurface irrigation, certain limitations should be acknowledged. The experiment was restricted to a single soil type (loamy sand) and one plant (potato), which may limit the generalizability of the findings. Additionally, the study was conducted over two growing seasons, leaving seasonal variability and long-term system durability untested. Only two burial depths (25 and 35 cm) and up to five irrigation cycles were examined, whereas broader ranges may reveal additional optimization opportunities. Addressing these limitations presents clear directions for future work. Long-term trials across diverse soil types, plants, and climatic conditions are recommended to validate and extend these findings. Further research should also evaluate system performance under saline or reclaimed water use, test a wider range of pulse frequencies and depths, and integrate automated smart irrigation systems linked to soil moisture sensors. Such efforts will enhance the scalability and sustainability of pulsed subsurface irrigation under real-world agricultural conditions.

4. Conclusions

This study demonstrated that emitter type, burial depth, and irrigation scheduling collectively shape the efficiency of subsurface irrigation systems in arid environments. Shallow installation at 25 cm consistently outperformed deeper placement at 35 cm by retaining more water in the active root zone and supporting better plant performance. Among the tested pipe types, emitting pipes (GRP) showed clear superiority over porous pipes (PRP), providing more uniform soil water distribution and enhancing both germination and yield. The results further confirmed that intermittent, pulsed irrigation regimes (particularly five pulses, WF5C) improved lateral redistribution of water, reduced percolation losses, and created favorable conditions for plant growth compared to continuous application. The combined treatment of GRP at 25 cm depth under pulsed irrigation achieved the highest germination rates (74–83%) and yields (164.5–171.7 kg), representing a 40–49% improvement over continuous flow methods. These findings highlight the importance of optimizing subsurface irrigation design for water-scarce regions, where improving water-use efficiency is crucial for agricultural sustainability. The practical implications extend beyond potato cultivation in Saudi Arabia, offering a framework for managing irrigation in other plants and arid or hyper-arid regions worldwide. Future research should extend these results to diverse soil types and climatic conditions and explore advanced scheduling strategies to maximize the benefits of intermittent subsurface irrigation.

Author Contributions

Conceptualization, A.A.A., M.S., N.A., F.R. and M.E.; Data curation, A.A.A., M.S., N.A., F.R. and M.E.; Formal analysis, A.A.A., M.S., N.A., F.R. and M.E.; Investigation, A.A.A., M.S., N.A., F.R. and M.E.; Methodology, A.A.A., M.S., N.A., F.R. and M.E.; Project administration, A.A.A.; Software, A.A.A., M.S., N.A., F.R. and M.E.; Supervision, A.A.A.; Validation, A.A.A., M.S., N.A., F.R. and M.E.; Visualization, A.A.A., M.S., N.A., F.R. and M.E.; Writing—original draft, A.A.A., M.S., N.A., F.R. and M.E.; Writing—review and editing, A.A.A., M.N.E., M.S., N.A., F.R. and M.E.; All authors have read and agreed to the published version of the manuscript.

Funding

This project was funded by the National Plan for Science, Technology and Innovation (MAARIFAH), King Abdulaziz City for Science and Technology, Kingdom of Saudi Arabia, award number (WAT539) and the APC was funded by (MAARIFAH).

Data Availability Statement

The data presented in this study are available on request from the corresponding author due to privacy restrictions.

Acknowledgments

This project was funded by the National Plan for Science, Technology and Innovation (MAARIFAH), King Abdulaziz City for Science and Technology, Kingdom of Saudi Arabia, Award Number (WAT539).

Conflicts of Interest

No conflicts of interest are declared by the authors in relation to the publication of this research.

References

  1. Mukhopadhyay, R.; Sarkar, B.; Jat, H.S.; Sharma, P.C.; Bolan, N.S. Soil salinity under climate change: Challenges for sustainable agriculture and food security. J. Environ. Manag. 2021, 280, 111736. [Google Scholar] [CrossRef] [PubMed]
  2. Tian, Z.; Wang, J.-W.; Li, J.; Han, B. Designing future crops: Challenges and strategies for sustainable agriculture. Plant J. 2021, 105, 1165–1178. [Google Scholar] [CrossRef] [PubMed]
  3. Jha, S.K.; Ramatshaba, T.S.; Wang, G.; Liang, Y.; Liu, H.; Gao, Y.; Dian, A. Response of growth, yield and water use efficiency of winter wheat to different irrigation methods and scheduling in North China Plain. Agric. Water Manag. 2019, 217, 292–302. [Google Scholar] [CrossRef]
  4. Olgarenko, V.; Olgarenko, G.; Olgarenko, I. A Method of Integral Efficiency Evaluation of Water Use on Irrigation Systems. In Proceedings of the International Multidisciplinary Scientific GeoConference SGEM 2018, Albena, Bulgaria, 2–8 July 2018; Volume 18, pp. 3–9. [Google Scholar]
  5. Najafi, P.; Tabatabaei, S. Effect of using subsurface drip irrigation and ET-HS model to increase WUE in irrigation of some crops. Irrig. Drain. 2007, 56, 477–486. [Google Scholar] [CrossRef]
  6. Subbaiah, R. A review of models for predicting soil water dynamics during trickle irrigation. Irrig. Sci. 2013, 31, 225–258. [Google Scholar] [CrossRef]
  7. Martínez, J.; Reca, J. Water use efficiency of surface drip irrigation versus an alternative subsurface drip irrigation method. J. Irrig. Drain. Eng. 2014, 140, 04014030. [Google Scholar] [CrossRef]
  8. Alazba, A.A.; Mattar, M.A.; El-Shafei, A.; Radwan, F.; Ezzeldin, M.; Alrdyan, N. Comparative Analysis of ANN, GEP, and Water Advance Power Function for Predicting Infiltrated Water Volume in Furrow of Permeable Surface. Water 2025, 17, 1304. [Google Scholar] [CrossRef]
  9. Gültekin, R.; Ertek, A. The Effect of Intermittent Subsurface Drip Irrigation on Soil Water Distribution. Water Conserv. Sci. Eng. 2024, 9, 21. [Google Scholar] [CrossRef]
  10. Jin, Y.; Gao, X.; Zhang, R.; Wu, X.; Long, H.; Sun, Z.; Zhang, S. Comprehensive assessment of plant and water productivity responses in negative pressure irrigation technology: A meta-analysis. Agronomy 2022, 12, 1925. [Google Scholar] [CrossRef]
  11. Ayars, J.; Bucks, D.A.; Lamm, F.R.; Nakayama, F.S. Introduction, Micro irrigation for crop production design, operation and management. In Developments in Agricultural Engineering; Lamm, F.R., Ayars, J.E., Nakayama, F.S., Eds.; Elsevier: Amsterdam, The Netherlands, 2007; pp. 473–551. [Google Scholar]
  12. Singh, K.; Mishra, S.K.; Brar, A.S. Optimizing Sugarcane and Water Productivity Through Surface and Subsurface Drip Fertigation in Subtropical India. Sugar Tech 2023, 26, 63–76. [Google Scholar] [CrossRef]
  13. Vadar, H.; Pandya, P.; Patel, R. Effect of subsurface drip irrigation depth scheduling in summer Okra. Emergent Life Sci. Res. 2019, 5, 52–61. [Google Scholar] [CrossRef]
  14. Salisu, A.; Abdallah, A.F.; Wayayok, A.; Kamal, R.M. Discharge characterization and variability determination along shorter sections of soaker hose pipe for soil column experiment. Basrah J. Agric. Sci. 2021, 34, 92–99. [Google Scholar] [CrossRef]
  15. Rasheed, Z. Modeling of subsurface horizontal porous pipe irrigation under different conditions. Iraqi J. Agric. Sci. 2021, 52, 949–959. [Google Scholar] [CrossRef]
  16. Junpunya, M.; Ou-udomying, B.; Amornsakchai, T.; Jangchud, I. Study of porous rubber pipes reinforced with waste tire fiber and pineapple leaf fiber for smart irrigation system. In IOP Conference Series: Materials Science and Engineering; IOP Publishing: Bristol, UK, 2022. [Google Scholar]
  17. Rasheed, Z. Investigating the Effect of Saturated Hydraulic Conductivity in Porous Pipe Irrigation System and Comparing to Other Parameters. In IOP Conference Series: Earth and Environmental Science; IOP Publishing: Bristol, UK, 2023. [Google Scholar]
  18. Appels, W.M.; Karimi, R. Analysis of soil wetting patterns in subsurface drip irrigation systems–indoor alfalfa experiments. Agric. Water Manag. 2021, 250, 106832. [Google Scholar] [CrossRef]
  19. Elmaloglou, S.; Diamantopoulos, E.; Dercas, N. Comparing soil moisture under trickle irrigation modeled as a point and line source. Agric. Water Manag. 2010, 97, 426–432. [Google Scholar] [CrossRef]
  20. Patel, N.; Rajput, T. Effect of drip tape placement depth and irrigation level on yield of potato. Agric. Water Manag. 2007, 88, 209–223. [Google Scholar] [CrossRef]
  21. Lozano, D.; Ruiz, N.; Baeza, R.; Contreras, J.I.; Gavilán, P. Effect of pulse drip irrigation duration on water distribution uniformity. Water 2020, 12, 2276. [Google Scholar] [CrossRef]
  22. Mohammed, A.K.; Abed, B.S. Water distribution and interference of wetting front in stratified soil under a continues and an intermittent subsurface drip irrigation. J. Green Eng. 2020, 10, 268–286. [Google Scholar]
  23. Zamora, V.R.O.; da Silva, M.M.; da Silva, G.F.; Santos Junior, J.A.; Menezes, D.; de Menezes, S.M. Pulse drip irrigation and fertigation water depths in the water relations of coriander. Hortic. Bras. 2019, 37, 22–28. [Google Scholar] [CrossRef]
  24. Kilic, M. A new analytical method for estimating the 3D volumetric wetting pattern under drip irrigation system. Agric. Water Manag. 2020, 228, 105898. [Google Scholar] [CrossRef]
  25. Gültekin, R.; Ertek, A. Effect of Pulse Subsurface Drip Irrigation on Yield and Quality Parameters of Sillage Maize (Zea Mays L.). Anadolu Tarım Bilim. Derg. 2022, 37, 459–478. [Google Scholar]
  26. Yuan, B.-Z.; Nishiyama, S.; Kang, Y. Effects of different irrigation regimes on the growth and yield of drip-irrigated potato. Agric. Water Manag. 2003, 63, 153–167. [Google Scholar] [CrossRef]
  27. Ruskin, R. Subsurface Drip Irrigation and Yields; Geoflow Inc.: Corte Madera, CA, USA, 2000. [Google Scholar]
  28. Lal Mehriya, M.; Geat, N.; Sarita; Singh, H.; Mattar, M.A.; Elansary, H.O. Response of drip irrigation and fertigation on cumin yield, quality, and water-use efficiency grown under arid climatic conditions. Agronomy 2020, 10, 1711. [Google Scholar] [CrossRef]
  29. De Almeida, W.F.; Lima, L.A.; Pereira, G.M. Drip pulses and soil mulching effect on American crisphead lettuce yield. Eng. Agric. 2015, 35, 1009–1018. [Google Scholar] [CrossRef]
  30. Madane, D.A. Advancement of pulse irrigation (drip) in sandy soil. Think India J. 2019, 22, 692–698. [Google Scholar]
  31. Thompson, C. Irrigation and Intensive Large-Scale Crop Management. In Proceedings of the 10th Australian Agronomy Conference, Hobart, Australia, 29 January–1 February 2001. [Google Scholar]
  32. Oron, G. Simulation of water flow in the soil under sub-surface trickle irrigation with water uptake by roots. Agric. Water Manag. 1981, 3, 179–193. [Google Scholar] [CrossRef]
  33. Bakeer, G.; El-Ebabi, F.G.; El-Saidi, M.T.; Abdelghany, A.R.E. Effect of pulse drip irrigation on yield and water use efficiency of potato crop under organic agriculture in sandy soils. Misr J. Agric. Eng. 2009, 26, 736–765. [Google Scholar] [CrossRef]
  34. Li, Y.; Niu, W.; Wang, J.; Xu, J.; Zhang, M.; Li, K. Review on advances of airjection irrigation. Int. J. Agric. Biol. Eng. 2016, 9, 1–10. [Google Scholar]
  35. Rank, P.; Unjia, Y.; Kunapara, A. Soil wetting pattern under point and line source of trickle irrigation. Int. J. Curr. Microbiol. App. Sci. 2019, 8, 785–792. [Google Scholar] [CrossRef]
  36. Mmolawa, K.; Or, D. Root zone solute dynamics under drip irrigation: A review. Plant Soil 2000, 222, 163–190. [Google Scholar] [CrossRef]
  37. Khurmatullina, R.; Salpykova, I. Tatar folklore in the creative work of composer Rafael Belyalov. Middle-East J. Sci. Res. 2014, 19, 29–41. [Google Scholar]
  38. Al-Naeem, M.A. Use of pulse trickles to reduce clogging problems in trickle irrigation system in Saudi Arabia. Pak. J. Biol. Sci. PJBS 2008, 11, 68–73. [Google Scholar] [CrossRef] [PubMed]
  39. New, L.; Roberts, R.E. Drip Irrigation for Greenhouse Vegetable Production; Texas A&M AgriLife Extension: Vernon, TX, USA, 2012. [Google Scholar]
  40. Phene, C.; Davis, K.R.; Hutmacher, R.B.; McCormick, R.L. Advantages of subsurface irrigation for processing tomatoes. In Proceedings of the II International Symposium on Processing Tomatoes, XXII IHC 200, Davis, CA, USA, 11 August 1986. [Google Scholar]
  41. Madane, D.; Mane, M.; Kadam, U. Study on White Onion (Alium cepa L.) Growth, Yield and Economics under Pulse (Drip) Irrigation. J. Allium Res. 2018, 1, 44–50. [Google Scholar]
  42. El-Mogy, M.M.; Abuarab, M.E.; Abdullatif, A.L. Response of green bean to pulse surface drip irrigation. J. Hortic. Sci. Ornam. Plants 2012, 4, 329–334. [Google Scholar]
  43. Alazba, A.A.; Mosad, A.; Geli, H.M.E.; El-Shafei, A.; Ezzeldin, M.; Alrdyan, N.; Radwan, F. Transboundary Urban Basin Analysis Using GIS and RST for Water Sustainability in Arid Regions. Water 2025, 17, 1463. [Google Scholar] [CrossRef]
  44. Radwan, F.; Alazba, A.A.; Mossad, A. Flood risk assessment and mapping using AHP in arid and semiarid regions. Acta Geophys. 2019, 67, 215–229. [Google Scholar] [CrossRef]
  45. Alazba, A. Estimating palm water requirements using Penman-Monteith mathematical model. J. King Saud Univ. 2004, 16, 137–152. [Google Scholar]
  46. Ayers, R.S.; Westcot, D.W. Water Quality for Agriculture; Food and Agriculture Organization of the United Nations: Rome, Italy, 1985; Volume 29. [Google Scholar]
  47. Al-Ghobari, H.M.; El Marazky, M.S.A. Field evaluation of EnviroSCAN performance for monitoring soil water content compared with other soil moisture sensors under arid conditions. Wulfenia J. Klagenf. Austria 2013, 20, 54–70. [Google Scholar]
  48. Siphiwe, N.G.; Magyar, T.; Tamás, J.; Nagy, A. Modelling Soil Moisture Content with Hydrus 2D in a Continental Climate for Effective Maize Irrigation Planning. Agriculture 2024, 14, 1340. [Google Scholar] [CrossRef]
  49. Wright, C.H. Soil Analysis: A Handbook of Physical and Chemical Methods; Soil Science; Thomas Murby & Company: London, UK, 1934; p. 38. [Google Scholar]
  50. Alazba, A.A.; Mattar, M.A.; El-Shafei, A.; Radwan, F.; Ezzeldin, M.; Alrdyan, N. Daily Reference Evapotranspiration Derived from Hourly Timestep Using Different Forms of Penman–Monteith Model in Arid Climates. Water 2025, 17, 2272. [Google Scholar] [CrossRef]
  51. Ezzeldin, M.; Alazba, A.A.; Alrdyan, N.; Radwan, F. Rationalizing Irrigation Water Consumption in Arid Climates Based on Multicomponent Landscape Coefficient Approach. Earth Syst. Environ. 2025, 9, 277–298. [Google Scholar] [CrossRef]
  52. Alazba, A.A.; Mattar, M.A.; El-Shafei, A.; Ezzeldin, M.; Radwan, F.; Alrdyan, N. Water Demand Determination for Landscape Using WUCOLS and LIMP Mathematical Models. Water 2025, 17, 1429. [Google Scholar] [CrossRef]
  53. Gardner, C.M.; Robinson, D.A.; Blyth, K.; Cooper, J.D. Soil water content. In Soil and Environmental Analysis; CRC Press: Boca Raton, FL, USA, 2000; pp. 13–76. [Google Scholar]
  54. Jabro, J.; Leib, B.; Jabro, A. Estimating soil water content using site-specific calibration of capacitance measurements from Sentek EnviroSCAN systems. Appl. Eng. Agric. 2005, 21, 393–399. [Google Scholar] [CrossRef]
  55. Bedaiwy, M.N.A. A simplified approach for determining the hydrometer’s dynamic settling depth in particle-size analysis. CATENA 2012, 97, 95–103. [Google Scholar] [CrossRef]
  56. Romero-Ruiz, A.; Linde, N.; Keller, T.; Or, D. A review of geophysical methods for soil structure characterization. Rev. Geophys. 2018, 56, 672–697. [Google Scholar] [CrossRef]
  57. Evett, S. Chapter 2. Gravimetric and volumetric direct measurements of soil water content. In Field Estimation of Soil Water Content: A Practical Guide to Methods, Instrumentation and Sensor Technology; IAEA International Atomic Energy Agency, Soil and Water Management and Crop Nutrition Section: Vienna, Austria, 2008; pp. 23–37. [Google Scholar]
  58. Rasheed, Z. Analysis the wetted area for subsurface drip irrigation in different soils texture. Iraqi J. Agric. Sci. 2020, 51, 712–722. [Google Scholar] [CrossRef]
  59. Vyrlas, P.; Sakellariou-Makrantonaki, M. Intermittent water application through surface and subsurface drip irrigation. In Proceedings of the 2005 ASAE Annual Meeting, Tampa, FL, USA, 17–20 July 2005; American Society of Agricultural and Biological Engineers: St Jospeh, MI, USA. [Google Scholar]
  60. Zhu, Z.; Rasheed, M.W.; Safdar, M.; Yao, B.; Tumaerbai, H.; Sarwar, A.; Zhu, L. Intermittent Drip Irrigation Soil Wet Front Prediction Model and Effective Water Storage Analysis. Sustainability 2024, 16, 9553. [Google Scholar] [CrossRef]
  61. Shen, Z.; Ren, J.; Wang, Z.; Cui, W. Effects of initial water content and irrigation frequency on soil-water dynamics under subsurface drip irrigation. J. Food Agric. Environ. 2011, 9, 666–671. [Google Scholar]
  62. Douh, B.; Boujelben, A. Improving water use efficiency for a sustainable productivity of agricultural systems with using subsurface drip irrigation for maize (Zea mays L.). J. Agric. Sci. Technol. B 2011, 1, 881–888. [Google Scholar]
  63. Douh, B.; Boujelben, A.; Khila, S.; Bel Haj Mguidiche, A. Effect of subsurface drip irrigation system depth on soil water content distribution at different depths and different times after irrigation. LARHYSS J. 2013, 13, 7–16. [Google Scholar]
  64. Mei, X.N.; Shen, Z.-Z.; Ren, J.; Wang, Z.H. Effects of dripper discharge and irrigation amount on soil-water dynamics under subsurface drip irrigation. Adv. Mater. Res. 2012, 347, 2400–2403. [Google Scholar] [CrossRef]
  65. El-Abedin, T.Z. Effect of pulse drip irrigation on soil moisture distribution and maize production in clay soil. Misr J. Agric. Eng. 2006, 23, 1032–1050. [Google Scholar]
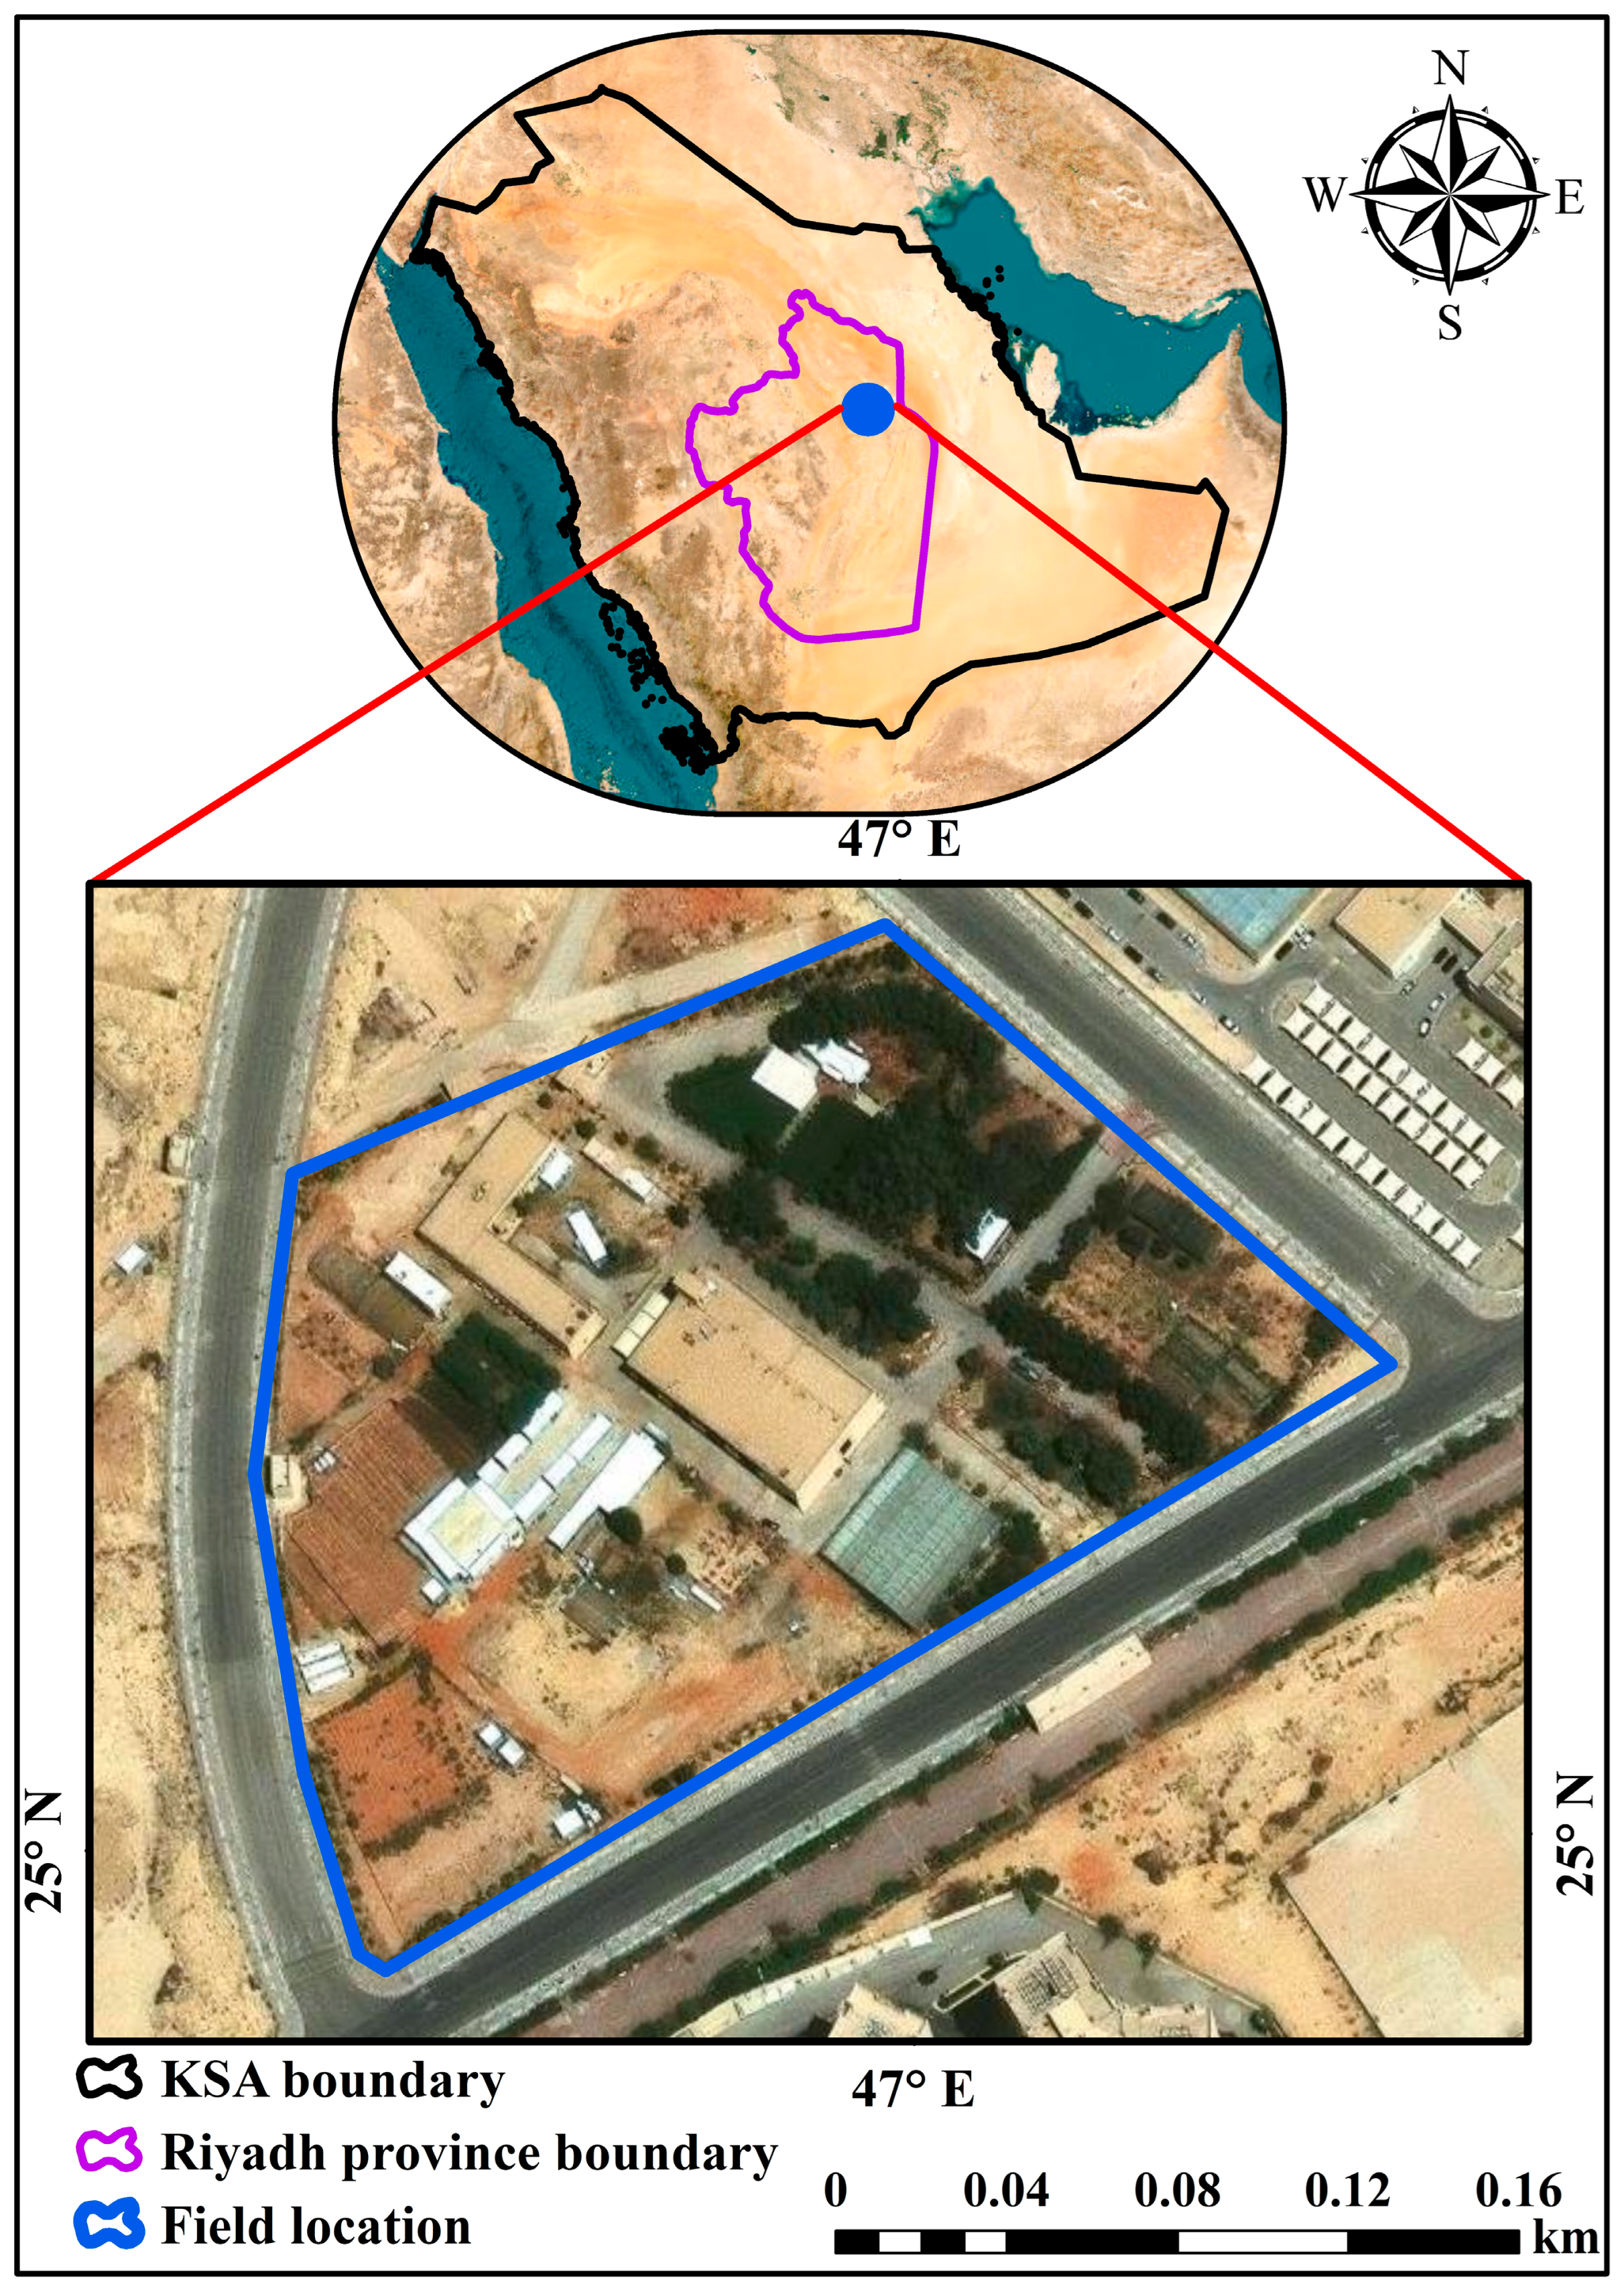
Figure 1. Location of the field site.
Water 17 03143 g001
Figure 2. Water discharging sources: (A) porous rubber pipe (PRP), (B) emitting pipe (GRP).
Water 17 03143 g002
Figure 3. Spatial arrangement of pipes, tubers, and measurement points. Where sampling soil water content (red colors), (A) pipeline depth is 35 cm, (B) pipeline depth is 25 cm.
Water 17 03143 g003
Figure 4. Field layout diagram.
Water 17 03143 g004
Figure 5. Key procedures involved in the chemical analysis and irrigation system setup. (a): soil excavation to the designated depth, and (b): assembling the network components.
Water 17 03143 g005
Figure 6. Procedures for measuring volumetric soil water content: (a) three sampling points around each sensor of the EnviroSCAN, and (b) oven-drying soil samples at 105 °C to determine water content.
Water 17 03143 g006
Figure 7. The values of, (A) plant factor (Kplt), (B) reference evapotranspiration (ETref), (C) plant evapotranspiration (ETplt), and (D) net water irrigation requirements (NWIR).
Water 17 03143 g007
Figure 8. The relationship between EnviroSCAN and HYDRUS software values; (A) PRP35, (B) PRP25, (C) GRP35, and (D) GRP25. Where the HYDRUS v. 2.05.
Water 17 03143 g008
Figure 9. Linear relation and determination coefficient between EnviroSCAN and HYDRUS software values for every group; (A) PRP35, (B) PRP25, (C) GRP35, and (D) GRP25. Where the dashed line is the linear regression fit.
Water 17 03143 g009
Figure 10. The relation between EnviroSCAN and HYDRUS software values for all groups. Where the dashed line is the linear regression fit.
Water 17 03143 g010
Figure 11. Relationship between the volumetric water content and the EnviroSCAN readings; (A) PRP35, (B) PRP25, (C) GRP35, and (D) GRP25. Where the dashed line is the linear regression fit.
Water 17 03143 g011
Figure 12. Relationship between the volumetric water content and HYDRUS readings; (A) PRP35, (B) PRP25, (C) GRP35, and (D) GRP25. Where the dashed line is the linear regression fit.
Water 17 03143 g012
Figure 13. Soil water content for Group (A): PRP35 and Group (B): PRP25, at ((a,f): WF1C), ((b,g): WF2C), ((c,h): WF3C), ((d,i): WF4C), and ((e,j): WF5C).
Water 17 03143 g013
Figure 14. Soil water content for Group (C): GRP35 and Group (D): GRP25, at ((a,f): WF1C), ((b,g): WF2C), ((c,h): WF3C), ((d,i): WF4C), and ((e,j): WF5C).
Water 17 03143 g014
Figure 15. Holding soil water content PRP as a percentage is based on the initial soil water content, at (GROUP (A): PRP35), and (GROUP (B): PRP25) for (WF1C: WF5C). Where the dashed lines refer to the pipe burial depth, Group A is at 35 cm, and Group B is at 25 cm.
Water 17 03143 g015
Figure 16. Holding soil water content GRP as a percentage is based on the initial soil water content, at (GROUP (C): GRP35), and (GROUP (D): GRP25) for (WF1C: WF5C). Where the dashed lines refer to the pipe burial depth, Group C is at 35 cm, and Group D is at 25 cm.
Water 17 03143 g016
Figure 17. The total holding water content as a percentage of the initial water content at depths of 10 to 50 cm underneath the four groups.
Water 17 03143 g017
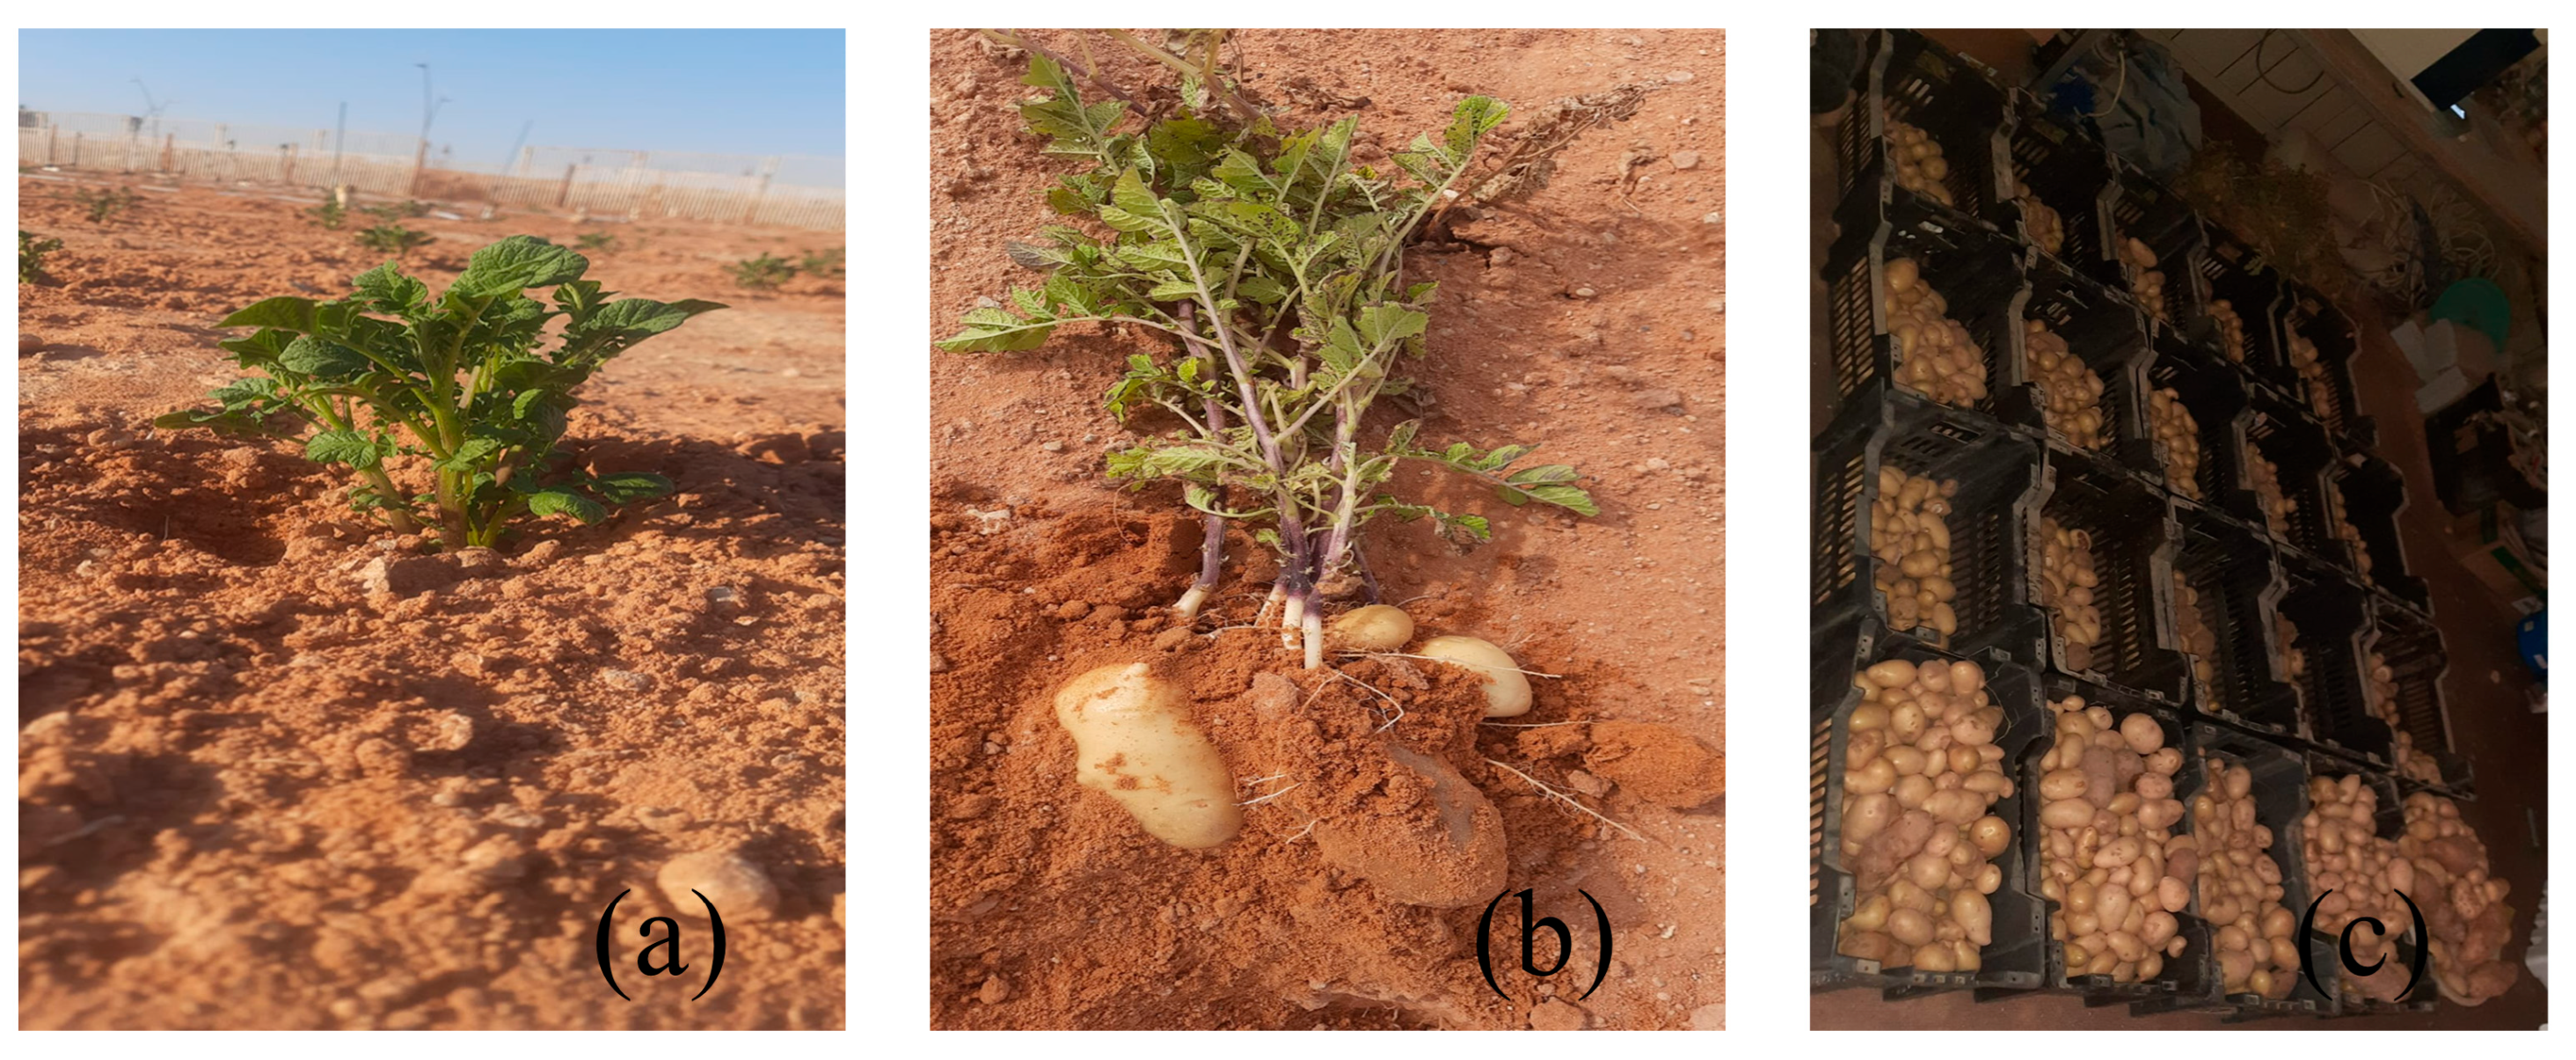
Figure 18. The potato harvesting process, (a): germination, (b): before harvest, and (c): after harvest.
Water 17 03143 g018
Figure 19. The germination rate for the four groups in the first and second seasons.
Water 17 03143 g019
Figure 20. Yield products through the first and second season.
Water 17 03143 g020
Table 1. ON: OFF time for 30 min of water application.
WFCTime (min)12345ON
(min)
OFF
(min)
Total Time (min)
ONOFFONOFFONOFFONOFFON
WF1C25,353030 30030
WF2C25,35151515 301545
WF3C25,351010101010 302050
WF4C25,357.57.57.57.57.57.57.5 3022.552.5
WF5C25,35666666666302454
Where, in the one-cycle water flow (WF1C), water flows continuously for 30 min without any OFF time. The two-cycle water flow (WF2C) involved 15 min of water application followed by a 15 min OFF cycle, totaling 45 min. In the three-cycle water flow (WF3C), water was applied for 10 min, with two 10 min OFF cycles, leading to 50 min total. The four-cycle water flow (WF4C) had four 7.5 min of application and three 7.5 min OFF cycles, resulting in 52.5 min. Lastly, in the five-cycle water flow (WF5C), the application lasted 6 min with four 6 min OFF cycles, totaling 54 min.
Table 2. Descriptive statistics for the two seasons.
SeasonGroupPlant Count (Mean ± SD)Weight (kg) (Mean ± SD)Productivity (kg)Germination Rate
FirstA33.2 ± 5.021.9 ± 6.3105.450.3%
B40.2 ± 6.724.8 ± 4.9122.760.9%
C36.2 ± 5.022.9 ± 6.4113.254.8%
D49.0 ± 5.532.9 ± 7.6164.574.2%
SecondA39.4 ± 5.023.7 ± 5.9118.759.7%
B46.0 ± 6.526.9 ± 5.9134.369.7%
C40.6 ± 6.124.9 ± 5.4121.361.5%
D55.0 ± 6.534.7 ± 6.3171.783.3%
Disclaimer/Publisher’s Note: The statements, opinions and data contained in all publications are solely those of the individual author(s) and contributor(s) and not of MDPI and/or the editor(s). MDPI and/or the editor(s) disclaim responsibility for any injury to people or property resulting from any ideas, methods, instructions or products referred to in the content.