Article

Groundwater Storage Assessment in Abu Dhabi Emirate: Comparing Spatial Interpolation Models

by
Tala Maksoud
1,2 and
Mohamed M. Mohamed
1,2,*
1
Civil and Environmental Engineering Department, College of Engineering, United Arab Emirates University, Al Ain 15551, United Arab Emirates
2
National Water and Energy Center, United Arab Emirates University, Al Ain 15551, United Arab Emirates
*
Author to whom correspondence should be addressed.
Water 2025, 17(21), 3078; https://doi.org/10.3390/w17213078
Submission received: 9 July 2025 / Revised: 13 October 2025 / Accepted: 23 October 2025 / Published: 28 October 2025
(This article belongs to the Special Issue Advance in Groundwater in Arid Areas)

Abstract

This study aims to extend the understanding of groundwater level dynamics in the Abu Dhabi Emirate by evaluating the performance of two interpolation models, local polynomial interpolation (LPI) and exponential ordinary kriging (EXP-OK), over a 20-year period. These models were selected for their demonstrated effectiveness in groundwater studies, with LPI offering strong local adaptability to spatial variability and EXP-OK providing robust geostatistical modeling for regional patterns. This study also aims to assess the performance of the two interpolation models in identifying missing groundwater level measurements to accurately estimate groundwater storage. The evaluation of the two models is conducted using ArcGIS and IBM-SPSS statistics, including cross-validation, descriptive statistics and exploratory spatial data analysis (ESDA). The findings revealed that both LPI and EXP-OK are effective in analyzing groundwater fluctuations in the study area, with LPI demonstrating a slight edge in predictive accuracy. The ability of the LPI to capture local data variations resulted in a smoother representation of groundwater level data. Owing to its superior performance, the LPI was selected for the estimation of groundwater storage. The study reports that the average change in groundwater storage over the study period could range from −0.066 to −2.112 cubic meters per square meter of aquifer area. These findings emphasize the importance of continuous monitoring and analysis for sustainable water resource management in the study area.

1. Introduction

Groundwater is recognized as an essential element for the advancement of any nation [1]. The United Arab Emirates is a dry and arid area that experiences low levels of precipitation and high levels of evaporation. Groundwater supplies are present in all parts of the country; however, their availability and quality vary depending on the underlying geological formations in the area [2,3,4]. Groundwater in arid and semi-arid regions is a precious, nonrenewable, and limited resource; however, it remains indispensable for a variety of purposes. Globally, with an expanding population and the intensification of agricultural and domestic activities, surface water yields are declining, leading to an increased dependence on groundwater. Excessive extraction, either due to rising demand or climate-induced shifts in the geographic distribution of precipitation, may reduce the quantity and quality of groundwater [5]. In Abu Dhabi, part of the United Arab Emirates, groundwater is the primary source of natural freshwater and provides the majority of the water used for agricultural irrigation, accounting for approximately 70% of total water extraction [6]. Tracking changes in groundwater reserves is especially important in arid and semi-arid regions, where water scarcity is a major concern. Estimating stored groundwater is crucial for assessing the availability of this vital resource [7,8]. The amount of groundwater stored in an aquifer determines its ability to withstand large fluctuations caused by pumping, recharge, and transpiration—including those driven by climate change and human activities. The greater the amount of stored groundwater, the better the aquifer is able to maintain stability [9]. To estimate changes in groundwater storage, detailed and reliable groundwater level measurements must be collected over a wide range of locations and times [10]. To understand the spatiotemporal variability of groundwater in the selected study area, a suitable interpolation method should be selected to accurately monitor the fluctuations in groundwater levels. By choosing a suitable interpolation method and analyzing the data using appropriate software, it is possible to observe changes over time and across various locations. Several geostatistical and deterministic interpolation methods have been applied in various water studies. Table 1 summarizes the best-fit models identified in twenty-four different studies evaluating various variables. According to the summary table, Global Polynomial Interpolation (GPI) had the best performance in two studies, offering smooth global interpolation effects. Meanwhile, Local Polynomial Interpolation (LPI) outperformed in four studies across various metrics like precipitation, annual rainfall, groundwater quality, and hydrological drought, showcasing its ability to capture local variations effectively. Ordinary Kriging (OK) is frequently used in environmental and water studies [11]. Spherical Ordinary Kriging (SPH-OK) excelled in three studies, specifically predicting groundwater salinity, quality, and hydrological drought with low RMSE values. Exponential Ordinary Kriging (EXP-OK) outperformed in four groundwater studies, while Gaussian Ordinary Kriging (Guass-OK) demonstrated the highest performance in three other groundwater studies. A study in China found that Simple Ordinary Kriging (SK), a geostatistical method that assumes a known constant mean across the study area, is optimal for predicting groundwater levels using ArcGIS and spatio-temporal analysis, as shown in Table 1. In Turkey, a study concluded that Radial Basis Function (RBF) is superior for modeling groundwater level variations. Universal Kriging (UK) demonstrated high efficiency in two studies, particularly for predicting missing groundwater level data. Lastly, the Cokriging (CoOk) method, which extends ordinary kriging by incorporating secondary variables (such as groundwater quality) to improve predictions, yielded the best results in two studies focused on both groundwater level and quality.
While previous research has identified multiple drivers of groundwater variation, including climate variability, agricultural irrigation, and rural water demand, much of this literature treats these factors in isolation, with limited integration into a unified understanding of groundwater trends in the UAE. Several studies report depletion patterns in arid regions, yet many of these assertions are presented without consistent empirical backing, leaving gaps in their applicability to Abu Dhabi’s unique hydrogeological context. Moreover, although various interpolation methods have been applied globally, few studies explicitly address how such techniques can overcome the limitations of earlier approaches, such as reduced accuracy in sparsely monitored regions or insufficient sensitivity to local variability. By focusing on LPI and EXP-OK, this study directly targets these shortcomings, aiming to deliver a clearer, more spatially detailed representation of groundwater dynamics that can inform both scientific understanding and water resource policy.
This study aims to build upon a previous study by further assessing the performance of two interpolation models, LPI and EXP-OK, to identify missing groundwater level measurements over an extended period in the same study area. Additionally, this study seeks to measure groundwater storage, thereby providing a more comprehensive understanding of groundwater dynamics in the region. This evaluation not only validates earlier findings but also contributes to deeper insights into groundwater behavior. Unlike previous studies summarized in Table 1, this research applies LPI and EXP-OK over a 20-year record of groundwater levels in Abu Dhabi, integrates cross-validation with both statistical and spatial diagnostics, and directly links interpolation performance to groundwater storage estimation for policy-relevant water management decisions in an arid environment.

2. Materials and Methods

2.1. Study Area and Data Description

The location of this study is the emirate of Abu Dhabi, which has 257 wells in different emirate regions, as shown in Figure 1, and the data was obtained from Environment Agency—Abu Dhabi. The geography of Abu Dhabi is mainly flat, sandy land with occasional sand dunes that can be as high as 300 m in the southern areas. To the east, the Emirates borders the western Al-Hajar Mountains. The highest peak is the Hafeet Mountains in the south of Al-Ain City, rising to approximately 1250 m [36]. The weather in the Abu Dhabi Emirate is typically hot and arid; however, there are slight variations in the climate between the east and west as well as between coastal and inland areas. The highest amount of rain in the area occurs in Northeast Al Hayar, with an average annual total of 100 mm. In the Liwa Desert, the average temperature is the highest in the Emirate, reaching above 40 °C and even going as high as 50 °C on some days during the summer. The formation of the Emirate of Abu Dhabi was a result of the uplifting of continental plates, resulting in layered, semi-solid, and unconsolidated structures of different ages. Although the depth of the hard rock is unknown, its extent can be delineated to the north and east by the Arabian Sea and the Oman Mountains, while the southern boundary permits groundwater flow into Saudi Arabia. The topography of Abu Dhabi is generally characterized by low relief, with the highest elevations found in the eastern region, forming part of the foothills of the Oman Mountains [37]. Extensive amounts of groundwater are collected from surface aquifers to meet present-day water needs. Heading toward the east, the surface aquifer is situated above the upper far layers that are highly productive and below the lower far layers that are not as available. As a result of extensive pumping, the water table fell between 40 and 60 m below its traditional level in the eastern section of the area [38].

2.2. Interpolation Techniques for Groundwater Level Estimation

The methodology for this study involved employing two distinct interpolation methods: EXP-OK, a commonly used kriging method [39], and LPI, which was widely used to create surfaces with local variation to assess the fluctuations in groundwater levels of 257 wells over a 20-year period from 2002 to 2022 [31]. The key aim was to evaluate the efficiency of these interpolation techniques in tracking changes in groundwater levels and subsequently calculating the groundwater storage for the assigned period. The ArcGIS 10.8.1 modeling program was used for different interpolation performance evaluations. This advanced tool played a key role in generating comprehensive groundwater level maps for the selected study period. The interpolation methods utilized in this study are classified into geostatistical and deterministic methods. Geostatistical methods are powerful interpolation techniques that use spatial correlation patterns among sample points to estimate the values of surface locations. This method determines the resulting value of each location by specifying the number of points or using all points within a certain radius. Geostatistical analysts offer three types of kriging: ordinary kriging (OK), empirical Bayesian, and areal interpolations. Deterministic techniques generate surfaces based on the similarities or uniformities of the considered points. These approaches can be categorized into global and local. Global methods make use of all the data to determine the missing values that produce a general result view, whereas local techniques use only data within a localized region to predict unknown values at the benchmark points [40].

2.3. Ordinary Kriging

Ordinary kriging is the most common kriging method. It is a linear regression method that estimates known values at unsampled locations using semivariogram characteristics and a primary value, assuming that the mean value remains constant across the entire interpolation area [12,25,41], as represented in the following equation:
Z ^ O K x 0 = i = 1 n λ i O K x 0 Z x i , i = 1 n λ i O K x 0 = 1
where  Z ^ O K x 0  is the estimated value of the variable at the unsampled location  x 0  using Ordinary Kriging,  n  is the number of neighboring sample points used in the estimation,  λ i O K x 0  is the Ordinary Kriging weight assigned to the  i -th sampled point, determined by solving the kriging system so that estimation is unbiased and variance is minimized,  Z x i  is the observed value of the variable at the sampled location  x i x 0  is the location where the value is being estimated and  i = 1 n λ i O K x 0 = 1  is a constraint ensuring the kriging estimator is unbiased.
Before performing a geostatistical estimation, it is necessary to develop a model that can calculate the variogram value for any potential sampling interval. The most commonly used models for this purpose are spherical, exponential, Gaussian, and pure nugget effects [42]. The spherical model is commonly utilized in geostatistics, particularly when there is a noticeable difference in nugget variance and there is a defined range and sill. In cases where there are distinct nuggets and sills, the exponential model is a suitable option; however, it works best when there is a gradual approach to the range. Alternatively, when the variance is extremely uniform and the nugget variance is minor compared to the spatially correlated random variation, the Gaussian model tends to provide the best fit for the variogram [43]. A pure nugget effect model is a unique simplified form of a transitive semivariogram featuring an extremely small range in which the semivariogram rapidly increases from zero to a fixed value [44].

2.4. Local Polynomial Interpolation

The LPI technique involves the use of polynomials to model all surfaces and consists of a series of algorithmic functions that correspond to polynomial orders (e.g., zero, first, second, third, and beyond) [45]. Neighborhood parameters, such as shape, minimum and maximum points to be included, and sector configuration, can be defined by the user to estimate the surface value of the center of the area. This method produces a predicted value, standard error of the prediction, and condition number surface similar to those produced by other kriging interpolations. The order of the polynomial function determines the shape of the resulting surface.
However, this technique relies on the consistent spread of data points and normally distributed data values within the study area [41]. In this study, a first-order exponential kernel function with six neighbors is used. The LPI approach uses only neighboring data points rather than the entire dataset, as is the case with the GPI method. The formula employed in the LPI technique was developed from the equation of the GPI method, incorporating a surface trend of a greater polynomial degree as expressed in the equation [45].
Z x y = b 0 + b 1 x + b 2 y + b 3 x 2 + b 4 x y + b 5 y 2 + b 6 x 3 + b 7 x 2 y + b 8 x y 2 + b 9 y 3
where  Z x y  is the Estimated value of the variable at the location with coordinates  ( x ,   y ) x  and  y  are spatial coordinates of the prediction location,  b 0  is the intercept term,  b 1 ,   b 2 ,   ,   b 9  are the polynomial coefficients determined during interpolation that define the contribution of each term,  b 1 x  and  b 2 y  are the first-order terms describing simple trends along the  x  and  y  directions,  b 3 x 2 b 4 x y  and  b 5 y 2  are the second-order terms capturing curvatures and interaction between  x  and  y , and  b 6 x 3 b 7 x 2 y b 8 x y 2  and  b 9 y 3  are the third-order terms capturing more complex local variations and asymmetries.
In simpler terms, LPI fits a smooth surface to the data by using only the most relevant nearby measurements, which makes it well suited for capturing small-scale variations in groundwater levels. This is an important consideration in Abu Dhabi, where conditions can vary sharply over short distances. However, like many interpolation methods, it assumes relatively uniform aquifer behavior within each local neighborhood, which may not fully reflect the complex subsurface geology of the region.

2.5. Spatial Temporal Variability Analysis of Groundwater Level

This study employed ordinary kriging (EXP-OK) and LPI methods to analyze groundwater level fluctuations across 257 wells from 2002 to 2022. To understand the dynamics and spatial variability of groundwater levels over a 20-year period. To facilitate this understanding, this study utilized several analytical methods within ArcGIS software, along with IBM-SPSS (version 29) statistics:
  • Cross-validation is a statistical approach that verifies the precision of an interpolation model by dividing the initial data into a training set and a validation set. The validation set is then utilized to test the model created from the training set, providing indicators to assess its accuracy. The model with the lowest error is considered the most suitable interpolation model [32].
  • Descriptive Statistics: calculating basic statistics of groundwater level data such as the mean, median, mode, and standard deviation. These statistics provide initial insights into the central tendency, shape, and dispersion of the data [46].
  • Visual Inspection: creating time series plots and histograms visualizes the data to provide insights into normality, potential patterns, and outliers [47].
  • Exploratory Spatial Data Analysis (ESDA): conducting a semivariogram, which is a graphical representation that shows the semi variance values for pairs of points at different distances. Essentially, it plots the squared difference between the values of each pair of points on the “y” axis against the distance separating them on the “x” axis. This tool is useful for understanding the spatial autocorrelation of a set of sample points, which assumes that points nearby are more similar to each other [48].
  • Maps Generation: producing groundwater level maps along with prediction standard error maps to interpret spatial patterns and temporal fluctuations, along with critical zones [46].

2.6. Groundwater Storage Calculation from In Situ Data

Calculating groundwater storage over the two-decade period from 2002 to 2022 is an important part of understanding long-term changes in water availability and hydrological conditions. A key equation used in this calculation, Equation (3), is:
S = h × S y
This equation represents the change in groundwater storage (ΔS), calculated as the product of the water level fluctuation (∆h) and the specific yield (Sy). The specific yield refers to the proportion of water that an aquifer releases due to the force of gravity [9,49]. In this equation, (∆h) is the water level fluctuation, represents the change in the level of water over time. It can be measured by observing the change in water levels in wells over the study period. Positive values indicate an increase in water levels, suggesting recharge or accumulation of water, while negative values suggest a reduction in water levels, indicating extraction or drainage of water from the aquifer. The Sy is a critical parameter in this equation. It refers to the volume of water that an aquifer can release from storage per unit surface area of the aquifer, per unit decline in the water level, due to the influence of gravity. It is typically estimated based on the characteristics of the aquifer material, such as its porosity and permeability, as well as the degree of water saturation. Different studies focused on the water level fluctuation and the specific yield to calculate the changes in groundwater storage [9,49,50]. They acknowledged the importance of understanding these two parameters in order to comprehensively analyze and predict changes in groundwater resources. Here are some of the primary limitations:
  • Accuracy of Measurements: The equation is heavily dependent on the accuracy of the measurements of water level changes (∆h) and Sy. Any errors or inaccuracies in these measurements can greatly impact the calculation of groundwater storage change (ΔS).
  • Assumption of Homogeneity: The method assumes that the aquifer is homogeneous and isotropic, meaning that the properties of the aquifer, including the Sy, are uniform in all directions. However, in reality, aquifers often have variable properties.
  • Limitations of Specific Yield: The Sy is a difficult parameter to determine accurately. However, this value can change based on various factors, including soil properties, saturation levels, and even the rate of withdrawal. In this research, the chosen average value of specific yield is based on several published studies conducted in the same region by [49,51,52]. These studies utilized a specific yield that varied between 0.01 and 0.32.

3. Results

3.1. Cross-Validation

The study aims to assess the performance of the two interpolation methods, EXP-OK and LPI. Based on the ArcGIS comparison feature, both methods have RMSE values from cross-validation tests of groundwater levels. The EXP-OK method yielded an RMSE value of 2.644 while the RMSE for LPI method is about 2.844 (Figure 2). The lower the RMSE value, the higher the accuracy of the interpolation method. Indicating EXP-OK to outperform LPI for RMSE value. R2 values for the EXP-OK and LPI methods were 0.9338 and 0.9561, respectively. Both methods achieved high R2 values; however, LPI showed a slightly higher R2 than EXP-OK. The higher R2 observed for LPI indicates a stronger fit between observed and predicted groundwater levels, likely due to its sensitivity to local data patterns and ability to adapt to small-scale variations. However, this local adaptability may also amplify the influence of outliers or noise, particularly in areas with sparse data, which could explain its slightly higher RMSE compared to EXP-OK. In contrast, EXP-OK provides a more smoothed coherent surface, leading to lower RMSE. Generally, LPI may offer more detailed spatial insight, as predictions may carry higher localized uncertainty. This also helps explain the broader range of groundwater storage estimates derived from LPI with fine-scale sensitivity focusing on localized fluctuations compared with EXP-OK that may smooth over, leading to different ΔS values across the study area.

3.2. Descriptive Statistics

The basic statistics of groundwater levels differences obtained using EXP-OK and LPI models are summarized in Table 2. This table shows that the LPI method demonstrated a broader overall range of 71.022 m, suggesting more extreme fluctuations in groundwater levels than EXP-OK, which had a slightly narrower range of 66.339 m. The mean groundwater level for EXP-OK was 3.281 m lower than that of LPI (7.467 m), indicating that, on average, LPI experienced higher groundwater levels. This difference was further highlighted by the median values, with EXP-OK at 2.489 m and LPI at 7.552 m. In terms of distribution, EXP-OK has a slightly asymmetrical distribution, as shown by its skewness value of 0.268, whereas the LPI distribution is more symmetric, as evident from its lower skewness of 0.071. However, both locations had relatively flat distributions, as indicated by kurtosis values of 1.151 for EXP-OK and 0.383 for LPI. The standard deviation of LPI (11.904 m) was higher than that of EXP-OK (9.686 m), suggesting that groundwater levels using LPI vary more widely around the mean than those of EXP-OK. The interquartile range further supports this observation, with LPI showing a greater variability of 15.597 m than EXP-OK at 11.750 m. Overall, the LPI exhibited higher, more variable, and more symmetrically distributed groundwater levels than EXP-OK.

3.3. Histograms and Time-Series Plot

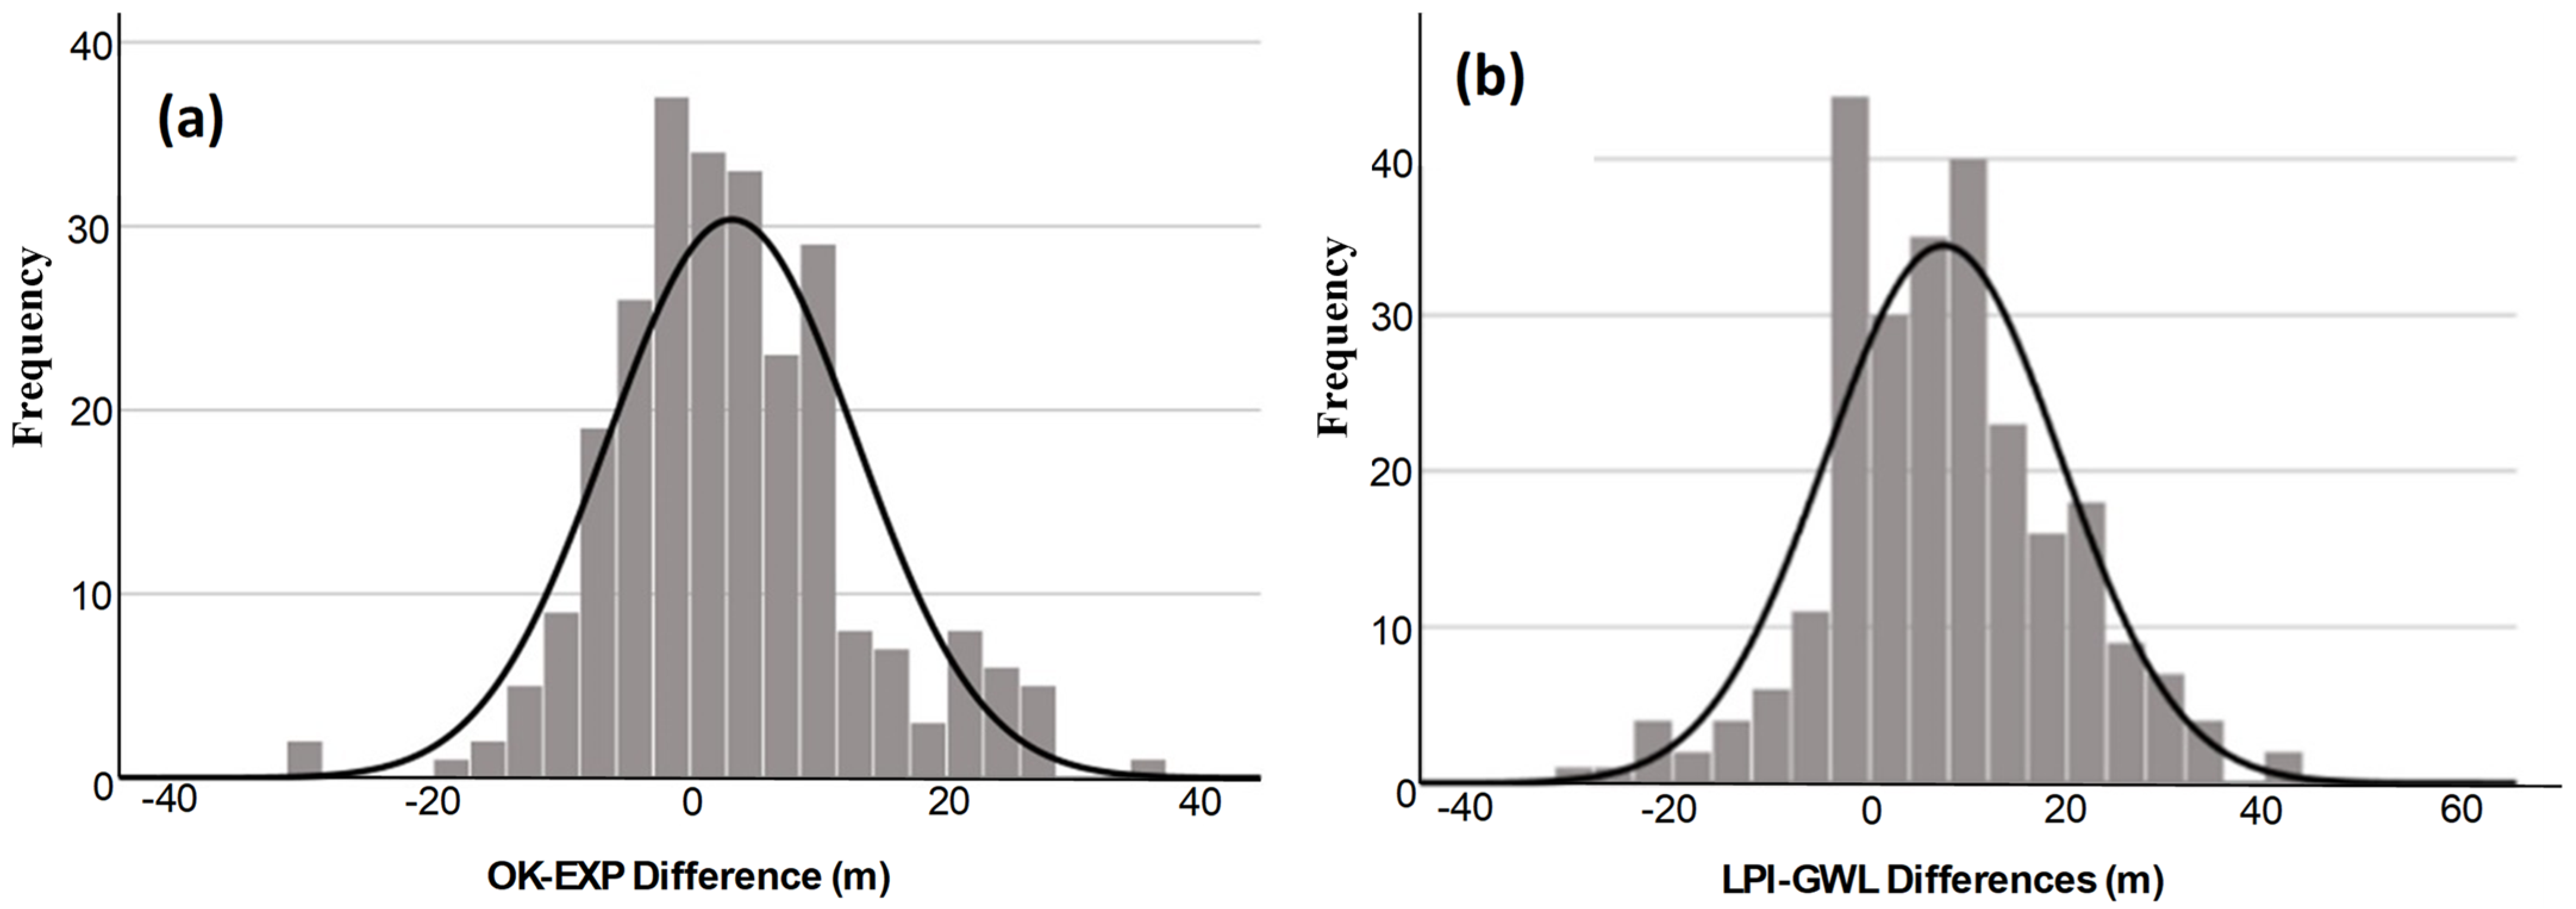
The distribution of the groundwater level differences predicted by EXP-OK and LPI models can be represented by histograms as shown in Figure 3. The EXP-OK histogram displays an approximately symmetrical, normal distribution centered around the mean, with values ranging between −20 and 20 m. In contrast, the LPI histogram shows a clustering of values around the mean with a slightly different pattern. The LPI GWL distribution represents a slightly right-skewed, with a longer tail extending towards the positive differences, particularly between 20 and 60 m. This skew suggests that there are more frequent higher positive differences in groundwater levels at LPI. The peak of the LPI histogram is higher than that of EXP-OK, indicating a greater frequency of values around the mode. The wider spread in LPI’s data points to a higher variance, which could imply a more dynamic range of changes in groundwater levels compared to EXP-OK.
These histogram patterns are consistent with findings from earlier groundwater interpolation studies, where kriging methods often produced more normally distributed residuals while polynomial approaches captured local variability with higher variance. Similar right-skewness and wider spreads in LPI outputs have been reported in arid-region groundwater modeling, highlighting its sensitivity to local heterogeneity.
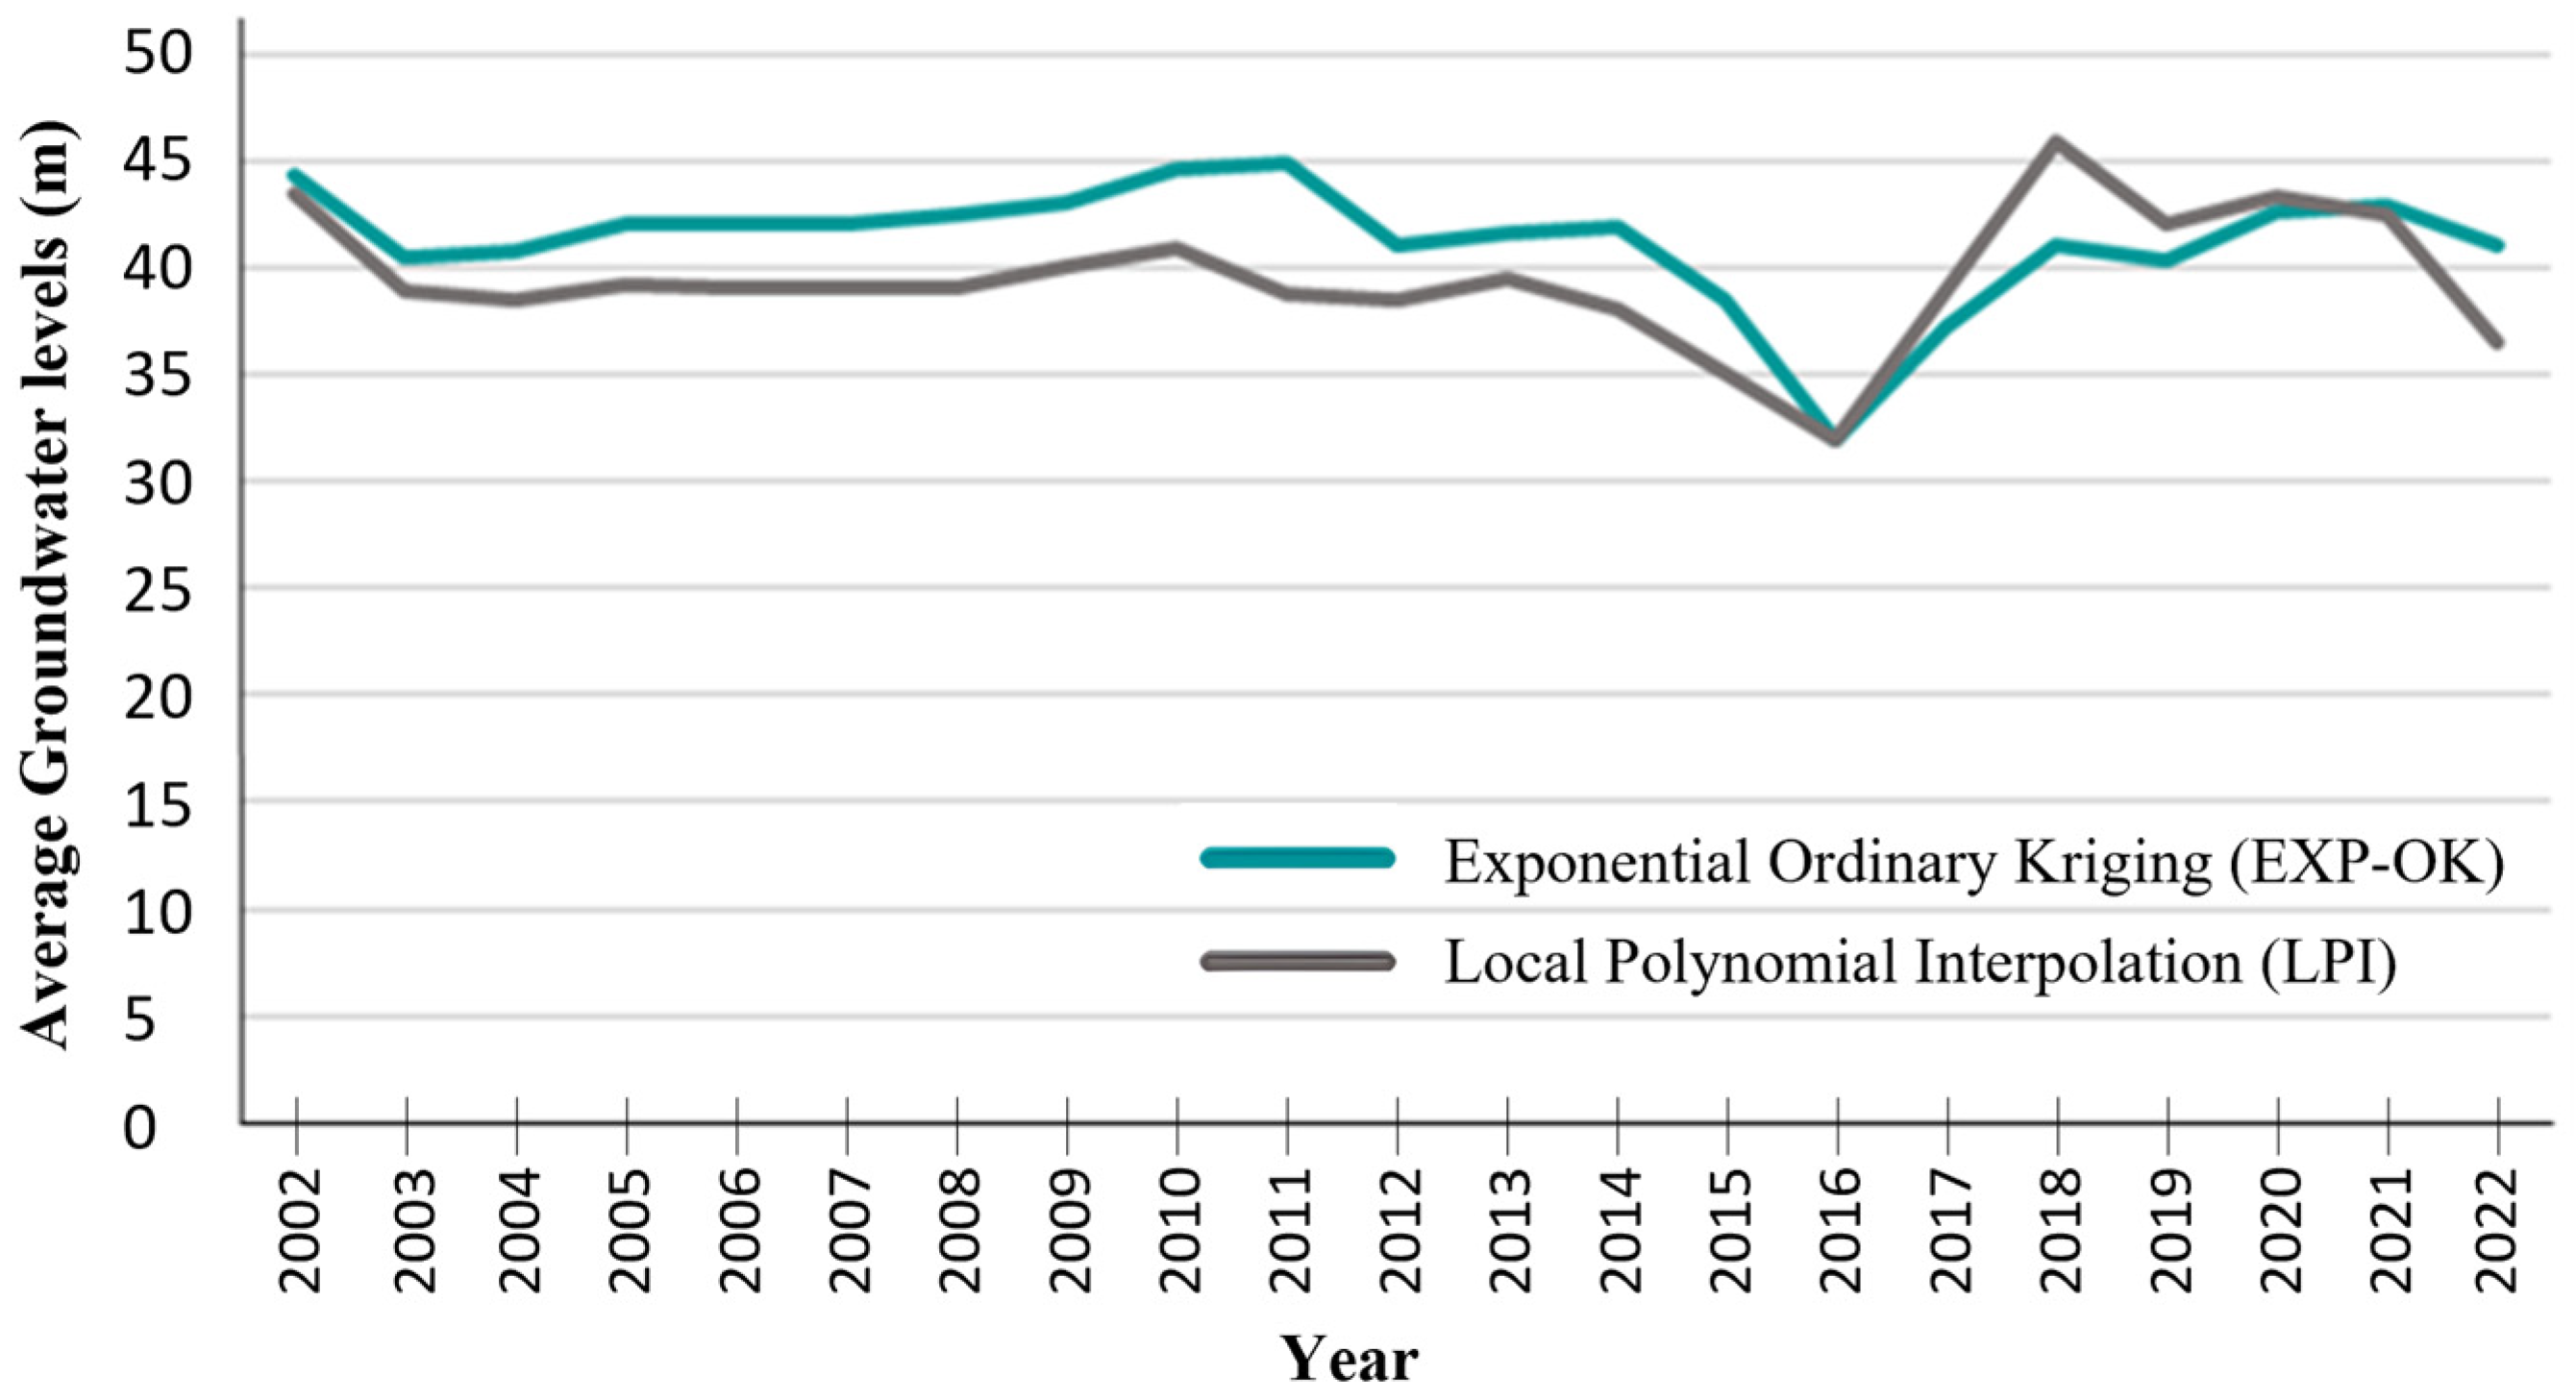
Time series plot is an essential tool for visualizing and understanding the temporal dynamics of a dataset. Figure 4 presents time series plots of average groundwater level differences from 2002 to 2022, comparing the results of the EXP-OK and LPI methods. Both methods exhibit similar trends over the time period, suggesting that the underlying groundwater patterns are consistent regardless of the interpolation technique used. The lowest recorded GWL using EXP-OK was approximately 31.88 m in 2016, and the highest was around 44.92 m in 2011. For LPI, the lowest was about 31.98 m in 2016, closely aligning with EXP-OK, and the highest was 45.87 m in 2018. The average GWL over the 20-year period using EXP-OK was approximately 42.00 m, while for LPI, it was lower, at around 39.00 m. From 2014 to 2015, GWL decreased by about 2.89 m as per EXP-OK and 1.67 m according to LPI, showing one of the more significant annual drops. The values of groundwater levels extracted from EXP-OK are consistently higher than those from LPI. LPI method is more sensitive to local variations in the data due to its emphasis on nearby points, which can lead to lower or higher estimates compared to EXP-OK, which considers a broader area to determine the best estimate. It should be noted that the interpolation analysis presented here is primarily statistical and spatial, with limited incorporation of hydrogeological variables such as aquifer properties, recharge and discharge zones, and lithological variations that also influence groundwater dynamics.
Given that Abu Dhabi has a predominantly hot and arid climate with limited and highly variable rainfall, seasonal fluctuations in groundwater levels are minimal. Instead, the observed temporal variability over the 20-year period is more strongly influenced by long-term drivers such as intensive irrigation demand and reduced natural recharge.

3.4. Exploratory Spatial Data Analysis (ESDA)

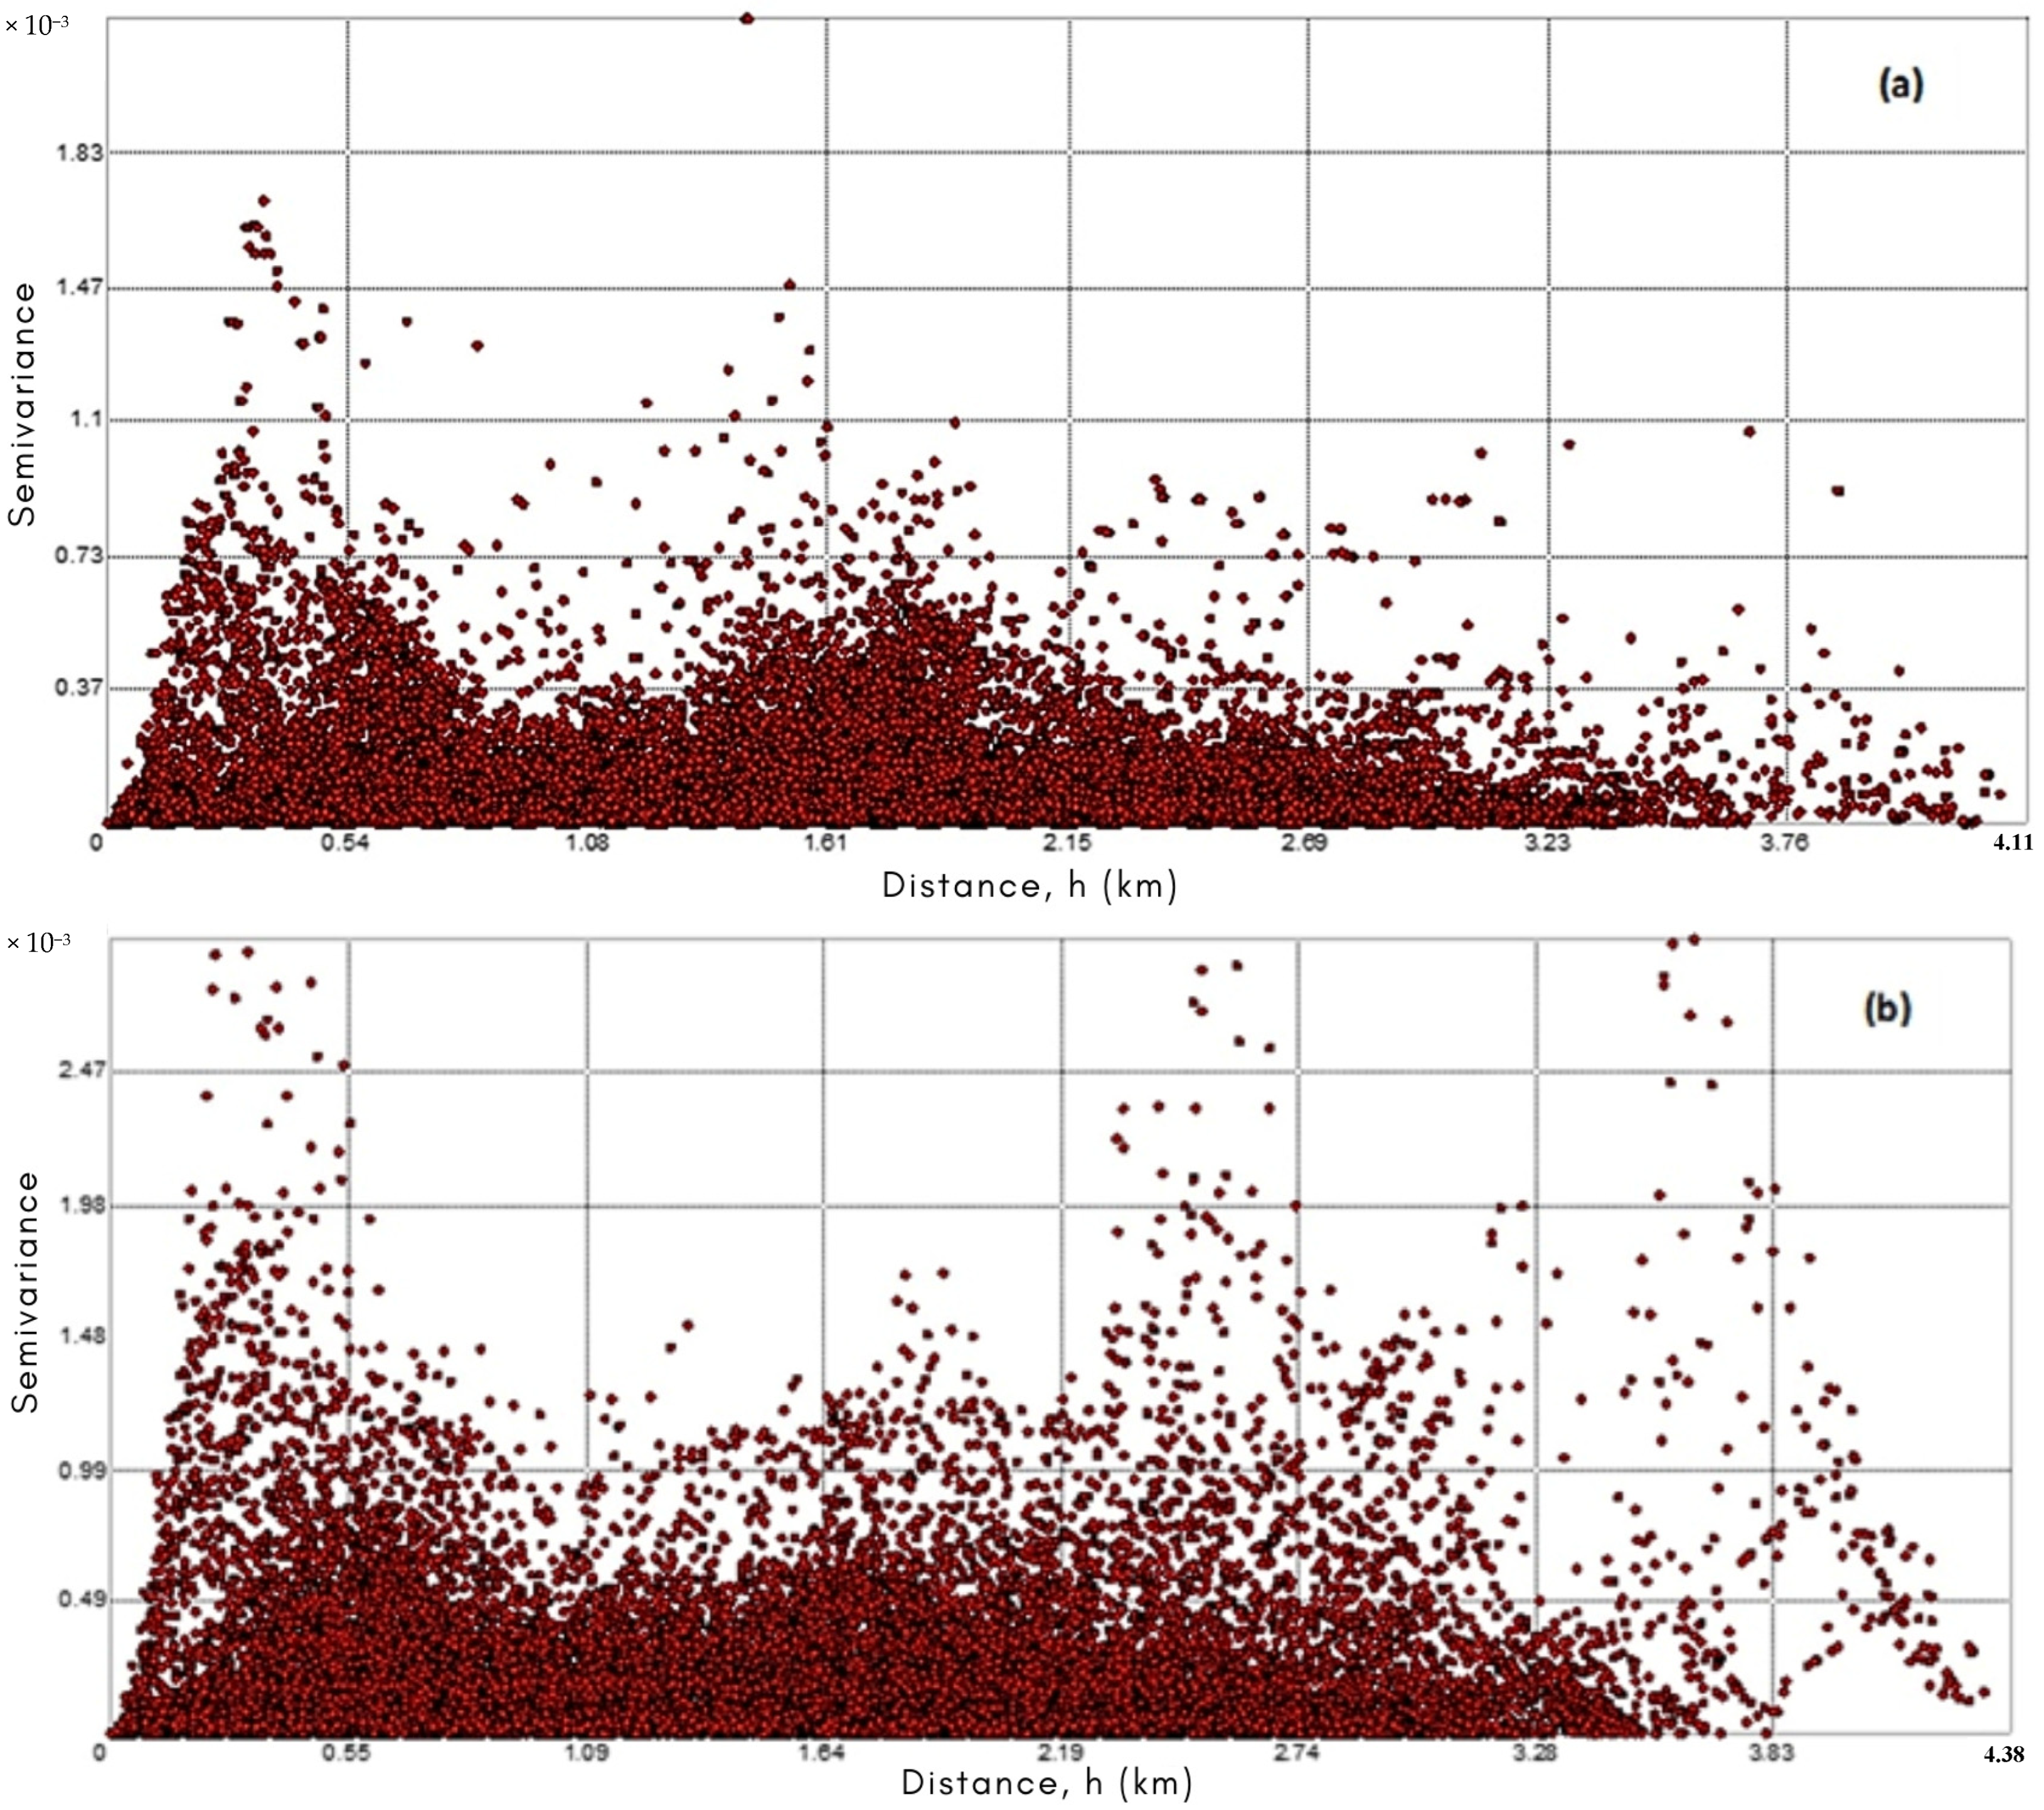
Exploratory Spatial Data Analysis plays a vital role in understanding spatial patterns in datasets, and variograms are a key tool within this analysis. Variograms provide information about spatial autocorrelation in data, showing how the similarity (or dissimilarity, in terms of variance) between data points changes with distance. The semivariogram, a crucial tool in ArcGIS spatial statistics and geostatistics, is used to quantify spatial autocorrelation, or the degree of similarity among values based on their spatial location. It provides information on the spatial dependence and variability within a dataset [53]. It can be useful in determining whether spatial relationships exist among sampled points [54]. Additionally, it has been widely used in ecological research to reveal the spatial variability of ecological factors within a given area [55]. Generally, it is obtained by taking the mean of the squared differences between each pair of values when measured at a specific lag distance, the lag distance (h) is the distance between pairs of spatial data points used in the semivariogram analysis [56]. Figure 5 demonstrates the EXP-OK and LPI methods semivariogram that reflect how these models capture the spatial autocorrelation structure of groundwater levels. For plot (a), the EXP-OK model, the semivariogram points appear to be densely clustered at the lower end of the y-axis, which represents semivariance, and spread out as the lag distance on the x-axis increases. This pattern is characteristic of an exponential growth in variance with distance, indicating that groundwater levels are more similar at closer distance and the correlation decreases with distance. The points do not show a clear sill or range, which would typically indicate the distance beyond which there is no correlation. Plot (b), representing the LPI model, also shows a dense cluster of points at the lower end of the semivariance, but with a more dispersed spread as distance increases, suggesting a more gradual decrease in spatial correlation. This could be indicative of the LPI model capturing more localized variations in the groundwater levels, as it adjusts the interpolation based on local subsets of the data.
In the Abu Dhabi context, external drivers such as intensive groundwater abstraction, rapid land-use change, and arid climatic variability have affected groundwater critically. Over-abstraction for irrigation has already led to significant water table declines (up to 40 m in Remah and 15 m in Al Khatim), coupled with salinity increases and nitrate contamination linked to irrigation return flow and fertilizer use [57]. Land-use change has further intensified pressures, with agricultural and urban areas in Al Ain expanding by more than 7% and 10%, respectively, between 2006 and 2016, driving a groundwater depth decline of over 40% in a single decade [58]. Climatic controls exacerbate these stresses: low rainfall (70–130 mm/year) and high evaporation rates (>2000 mm/year) restrict natural recharge, while isotope studies reveal that much of Abu Dhabi’s groundwater is paleoclimatic in origin with minimal modern replenishment [59,60]. These interacting anthropogenic and climatic factors strongly influence the spatial heterogeneity of groundwater observed in semivariograms, altering both the strength and scale of spatial autocorrelation patterns.

3.5. Groundwater Interpretation Maps

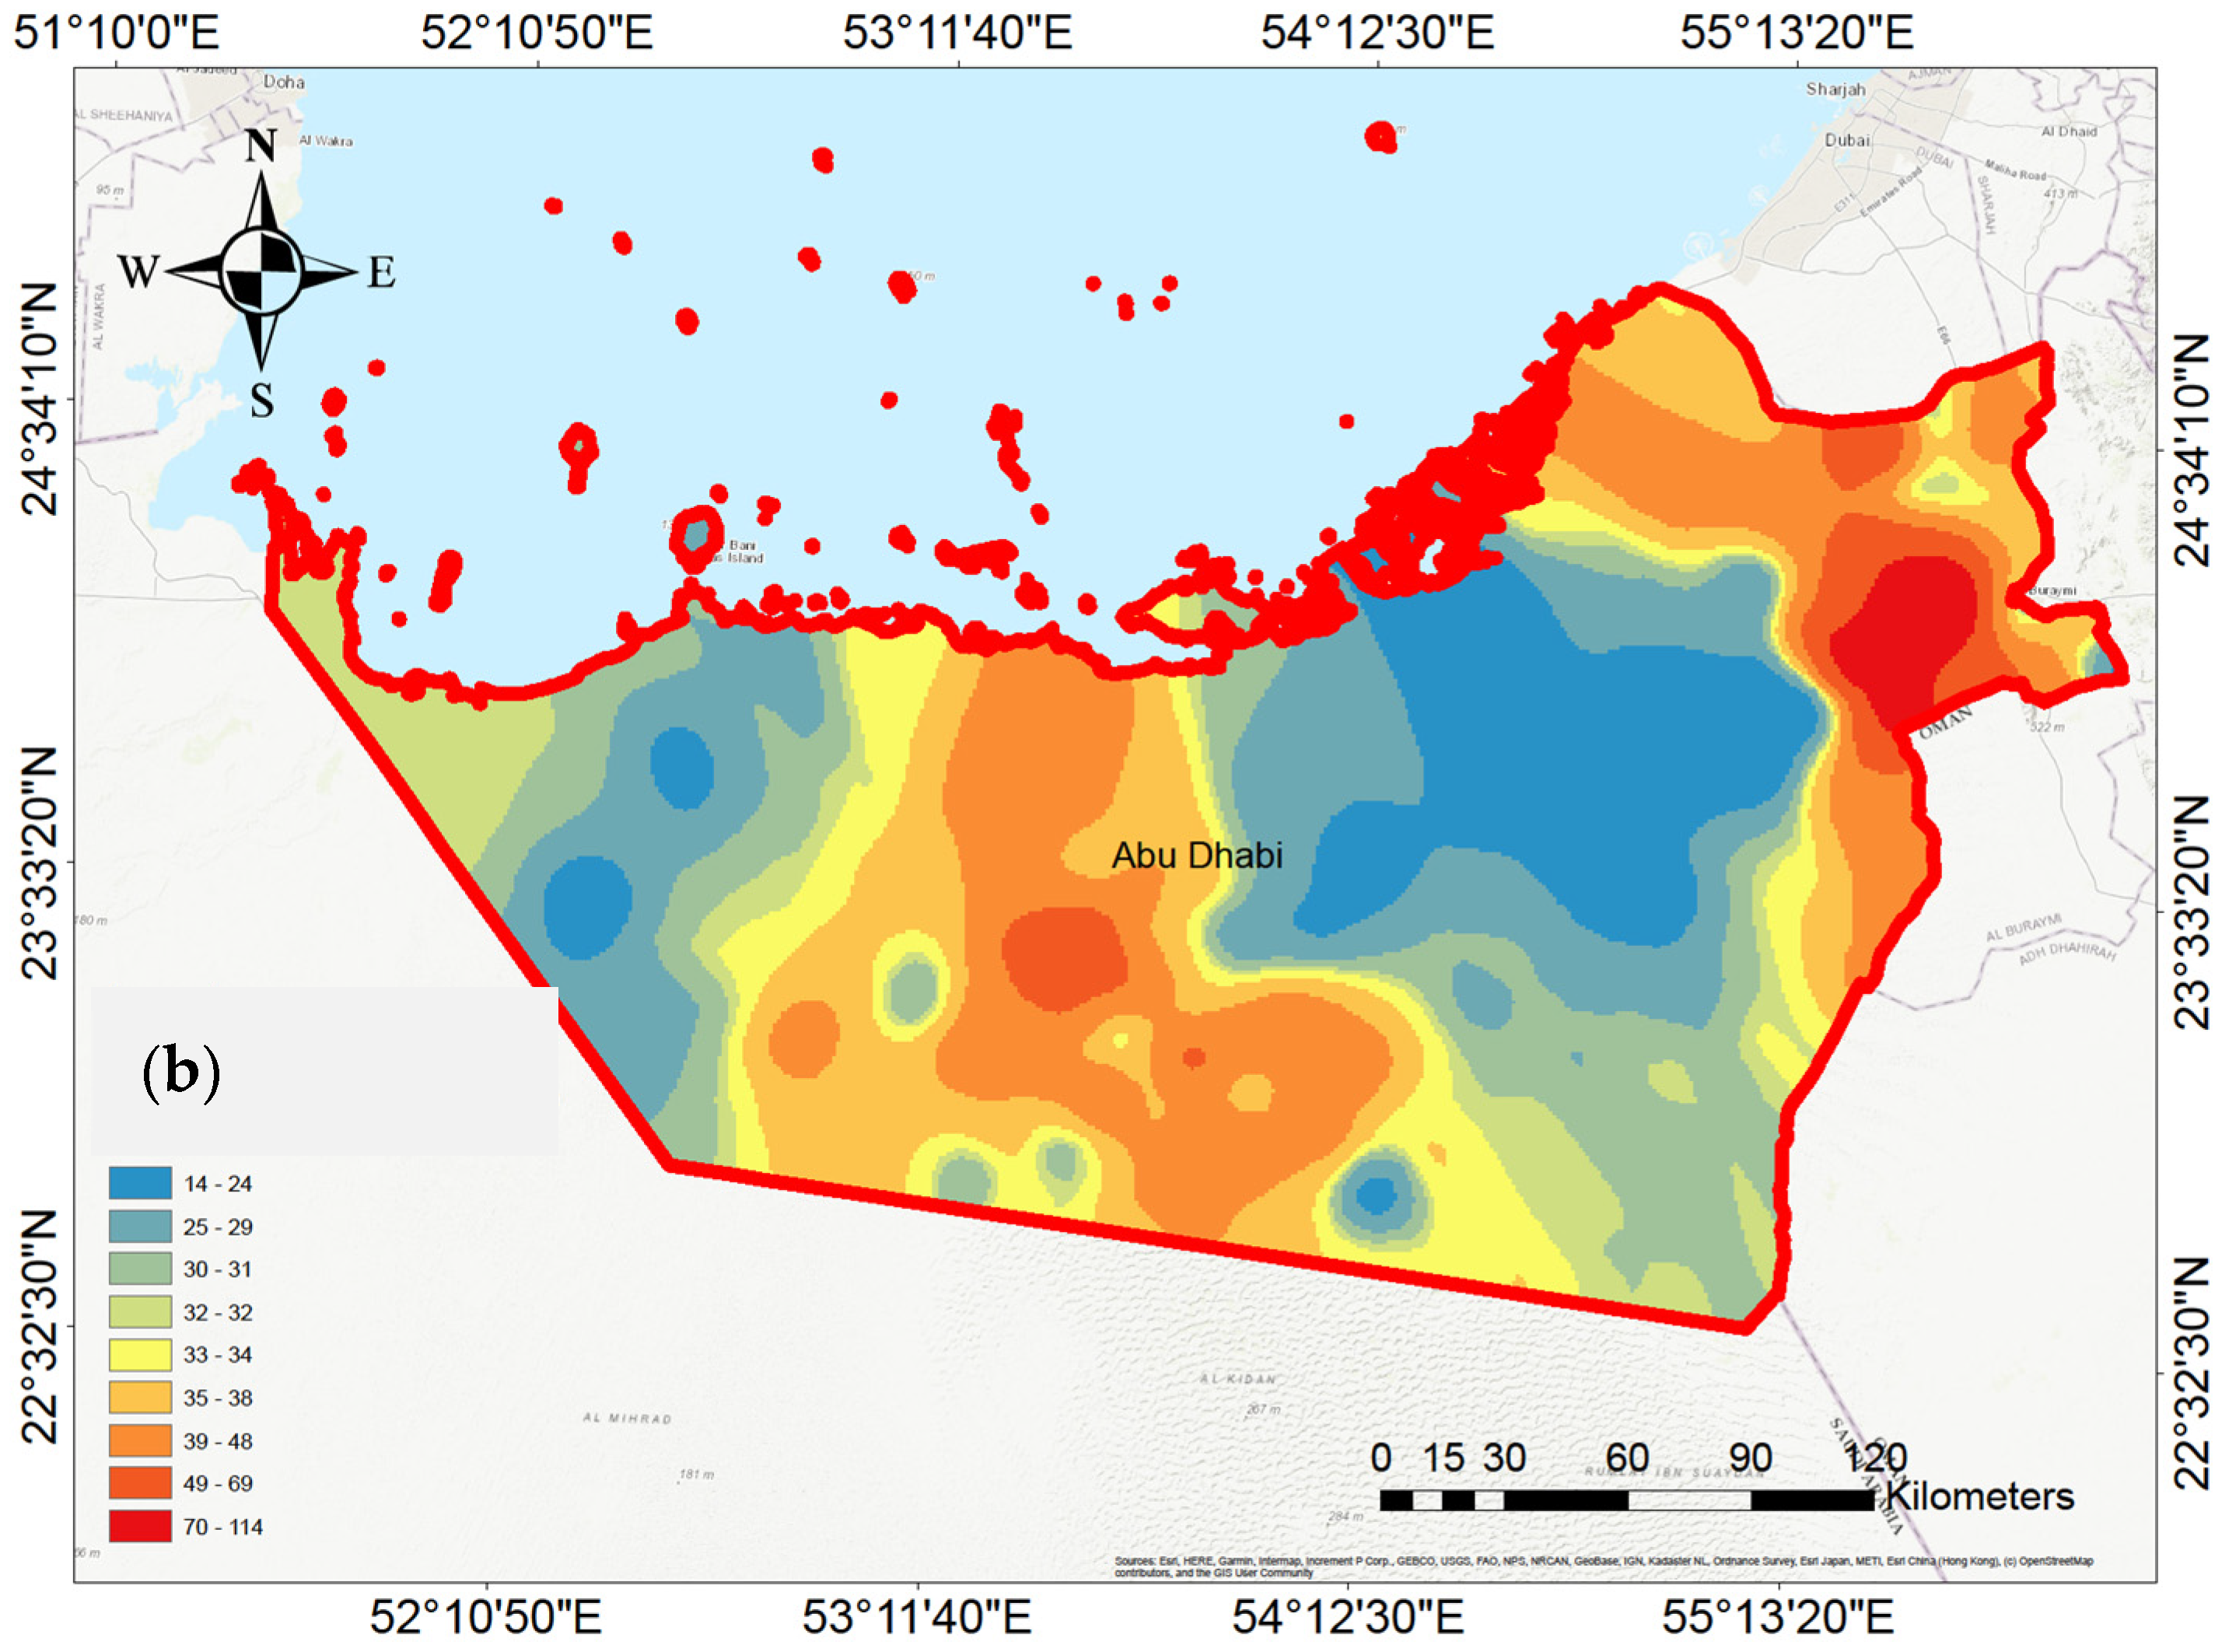
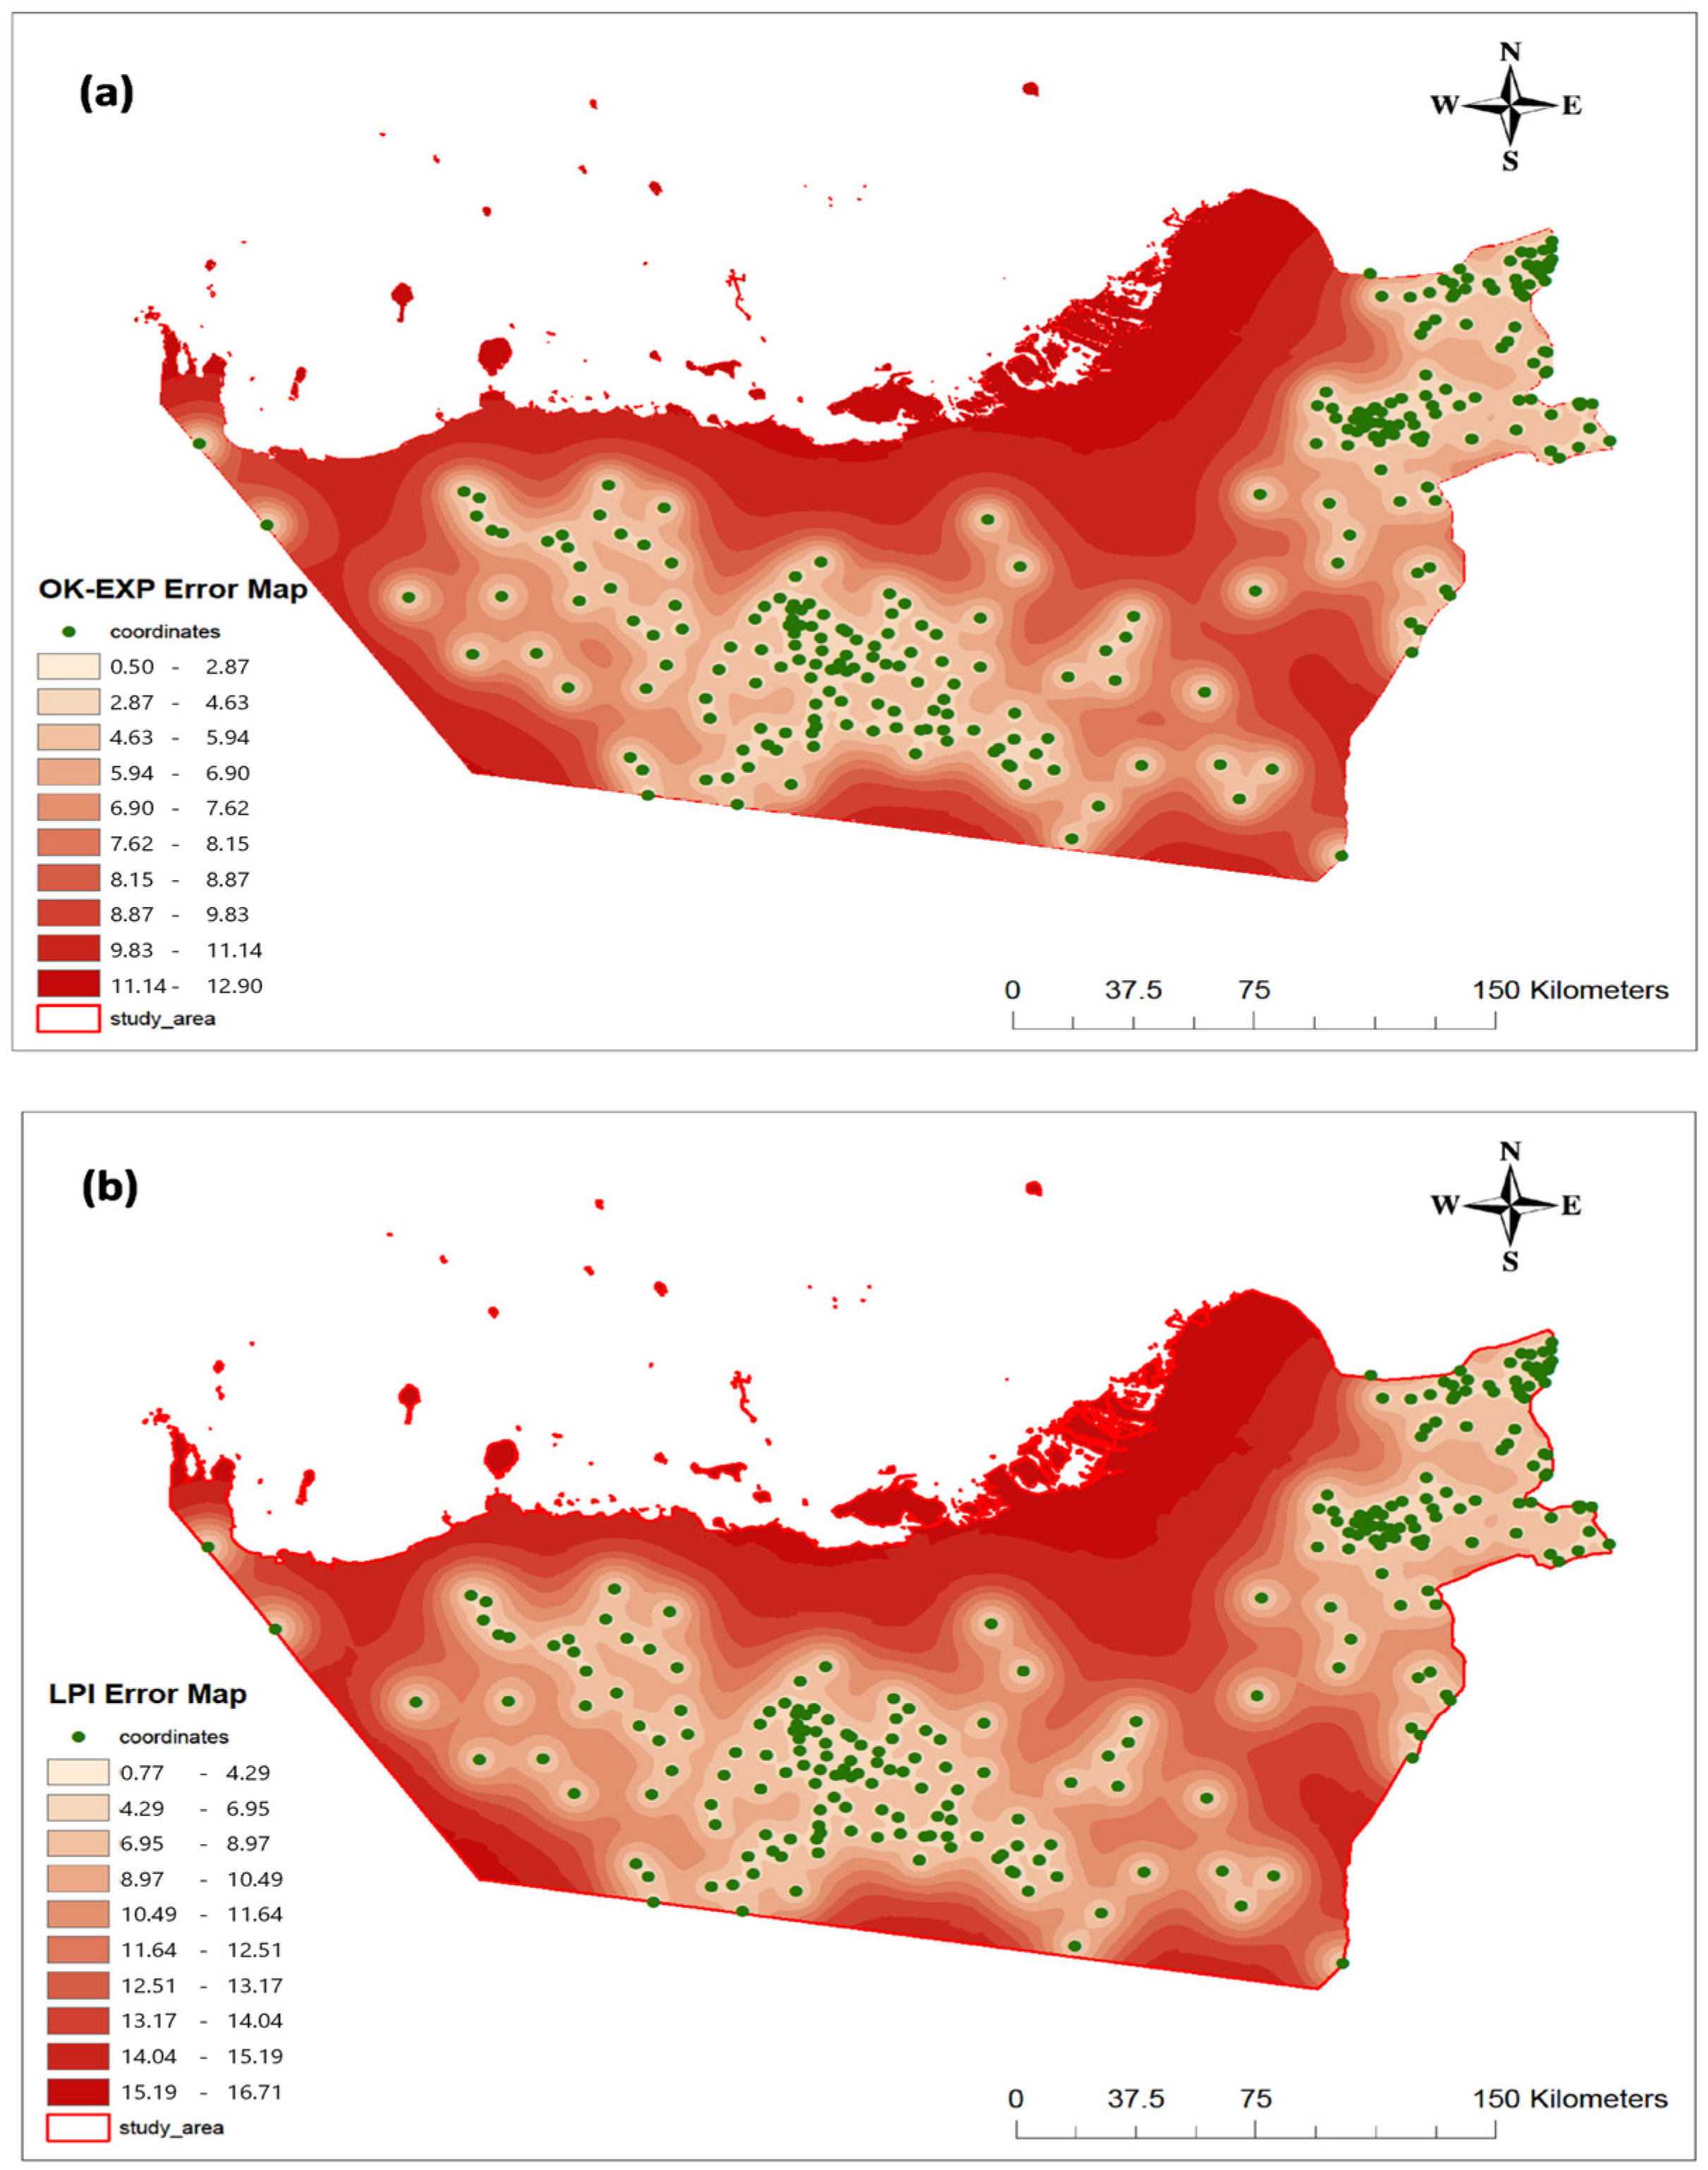
Dynamic changes in groundwater level are a crucial factor in understanding current and future water availability by monitoring and evaluating variations in groundwater level over a period of time. The created groundwater level map had a legend column that indicates the change in the water table. A higher positive value in the legend column indicates a rise in the water level, which means that the water table is closer to the surface. Conversely, a lower positive or negative value in the legend column indicates a decline in the water level, as the water table is farther below the surface. Figure 6 shows an interpolated map of the groundwater difference values utilizing the EXP-OK and LPI methods between 2002 and 2022. The two maps illustrate that there was a significant overall fluctuation in groundwater levels during the study period. Examining the groundwater level spatial variation map more closely reveals that the EXP-OK map displays a broad range of GWL, with the highest concentrations indicated in red, particularly towards the northern areas of Abu Dhabi, suggesting areas with a GWL above 5 m. In contrast, the southern areas show significantly lower GWL, with some regions dropping below −10 m, marked in blue. Compared to the EXP-OK map, the LPI method indicated a more uniform transition from shallow to deep levels. The highest levels were less extreme than those observed in the EXP-OK map, and the lowest levels were not as severe. This suggests that the LPI method provides a smoother interpretation of the GWL data, possibly integrating over longer timescales or reflecting different sensitivities to local hydrogeological conditions. The error maps represented in Figure 7 for the EXP-OK and LPI methods provide a visual representation of the spatial distribution of errors associated with groundwater level (GWL) measurements across the Abu Dhabi region. The EXP-OK map suggests lower measurement errors, particularly in the northern areas where wells are densely located, while the LPI map shows generally higher errors across the region. These maps are essential for assessing the accuracy of groundwater level estimations.

3.6. Change in Groundwater Storage

The study found that both the Ordinary Kriging (EXP-OK) and Local Polynomial Interpolation (LPI) methods were effective in analyzing groundwater level fluctuations. LPI, however, showed a slightly better performance in predictive accuracy. It revealed higher, more variable, and more symmetrically distributed groundwater levels compared to EXP-OK. LPI’s sensitivity to local data variations led to a broader range of estimates and a more dynamic understanding of groundwater changes. The LPI method also provided a smoother interpretation of groundwater level data, indicating a more uniform transition between different levels. Due to these advantages, LPI was chosen for the final analysis and calculation of groundwater storage. Over the two-decade period from 2002 to 2022, an analysis of the groundwater storage across 257 wells revealed notable changes. In 2002, the average groundwater level is 43.47 m. By 2022, this level had dropped to 36.87 m, marking a water level fluctuation (∆h) of −6.60 m. As illustrated in Table 3, this change in groundwater level, combined with the specific yield (Sy) values ranging from 0.01 to 0.32, translates to a change in groundwater storage (∆S) between −0.066 to −2.112 cubic meters per square meter of aquifer area. These findings underscore the dynamic nature of groundwater reservoirs and emphasize the importance of continuous monitoring and analysis to ensure sustainable water management in the area. In addition, the values in Table 3 can serve as a baseline for projecting groundwater storage under future scenarios, allowing estimation of potential changes by 2030, 2040, and 2050 under different recharge and extraction conditions. These findings highlight the dynamic nature of groundwater reservoirs in the region and emphasize the need for ongoing monitoring and analysis to ensure sustainable water management.

4. Discussion

This study aimed to evaluate the performance of the LPI and EXP-OK models in filling missing groundwater level measurements over an extended timeframe and assessing changes in groundwater storage. A comprehensive evaluation was conducted using a range of analytical tools within ArcGIS and IBM SPSS Statistics, including cross-validation, descriptive statistics, visual inspection, exploratory spatial data analysis, and map generation. These methods enabled a thorough comparison of the two interpolation models in terms of accuracy and their ability to reflect spatial and temporal groundwater dynamics. The results confirmed the effectiveness of both EXP-OK and LPI in analyzing groundwater level fluctuations, with LPI showing a slight advantage in predictive accuracy. Its sensitivity to local data variations provided a more nuanced understanding of groundwater changes, with a smoother interpretation indicating a more uniform transition between levels. The assessment of overall groundwater storage changes by the LPI method ranged from −0.066 to −2.112 cubic meters per square meter of aquifer area, underscoring the dynamic nature of groundwater reservoirs and the imperative of continuous monitoring and analysis for sustainable water management. In practical terms, these fluctuations could directly impact community water security, irrigation scheduling, and the sustainability of recharge programs. These insights can directly guide policy decisions and targeted conservation measures, such as optimizing groundwater extraction rates, enhancing recharge initiatives, and prioritizing monitoring in areas of greatest fluctuation. While this study relies on in situ well data rather than satellite gravimetry or large-scale numerical simulation, factors such as the uneven spatial distribution of monitoring wells and the temporal resolution of records may introduce uncertainties that should be addressed in future work. Comparing these results with basin-scale studies in neighboring Gulf states reveals similar depletion patterns, some of which have prompted the adoption of managed aquifer recharge and stricter extraction controls. This highlights the policy relevance of these findings. Building on this, agencies could implement phased calibration of remote-sensing estimates against field-measured wells, develop prototype early-warning dashboards to detect rapid declines, and test targeted conservation measures in high-risk zones, turning monitoring insights into actionable strategies for arid catchments under stress.

5. Conclusions

This study demonstrates that both LPI and EXP-OK are effective interpolation methods for quantifying groundwater storage dynamics in Abu Dhabi, with LPI showing slightly higher predictive accuracy. By applying these methods over a 20-year record, the research provides valuable insights into the spatial and temporal dynamics of groundwater storage in the study area. The declines in groundwater storage highlight the urgency of sustained monitoring and informed resource management. Future work should integrate remote-sensing data with field observations and hydrogeological variables to improve projections and support evidence-based water policy. The findings ultimately underscore the importance of adopting suitable management strategies to safeguard groundwater resources for long-term sustainability in the region.

Author Contributions

Conceptualization, T.M. and M.M.M.; methodology, T.M. and M.M.M.; software, T.M.; validation, T.M.; formal analysis, T.M.; investigation, M.M.M.; resources, M.M.M.; data curation, T.M.; writing—original draft preparation, T.M.; writing—review and editing, T.M. and M.M.M.; visualization, T.M.; supervision, M.M.M.; project administration, M.M.M.; funding acquisition, M.M.M. All authors have read and agreed to the published version of the manuscript.

Funding

This work was funded by the National Water and Energy Center at UAE University under project No. 12R176.

Data Availability Statement

The data are available upon reasonable request from the corresponding author (Mohamed Mohamed, E-mail: m.mohamed@uaeu.ac.ae).

Conflicts of Interest

The authors declare no conflicts of interest.

Abbreviations

The following abbreviations are used in this manuscript:
LPILocal Polynomial Interpolation
EXP-OKExponential Ordinary Kriging
GPIGlobal Polynomial Interpolation
OKOrdinary Kriging
SPH-OKSpherical Ordinary Kriging
Guass-OKGaussian Ordinary Kriging
SKSimple Ordinary Kriging
RBFRadial Basis Function
UKUniversal Kriging
CoOkCokriging
ESDAExploratory Spatial Data Analysis
SySpecific yield
RMSERoot Mean Square Error
GWLGroundwater Level

References

  1. UNESCO. The United Nations World Water Development Report 2021: Valuing Water; UNESCO: Paris, France, 2021. [Google Scholar]
  2. Khalil, K.; Khan, Q.; Mohamed, M. Selection Criteria of Best Sites for Aquifer Storage and Recovery in the Eastern District of Abu Dhabi, United Arab Emirates. Groundw. Sustain. Dev. 2022, 18, 100771. [Google Scholar] [CrossRef]
  3. Mohamed, M.M.; Parimalarenganayaki, S.; Khan, Q.; Murad, A. Review on the Use of Environmental Isotopes for Groundwater Recharge and Evaporation Studies in the GCC Countries. Groundw. Sustain. Dev. 2021, 12, 100546. [Google Scholar] [CrossRef]
  4. Sumi, T.; Kantoush, S.A.; Saber, M. Wadi Flash Floods: Challenges and Advanced Approaches for Disaster Risk Reduction; Springer Nature: Singapore, 2022. [Google Scholar]
  5. Dawoud, M.A. Groundwater Economics in Arid Regions: Abu Dhabi Emirate Case Study. In Recent Advances in Environmental Science from the Euro-Mediterranean and Surrounding Regions, Proceedings of the Euro-Mediterranean Conference for Environmental Integration, Sousse, Tunisia, 22–25 November 2017; Springer: Cham, Switzerland, 2017; pp. 611–613. [Google Scholar]
  6. Alyaarbi, Y.; Camkin, J.; Neto, S.; Wegener, P. Knowledge, Attitudes, Skills, and Aspirations of Farmers in Abu Dhabi and Western Australia on Groundwater Management: A Comparison Study. World Water Policy 2019, 5, 161–178. [Google Scholar] [CrossRef]
  7. MacDonald, A.M.; Bonsor, H.C.; Dochartaigh, B.É.Ó.; Taylor, R.G. Quantitative Maps of Groundwater Resources in Africa. Environ. Res. Lett. 2012, 7, 024009. [Google Scholar] [CrossRef]
  8. Khorrami, B.; Gunduz, O. Evaluation of the Temporal Variations of Groundwater Storage and Its Interactions with Climatic Variables Using GRACE Data and Hydrological Models: A Study from Turkey. Hydrol. Process. 2021, 35, e14076. [Google Scholar] [CrossRef]
  9. Koïta, M.; Yonli, H.F.; Soro, D.D.; Dara, A.E.; Vouillamoz, J.-M. Groundwater Storage Change Estimation Using Combination of Hydrogeophysical and Groundwater Table Fluctuation Methods in Hard Rock Aquifers. Resources 2018, 7, 5. [Google Scholar] [CrossRef]
  10. Sinha, R.; Gupta, S.; Nepal, S. Groundwater Dynamics in North Bihar Plains. Curr. Sci. 2018, 114, 2482–2493. [Google Scholar] [CrossRef]
  11. Wackernagel, H.; De Oliveira, V.; Kedem, B. Multivariate Geostatistics; Springer: Berlin/Heidelberg, Germany, 2010. [Google Scholar]
  12. Arkoc, O. Modeling of Spatiotemporal Variations of Groundwater Levels Using Different Interpolation Methods with the Aid of GIS, Case Study from Ergene Basin, Turkey. Model. Earth Syst. Environ. 2022, 8, 967–976. [Google Scholar] [CrossRef]
  13. He, L.; Chen, S.; Liang, Y.; Hou, M.; Chen, J. Infilling the Missing Values of Groundwater Level Using Time and Space Series: Case of Nantong City, East Coast of China. Earth Sci. Inform. 2020, 13, 1445–1459. [Google Scholar] [CrossRef]
  14. Nistor, M.M.; Rahardjo, H.; Satyanaga, A.; Hao, K.Z.; Xiaosheng, Q.; Sham, A.W.L. Investigation of Groundwater Table Distribution Using Borehole Piezometer Data Interpolation: Case Study of Singapore. Eng. Geol. 2020, 271, 105590. [Google Scholar] [CrossRef]
  15. Bouteraa, O.; Mebarki, A.; Bouaicha, F.; Nouaceur, Z.; Laignel, B. Groundwater Quality Assessment Using Multivariate Analysis, Geostatistical Modeling, and Water Quality Index (WQI): A Case of Study in the Boumerzoug-El Khroub Valley of Northeast Algeria. Acta Geochim. 2019, 38, 796–814. [Google Scholar] [CrossRef]
  16. Shahmohammadi-Kalalagh, S.; Taran, F. Evaluation of the Classical Statistical, Deterministic and Geostatistical Interpolation Methods for Estimating the Groundwater Level. Int. J. Energy Water Resour. 2021, 5, 33–42. [Google Scholar] [CrossRef]
  17. Ezugwu, M.O.; Atikpo, E. Spatial Dependency of Groundwater Quality in Benin City, Edo State, Nigeria Using Semi-Variogram Models. World J. Adv. Eng. Technol. Sci. 2021, 2, 29–41. [Google Scholar] [CrossRef]
  18. Yao, L.; Huo, Z.; Feng, S.; Mao, X.; Kang, S.; Chen, J.; Xu, J.; Steenhuis, T.S. Evaluation of Spatial Interpolation Methods for Groundwater Level in an Arid Inland Oasis, Northwest China. Environ. Earth Sci. 2014, 71, 1911–1924. [Google Scholar] [CrossRef]
  19. Lowot, M.; Alexander, A.C.; Mulungu, D. Assessment of Spatial Variability of Groundwater Levels in Moroto District, Uganda. Tanzan. J. Eng. Technol. 2023, 42, 1–9. [Google Scholar] [CrossRef]
  20. Antonakos, A.; Lambrakis, N. Spatial Interpolation for the Distribution of Groundwater Level in an Area of Complex Geology Using Widely Available GIS Tools. Environ. Process. 2021, 8, 993–1026. [Google Scholar] [CrossRef]
  21. Aghajari, M.; Mozayyan, M.; Mokarram, M.; Chekan, A.A. Relationship between Groundwater Quality and Distance to Fault Using Adaptive Neuro Fuzzy Inference System (ANFIS) and Geostatistical Methods (Case Study: North of Fars Province). Spat. Inf. Res. 2019, 27, 529–538. [Google Scholar] [CrossRef]
  22. Mahmoodnia, A.; Mousavi, M.; Kootenaei, F.G.; Asadi-Ghalhari, M. The Performance of Several Current Interpolation Methods for Variability of Cations in Groundwater in Esfarayen Plain, Iran: A Case Study. Avicenna J. Environ. Health Eng. 2022, 9, 75–84. [Google Scholar] [CrossRef]
  23. Dash, C.J.; Adhikary, P.P.; Lenka, J. Assessment of Groundwater Salinity Risk in Coastal Belt of Odisha Using Ordinary Kriging and Its Management. In Case Studies in Geospatial Applications to Groundwater Resources; Elsevier: Amsterdam, The Netherlands, 2023; pp. 133–150. [Google Scholar]
  24. Bhuiyan, M.A.H.; Bodrud-Doza, M.; Islam, A.R.M.T.; Rakib, M.A.; Rahman, M.S.; Ramanathan, A.L. Assessment of Groundwater Quality of Lakshimpur District of Bangladesh Using Water Quality Indices, Geostatistical Methods, and Multivariate Analysis. Environ. Earth Sci. 2016, 75, 1020. [Google Scholar] [CrossRef]
  25. Moghaddam, A.; Moteallemi, A.; Joulaei, F.; Peirovi, R. A Spatial Variation Study of Groundwater Quality Parameters in the Gonabad Plain Using Deterministic and Geostatistical Models. Desalination Water Treat. 2018, 103, 261–269. [Google Scholar] [CrossRef]
  26. Chandan, K.S.; Yashwant, B.K. Optimization of Groundwater Level Monitoring Network Using GIS-Based Geostatistical Method and Multi-Parameter Analysis: A Case Study in Wainganga Sub-Basin, India. Chin. Geogr. Sci. 2017, 27, 201–215. [Google Scholar] [CrossRef]
  27. Farzaneh, G.; Khorasani, N.; Ghodousi, J.; Panahi, M. Application of Geostatistical Models to Identify Spatial Distribution of Groundwater Quality Parameters. Environ. Sci. Pollut. Res. 2022, 29, 36512–36532. [Google Scholar] [CrossRef]
  28. Wang, S.; Huang, G.H.; Lin, Q.G.; Li, Z.; Zhang, H.; Fan, Y.R. Comparison of Interpolation Methods for Estimating Spatial Distribution of Precipitation in Ontario, Canada. Int. J. Climatol. 2014, 34, 3745–3751. [Google Scholar] [CrossRef]
  29. Bameri, A.; Khaleghi, M. Monitoring and Predicting the Groundwater-Level Fluctuations for Better Management of Groundwater Resource in Lowlands Using Geographic Information System (GIS). J. Radar Opt. Remote Sens. GIS 2021, 4, 7–15. [Google Scholar]
  30. Bodrud-Doza, M.D.; Islam, A.R.M.T.; Ahmed, F.; Das, S.; Saha, N.; Rahman, M.S. Characterization of Groundwater Quality Using Water Evaluation Indices, Multivariate Statistics and Geostatistics in Central Bangladesh. Water Sci. 2016, 30, 19–40. [Google Scholar] [CrossRef]
  31. Chin, R.J.; Lai, S.H.; Loh, W.S.; Ling, L.; Soo, E.Z.X. Assessment of Inverse Distance Weighting and Local Polynomial Interpolation for Annual Rainfall: A Case Study in Peninsular Malaysia. Eng. Proc. 2023, 38, 61. [Google Scholar]
  32. Xiao, Y.; Gu, X.; Yin, S.; Shao, J.; Cui, Y.; Zhang, Q.; Niu, Y. Geostatistical Interpolation Model Selection Based on ArcGIS and Spatio-Temporal Variability Analysis of Groundwater Level in Piedmont Plains, Northwest China. Springerplus 2016, 5, 425. [Google Scholar] [CrossRef] [PubMed]
  33. Yin, S.; Gu, X.; Xiao, Y.; Wu, W.; Pan, X.; Shao, J.; Zhang, Q. Geostatistics-Based Spatial Variation Characteristics of Groundwater Levels in a Wastewater Irrigation Area, Northern China. Water Sci. Technol. Water Supply 2017, 17, 1479–1489. [Google Scholar] [CrossRef]
  34. Pooteh Rigi, M.; Shafiee, P.; Fatehi, S.M. Assessment and Zoning of Groundwater Quality in Shiraz Plain Using GIS. Asian J. Water Environ. Pollut. 2019, 16, 87–96. [Google Scholar] [CrossRef]
  35. Katipoğlu, O.M.; Acar, R. Space-Time Variations of Hydrological Drought Severities and Trends in the Semi-Arid Euphrates Basin, Turkey. Stoch. Environ. Res. Risk Assess. 2022, 36, 4017–4040. [Google Scholar] [CrossRef]
  36. Salehi, S.; Barati, R.; Baghani, M.; Sakhdari, S. Interpolation methods for spatial distribution of groundwater mapping electrical conductivity. Sci. Rep. 2024, 14, 11528. [Google Scholar] [CrossRef] [PubMed]
  37. Borzì, I. Modeling Groundwater in Data-Scarce Environments: A Systematic Review of Approaches, Challenges, and Future Directions. Hydrology 2025, 12, 11. [Google Scholar] [CrossRef]
  38. Al Blooshi, L.S.; Ksiksi, T.S.; Aboelenein, M.; Gargoum, A.S. The Impact of Climate Change on Agricultural and Livestock Production and Groundwater Characteristics in Abu Dhabi, UAE. Nat. Environ. Pollut. Technol. 2020, 19, 1945–1956. [Google Scholar] [CrossRef]
  39. Mohamed, M.M.A.; Saleh, N.E.; Sherif, M.M. Modeling in Situ Benzene Bioremediation in the Contaminated Liwa Aquifer (UAE) Using the Slow-Release Oxygen Source Technique. Environ. Earth Sci. 2010, 61, 1385–1399. [Google Scholar] [CrossRef]
  40. Mohamed, M.M.; El-Shorbagy, W.; Kizhisseri, M.I.; Chowdhury, R.; McDonald, A. Evaluation of policy scenarios for water resources planning and management in an arid region. J. Hydrol. Reg. Stud. 2020, 32, 100758. [Google Scholar] [CrossRef]
  41. Parvin, M.; Tadakuma, N.; Asaue, H.; Koike, K. Characterizing the Regional Pattern and Temporal Change of Groundwater Levels by Analyses of a Well Log Data Set. Front. Earth Sci. 2011, 5, 294–304. [Google Scholar] [CrossRef]
  42. Al-Mamoori, S.K.; Al-Maliki, L.A.; Al-Sulttani, A.H.; El-Tawil, K.; Al-Ansari, N. Statistical Analysis of the Best GIS Interpolation Method for Bearing Capacity Estimation in An-Najaf City, Iraq. Environ. Earth Sci. 2021, 80, 683. [Google Scholar] [CrossRef]
  43. Ohmer, M.; Liesch, T.; Goeppert, N.; Goldscheider, N. On the Optimal Selection of Interpolation Methods for Groundwater Contouring: An Example of Propagation of Uncertainty Regarding Inter-Aquifer Exchange. Adv. Water Resour. 2017, 109, 121–132. [Google Scholar] [CrossRef]
  44. Isaaks, E.H.; Srivastava, R.M. An Introduction to Applied Geostatistics; Oxford University Press: New York, NY, USA, 1989. [Google Scholar]
  45. Sunila, R.; Kollo, K. A Comparison of Geostatistics and Fuzzy Application for Digital Elevation Model. Int. Arch. Photogramm. Remote Sens. Spat. Inf. Sci. 2007, 36. Available online: https://www.researchgate.net/publication/253685839_A_COMPARISON_OF_GEOSTATISTICS_AND_FUZZY_APPLICATION_FOR_DIGITAL_ELEVATION_MODEL (accessed on 8 July 2025).
  46. Yarus, J.M.; Chambers, R.L. Stochastic Modeling and Geostatistics; AAPG: Tulsa, OK, USA, 1994; Volume 231. [Google Scholar]
  47. Tanjung, M.; Syahreza, S.; Rusdi, M. Comparison of Interpolation Methods Based on Geographic Information System (GIS) in the Spatial Distribution of Seawater Intrusion. J. Nat. 2020, 20, 24–30. [Google Scholar] [CrossRef]
  48. Uyan, M.; Cay, T. Spatial Analyses of Groundwater Level Differences Using Geostatistical Modeling. Environ. Ecol. Stat. 2013, 20, 633–646. [Google Scholar] [CrossRef]
  49. Rasel, H.M.; Alam, S.; Hasnat, A.; Hossain, I.; Hasan, M.; Ahsan, A. Geospatial Analysis of Groundwater Level Variations Using Kriging Method. J. Eng. Appl. Sci. 2019, 3, 21–34. [Google Scholar]
  50. Singh, P.; Verma, P. A Comparative Study of Spatial Interpolation Technique (IDW and Kriging) for Determining Groundwater Quality. In GIS and Geostatistical Techniques for Groundwater Science; Elsevier: Amsterdam, The Netherlands, 2019; pp. 43–56. [Google Scholar] [CrossRef]
  51. Alghafli, K.; Shi, X.; Sloan, W.; Shamsudduha, M.; Tang, Q.; Sefelnasr, A.; Ebraheem, A.A. Groundwater Recharge Estimation Using In-Situ and GRACE Observations in the Eastern Region of the United Arab Emirates. Sci. Total Environ. 2023, 867, 161489. [Google Scholar] [CrossRef]
  52. Todd, D.K.; Mays, L.W. Groundwater Hydrology; John Wiley & Sons: Hoboken, NJ, USA, 2004; ISBN 0471059374. [Google Scholar]
  53. Sathish, S.; Mohamed, M.M. Assessment of Aquifer Storage and Recovery (ASR) Feasibility at Selected Sites in the Emirate of Abu Dhabi, UAE. Environ. Earth Sci. 2018, 77, 112. [Google Scholar] [CrossRef]
  54. Khalil, K.; Khan, Q.; Mohamed, M. Modeling Aquifer Storage and Recovery in the Eastern District of the United Arab Emirates Using MODFLOW. Sci. Rep. 2022, 12, 17537. [Google Scholar] [CrossRef] [PubMed]
  55. Obroślak, R.; Dorozhynskyy, O. Selection of a Semivariogram Model in the Study of Spatial Distribution of Soil Moisture. J. Water Land Dev. 2017, 35, 161–166. [Google Scholar] [CrossRef]
  56. David, C.-G.; Diana, E.M.; Germán, T.; David, B.; Laurent, P.; Eulogio, J.B. Spatial Distribution of N-Cycling Microbial Communities Showed Complex Patterns in Constructed Wetland Sediments. FEMS Microbiol. Ecol. 2013, 83, 340–351. [Google Scholar]
  57. Khan, Q.; Kalbus, E.; Alshamsi, D.M.; Mohamed, M.M.; Liaqat, M.U. Hydrochemical analysis of groundwater in Remah and Al Khatim regions, United Arab Emirates. Hydrology 2019, 6, 60. [Google Scholar] [CrossRef]
  58. Liaqat, M.U.; Mohamed, M.M.; Chowdhury, R.; Elmahdy, S.I.; Khan, Q.; Ansari, R. Impact of land use/land cover changes on groundwater resources in Al Ain region of the United Arab Emirates using remote sensing and GIS techniques. Groundw. Sustain. Dev. 2021, 14, 100587. [Google Scholar] [CrossRef]
  59. Khan, Q.; Liaqat, M.U.; Mohamed, M.M. A comparative assessment of modeling groundwater vulnerability using DRASTIC method from GIS and a novel classification method using machine learning classifiers. Geocart. Int. 2021, 37, 5832–5850. [Google Scholar] [CrossRef]
  60. Elmahdy, S.I.; Marghany, M.M.; Mohamed, M.M. Application of a weighted spatial probability model in GIS to analyze landslides in Penang Island, Malaysia. Geomat. Nat. Hazards Risk 2013, 7, 345–359. [Google Scholar] [CrossRef]
Figure 1. Study area and wells distribution, extracted by ArcGIS. Red area is the study area and green dots are the wells’ locations.
Water 17 03078 g001
Figure 2. Comparison of (a) EXP-OK and (b) LPI cross-validation performance, using ArcGIS feature. The x and y coordinates show the measured and predicted groundwater levels.
Water 17 03078 g002
Figure 3. The distribution of the groundwater level differences by: (a) Exponential Ordinary Kriging Interpolation (EXP-OK) model and (b) Local Polynomial Interpolation (LPI) model.
Water 17 03078 g003
Figure 4. Time series for the averages of groundwater levels from 2002 to 2022.
Water 17 03078 g004
Figure 5. Semivariogram of spatial autocorrelation structure of groundwater levels using: (a) Exponential Ordinary Kriging model (EXP-OK; (b)) Local Polynomial Interpolation (LPI) model.
Water 17 03078 g005
Figure 6. Interpolated map of the groundwater level difference between 2002 and 2022 utilizing: (a) Exponential Ordinary Kriging Interpolation (EXP-OK) model and (b) Local Polynomial Interpolation (LPI) model.
Water 17 03078 g006aWater 17 03078 g006b
Figure 7. The standardized error maps of the groundwater level difference between 2002 and 2022 utilizing: (a) Exponential Ordinary Kriging Interpolation (EXP-OK) model and (b) Local Polynomial Interpolation (LPI) model.
Water 17 03078 g007
Table 1. Summary of best-fit interpolation models for estimating groundwater levels in previous studies.
StudyGPILPIIDWOK-SPHEXP-OKOK-GAUSSSKRBFUKCoOk
Arkoc [12] Water 17 03078 i001
He et al. [13] Water 17 03078 i001
Nistor et al. [14] Water 17 03078 i001
Bouteraa et al. [15] Water 17 03078 i001
Shahmohammadi-Kalalagh and Taran [16] Water 17 03078 i001
Ezugwu and Atikpo [17] Water 17 03078 i001
Yao et al. [18]Water 17 03078 i001
Lowot et al. [19] Water 17 03078 i001
Antonakos and Lambraki [20] Water 17 03078 i001
Aghajari et al. [21] Water 17 03078 i001
Mahmoodnia et al. [22]Water 17 03078 i001
Dash et al. [23] Water 17 03078 i001
Bhuiyan et al. [24] Water 17 03078 i001
Moteallemi et al. [25] Water 17 03078 i001
Chandan and Yashwant [26] Water 17 03078 i001
Farzaneh et al. [27] Water 17 03078 i001
Wang et al. [28] Water 17 03078 i001
Bameri and Khaleghi [29] Water 17 03078 i001
Bodrud-Doza et al. [30] Water 17 03078 i001
Chin et al. [31] Water 17 03078 i001
Xiao et al. [32] Water 17 03078 i001
Yin et al. [33] Water 17 03078 i001
Pooteh et al. [34] Water 17 03078 i001
Katipoğlu and Acar [35] Water 17 03078 i001 Water 17 03078 i001
Salehi et al. [36] Water 17 03078 i001
Borzì [37] Water 17 03078 i001
Table 2. Descriptive statistics of GWL difference applied by EXP-OK and LPI modules.
StatisticsEXP-OK
GWL Difference (m)
LPI
GWL Difference (m)
Minimum−30.773−29.107
Maximum35.56641.915
Mean3.2817.467
Standard deviation9.68611.904
Skewness0.2680.071
Kurtosis1.1510.383
Median2.4897.552
Range66.33971.022
Interquartile range11.75015.597
Table 3. The change in groundwater storage (ΔS), along with the water level fluctuation (∆h) and the specific yield (Sy) values for 2002–2022.
Yearh h S y s m i n s m a x
200243.47−6.600.01–0.32−0.066−2.112
202236.87
Disclaimer/Publisher’s Note: The statements, opinions and data contained in all publications are solely those of the individual author(s) and contributor(s) and not of MDPI and/or the editor(s). MDPI and/or the editor(s) disclaim responsibility for any injury to people or property resulting from any ideas, methods, instructions or products referred to in the content.