Article

Response of Preferential Flow to Initial Soil Water Content in Coalmining Subsidence Zones Along the Middle Reaches of the Yellow River, China

1
School of Economics and Management, Nanchang Institute of Science & Technology, Nanchang 330013, China
2
School of Water Resources and Environmental Engineering, East China University of Technology, Nanchang 330013, China
3
Jiangxi Provincial Key Laboratory of Genesis and Remediation of Groundwater Pollution, Nanchang 330013, China
*
Author to whom correspondence should be addressed.
Water 2025, 17(17), 2606; https://doi.org/10.3390/w17172606
Submission received: 28 April 2025 / Revised: 1 June 2025 / Accepted: 24 July 2025 / Published: 3 September 2025
(This article belongs to the Special Issue Advance in Groundwater in Arid Areas)

Abstract

Preferential flow in coal mining subsidence areas leads to shallow soil moisture loss, vegetation reducing and ecological degradation. However, the factors influencing the development of preferential flow remain unclear. This study analyzed the morphological characteristics of preferential flow using a staining tracer test in coal mining subsidence areas along the middle reaches of the Yellow River Basin. Characteristic parameters including the dye-stained area ratio, preferential flow ratio, length index, variation coefficient were comparatively evaluated under different initial soil moisture conditions. Results showed that shallow soils exhibited substrate flow, while preferential flow occurred in deeper soil layers below the matrix flow. As initial soil moisture increased, the extent of both substrate flow and preferential flow decreased. The dye-stained area ratio declined with increasing soil depth, and the relationship between dye-stained area and soil layer depth was best described by a cubic function. Higher initial soil moisture reduced maximum infiltration depth and length indices while increasing the coefficient of the stained pattern. Furthermore, a higher of initial soil water content corresponded to a lower preferential flow index. Overall, increased initial soil moisture may reduce the extent of preferential flow and the rapid infiltration of water into soil. These findings provides a basis for further hydrological studies in coal mining subsidence areas in arid and semi-arid regions and offer scientific support for ecological restoration efforts in mining areas.

1. Introduction

Preferential flow refers to the movement of water in the soil along preferential pathways, bypassing the soil matrix and rapidly reaching deeper layers [1,2]. It is a common phenomenon in hydrology that can significantly influence nutrient transport [3], the residence time of water and pollutants [4], stormflow generation [5], and groundwater recharge [6,7]. At the same time, preferential flow can contribute to natural hazards such as mudslides, landslides and avalanches [8].
Coal is a key fossil fuel and plays an important role in the world economy [9]. China is the world’s largest producer and consumer of coal. The Yellow River Basin, located in China’s coal rich region, has accounting for more than 40% of China’s total coal production over the years [10]. This area lies in arid and semi-arid inland China, characterized by low annual precipitation, high evaporation, and sparse vegetation. Large scale mining of shallow and thick coal seams mining has resulted in extensive surface cracks caused by subsidence [11]. These cracks form when soil pressure exceeds its breaking point during coal extraction [12]. The surface cracks are the most common type of soil damage in coal mining areas. They create preferential channels for water movement, alter rainfall infiltration, increase infiltration rates [13], cause the loss of surface soil moisture, reduce vegetation cover, and lead to land degradation [14,15,16]. Therefore, it is essential to study preferential flow in coal mining subsidence areas to provide scientific support for land rehabilitation and eco-logical management in mining regions.
Previous studies have shown that preferential flow is controlled by multiple factors, such as soil hydrophobicity, plant roots, clays swelling and shrinking, and soil fauna burrows [17]. Hydrological factors including total precipitation, precipitation intensity, and initial soil water content also play an important role [18]. For example, Liu and Lin [19] emphasized the significant impact of precipitation features, including total precipitation, precipitation duration and initial soil water content. Demand et al. [20] highlighted the impact of precipitation intensity, while Hu et al. [21] found that preferential flow occurrence increased with higher initial soil moisture. Xu et al. [22] reported no clear relationship between preferential flow and initial soil moisture. Similarly, Demand et al. [19] observed that low initial soil moisture promoted preferential flow in forests and grassland, whereas Wiekenkamp et al. [3] found no connection between preferential flow frequency and initial soil water content. These discrepancies illustrate the complexity of preferential flow processes. To date, the influence of initial soil water content on preferential flow in coal mining subsidence areas had rarely been reported. This study addresses this gap by extending the research coal mining subsidence zones, offering valuable insights into the role of preferential flow in subsurface hydrological processes.
Various methods are available to study preferential flow, including image analysis, dye tracer experiments, and soil physical measurements [23]. Among these, dye tracer are the most widely used under different conditions such as soil drying out, plant root growth, burrowing animal activity, groundwater subduction, karst collapse, and ground subsidence [24] due to their ability to visually and quantitatively characterize preferential flow. As such, dye tracing has become one of the most common techniques for investigating preferential flow [25].
In this study, we investigated the effect of initial soil moisture on preferential flow in coal mining subsidence areas using dye tracer experiments. The objectives were to: (1) clarify the influence of initial soil water content on preferential flow characteristics; (2) quantify differences in preferential flow parameters under varying initial soil water moisture content conditions; and (3) evaluate the relationship between different initial soil water content and the preferential flow development in coal mining subsidence areas. The findings of this study provide valuable insights into significance of preferential flow in subsurface hydrologic processes in coal mining areas, and offer fundamental support for groundwater transport research in these regions.

2. Materials and Methods

2.1. Study Area

The experimental location was located in a coal mine subsidence area along the mid dle reaches of the Yellow River (Figure 1), in the northern part of the Loess Plateau and at the southeastern edge of the Mao Wusu Desert. The soil is predominantly sandy, and the landform is characterized by wind-blown sand. The mine subsidence area is sparsely vegetated, and features gullies and valleys [26]. The coal mine, where the subsidence is located, started production in 2003 [27] and has a well-field area of 64.21 km2. It contains shallow coal seams, thin bedrock above the coal seams, and thick loose layers. Underground coal mining, has caused the overlying rock strata to collapse, resulting in surface cracks. After years of coal mining, extensive subsidence areas and surface cracks have developed.

2.2. Field Stain Tracing Experimental Design

The 50 m × 50 m sampling plot was established in the coal mining subsidence zone along middle reaches of Yellow River. Experiments were carried out from 13 to 25 July 2023. Brilliant blue dye was selected as the colorant. Cracks with a width of 3 cm were the most common and representative within the sampling plot. To minimize the influence of variations in crack characteristics, the four experiment sites were selected along the same crack. To ensure that the experiment sites did not interfere with each other, a 37 cm segment of the crack was chosen within the experimental plot. The experimental sites were labeled as test point 0, test point 1, test point 2, and test point 3.
Before the experiments, weeds on the surface layer were carefully eliminated. A square steel frame with a side length of 60 cm × 60 cm and a height of 30 cm was inserted vertically into the soil to a depth of 20 cm, and the surrounding soil was compacted to prevent preferential flow [28]. For each experiment site, Brilliant blue solution with a concentration of 5 g L−1 was prepared. The detailed experimental design is shown in Table 1. Tap water volumes of 0 L, 5 L, 10 L, and 15 L were evenly sprinkled to the four sites. After 24 h, 22.5 L of Brilliant blue solution was sprinkled uniformly to the soil surface over 30 min. The steel frame was then covered with a plastic film to prevent evaporation.
After 24 h, vertical soil profiles at a depth of 0–10 cm were excavated along a direction perpendicular to the crack, at 10 cm intervals, resulting in 6 vertical profiles named section A, section B, section C, section D, section E, and section F. Sequential vertical profile were excavated at 0–10 cm depth, followed by careful trimming of a horizontal profile at the same depth 10 cm depth. Horizontal soil profiles were excavated from the surface layer at 10 cm intervals. Vertical and horizontal profiles were excavated alternately and photographed. The profiles were prepared to be as flat and smooth as possible to prevent to avoid shadows caused by surface roughness, which could interfere with the calculation of the stained area. The vertical profile were aligned perpendicular to the horizontal profile to prevent the image deformation. Photographs were taken with the camera lens positioned vertically over the center of each the profile to minimize distortion (Figure 2).

2.3. Soil Texture and Structure Determination

During excavating profiles, soil samples were collected from both stained and unstained areas at depths of 0–10 cm, and 10–20 cm, continuing down to the maximum staining depth. The collected soil samples were placed in aluminum boxes and sealed, stored in an insulated container, and transported to the laboratory. Soil water content was determined using the drying method. Soil particle size distribution was tested with a laser particle size analyzer. Soil bulk density (g.cm−3) was analyzed using ring knife method, and soil porosity (%) was calculated from soil particle density and bulk density following the procedure described by Jiang et al. [29]. In this study, the soil particle density was taken as the common value of 2.65 g.cm−3 [30].

2.4. Imaging Process

Vertical profiles were excavated in 10 cm layer, requiring the splicing of images from different depths within the same profiles. When photographs were taken, the geometric deviations occurred due to various factors; these were corrected using the geometric correction function of Adobe Photoshop 2020. Each vertical profiles were cropped according to the staining depth at the corresponding experiment site. Contrast, color gradation, brightness, saturation, and shadows were adjusted using the Camera Raw features. The images were then converted to grayscale using image to mode, then mode to grayscale. The processed black and white images in GIF format were imported into Image Pro Plus 6.0 for pixel analysis. In this step, black pixels were assigned a value of 255 and white pixels a value of 0, creating a dataset containing only these two values. The number of staining paths was determined by counting the total number of black pixels [31].

2.5. Characteristic Parameters of Preferential Flow

Dyeing area percentage (DC, %) is proportion of the black pixels number to the total pixels number in the image [32].
D C = D D + N D × 100 %
where D C represents the soil section stained area percentage (%); D is the total soil profile dyeing area (cm2); and ND is the soil profile unstained area (cm2).
Preferential flow percentage (PF-fr, %) indicates proportion of preferential flow dye-stained area to total stained area in the vertical staining profile [33].
P F f r = ( 1 U n i F r × W T S A ) × 100 %
where PF-fr represents preferential flow percentage (%), UniFr represents matrix flow depth (cm), W represents horizontal staining width of section, TSA is vertical profile total stained area (cm2).
Length index (Li, %) is the sum of the absolute value in stained zone between the soil section and the previous soil section of vertical stained profile [34].
L i = i = 1 n | D C i + 1 D C i |
where D C i (%) and D C i + 1 (%) respectively is the dyeing ration corresponding to layer i and layer i + 1 in the soil slice binary plot, where n represents the number of soil slices.
Coefficient of dye-stained area variation (CV) is the level of variation in soil staining at different depths [23].
C V = 1 n 1 i = 1 n D C i D C 0 2 1 n i = 1 n D C i
where n is the number of soil slices, DCi represents the dye-stained area ratio of the soil slice at depth i (%), DC0 is the mean o the dye-stained area ratio of the soil slice at 0 (%).

2.6. Preferential Flow Evaluation Methodology

Dimensionless normalization of preferential flow parameterization use the polarimetric method [35].
Z i j ( p o s i t i v e v a l u e ) = X i X m i n X m a x X m i n
Z i j ( n e g a t i v e v a l u e ) = X m a x X i X m a x X m i n
where Zij is standardized value of priority flow parameter, Xi represents measured value of item i, Xmax is measured maximum value, Xmin is measured minimum value.
Mean value of the random variable ( E G j ) is calculated as follows:
E G j = 1 n i = 1 n Z i j
Mean square deviation θ G j of G is calculated as follows:
θ G j = 1 n i = 1 n ( Z i j E G j ) 2
Weighting factor W G j of G j is calculated by the following equation:
W G j = G j i = 1 m G j
Multi-indicator decision and ranking is as follows:
D i ( W ) = j = 1 m Z i j W ( G j )

3. Result

3.1. Cracks Effect on Soil Texture and Structure

The soil texture and structure parametric for stained and unstained areas at the four experiment sites are showed in Table 2. The soil particle size showed no significant change, and was predominantly sandy. Both volumetric water content and soil porosity were higher in stained regions than that in non-stained areas, indicating that the soil structure in stained region areas became looser. Volumetric water content ranged from 4.23–9.92% in the stained region, and from 1.83–7.96% in the non-stained areas. Soil capacity showed no significant change between the two regions.

3.2. Preferential Flow Pattern

3.2.1. Preferential Flow Pattern in Vertical Profile

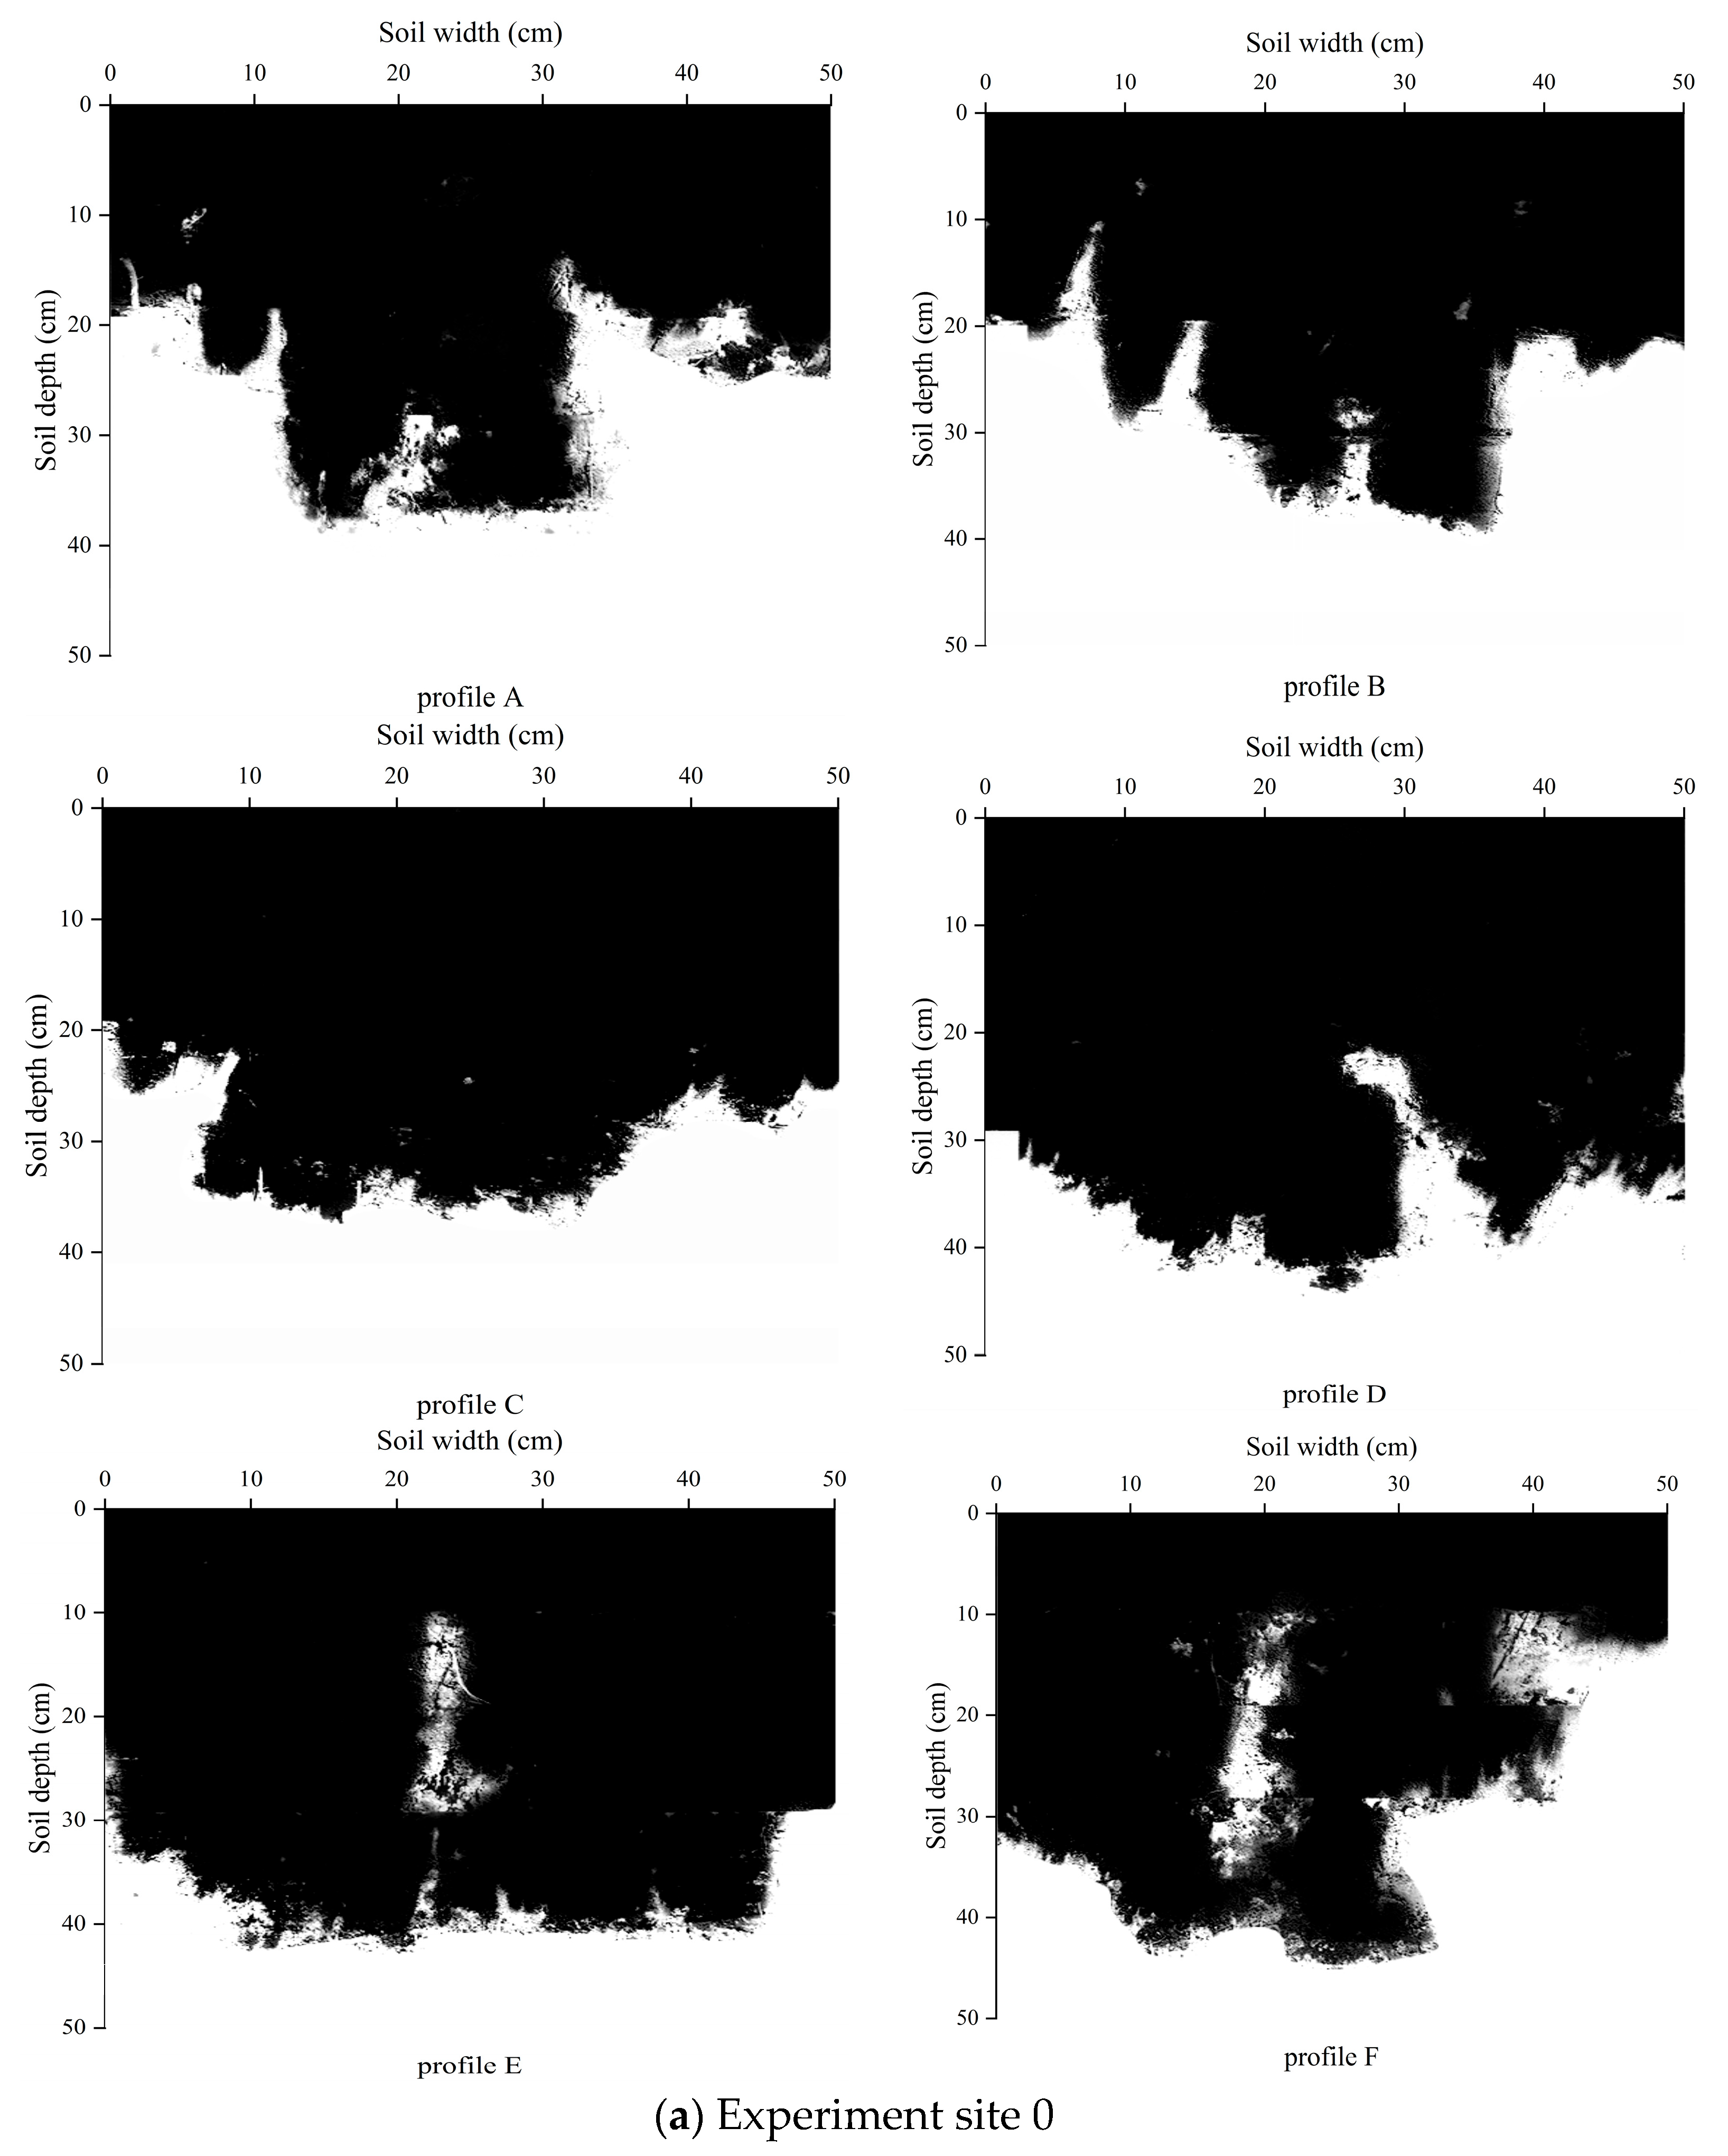
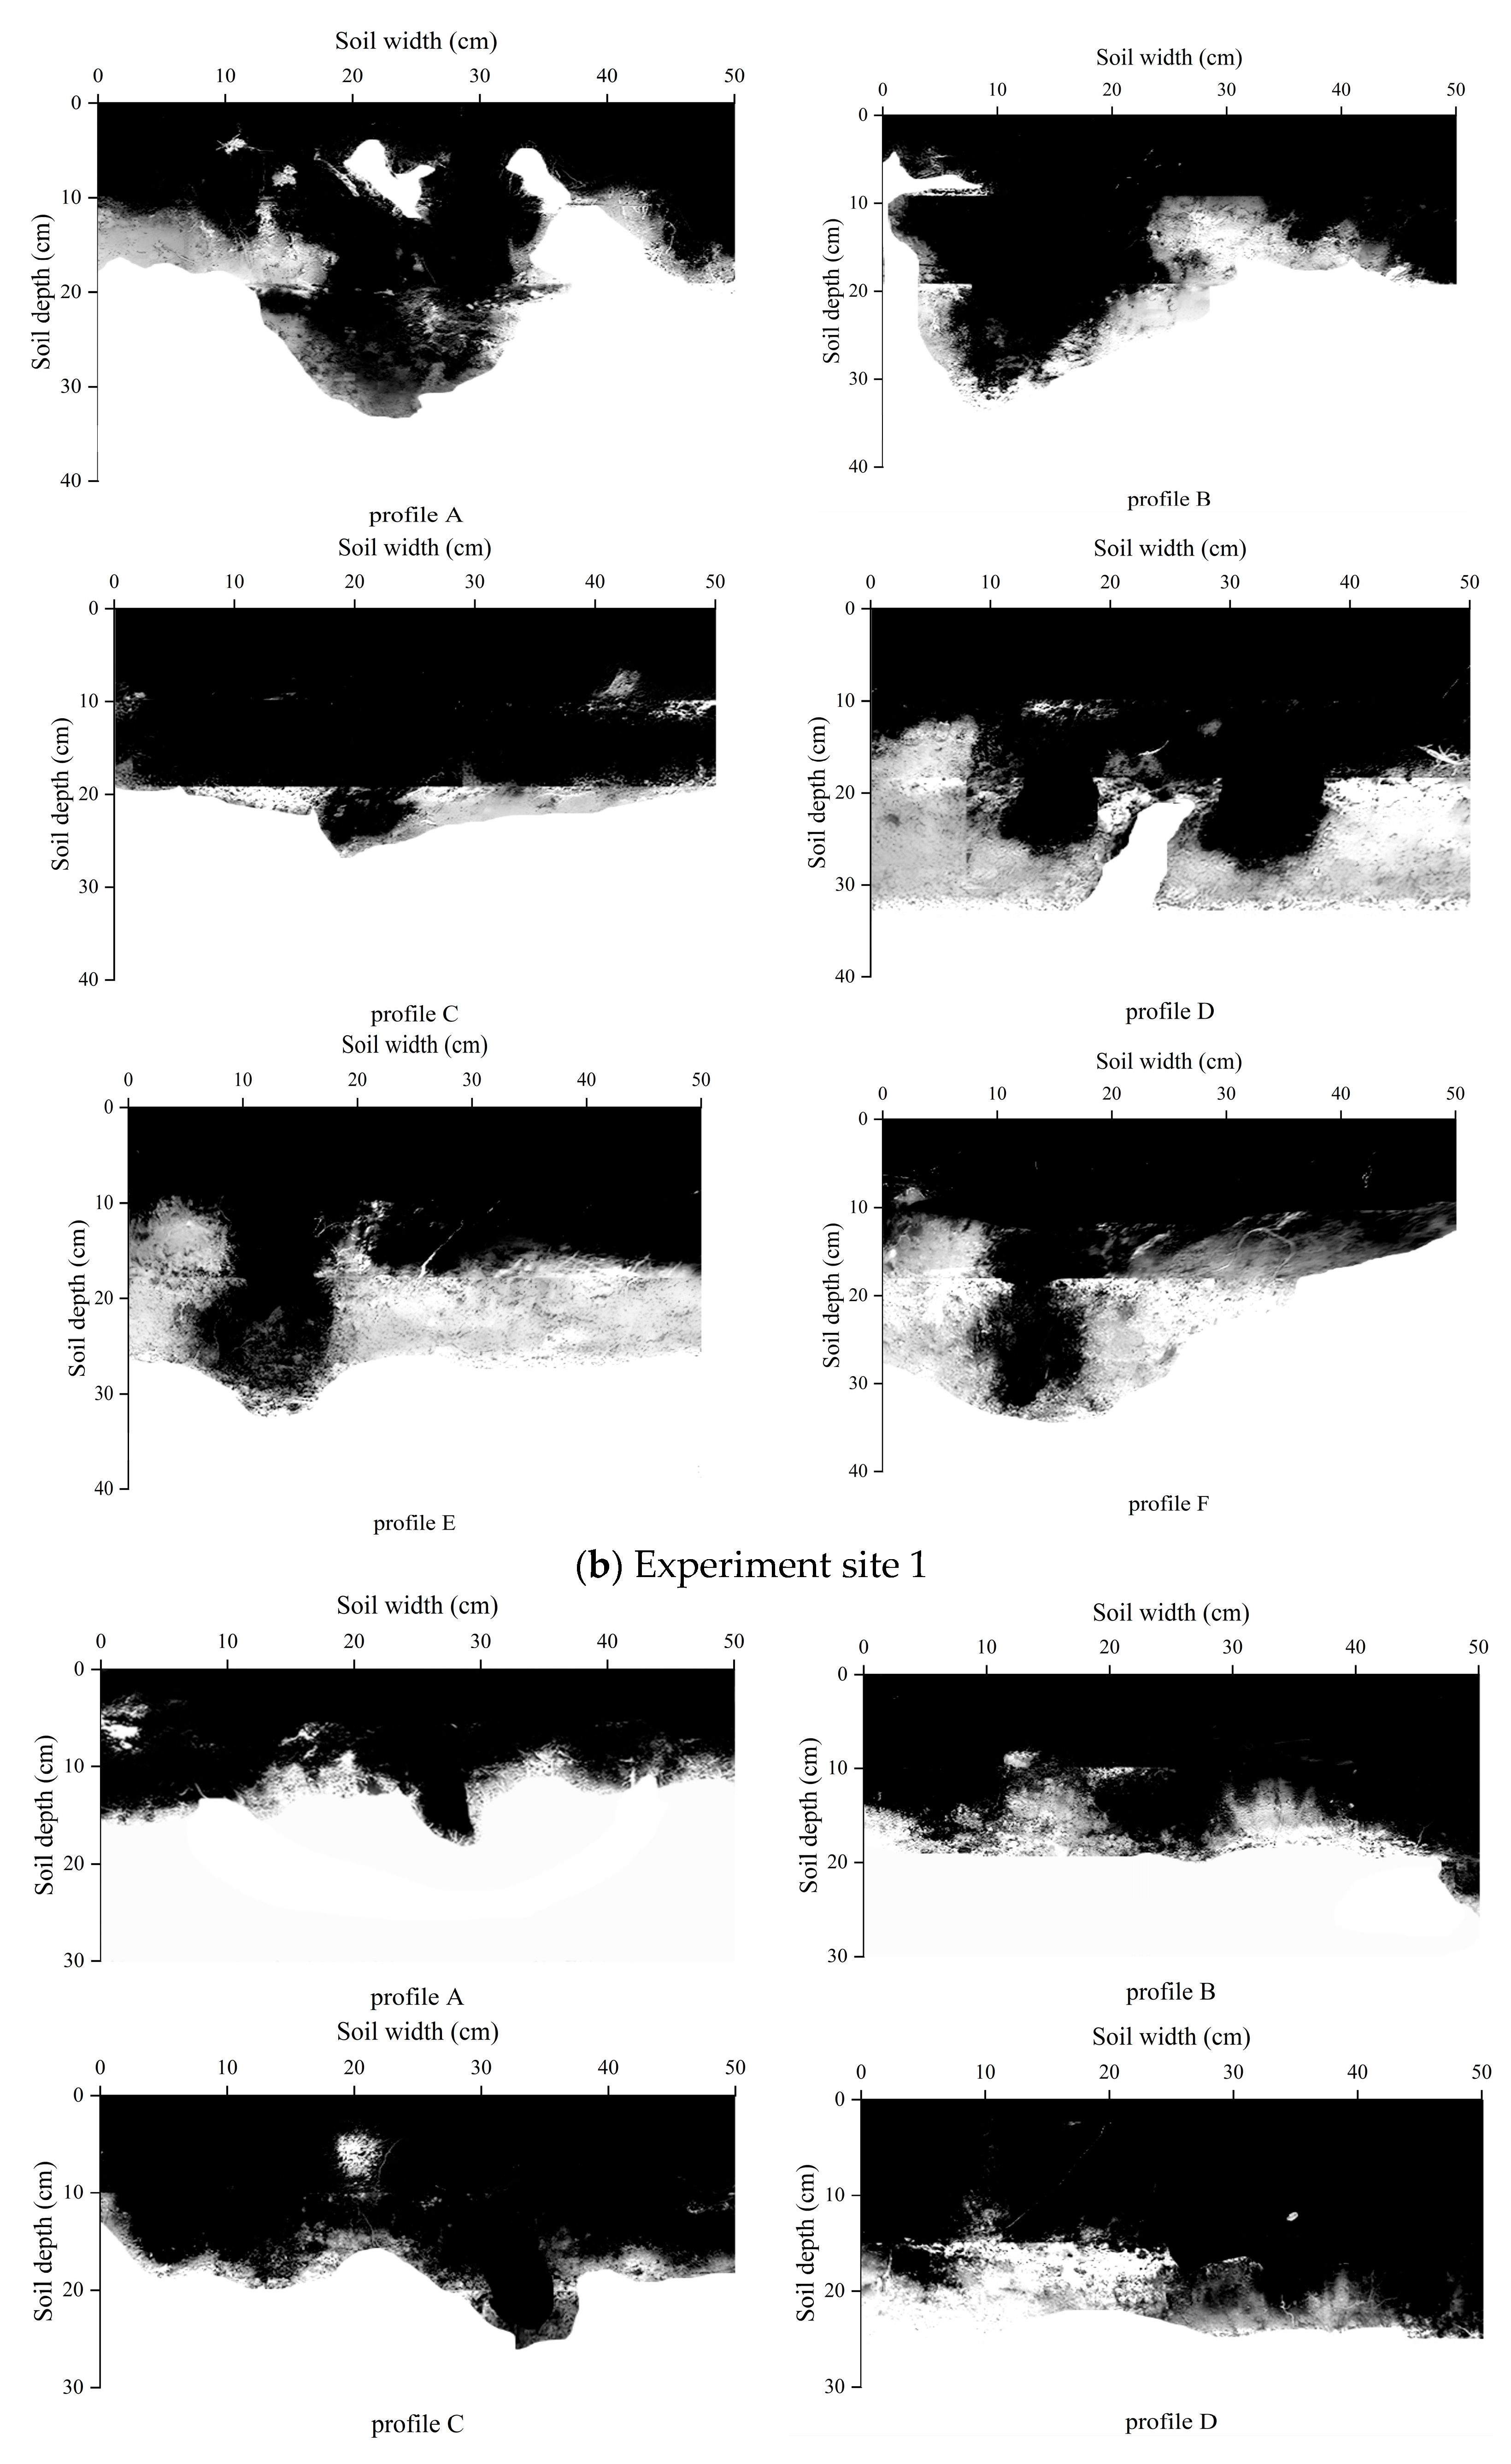
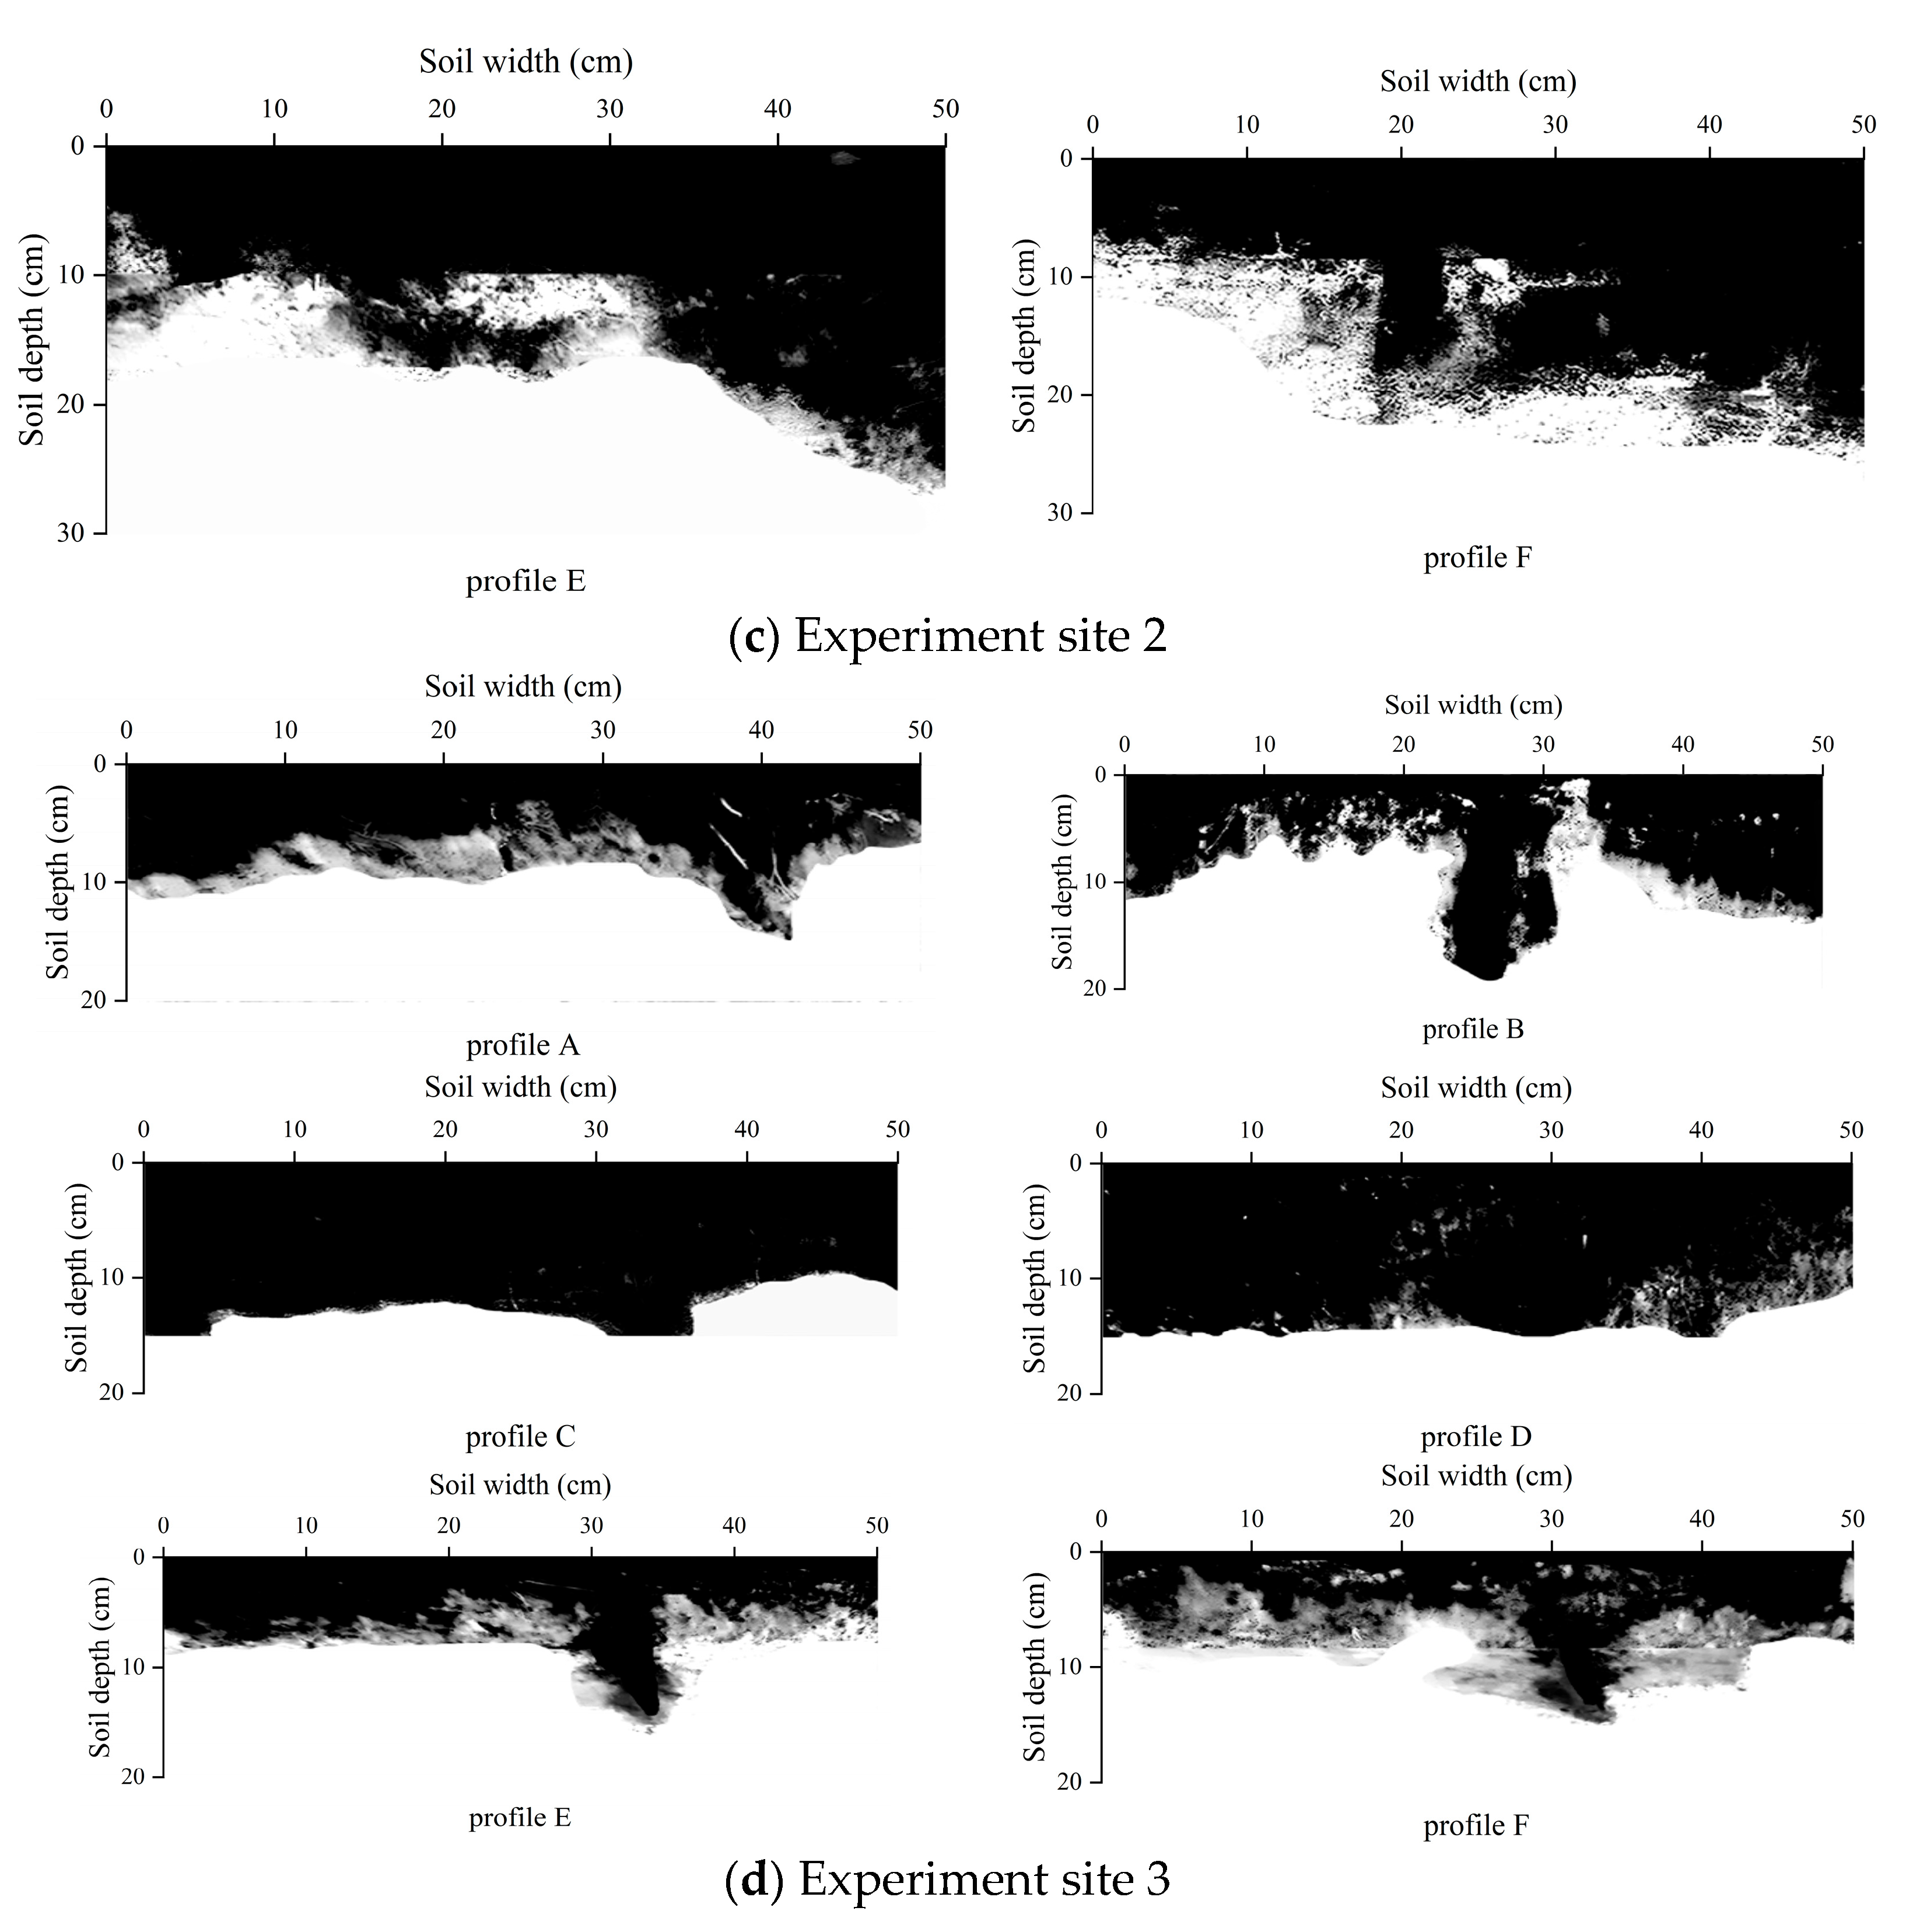
The black and white binary image of stained profiles clearly reflect the morphological characteristics of soil staining. The stained vertical profile from the four experiment sites are shown in Figure 3. These images reveal that soil water infiltration appeared obvious preferential flow. The depth range of substrate flow at test site 0, test site 1, test site 2, and test site 3 was 0–20 cm, 0–12 cm, 0–9 cm, and 0–5 cm below the surface, respectively. The deepest occurrence of preferential flow was observed at 44.3 cm below the surface in profile D at experiment site 0; 33.9 cm below the surface in profile F at experiment site 1; 26.0 cm below the surface in profile E at experiment site 2; 19.2 cm below the surface in profile B at experiment site 3.
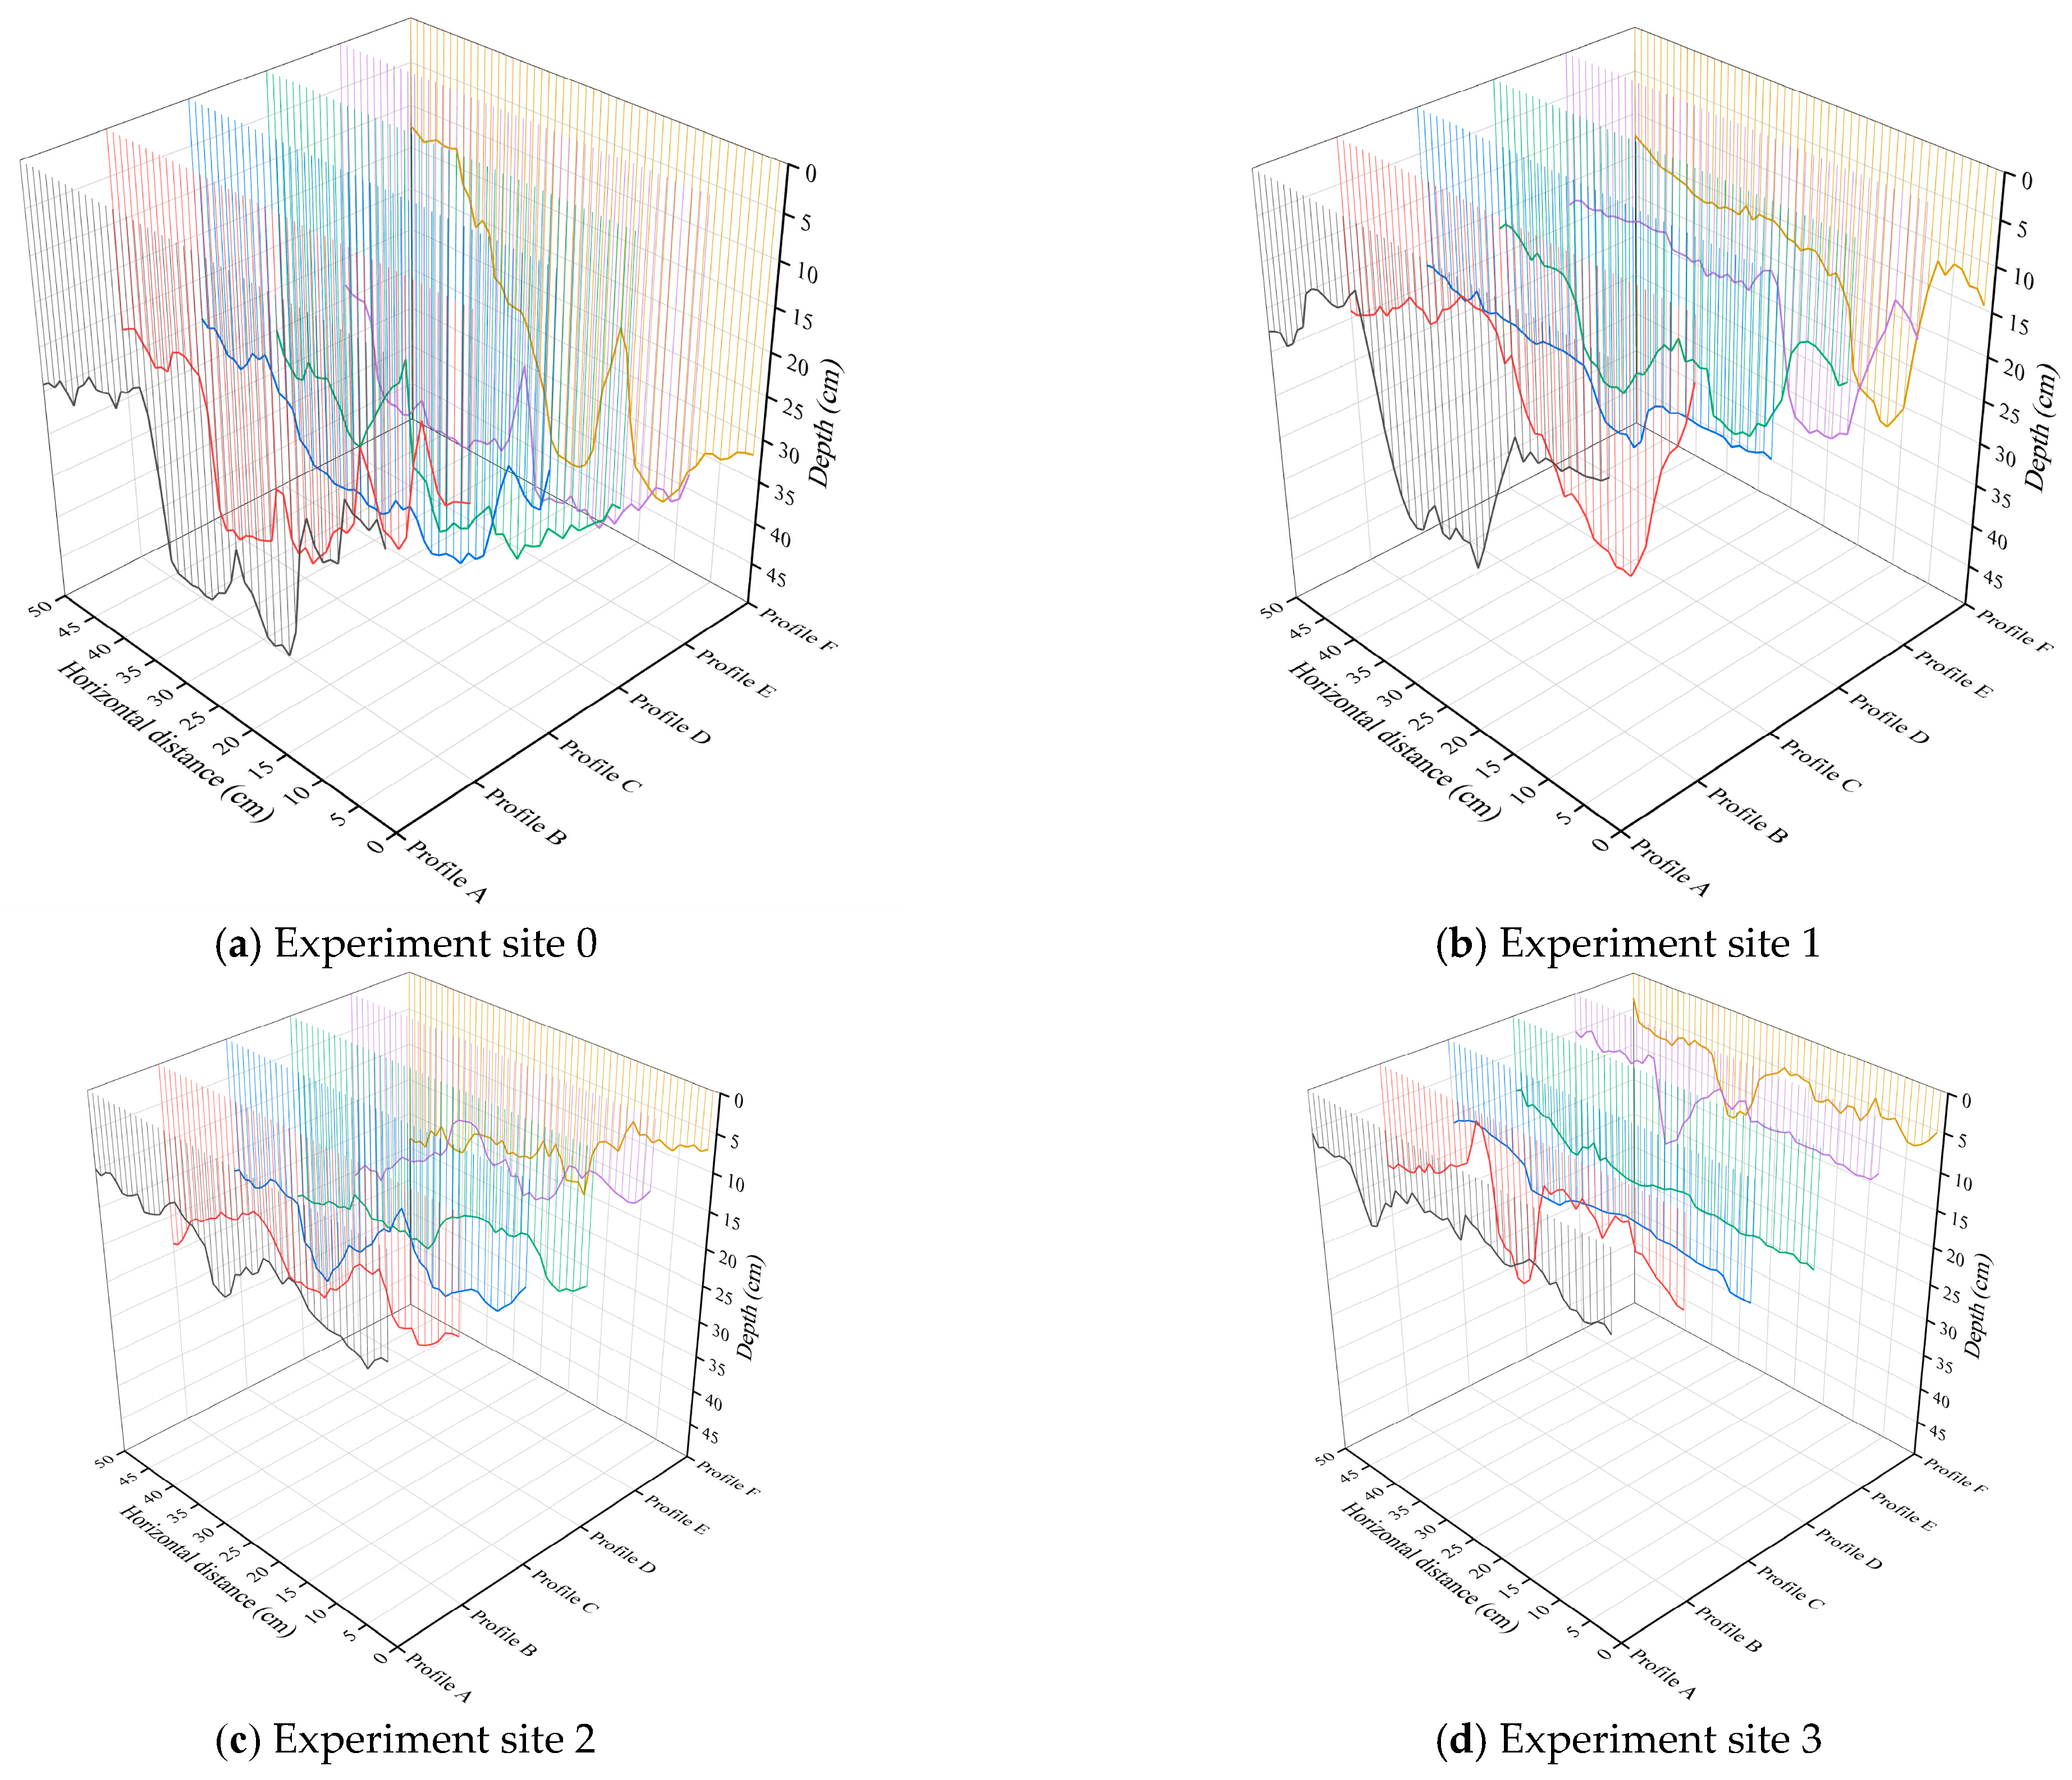
When comparing preferential flow characteristics under four initial soil water content, it was found that the lower initial soil water content led to deeper substrate flow and more pronounced preferential flow development. For cracks of the same width (3 cm), differences in the crack morphology and orientation caused spatial heterogeneity in staining paths and noticeable variation in staining patterns both among experimental sites and between profiles at the same experiment site. The profiles with the deepest preferential flow differed across the sites; profile D at site 0, profile F at site 1, profile E at site 2, and profile B at site 3 (Figure 4). This variation was mainly related to the differences in the direction and morphology of the cracks below the surface at each experiment site.

3.2.2. Preferential Flow Patterns in Horizontal Profile

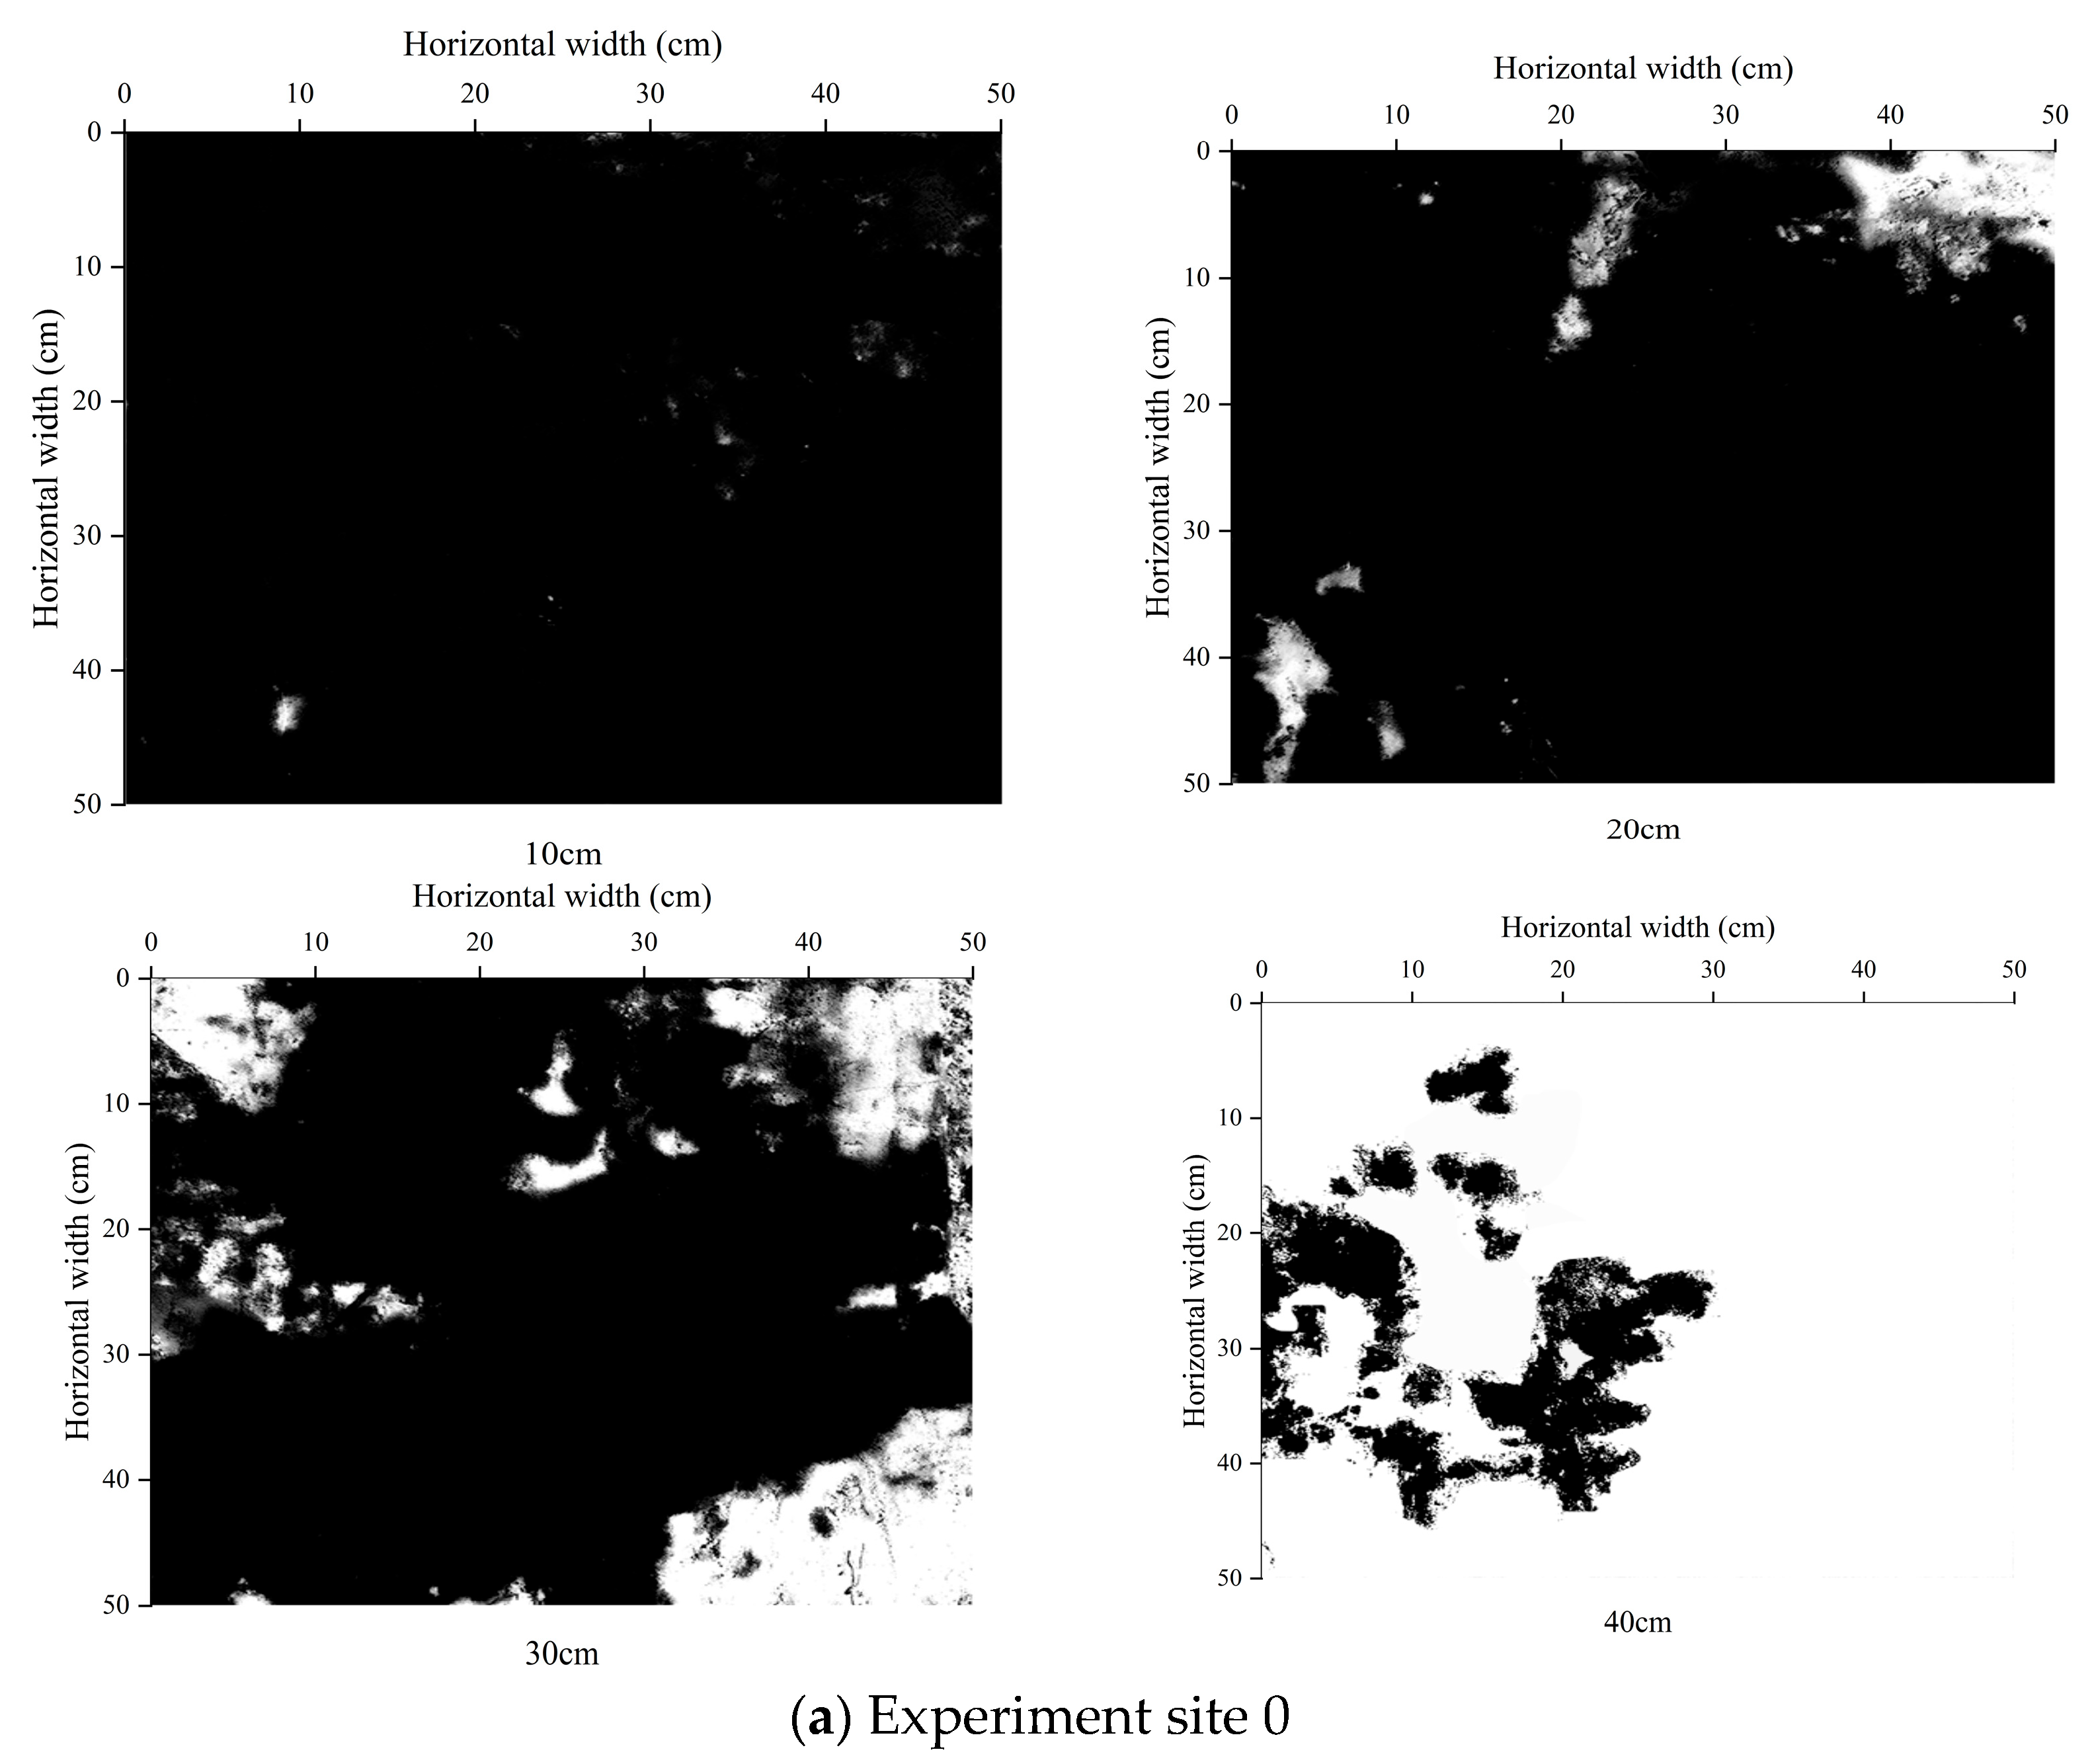
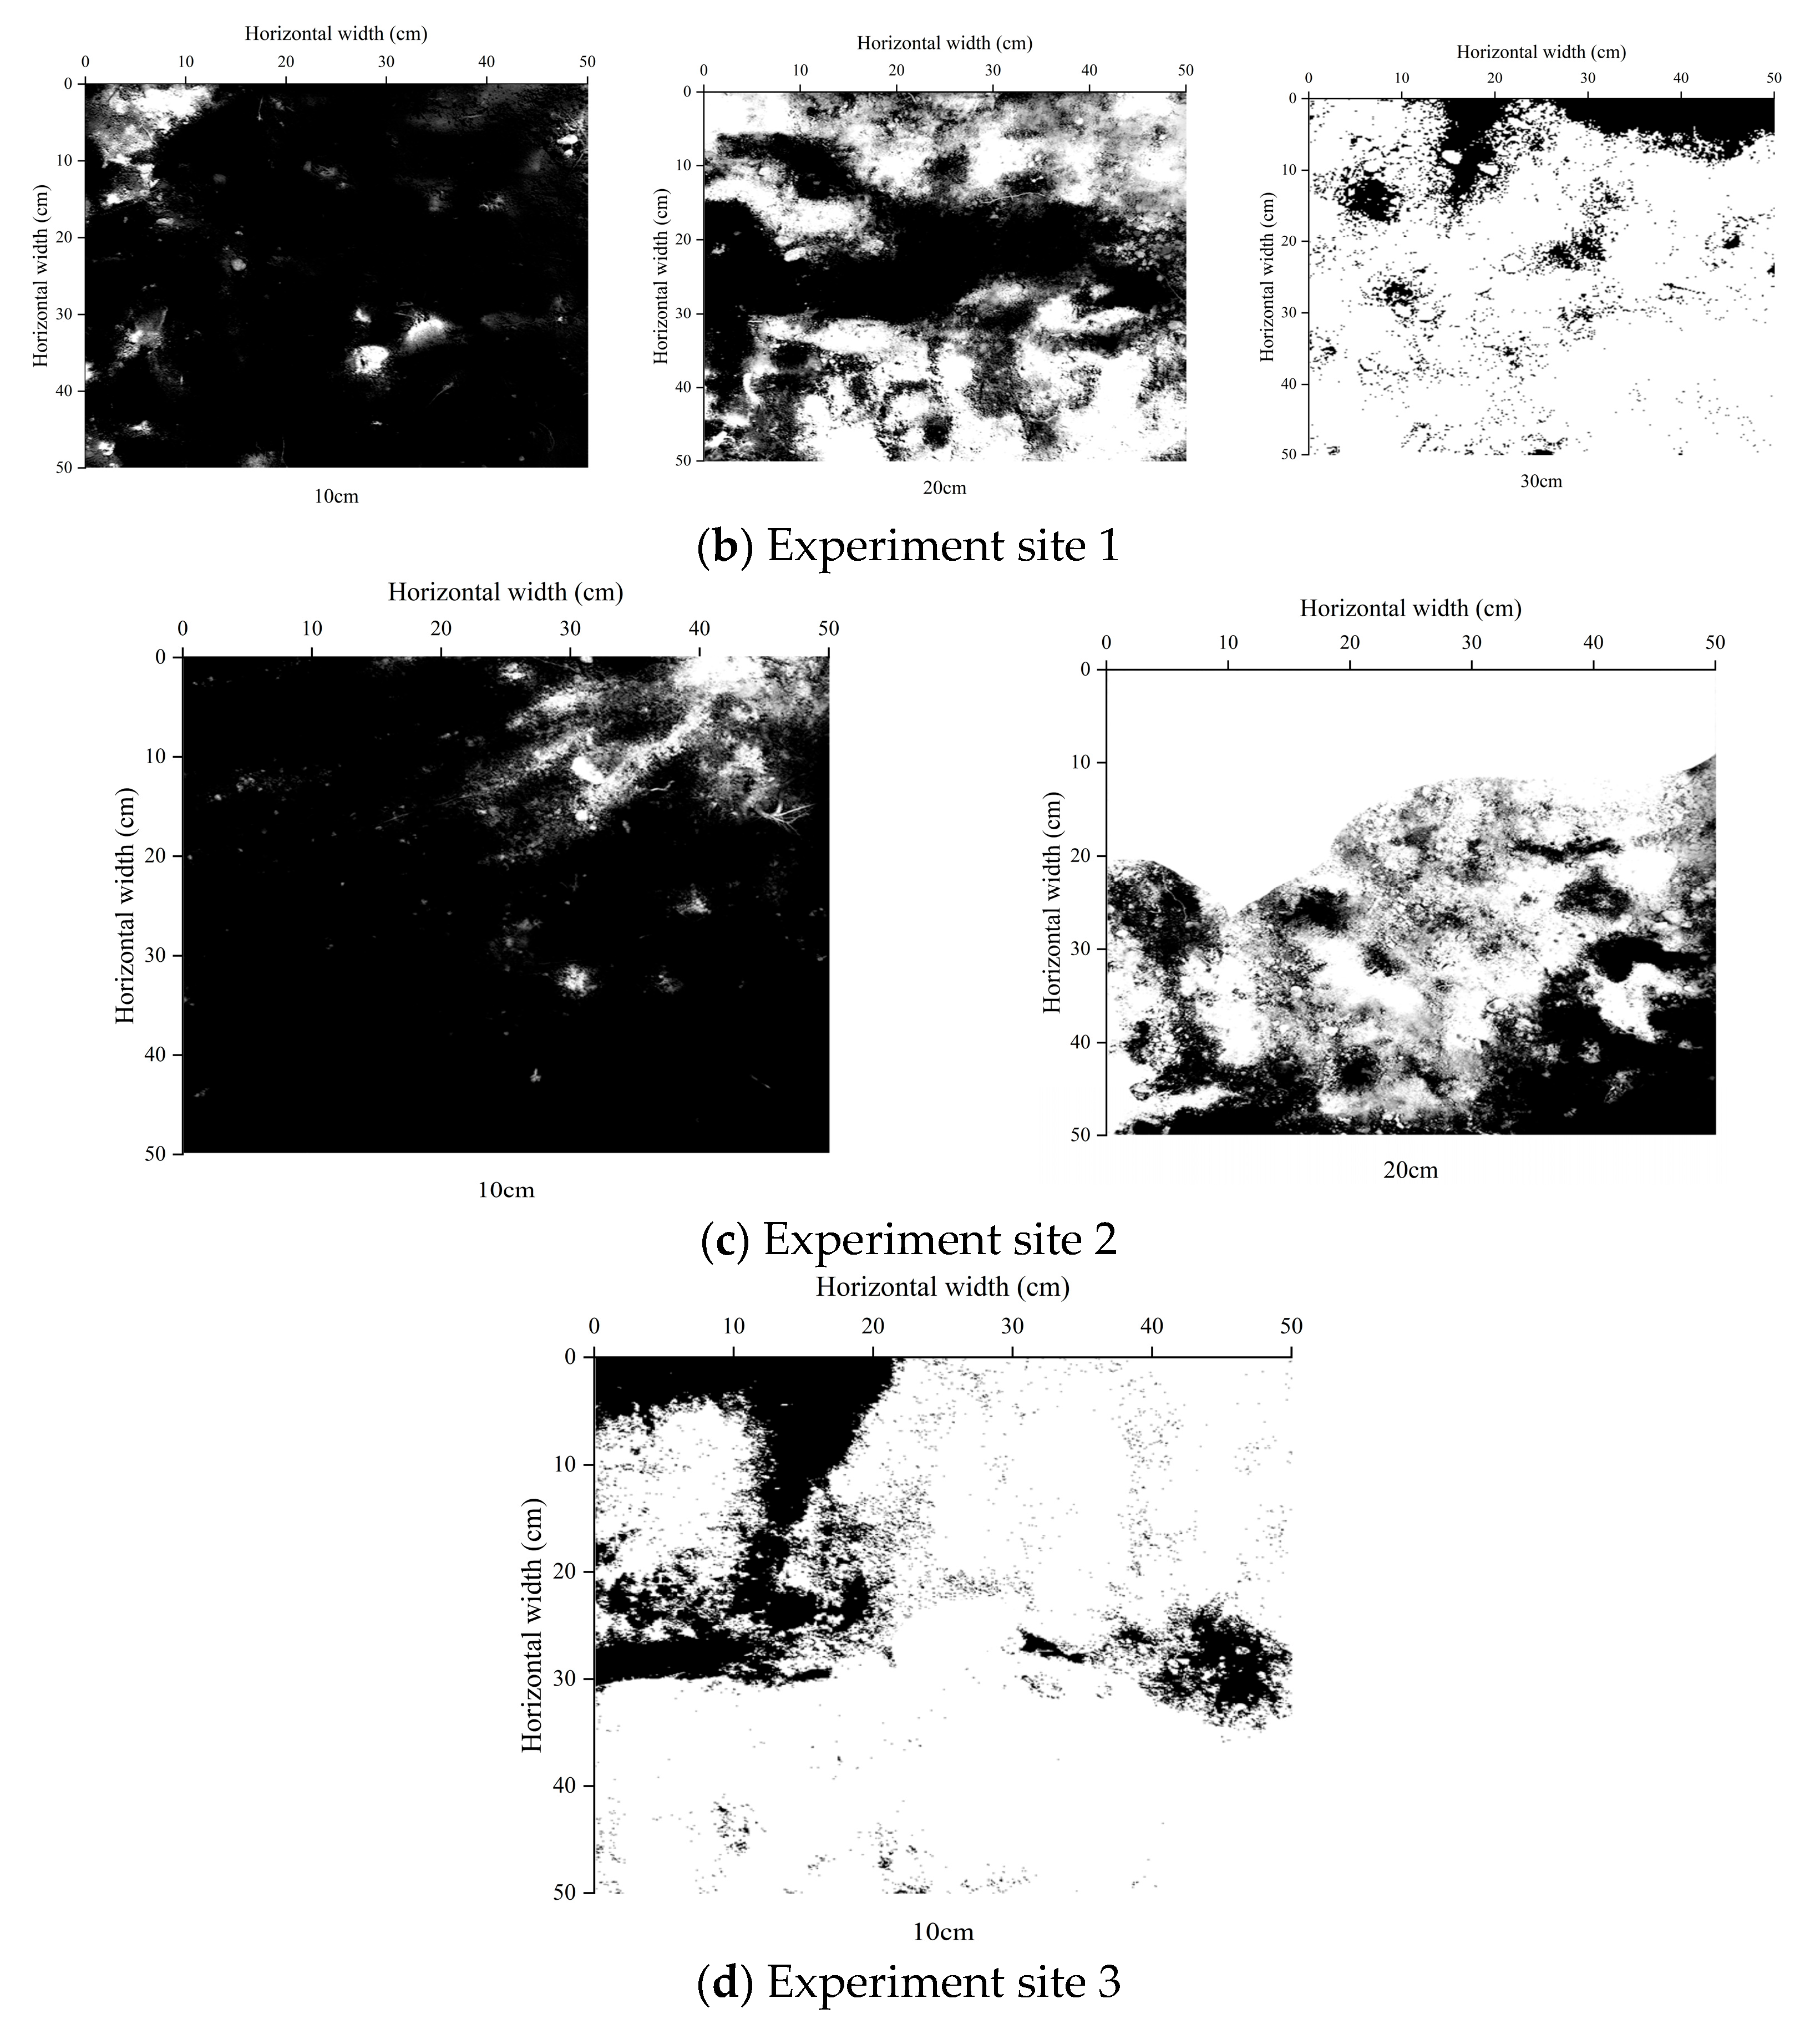
To better understand the spatial distribution of preferential flow, the stained horizontal profile were also analyzed (Figure 5). The stained horizontal patterns varied greatly under different initial soil moisture conditions. At experiment site 0, the stained pattern was mainly characterized by a clumping distribution. The stained area reached 99.75% at 10 cm below surface, decreased to 82.14% at 30 cm, and then dropped sharply to 14.08% at 40 cm. Preferential flow was clearly evident. At experiment site 1, the stained pattern consisted mainly of clumps and strips. At 20 cm depth, staining was concentrated within a horizontal width of 15–35 cm, while at 30 cm, staining was concentrated within 0–10 cm, indicating that lateral water movement. At experiment site 2, extensive stained occurred at 10 cm depth, but stained area decreased rapidly at 20 cm depth. At this depth, the stained area was concentrated within a horizontal width of 20–50 cm. At experiment site 3, the stained area at 10 cm depth was relatively low, with only narrow strips of staining present.

3.3. Soil Stained Area Ratio

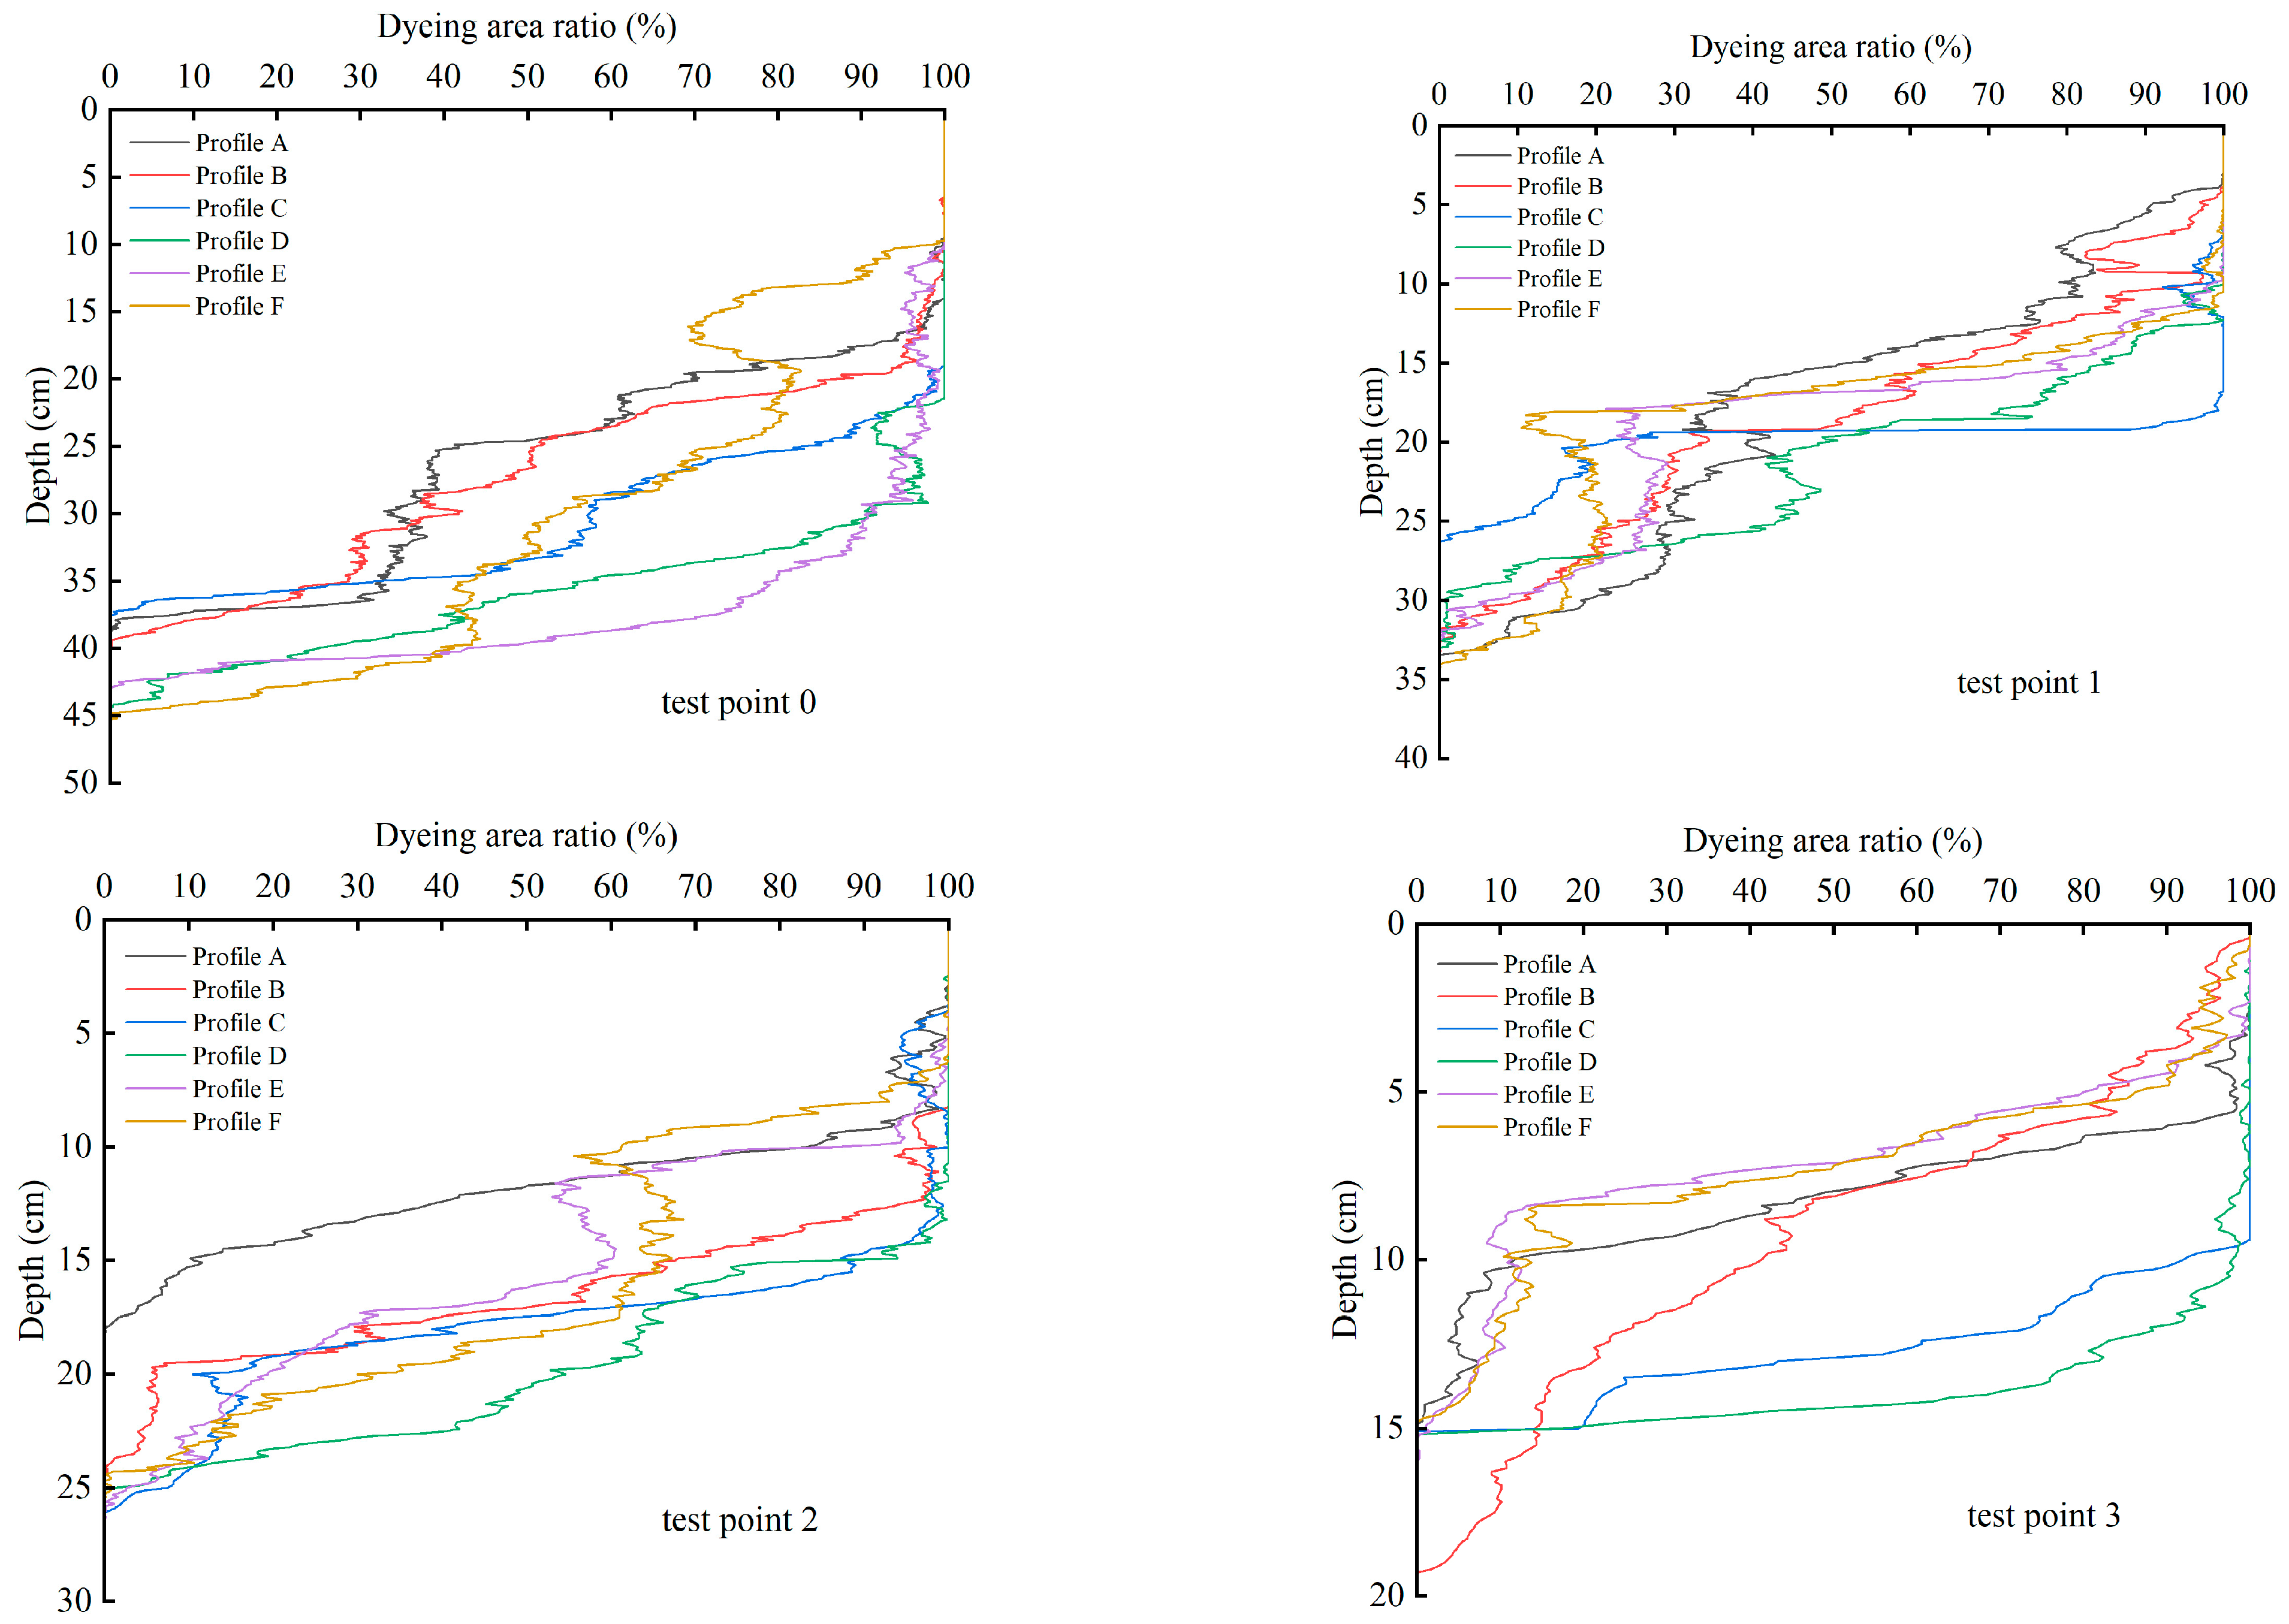
The stained area ratio is an important parameter that reflects the range and trajectory of the staining solution’s movement through the soil. At all experimental sites, the stained area ratio decreased with increasing soil depth (Figure 6). For experiment sites 0, 1, and 2, the relationship between stained area and soil depth exhibited an S-shaped curve. At the inflection point of the S-shape, the stained area ratio increased with depth due to the occurrence of lateral flow. In contrast, experimental site 3 showed a monotonically decreasing trend, with no obvious peaks or troughs.
To further examine changes in the stained area ratio, logarithmic, quadratic, cubic and exponential functions were selected to fit the relation between the stained area percentage (y) and the soil depth (x) under different initial soil water contents (Table 3). The results indicated that the cubic function provided the best fit for all four experiment sites. This model can be used to simulate and predict the scope of preferential flow and its movement processes in the coal mine subsidence areas along the middle reaches of Yellow River.

3.4. Comprehensive Evaluation of Preferential Flow

Each characteristic parameter of preferential flow was obtained through numerical de coding of the stained images (Table 4). Significant difference (p < 0.05) in preferential flow parameters were observed under different initial soil moisture conditions. The four experiment sites differed in their average substrate flow depth, which was influenced by the initial soil moisture. The average substrate flow depth at experiment site 0 was significantly deeper than the other three experiment sites. The maximum infiltration depth and length index followed the order: test point 0 > test point 1 > test point 2 > test point 3, showing a decreasing trend with increasing initial soil moisture. The coefficient of variation for the stained pattern followed the opposite trend: test site 0 < test site 1< test site 2< test site 3, increasing with higher initial soil moisture. Overall, preferential flow at experiment site 0 was more obvious than that at the other three experiment sites.
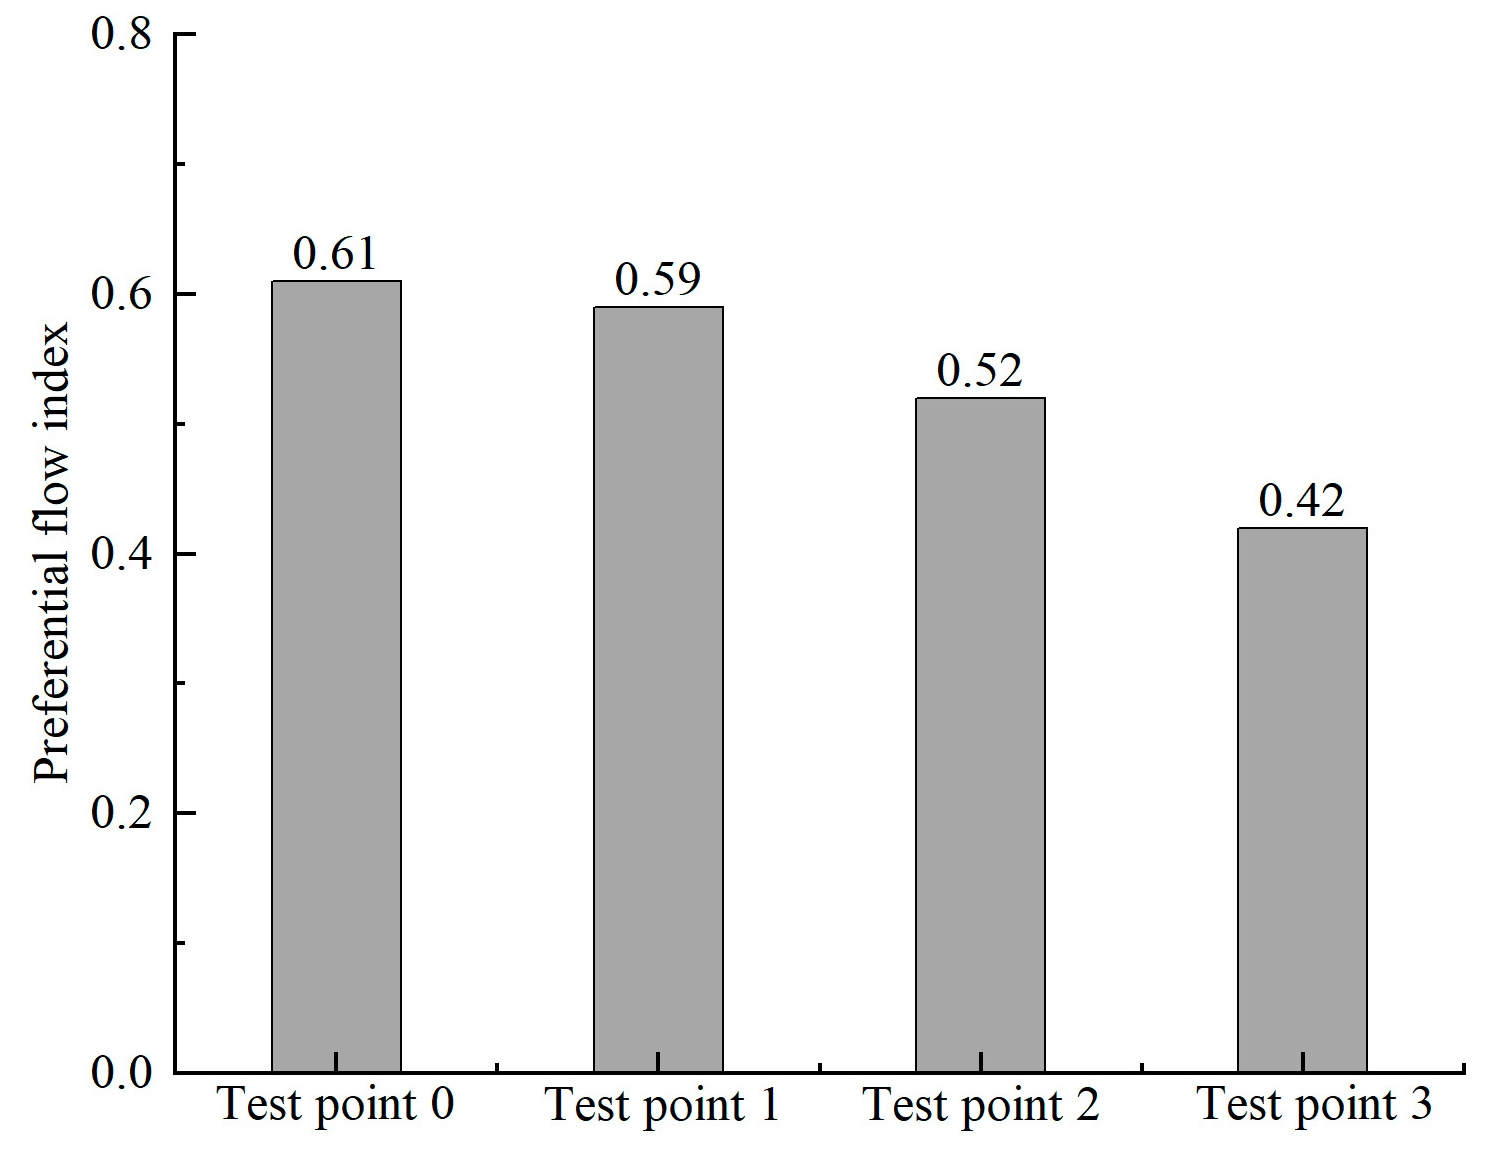
Preferential flow was evaluated for each characteristic parameter using the mean square deviation decision-making method (Table 5). Among the parameters, the coefficient of stained pattern variation had the largest weighting factor, while the length index had the lowest. The calculated preferential flow index followed the order: test point 0 > test point 1 > test point 2 > test point 3 (Figure 7), indicating that the higher initial soil water content was associated with lower preferential flow development. Higher soil moisture reduced the rapid infiltration of water to deeper layers and promoted the growth of surface vegetation.

4. Discussion

4.1. Relation Between Cracks and Preferential Flow Characteristics

Stained images showed that cracks served as preferential pathways for water infiltrtion. The preferential flow phenomenon was obvious, and the morphology and orientation of subsurface cracks determined the shape and location of stained areas in coal mining subsidence area. This finding is consistent with the results of Li et al. [24], who reported that cracks in the coal mining subsidence areas disrupted soil continuity, altered subsurface microtopography, and affected hydrological processes such as runoff, infiltration, and evaporation. Under the influence of soil cracks, Surface runoff from atmospheric precipitation is transformed into subsurface runoff and transport to deeper soil layers, forming the primary channel of preferential flow in the subsidence area.

4.2. Relation Between Initial Soil Moisture and Preferential fFlow Characteristics

The development of preferential flow can be revealed by stained morphological pat terns. The large-scale, uniformly stained surface soil observed at the four experiment sites indicated that matrix flow dominated in surface layer, while preferential flow mostly occurred in the deeper soil. The stained area ratio decreased non-linearly with increasing soil depth, mainly because surface layer was relatively loose and favored water infiltration, whereas the deeper soil was relatively denser, less permeable, and limited infiltration [36].
The initial soil moisture played a major role in the development of preferential flow by influencing both water infiltration and conductance. Hu et al. [21] reported that higher initial soil water content can increase the occurrence of preferential flow. In contrast, Demand et al. [20] found that lower initial soil moisture may increase preferential flow occurrence in forests and grassland. However, Wiekenkamp et al. [23] did not find a clear relationship between preferential flow frequency and initial soil water content. In this study, we found that the lower initial soil water content, the drier of the soil, the deeper of substrate flow, and the deeper of preferential flow. This is mainly due to the sandy nature of soils in the coal mining subsidence zone, where low soil moisture conditions increase soil hydrophobicity, a key factor in the intensification of exacerbating preferential flow [37]. In sandy soils, hydrophobicity decreases as soil moisture increases [38]. Thus, the lower water content, the stronger of hydrophobic, and consequently, the more fully the preferential flow develops. In addition, under low soil moisture conditions, the repulsion between soil particles and water becomes stronger [39], further enhancing preferential flow.
In this study, the volumetric water content in stained areas across the four experiment sites ranged from 4.23 to 9.92%, all below the saturated water content. We found that intensity of preferential flow decreased as soil water content increased. This may be because, once the soil approaches saturation, surface runoff increases, thereby reducing the occurrence of preferential flow.

4.3. Further Research Needed

The four experiment sites were selected within the same coal mine subsidence area. At each experiment site, preferential flow was minimally disturbed by soil texture. This study analyzed the difference in preferential flow under the same rainfall conditions but with varying initial soil moisture levels. Theoretically, the cracks characteristic across the four selected experiment sites should have been identical; however, this was not fully achievable in the field. Only the cracks width of could be standardized, while subsurface crack morphology and direction could be controlled, which inevitably influenced the results to some extent. In the future research, carefully designed laboratory experiments will be conducted to address and minimize the limitations inherent in field experiments.

5. Conclusions

Preferential flow was observed in soils of the coal mining subsidence area. The top layer soil primarily exhibited substrate flow, while preferential flow occurred in the deeper soil layers beneath it. Under identical rainfall conditions, an increase in initial soil moisture resulted in reduced ranges of both substrate flow and preferential flow.
In the coal mining subsidence area, the stained area ratio decreased with increasing soil depth. When irrigation water applied 24 h in advance was ≤10 L, the relationship between stained area percentage and soil depth displayed an S-shaped pattern. When the irrigation amount was increased to 15 L, the relationship changed to a monotonically decreasing trend. A cubic function provided a better fit for the relationship between stained area ratio and soil depth in the coal mining subsidence area.
The maximum infiltration depth and length indices tended to decrease as the initial soil water content increased. In contrast, coefficient of variation of the stained pattern tended to increase with initial soil water content. Increased soil water content reduced the rapid infiltration of water to deeper layers and supported the growth of surface vegetation.

Author Contributions

Investigation, field staining tracer test, Stained image processing, writing—original draft preparation, writing the main manuscript text, Y.Y.; Calculation of preferential flow characteristic parameters, Preferential flow evaluation methodology, revised this manuscript, Q.G. All authors have read and agreed to the published version of the manuscript.

Funding

This research was funded by Science and Technology Project of Jiangxi Provincial Education Department [Space and temporal evolution mechanism of carbon source / carbon sink in poyang Lake ecological economic zone], grant number [GJJ2202918]; The National Natural Science Foundation of China [Formation mechanism and transport process of preferential flow in coal mining subsidence area in middle reaches of Yellow River], grant number [42162021].

Data Availability Statement

The data presented in study are available on request from the authors.

Acknowledgments

We appreciate the valuable comments and suggestions from the editor and the reviewers.

Conflicts of Interest

The authors declare that they have no known competing financial interests or personal relationships that could have appeared to influence the work reported in this paper.

References

  1. Beven, K.; Germann, P. Macropores and water flow in soils. Water Resour. Res. 1982, 18, 1311–1325. [Google Scholar] [CrossRef]
  2. Gerke, H.H. Preferential flow descriptions for structured soils. J. Plant Nutr. Soil Sci. 2006, 169, 382–400. [Google Scholar] [CrossRef]
  3. Wiekenkamp, I.; Huisman, J.A.; Bogena, H.R.; Lin, H.S.; Vereecken, H. Spatial and temporal occurrence of preferential flow in a forested headwater catchment. J. Hydrol. 2016, 534, 139–149. [Google Scholar] [CrossRef]
  4. Jarvis, N.J. A review of nonequilibrium water flow and solute transport in soil macropores: Principles, controlling factors and consequences for water quality. Eur. J. Soil Sci. 2007, 58, 523–546. [Google Scholar] [CrossRef]
  5. Tromp-van Meerveld, H.J.; McDonnell, J.J. Threshold relations in subsurface stormflow: 2.The fill and spill hypothesis. Water Resour. Res. 2006, 42, W02411. [Google Scholar] [CrossRef]
  6. Beven, K.; Germann, P. Management of water repellency in Australia, and risks associated with preferential flow, pesticide concentration and leaching. J. Hydrol. 2013, 231–232, 384–395. [Google Scholar]
  7. Vikram, K.; Barkha, C.; Padam, J.O.; Mishra, S.; Md. Azamathulla, H. Experimental study on infiltration pattern: Opportunities for sustainable manage-ment in the Northern region of India. Water Sci. Technol. 2021, 84, 2675–2685. [Google Scholar]
  8. Wu, Q.H.; Zhang, J.F.; Lin, W.J. Applying dyeing tracer to investigate patterns of soil water flow and quantify preferential flow in soil columns. Trans. Chin. Soc. Agric. Eng. 2014, 30, 82–90. [Google Scholar]
  9. Energy Information Administration (E.I.A). International Energy Outlook. Washington, DC, USA, 2021. Available online: https://www.eia.gov/outlooks/ieo/pdf/IEO2021_Narrative.pdf (accessed on 27 April 2025).
  10. Ren, B.P.; Du, Y.X. Strategy of ecological protection and high-quality development in the Middle Yellow River. Yellow River 2021, 43, 1–5. [Google Scholar]
  11. Wang, X.K.; Peng, S.P.; He, Y.L. Soil moisture evidence of self-restoration in coal mining subsidence area of Shendong Mining area: Gognition based on stable isotopes. Sci. Total Environ. 2024, 951, 175831. [Google Scholar] [CrossRef]
  12. Xie, X.S.; Hou, E.K.; Zhao, B.C.; Feng, D.; Hou, P. Investigating the damage characteristics of overburden and dynamic evolution mechanism of surface cracks in gently inclined multi-seam mining: A case study of Hongliu coal mine. Environ. Technol. Innov. 2024, 36, 103897. [Google Scholar] [CrossRef]
  13. Qian, J.Z.; Wang, W.; Ma, L.; Dang, B.; Sun, X. Identification of preferential flow paths by hydraulic tomography compared with tracer test and the groundwater contour map in coal mine water hazard area. J. Hydrol. 2024, 631130816. [Google Scholar] [CrossRef]
  14. Chen, W.; Li, W.; Yang, Z.; Wang, Q. Analysis of mining-induced variation of the water table and potential benefits for ecological vegetation: A case study of Jinjitan coal mine in Yushenfu mining area, China. Hydrogeol. J. 2021, 29, 1629–1645. [Google Scholar] [CrossRef]
  15. Yang, Y.; Zhang, M.; Zhang, Y.; Wang, S.; Wang, J. Evaluating the soil pevaoration loss rate in a gravel sand mulching environment based on stable isotopes data. J. Arid. Land 2022, 14, 925–939. [Google Scholar] [CrossRef]
  16. Long, L.; Liu, Y.; Chen, X.; Guo, J.; Li, X.; Guo, Y.; Zhang, X.; Lei, S. Analysis of satial variability and influencing factors of soil nutrients in western China: A case study of the Daliuta Mining Area. Sustainability 2022, 14, 2793. [Google Scholar] [CrossRef]
  17. Ghafoor, A.; Koestel, J.; Larsbo, M.; Moeys, J.; Jarvis, N. Soil properties and susceptibility to preferential solute transport in tilled topsoil at the catchment scale. J. Hydrol. 2013, 492, 190–199. [Google Scholar] [CrossRef]
  18. Hardie, M.A.; Cotching, W.E.; Doyle, R.B.; Holz, G.; Lisson, S.; Mattern, K. Effect of antecedent soil moisture on preferential flow in a texture-contrast soil. J. Hydrol. 2011, 398, 191–201. [Google Scholar] [CrossRef]
  19. Liu, H.; Lin, H. Frequency and control of subsurface preferential flow: From edon to catchment scales. Soil Sci. Soc. Am. J. 2015, 79, 362–377. [Google Scholar] [CrossRef]
  20. Demand, D.; Blume, T.; Weiler, M. Spatio-temoral relevance and controls of preferential flow at the landscape. Hydrol. Earth Syst. Sci. 2019, 23, 4869–4889. [Google Scholar] [CrossRef]
  21. Hu, H.; Wen, J.; Peng, Z.; Tian, F.; Tie, Q.; Lu, Y.; Khan, M.Y.A. High-frequency monitoring of the occurrence of preferential flow on hillsloes and its rela-tionship with rainfall features, soil moisture and landscape. Hydrol. Sci. J. 2019, 64, 1385–1396. [Google Scholar] [CrossRef]
  22. Xu, J.; Liu, M.; Yi, J.; Zhang, J.; Zhang, H.; Cai, C. Evaluating the soil hydraulic functions of vegetation restoration in a subtroical hilly catchment: Insights from continuous soil moisture monitoring. J. Hydrol. 2024, 629, 130578. [Google Scholar] [CrossRef]
  23. Allaire, S.E.; Roulier, S.; Cessna, A.J. Quantifying preferential flow in soils: A review of different techniques. J. Hydrol. 2009, 378, 179–204. [Google Scholar] [CrossRef]
  24. Li, W.L.; Jin, C.J.; Wang, A.Z.; Pei, T.F.; Guan, D.X. Research progress in soil macropore flow. Chin. J. Appl. Ecol. 2007, 18, 888–894. [Google Scholar]
  25. Kan, X.; Cheng, J.; Hou, F. Response of preferential soil flow to different infiltration rates and vegetation types in the Karst Region of Southwest, China. Water 2020, 12, 1778. [Google Scholar] [CrossRef]
  26. Xu, T.; He, H.T. Analysis of the influences of surface gully on rock pressure behavior in working face with larger mining height in Shangwan Coal Mine. China Coal 2017, 43, 49–54. [Google Scholar]
  27. Duan, H.L. Reliable operation on method of ultra-long bundle tube gas collecting in Shangwan Coal Mine. Coal Eng. 2023, 55, 136–140. [Google Scholar]
  28. Yao, J.J. Characteristics of Soil Preferential Flow and Its Effect on Nutrient Transport in Catchment Scale of Simian Mountain, Chongqing; Beijing Forestry University: Beijing, China, 2018; pp. 26–29. [Google Scholar]
  29. Jiang, X.J.; Chen, C.F.; Zhu, X.A.; Zakari, S.; Singh, A.K.; Zhang, W.; Zeng, H.; Yuan, Z.; He, C.; Yu, S.; et al. Use of dye infiltration experiments and HYDRUS-3D to interpret preferential flow in soil in a rubber-based agroforestry systems in Xishuangbanna, China. Catena 2019, 178, 120–131. [Google Scholar] [CrossRef]
  30. Hu, Q.; Li, X.Y.; Shi, H.B.; Chen, N.; Zhang, Y. Residual plastic film exerts dual effects of blocking and preferential flow on soil water movement. Soil Tillage Res. 2023, 227, 105628. [Google Scholar] [CrossRef]
  31. Zheng, X.; Cheng, J.H.; Zhang, H.J. Characteristics and influencing factors of preferential flow dyeing morphology of two soils in Beijing. J. Soil Water Conserv. 2018, 32, 113–119. [Google Scholar]
  32. Deng, Y.Y.; Liao, Y.L.; Rong, Q.B. Variations of preferential flow across different aged Chinese fir plantations in northern Guangxi. Chin. J. Ecol. 2025, 44, 389–395. [Google Scholar]
  33. Van Schaik, N. Spatial variability of infiltration patterns related to site characteristics in a semi-arid watershed. Catena 2009, 78, 36–47. [Google Scholar] [CrossRef]
  34. Tobella, A.B.; Reese, H.; Almaw, A.; Bayala, J.; Malmer, A.; Laudon, H.; Ilstedt, U. The effect of trees on preferential flow and soil infiltrability in an agroforestry parkland in semiarid burkina faso. Water Resour. Res. 2014, 50, 3342–3354. [Google Scholar] [CrossRef]
  35. Zhang, D.X.; Zhang, H.J.; Cheng, J.H. Quantitative analysis of preferential flow in slope farmland soils based on multi-index evaluation and fractional dimension. Trans. Chin. Soc. Agric. Mach. 2017, 48, 214–220. [Google Scholar]
  36. Liu, M.X.; Song, X.M.; Lu, S.G.; Zhang, H.L.; Yi, J. Research on the characteristics of preferential flow movement along varied hillslopes covered with different vegetation in the three gorges reservoir area. Acta Pedol. Sin. 2022, 59, 1321–1335. [Google Scholar]
  37. Aumer, K.; Stoffregen, H.; Wessolek, G. Seasonal dynamics of preferential flow in a water repellent soil. Vadose Zone J. 2006, 5, 405–411. [Google Scholar] [CrossRef]
  38. Duan, F.Y.; Zhu, C.L.; Wang, C. Effects of cracking patterns and antecedent soil water content on preferential flow of irrigated water. J. Irrig. Drain. 2023, 42, 32–41. [Google Scholar]
  39. Chen, X.B.; Wu, H.; Jiang, B. Spatial distribution of preferential flow paths in paddy field in the karst area of Guangxi. Chin. J. Appl. Ecol. 2020, 31, 4099–4108. [Google Scholar]
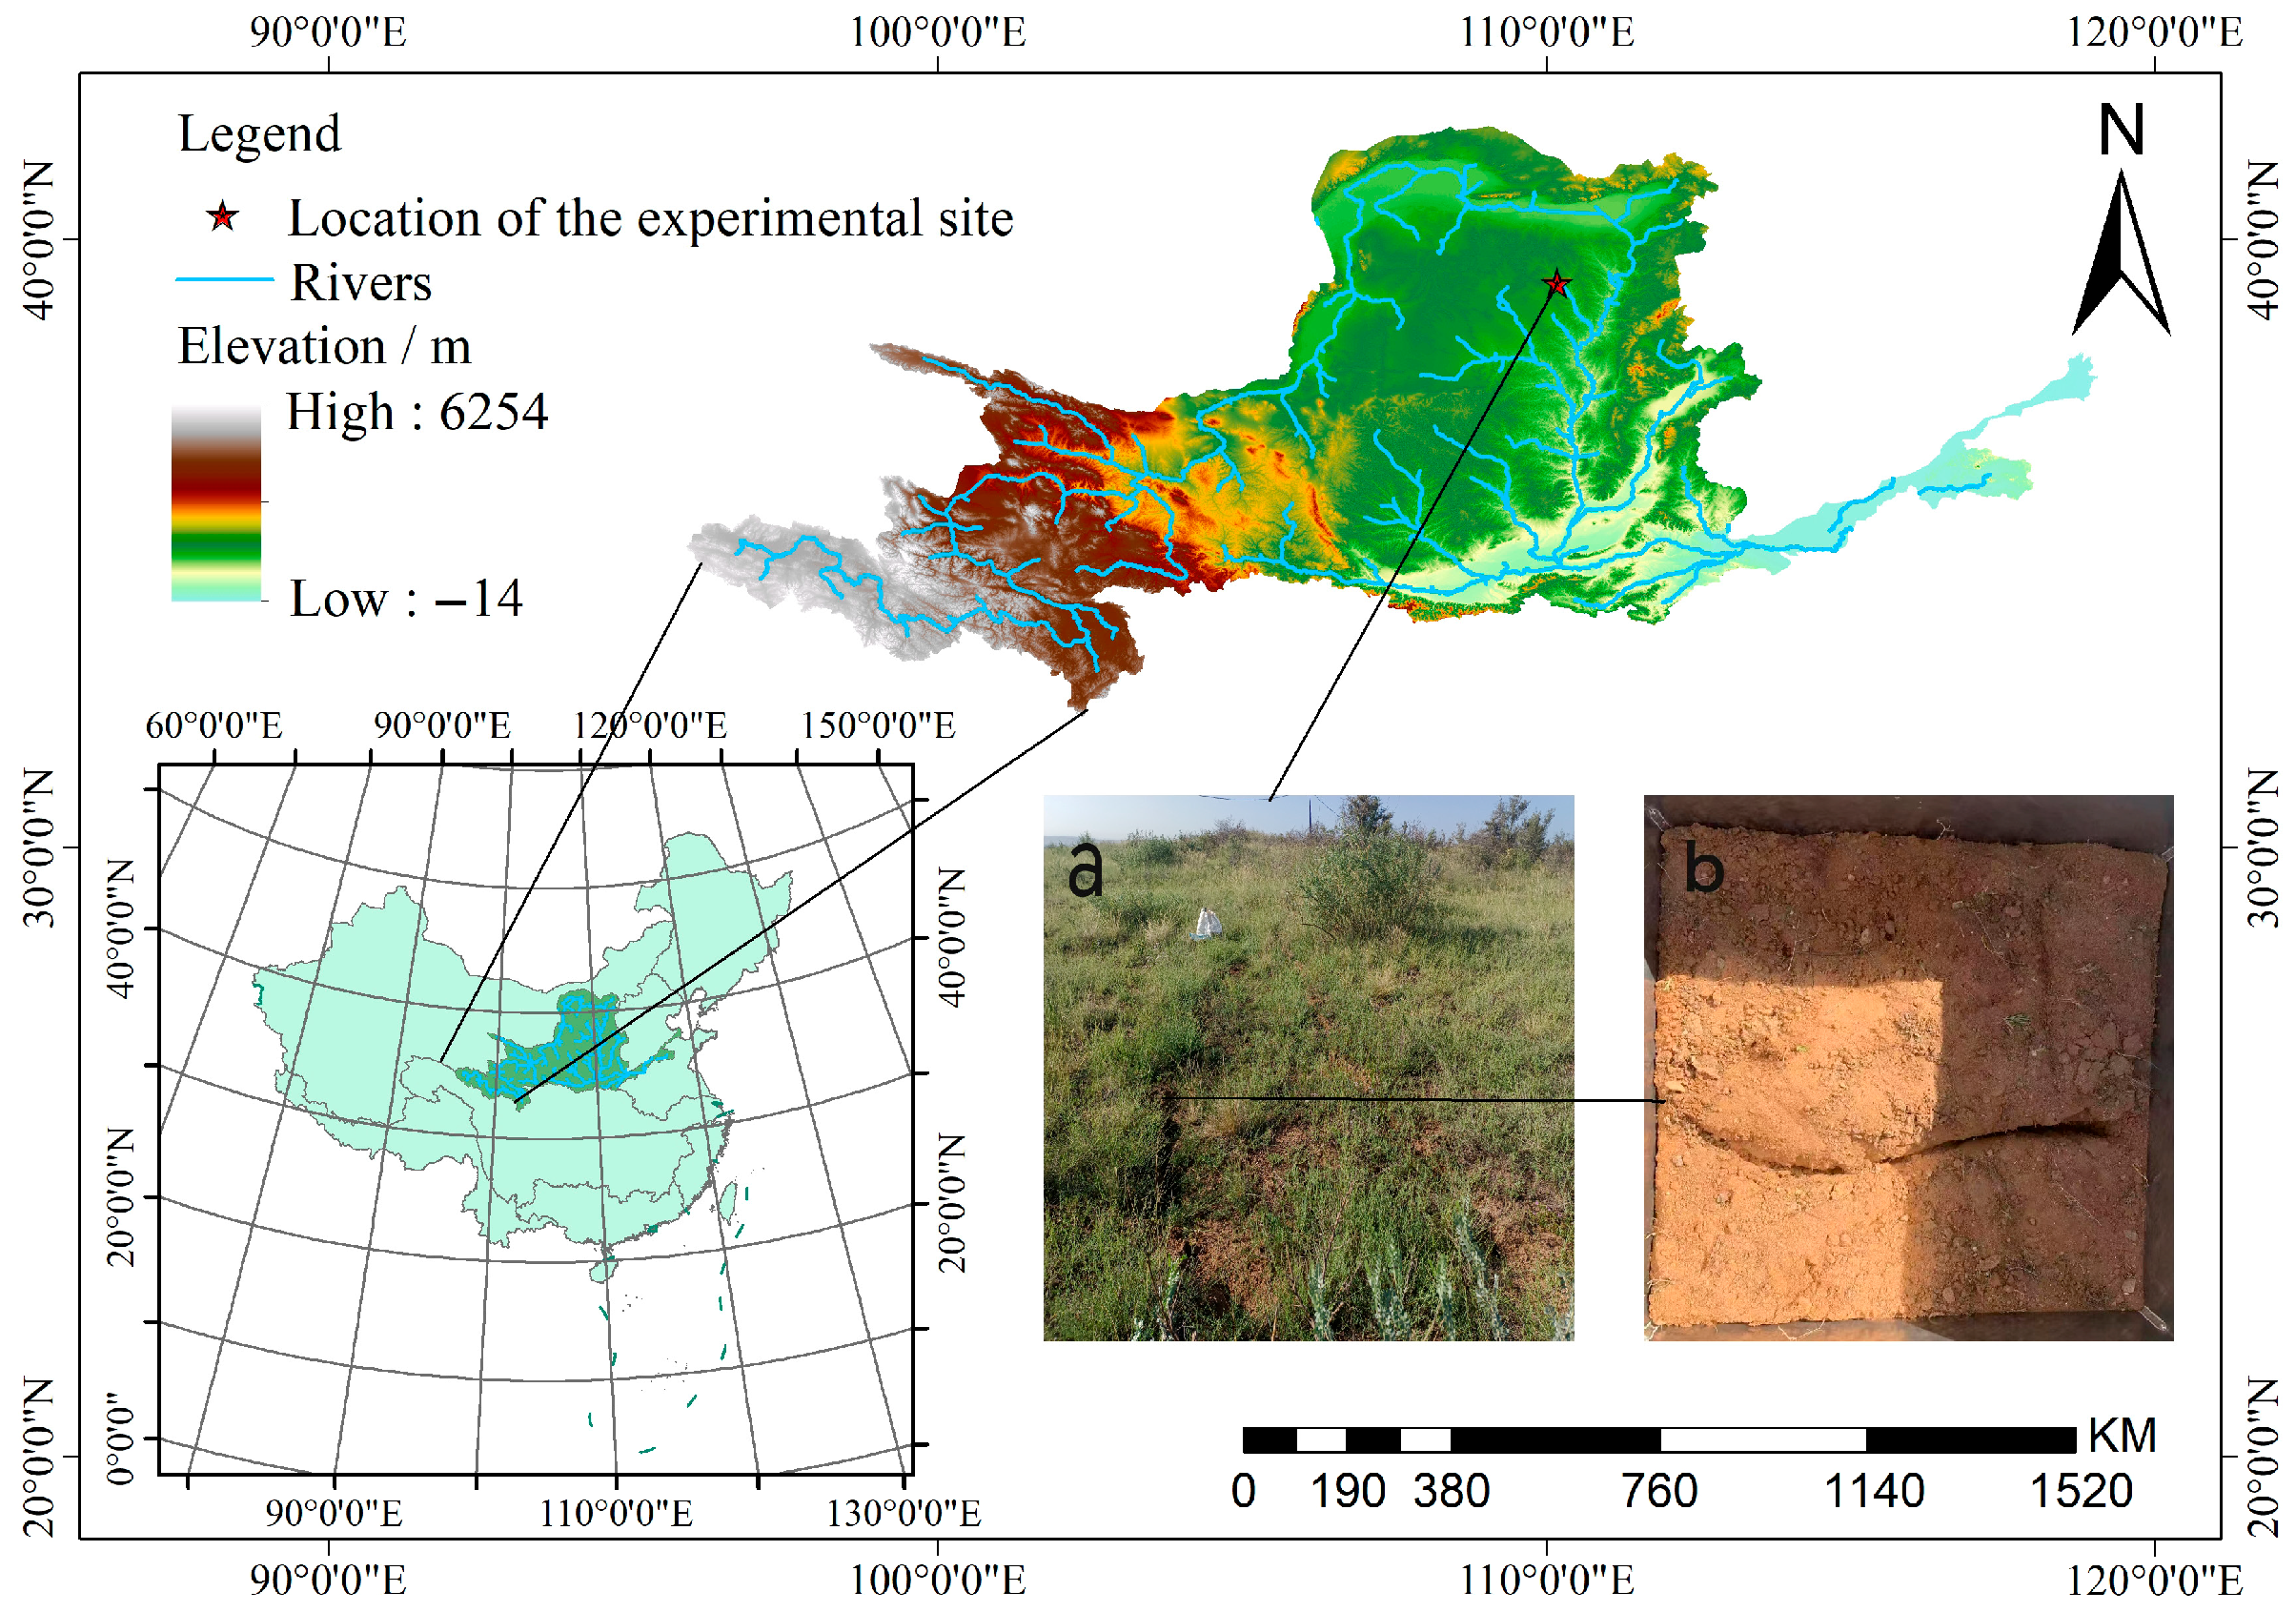
Figure 1. Location of the study area.
Water 17 02606 g001
Figure 2. Diagram of the profile excavation.
Water 17 02606 g002
Figure 3. Dyed pattern of vertical profiles.
Water 17 02606 g003aWater 17 02606 g003bWater 17 02606 g003c
Figure 4. Spatial distribution of stained vertical profiles at experiment sites.
Water 17 02606 g004
Figure 5. Dyed pattern of horizontal profiles in experiment sites.
Water 17 02606 g005aWater 17 02606 g005b
Figure 6. Changes of stained area ratio at different sites.
Water 17 02606 g006
Figure 7. Soil preferential flow index.
Water 17 02606 g007
Table 1. Experimental design under different initial soil moisture.
Experiment SiteControl ConditionQuantity of Brilliant Blue Solution/LExperiment Design
0Same width crack, different initial soil water content22.5 LContinuous rainfall of 0.5 h at the intensity of 125 mm·h−1Irrigation water 0 L, 24 h in advance
1Irrigation water 5 L, 24 h in advance
2Irrigation water 10 L, 24 h in advance
3Irrigation water 15 L, 24 h in advance
Table 2. Parameters of soil texture and structure in experiment sites.
Experiment SiteDifferent Soil Depths/cmWater Content by Volume/%Soil Capacity /g·cm−3Soil Porosity/%Soil Particle Size > 0.05 mm/%
SAUASAUASAUASAUA
00–105.691.830.791.0566.9559.7791.7892.17
10–204.232.410.870.9966.6662.1192.2390.73
20–304.893.090.990.9962.2562.1690.0291.19
30–407.884.011.111.0967.9657.5589.1388.07
10–106.543.351.041.2860.6559.8493.1292.04
10–206.744.151.060.9859.5157.6289.3287.29
20–308.414.541.251.2162.2153.7292.7693.11
20–108.247.451.121.1457.3956.7992.3491.02
10–209.927.961.271.0161.4361.2191.2690.25
20–306.665.950.970.9463.2363.8991.3492.40
30–104.864.060.901.1365.0956.6488.6387.72
10–208.697.050.750.9867.9362.0685.6186.03
Note: SA represents the stained region, UA represents the non-stained region.
Table 3. Fitting of soil stained area ratio function.
FunctionTest PointFunctional RelationshipR2
Exponential function0y = 189.73e−0.052x0.6066
1y = 288.92e−0.12x0.6571
2y = 307.03e−0.15x0.6132
3y = 365.81e−0.256x0.7908
Logarithmic function0y = −26.12ln(x) + 146.260.5402
1y = −36.42ln(x) + 152.330.6992
2y = −35.47ln(x) + 146.960.6447
3y = −41.87ln(x) + 140.050.7907
Quadratic function0y = −0.0718x2 + 1.0709x + 96.770.9964
1y = −0.0221x2 − 5.9078x + 116.630.9531
2y = −0.1459x2 − 0.428x + 105.620.977
3y = −0.001x2 − 0.1016x + 102.610.9711
Cubic function0y = −0.0004x3 − 0.0461x2 + 0.5925x + 98.7040.9968
1y = 0.0081x3 − 0.474x2 + 4.0809x + 92.5240.9845
2y = 0.0128x3 − 0.6824x2 + 5.6901x + 90.0580.9936
3y = 0.0374x3 − 1.1987x2 + 4.2183x + 96.7880.9932
Table 4. Characteristic parameters of preferential flow.
Test PointSubstrate Flow DepthMaximum Infiltration DepthPreferential Flow RatioLength IndexVariation Coefficient of Stained Pattern
025.933 ± 6.4936a 41.400 ± 3.1673a 0.176 ± 0.0719a 204.933 ± 38.4072ab 0.489 ± 0.9956b
114.417 ± 2.9247b 32.050 ± 2.9269b 0.281 ± 0.1362b 221.067 ± 31.7406a 0.646 ± 0.1096ab
212.283 ± 3.1019bc 24.183 ± 3.0643c 0.259 ± 0.1302a 179.733 ± 29.5076b 0.721 ± 0.1953ab
37.717 ± 3.4055c 15.800 ± 1.7146d 0.257 ± 0.1273c 136.933 ± 21.2410c 0.783 ± 0.2847a
Note: The number of the table are mean ± standard deviation, and different alphabets in the same column represents significant differences in the indicators between different initial moisture contents (p < 0.05).
Table 5. Mean value, mean square deviation and weight coefficient of each evaluation index.
Each Evaluation IndexMean ValueMean Square DeviationWeight Coefficient
Depth of substrate flow0.4280.36220.209
Maximumdepth of infiltration0.5520.3510.203
Preferential flow percentage0.4410.3310.192
Length index0.4970.3130.181
Variation coefficient of staining pattern0.5320.3720.215
Disclaimer/Publisher’s Note: The statements, opinions and data contained in all publications are solely those of the individual author(s) and contributor(s) and not of MDPI and/or the editor(s). MDPI and/or the editor(s) disclaim responsibility for any injury to people or property resulting from any ideas, methods, instructions or products referred to in the content.