Abstract
One of the limiting factors in the implementation of water resource management is the absence of tools that help water programs evaluate processes and progress. This is because, until now, the indicators that have been developed have not addressed specific local characteristics and issues. Therefore, in this research, a set of indicators has been proposed, with the purpose of developing a management index for urban public water supply, which will consider the Drinking Water and Sewer System of León (SAPAL), in the Mexican state of Guanajuato, as case study. This index will be useful to measure progress toward sustainable development, monitor the impact of public policies, and foster citizen participation. In order to propose a methodology that aligns with the changing environments, where proper decision-making is key to the current water management requirements, the combination of the Analytic Hierarchy Process (AHP) and Fuzzy Logic (FL) methodologies will be helpful for proper decision-making. All this will foster a paradigm shift towards appropriate water management actions that allow for the conditions and availability of human and natural resources, which the municipality has control of, for a long-term improvement that guarantees the well-being of the population.
1. Introduction
One of the recommendations in scientific literature is the adoption of indicators for evaluating and monitoring the change processes (including public policy) toward sustainable development [1]; mentioned in [2]. At an international level, indicators have been considered a powerful decision-support instrument [3,4]. Concerning the water issue, in recent years, indicators related to water resource management have been increasing rapidly [2,5], due to the growing need to develop tools for assessing the development process in an integrated fashion [3].
Despite this rapid development, water-related indicators still show limitations. Among the reasons, we can find data collection and evaluation, as well as the limited interaction between societal sectors that generate and use the information, which has complicated their implementation in public policy [5,6]. According to [5,7], mentioned in [2], although there are several water-related indicators and a need to link scientific evaluation with water management issues, there have been few advances in the systematic application of indicator-based evaluation methods. Existing indicators assessed by water utilities are generally one-dimensional, i.e., related to either water quality or quantity, and rarely consider other aspects such as ecosystems, land use, and water management within the same framework [5].
Therefore, sustainability indicators, indexes, and information systems have gained popularity in recent years [8]. Despite this, cities in transition and developing countries pose increasing challenges regarding integrated urban water management, where trends and pressures of urbanization, economic growth [9], climate change, lack of government awareness and preparedness, and limited financial resources for construction, as well as infrastructure maintenance, present enormous barriers to adequate implementation of urban water management [10] mentioned in [2].
Another important aspect to consider is climate change, which increases the vulnerability of urban water in terms of floods, water stress, scarcity, and contamination [11]. Given the complexity of socio-environmental problems and global changes in urban areas, there is a need to design and adapt socially and environmentally responsible indicators based on the recognition of the distinctive water-related challenges of cities and their responses. Considering this, indicators play a fundamental role in disseminating information, transforming scientific and complex data into a simplified, quantified expression [2,12] that allows decision-makers and society to be informed about trends and changes. In this regard, the act of making decisions is a fundamental and inherent activity in water management; where those in charge face ever greater responsibility due to the relevance this implies, especially with the changes and sustainability approaches to the water resource [13].
Decision-making is a procedure that combines the performance of alternatives across various criteria and yields a compromise solution [14]. Many decision-making problems involve multiple qualitative and/or quantitative criteria; for this reason, among the most popular methods is the Analytic Hierarchy Process (AHP) [15]. This may be somewhat limited, depending on the presence of sufficient, available, and accurate information, which is not always the case. Another limitation is that subjective factors such as emotions, personal preferences, or cultural values are not always considered, which can be important in some cases. Unlike other multi-criteria methods, the AHP methodology allows complex problems to be broken down for analysis. It employs pairwise comparisons, which simplify and structure decision-making, accommodates both qualitative and quantitative criteria, and validates the consistency of judgments to ensure reliable results. To overcome these limitations, so-called hybrid methods emerged, such as the combination of the strengths of AHP and FL (fuzzy logic) [16].
The large amount of data available from computer systems is highly useful for proper decision-making and thus has become relevant within organizations and institutions [17,18]. In this regard, the present work proposes a set of indicators oriented toward evaluating the progress within the principles of urban water management, to develop a public supply sustainability index that measures progress toward sustainable development, to monitor the impact of public policies, and to foster citizen participation; in line with current water management requirements, such as the human right to water, the human right to a healthy environment, and Sustainable Development Goal 6 (SDG 6).
The case study is the Drinking Water and Sewer System of the city of León (SAPAL). For this purpose, the AHP and FL methodologies are proposed as decision-making aids. The objective is to establish a measurement index for water resource sustainability using a multi-criteria decision method applying FL, thus ensuring veracity and reducing the degree of subjectivity in the judgments issued by ten experts, thereby establishing the importance of the criteria to be evaluated.
2. Materials and Methods
The article is structured as follows: Section 1 details the conceptual framework and the urban public supply study area in the city of León, Guanajuato. Section 2 explains the AHP and FL methodologies and the combination of both that was used in this research. Section 3 presents the results that determined the importance of considering indicators with a socio-environmental focus that can contribute to sustainable water resource management. Finally, the discussion and conclusions are addressed.
For the optimal and reliable development of this research process, the following methodological steps are proposed:
- A review of national and international research on water management indicators was conducted.
- The state of the art in integrated water management and the application of indices and indicators was reviewed.
- Water management indicators directly related to the approaches of the human right to water, the right to a healthy environment, and access to basic public services (SDG 6) were selected.
- The selected indicators were grouped into the following components according to their typology and data availability: social aspects, environmental aspects, water quality, efficiency in water use, and institutional aspects of coordination and policy.
- Considering the framework of the five components mentioned above, an AHP was applied to determine the relevance of each of the indicators that may be used by water supply services, directly impacting water management and serving as support for decision-making.
- FL was applied to identify trends and/or the evolution of the different indicators, as well as a mechanism to determine whether they are related and how they behave over time. For this analysis, the software R version 4.4.2 [19] was used.
- AHP and FL methodologies were combined to determine which of the different indicators that make up the components have a direct impact on water management and to assess through which of these indicators the water utility (OO) can evaluate and display the current state of the water resource from a comprehensive perspective.
The identification of potential components and indicators was carried out through a review of the literature. For this purpose, information on existing indicators and those related to water resources were collected from 12 different information portals.
Primarily, from public organizations or projects that depend on them, which provide open-access information related to water management. The consulted sources are as follows: World Resources Institute (WRI-AQUEDUCT), International Groundwater Resources Assessment Centre (UN-IGRAC), Environmental Performance Index (EPI), Global Health Observatory (GHO), International Benchmarking Network for Water and Sanitation Utilities (IB-NET), The World Bank Group, World Water Assessment Program (WWAP), European Environment Agency (EEA), European Commission (EUROSTAT), Integrated Water Information System (MAGRAMA-SIA), Food and Agriculture Organization (FAO-AQUASTAT), and Sustainable Development Goals (SDGs).
From these, potential indicators related to the human right to water, the right to a healthy environment, and SDG 6 were considered. The most relevant indicators in water management and those matching the various sources consulted for this research were considered.
The general framework of the index, components, and indicators can be found in the document [20,21].
Once the indicators were defined, the process of collecting, handling, and analyzing available information from various sources was carried out, including: The National Institute of Statistics and Geography (Instituto Nacional de Estadística y Geografía, INEGI), National Water Commission (Comisión Nacional del Agua, Conagua), Ministry of Environment and Natural Resources (Secretaría de Medio Ambiente y Recursos Naturales, Semarnat), Mexican Institute of Water Technology (IMTA), Guanajuato State Water Commission (Comisión Estatal del Agua de Guanajuato, CEAG), León Municipal Planning Institute (Instituto Municipal de Planeación León, IMPLAN), and Leon Drinking Water and Sewage System (Sistema de Agua Potable y Alcantarillado de León, SAPAL).
Table 1 presents the water management indicators evaluated in this study. The limits considered for each of the indicators were defined based on the historical period from 2010 to 2022:
The “Lower than” column shows the minimum average value expected for each indicator.
The “Between” column presents the total range.
The “Higher than” column represents the maximum value for each indicator.

Table 1.
Evaluated Water Management Indicators.
Table 1.
Evaluated Water Management Indicators.
| Indicators | Lower Than | Between | Higher Than | References |
|---|---|---|---|---|
| Access of the population to Potable Water and Sewerage Services (APPWSyS) (%) | 60 | 60–95 | 95 | [22,23] |
| Affordability (Affor) (%) | 0 | 0–100 | 100 | [24] |
| Social Perception of Customer Satisfaction (SPCS) (rating) | 0 | 0–10 | 10 | [25] |
| Ecosystem Preservation (PE) (m2/inhabitant) | 9 | 9–16 | 16 | [26,27,28] |
| Pressure Level (PL) (%) | 10 | 10–120 | 120 | [29] |
| Water Resource Availability (WRA) (m3/inhabitant/year) | 1000 | 1000–10,000 | 10,000 | [30] |
| Climate Change (CC) | 0.05 | 0.05–0.98 | 0.98 | [31] |
| Treated Wastewater (TW) (%) | 60 | 60–90 | 90 | [23] |
| Groundwater and Surface Water Quality (GSWQ (%) | 0 | 0–100 | 100 | [32] |
| Groundwater Extraction (GE) (%) | 0 | 0–100 | 100 | [33] |
| Treated Water Consumption (TWC) (%) | 0 | 0–100 | 100 | [25] |
| Flow Recovery Through Leak Mitigation (FRTLM) (L/s) | 0 | 0–130 | 130 | [34] |
| Energy Efficiency (EE) (%) | 5.3 | 5.3–44 | 44 | [34] |
| Degree of Implementation of Integrated Water Resources Management (DIIWRM) (%) | 0 | 0–100 | 100 | [31,35] |
| Social Participation in Water and Sanitation Management (SPWSM) (rating) | 0 | 0–10 | 10 | Table 4 |
2.1. Conceptual Framework
Integrated Water Resource Management in an Urban Drinking Water System
Within a municipality, water demands are very varied and, in general, competitive (domestic consumption, industrial use, irrigation, energy production, to name a few) and satisfying all these demands can lead to conflicts if the supply is scarce. This resource has played a crucial role in regional and national development, as for decades the expansive use of water in cities and industries has been based on the development of economic growth and infrastructure.
It is important to emphasize that the conventional water management model is characterized by drinking water supply and sanitation systems aimed at meeting water demand without considering natural availability, and the social or natural processes of the water cycle [36,37]. This causes that, when attending to a multiplicity of demands, it often becomes a fundamental problem when addressing integrated management [38]. Currently, in the state of Guanajuato, industrial development has increased, which has resulted in the drinking water systems in its municipalities facing problems in the areas of conservation, protection, and management of water resources.
Public water service is essential for urban and rural communities, forming part of the so-called vital services for the well-being, public health, and collective security of populations, as well as for economic activities and environmental preservation [39]. The United Nations has recognized the Human Right to Water and Sanitation, reinforcing the idea that all people have the right to sufficient, safe, acceptable, accessible, and affordable water for personal and domestic use. Water supply services are the primary vehicle for guaranteeing this right worldwide [40]. The management of water services must follow an integrated approach because historically, the technical management of the services has focused on the engineering side of the business [39]. That is, integrated water management seeks the sustainable integration of drinking water, sanitation, and sewer services into an integrative physical system [41] and it recognizes that this system is based on a common organizational scheme within the comprehensive vision, so that water conservation is envisaged as an interconnection with the natural landscape. Therefore, water resource management is approached from a perspective related to concepts associated with the environment and the problems generated by human activity.
The paradigm of integrated management is based on handling water through the availability and use of water resources in an alternative form and, at the same time, promoting the decentralization of the administrative process [2]. Integrated water management in an urban system involves land-use planning and zoning; economic development processes; regulation and legislation; education, citizen awareness, and the integration of society in the participatory management of water according to [42]. To achieve improvements in integrated water resource management, it is important to understand the urban water cycle. This sequence is manifested in infrastructures that, in some way, reflect the lag the demands originating from urban development processes, which could be termed reactive behavior of infrastructures concerning the needs of the population and environmental demands [43].
The traditional model is insufficient to demonstrate the complexity of the water problem in urban environments, which leads to clear inefficiencies. For example, the classic method of meeting various urban demands (private users in the domestic sphere, industrial users, irrigation of parks and gardens, street cleaning, etc.) [43]. Current urban water systems largely reflect a linear, non-integrated management model in the face of urban development that has not always been sensitive to the integrated and comprehensive nature of water resources, especially in urban settings [43]. Therefore, integrated management aims at handling general conflictive relationships surrounding the use and exploitation of water [38]. For this reason, it is important to consider the two principles of integrated urban water management mentioned by [41]; the first emphasizes planning and decision-making that includes all components of the water service and the landscape, and the second suggests that decision-making should be oriented toward sustainability in water management through balancing environmental, social, and economic interests in the short, medium, and long term. Consequently, sustainable management in an urban drinking water system must promote a transformation of the management model through changes in governance, so that urban water systems can transition from a linear, non-integrated approach to urban water systems that are embedded in new sustainable urban development [43].
Breaking down the concept of integrated water resource management reveals ideas that must be considered: coordinated management of water and territory; a joint vision of water and other resources (energy, in a very particular way); multiple competing demands that must be met equitably; economic efficiency; and respect for the natural environment [43].
Within integrated water management, an important phase is the evaluation and monitoring of action plans at the local scale, so it is necessary to have appropriate indicator frameworks that describe and communicate current conditions, foster critical thinking about needed corrective measures, and facilitate the participation of various stakeholders in decision-making processes [44,45,46].
One of the main strategic elements of integrated urban water management is the development of indicators that serve to provide essential information about the viability of a system and its rate of change, as well as how they contribute to sustainable development [47,48].
Efforts to evaluate and measure sustainable development have focused on proposing indicators and composite indices intended to gauge the degree of progress or achievement of the sustainable development objectives and goals [49]. Within these efforts, at least two types of contributions can be identified: the first includes those directed at proposing measurements of sustainable development through the construction of general or global indicators and indices more suitable to be applied at the national level.
The second contribution is related to measurements of sustainable development at the local scale; these intentions follow up on the initial proposals resulting from Agenda 21 [50] and the sustainable development indicators developed by the United Nations (UN) in its “Blue Book.” Indicators have been proposed in which the ideal value depends on the conditions and context of the country, as is the case in Mexico: the water situation is one of the most urgent problems faced by society.
Natural or man-made water scarcity requires making difficult decisions about the allocation of water resources among different users, with demands that grow at different rates. Therefore, indicators have become an instrument for federal government agencies, state and municipal authorities, and especially for the operators of drinking water services in the country. These have served to assess and compare the performance of the latter in their primary function through a battery of indicators that allow the state of water services, their operational and management efficiency, to be formally and standardly represented, thereby improving decision-making [51].
In the case of the state of Guanajuato, it has the Water Utilities Information System (SIOO), which has been an important input for the development of state hydraulic planning instruments through its performance indicators since 1995 to date, and collects information on urban public use; from this, management indicators are created to measure and evaluate the performance of the water utilities. However, it seems that adjustments are needed [52].
The concept of service sustainability is not yet as present as it should be, and long-term sustainability perspectives remain one of the key issues and challenges [39]. Maintaining a sustainable drinking water supply system is complicated, given the varied ways in which management is carried out according to local conditions, where sustainability of the resource, encompassing environmental, social, and economic aspects, is still ignored [53].
Under this context, it is necessary to have a set of indicators that are not limited solely to evaluating the conditions of urban public water supply, but that also serve as an instrument for integrated management, so that sustainable progress of the resource, efficiency in its use, and water governance can be measured.
2.2. Study Area
León is a Mexican city located in the state of Guanajuato, in the Bajío region. The city has a total population of 1,578,626 inhabitants according to INEGI in an intercensal survey 2015 [54], making it the most populous city in the Metropolitan Zone of León and the State of Guanajuato. The municipal territory covers an area of 1283.88 square kilometers (km2), equivalent to 3.87% of the state’s total surface area. It has an urban limit of 22,000 hectares, around 600 rural communities, as well as more than a thousand neighborhoods and subdivisions. León is part of a regional configuration known as the Mexican Bajío, as well as the well-known industrial corridor that runs through municipalities in both Guanajuato and Querétaro, which is crucial for economic growth [55].
The main source of water supply for the municipality comes from the Valle de León aquifer, which predominantly covers the municipality, with water used for domestic, public, commercial, industrial, agricultural, and livestock purposes. The urban public water supply and drainage service of the city of León is administered by SAPAL, a decentralized municipal public water utility whose function is to provide potable water, sanitation, and the reuse of treated water to the urban population [25] (see Figure 1). The population served in 2019 was 1,874,553 inhabitants in León. 95.1% of these residents have access to potable water, and 95.7% have sewerage services [23]. SAPAL is supplied by 119 wells, as well as by the El Palote dam, to offer the potable water service through a distribution network of 6264 km, in addition to having 3342 km of sanitary drainage and 240 km of stormwater drainage [56].
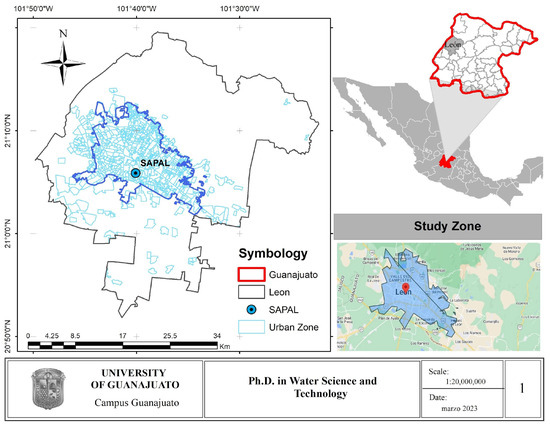
Figure 1.
Study Zone Location (SAPAL).
Additionally, apart from the water supply coming from the aquifer and the El Palote dam (surface water), there is the volume of treated water by SAPAL, which can be utilized for different purposes. In 2018, with 19 treatment plants, the coverage reached 94.8%, i.e., 52.9 mm3 of treated wastewater [57]. Of this volume, 30.4% (16.1 mm3) was utilized as follows: 1.6% for irrigating green areas, 5.7% in industries, and 92.7% for agricultural purposes; however, 69.6% (37 mm3) of the treated water that was not allocated to any productive use was ultimately discharged into federal channels [56].
According to various authors and the reviewed information, it is indicated that the city of León suffers from water scarcity and is associated with the current water management model; this is due to the high level of leaks and the low utilization of treated water [58].
2.3. Analytic Hierarchy Process (AHP) and Fuzzy Logic (FL)
According to the foundational principles, decision-making is defined as a process for selecting criteria and alternatives to solve a problem or achieve a goal [59]. Decision-making involves evaluating the options available and determining the course of action to undertake [60]. In every decision, key factors intervene, such as the value that each option holds for the decision-maker and the likely outcome. Moreover, risk and uncertainty play a fundamental role in any decision-making process [61]. Consequently, decision problems may exhibit a certain degree of variability in evaluation, judgment, and final choice. For this study’s decision-making, the quantitative method known as the AHP was employed. AHP enables the generation of priority scales based on expert judgments, which are expressed through pairwise comparisons using a preference scale and organized into a positive reciprocal matrix [62].
The values within the matrix are numerical, and the method imposes two logical restrictions to ensure valid results: (i) when an alternative is compared with itself, it is assigned “equal importance”, and (ii) if option i is assigned a value x when compared to alternative j, then in the reciprocal comparison (of j to i) the value must be 1/x.
For these pairwise comparisons in terms of preference or importance, the 1–9 scale and its reciprocal values established by [15,63] is employed.
Once all pairwise comparisons have been made and recorded in the matrix, the priority vector, which components represent the relative weights of each alternative, is determined.
The vector ω satisfies the following eigenvalue equation:
If the judgments expressed in the pairwise comparisons were perfectly consistent, the principal eigenvalue (λ) would be equal to the order of the matrix (n), that is, the number of criteria being compared. Otherwise, the principal eigenvalue necessarily satisfies the condition (λₘₐₓ ≥ n). In such cases, it becomes necessary to calculate the Consistency Index (CI) according to the following formula:
where λₘₐₓ represents the largest eigenvalue of the pairwise comparison matrix and n denotes its dimensionality.
A pairwise comparison matrix is deemed perfectly consistent if, and only if CI equals zero [15]. In other words, CI will reach a value of zero exclusively when all judgments are fully coherent.
In order to assess the degree of inconsistency, the computed CI is compared against the Random Consistency Index (IC*), which is the expected value of the consistency index for a randomly generated reciprocal matrix of the same order. Random consistency indices depend explicitly on the number of elements being compared and are drawn from empirical values reported by [64] and later corroborated by [65].
A matrix is considered valid in terms of consistency, if the consistency ratio obtained using the equation
does not exceed 10% [65,66]. If it is not possible to achieve the aforementioned, then the judgments made must be modified to improve the consistency ratio and ensure the reliability of the analysis [65,67].
2.4. Fuzzy Sets
Most phenomena encountered in daily life are imprecise in terms of their descriptive nature.
This imprecision may be associated with various attributes, such as shape, position, time, color, texture, among others. Typically, a given concept may exhibit different degrees of imprecision depending on the context or overtime. FL examines the elements of traditional logic applied to fuzzy values.
The elements of a fuzzy set are ordered pairs that represent the value of the element and its degree of membership within the set. Unlike Aristotelian logic, where membership is binary (0 or 1), FL allows for intermediate values of membership. Consequently, FL provides a framework for managing uncertainty inherent in data structures. In essence, FL can be regarded as a “language” that enables the translation of natural language statements into formal mathematical expressions [68]. Furthermore, fuzzy sets constitute a generalization of classical set theory, as introduced by [68]. A fuzzy set is defined as a set in which the membership of an element is determined in a fuzzy manner. Specifically, if X represents the universe or reference set, a fuzzy subset, denoted as A, is one where the membership of an element x ∈ X is assigned a truth value from the continuous interval [0, 1]. The degree of membership of an element x is determined by its membership function or characteristic function μA(x). Thus, a fuzzy subset can be defined as A = {x ∈ X}, being its membership function:
where 0 indicates non-membership in set A and 1 represents absolute membership. Clearly, there is a degradation in the membership level, such that if , the membership level of element x is very high, and if
, the membership level of x is very low. This can be interpreted as the degree to which a particular element under consideration satisfies the specifications that define the elements of the set in question. Therefore, the membership function provides a measure of the degree of similarity of an element from set X with the fuzzy set.
The form of the membership function used depends on the criteria applied in solving the specific problem at hand and will vary depending on the user’s perspective. The use of complex functions to define fuzzy concepts does not necessarily provide greater accuracy. Thus, membership functions are generally kept simple to facilitate mathematical computations without sacrificing precision. Conceptually, there are two approaches for determining the characteristic function associated with a set: the first approach is based on expert human knowledge, while the second approach involves using a data collection to design the function.
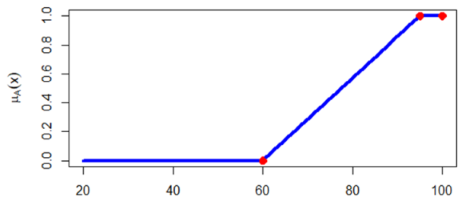
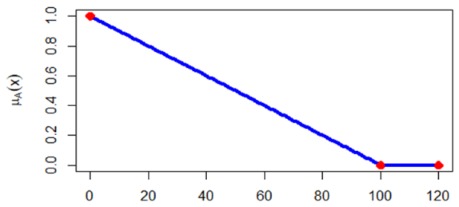
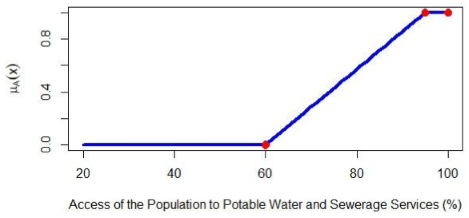
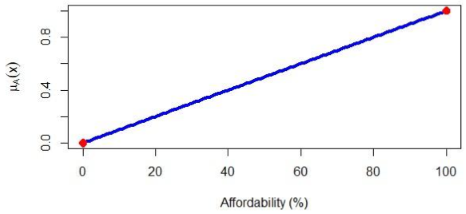
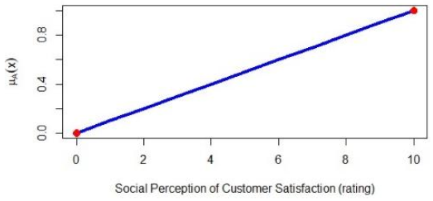
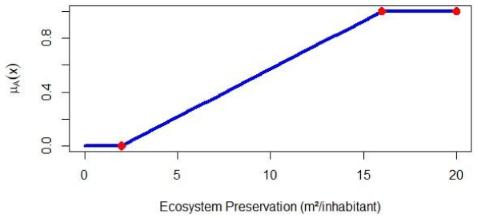
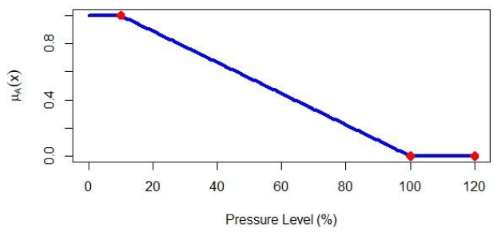
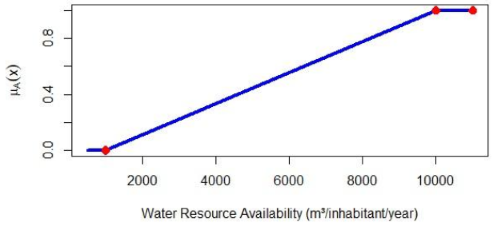
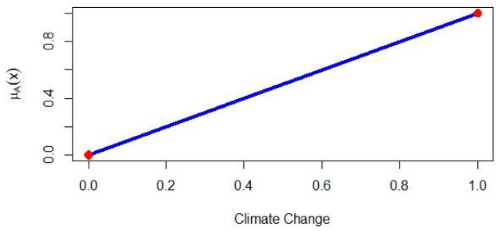
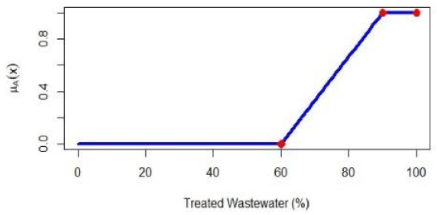
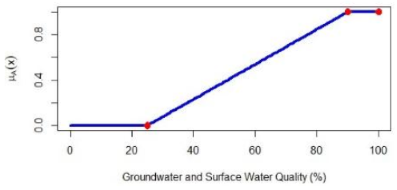
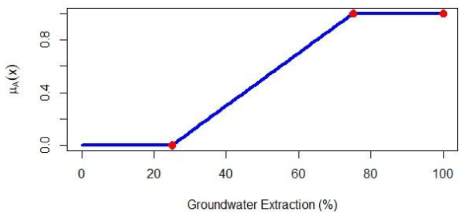
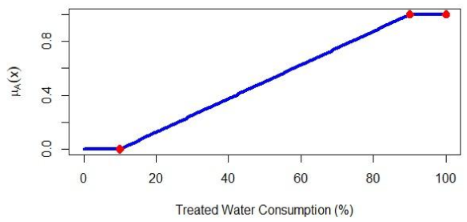
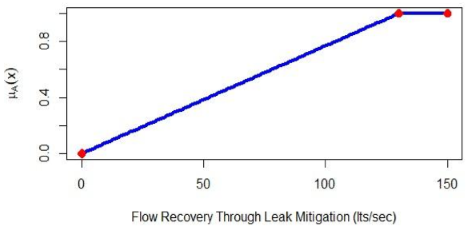
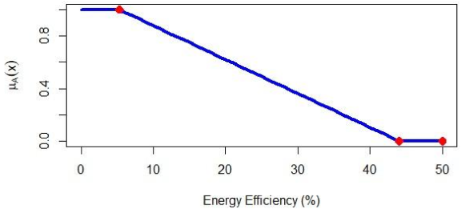
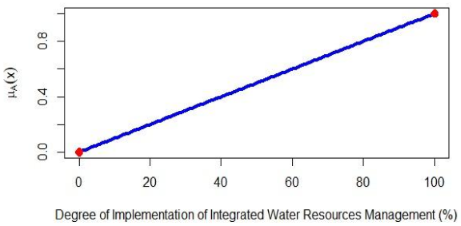
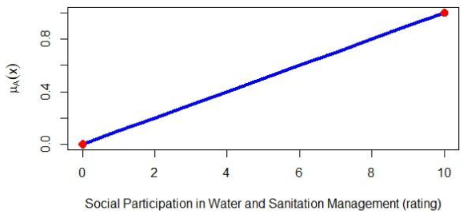
To determine whether the proposed indicators for each component exhibit optimal or unfavorable trends in water management, the membership degree was established according to the ranges provided in Table 1. In this work, the membership functions formed for the different indicators were the Gamma function and L (1 − γ). The indicators that best fit the Gamma function are (Population access to drinking water and sewerage services, affordability, social perception of customer satisfaction, ecosystem preservation, water resource availability, treated wastewater, groundwater and surface water quality, treated water consumption, flow recovery through leak mitigation, degree of implementation of integrated water resources management, and social participation in water and sanitation management), while the indicators that fit the L function are (Energy efficiency and pressure degree). The Gamma function represents indicators where higher values are desirable, while the L function represents indicators where lower values are desirable. Table 2 shows, as an example, the Gamma and L functions for the studied indicators. In this case, the X-axis will be related to the range values of each indicator.

Table 2.
Gamma and L membership functions.
3. Results
3.1. AHP Method
In this study, ten experts were consulted as decision-makers from different public authorities—namely, the Guanajuato Municipal Drinking Water and Sewerage System (SIMAPAG), the Silao Drinking Water and Sewerage System (SAPAS), and SAPAL—as well as specialists in water management, water resources, hydraulics, and environmental protection. These experts were contacted and provided with information digitally in April 2021. The interviews were conducted both virtually and in person. To obtain the weighting of components and indicators, experts used the scale developed by [15], comparing each of the elements in a comparison matrix, where the requirements of AHP, and described in Section 2.3, were strictly followed, including CI [65,67]. There was no weighting of the ten experts, so their opinions are considered equal. The numerical results were validated and aggregated, according to [15,64,66], which are shown in Figure 2.
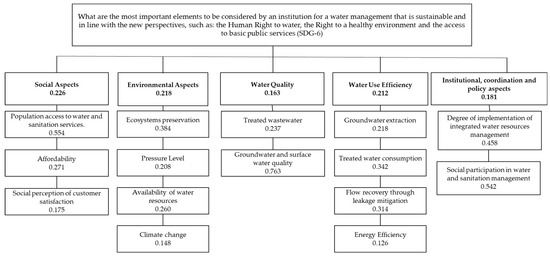
Figure 2.
Hierarchical Structure for the Identification of Key Elements Influencing Sustainable Water Management.
The hierarchical model depicted in Figure 2 illustrates the weighting assigned to each indicator based on the five components and the importance of each; thus, it enables the identification of the most relevant components and indicators. Based on the evaluation of the proposed indicator model, the categories deemed most significant, those that the SAPAL utility must prioritize to achieve sustainable water management in the case study, are those aligned with contemporary perspectives, namely: the human right to water, the right to a healthy environment, and access to public services. The components directly associated with these approaches are the social and environmental aspects.
The results presented in Figure 2 indicate that the most relevant factors are those related to social and environmental well-being. By prioritizing the indicators that require the most attention, the social and environmental components, with a weighting of 22.6% and 21.8%, respectively, highlight the following key aspects: population access to potable water and sanitation services, ecosystem preservation, and water resource availability. These indicators are particularly significant as they are closely linked to emerging perspectives on the human right to water, a healthy environment, and access to basic public services. Additionally, they are influenced by critical factors such as health, poverty, and the degree of ecological and environmental degradation.
Regarding the water use efficiency (21.2%) and water quality (16.3%) components, as well as their respective indicators, the results suggest that the water utility (OO) should prioritize treated water consumption, flow recovery through leak mitigation, and surface and groundwater quality. These indicators have a substantial impact on achieving sustainable water management, as they are essential for social and economic development. Notably, water resource management plays a pivotal role in eliminating and/or reducing undesirable water characteristics, thereby ensuring higher water quality tailored to specific uses. In this regard, it is crucial to implement strategies for water reuse, avoiding the unnecessary use of potable water for non-essential activities, thus enhancing water use efficiency.
Finally, the institutional, coordination, and policy aspects component (18.1%) stands out as one of the most significant due to the nature of its indicators, which focus on integrated water management. This component strengthens water governance policies and fosters public awareness and citizen participation in water resource management, reinforcing the principles of sustainability and resource conservation.
3.2. Results of the FL Analysis for Each Component
To understand the behavior of the proposed indicators over time, official data from 2010 to 2022, validated by various governmental institutions, was analyzed. For this purpose, linguistic variables (the concepts used to classify the fuzzy form) and the universe of discourse (the range of values that the elements possessing the property expressed by the linguistic variables can take) were specified. The ranges assigned to most of the elements are: 0, 0.25, 0.5, 0.75, and 1. Subsequently, a linguistic value was assigned to each of the linguistic variables, which is the classification applied to the different indicators, i.e., the degree of impact that an indicator could generate if it exceeded certain thresholds. With this, a fuzzy set was defined, representing the union between the linguistic values and their corresponding values within the universe of discourse, as well as the supporting fuzzy sets [69]. Then, based on the structure of the available information, the function that best fits was defined, starting from an ideal or deteriorating situation. Successive values indicate a point from which the situation of a given indicator can evolve either towards improvement or further deterioration. The software R [19] was used to analyze data and obtain fuzzy values, corresponding graphs, and the implementation of the membership functions of the FL method (Table 3).

Table 3.
Membership functions of FL for each component with their indicators.
For the fifteen proposed indicators, the most comprehensive data available was utilized. Nonetheless, for certain years within the study period (2010–2022), data gaps were identified. In such cases, the missing values were estimated by calculating the average based on the available data from other years. The results obtained for the case of the city of León illustrate the potential of the developed indicator framework to evaluate the process of integrated urban water management. This framework aims to provide a more holistic perspective, grounded in the human right to water, the right to a healthy environment, and equitable access to basic public services. The results for each indicator are presented below.
3.2.1. Social Aspects
Population Access to Drinking Water and Sanitation Services. For this indicator, the proportion of the population served by the Water utility with access to drinking water and sanitation was calculated relative to the total population of the municipality of León. The result of the fuzzy classification for population access to drinking water and sanitation services reflects the degree of impact associated with this indicator. In this case, over 90% of the population in León has access to drinking water and sanitation services. This implies that membership values increase linearly toward the right of the scale, indicating that values closer to 0 represent an unfavorable condition, while those approaching 1 denote a highly favorable situation. Therefore, in linguistic terms, the condition of this indicator is classified as very high and excellent, with a clearly positive trend.
Affordability. According to the United Nations Development Programme (UNDP), water and related services must be affordable for all, suggesting that the cost of water should not exceed 3% of household income. To determine whether water is affordable in the city of León, the monthly cost of water consumption per cubic meter was compared to the income ranges of the city’s residents. The income ranges considered were: one minimum wage (MW), more than one and up to two MWs, more than two and up to three MWs, and more than three and up to five MWs. To estimate the affordability percentage for each income level, the upper limit of each range was used. For instance, in the case of the income level between more than one and up to two MWs, the value of two was taken, and so on. In the municipality of León, approximately over 50% of the employed population earns between one and three MWs. According to the results, for this segment of the population, the cost of water still exceeds 3% of their income. This means that, under the FL conditions, the membership values are closer to 0, indicating that water is not affordable for more than half of the city’s residents. Only 20% of the population earning more than three MWs is water considered affordable.
Social Perception of Customer Satisfaction. The communication department of the Water Utility (OO) conducts user surveys on-site at its facilities. The questionnaires use a scale from 0 to 10, where 0 represents the lowest rating and 10 the highest. The values for this indicator were provided by SAPAL. According to the results of the FL analysis, a positive trend is observed, with membership values approaching 1. This indicates that users express a generally favorable level of satisfaction with the services and customer care provided by SAPAL, with annual average ratings ranging between 8 and 9.
3.2.2. Environmental Aspects
Ecosystems preservation. This indicator relates the surface area of public municipal green spaces—such as public gardens, urban parks, metropolitan and linear parks—to the urban population. According to the FL analysis, this indicator was evaluated based on the standards established by the World Health Organization (WHO) and the Inter-American Development Bank (IDB), which recommend a minimum green area index of 9 m2 per inhabitant for intermediate cities. According to the results, the city of León reports figures ranging between 2 and 5.5 m2 of green area per inhabitant. This implies that the corresponding membership values are very close to 0. Under the FL framework, this places the indicator’s condition in a critical to deficient range, representing the lowest classification. This insufficient green space coverage fails to support the maintenance of biodiversity and the delivery of essential environmental services necessary to improve environmental quality. Urban green spaces play a key role in connecting peripheral ecosystems with the city, thereby enabling the continuity of ecological flows. Additionally, the existence of urban green areas contributes significantly to the quality of life and the health of the population.
Pressure Level. It represents the ratio between water use for different purposes and the surface- and groundwater availability by region, which indicates the degree of pressure on water resources. To define the values in the universe of discourse for this indicator, Table 1 was considered. These were defined with the following linguistic values: the degree of pressure may be “very high,” “high,” “medium,” “low,” or “no stress.” It is considered that if the percentage exceeds 40 percent, severe water-stress conditions may occur. According to the results of FL, this means that as the degree-of-pressure values increase, they approach zero—an indication of an unfavorable situation. This indicator shows values above 40 percent; therefore, a high or very high degree of pressure is exerted. This is due to the water demand for the city’s various uses and users, which grow and intensify at different rates. In such cases, the volumes of extracted water exceed natural availability, affecting not only surface- and groundwater reserves but also intensifying competition among different uses—potentially increasing resource pressure and causing deficiencies in the water supply of the city of León.
Water Resources Availability. This indicator was evaluated by estimating the volume of water allocated per inhabitant. The linguistic values for this indicator range from “very high,” “high,” “medium,” “low,” “very low,” to “extremely low” (i.e., less than 1000 m3/inhabitant/year). During the study period, the city of León has an availability of only 50 m3 per inhabitant per year—classifying it as “extremely low” availability, a wholly unfavorable condition. Such levels carry potentially severe consequences and may seriously compromise the city’s food security. It is important to note that the observed variations in water availability over time depend primarily on changes in population size rather than on a decrease in precipitation.
Climate Change. This is a composite indicator, so called because its construction involved a dimensionless numerical index combining three variables: temperature, precipitation, and drought. For the data analysis and to obtain the fuzzy values and corresponding graphs for these three variables, we adopted the approach proposed in [69]. To that end, we used annual data for the period 2010–2022 from the conventional climatological stations of the National Water Commission’s (Conagua) national network, selecting those meteorological stations located within or near the study area. To compute both the historical mean and the study-period mean for precipitation and temperature, we retrieved all available records from each station of the National Meteorological Service [31]. Regarding drought, we used data from the North American Drought Monitor and adopted the index formulation also described in [69].
Once the annual data for each variable were assembled, we calculated the product of their fuzzy membership values for the study period, applying an equal weight (1/3) to each variable. The results show that in the years 2010, 2013, 2015, and 2016, with index values between 0.95 and 0.99, there was very little impact from climate change—meaning that during those years precipitation increased significantly, temperature remained stable, and drought severity was low. Conversely, 2011 exhibited an extremely high impact, characterized by a severe reduction in precipitation, critical increases in maximum temperatures, and a very intense drought. For the remaining years of the study period, the climate-change impact is high, as evidenced by index values very close to zero. This implies that declining precipitation and rising high temperatures are having substantial effects on water availability and quality, leading the water utility (OO) to face increased operating costs and distribution challenges.
Moreover, water availability remains low because population growth outpaces any increase in supply, intensifying competition for the resource. Considering that Guanajuato is a semi-arid region with cyclical droughts and, by contrast, sporadic torrential rains, these hydrological extremes greatly increase exposure risk. Under a future climate-change scenario—where precipitation levels are expected to decline further—already strong pressure on water resources would intensify, exacerbating competition among users and potentially undermining the city’s potable-water supply. This is especially critical given the region’s constant economic and demographic growth. From a social perspective, water scarcity can increase the vulnerability of disadvantaged populations, particularly in rural and peri-urban areas where access to safe drinking water is already limited. Such conditions may exacerbate pre-existing inequalities, compromise public health, and intensify conflicts over the allocation and distribution of the resource. From an economic standpoint, limited per capita water availability constrains productive activities, especially in sectors such as agriculture and local industry, which are directly dependent on water resources. Insufficient supply can reduce productivity, raise operational costs, and discourage investment, ultimately hindering regional economic growth. Furthermore, it necessitates the prioritization of water allocation, potentially generating tensions among economic sectors with unequal levels of political influence. Politically, water scarcity underscores the urgent need to strengthen water governance. Low availability is not solely attributable to natural conditions but may also reflect deficiencies in planning, allocation, and regulatory frameworks. It is therefore essential that policymakers move beyond a purely quantitative assessment and recognize the structural implications of scarcity. This entails advancing conservation policies, enhancing water supply and sanitation infrastructure, and fostering integrated water management grounded in principles of equity, sustainability, and participatory governance.
3.2.3. Water Quality
Treated Wastewater. This is considered a guiding and priority indicator for the León Water and Sewerage System (SAPAL), owing to the sustained increase in water consumption driven by a growing population. Consequently, larger volumes of wastewater are generated. SAPAL operates 21 treatment plants, whose continual expansion in both installed capacity and treated flow has achieved over 90% coverage—equivalent to 59.5 million m3 per year. Notably, León’s treatment coverage exceeds the 2020 national average of 67.5%. Under the FL analysis, as the percentage of treated wastewater increases, membership values approach 1, indicating a clearly favorable trend over the study period.
Surface and Groundwater Quality. Water quality was assessed using the Water Quality Index (WQI), the most widely adopted among existing indices. To calculate the WQI, nine parameters defined by the U.S. National Sanitation Foundation (NSF–1970) were used: fecal coliforms (NMP/100 mL), pH, five-day biochemical oxygen demand (BOD5, mg L−1), nitrates (NO3, mg L−1), phosphates (PO4, mg L−1), temperature (°C), turbidity (NTU), total dissolved solids (mg L−1), and dissolved oxygen (DO, % saturation). Data were obtained from CONAGUA’s national monitoring network for surface and groundwater (2012–2020), including lotic bodies (the Turbio and Lerma rivers, upstream and downstream) and various groundwater monitoring sites. For years with incomplete records (2010–2012, 2021–2022), available values were averaged. The WQI was computed using the “Calculating NSF Water Quality Index” software version 2020 [70]. Across all evaluated sites, WQI scores ranged between 25% and 50%, indicating very poor water quality—the worst possible classification. Such conditions lead to loss of biodiversity, ecosystem degradation, disruption of food chains, and waterborne diseases, adversely affecting human health.
3.2.4. Water Use Efficiency
Groundwater Extraction. This indicator considers domestic, commercial, and industrial uses. First, billed volume was compared to total groundwater extraction to determine each sector’s share and its evolution over time. Domestic use remains the largest share, although its percentage has declined, while commercial and industrial shares have risen. From 2010 to the most recent year, extraction increased by 2%, reflecting population growth and expanded economic activity. However, the shift toward productive uses suggests SAPAL’s operational priority lies with economic users. Under our FL scheme—where a decrease in domestic share is penalized (assigned 0) and an increase in productive share is penalized, whereas stability or reduction in productive share is rewarded—results show no proportional increase in domestic allocation but a rise in productive allocation from 6% to 8.4%. Although extraction volumes have generally grown, year-to-year comparisons reveal occasional decreases, aligning with broader efficiency objectives. For this indicator, weights of 50% domestic, 25% commercial, and 25% industrial were applied.
Treated Water Consumption. Based on SAPAL’s 2013–2022 annual reports, fuzzy values for treated water consumption (CAT) were tabulated (see Table 3). CAT ≤ 10% indicates consumption below the national average, while CAT ≥ 90% signifies high consumption above average. León’s CAT has steadily risen, currently classified as “regular” (30% < CAT ≤ 50%). Reuse and exchange are categorized as: direct reuse (use of treated effluent before discharge), indirect reuse (use after discharge into a receiving body), and exchange (use of treated effluent in place of fresh supply). To promote efficient water use and sustainable resource management, SAPAL allocates 20% of its capital works budget to sanitation and reuse initiatives.
Flow Recovery by Leak Mitigation. Calculated as the difference between total extraction and annual billed volume, this indicator reflects both physical losses (visible and non-visible leaks in supply lines, network, tanks, connections, valve boxes) and non-revenue water (illegal connections, meter under registration, billing errors). For 2020–2022, missing annual data were averaged. Results show, for example, that the highest recovery occurred in 2019 (130 L/s), whereas in 2017 losses reached −129.3 L/s. Under FL, values ≤ 0 L/s denote the worst condition, while positive values indicate improvement. SAPAL’s current recovery is “regular,” supported by comprehensive water balances and loss-reduction programs.
Energy Efficiency. Defined as the ratio of electrical energy expenditure to total operating costs, expressed as a percentage. Membership functions classify >44% as “very poor” (the worst condition), reflecting scenarios where energy costs exceed 50% of total expenses—common in smaller utilities and detrimental to financial health. Values between 15% and 20% are “regular” at the national level, enhancing operational savings. SAPAL’s energy efficiency lies between 10% and 15%, yielding the most favorable membership values (closest to 1). This indicates a strong operational efficiency and provides insight into the utility’s financial robustness.
3.2.5. Institutional Aspects of Coordination and Policy
Degree of Integrated Water Resources Management (IWRM) Implementation. Measured on a 0–100 scale via a 33-question national survey developed by UNEP, this indicator assesses IWRM stages—risk identification, analysis, evaluation, control, mitigation, preparedness, response, recovery, and reconstruction [35]—across all government levels and societal sectors. Only 2018 and 2020 data were directly available; values for 2010–2017 and 2021–2022 were averaged. IWRM implementation scores fall within the 25–50% range, which under FL produces membership values near 0 (an unfavorable trend). Although most IWRM elements are institutionalized, the global objective remains unmet, underscoring the need for specific national targets to advance this framework.
Social Participation in Water and Sanitation Management. Evaluated via a ten-question rubric (Table 4) that examines engagement between SAPAL, its auxiliary bodies (the Subsurface Water Technical Committee, COTAS, and the Basin Council), and end users. FL results yield membership values close to 1, suggesting a favorable participatory condition. However, no concrete evidence of collaboration with either auxiliary committees or users was found, hampering the identification of durable, cost-effective, and socially and environmentally sound solutions. Only 2022 was directly assessed; values for 2010–2021 were averaged. The rubric is intended as a tool for future data collection and implementation.

Table 4.
Rubric of Social Participation for the León Water and Sewerage System (SAPAL).
3.3. Combination of AHP and FL Methodologies for Index Construction
With the aim of estimating the water-management index in the municipality of León, SAPAL combined the AHP and FL methodologies.
Below, as an example (year 2010; see Table 5), the procedure for calculating the weighted component related to social aspects is presented.

Table 5.
Social Aspects Component.
As a first step, one must evaluate the historical values corresponding to the indicators of (1) population access to water and sanitation services, (2) affordability, and (3) social perception of customer satisfaction within each membership function. In this way, the values recorded in the “membership” columns are obtained, which we denote as:
corresponding to the population-access indicator,
corresponding to the affordability indicator, and
corresponding to the social-perception-of-customer-satisfaction indicator.
Subsequently, to compute the weighted component associated with social aspects, given the eigenvector for the analyzed component, which we denote ω1 and take the product of this eigenvector with the linear combination of the membership values and the eigenvectors associated with the indicators (denoted δᵢ for i = 1, 2, 3). Thus, for example:
Finally, the water management index is calculated as the sum of each of these weighted components for each of the proposed indicators. Specifically, for the year 2010, the water management index is:
0.088 + 0.060 + 0.066 + 0.110 + 0.106 = 0.43
A summary of the other four components is included in Appendix A (Table A1, Table A2, Table A3 and Table A4), Table 5 and Figure 3 are presented as an example. For estimating the water management index for the SAPAL operating organization, the absence of values in certain years was considered by using average values for some of the previously described indicators. Therefore, in Table 6, the values of the components in the shaded cells correspond to those where the average was applied. In this manner, the same procedure was applied for each year of study to obtain the water management index.
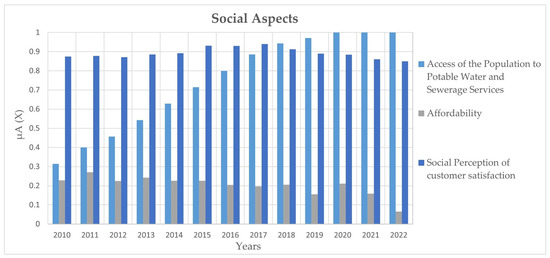
Figure 3.
Social Aspects component.

Table 6.
Water Management Index for Urban Water Supply in León, Guanajuato.
Considering the FL framework, a membership value closer to 1 indicates that the water utility (OO) exhibits a favorable condition for demonstrating sustainable management and provides a comprehensive view of the water-resource challenges. Conversely, values approaching 0 denote unfavorable conditions—meaning the OO is not accounting for all areas that deserve monitoring and thus fails to present an integrated picture of local water management for municipal welfare.
As seen in Table 6, there is little variation among the different components because each set of indicators carries similar weight in their potential impact on redirecting water management. From the outcome analysis, the Social Aspects component has the highest average value (0.14). Linguistically, this signifies that its constituent indicators are highly relevant to sustainable water management and closely aligned with emerging perspectives—such as the human right to water—thereby underscoring the importance of social-wellbeing indicators.
The Institutional Aspects of Coordination and Policy component ranks second (average 0.11). This reflects that its indicators are oriented toward modern water-management paradigms that support sustainable development by advancing actions for water-quality protection and equitable resource allocation. Social participation emerges as a promising avenue for further improvement. It should be noted, however, that this component’s average was influenced by the imputation of missing values over the study period.
The Water-Use Efficiency component, which encompasses indicators related to conservation and reduction in losses, yielded an average of 0.09—indicating a negative trend. This implies that SAPAL has not yet implemented sufficient measures or improvements to reduce extraction volumes across domestic, commercial, and industrial sectors. Consequently, it lacks the strategies necessary to improve treated-water consumption rates and leakage recovery, which would reduce both costs and environmental impacts, alleviate aquifer overexploitation, and enhance water quality for its intended uses. Promoting reuse of non-potable water for certain activities could bolster overall efficiency.
Regarding the Water Quality component—which combines treated-effluent coverage and surface/groundwater quality—the average result is 0.063, one of the lowest and most unfavorable. Laboratory analyses of physicochemical and microbiological parameters from both surface and groundwater monitoring sites demonstrate poor water quality, with negative repercussions for ecosystems, human health, and water usability. Therefore, treated-wastewater infrastructure is essential to safeguard the hydrological cycle. In response, SAPAL has revised municipal industrial-discharge regulations, negotiated non-discharge agreements, and is planning a future reuse scheme—with commercialization—to establish dedicated tariffs and revenue streams. Such reuse offers a significant advantage by offsetting operational costs and mitigating poor water quality.
Finally, the Environmental Aspects component is the closest to 0, mirroring a negative outcome like Water Quality. This reflects that most of its indicators lie beyond SAPAL’s direct purview.
Overall, the average Water Management Index for urban supply in León is 0.45—deemed unacceptable and indicative of negligible progress. An ideal scenario for SAPAL would manifest as a positive trajectory with values near 1; any lower values or downward trends are undesirable (Figure 4). These findings reveal that SAPAL currently lacks water-management indicators attuned to the city’s socio-environmental context and the ongoing water-scarcity crisis in León. Consequently, the human right to water and sanitation is not being guaranteed, nor is a sustainable, equitable use of surface and groundwater that preserves ecosystems. Moreover, community engagement in resource management and planning—a cornerstone of public awareness—is absent, undermining efforts to secure efficient and sustainable practices that reconcile demand satisfaction with environmental administration.
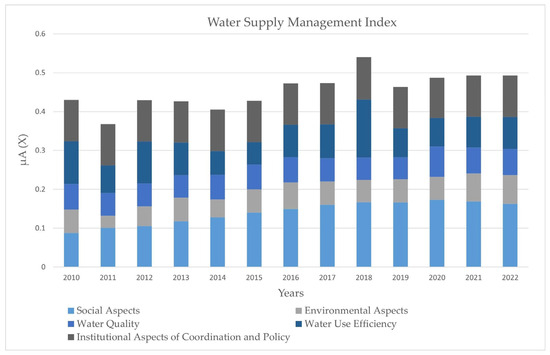
Figure 4.
Water supply management index.
3.4. Discussion
For the analysis of the results obtained, it is useful to contrast the index applied in this study with other widely used international frameworks, such as the Water Sustainability Index (WSI), the City Blueprint Approach, or the European WISE indicators (Water Information System for Europe). These indices share the common objective of assessing the sustainability of water management, but they differ in their focus, scale of application, methodological complexity, and the degree to which social, environmental, and institutional variables are integrated.
For instance, the WSI combines data on water availability, demand, quality, and governance, producing a comprehensive approach that enables the identification of water-stress areas at the national or regional level. By comparison, the index developed in this study is focused on a local (municipal) scale, which allows for a more detailed territorial assessment, albeit with reduced regional comparability unless its components are standardized. Nevertheless, the results of both highlight similar trends regarding pressure on water resources in areas with high population density and limited natural availability.
The City Blueprint Approach, in turn, includes indicators on urban resilience, water-use efficiency, wastewater treatment, and citizen participation, offering a holistic perspective of urban water performance. Compared with this approach, the local index presents lower complexity but greater adaptability to specific contexts, which can be advantageous in municipalities with limited institutional capacities.
Finally, the WISE indicators, promoted by the European Environment Agency, are designed to monitor compliance with European directives related to water quality and integrated basin management. Although they operate at national and supranational scales, some of their indicators—such as water-use efficiency or the percentage of water bodies in good ecological status—could be incorporated as reference points to strengthen the international comparability of the proposed index.
Taken together, these comparisons highlight both the strengths of the local index—particularly its territorial relevance and low data requirements—and its limitations in terms of international comparability and thematic coverage. Therefore, future versions of the index could benefit from greater methodological harmonization with international frameworks, while preserving its contextualized and participatory orientation.
In Figure 5, we compare the index derived from the management indicators currently employed by SAPAL with the proposed index—one built around indicators that support an integrated urban water management approach and offer a deeper understanding of the process’s multifaceted dimensions.
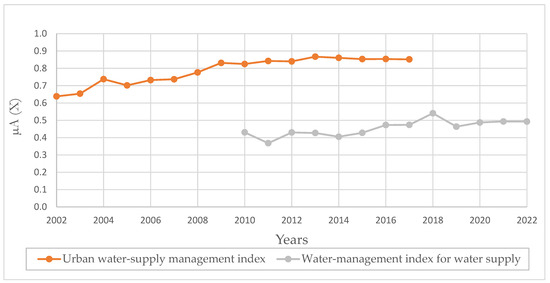
Figure 5.
Comparison of Water Supply Management Indices for the City of León, Guanajuato.
In this context, with respect to the urban water-supply management index—as shown by the analysis in [20] and illustrated over time in the accompanying figure—the water utility achieves an average score of 0.79. This result reflects the fact that the water utility’s chosen indicators emphasize a technically-oriented, engineering-centric approach to water services. A substantial share of all investments in water services is dedicated to expanding, maintaining, and upgrading infrastructure, in accordance with those indicator priorities. Consequently, the management metrics employed by the drinking-water and sewer systems are designed to develop and implement programs that optimize operational efficiency, demonstrating that the prevailing urban water-management paradigm has reached a critical juncture demanding urgent public-policy interventions.
By contrast, the proposed water-management index—whose composing indicators track emerging approaches and perspectives in modern water governance—yields an average value of only 0.45 for SAPAL. These new indicators monitor the sustainability of water use, which is essential for guiding public-sector management and for carrying out fully integrated water-resource planning and programming (in line with sustainable-development objectives). In this sense, the proposed indicator set will enable water utility to appreciate the importance of sustainable resource planning by quantifying variables such as water-scarcity stress levels, the percentage of treated water, changes in water-use efficiency over time, affordability, shifts in the extent of water-related ecosystems, and the impacts of climate change.
Therefore, it is imperative that the water utility adopt indicators that capture the complex interplay between society and the environment, thereby providing a holistic view of León’s unfolding water crisis. Such a multidimensional perspective—grounded in the latest governance approaches—will allow water-management to be reoriented toward fulfilling both social needs and the imperatives of a healthy environment. A comparative analysis of the two indices makes clear that the traditional management metrics used by water utilities are inadequate for the forward-looking institutional perspectives now required.
The adoption of the proposed index by water managers may constitute a valuable tool to enhance efficiency, equity, and sustainability in water resources management. For this index to be effective in real-world decision-making contexts, certain criteria must be met: First, the index should be incorporated into existing public policies and regulatory frameworks, which require collaborative efforts among all stakeholders to ensure its relevance is acknowledged in water resources planning and management. Second, water managers could employ the index as an instrument for inter-institutional communication and engagement with society. By synthesizing complex information into a single value or a set of comprehensible indicators, the index would facilitate dialogue among diverse actors, thereby promoting transparency in decision-making processes.
Nevertheless, for its adoption to be effective, a participatory validation process is necessary, involving local stakeholders, technical experts, and decision-makers. Such a process would ensure that the indicators embedded in the index adequately reflect territorial priorities, and that the required data are either available or can be sustainably generated. Finally, the index could be integrated into existing water resources monitoring and evaluation platforms or be employed as a criterion for resource allocation.
4. Conclusions
This research was aimed at developing an urban public-supply management index, using SAPAL as a case study, in order to propose a methodology that integrates an indicator framework aligned with current water-management requirements—namely, the human right to water, the human right to a healthy environment, and Sustainable Development Goal 6 (SDG 6).
These indicators are intended to measure progress toward sustainable development, monitor policy impact, and foster citizen participation, thus prioritizing a shift from the conventional paradigm toward integrated urban water management.
Within this framework, to construct the urban public-supply management index for the city of León over the period 2010–2022, fifteen indicators were proposed and measured, grouped into five components: social aspects (3 indicators), environmental aspects (4 indicators), water quality (2 indicators), water-use efficiency (4 indicators), and institutional/coordination and policy aspects (2 indicators). These measurement instruments made it possible to identify which indicators are priorities for use or require greater attention in the management of water supply, thereby providing a comprehensive overview of the challenges facing the city.
Based on the FL analysis, we determined the trends shown by the indicators, identifying those aligned with current water-management approaches and those that require greater focus. Thus, elements whose values are closer to 1 have the greatest impact on new water-management paradigms; conversely, those nearer to 0 hold less relevance for today’s water-management requirements, as set out in SDG 6. The water-management index calculated for the water utility using the proposed indicators shows negative progress, with an average value of 0.45. This value is wholly insufficient and unfavorable, indicating that the indicator set does not follow an integrated approach. It implies that water-resource management has not achieved the clear criteria of sustainability and resilience demanded by coordinated, shared responsibility—namely, a consensus-based decision-making process among basin authorities, water utilities, municipal government, and civil society.
From an urban perspective, there is also a deficiency in developing local capacities for water-resource management, since the water utility lacks comprehensive indicators for conducting fully integrated planning and programming. This prevents it from tracking the sustainability of water use—a fundamental prerequisite for guiding public management of water resources considering the crisis currently affecting the service area. Good management must not focus solely on demanding more resources, enacting better laws, implementing more efficient systems, or building mega-projects; it must also embrace an ethical vision that considers the impact of actions and decisions on both society and the environment.
Accordingly, we proposed indicators as an alternative means of achieving integrated water management that contributes to improving the population’s quality of life. The proposed indicator suit proved to be a practical, useful, and replicable tool, even when data availability or system knowledge was limited. We achieved the objective of evaluating León’s urban public-supply system to understand current conditions and underscore the need for more effective measures. An important next step for this proposal is to present it to stakeholders to refine and improve the indicators, ensuring they are accepted and used by decision-makers.
While it is recognized that data quality and the potential subjectivity inherent in the AHP method may constitute a limitation, this does not undermine the validity of the results presented herein. This highlights the need to strengthen local monitoring systems. Although this aspect is only marginally addressed in the present study, it is equally crucial to foster transparency in the management of public data and to enhance the institutional and technical capacities of municipalities, particularly through water utilities, so that such tools can be applied more extensively and on a continuous basis.
Looking forward, this framework could serve as a valuable basis for comparative studies in other contexts and for integrating more complex indicators—such as water security, system resilience, governance, and water culture, among others.
Each region may exhibit unique characteristics regarding water availability and demand, and although the index was developed and applied in a single municipality, its methodological structure allows for consideration of its potential replicability in other regions or countries, whether under similar or different conditions. In contexts with comparable characteristics such as climate, water availability, institutional framework, or management challenges, the transfer of the index could be relatively straightforward, requiring only minor adjustments related to the availability and resolution of local data. In such cases, the index could serve as a useful tool for comparing the situation of the studied municipality with other jurisdictions, identifying regional patterns, and guiding management strategies at a broader scale.
Author Contributions
Conceptualization, D.T.-Z. and X.D.-G.; methodology, J.L.M.M. and X.D.-G.; software, M.M.G., J.L.M.M. and X.D.-G.; validation, M.M.G., J.L.M.M. and X.D.-G.; formal analysis, M.M.G., D.T.-Z., A.C.O., J.L.M.M., J.M.R., H.M.R. and X.D.-G.; investigation, M.M.G., D.T.-Z., A.C.O., J.L.M.M., J.M.R., H.M.R. and X.D.-G.; resources, M.M.G., D.T.-Z., A.C.O., J.L.M.M., J.M.R., H.M.R. and X.D.-G.; data curation, M.M.G. and J.L.M.M.; writing—original draft preparation, M.M.G. and X.D.-G.; writing—review and editing, M.M.G. and X.D.-G.; visualization, M.M.G., D.T.-Z. and X.D.-G.; supervision, D.T.-Z. and X.D.-G.; project administration, D.T.-Z. and X.D.-G.; funding acquisition, M.M.G., D.T.-Z., A.C.O., J.M.R. and X.D.-G. All authors have read and agreed to the published version of the manuscript.
Funding
Consejo Nacional de Ciencia y Tecnología (CONACYT) M.M.G. grant 175098.
Data Availability Statement
The original contributions presented in the study are included in the article, further inquiries can be directed to the corresponding author.
Conflicts of Interest
The authors declare no conflicts of interest.
Appendix A

Table A1.
Environmental Aspects Component.
Table A1.
Environmental Aspects Component.
| 1 | 2 | 3 | 4 | Component Value | |||||
|---|---|---|---|---|---|---|---|---|---|
| 38.40% | 20.80% | 26.00% | 14.80% | 21.80% | Environmental Aspects | ||||
| Year | Ecosystem Preservation (m2/Habitant) | Pressure Level (%) | Water Resources Availability (%) | Climate Change | Fuzzy Component | Weighted Component | |||
| 2010 | 1.55 | 0 | 42.3 | 0.641 | 49.2 | 0 | 0.958 | 0.275 | 0.060 |
| 2011 | 1.56 | 0 | 41.0 | 0.656 | 54.03 | 0 | 0.050 | 0.144 | 0.031 |
| 2012 | 1.74 | 0 | 42.1 | 0.643 | 53.14 | 0 | 0.658 | 0.231 | 0.050 |
| 2013 | 1.71 | 0 | 42.0 | 0.644 | 49.85 | 0 | 0.975 | 0.278 | 0.061 |
| 2014 | 1.69 | 0 | 43.6 | 0.627 | 48.74 | 0 | 0.550 | 0.212 | 0.046 |
| 2015 | 1.45 | 0 | 44.8 | 0.613 | 50.09 | 0 | 0.992 | 0.274 | 0.060 |
| 2016 | 3.49 | 0.115 | 45.4 | 0.607 | 52.11 | 0 | 0.975 | 0.315 | 0.069 |
| 2017 | 4.17 | 0.167 | 45.2 | 0.609 | 53.12 | 0 | 0.575 | 0.276 | 0.060 |
| 2018 | 4.26 | 0.174 | 45.6 | 0.604 | 54.85 | 0 | 0.470 | 0.265 | 0.058 |
| 2019 | 4.37 | 0.182 | 45.8 | 0.602 | 47.41 | 0 | 0.503 | 0.273 | 0.059 |
| 2020 | 4.47 | 0.190 | 45.6 | 0.604 | 49.71 | 0 | 0.417 | 0.271 | 0.059 |
| 2021 | 4.84 | 0.219 | 45.3 | 0.608 | 49.62 | 0 | 0.617 | 0.329 | 0.072 |
| 2022 | 5.77 | 0.290 | 45.0 | 0.611 | 47.46 | 0 | 0.683 | 0.340 | 0.074 |
Note: For the climate change indicator, only the column of the recorded membership value is considered, due to the previously described data processing.

Table A2.
Water Quality component.
Table A2.
Water Quality component.
| 1 | 2 | Component Value | ||||
|---|---|---|---|---|---|---|
| 23.70% | 76.30% | 16.30% | Water Quality | |||
| Year | Treated Wastewater (%) | Groundwater and Surface Water Quality (%) | Fuzzy Component | Weighted Component | ||
| 2010 | 89 | 0.967 | 39.93 | 0.2297 | 0.40 | 0.0659 |
| 2011 | 83 | 0.767 | 39.93 | 0.2297 | 0.36 | 0.0582 |
| 2012 | 84 | 0.800 | 39.93 | 0.2297 | 0.36 | 0.0595 |
| 2013 | 99 | 1 | 35.24 | 0.1569 | 0.36 | 0.0581 |
| 2014 | 86 | 0.867 | 40.76 | 0.2431 | 0.39 | 0.0637 |
| 2015 | 95 | 1 | 38.35 | 0.2046 | 0.39 | 0.0641 |
| 2016 | 88 | 0.933 | 39.97 | 0.2308 | 0.40 | 0.0648 |
| 2017 | 81 | 0.700 | 42.20 | 0.2646 | 0.37 | 0.0599 |
| 2018 | 86 | 0.867 | 37.61 | 0.1938 | 0.35 | 0.0576 |
| 2019 | 85 | 0.833 | 37.80 | 0.1969 | 0.35 | 0.0567 |
| 2020 | 87 | 0.900 | 47.55 | 0.3476 | 0.48 | 0.0780 |
| 2021 | 90 | 1 | 39.93 | 0.2297 | 0.41 | 0.0672 |
| 2022 | 93 | 1 | 39.93 | 0.2297 | 0.41 | 0.0672 |
Note: background color means average values were considered.

Table A3.
Water use Efficiency Component.
Table A3.
Water use Efficiency Component.
| 1 | 2 | 3 | 4 | Component Value | |||||
|---|---|---|---|---|---|---|---|---|---|
| 21.80% | 34.20% | 31.40% | 12.60% | 21.20% | Water Use Efficiency | ||||
| Year | Water Extraction | Treated Wastewater Consumption (%) | Flow Recovery Though Leak Mitigation (lts/s) | Energy Efficiency (%) | Fuzzy Component | Weighted Component | |||
| 2010 | 0.50 | 38.6 | 0.358 | 74.36 | 0.572 | 10.8 | 0.858 | 0.519 | 0.110 |
| 2011 | 0.25 | 40.3 | 0.379 | 18.22 | 0.140 | 11.0 | 0.853 | 0.335 | 0.071 |
| 2012 | 0.50 | 41.1 | 0.389 | 69.46 | 0.534 | 13.5 | 0.788 | 0.509 | 0.108 |
| 2013 | 0.75 | 35.2 | 0.315 | 10.36 | 0.080 | 13.9 | 0.778 | 0.394 | 0.084 |
| 2014 | 0.25 | 40.7 | 0.384 | −4.78 | 0 | 12.9 | 0.804 | 0.287 | 0.061 |
| 2015 | 0.25 | 34.6 | 0.308 | −11.77 | 0 | 10.1 | 0.876 | 0.270 | 0.057 |
| 2016 | 0.75 | 37.6 | 0.345 | −129.30 | 0 | 9.5 | 0.892 | 0.394 | 0.083 |
| 2017 | 0.50 | 39.1 | 0.364 | 27.62 | 0.216 | 10.5 | 0.866 | 0.410 | 0.087 |
| 2018 | 0.75 | 36.9 | 0.336 | 130.00 | 1 | 10.1 | 0.876 | 0.703 | 0.149 |
| 2019 | 0.50 | 39.3 | 0.366 | 4.82 | 0.037 | 11.5 | 0.840 | 0.352 | 0.075 |
| 2020 | 0.50 | 40.7 | 0.384 | −16.43 | 0 | 11.4 | 0.843 | 0.346 | 0.073 |
| 2021 | 0.50 | 37.8 | 0.348 | 15.69 | 0.121 | 11.4 | 0.843 | 0.372 | 0.079 |
| 2022 | 0.50 | 41.5 | 0.394 | 15.69 | 0.121 | 11.4 | 0.843 | 0.388 | 0.082 |
Note: For the Water extraction component, only the column corresponding to the registered degree of membership is considered, due to the previously described data processing. Background color means average values were considered.

Table A4.
Institutional, Coordination, and Policy Aspects Component.
Table A4.
Institutional, Coordination, and Policy Aspects Component.
| 1 | 2 | Component Value | ||||
|---|---|---|---|---|---|---|
| 45.80% | 54.20% | 18.10% | Institutional, Coordination, and Policy Aspects | |||
| Year | Degree of Implementation of Integrated Water Resources Management (%) | Social Participation in Water and Sanitation Management | Fuzzy Component | Weighted Component | ||
| 2010 | 45.5 | 0.455 | 7 | 0.7 | 0.59 | 0.106 |
| 2011 | 45.5 | 0.455 | 7 | 0.7 | 0.59 | 0.106 |
| 2012 | 45.5 | 0.455 | 7 | 0.7 | 0.59 | 0.106 |
| 2013 | 45.5 | 0.455 | 7 | 0.7 | 0.59 | 0.106 |
| 2014 | 45.5 | 0.455 | 7 | 0.7 | 0.59 | 0.106 |
| 2015 | 45.5 | 0.455 | 7 | 0.7 | 0.59 | 0.106 |
| 2016 | 45.5 | 0.455 | 7 | 0.7 | 0.59 | 0.106 |
| 2017 | 45.5 | 0.455 | 7 | 0.7 | 0.59 | 0.106 |
| 2018 | 49 | 0.49 | 7 | 0.7 | 0.60 | 0.109 |
| 2019 | 45.5 | 0.455 | 7 | 0.7 | 0.59 | 0.106 |
| 2020 | 42 | 0.42 | 7 | 0.7 | 0.57 | 0.103 |
| 2021 | 45.5 | 0.455 | 7 | 0.7 | 0.59 | 0.106 |
| 2022 | 45.5 | 0.455 | 7 | 0.7 | 0.59 | 0.106 |
Note: background color means average values were considered.
References
- Hezri, A.; Dovers, S.R. Sustainability indicators, policy and governance: Issues for ecological economics. Ecol. Econ. 2006, 60, 86–99. [Google Scholar] [CrossRef]
- Tiburcio, A.; Perevochtchikova, M. Propuesta de un marco de indicadores de agua urbana para la ciudad de México, 2005–2018. Tecnol. Cienc. Agua 2020, 11, 177–243. [Google Scholar] [CrossRef]
- United Nations, World Water Assessment Program (UN-WWAP). Water for People, Water for Life: The United Nations World Water Development Report Executive Summary; United Nations, World Water Assessment Program (UN-WWAP): Paris, France, 2003; Available online: https://unesdoc.unesco.org/ark:/48223/pf0000129556_spa/PDF/129556spa.pdf.multi (accessed on 21 October 2023).
- Organization for Economic Cooperation and Development (OECD). Towards Sustainable Development: Environmental Indicators; Organization for Economic Cooperation and Development: Paris, France, 1998. [Google Scholar]
- Dunn, G.; Bakker, K. Fresh water-related indicators in Canada: An inventory of indicators. Can. Water Resour. J. 2011, 36, 135–148. [Google Scholar] [CrossRef]
- Hill, C.; Furlong, K.; Bakker, K.; Cohen, A. Harmonization versus subsidiarity in water governance: A review of water governance and legislation in the Canadian provinces and territories. Can. Water Resour. J. 2008, 33, 315–332. [Google Scholar] [CrossRef]
- United Nations, World Water Assessment Program (UN-WWAP). Water a Shared Responsibility; United Nations Educational, Scientific and Cultural Organization: Paris, France, 2006. [Google Scholar]
- Pintér, L.; Hardi, P.; Bartelmus, P. Sustainable Development Indicators: Proposals for the Way Forward; International Institute for Sustainable Development: New York, NY, USA, 2005. [Google Scholar]
- United Nations (UN). World Urbanization Prospect. The Revision 2014. Highlights; United Nations Publications: New York, NY, USA, 2014. [Google Scholar]
- Organization for Economic Cooperation and Development (OECD). Water and Cities. Ensuring Sustainable Futures; OECD Studies on Water; OECD Publishing: Paris, France, 2015. [Google Scholar] [CrossRef]
- Ligtvoet, W.; Hilderink, H.; Bouwman, A.; Van Puijenbroek, P.; Lucas, P.; Witmer, M. Towards a World of Cities in 2050. An Outlook on Water-Related Challenges. Background Report to the UN-Habitat Global Report; Environmental Assessment Agency: The Hague, The Netherlands, 2014. [Google Scholar]
- Gleick, P.H.; Chalecki, E.L.; Wong, A. Measuring water well-being: Water indicators and indices. In The World’s Water: The Biennial Report on Freshwater Resources; Gleick, P.H., Ed.; Island Press/Pacific Institute for Studies in Development Environment and Security: Washington, DC, USA, 2002; pp. 87–112. [Google Scholar]
- Dweiri, F.T.; Kablan, M.M. Using fuzzy decision making for the evaluation of the project management internal efficiency. Decis. Support Syst. 2006, 42, 712–726. [Google Scholar] [CrossRef]
- Dadda, A.; Ouhbi, I. A decision support system for renewable energy plant projects. In Proceedings of the 2014 International Conference on Next Generation Networks and Services (NGNS), Casablanca, Morocco, 30 May 2014. [Google Scholar]
- Saaty, T.L. The Analytic Hierarchy Process; McGraw-Hill: New York, NY, USA, 1980. [Google Scholar]
- Buckley, J.J. Fuzzy hierarchical analysis. Fuzzy Sets Syst. 1985, 17, 233–247. [Google Scholar] [CrossRef]
- Waller, M.A.; Fawcett, S.E. Data Science, Predictive Analytics, and Big Data: A Revolution That Will Transform Supply Chain Design and Management. J. Bus. Logist. 2013, 34, 77–84. [Google Scholar] [CrossRef]
- Eckert, K.; Britos, P.V. Modelo basado en la toma decisiones con criterios múltiples para la elección de metodologías de data science. In Proceedings of the XX Workshop de Investigadores en Ciencias de la Computación, Corrientes, Argentina, 26–27 April 2018. [Google Scholar]
- R Core Team. R: A Language and Environment for Statistical Computing, version 4.4.2; R Foundation for Statistical Computing: Vienna, Austria, 2020. Available online: https://www.R-project.org/ (accessed on 10 October 2023).
- Mendoza, M.; Tagle, D.; Morales, J.; Caldera, A.; Mora, J.; Delgado, X. Water Supply Management Index: Leon, Guanajuato, Mexico. Water 2022, 14, 919. [Google Scholar] [CrossRef]
- Mendoza, M.; Tagle, D.; Caldera, A.; Mora, J.; Carreño-Aguilera, G.; Delgado, X. Indicadores de la gestión del suministro de agua en zonas urbanas para evaluar su sostenibilidad. Tecnol. Cienc. Agua 2024, 15, 192–240. [Google Scholar] [CrossRef]
- INEGI. Censo de Población y Vivienda. 2020. Available online: https://www.inegi.org.mx/programas/ccpv/2020/ (accessed on 3 October 2023).
- Hansen, M.; Rodríguez, J. Indicadores de Gestión Prioritarios en Organismos Operadores. Informe Final HC1915.1. Coordinación y Subcoordinación de Hidráulica Urbana; IMTA: Morelos, Mexico, 2019; pp. 1–124. [Google Scholar]
- INEGI. Encuesta Nacional de Ocupación y Empleo (ENOE), Población de 15 Años y Más de Edad; INEGI: Mexico City, Mexico, 2025; Available online: https://www.inegi.org.mx/programas/enoe/15ymas/ (accessed on 31 October 2024).
- SAPAL. Agua Siempre y Para Todos. Informe de Resultados del Consejo Directivo de SAPAL 2013–2016; SAPAL: Leon, Mexico, 2016; Available online: https://www.sapal.gob.mx/informacion-descargas (accessed on 6 November 2023).
- WHO. Naturaleza, Biodiversidad y Salud: Una Descripción General de las Interconexiones; WHO: Geneva, Switzerland, 2022; Available online: https://iris.who.int/handle/10665/352803 (accessed on 10 November 2023).
- IMPLAN. Indicadores de Áreas Verdes Del Municipio de León, Guanajuato; IMPLAN: Leon, Mexico, 2012. [Google Scholar]
- Reyes, S.; Figueroa, I.M. Distribución, superficie y accesibilidad de las áreas verdes en Santiago de Chile. EURE Rev. Latinoam. Estud. Urbanos Reg. 2010, 36, 89–110. Available online: http://www.scielo.cl/pdf/eure/v36n109/art04.pdf (accessed on 10 November 2023).
- Conagua. Grado de Presión Sobre el Recurso Hídrico por Región Hidrológicoadministrativa. 2025. Available online: https://sinav30.conagua.gob.mx:8080/Indicadores/ (accessed on 18 August 2023).
- Conagua (2006–2018) Estadísticas del Agua en México. Available online: https://sinav30.conagua.gob.mx:8080/port_publicaciones.html (accessed on 21 August 2023).
- Conagua. Sistema Meteorológico Nacional. 2025. Available online: https://smn.conagua.gob.mx/es/climatologia/informacion-climatologica/informacion-estadistica-climatologica (accessed on 24 August 2023).
- Conagua. Calidad del agua en México. 2025. Available online: https://www.gob.mx/conagua/articulos/calidad-del-agua (accessed on 30 August 2023).
- IMTA. Programa de Indicadores de Gestión de Organismos Operadores; Instituto Mexicano de Tecnología del Agua: Morelos, Mexico, 2025; Available online: http://www.pigoo.gob.mx/ (accessed on 4 September 2023).
- CEAG. 2011, 2014, 2018 y 2019. Diagnóstico Sectorial de Agua Potable y Saneamiento; CEAG: Guanajuato, Mexico, 2018; Available online: https://agua.guanajuato.gob.mx/pdf/publicaciones/diagnostico-cea-2018.pdf (accessed on 8 September 2023).
- WHO. Situación Del Marco Para la Seguridad del Agua de Consumo Humano en América Latina y el Caribe; Organización Panamericana de la Salud: Washington, DC, USA, 2021. [Google Scholar] [CrossRef]
- Pinkham, R. 21st Century Water Systems: Scenarios Visions and Drivers. 1999. Available online: https://rmi.org/insight/21st-century-water-systems-scenarios-visions-and-drivers/ (accessed on 3 July 2023).
- Tucci, C. Integrated urban water management in the humid tropics. In Integrated Urban Water Management: Humid Tropics; Parkinson, J.N., Goldenfum, J.A., Tucci, C.E.M., Eds.; UNESCO-IHP; Urban Water Series; United Nations Educational, Scientific Nations Educationalization: Paris, France; Taylor and Francis: Leiden, The Netherlands, 2010; pp. 1–23. [Google Scholar]
- Benavides, H. Diagnóstico de la Sostenibilidad de un Abastecimiento de Agua e Identificación de las Propuestas que la Mejoren. Ph.D. Thesis, Universitat Politécnica de Valéncia, Valencia, Spain, 2010. Available online: https://dialnet.unirioja.es/servlet/tesis?codigo=88261 (accessed on 26 September 2023).
- Alegre, H.; Cabrera, E.; Duarte, P.; Merkel, W.; Melo, J.; Cubillo, F.; Hirner, W.; Parena, R. Indicadores de desempeño para servicio de abastecimiento de agua. In Manual de Buenas Prácticas. España: Universitat Politécnica de Valéncia, 3rd ed.; IWA: Valencia, Spain, 2018; pp. 1–439. Available online: https://www.iwapublishing.com/sites/default/files/ebooks/Manual%20PI%20IWA_ES.pdf (accessed on 22 May 2023).
- Alegre, H.; Melo, J.; Cabrera, E.; Cubillo, F.; Duarte, P.; Wolfram, H.; Wolf, M.; Parena, R. Performance Indicators for Water Supply Services, IWA Manual of Best Practices; IWA Publishing: London, UK, 2017; pp. 1–372. [Google Scholar]
- Mitchell, V. Applying integrated urban water management concepts: A review of Australian experience. Environ. Manag. 2006, 37, 589–605. [Google Scholar] [CrossRef]
- Niemczynowicz, J. Urban hydrology and water management—Present and future challenges. Urban Water 1999, 1, 1–14. [Google Scholar] [CrossRef]
- Suárez, J.; Puertas, J.; Anta, J.; Jácome, A.; Álvarez-Campana, J. Gestión integrada de los recursos hídricos en el sistema del agua urbana: Desarrollo Urbano Sensible al Agua como enfoque estratégico. Ing. Agua 2014, 18, 111–123. [Google Scholar]
- Pahl-Wostl, C.; Downing, T.; Kabat, P.; Magnuszewski, P.; Meigh, J.; Schlueter, M.; Sendzimir, J.; y Werners, S. Transition to Adaptive Water Management. The NeWater Project. Water Policy. NeWater (Working Paper X); Institute of Environmental Systems Research, University of Osnabrück: Osnabrück, Germany, 2005. [Google Scholar]
- Bhaduri, A.; Bogardi, J.; Siddiqi, A.; Voigt, H.; Vörösmarty, C.; Pahl-Wostl, C.; Bunn, S.E.; Shrivastava, P.; Lawford, R.; Foster, S.; et al. Achieving sustainable development goals from a water perspective. Front. Environ. Sci. 2016, 4, 64. [Google Scholar] [CrossRef]
- Brugmann, J. Is there a method in our measurement? The use of indicators in local sustainable development. Local Environ. 1997, 2, 59–72. [Google Scholar] [CrossRef]
- Perevochtchikova, M.; Rojo-Negrete, I. Development of an indicator scheme for the environment impact assessment in the Federal District, Mexico. J. Environ. Prot. 2013, 4, 226–237. [Google Scholar] [CrossRef]
- Tiburcio, A.; Perevochtchikova, M. La gestión del agua y el desarrollo de indicadores ambientales en México y Canadá: Un análisis comparativo. J. Lat. Am. Geogr. 2012, 11, 145–165. [Google Scholar] [CrossRef]
- García, C.; Carreón, J.; y Quintero, M. Dimensiones de gobernanza para la sustentabilidad hídrica. Rev. Pueblos Front. Digit. 2015, 10, 195–203. [Google Scholar] [CrossRef]
- United Nations. Agenda 21: Programme of Action for Sustainable Development; United Nations Publications: New York, NY, USA, 1992; Available online: https://www.un.org/en/conferences/environment/rio1992 (accessed on 15 November 2023).
- Flores, F.; Rodríguez, M.; Alcocer, V. Indicadores de Gestión Prioritarios en Organismos Operadores; Instituto Mexicano de Tecnología del Agua: Morelos, Mexico, 2012. [Google Scholar]
- Ministerio de Obras Públicas y Comunicaciones. Manual de Indicadores de Gestión Para Agua Potable y Alcantarillado Sanitario; Dirección de Agua Potable y Saneamiento: Asuncion, Paraguay, 2012. [Google Scholar]
- Pineda, N.; Salazar, A.; Méndez, R. Gestión municipal exitosa: El sistema de Agua Potable y Alcantarillado de León. In El Agua en las Ciudades del Norte de México: Capacidad Institucional y Desempeño; El Colegio de Sonora: Hermosillo, Mexico, 2020; pp. 27–50. Available online: https://libros.colson.edu.mx/index.php/colson/catalog/view/235/727/1275 (accessed on 6 November 2023).
- Instituto Nacional de Estadística y Geografía [INEGI]. Municipios de México; Instituto Nacional de Estadística y Geografía: Aguascalientes, Mexico, 2015. [Google Scholar]
- Tagle, D.; Caldera Ay Rodríguez, J. Complejidad ambiental en el Bajío mexicano: Implicaciones del proyecto civilizatorio vinculado al crecimiento económico. Reg. Soc. 2017, 29, 193–221. Available online: https://regionysociedad.colson.edu.mx:8086/index.php/rys/article/view/873/1016 (accessed on 8 December 2023).
- Instituto Municipal de Planeación. Plan Municipal de Desarrollo. León Hacia el Futuro; IMPLAN: Leon, Mexico, 2019; Available online: https://portalsocial.guanajuato.gob.mx/sites/default/files/documentos/2021_LEON_GTO_Plan_municipal_desarrollo_leon_futuro_vision_2045.pdf (accessed on 28 January 2024).
- Instituto Municipal de Planeación. Sistema de Indicadores para el Desarrollo del Municipio de León, Guanajuato; IMPLAN: León, Mexico, 2018; Available online: https://www.implan.gob.mx/sistema-indicadores.php (accessed on 11 December 2023).
- Tagle, D. Presa El Zapotillo: Una discusión de su pertinencia para León, Guanajuato, a una década del conflicto por el agua. Estud. Demogr. Urbanos 2023, 38, 247–282. [Google Scholar] [CrossRef]
- Moreno, C. Proceso de Jerarquía Difusa Para la Toma de Decisiones de Suministro Eléctrico en Áreas Rurales No Interconectadas en la Región Caribe Colombiana. Master’s Thesis, University of the Coast (CUC), Barranquilla, Colombia, 2021. [Google Scholar]
- Smith, E.E.; Kosslyn, S.M. Procesos Cognitivos, Modelos y Bases Neurales; Pearson, Prentice Hall Ed.: Madrid, Spain, 2008. [Google Scholar]
- Ríos, S. Análisis de Decisiones; Ediciones ICE: Madrid, Spain, 1976. [Google Scholar]
- Díaz, R.; Piña, J.; Ríos, D.; Serafín, M. Uso de AHP y conjuntos difusos para mejorar la toma de decisiones. Caso: Selección de Empresas Contratistas de Construcción en la Administración Pública Venezolana. In Proceedings of the Energy and Technology for the Americas: Education, Innovation, Technology and Practice, San Cristóbal, Venezuela, 2–5 June 2009. [Google Scholar]
- Nantes, E. El Método Analytic Hierarchy Process para la toma de decisiones. Repaso de la metodología y aplicaciones. Investig. Oper. 2019, 46, 54–73. [Google Scholar]
- Saaty, T.L. A Scaling method for priorities in hierarchical structures. J. Math. Psychol. 1977, 15, 234–281. [Google Scholar] [CrossRef]
- Delgado-Galván, X.; Pérez-García, R.; Izquierdo, J.; Mora-Rodríguez, J. Analytic Hierarchy Process for Assessing Externalities in Water Leakage Management. Math. Comput. Model. 2010, 52, 1194–1202. [Google Scholar] [CrossRef]
- Saaty, T.L. The Analytic Network Process; RWS Pub.: Pittsburgh, PA, USA, 2001. [Google Scholar]
- Finan, J.; Hurley, W. The analytic hierarchy process: Does adjusting a pairwise comparison matrix to improve the consistency ratio help? Comput. Oper. Res. 1997, 24, 749–755. [Google Scholar] [CrossRef]
- Zadeh, L.A. Fuzzy algorithms. Inf. Control. 1968, 12, 8. [Google Scholar] [CrossRef]
- Flores, H. Evaluación de Los Impactos de la Industrialización en el Bajío de Guanajuato. Ph.D. Thesis, Universidad de Guanajuato, Guanajuato, México, 2019; pp. 1–313. [Google Scholar]
- Purdue University. Simple Water Quality Index Calculator. 2020. Available online: https://www.agry.purdue.edu/hydrology/projects/nexus-swm/en/Tools/WaterQualityCalculator.php (accessed on 10 January 2024).
Disclaimer/Publisher’s Note: The statements, opinions and data contained in all publications are solely those of the individual author(s) and contributor(s) and not of MDPI and/or the editor(s). MDPI and/or the editor(s) disclaim responsibility for any injury to people or property resulting from any ideas, methods, instructions or products referred to in the content. |
© 2025 by the authors. Licensee MDPI, Basel, Switzerland. This article is an open access article distributed under the terms and conditions of the Creative Commons Attribution (CC BY) license (https://creativecommons.org/licenses/by/4.0/).
