Abstract
Hydrological modeling is critical for assessing water availability and guiding sustainable resource management, particularly in monsoon-dependent, data-scarce basins such as the Chalakudy River Basin (CRB) in Kerala, India. This study integrated the Soil Conservation Service Curve Number (SCS-CN) method within the Google Earth Engine (GEE) platform, making novel use of multi-source, open access datasets (CHIRPS precipitation, MODIS land cover and evapotranspiration, and OpenLand soil data) to estimate spatially distributed long-term runoff (2001–2023). Model calibration against observed runoff showed strong performance (NSE = 0.86, KGE = 0.81, R2 = 0.83, RMSE = 29.37 mm and ME = 13.48 mm), validating the approach. Over 75% of annual runoff occurs during the southwest monsoon (June–September), with July alone contributing 220.7 mm. Seasonal assessments highlighted monsoonal excesses and dry-season deficits, while water balance correlated strongly with rainfall (r = 0.93) and runoff (r = 0.94) but negatively with evapotranspiration (r = –0.87). Time-series analysis indicated a slight rise in rainfall, a decline in evapotranspiration, and a marginal improvement in water balance, implying gradual enhancement of regional water availability. Spatial analysis revealed a west–east gradient in precipitation, evapotranspiration, and water balance, producing surpluses in lowlands and deficits in highlands. These findings underscore the potential of cloud-based hydrological modeling to capture spatiotemporal dynamics of hydrological variables and support climate-resilient water management in monsoon-driven and data-scarce river basins.
1. Introduction
Water is the most vital natural resource, supporting life, economic growth, and ecological balance [1,2]. Effective management of water resources requires full knowledge of the hydrology processes of a basin, which entails how precipitation is transformed into surface flows, evapotranspiration, surface recharge of the groundwater, and the storage changes [3,4]. The analysis of hydrological response provides the foundation to cope with issues of water scarcity, control over floods, agricultural planning, and ecosystem recovery [5].
Conventional hydrological modeling, which is methodologically sound, however, relies heavily on ground-based measurements [6,7]. Nevertheless, these measurements are mostly scarce, non-continuous and geographically constrained, especially in data-scarce areas like mountains or inaccessible regions [8,9]. Such constraints limit the spatial and temporal scale of measurement within which water balance components can be correctly distinguished and interpreted. Remote sensing has become a high-potential method to break these limitations in recent decades, providing spatially continuous, time-frequent, and worldwide observations of hydrological variables.
At the same time, cloud computing has made further innovations in the sphere of hydrological research. Major platforms like GEE allow integrating and processing large amounts of satellite-derived information with unprecedented speed and scalability [10,11]. In this context, large-scale hydrological models have emerged as effective alternatives for simulating ungauged, national, and transboundary river basins [12]. The synergy between remote sensing and cloud computing represents a paradigm shift in water resource assessment, opening new possibilities for high-resolution, near-real-time, and basin-scale hydrological modeling that would be unfeasible with traditional approaches.
Remote sensing and cloud-based tools have shown their effectiveness in estimating runoff, evapotranspiration, and soil moisture across the globe [13,14,15,16]. Satellite data, including CHIRPS rainfall, MODIS evapotranspiration and land cover, and SMAP soil moisture that are widely used have enhanced the spatial and temporal resolution of models that predict hydrological variables [17,18]. Several studies have shown that the CHIRPS precipitation product performs well across diverse regions of India [19,20,21,22,23,24]. The combination of empirical models such as Soil Conservation Service Curve Number (SCS-CN) method with satellite inputs has produced positive outcomes in estimating runoff in data-limited areas [25,26]. Simultaneously, cloud systems enable effective analysis of large catchments using minimal computation facilities.
Recent advancements have demonstrated the efficacy of integrating the SCS-CN method with Google Earth Engine (GEE) for large-scale runoff estimation. Shahbazi [27] applied the SCS-CN method within GEE to estimate surface runoff in the Minab River Basin, highlighting the adaptability of this approach across diverse hydroclimatic contexts. Das et al. [28] employed GEE to model runoff in Louisiana, integrating soil texture, land use, and precipitation data, achieving high model accuracy (R2 = 0.964). Campo et al. [29] utilized GEE to automate surface runoff estimation using the SCS-CN method, emphasizing its applicability across various landscapes. Sujud et al. [30] developed a global dynamic runoff application using GEE, assimilating satellite-derived precipitation and soil moisture datasets for high-resolution runoff estimation. Merizalde et al. [31] combined geographic data and the SCS-CN method with machine learning for short-term runoff forecasting in multiple watersheds. Wang et al. [32] optimized SCS-CN model parameters for runoff prediction in ridge-furrow rainwater harvesting systems, demonstrating the method’s versatility in different hydroclimatic and land management contexts. Collectively, these studies underscore the growing utilization of GEE-based SCS-CN frameworks for reproducible, large-scale hydrological modeling across diverse geographical regions and climates.
Nonetheless, a number of research gaps remain open especially in monsoon-dominated areas like the river basins in India, in spite of these methodological advances. First, limited research efforts cover the multi-source satellite data exhaustively with empirical or semi-distributed runoff models on cloud platforms such as GEE [33]. Most studies that have been conducted are fragmented, as they mainly study isolated portion of balance of water, but they do not study the entire process of the water balance [34,35]. Second, quantitative verification of remotely sensed estimates of runoff against ground-based observations of streamflow is rarely conceived (or is poorly developed), constraining their applicability [36,37]. Third, the spatial variability and seasonality of hydrological components within the basin (especially the magnitude and distribution of dry-season water deficiency) are often not reflected in available literature. This geographic imbalance frustrates the development of effective strategies of water management at the basin scale against the backdrop of climate variability.
This study aims to address these critical gaps by employing a remote sensing and cloud computing-based approach for hydrological response analysis in the Chalakudy River Basin. The novelty of this work lies in integrating multi-source satellite datasets with the SCS-CN model on a cloud platform (GEE) to provide a spatially and seasonally explicit water balance assessment, which has not been attempted comprehensively in this basin. The SCS-CN method was chosen because it is a simple yet robust empirical approach that performs reliably in data-scarce regions and can be effectively enhanced with remotely sensed inputs. Specifically, the study seeks to (i) estimate key water balance components using high-resolution satellite datasets, (ii) apply the SCS-CN method within a cloud computing environment to derive runoff estimates, (iii) validate modeled runoff using available in situ observations, and (iv) assess spatial and seasonal hydrological variability across the basin. By doing so, the study offers a replicable methodology for water balance assessment in data-scarce, monsoon-affected basins and contributes to the development of decision-support tools for integrated water resource management.
2. Materials and Methods
2.1. Study Area
The CRB (Figure 1), located in central Kerala, India (10°10′ N–10°30′ N; 76°15′ E–76°55′ E), covers an area of approximately 1704 km2. Originating from the Anamalai Hills of the Western Ghats, the river flows westward for about 145.5 km before merging with the Periyar River system. Elevation ranges from over 1568 m in the upper catchments to −3 m in the coastal plains. The basin exhibits a dendritic drainage pattern and includes significant tributaries such as the Karappara, Kuriarkutty, Peruvarippallam, Thunacadavu, and Sholayar river. Annual precipitation ranges from 2500 to 5000 mm, primarily received during the southwest monsoon. The region features diverse landforms, including forested highlands, agricultural midlands, and urbanized lowlands. Land use/land cover includes tropical evergreen forests, plantations, paddy fields, settlements, and wetlands. Major hydrological structures include the Poringalkuthu Dam and Thumboormuzhi Barrage, which influence the flow regime and water availability across the basin.
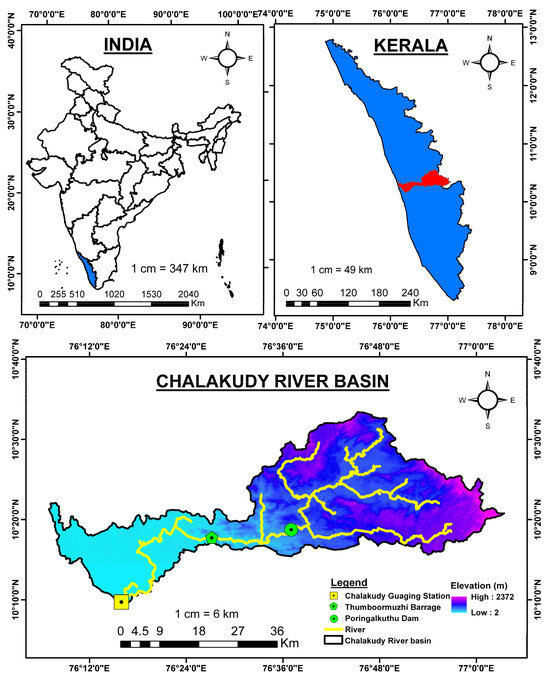
Figure 1.
Location of the Chalakudy River Basin.
The CRB represents a highly dynamic and ecologically significant hydrological system. Characterized by steep terrain, dense forests, and intensive agricultural activity, the basin is heavily dependent on monsoonal precipitation, which accounts for nearly three-fourths of its annual rainfall [38]. The region faces increasing anthropogenic pressures from land use change, deforestation, urban expansion, and unsustainable groundwater extraction [39]. These factors, compounded by growing climate variability, make hydrological modeling in the basin both urgent and complex. Overall, spatially resolved hydrological research within the Chalakudy Basin is limited. Furthermore, a deficiency exists in the implementation of comprehensive framework that utilize cloud-based platform and multi-sensor remote sensing information to assess hydrological processes of the basin throughout seasons and changing land use dynamics.
2.2. Data Used
This study employed an integrated use of satellite-derived and observed datasets to assess the hydrological response of the monsoon-dependent CRB during 2001 to 2023. Precipitation inputs were sourced from the CHIRPS dataset [40,41], which provides long-term, high-resolution estimates suitable for runoff simulation in monsoon-driven basins. Land use and evapotranspiration were characterized using MODIS products: MCD12Q1 for land cover classification [42,43] and MOD16A2 for evapotranspiration [44]. These datasets facilitated the derivation of curve numbers and quantification of spatiotemporal water losses. Soil texture and hydrological properties, necessary for classifying hydrological soil groups, were obtained from the OpenLand Soil Database [45]. The Monthly River discharge data from the India-Water Resources Information System (WRIS) were used to validate runoff estimates. A summary of all datasets and their applications is presented in Table 1.

Table 1.
Summary of the data used in this study.
2.3. Resolution Harmonization and Data Integration
To address the heterogeneity in spatial resolutions across datasets, a resolution harmonization procedure was systematically applied. The MODIS evapotranspiration product (MOD16A2; 500 m) was adopted as the reference grid owing to its central role in subsequent analyses. All datasets were reprojected to a common spatial reference framework (WGS 84, UTM Zone 43N) to ensure geospatial uniformity. Continuous variables, such as CHIRPS precipitation, were resampled to 500 m using bilinear interpolation, thereby preserving spatial gradients and minimizing interpolation artifacts. Conversely, categorical datasets, exemplified by the OpenLand Soil Database, were resampled using the nearest-neighbor approach to maintain the integrity of discrete class boundaries. Following these steps, all data layers were precisely aligned to the 500 m MODIS grid, thereby facilitating pixel-level comparability and integration. Finally, runoff was estimated at a spatial resolution of 500 m. The entire preprocessing workflow was executed within the Google Earth Engine (GEE) environment using its native reprojection and resampling functions.
2.4. SCS-CN Method for Runoff Estimation
Several methods are available to estimate runoff, including the Rational Method, Green–Ampt, and the SCS-CN approach [46]. Among these, the SCS-CN method, developed by the USDA Natural Resources Conservation Service [47], is widely applied due to its simplicity, predictability, and reliance on readily available parameters [48]. The method estimates direct runoff depth from storm rainfall by assigning a Curve Number (CN) that reflects runoff potential based on land use, hydrologic soil group, and antecedent moisture condition (AMC). Low CN values indicate high infiltration and low runoff potential, whereas high CN values reflect reduced infiltration and greater runoff generation. Hydrologic soil groups (A to D) further classify soils from high-infiltration (Group A) to low-infiltration (Group D).
2.4.1. Calculation of Runoff Depth (Q)
Runoff depth (Q) represents the portion of rainfall that is not lost to infiltration, evapotranspiration, or storage and therefore contributes to direct surface [49]. It is a critical hydrological variable that reflects the interaction between rainfall intensity, land surface characteristics, and soil properties, and serves as a key input for water balance and flood assessment studies [50].
For a rainfall event of depth P (mm), the runoff depth Q is calculated using Equation (1):
where
- Q = Runoff depth (mm),
- P = Rainfall depth (mm),
- S = Potential maximum retention after runoff begins, which is calculated based on the Curve Number (CN).
If then since rainfall is entirely absorbed by the soil without generating surface runoff.
2.4.2. Determining Curve Number (CN)
The Curve Number (CN) represents the hydrological characteristics of the soil and land cover [51]. It ranges from 30 (high infiltration, low runoff potential) to 100 (impervious, high runoff potential) [52]. CN values were assigned based on standard tables from the USDA SCS handbook and reflect the study area’s land cover and soil type.
CN values vary according to three Antecedent Moisture Conditions (AMC):
- AMC I: Dry condition (low runoff potential),
- AMC II: Average condition (standard CN used),
- AMC III: Wet condition (high runoff potential).
The CN for average conditions (AMC II) was adjusted to reflect the actual soil moisture state at the time of each rainfall event.
2.4.3. Potential Maximum Retention (S)
Potential maximum retention (S) represents the maximum amount of water that a watershed can retain through infiltration, surface storage, and other abstractions before generating direct runoff [53]. It is a key parameter in the SCS-CN method, reflecting the combined influence of land use, soil type, and hydrological condition on runoff potential. Higher values of S indicate greater retention capacity and lower runoff generation, whereas lower values signify limited retention and higher runoff susceptibility.
The parameter is empirically derived from the CN, which standardizes watershed characteristics into a dimensionless index ranging from 0 (high infiltration capacity) to 100 (impervious conditions). The relationship between S and CN is given by:
where is in millimeters.
2.4.4. Adjustments for Antecedent Moisture Condition (AMC)
The Antecedent Moisture Condition (AMC) adjustments in the SCS-CN method account for soil moisture levels prior to a rainfall event, which influence the runoff potential. These adjustments modify the Curve Number (CN) for dry, average, and wet conditions, designated as AMC I, AMC II, and AMC III, respectively. Here are the equations for AMC adjustments:
- AMC II (Average Condition): This is the standard CN value for average soil moisture. It is the baseline Curve Number used for most calculations without adjustment.
- AMC I (Dry Condition): When soil moisture is low (dry conditions), runoff potential is reduced, so a lower CN value is used. The adjusted CN for AMC I is calculated using Equation (3):
Here, is the adjusted Curve Number for dry conditions, and is the Curve Number under average conditions.
AMC III (Wet Condition): When soil moisture is high (wet conditions), runoff potential increases, so a higher CN value is applied. The adjusted CN for AMC III is calculated using Equation (4):
Here, represents the adjusted Curve Number for wet conditions.
The choice of AMC (I, II, or III) depends on the cumulative rainfall over the 5 days preceding the event:
- AMC I (Dry): When cumulative rainfall over the last 5 days is below:<35 mm for dormant season or < 13 mm for growing season.
- AMC II (Average): When cumulative rainfall falls between:35–53 mm for dormant season or 13–28 mm for growing season.
- AMC III (Wet): When cumulative rainfall exceeds:>53 mm for dormant season or > 28 mm for growing season.
By applying these AMC adjustments, the SCS-CN method can more accurately reflect changes in soil moisture, making runoff predictions more responsive to recent rainfall patterns.
2.5. SCS CN Model Development in GEE Environment
The SCS-CN model was implemented within the GEE environment to enable scalable, pixel-wise runoff estimation using remotely sensed inputs. GEE’s extensive spatial data catalog and cloud-based computation significantly enhance data accessibility and processing efficiency compared to conventional methods.
The model workflow began with the classification of a soil texture map into four hydrologic soil groups (A, B, C, and D) using nested ternary operators (condition ? true_case: false_case) within the ee.Image.expression() function in GEE. For example, soil texture values were mapped as (t == 1)?1:(t == 2)?2:(t == 3)?3:(t == 4)?4, corresponding to groups A–D, enabling pixel-wise assignment of soil groups directly from the texture raster. This hydrologic soil group map was integrated with downscaled MODIS land use/land cover (LULC) data to produce a composite image. A Curve Number (CN-II) map was then derived using conditional logic to represent all combinations of the 17 LULC classes and four hydrologic soil groups. Based on CN-II values, CN-I and CN-III maps were subsequently calculated using established empirical relationships to reflect dry and wet antecedent moisture conditions, respectively. The maximum potential retention (S) values were derived from the CN map (Figure 2), with each CN condition (I, II, III) assigned its corresponding S image. To optimize computational performance, these S images were defined globally within the GEE script. Daily antecedent moisture condition (AMC) was computed as the cumulative rainfall over a five-day window, including the current day. Based on AMC thresholds, each pixel was dynamically assigned an appropriate S image: AMC < 13 mm used S-I (dry), AMC ≥ 28 mm used S-III (wet), and intermediate values used S-II (normal). These were merged to form a spatially consistent, AMC-adjusted S image for each day. Runoff (Q) was then estimated using the standard SCS-CN equation. A conditional check was incorporated to account for initial abstraction (Ia): if daily rainfall at a given pixel was less than Ia, runoff was set to zero; otherwise, Q was computed based on the corresponding S value. This process was iteratively applied across the entire temporal dataset to generate a time series of daily runoff maps at high spatial resolution. The conceptual framework adopted in this study is illustrated in Figure 3.
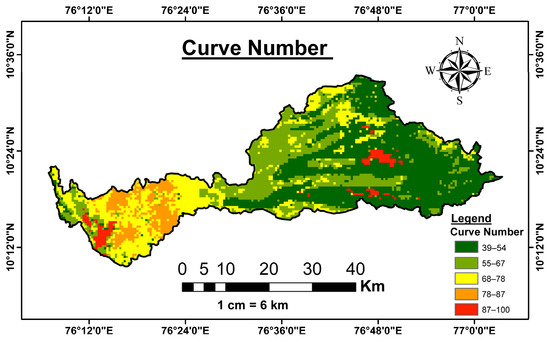
Figure 2.
Spatial distribution of Curve Number (CN) values estimated using the cloud-based rainfall–runoff model for the Chalakudy River Basin, highlighting variations in land cover, soil properties, and hydrological response.
2.6. Model Validation
Monthly streamflow data observed at Chalakudy during 2018 to 2021, obtained from the Central Water Commission (CWC), WRIS, India and Irrigation Department of Kerala, was used to validate runoff estimated using the SCS-CN method. Model performance was evaluated by comparing observed and simulated runoff using widely applied statistical metrics (Table 2), including Nash–Sutcliffe Efficiency (NSE), Root Mean Square Error (RMSE), Mean Error (ME), and Kling–Gupta Efficiency (KGE) [54,55,56] providing a comprehensive evaluation of the model’s accuracy and reliability.

Table 2.
Statistical metrics used for validating runoff simulations.
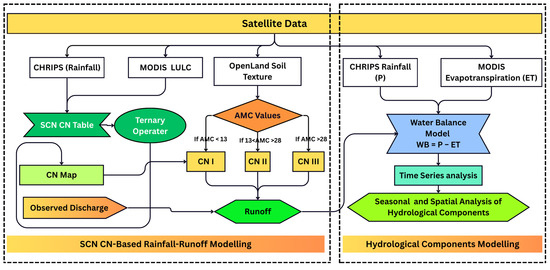
Figure 3.
Conceptual framework showing SCS −CN-based rainfall–runoff modeling using CHIRPS rainfall, MODIS land cover, and OpenLand soil data with antecedent moisture conditions, and hydrological components modeling using CHIRPS precipitation and MODIS evapotranspiration in a water balance approach.
2.7. Water Balance Model
The hydrological regime of the monsoon-dependent CRB was quantified through a water balance framework grounded in the principle of mass conservation [57], which conceptualizes the basin as a control volume wherein inflows and outflows collectively determine net water availability. For the period 2001−2023, the water balance was represented in its simplified form as:
where denotes the net water balance (mm), represents precipitation (mm), and is evapotranspiration (mm). was derived from the CHIRPS dataset, providing spatially and temporally consistent rainfall estimates, while was obtained from the MODIS MOD16A2 product, which integrates remote sensing observations with biophysical algorithms to approximate terrestrial water fluxes.
This simplified equation is appropriate for the basin, where monsoonal precipitation and evapotranspiration dominate annual water fluxes, and long-term storage changes and subsurface flows are assumed negligible. The resulting water balance effectively indicates surplus or deficit, capturing the basin’s integrated hydrological response to monsoonal variability.
2.8. Time-Series Analysis and Trend Detection
To quantify long-term hydrological trends, monthly time series of precipitation , evapotranspiration and in the period 2002–2022 were subjected to non-parametric trend analysis [58,59]. Sen’s slope estimator was employed to quantify the magnitude of monotonic change, as it provides a robust and distribution-free measure that is minimally affected by outliers and non-normal data distributions. The slope () was computed using Equation (6).
where and represent observed values at times and , respectively. The statistical significance of the trends was evaluated using the Mann–Kendall test, which assesses the null hypothesis of no monotonic trend without requiring assumptions regarding the underlying distribution of the data. Positive Sen’s slopes indicate upward trends, whereas negative slopes denote declining trajectories in the examined hydrological variables.
2.9. Spatial and Seasonal Analysis
Long-term monthly mean maps of precipitation, evapotranspiration, and water balance were generated by aggregating 23 years (2001–2023) of satellite-derived data within the GEE environment. Pixel-wise temporal averaging was conducted to derive climatological monthly means, thereby capturing intra-annual spatial variability with high fidelity. The processed outputs were exported as GeoTIFF files at 500 m spatial resolution and subsequently refined in ArcGIS for cartographic standardization. Seasonal analysis was conducted based on the agro-climatic cropping calendar of Kerala, dividing the year into four agricultural seasons: Kharif (June–September), Rabi (October–November), Summer (March–May), and Winter Fallow (December–February). This approach enabled the identification of periods of moisture surplus and deficit. The analysis provides critical insights into the spatiotemporal dynamics of water availability across cropping seasons and supports the optimization of cropping systems through informed water resource planning and adaptive agricultural management.
3. Results
3.1. Rainfall and Runoff Analysis
The rainfall–runoff dynamics of the CRB exhibit pronounced seasonality, driven by monsoonal precipitation patterns. The basin receives peak rainfall during June–September, with July recording the highest precipitation (566.8 mm), resulting in maximum runoff (220.7 mm) (Figure 4). A sharp increase in runoff in May (62.3 mm) suggests early monsoon influence and catchment wetting, while the post-monsoon recession (October–December) reflects delayed groundwater contributions and storage effects. The rainfall–runoff relationship is highly nonlinear, indicating complex hydrological responses influenced by infiltration, antecedent moisture, and basin storage characteristics. Notably, over 75% of the total runoff is generated during the monsoon period, underscoring the basin’s extreme dependence on seasonal precipitation.
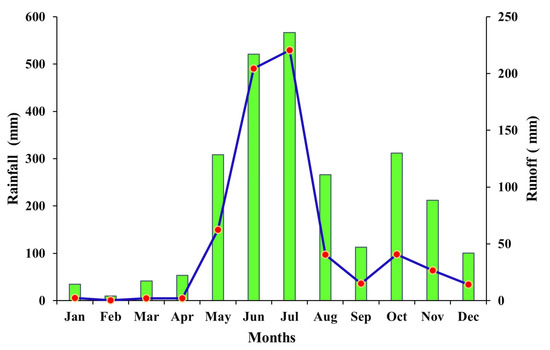
Figure 4.
Variation in the 21-year (2001–2023) monthly averages of rainfall (Bar) and runoff (line) for the CRB.
3.2. Validation of Runoff
The comparison of observed and estimated runoff from 2018 to 2021 (Figure 5) shows that both series capture the seasonal variation, with high flows during the monsoon and low flows in the dry months. While the timing of peak flows is well represented, the estimated runoff consistently overestimates the observed values, particularly during monsoon peaks. The model performed well in predicting the runoff values, with an RMSE of 29.37 (mm), indicating the average deviation between predictions and actual data. The NSE and R2 values were both 0.83, (Figure 6 and Table 3) showing a strong correlation and good agreement between simulated and observed values. The ME of 13.48 suggests a slight overestimation. The KGE value of 0.81 indicates a balanced model in terms of correlation, bias, and variability. These results are consistent with findings from similar studies in monsoon-driven basins, where NSE values typically range between 0.7 and 0.8, R2 ranges from 0.7 to 0.85 and KGE values between 0.7 and 0.8 are considered satisfactory for hydrological applications [41,54]. Overall, the results confirm the model’s reliability for hydrological predictions.
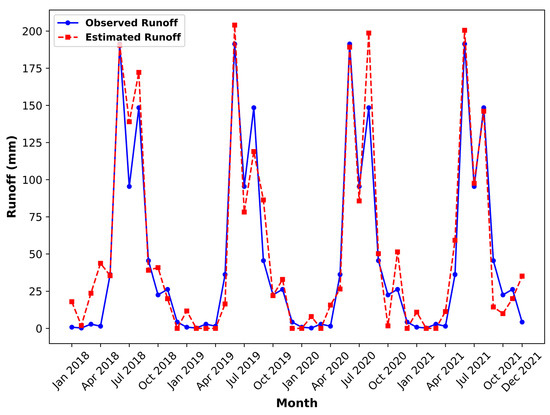
Figure 5.
Time series of observed and estimated runoff showing strong agreement in seasonal trend but consistent overestimation during high-flow periods.
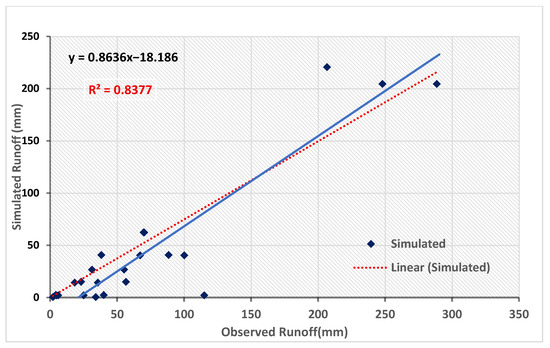
Figure 6.
Relationship between observed and simulated runoff for CRB, showing strong agreement (R2 = 0.84).

Table 3.
Inferential statistics evaluating the performance of the rainfall–runoff model.
3.3. Hydrological Components Variation
The box plots (Figure 7) provide a comprehensive representation of the seasonal variability in precipitation, evapotranspiration, and water balance across different months. The results indicate a pronounced monsoonal influence on precipitation patterns, with peak values recorded between June and August, reaching a maximum in July, whereas the lowest precipitation levels are observed from January to April (Figure 7a). Evapotranspiration exhibits an inverse trend, with higher values during the drier months (January–March and October–December) and reduced rates during the monsoon period (June–August), highlighting the significant role of water availability in modulating evapotranspiration processes (Figure 7b). The water balance aligns closely with the precipitation pattern, displaying a substantial surplus during the monsoon season and a pronounced deficit in the dry months, particularly from January to April, when evapotranspiration surpasses precipitation (Figure 7c). The interquartile range and whisker variations across all plots underscore the inherent climatic variability influencing hydrological components, reflecting the complex interplay of atmospheric and terrestrial processes governing regional water dynamics.
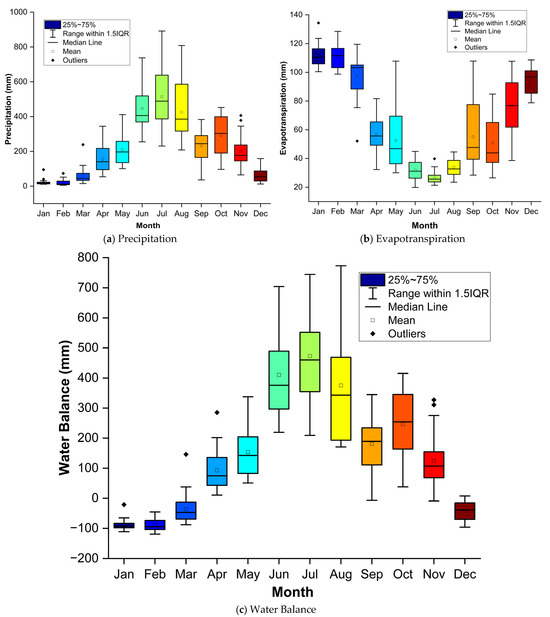
Figure 7.
Boxplots showing the distribution of (a) precipitation (mm), (b) evapotranspiration (mm), and (c) water balance (mm) for the CRB during 2001–2023.
The analysis reveals a distinct seasonal pattern, with peak precipitation occurring during the monsoon months (June–September). July exhibits the highest precipitation (548.3 mm) and water balance (540 mm), indicating a significant surplus during this period. This highlights the strong influence of monsoonal rainfall on regional hydrological processes.
Evapotranspiration remains relatively stable throughout the year, with the highest values recorded in January (111.7 mm) and February (109.3 mm). Notably, these months also show negative water balance values, suggesting that evapotranspiration exceeds precipitation, leading to potential moisture deficits and an increased risk of seasonal drought conditions.
The transition from the dry season to the monsoon period is evident during the pre-monsoon months (March–May), where a gradual increase in precipitation and water balance is observed (Figure 8). Conversely, post-monsoon months (October–December) show a decline in both variables, though evapotranspiration remains relatively unchanged.
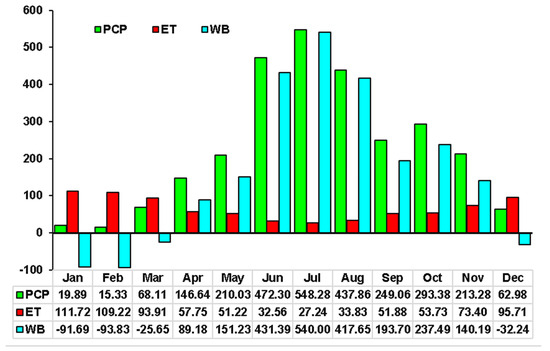
Figure 8.
Mean monthly variation in precipitation (PCP, mm), evapotranspiration (ET, mm), and water balance (WB, mm) for the CRB during 2001–2023.
The heatmap analysis (Figure 9) of precipitation (P), evapotranspiration (ET), and water balance (WB) for the period 2001–2023 reveals pronounced seasonal and interannual variability, with a strong dependence on the monsoon cycle. Precipitation is largely confined to the southwest monsoon months (June–September), frequently exceeding 500 mm in July and August, whereas non-monsoon periods typically receive less than 50 mm, indicating marked seasonality and extended dry spells (Figure 9a). Evapotranspiration exhibits a more consistent annual rhythm, with elevated values during the pre-monsoon summer (100–130 mm) driven by high atmospheric demand, and relatively lower values during the monsoon (30–70 mm) due to reduced evaporative potential under cloudy and humid conditions (Figure 9b). Consequently, the WB mirrors precipitation variability, showing substantial surpluses during the monsoon (often above 700 mm in peak months) and persistent deficits during the pre-monsoon (80 to 110 mm) (Figure 9c). These results highlight that the hydrological balance of the region is overwhelmingly controlled by monsoonal rainfall, with water availability heavily dependent on its intensity and timing, while non-monsoon periods remain characterized by widespread deficits and heightened water stress.
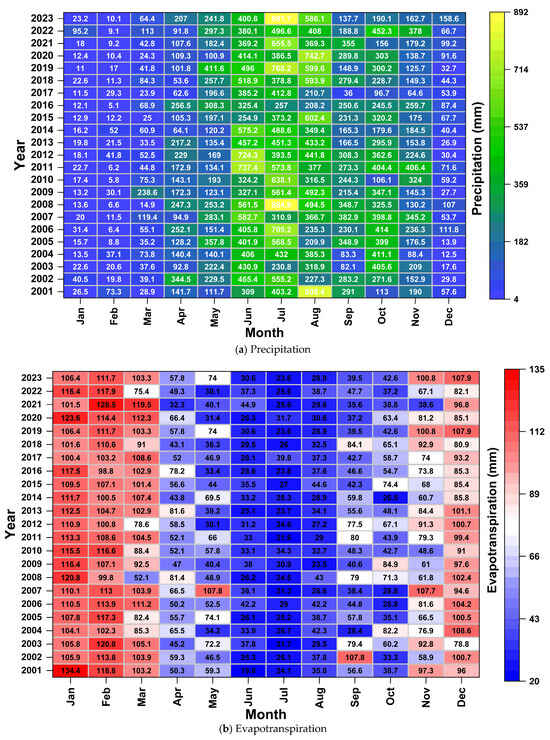
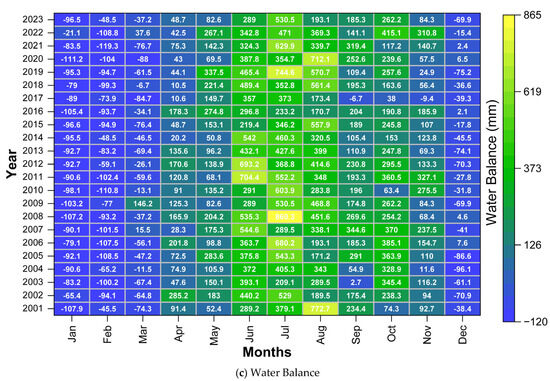
Figure 9.
Heatmaps showing monthly averages of (a) precipitation, with strong monsoon peaks (>500 mm) and very low non-monsoon values (<50 mm), (b) evapotranspiration, with high pre-monsoon demand (100–130 mm) and lower monsoon values (30–70 mm), and (c) water balance, with large surpluses (>700 mm) in monsoon months and deficits (80 to 110 mm) in pre-monsoon, during 2001–2023.
3.4. Time-Series Analysis of Hydrological Components
The time-series analysis from 2001 to 2023 shows clear seasonal variation in precipitation, evapotranspiration, and water balance (Figure 10). Precipitation shows a slight increasing trend, with a Sen’s slope of +0.0251 mm per month, indicating a small rise in rainfall over time. Evapotranspiration shows a decreasing trend (–0.0466 mm per month), which may be due to changes in vegetation, temperature, or land use change. The water balance also declines slightly (+0.0574 mm per month), suggesting that improvement in regional water availability.
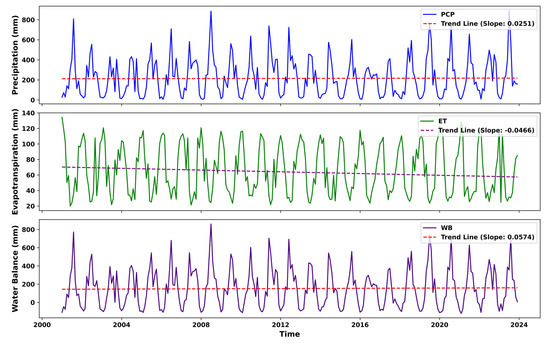
Figure 10.
Time series of monthly precipitation (mm), evapotranspiration (mm), and water balance (mm) from 2001 to 2023 with Sen’s slope estimates and corresponding linear trend.
3.5. Seasonal Analysis
The results highlight a significant contrast across seasons, with the southwest monsoon (June–September) exhibiting the highest precipitation (1707.5 mm) and water balance (1582.74 mm). This indicates the dominance of monsoonal rainfall in replenishing surface and groundwater resources. In contrast, the winter season (December–February) shows negative water balance (−217.75 mm), suggesting that evapotranspiration (316.65 mm) exceeds precipitation (98.2 mm) (Figure 11), leading to potential soil moisture depletion and increased water stress. This emphasizes the critical need for effective water conservation strategies during dry periods. The northwest monsoon (October–November) contributes moderate precipitation (755.72 mm) and a water balance of 571.38 mm, which helps sustain water availability post-monsoon. However, evapotranspiration remains relatively high (179.02 mm), reducing overall water retention. During summer (March–May), precipitation (424.78 mm) and water balance (214.76 mm) are lower compared to monsoon months, indicating a gradual transition from the dry season to peak monsoon. The relatively high evapotranspiration (202.88 mm) during this period suggests increased atmospheric demand for moisture, which may impact water availability for agriculture and ecosystems.
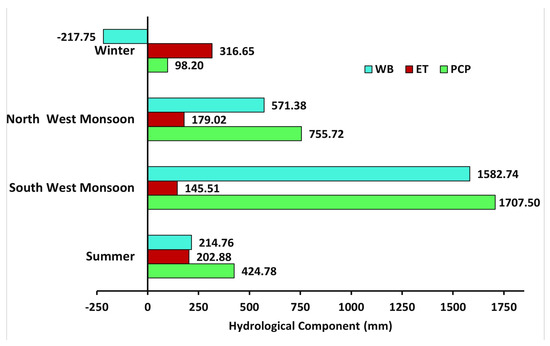
Figure 11.
Seasonal variation of precipitation (PCP, mm), evapotranspiration (ET, mm), and water balance (WB, mm) for the CRB during 2001–2023.
3.6. Influence of Rainfall, Runoff, and Evapotranspiration on Water Balance
The relationship between rainfall and water balance exhibited a strong positive linear correlation (R2 = 0.992), indicating rainfall as the primary driver of water availability in the basin (Figure 12a). In contrast, evapotranspiration showed a significant negative association with water balance (R2 = 0.753), suggesting substantial moisture loss (Figure 12b). Runoff also demonstrated a strong positive correlation (R2 = 0.860) with water balance, highlighting its contribution to hydrological surplus (Figure 12c).
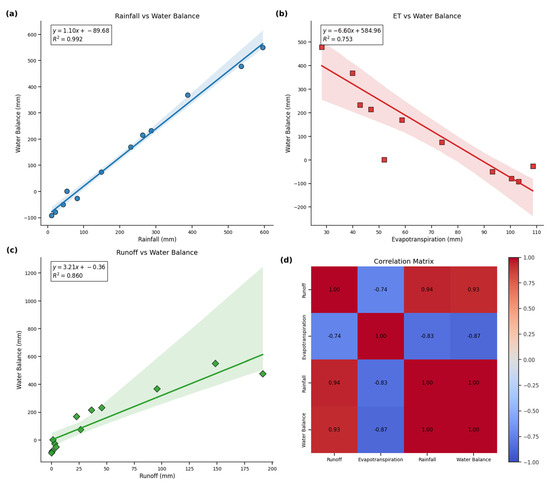
Figure 12.
Hydrological interactions in the CRB. (a–c). Relationships of rainfall, evapotranspiration, and runoff with water balance. (d) Correlation matrix showing the dependence among the hydrological parameters.
The correlation matrix (Figure 12d) reinforces these findings: rainfall and runoff are highly correlated with water balance (r = 0.93 and r = 0.94, respectively), while evapotranspiration shows a strong inverse relationship (r = –0.87). Additionally, rainfall and runoff exhibit a robust positive interdependence (r = 0.94), and ET is negatively correlated with both rainfall (r = –0.83) and runoff (r = –0.74).
3.7. Spatial Variation of Hydrologic Components
The spatial distribution of mean precipitation across the study area reveals a distinct west-to-east gradient. Higher precipitation values, reaching up to 280.43 mm, are concentrated in the eastern region, while the western region, particularly near the coastal areas, experiences significantly lower precipitation levels, with a minimum of 132.07 mm (Figure 13a). This pattern indicates orographic influences, where moisture-laden winds from the Arabian Sea ascend the Western Ghats, leading to enhanced precipitation in the eastern highlands while creating a rain shadow effect in the western lowlands. The observed variation in precipitation plays a critical role in shaping regional hydrology, influencing surface water availability, groundwater recharge, and runoff generation. Such spatial disparities emphasize the necessity for localized water management strategies to address potential water scarcity issues in low-precipitation zones while mitigating flood risks in high-precipitation areas.
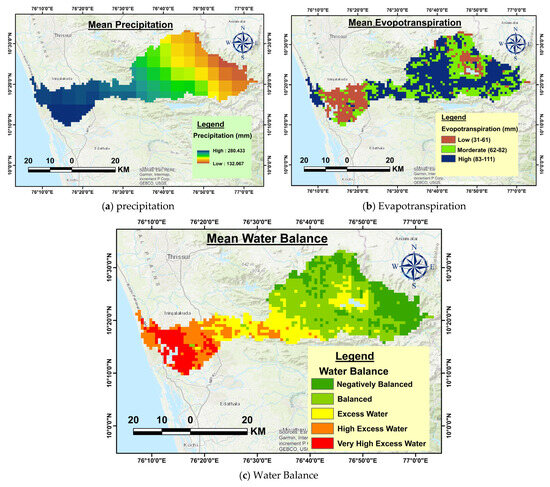
Figure 13.
Spatial distribution of long-term monthly averages of (a) precipitation (mm), (b) evapotranspiration (mm), and (c) water balance for the CRB during 2001–2023.
The spatial distribution of mean evapotranspiration across the study area exhibits considerable variation, with values ranging from 31 mm to 111 mm (Figure 13b). Higher evapotranspiration rates are observed in the eastern region, where dense vegetation and elevated temperatures contribute to increased moisture loss. In contrast, the western coastal areas experience lower evapotranspiration, likely due to the presence of water bodies, higher humidity, and reduced solar radiation. The moderate evapotranspiration zone is spread across the central part, reflecting a transitional climate between the highland and lowland regions. The observed pattern highlights the strong influence of land cover, topography, and climatic factors on evapotranspiration rates. These findings are crucial for water resource management, as areas with high evapotranspiration demand efficient irrigation strategies to sustain agricultural productivity, while regions with lower evapotranspiration may have better water retention potential.
The spatial distribution of mean water balance across the study area indicates significant regional variations (Figure 13c). The eastern region exhibits a negatively balanced water condition, suggesting high evapotranspiration rates or lower precipitation, which could lead to water scarcity issues. The central region maintains a balanced water status, indicating a relatively stable hydrological condition where precipitation and water loss are nearly equal. In contrast, the western coastal areas experience excess water accumulation, with some zones showing high to very high excess water. This pattern could be attributed to higher precipitation, lower evapotranspiration, or the presence of water-retaining land cover.
4. Discussion
4.1. Rainfall and Runoff Dynamics
The Chalakudy River Basin (CRB) exhibits a strong monsoon-driven hydrological regime, with more than 75% of annual runoff generated between June and September. This pattern is consistent with earlier studies in Kerala, which reported peak rainfall and streamflow aligned with the southwest monsoon [60,61,62]. The sharp increase in runoff during May reflects the early monsoon onset and initial wetting of the catchment, a phenomenon also observed in the Periyar and Bharathapuzha basins [63,64]. Our findings further confirm that rainfall–runoff interactions are nonlinear and strongly influenced by antecedent soil moisture and storage, in line with observations across other Western Ghats basins [65].
Model validation showed strong agreement between simulated and observed runoff, but it slightly overestimated peak flows. Similar performance metrics have been reported in other Indian monsoon basins, where NSE values commonly range between 0.70 and 0.85 [66,67]. Overestimation of peak flows has also been documented in the Periyar basin [68], often attributed to limitations of satellite-derived rainfall products in capturing localized convective storms. This highlights the need for high-resolution rainfall datasets to improve flood modeling in steep Kerala catchments.
4.2. Evapotranspiration and Water Balance
Although rainfall shows a modest increase, the CRB demonstrates declining water balance and elevated evapotranspiration (ET), particularly during dry months. Similar outcomes have been reported in Kerala, where rainfall increases under climate change scenarios in the Periyar basin did not proportionally enhance water yields due to rising ET losses [61]. Rising ET has also been documented across Peninsular India, largely driven by land use change and warming [69]. In the uplands of Kerala, plantation expansion has been shown to intensify ET, reducing seasonal water availability [70].
Our trend analysis indicates a slight rise in rainfall (+0.025 mm month−1) and water balance (+0.057 mm month−1). Comparable basin-scale studies from the Krishna and Godavari rivers provide evidence that stable or increasing rainfall can coincide with enhanced net water yields, largely attributed to significant reductions in evapotranspiration [71,72]. These findings suggest that evapotranspiration is emerging as a dominant factor controlling water availability in humid tropical basins. For Kerala, this means that abundant annual rainfall does not necessarily ensure water security, as dry-season deficits persist.
4.3. Seasonal and Spatial Water Balance Patterns
Seasonal analysis highlights the monsoon as the key contributor to water balance in the CRB, while negative balances in winter emphasize the impact of ET exceeding precipitation. Similar seasonal contrasts have been reported in the Periyar and Bharathapuzha basins [73,74]. The strong positive correlation of rainfall and runoff with water balance underscores precipitation as the main driver of hydrological surplus, whereas the negative relationship with ET confirms substantial dry-season moisture loss, in agreement with broader Indian monsoon basin studies [75].
Spatial gradients further highlight orographic influences, with higher rainfall and water surpluses in the eastern highlands and deficits in upland water balance compared to coastal surpluses. These patterns are consistent with earlier studies on Western Ghats rainfall–runoff variability [76,77]. The findings emphasize the need for localized water management strategies: upland regions require soil and water conservation interventions, while lowland areas need flood mitigation measures.
4.4. Contributions and Implications
This study provides the first integrated assessment of rainfall, evapotranspiration, and water balance for CRB over two decades. While earlier research has explored rainfall variability, evapotranspiration changes, or streamflow responses under climate change, few have examined all three components together in a single framework. Our results show that even humid tropical basins face significant seasonal water stress, particularly from January to April, when ET demand is highest. By employing a cloud-based modeling framework in Google Earth Engine, this study demonstrates a scalable and data-driven approach for hydrological assessment in data-scarce basins. Although similar frameworks have been applied in other Indian basins, this is the first application to CRB, offering new insights for the Western Ghats.
In summary, the CRB reflects a wider hydrological transition observed in Indian monsoon basins: stable or slightly rising rainfall, increasing evapotranspiration, and declining water balance. The novelty of this work lies in quantifying these interactions and highlighting their seasonal implications for water management. These insights are critical for climate-resilient reservoir operations, groundwater recharge planning, and drought preparedness in Kerala.
4.5. Cloud-Based Hydrological Modeling: Strengths, Constraints, and Future Directions
This study highlights the potential of cloud-based hydrological modeling within the GEE environment as a transformative approach for large-scale, data-driven water resource assessment. By integrating heterogeneous satellite products—including CHIRPS precipitation, MODIS-derived evapotranspiration and land cover, and OpenLand soil data—the framework demonstrates how multi-source datasets can be harmonized to generate spatially explicit runoff estimates across monsoon-dominated basins with limited reliance on in situ monitoring networks. Beyond methodological efficiency, this approach illustrates a replicable pathway for advancing hydrological research in data-deficient regions, where conventional modeling is often constrained by data scarcity and computational limitations. The ability of GEE to process multi-temporal datasets at scale underscores its relevance for capturing seasonal and interannual hydrological variability, thereby extending the practical and educational value of the framework to regional planning, climate-resilience strategies, and evidence-based water policy development.
Despite these strengths, several limitations require careful consideration. The use of moderate-resolution satellite datasets may mask local-scale hydrological variability, potentially introducing uncertainties in runoff estimation. Limited availability of observed discharge and meteorological data constrains rigorous model calibration and validation, restricting the evaluation of predictive performance. The current water balance framework does not explicitly account for changes in groundwater storage or extraction, which is a significant limitation in regions such as Kerala. Additionally, the absence of spatial downscaling reduces applicability for site-specific hydrological assessments. Addressing these challenges will require integrating higher-resolution satellite products, advanced downscaling techniques, and ground-based observations, including groundwater monitoring, to enhance accuracy. Future research should also consider dynamic land-surface characteristics and climate projection datasets to improve model adaptability across diverse hydroclimatic regimes.
5. Conclusions
This study demonstrates the effectiveness of integrating remote sensing datasets within a cloud-based hydrological modeling framework to assess spatiotemporal water dynamics in monsoon-dependent, data-scarce river basins. The model, validated against observed discharge, reliably captured both the magnitude and seasonal variability of runoff, confirming its suitability for regions with limited ground-based observations. Results reveal pronounced seasonal contrasts, with substantial monsoonal runoff and dry-season deficits, as well as spatial gradients leading to water surpluses in lowlands and deficits in uplands. Time-series analysis indicates a rising precipitation trend coupled with declining evapotranspiration, leading to a marginal improvement in the overall water balance and suggesting a slight increase in water availability in the basin.
The outcomes have direct implications for water resources management in Kerala, offering guidance for optimizing reservoir operations, irrigation scheduling, and drought preparedness. The cloud-based framework within Google Earth Engine enables scalable analysis, seamless integration of multi-source datasets, and robust characterization of seasonal hydrological dynamics. However, a critical limitation of this study is the exclusion of groundwater–surface water interactions, which play a decisive role in sustaining river flow, especially during dry periods. Additional constraints arise from the reliance on moderate-resolution datasets and sparse ground validation. Future research should prioritize the explicit representation of groundwater processes, coupled with higher-resolution inputs and dynamic surface characteristics, to improve model fidelity and strengthen its relevance for climate-resilient water management and policy planning in Kerala.
Author Contributions
Conceptualization, G.M.R., S.S. and M.Z.; methodology, G.M.R. and S.S.; software, G.M.R.; validation, G.M.R.; formal analysis, G.M.R.; investigation, G.M.R. and M.Z.; resources, G.M.R. and F.F.B.H.; data curation, G.M.R.; writing—original draft preparation, G.M.R. and S.S.; writing—review and editing, G.M.R., S.S., F.F.B.H. and M.Z.; visualization, G.M.R.; supervision, S.S.; project administration, M.Z. All authors have read and agreed to the published version of the manuscript.
Funding
This research was funded by Princess Nourah bint Abdulrahman University Researchers Supporting Project number (PNURSP2025R675), Princess Nourah bint Abdulrahman University, Riyadh, Saudi Arabia.
Data Availability Statement
The data analyzed in this study are available from the corresponding author upon reasonable request. The codes used in the analysis are openly accessible at; https://code.earthengine.google.com/71b6c4176657efbcd62db1f2820be70f, https://code.earthengine.google.com/fb1f88c175c89e5db657c4b4641d0443 (accessed on 12 may 2023).
Acknowledgments
The authors extend their appreciation to Princess Nourah bint Abdulrahman University Researchers Supporting Project number (PNURSP2025R675), Princess Nourah bint Abdulrahman University, Riyadh, Saudi Arabia. The authors are thankful to the reviewers for their constructive comments, which significantly improved the manuscript. The authors gratefully acknowledge Kerala Agricultural University for supporting the conducting of this study.
Conflicts of Interest
The authors declare no conflicts of interest.
Abbreviations
The following abbreviations are used in this manuscript:
| GEE | Google Earth Engine |
| SCS CN | Soil conservation Service Curve Number |
| CRB | Chalakudy River Basin |
| NSE | Nash–Sutcliffe efficiency coefficient |
| RMSE | Root Mean Square Error |
| ME | Mean Error |
| KGE | Kling–Gupta Efficiency |
| PCP | Precipitation |
| ET | Evapotranspiration |
| WB | Water balance |
| LULC | Land use land cover |
References
- Flint, R.W. The sustainable development of water resources. In Water Resources Update; Universities Council on Water Resources: Carbondale, IL, USA, 2004; pp. 41–51. [Google Scholar]
- Jung, M.S.; da Silva, J.A.G.; Fachinetto, J.M.; Carvalho, I.R.; Lucchese, O.A.; Basso, N.C.F.; Copetti, C.M.; Da Silva, L.G. Water: A fundamental resource for ensuring sustainability. Rev. Gestão Soc. Ambient. 2023, 17, 1–17. [Google Scholar] [CrossRef]
- Shen, Y.; Chen, Y. Global perspective on hydrology, water balance, and water resources management in arid basins. Hydrol. Process. Int. J. 2010, 24, 129–135. [Google Scholar] [CrossRef]
- Yang, D.; Yang, Y.; Xia, J. Hydrological cycle and water resources in a changing world: A review. Geogr. Sustain. 2021, 2, 115–122. [Google Scholar] [CrossRef]
- Hiben, M.G.; Awoke, A.G.; Ashenafi, A.A. Assessment of Hydrological and Water management Models for Ghba Subbasin, Ethiopia. Afr. J. Geogr. Reg. Plan. 2023, 10, 001–007. [Google Scholar]
- Das, G.K. Goolge earth engine-based rainfall-runoff modelling for hydrological assessment in Rasulpur River basin. Knowl.-Based Eng. Sci. 2024, 5, 81–97. [Google Scholar] [CrossRef]
- Kazemi Garajeh, M.; Haji, F.; Tohidfar, M.; Sadeqi, A.; Ahmadi, R.; Kariminejad, N. Spatiotemporal monitoring of climate change impacts on water resources using an integrated approach of remote sensing and Google Earth Engine. Sci. Rep. 2024, 14, 5469. [Google Scholar] [CrossRef]
- Choudhury, I.; Bhattachrya, B. Assessing the long-term fluctuations in dry-wet spells over Indian region using Markov model in GEE cloud platform. J. Agrometeorol. 2023, 25, 247–254. [Google Scholar] [CrossRef]
- Samanta, M.; Gupta, S.K.; Kanga, S.; Singh, S.K.; Kumar, P.; Meraj, G.; Ali, T.; Abouleish, M.Y. Hydrological Assessment of Uttarakhand Using the Budyko Framework and Geospatial Analysis: Insights for Sustainable Water Resource Management. In Water Resources Management; Springer: Berlin/Heidelberg, Germany, 2025; pp. 1–38. [Google Scholar]
- Amani, M.; Ghorbanian, A.; Ahmadi, S.A.; Kakooei, M.; Moghimi, A.; Mirmazloumi, S.M.; Moghaddam, S.H.A.; Mahdavi, S.; Ghahremanloo, M.; Parsian, S.; et al. Google earth engine cloud computing platform for remote sensing big data applications: A comprehensive review. IEEE J. Sel. Top. Appl. Earth Obs. Remote Sens. 2020, 13, 5326–5350. [Google Scholar] [CrossRef]
- Ghosh, S.; Kumar, D.; Kumari, R. Cloud-based large-scale data retrieval, mapping, and analysis for land monitoring applications with google earth engine (GEE). Environ. Chall. 2022, 9, 100605. [Google Scholar] [CrossRef]
- Skoulikaris, C. Large-Scale Hydrological Models and Transboundary River Basins. Water 2024, 16, 878. [Google Scholar] [CrossRef]
- El Alfy, M. Assessing the impact of arid area urbanization on flash floods using GIS, remote sensing, and HEC-HMS rainfall–runoff modelling. Hydrol. Res. 2016, 47, 1142–1160. [Google Scholar] [CrossRef]
- Rajesh, G.M.; Prasad, S.; Bhagat, I.B. Spatio-temporal Reconstruction of MODIS Land Surface Temperature over Samastipur district, Bihar with GLDAS using Geo-Matics. Indian J. Ecol. 2024, 51, 1–13. [Google Scholar]
- Senay, G.B.; Friedrichs, M.; Morton, C.; Parrish, G.E.; Schauer, M.; Khand, K.; Kagone, S.; Boiko, O.; Huntington, J. Mapping actual evapotranspiration using Landsat for the conterminous United States: Google Earth Engine implementation and assessment of the SSEBop model. Remote Sens. Environ. 2022, 275, 113011. [Google Scholar] [CrossRef]
- Mohseni, F.; Ahrari, A.; Haunert, J.H.; Montzka, C. The synergies of SMAP enhanced and MODIS products in a random forest regression for estimating 1 km soil moisture over Africa using Google Earth Engine. Big Earth Data 2024, 8, 33–57. [Google Scholar] [CrossRef]
- Ali, M.H.; Popescu, I.; Jonoski, A.; Solomatine, D.P. Remote sensed and/or global datasets for distributed hydrological modelling: A review. Remote Sens. 2023, 15, 1642. [Google Scholar] [CrossRef]
- Khattab, M.I.; Fadl, M.E.; Megahed, H.A.; Saleem, A.M.; El-Saadawy, O.; Drosos, M.; Scopa, A.; Selim, M.K. Evaluation of the Soil Conservation Service Curve Number (SCS-CN) Method for Flash Flood Runoff Estimation in Arid Regions: A Case Study of Central Eastern Desert, Egypt. Hydrology 2025, 12, 54. [Google Scholar] [CrossRef]
- Divya, P.V.; Shetty, A. Validation of CHIRPS rainfall estimates with ground-based observations in Kerala, India. In Climate Change and Water Security; Springer: Berlin/Heidelberg, Germany, 2021; pp. 585–596. [Google Scholar] [CrossRef]
- Bisht, D.S.; Chowdhury, B.; Rawat, S.S.; Pottakkal, J.G. Performance ranking of global precipitation estimates over data scarce Western Himalayan Region of India. Theor. Appl. Climatol. 2024, 155, 7515–7537. [Google Scholar] [CrossRef]
- Sharma, J.; Singh, O. Comparison of different rainfall products with gauge-based measurements over Narmada River Basin, India. Environ. Monit. Assess. 2024, 196, 114. [Google Scholar] [CrossRef]
- Prakash, S. Performance assessment of CHIRPS, MSWEP, SM2RAIN-CCI, and TMPA precipitation products across India. J. Hydrol. 2019, 571, 50–59. [Google Scholar] [CrossRef]
- Mishra, B.; Panthi, S.; Ghimire, B.R.; Poudel, S.; Maharjan, B.; Mishra, Y. Gridded precipitation products on the Hindu Kush-Himalaya: Performance and accuracy of seven precipitation products. PLoS Water 2023, 2, e0000145. [Google Scholar] [CrossRef]
- Du, H.; Tan, M.L.; Zhang, F.; Chun, K.P.; Li, L.; Kabir, M.H. Evaluating the effectiveness of CHIRPS data for hydroclimatic studies. Theor. Appl. Climatol. 2024, 155, 1519–1539. [Google Scholar] [CrossRef]
- Kumar, J.; Rajesh, G.M.; Singh, G.; Sambasiva Rao, P.; Kumar, P.; Ankit. Monitoring Land Use Dynamics and Agricultural Land Suitability in Samastipur District, Bihar Using Landsat Imagery and GIS. J. Clim. Change 2024, 10, 43–53. [Google Scholar]
- Karthik, G.; Nagarajan, K.; Manivannan, S.; Kannan, B. Application of Soil Conservation Service Curve Number model for deriving rainfall runoff relationship in an ungauged watershed of mountain region. J. Soil Water Conserv. 2022, 21, 361–370. [Google Scholar] [CrossRef]
- Shahbazi, S. Estimate Rainfall-Runoff Using Google Earth Engine in the Minab River Basin. EarthArxiv. 2025. Available online: https://eartharxiv.org/repository/view/8874/ (accessed on 15 September 2025).
- Milevski, I.; Aleksova, B.; Valjarević, A.; Gorsevski, P. Cloud-Based Assessment of Flash Flood Susceptibility, Peak Runoff, and Peak Discharge on a National Scale with Google Earth Engine (GEE). Atmosphere 2025, 16, 945. [Google Scholar] [CrossRef]
- Campo, C.; Deidda, R.; Sanna, A.; Cocco, S.; Pirastru, M. Automated Surface Runoff Estimation with the Spectral-Based Method. Remote Sens. 2023, 16, 136. [Google Scholar] [CrossRef]
- Sujud, L.H.; Jaafar, H.H.; Singh, V.P.; Mishra, A.K. A global dynamic runoff application and dataset based on Google Earth Engine. Sci. Data 2022, 9, 706. [Google Scholar] [CrossRef]
- Merizalde, M.J.; Muñoz, P.; Corzo, G.; Muñoz, D.F.; Samaniego, E.; Célleri, R. Integrating geographic data and the SCS-CN method with LSTM networks for enhanced runoff forecasting in a complex mountain basin. Front. Water 2023, 5, 1233899. [Google Scholar] [CrossRef]
- Wang, Q.; Zhao, X.; Li, F.; Zhao, W.; Awuku, I.; Ma, W.; Liu, Q.; Liu, B.; Cai, T.; Liu, Y.; et al. Optimized parameters for SCS-CN model in runoff prediction in ridge-furrow rainwater harvesting in semiarid regions of China. Agric. Water Manag. 2025, 310, 109363. [Google Scholar] [CrossRef]
- Jain, S.; Jaiswal, R.K.; Lohani, A.K.; Galkate, R. Development of cloud-based rainfall–run-off model using Google Earth Engine. Curr. Sci. 2021, 121, 1433–1440. [Google Scholar] [CrossRef]
- Jaafar, H.H.; Mourad, R.M.; Kustas, W.P.; Anderson, M.C. A global implementation of single-and dual-source surface energy balance models for estimating actual evapotranspiration at 30-m resolution using Google Earth Engine. Water Resour. Res. 2022, 58, e2022WR032800. [Google Scholar] [CrossRef]
- Vetrithangam, D.; Arunadevi, B.; Pegada, N.K.; Kaur, S.; Krishna Prasad, B. Cloud-based Rainfall-run-off Model for Assessment of Long-Term Rainfall Variability and Trends Using Google Earth Engine. Jordan J. Earth Environ. Sci. 2025, 16, 35–49. [Google Scholar]
- Zhu, B.; Xie, X.; Lu, C.; Lei, T.; Wang, Y.; Jia, K.; Yao, Y. Extensive evaluation of a continental-scale high-resolution hydrological model using remote sensing and ground-based observations. Remote Sens. 2021, 13, 1247. [Google Scholar] [CrossRef]
- Infante Corona, J.A.; Lakhankar, T.; Pradhanang, S.; Khanbilvardi, R. Remote sensing and ground-based weather forcing data analysis for streamflow simulation. Hydrology 2014, 1, 89–111. [Google Scholar] [CrossRef]
- Artha, M.A.; Libina, R.S.; Jegankumar, R. Geomorphometry Based Flood Susceptibility Prioritization: A Case Study of Chalakudy River Basin, Kerala, India. In Flood Risk Management: Assessment and Strategy; Springer Nature: Singapore, 2024; pp. 401–424. [Google Scholar]
- Chandran, P.B.; Arunkumar, R. Prediction of streamflow in Chalakudy River Basin, Kerala, by integrating teleconnection patterns of large-scale atmospheric circulations. ISH J. Hydraul. Eng. 2024, 30, 705–719. [Google Scholar] [CrossRef]
- Funk, C.; Peterson, P.; Landsfeld, M.; Pedreros, D.; Verdin, J.; Rowland, J.; Harrison, L.; Hoell, A.; Michaelsen, J. The climate hazards infrared precipitation with stations—A new environmental record for monitoring extremes. Sci. Data 2015, 2, 150066. [Google Scholar] [CrossRef]
- Dhanesh, Y.; Bindhu, V.M.; Senent-Aparicio, J.; Brighenti, T.M.; Ayana, E.; Smitha, P.S.; Fei, C.; Srinivasan, R. A comparative evaluation of the performance of CHIRPS and CFSR data for different climate zones using the SWAT model. Remote Sens. 2020, 12, 3088. [Google Scholar] [CrossRef]
- Friedl, M.A.; Sulla-Menashe, D.; Tan, B.; Schneider, A.; Ramankutty, N.; Sibley, A.; Huang, X. MODIS Collection 5 global land cover: Algorithm refinements and characterization of new datasets. Remote Sens. Environ. 2010, 114, 168–182. [Google Scholar] [CrossRef]
- Jingar, V.; Sahoo, S.; Siddharth, S.; Sharma, D.; Mehta, S.A.; Seth, A. Initial Experiments with a Scalable Machine Learning Based Approach for Downscaling the MOD16A2 Evapotranspiration Product. In Proceedings of the 7th ACM SIGCAS/SIGCHI Conference on Computing and Sustainable Societies, New Delhi, India, 8–11 July 2024. [Google Scholar]
- Hengl, T.; De Jesus, J.M.; Heuvelink, G.B.M.; Gonzalez, M.R.; Kilibarda, M.; Blagotić, A.; Shangguan, W.; Wright, M.N.; Geng, X.; Bauer-Marschallinger, B.; et al. SoilGrids250m: Global gridded soil information based on machine learning. PLoS ONE 2017, 12, e0169748. [Google Scholar] [CrossRef]
- Jaafar, H.H.; Farah, A.A.; El Beyrouthy, N. GCN250, new global gridded curve numbers for hydrologic modeling and design. Sci. Data 2019, 6, 145. [Google Scholar] [CrossRef]
- United States of Department of Agriculture (USDA), Natural Resources Conservation Service. Handbook of Hydrology; Technical Release (TR). 55; USDA: Washington, DC, USA, 1986. [Google Scholar]
- Shadeed, S.; Almasri, M. Application of GIS-based SCS-CN method in West Bank catchments, Palestine. Water Sci. Eng. 2010, 3, 1–13. [Google Scholar]
- Guo, Y.; Zhang, Y.; Zhang, T.; Wang, K.; Ding, J.; Gao, H. Surface runoff. In Observation and Measurement of Ecohydrological Processes; Springer: Berlin/Heidelberg, Germany, 2018; pp. 1–66. [Google Scholar]
- Dessie, M.; Verhoest, N.E.C.; Pauwels, V.R.N.; Admasu, T.; Poesen, J.; Adgo, E.; Deckers, J.; Nyssen, J. Analyzing runoff processes through conceptual hydrological modeling in the Upper Blue Nile Basin, Ethiopia. Hydrol. Earth Syst. Sci. 2014, 18, 5149–5167. [Google Scholar] [CrossRef]
- Deshmukh, D.S.; Chaube, U.C.; Hailu, A.E.; Gudeta, D.A.; Kassa, M.T. Estimation and comparision of curve numbers based on dynamic land use land cover change, observed rainfall-runoff data and land slope. J. Hydrol. 2013, 492, 89–101. [Google Scholar] [CrossRef]
- Nageswara Rao, K. Analysis of surface runoff potential in ungauged basin using basin parameters and SCS-CN method. Appl. Water Sci. 2020, 10, 47. [Google Scholar] [CrossRef]
- Mishra, S.K.; Sahu, R.K.; Eldho, T.I.; Jain, M.K. A generalized relation between initial abstraction and potential maximum retention in SCS-CN-based model. Int. J. River Basin Manag. 2006, 4, 245–253. [Google Scholar] [CrossRef]
- Lee, K.K.F.; Ling, L.; Yusop, Z. The revised curve number rainfall–runoff methodology for an improved runoff prediction. Water 2023, 15, 491. [Google Scholar] [CrossRef]
- Akhtar, F.; Borgemeister, C.; Tischbein, B.; Awan, U.K. Metrics assessment and streamflow modeling under changing climate in a data-scarce heterogeneous region: A case study of the Kabul River Basin. Water 2022, 14, 1697. [Google Scholar] [CrossRef]
- Rajesh, G.M.; Prasad, S. Dynamic spatio-temporal reconstruction, evaluation and trend analysis of satellite-based rainfall: A comprehensive study in Samastipur, Bihar. Discov. Geosci. 2025, 3, 56. [Google Scholar] [CrossRef]
- Rajesh, G.M.; Prasad, S.; Singh, S.K.; Al-Ansari, N.; Salem, A.; Mattar, M.A. Bias Correction of Satellite-Derived Climatic Datasets for Water Balance Estimation. Water 2025, 17. [Google Scholar] [CrossRef]
- Almazroui, M.; Şen, Z. Trend analyses methodologies in hydro-meteorological records. Earth Syst. Environ. 2020, 4, 713–738. [Google Scholar] [CrossRef]
- Ravanashree, M.; Nagarajan, M.; Rajesh, G. Climate Trend Analysis and Implications for Water Management in the Upper Bhavani Region, Coimbatore (1995–2021). J. Sci. Res. Rep. 2025, 31, 460–469. [Google Scholar] [CrossRef]
- Williams, J.R.; Kannan, N.; Wang, X.; Santhi, C.; Arnold, J.G. Evolution of the SCS runoff curve number method and its application to continuous runoff simulation. J. Hydrol. Eng. 2012, 17, 1221–1229. [Google Scholar] [CrossRef]
- Lee, J.S.; Choi, H.I. Improved streamflow calibration of a land surface model by the choice of objective functions—A case study of the nakdong river watershed in the Korean peninsula. Water 2021, 13, 1709. [Google Scholar] [CrossRef]
- Rao, P.S.B.; Shetty, S.; Umesh, P.; Shetty, A. An exploratory analysis of rainfall: A case study on western ghats of India. In Proceedings of the International Conference on Industrial Engineering and Operations Management, Bandung, Indonesia, 6–8 March 2018; pp. 1607–1617. [Google Scholar]
- Sadhwani, K.; Eldho, T.I. Assessing the vulnerability of water balance to climate change at river basin scale in humid tropics: Implications for a sustainable water future. Sustainability 2023, 15, 9135. [Google Scholar] [CrossRef]
- Reshma, C.; Arunkumar, R. Assessment of impact of climate change on the streamflow of Idamalayar River Basin, Kerala. J. Water Clim. Change 2023, 14, 2133–2149. [Google Scholar] [CrossRef]
- Nair, G.S.; Karunanidhi, D.; Subramani, T. Hydrological modeling for the Bharathapuzha River basin of South India using SWAT model. Desalination Water Treat. 2025, 321, 100975. [Google Scholar] [CrossRef]
- Abe, G.; Erinjery Joseph, J. Changes in streamflow regime due to anthropogenic regulations in the humid tropical Western Ghats, Kerala State, India. J. Mt. Sci. 2015, 12, 456–470. [Google Scholar] [CrossRef]
- Renu, S.; Reddy, B.S.N.; Santhosh, S.; Sreelekshmi; Lekshmi, V.; Pramada, S.K.; Sridhar, V. Hydrologic and Hydraulic Modeling for Flood Risk Assessment: A Case Study of Periyar River Basin, Kerala, India. Climate 2025, 13, 129. [Google Scholar] [CrossRef]
- Wagner, P.D.; Kumar, S.; Fiener, P.; Schneider, K. Hydrological modeling with SWAT in a monsoon-driven environment: Experience from the Western Ghats, India. Trans. ASABE 2011, 54, 1783–1790. [Google Scholar] [CrossRef]
- Shah, H.L.; Mishra, V. Hydrologic changes in Indian subcontinental river basins (1901–2012). J. Hydrometeorol. 2016, 17, 2667–2687. [Google Scholar] [CrossRef]
- Sudheer, K.P.; Bhallamudi, S.M.; Narasimhan, B.; Thomas, J.; Bindhu, V.M.; Vema, V.; Kurian, C. Role of dams on the floods of August 2018 in Periyar River Basin, Kerala. Curr. Sci. 2019, 116, 780–794. [Google Scholar] [CrossRef]
- Raghavendra, P.K.; Bhimala, K.R.; Patra, G.K.; Goroshi, S. Annual and seasonal trends in actual evapotranspiration over different meteorological sub-divisions in India using satellite-based data. Theor. Appl. Climatol. 2023, 152, 999–1017. [Google Scholar] [CrossRef]
- Mathew, B.; HD, V.P. Impact of Watershed Development Projects Implemented in Kerala. J. Ext. Educ. 2021, 33, 6531–6543. [Google Scholar] [CrossRef]
- Nikam, B.R.; Garg, V.; Jeyaprakash, K.; Gupta, P.K.; Srivastav, S.K.; Thakur, P.K.; Aggarwal, S.P. Analyzing future water availability and hydrological extremes in the Krishna basin under changing climatic conditions. Arab. J. Geosci. 2018, 11, 581. [Google Scholar] [CrossRef]
- Rao, K.D.; Rao, V.V.; Dadhwal, V.K.; Sharma, J.R.; Jyothsna, R. Transforming to hydrological modelling approach for long-term water resources assessment under climate change scenario—A case study of the Godavari Basin, India. Curr. Sci. 2014, 106, 293–299. [Google Scholar]
- Mathew, M.M.; Sreelash, K.; Mathew, M.; Arulbalaji, P.; Padmalal, D. Spatiotemporal variability of rainfall and its effect on hydrological regime in a tropical monsoon-dominated domain of Western Ghats, India. J. Hydrol. Reg. Stud. 2021, 36, 100861. [Google Scholar] [CrossRef]
- Nair, A. Trend analysis of hydro-climatological factors using a bayesian ensemble algorithm with reasoning from dynamic and static variables. Atmosphere 2022, 13, 1961. [Google Scholar] [CrossRef]
- Goroshi, S.; Pradhan, R.; Singh, R.P.; Singh, K.K.; Parihar, J.S. Trend analysis of evapotranspiration over India: Observed from long-term satellite measurements. J. Earth Syst. Sci. 2017, 126, 113. [Google Scholar] [CrossRef]
- Sinha, R.K.; Eldho, T.I.; Subimal, G. Assessing the impacts of land use/land cover and climate change on surface runoff of a humid tropical river basin in Western Ghats, India. Int. J. River Basin Manag. 2023, 21, 141–152. [Google Scholar] [CrossRef]
Disclaimer/Publisher’s Note: The statements, opinions and data contained in all publications are solely those of the individual author(s) and contributor(s) and not of MDPI and/or the editor(s). MDPI and/or the editor(s) disclaim responsibility for any injury to people or property resulting from any ideas, methods, instructions or products referred to in the content. |
© 2025 by the authors. Licensee MDPI, Basel, Switzerland. This article is an open access article distributed under the terms and conditions of the Creative Commons Attribution (CC BY) license (https://creativecommons.org/licenses/by/4.0/).