Article

Longitudinal Calculation of Water Poverty Index in the Middle East: Potential to Expedite Progress

1
Asturias Raw Materials Institute, University of Oviedo, 33600 Mieres, Spain
2
Quantitative Analysis Laboratory (QuAnLab), Higher Institute of Accountancy and Business Administration (ISCAE), University of Manouba, Manouba 2020, Tunisia
3
Institute of Environmental and Water Studies, Birzeit University, Ramallah P606, Palestine
*
Author to whom correspondence should be addressed.
Water 2025, 17(19), 2871; https://doi.org/10.3390/w17192871
Submission received: 31 August 2025 / Revised: 19 September 2025 / Accepted: 26 September 2025 / Published: 1 October 2025
(This article belongs to the Section Water Resources Management, Policy and Governance)

Abstract

This study examines the longitudinal relationship and interactions among comprehensive water management, human development, and fragility. The seventeen Middle Eastern countries were examined for the period from 1996 to 2023. The Human Development Index (HDI) and Fragile States Index (FSI) were considered as a proxy for human development and fragility. In addition, the Water Poverty Index (WPI) was thoroughly assessed using classical and improved methods to measure multidisciplinary water management. Findings highlight that “Resources” and “Environment” are the most critical components of WPI. Iran performed the most consistently across WPI versions, whereas Palestine performed the worst. “Capacity,” “Environment,” and “Access” are the most influential components of HDI. FSI was found to be the most sensitive to “Capacity” and “Environment”, which contribute to both human development and stability. This study provides empirical evidence to inform SDG 6 implementation by demonstrating the linkage between WPI components and progress in human development.

1. Introduction

WPI originated as a natural progression of efforts to create indices for measuring water scarcity in the 1980s. It has been recognized as a highly effective tool for offering a multidisciplinary and transparent means of assessing water conditions [1,2]. It has also been reported to be simple-to-measure, valuable for monitoring and benchmarking performance and evaluating policies, and enabling informed decision-making [3,4,5,6,7,8,9,10,11]. It is widely regarded as a robust tool to support decision-makers in developing prospective plans for the water sector [2]. Furthermore, WPI is inclusive and engages policymakers, stakeholders, academics, donors, and resource managers [2,12]. The WPI formula developed over time, and various versions of WPI have emerged since 2001 [8,13,14].
Despite the wealth of research on WPI, none of the studies tested the longitudinal trend of WPI over a certain number of years, despite the availability of reliable country-level data that allow for this monitoring. Moreover, limited literature was found measuring WPI for Middle Eastern countries despite this region being categorized among the most water-poor. Furthermore, the longitudinal relations and trends between WPI and human development, on one hand, and with fragility, on the other hand, were rarely touched [15]. Therefore, this study covers multifaceted gaps in the literature through providing a longitudinal measurement for WPI and testing the correlations between WPI with trends in human development and fragility for the period from 1996 to 2023. The sensitivity of WPI, HDI, and FSI to the five WPI components was tested over the aforementioned study timeframe. The study identified the classical WPIcl as the most suitable version for longitudinal analysis of WPI’s relationship with HDI and FSI. While improved methods predicted greater WPI deterioration, the classical approach consistently demonstrated stronger and more proportional correlations with HDI and FSI across most countries, offering more compelling results. “Capacity” emerged as the most significant component, showing proportional significance with HDI in 12 of 17 countries and inverse correlations with FSI. “Access”, “Use”, and “Environment” were the three influential components of WPI, while countries having higher performance in “Environment” were among the least fragile.
The following sections include a literature review and conceptual framework, which summarizes the main relevant literature and provides the theoretical basis for this study. The methodology used to execute this study follows with details on data sources and the methodology used to normalize, analyze, and calculate the index values. The next section presents the main results with a discussion and comparison with previous studies. The last section is the conclusion of this study with respective recommendations.

1.1. Water Poverty Index

WPI’s appeal lies in its dimensionless, holistic, and easy-to-understand nature, which makes it superior to a simple, single-dimensional, and restrictive index [13]. As a result, WPI has attracted widespread interest from researchers and scholars globally as a comprehensive tool for assessing the availability of water resources and access to them across different scales: international [3,5,12,13,16], national [7,10,12,13,17], district or basin [2,5,18], sub-basin [17], community [4,5,14,16,19], livelihood group [20], and household level [21]. WPI measurement has developed over the past two decades. Table 1 presents the main milestones and versions developed to measure WPI.
The classical WPI was criticized for having several limitations: firstly, the ad hoc selection of indicators used to calculate the index [26,27]; secondly, the weighing and aggregation techniques influence the coherence and interpretability of final values; thirdly, masking local-level variabilities through larger-scale WPI was also a common area of critique [5,21,24,28]; and fourthly, the correlated pieces of information can lead to possible compensability among different WPI components [7,12,13,24,26,28,29]. In addition, WPI as a blind value was found inadequate for assessing the complexity of water issues unless subcomponents were considered in the analysis [5,7,24]. Therefore, the improved methods were introduced to address some of the aforementioned limitations, namely, the weighting and correlations among subcomponents (which lead to replaceability risk) [15].
The most commonly used versions at national level were the classical and improved WPI versions [8,12,15,17,30]. However, it has been confirmed that the weighted geometric function is the most appropriate aggregation method for calculating WPI because this does not allow compensability among the different components involved in the index formula [1]. Newer versions such as AWPI, Inclusive WPI, and Improved WPI have either sectoral or smaller-scale applications, or still need further testing and validation [15].
The Middle East is a strategically significant transcontinental region located at the crossroads of Eurasia, Africa, and the Indian Ocean. This region spans southwestern Asia and north-eastern Africa. It consists of 17 countries, and it is one of the most water-scarce regions of the world. In the past few years, some countries in this region have experienced a water and sanitation crisis, and there is anticipation that the water situation will continue to deteriorate in these countries [13,26,31]. While some regions have begun tackling their water-related problems (e.g., North Africa, South Africa, and the Mediterranean), the Middle East is lagging behind [31].
Numerous studies have consistently shown that most countries in the Middle East fall within the high and severe water poverty categories, with Jordan and Palestine identified among the most water-poor nations in the region. Ref. [13] analyzed WPI values for Middle Eastern countries and presented their findings graphically. A review of these maps indicates that resources are not the sole determinants of the WPI value. For instance, although Iraq’s resource component ranked in the highest category, the low Use, Capacity, Access, and Environment scores result in an overall WPI value within one of the weakest categories.
Rapid population growth will pose significant challenges to the availability of drinking water. To address this critical situation, substantial investments will be necessary to upgrade existing water infrastructure and develop new facilities, including production plants, distribution networks, sanitation stations, and modernized irrigation systems [13]. However, a more comprehensive approach is required to drive sustainable change in water management across the Middle East. This is of special importance in a context where several countries are classified as fragile [32]. Thus, the WPI could serve as an ideal tool to help achieve sustainable improvements.
Despite the critical water scarcity in the Middle East, it is evident that WPI has not been calculated for most countries since 2014. Ref. [16] included some of the countries from the Middle East in her research but missed some others. Ref. [6] conducted their research on Palestine only. Ref. [13] covered the MENA region, but since then no assessment has been performed for all the Middle Eastern countries. Refs. [29,33] covered Jordan only. Ref. [34] measured WPI for Egypt only. Refs. [9,35,36] conducted their research in Iran only. Furthermore, despite their clear relevance, many WPI versions have not been piloted in most Middle Eastern countries. Utilizing these updated versions of WPI offers a valuable opportunity for water managers in these countries to make better-informed and impartial decisions.

1.2. Water Poverty and Fragility

Countries worldwide are commonly classified into three main categories: developed economies, economies in transition, and developing nations [30]. Each broad category may contain various sub-groups, and nations can be further categorized as fragile, crisis, or failed states [37]. At least one-third of the world’s most vulnerable populations are estimated to reside in fragile states. These countries often experience war, violence, and severe poverty, posing significant challenges to security and development efforts [12,19].
The correlation between water poverty and fragility is intricately examined by [26,31,38], with each highlighting different facets of the relationship. Ref. [26] argued that addressing water poverty requires a structural framework that includes water supply, sanitation, and economic indicators, underscoring that water sufficiency must be evaluated in monetary terms to account for environmental and social sustainability. Their long-term approach aligns with the idea that water poverty exacerbates fragility by limiting resources necessary for stability and development. Ref. [31] extend this perspective to the Middle East, illustrating how climate change, population growth, and increasing water demand amplify water scarcity, creating a volatile mix that threatens socio-economic stability. Both studies emphasize that water scarcity hinders development and exacerbates fragility by intensifying vulnerabilities within affected communities and regions.
Ref. [38] focused on the socio-political dimensions of water poverty and fragility. He argues that water scarcity triggers second-order conflicts, such as institutional and social adaptation challenges, which can destabilize nations more than first-order conflicts over water resources. This has been confirmed by [13] who assessed the impact of water scarcity on conflict in the MENA region. Ref. [38] places emphasis on adaptive capacity and highlights the link between water poverty and a country’s ability to manage fragility. While ref. [26] stress structural solutions and ref. [31] focus on environmental pressures, ref. [38] identifies the socio-political bottlenecks that compound water-related fragility. Together, these studies underscore the profound interdependence between water poverty and fragility, revealing how water access and management deficiencies can destabilize nations socially, economically, and politically.

1.3. Water Poverty and Human Development

The relationship between water poverty and human development is multifaceted, involving interactions between physical resources, socio-political systems, and individual capabilities. Fenwick [23] underscores the significant correlation between WPI and HDI, with a reported r = 0.81, suggesting that water access and development are closely intertwined. Ref. [7] highlights capacity as a critical determinant of this relationship, nearly perfectly correlated with HDI, while emphasizing the unique contributions of WPI. Both [7,16] underscore that water scarcity issues, exacerbated by population growth and climate change, pose ongoing challenges for sustainable development.
Refs. [30,39] argue that water poverty is not solely a physical issue but is deeply entrenched in socio-political and institutional inequalities. Ref. [30] critiques traditional water scarcity metrics, advocating for the entitlements and capabilities approaches that highlight structural barriers to water access, particularly for marginalized groups in the community. These frameworks integrate water’s critical role in health, education, and livelihoods, linking it to broader human rights and well-being. Ref. [39] aligns with this view, emphasizing the importance of overcoming systemic inequalities to enhance capabilities, particularly for women and girls who disproportionately bear the burden of water scarcity. Both authors highlight how privatization and commodification exacerbate disparities, calling for participatory and rights-based governance mechanisms to address inequities.
From a broader developmental perspective, Ref. [40] highlighted the complementary roles of the capability and entitlement frameworks in addressing structural inequalities and promoting human flourishing. The authors argue for an integrated approach considering individual freedoms and systemic conditions. Meanwhile, ref. [41] critiques blind imposing of Western-centric development models, which he sees as exacerbating inequality by ignoring local contexts and cultural heritage. His analysis underscores the importance of localized solutions in addressing water and poverty issues.
In the Middle East, these dynamics manifest acutely due to the region’s arid climate, rapid population growth, and political instability. Refs. [13,30] emphasize that water scarcity in this region is a matter of physical availability, institutional mismanagement, and socio-political constructs. Jemmali stresses that water poverty exacerbates economic disparity and food insecurity, particularly in rural areas. Addressing water poverty in the Middle East thus requires integrating technical solutions with governance reforms that account for cultural and political complexities, ensuring equitable access for vulnerable populations.

1.4. WPI, FSI and HDI

Improving WPI in fragile countries is normally more challenging than in stable ones. Refs. [14,42] emphasized the persistent vulnerability of fragile states despite receiving significant development aid. They highlight that aid effectiveness is conditional on the quality of policies and institutions, which is, in other words, represented in capacity. Likewise, Ref. [43] underscores the necessity of cross-sectoral policies to address climate-exacerbated food, water, and energy challenges. Seyoum [25] identified specific aspects of capacity such as institutional weaknesses, governance, legitimacy, and provision of public services. The latter underscores the strong relations between these aspects of HDI components.
Ref. [43] focused on environmental and resource dynamics to address fragility and boost human development, advocating for cross-sectoral coordination to optimize progress towards human development. On the other hand, ref. [44] linked fragility to social and political factors, such as state legitimacy and social cohesion, and their implications for human development. Therefore, it can be noticed from the literature that fragility and human development are determined based on a wide variety of natural, socio-economic, and political factors. It can be claimed that these factors are consistent with the variables that determine the value of WPI [16]. However, improving WPI and HDI in fragile countries, which is preconditioned with reducing fragility (Stewart and Brown, 2009, as cited by [18]) could be more challenging even with external assistance because the effectiveness of this aid was normally limited [14].
In the Middle Eastern context, the linkage among WPI, HDI, and FSI becomes evident through these frameworks. Ref. [44] further demonstrates that higher FSI scores correlate with lower HDI, showing that increased fragility leads to declines in education, health, and income [25,39]. The emphasis of [43] on resource interdependencies resonates with the Middle East’s water-scarce realities, where WPI intricately ties into HDI and FSI dynamics. Addressing these interdependencies requires integrated, region-specific policies encompassing environmental, social, and governance dimensions to promote stability and development. This recommendation aligns with [14], who concluded that strong institutional capacity is a prerequisite for making external aid more effective in achieving sustainable development, directly influencing HDI outcomes.

2. Materials and Methods

This study’s methodology for thoroughly examining the water situation in the Middle East primarily relies on the WPI framework, initially developed by [3,16,22]. The current study adopts the classical WPI structure but incorporates empirical enhancements suggested by [8,12,13,17,21].

2.1. Data

In the first step of data compilation, various datasets were utilized from multiple sources, including [45,46]. A total of 31 indicators were utilized to build 14 subcomponents that were categorized into five components (Table 2). This list of data was compiled for the 17 countries comprising the Middle East from 1996 to 2023. Regarding HDI and FSI, the values of both indices were collected for the same period (1996–2023, inclusively). The sources of data were as follows:
In some cases, the data for a specific country or a specific year were unavailable. In this case, the linear-trend interpolation procedure was applied separately for each country and for each variable to calculate the missing values. For a given country–variable we fitted an ordinary least squares linear trend of the form y t = x t + z , where yt is the observed value in year t, and x and z are the intercept and slope estimated from the set of available (non-missing) years for that country–variable. Please refer to Supplementary Materials to visualize the raw data used in this research.
Table 2. Subcomponents and components with their respective weights for each component and subcomponent using classic and PCA methods.
ComponentSub-ComponentsWeights According to Classical MethodWeights According to PCA
1996200520142023
Resources 20%45.7%28.5%0%35.9%
R1: External water Resources (Total external renewable water resources per capita)
R2: Internal water Resources (Total Internal renewable water resources per capita)
R2: Variability of precipitation (Long term average precipitation in depth)
33.33%

33.33%

33.33%
50%

50%

0%
50%

0%

50%
50%

0%

50%
50%

50%

0%
Access 20%0%0%31.8%7.0%
A1: Access to drinking water (Total population with access to safe drinking water)
A2: Access sanitation facilities (People using safely managed sanitation services)
A3: Access to irrigation to internal Resources (% of the area equipped for irrigation actually irrigated)
33.33%

33.33%

33.33%
50%

50%

0%
50%

50%

0%
50%

50%

0%
0%

50%

50%
Use 20%7.3%32.4%0%7.0%
U1: Water domestic use (Municipal water withdrawal)
U2: Agricultural use (Agriculture, value added (% GDP))
U3: Industrial use (Industry (including construction), value added (% of GDP))
33.33%
33.33%
33.33%
0%
50%
50%
50%
50%
0%
0%
50%
50%
50%
0%
50%
Capacity 20%0%4.9%40.6%15.4%
C1: Capacity Schooling (Mean Years of Schooling (HDI database))
C1: Health (Life expectancy _HDI)
C3: GDPc (GDP per capita (current US$))
33.33%
33.33%
33.33%
0%
100%
0%
0%
100%
0%
100%
0%
0%
100%
0%
0%
Environment 20%47.0%34.2%27.6%41.7%
E1: Fertilizers (Fertilizer consumption (kilograms per hectare of arable land))
E2: WatStress (Level of water stress: freshwater withdrawal as a proportion of available freshwater)
50%

50%
0%

100%
0%

100%
0%

100%
0%

100%

2.2. Aggregation and Weighting

2.2.1. WPI

To normalize these variables, each parameter is assigned a score ranging from 0 to 100, based on its significance, where 0 represents the lowest level and 100 denotes the optimal level. Normalization of indicators such as per capita water availability is standardized using the following approach:
X i = X i X m i n X m a x X m i n × 100
X i = X m a x X i X m a x X m i n × 100
where xi represents the current value of variable x for country i, while xmin and Xmax denote the lowest and highest values, respectively, of the variable across the Middle East. Equation (2) is applied to normalize negative variables, such as variability of precipitation, where lower levels indicate a better situation.
In the second step, following the calculation of various subcomponents, an appropriate weighting scheme is applied to aggregate these subcomponents objectively into the five WPI components. Before aggregation, the correlations among the subcomponents are analyzed to identify potential redundancy or interdependence, as such correlations can lead to double-counting [8] and introduce bias into the results [5,19]. A multivariate statistical technique analyzes whether the selected variables are statistically well-balanced.
Since all variables are quantitative, principal component analysis (PCA) is conducted for each component, after checking the factorability of data using the known exploratory tests (the determinant of the correlation matrix, Bartlett’s test of sphericity, and the Kaiser–Meyer–Olkin measures of sample adequacy). The main purpose of PCA is the reduction of the complex set of 31 subcomponents into a set of fewer uncorrelated components using varimax orthogonal rotation. To determine how many factors should be retained in the analysis without losing too much information, the “variance explained” criterion keeps enough factors to account for at least 70% of the total variation [19]. Since sub-indices can compensate for each other’s performance at this level, additive aggregation is used to compute the five component indices (Pérez-Foguet & Giné Garriga). All sub-indices (Vj) are considered to have the same importance; thus, no specific weighting is introduced. Each component (Xi) is calculated as a simple average of the n retained variables:
X i = 1 n j = 1 n V j
The last step is the aggregation of the five components under the assumption of non-compensability—where failure in one component cannot be offset by strong performance in another, ensuring that poor performance in any component is penalized more significantly. To achieve this, a weighted multiplicative function is employed, as it is deemed the most suitable aggregation method for calculating the final index while accounting for non-compensability among the components [8,12,13]. The appropriate weighting scheme is determined using PCA, after verifying the factorability of the data through the previously mentioned tests. This technique allows objectively determining the set of weights explaining the largest variation in the original components [48]. Then the final index can be formulated numerically as follows:
W P I a = i R , A , C , U , E W i X i
W P I g = i = R , A , C , U , E X i w i
where WPIg/WPIa are the final values of the index, Xi is the ith component, and wi is the weight assigned to that component. Weights are determined using the squared rotated factor loading scores obtained after applying varimax orthogonal rotation and the variance explained criterion, which allows keeping enough factors to account for at least 70% of the total variation. The selected intermediate components, which explain the largest part of the variance, are aggregated by assigning each a weight that depends on the proportion of the explained variance in the data; the greater the proportion, the higher the weight. The weight (wi) can then be found using the formula shown in Equation (6) [13]:
w i = k = 1 , 2 , 3 P C K i × γ k j = 1 , 2 γ j
where PCki is the factor loading of the ith index, which can be Resources, Access, Capacity, Use, and Environment, on the kth principal component; this is also called component loading.
Mapping water poverty provides a clear visualization of the spatial heterogeneity of WPI and establishes a unified data framework that integrates socio-economic, physical, and ecological information [16]. Maps proved to be effective in analyzing water-related challenges and offer a practical tool for policymakers to enhance transparency in decision-making and policy formulation. In addition, the longitudinal mapping of WPI also shows transparently the changes in WPI over time and the trend of each country, and helps predict the future situation. The maps of WPI’s components might be also assessed separately. This may draw attention to those water-sector requirements that necessitate urgent policy intervention and specific strategies.

2.2.2. Fragility Measurement

Indices have been used since the 1970s to measure fragility. However, there are multiple indices with no consensus on a unified measurement tool. The most important fragility indices are as follows:
  • Country Indicators for Foreign Policy (CIFP): Developed by Carleton University. These assess state performance along three dimensions of statehood—authority, legitimacy, and capacity (ALC).
  • Country Policy and Institutional Assessment (CPIA): Developed by World Bank. It represents the quality of a country’s present policy and institutional framework.
  • Fragile states index (FSI): Developed by Fund for Peace and based on the existing social and economic, and political and military, pressures faced by each country. The scale is 1–120.
  • Index of state weakness in the developing world (ISW): Developed by Brookings Institution. It enables the identification of potential patterns of state weakness, either within geographical regions or across functional areas.
  • State fragility index (SFI): Developed by George Mason University. It is a measure of state effectiveness and legitimacy in the key dimensions of security, governance, economics, and social development.
For this study, it was found that each fragility index has its focus, but the FSI is the index that is being measured for all countries worldwide on an annual basis. The index is built using a sophisticated approach and large number of variables. Unlike the other indices, FSI provides data for all Middle Eastern countries since 2006 [14]. The FSI thresholds are as follows:
  • <30: Very sustainable (high stability);
  • 30–59.9: Stable (minor vulnerability);
  • 60–89.9: Warning (moderate challenge or risks of instability);
  • 90–120: Alert (significant fragility and risk of conflict/collapse).
Therefore, the data for FSI were retrieved from the annual reports from Fund for Peace (2016 to 2023).

2.2.3. Human Development Measurement

Human development is a multidimensional concept that encompasses improvements in life expectancy, education, and living standards, emphasizing the well-being of individuals rather than just economic growth [49]. While HDI has been a pivotal tool for measuring societal development since its introduction in 1990, it has limitations, particularly its reliance on national averages that mask significant subnational disparities and neglect critical dimensions [44,49,50]. Nonetheless, both Permaver and Smits [25] and Seyoum [25] focused on HDI’s role in showcasing global development and tracking countries’ progress. The 2010 enhancements to the HDI, which incorporated new indicators like gender inequality and climate change, broadened its scope to reflect the evolving understanding of human development [41]. For this study, the standard HDI was used. The HDI value was retrieved from UNDP Human Development Reports (1996–2023) for the Middle Eastern countries.

2.3. Statistical Analysis for WPI, FSI and HDI

Given that this research covers the period from 1996 to 2023, analysis was conducted per country annually. Mapping was used to show the spatial and temporal changes in WPI and its components over the 28-year interval. The following software was also used for data preparation and statistics:
(a)
MS Excel 365 was used for data preparation/organization.
(b)
Stata 16 was used to perform all statistical analyses needed for normalization, component value calculations, and WPI calculations in classical, arithmetic, and geometric versions.
(c)
IBM SPSS Statistics 30.0 was used to determine the correlation between the three indices

3. Results

Table 2 shows the weights for each component using PCA for four years distributed across the testing period. To select the principal components, we chose the PCs that explain a significant portion of the total variance (e.g., 70% or more). This reduces dimensionality while retaining the most important information.
As shown in the above table, the PCA method weighted Resources and Environment the highest across the whole testing period. This could be a good basis for decision-makers to prioritize developing the relevant water infrastructure and boost the environment components in order to amplify the progress in WPI. This result is in alignment with previous studies such as [13].

3.1. Middle Eastern Countries’ Performance in the Five WPI Components

When the average value of each component was calculated using the classical method for the period 1996–2023, 15 countries showed improvement in their WPIcl. The best improvement over time was in the Environment component, where 15 out of 17 countries showed improvement, while the least was in the Resources, with only 9 countries showing improvement. Iran showed the highest WPI in 2023 according to the three methods, and it was the only country that showed improvement in the five components, while Palestine’s performance was the worst (refer to Table S4 in the Supplementary Materials).
When the arithmetic and geometric WPI were used, 14 and 12 countries showed improvement in their WPI, respectively. Yet, none of the countries showed improvement in 100% of components. A share of 12 out of the 17 showed deterioration in two to four components over the testing period (1996–2023). The best improvement was found in the Environment component (observed in 15 countries), while the worst was in the Access component (improvement is observed in four countries only). By comparing the ranking of countries using the three methods, it was concluded that, in all three WPI methods, the ranking of the majority of countries was consistent.
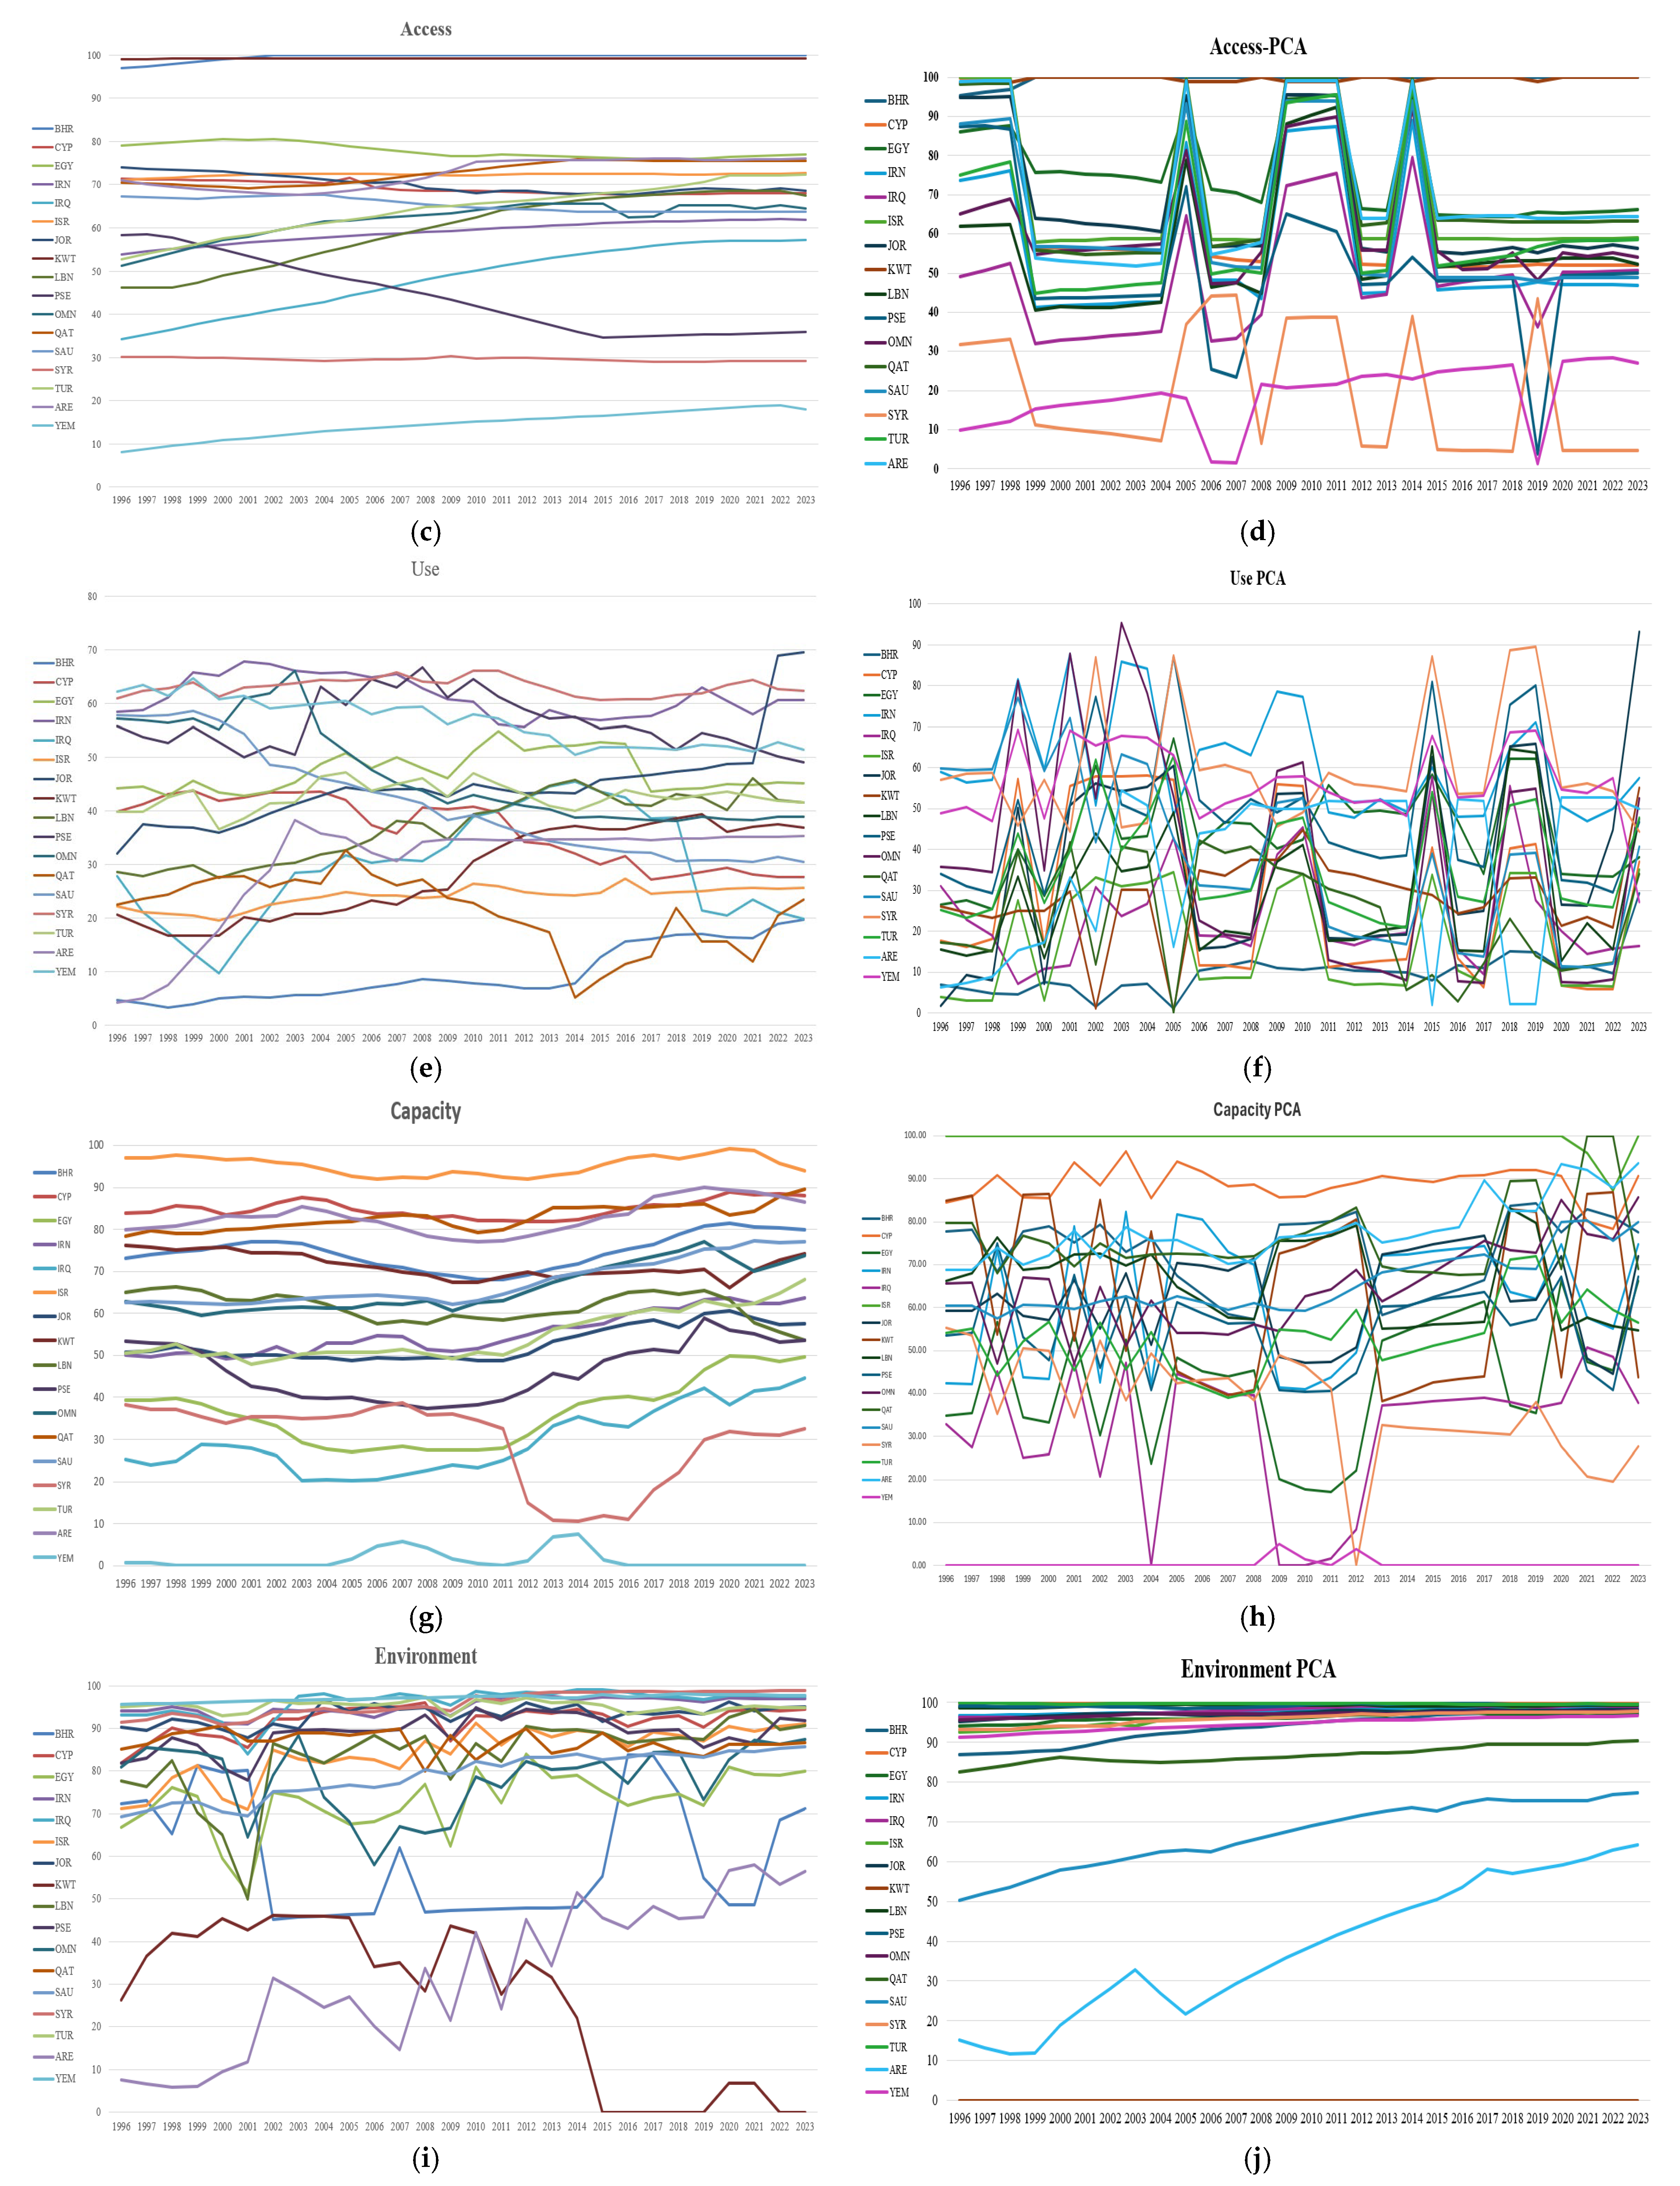
As shown in Figure 1, the longitudinal graphs for components using the classical method of calculations showed different patterns to the improved (PCA-based) method. The results of the classical method show more flat and stable graphs throughout the period. In contrast, the graphs using the PCA method show more turbulence in specific periods that vary for each component, but with temporal relative stability in other periods as well. This instability is found also across the whole period for “Use”, but it was the least for Environment.
In both classical and PCA methods, Iraq, Iran, and Syria showed the highest performance in Resources, while Qatar and Kuwait were among the least. It is noticeable that Resources is the component for which 7–8 countries showed deterioration. This result is in alignment with studies that anticipated that the water situation will continue to deteriorate due to various factors including population growth [13,31,34]. Regarding Access, Kuwait and Bahrain scored the highest, while Yemen and Syria scored the least in both methods. Iran and Syria scored the highest in Use, while Qatar, Israel, and Bahrain scored the least. Moreover, Israel, Cyprus, and UAE scored the highest in Capacity, while Iraq, Syria, and Yemen scored the least. For Environment, no consistency was found between the two methods, where Yemen and Iraq scored the highest according to the classical method, while Cyprus and Turkey were highest according to the PCA method.
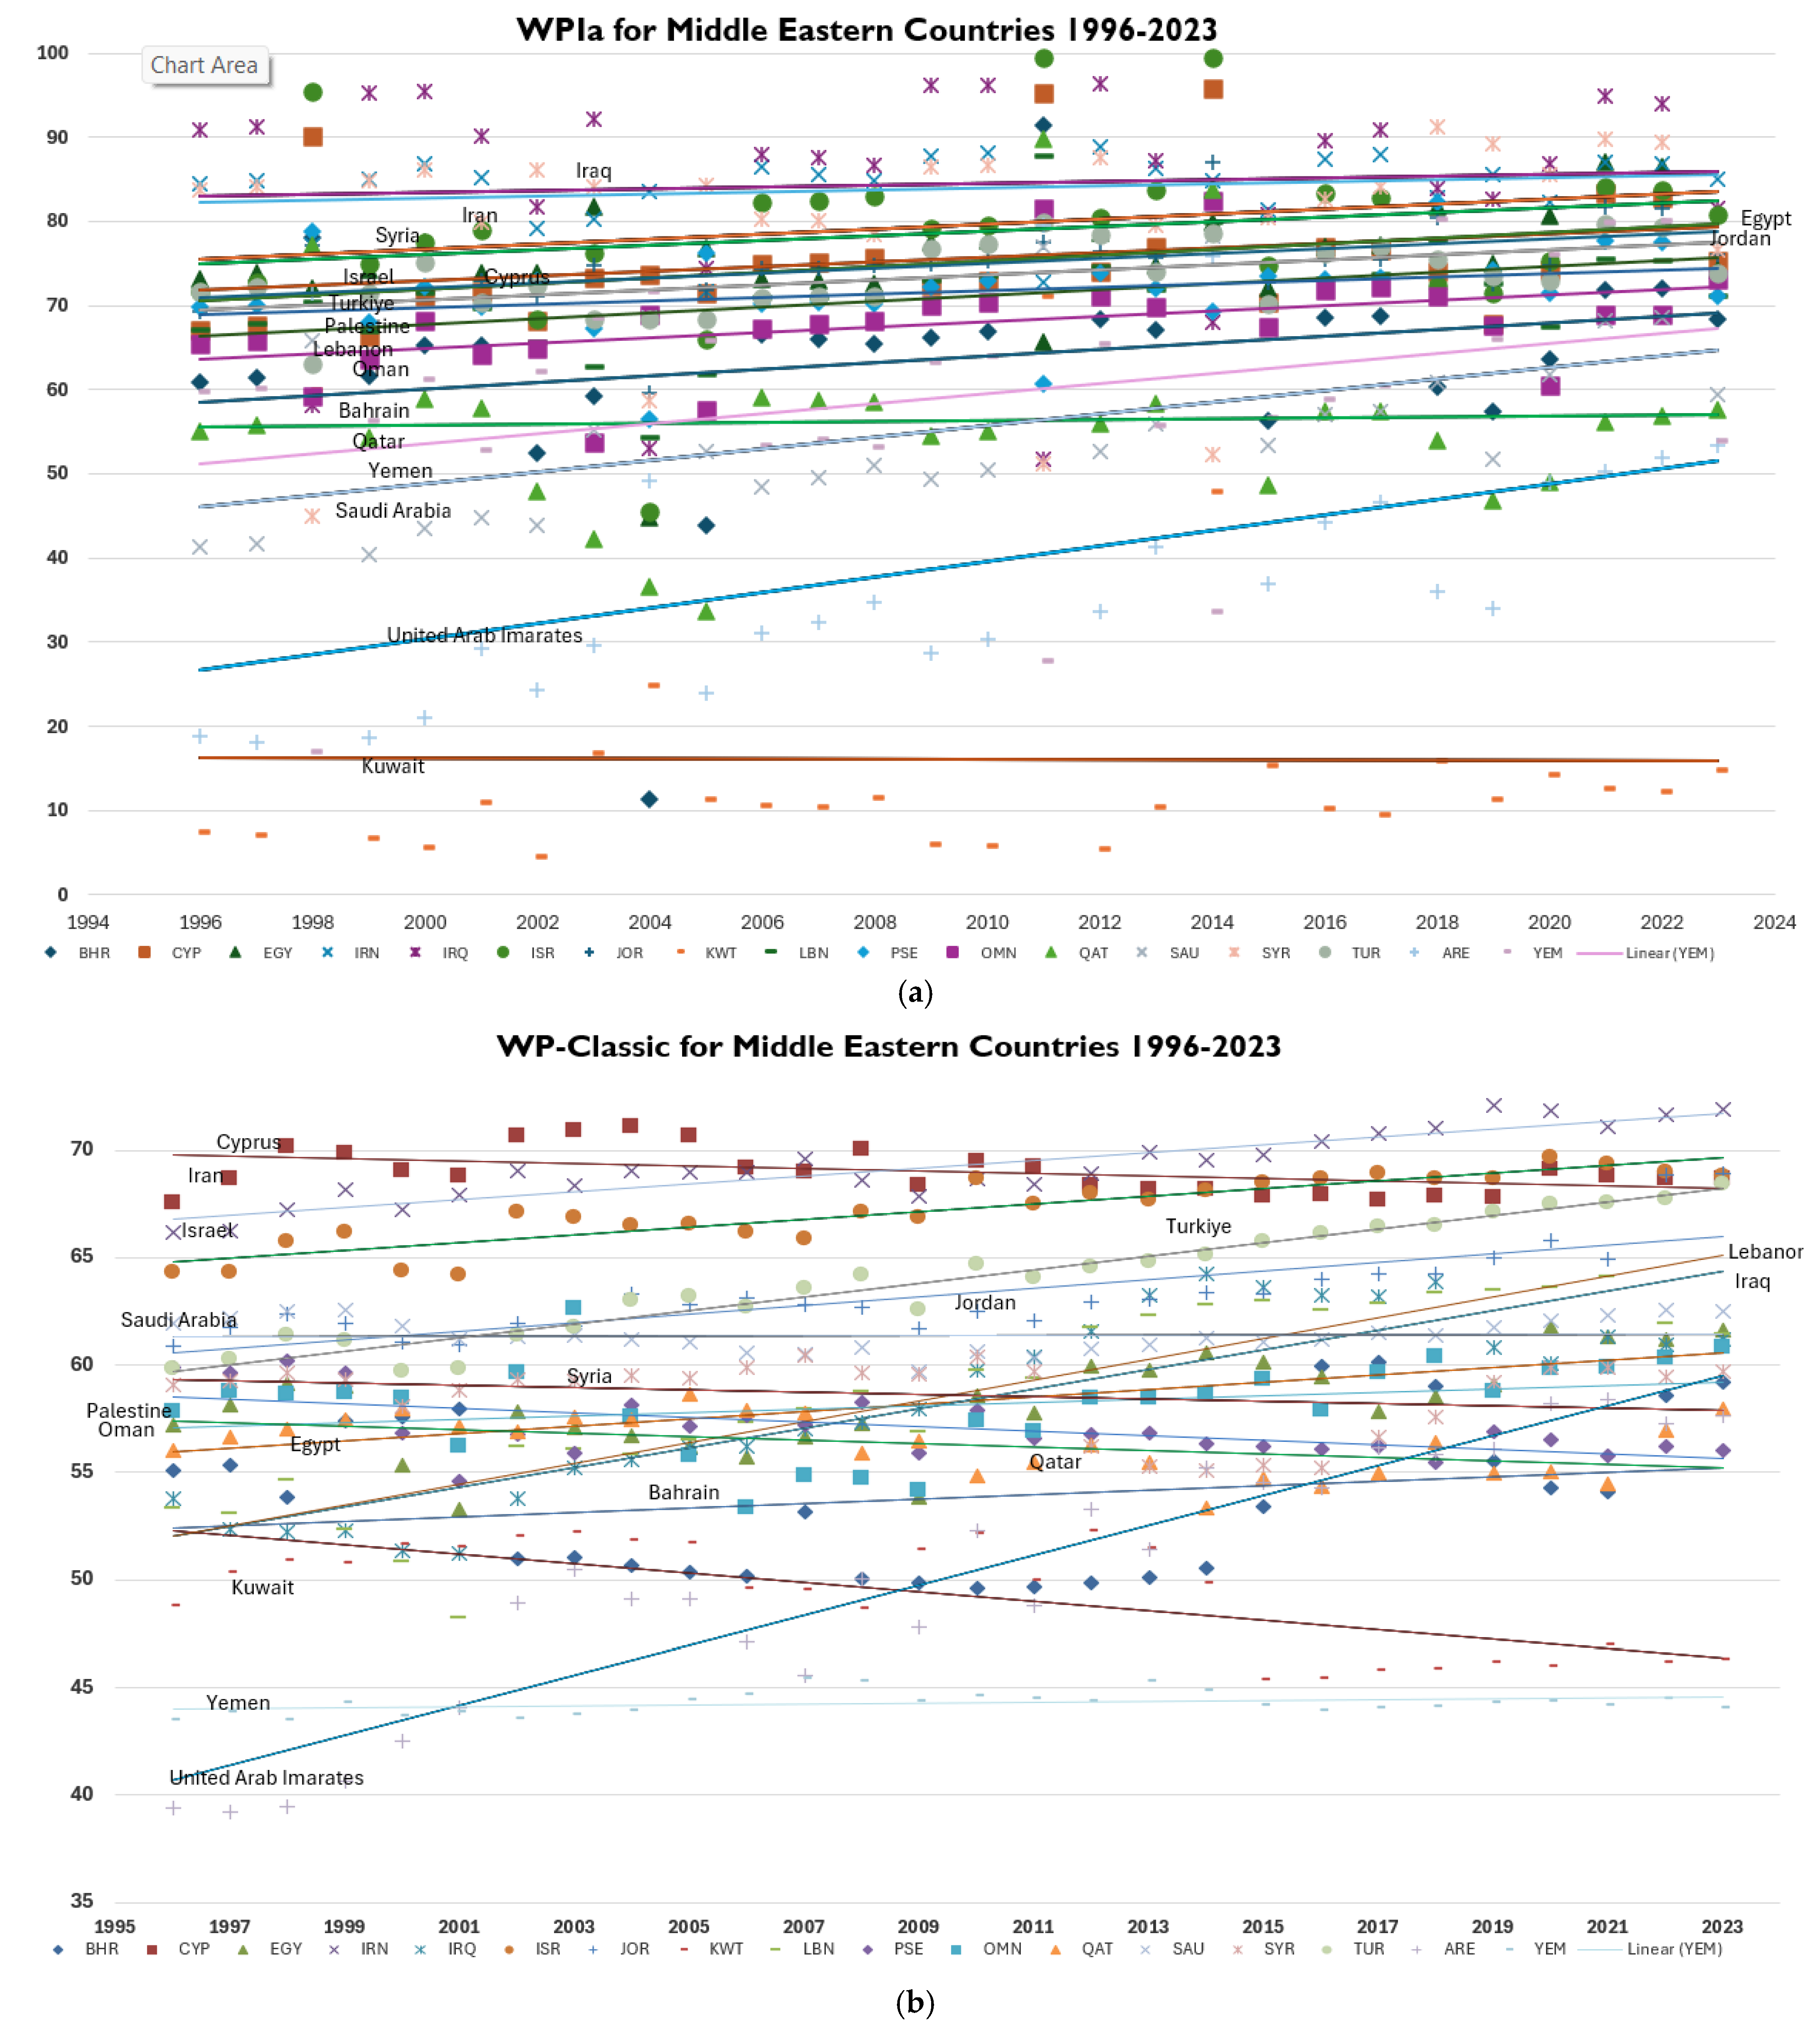
Figure 2 shows the WPI longitudinal graph using classical, arithmetic, and geometric methods. It can be noticed that the highest WPI values were recorded in WPIa and WPIg, indicating that some countries have even better performance than what was reported using the classical method. Shares of 15, 14, and 12 countries out of the 17 showed improvement in their WPIcl, WPIa, and WPIg, respectively. The highest improvement was found in United Arab Emirates in the three methods (18.23–34.45), while the highest deterioration was found in Iraq, Syria, and Yemen in WPIa and WPIg. The three countries are classified to the “Alert” category of FSI. On the other hand, Palestine and Kuwait deteriorated the most according to WPIcl. The improvement in WPI revealed in most of the countries, despite the deterioration in Access and Resources, is attributed to the improvement in the other components, mainly Environment, which was found to have the highest weight according to the PCA method. When weighted average WPI (based on population sizes) was calculated for the Middle East for the years 1996-2023, as a block, WPI was found to be at an average of 61.0, 73.9 and 69.3 for WPIcl, WPIa and WPIg, respectively. Accordingly, the Middle East showed tangible improvement in WPI by 4.1, 9.2, and 10.3 for WPIcl, WPIa and WPIg, respectively.
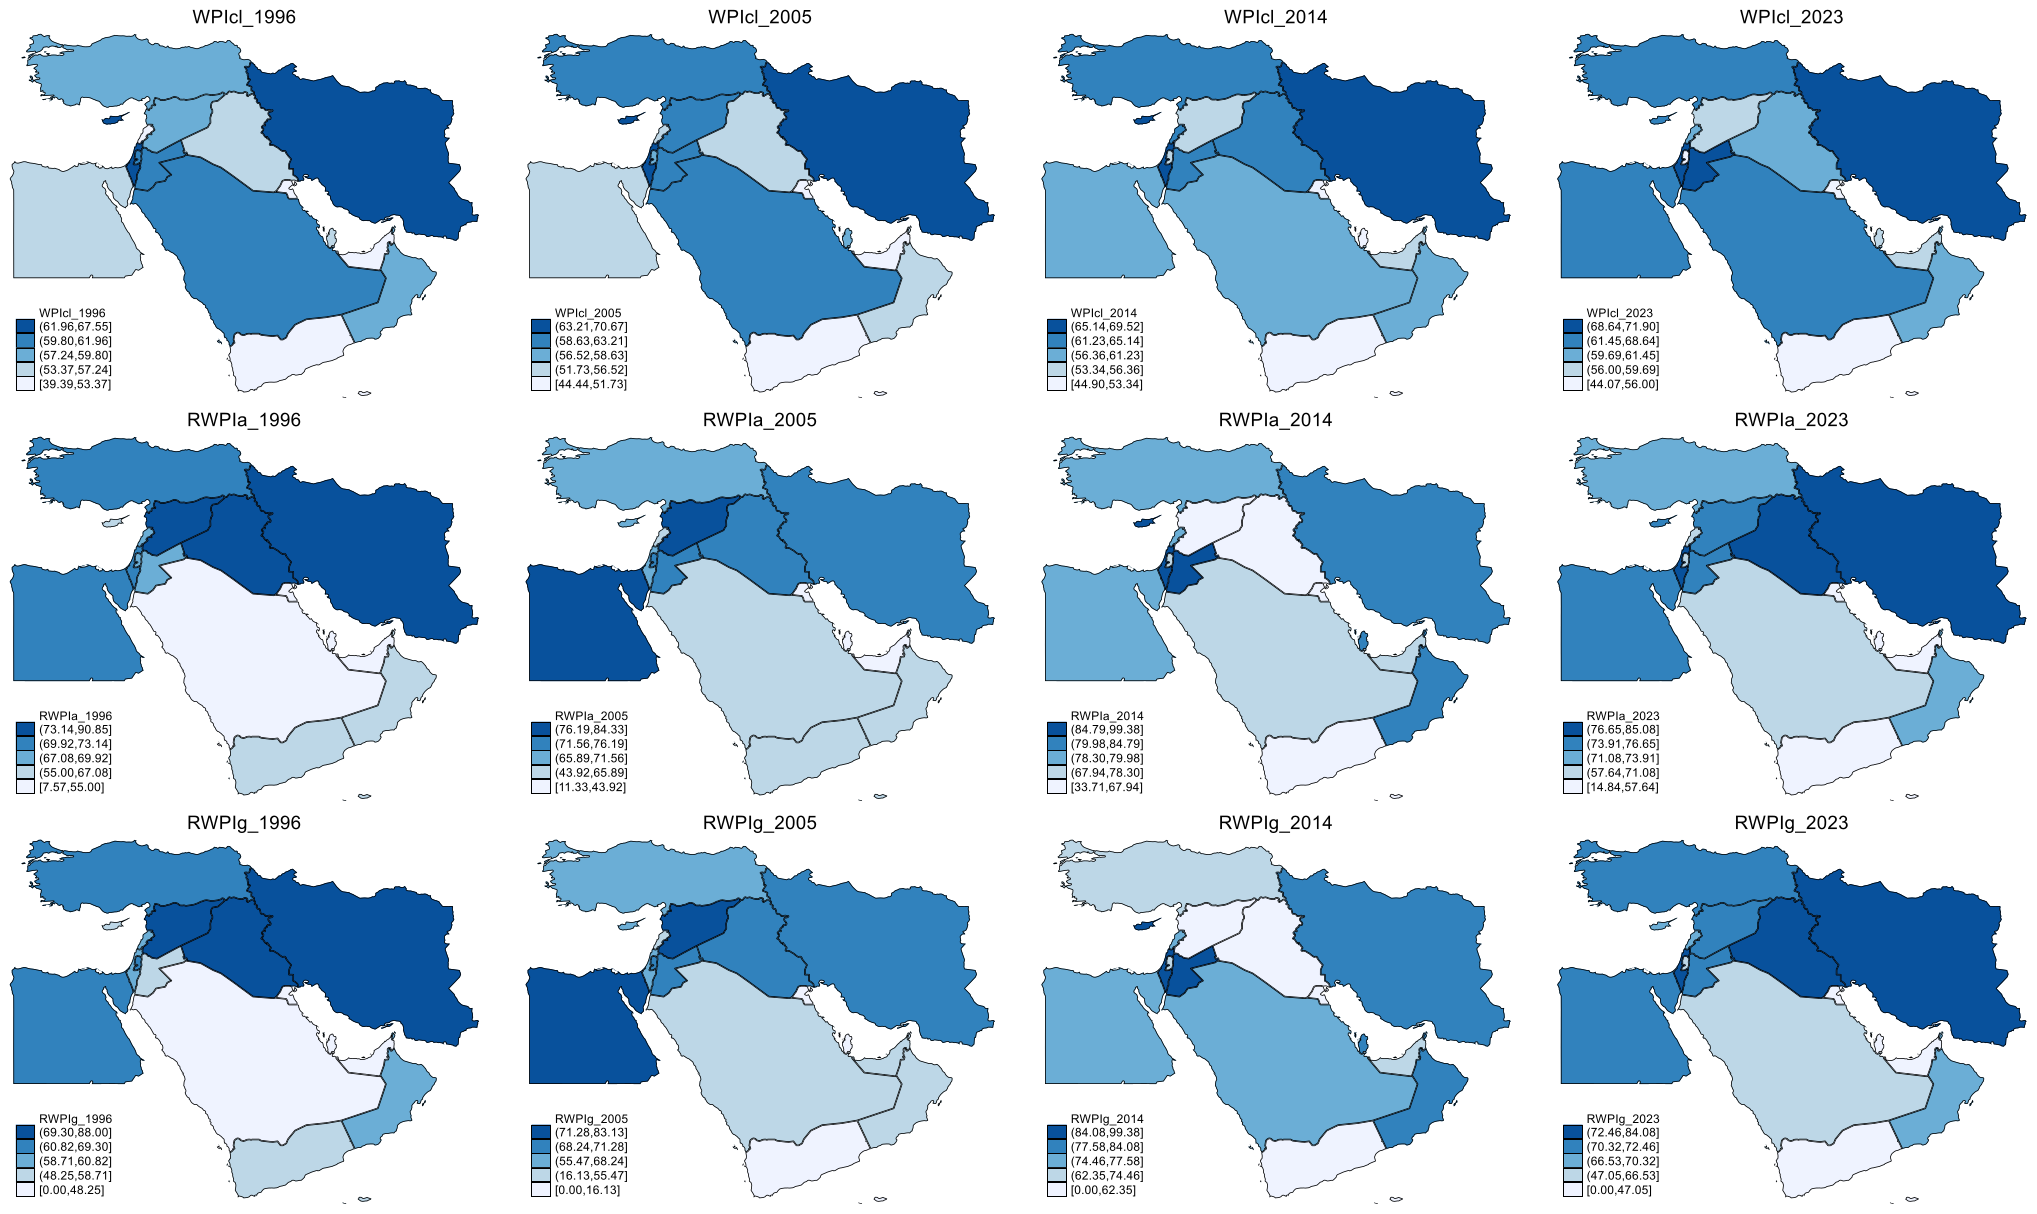
To illustrate the variance among the three methods and the longitudinal change in the values across the testing period, the maps below in Figure 3 were developed for four years evenly distributed across the testing period.
Yemen, UAE, and Kuwait consistently showed low WPI values for the year 2023 for the three versions of WPI. The low WPI values resulted mainly from the low score of the Environment component for Kuwait and UAE, and extremely low Capacity in Yemen (refer to Figure 1). The low capacity of Yemen is linked to a high level of fragility, which is inversely related to HDI, and hence to WPI [13,14,17,25].
The country ranking in this study aligns with [3] for most Middle Eastern countries, except for Israel, which was ranked lower than what is reported in this study for the same year and for the whole study period. Likewise, the ranking reported is in full alignment with [46], except for Iraq, which was ranked at the lowest quartile compared with the highest quartile according to this study. However, alignment was found for all the remaining countries.

3.2. Correlation Analysis Among Key Indices

The correlations among the three versions of WPI with HDI and FSI were calculated and are depicted in Table 3. None of the Middle Eastern countries is sustainable according to the FSI scale. On the contrary, seven countries showed deterioration in FSI. The correlations among the three versions of WPI for the whole period are significant. However, no significance was revealed between the three versions of WPI, with average values of HDI as well as FSI. This was also true for the correlation between average values of FSI and HDI. Therefore, in order to avoid the masking effect of the prolonged testing period, given that the current study covers the longitudinal temporal dimension from 1996 to 2023, which never included this [15], the statistical test was applied on shorter intervals of 5 years, and it was found that HDI and FSI were consistently inversely correlated with significance. In addition, the three versions of WPI were found to be significantly and strongly correlated. However, no clear significance was found between HDI and the three versions of WPI even at shorter intervals. This could be attributed to spatial masking, which will be tested below (refer to Table S6 for more details). Despite that, this result does not align with the results of previous literature that showed significant cross-sectional correlation between WPI and HDI (e.g., [7]). When the analysis was made at country level, 11 countries showed a significant and/or positive (but statistically insignificant) correlation with WPIcl (Table S7). Although there should be a natural significant correlation between WPI and HDI, given the link between WPI, health, and income [25,39], in some countries other contextual variables could hamper the significance level. For example, the influence of external shocks such as wars could significantly affect access to water, education, and deterioration in the health situation. For example, Syria’s HDI drop after 2011 was partly driven by conflict-related mortality and school closures, but water systems had been deteriorating earlier.
As shown in Table S7, when the above analysis was conducted at country level, HDI was found to be consistently inversely correlated with WPIa and WPIg, while values varied between proportional and inverse correlation with WPIcl. HDI and FSI were found to be consistently inversely correlated for 12 out of the 17 countries. This indicates that fragility was a key driver that hampered human development despite the level of capacity. Regarding the correlation with FSI, it was found that there is no specific trend in correlation, as the relations were found to vary from proportional to inverse and an insignificant correlation with WPIcl, WPIa, and WPIg. This suggests that the way WPI is measured is not the main determinant of fragility in the context of Middle Eastern countries, yet WPIcl performed better than the other two versions. A similar result was found after using the regression analyses in Section 3.3.

3.3. Correlations Between HDI, FSI, and WPI Components

As shown in Tables S8 and S9, when correlations among the average values of the indices and the components using classical and PCA methods were calculated, average Access and average Capacity were found to be significantly correlated with HDI in both methods. However, none of the indices and their components were found to be significantly correlated to FSI. On the other hand, the regression analysis revealed that average FSI and HDI are inversely correlated. All models combining the various versions of WPI, FSI, and HDI are significantly correlated according to ANOVA testing. The only WPI version that showed a significant correlation with FSI is WPIcl. Therefore, by combining the results here with the results reported in Section 3.2, it can be concluded that when fragility is concerned, the three versions of WPI are suitable, but WPIcl provides the best fit (refer to Table S18).

3.3.1. Correlation Analysis for HDI and FSI with Components Calculated Using Classical Method

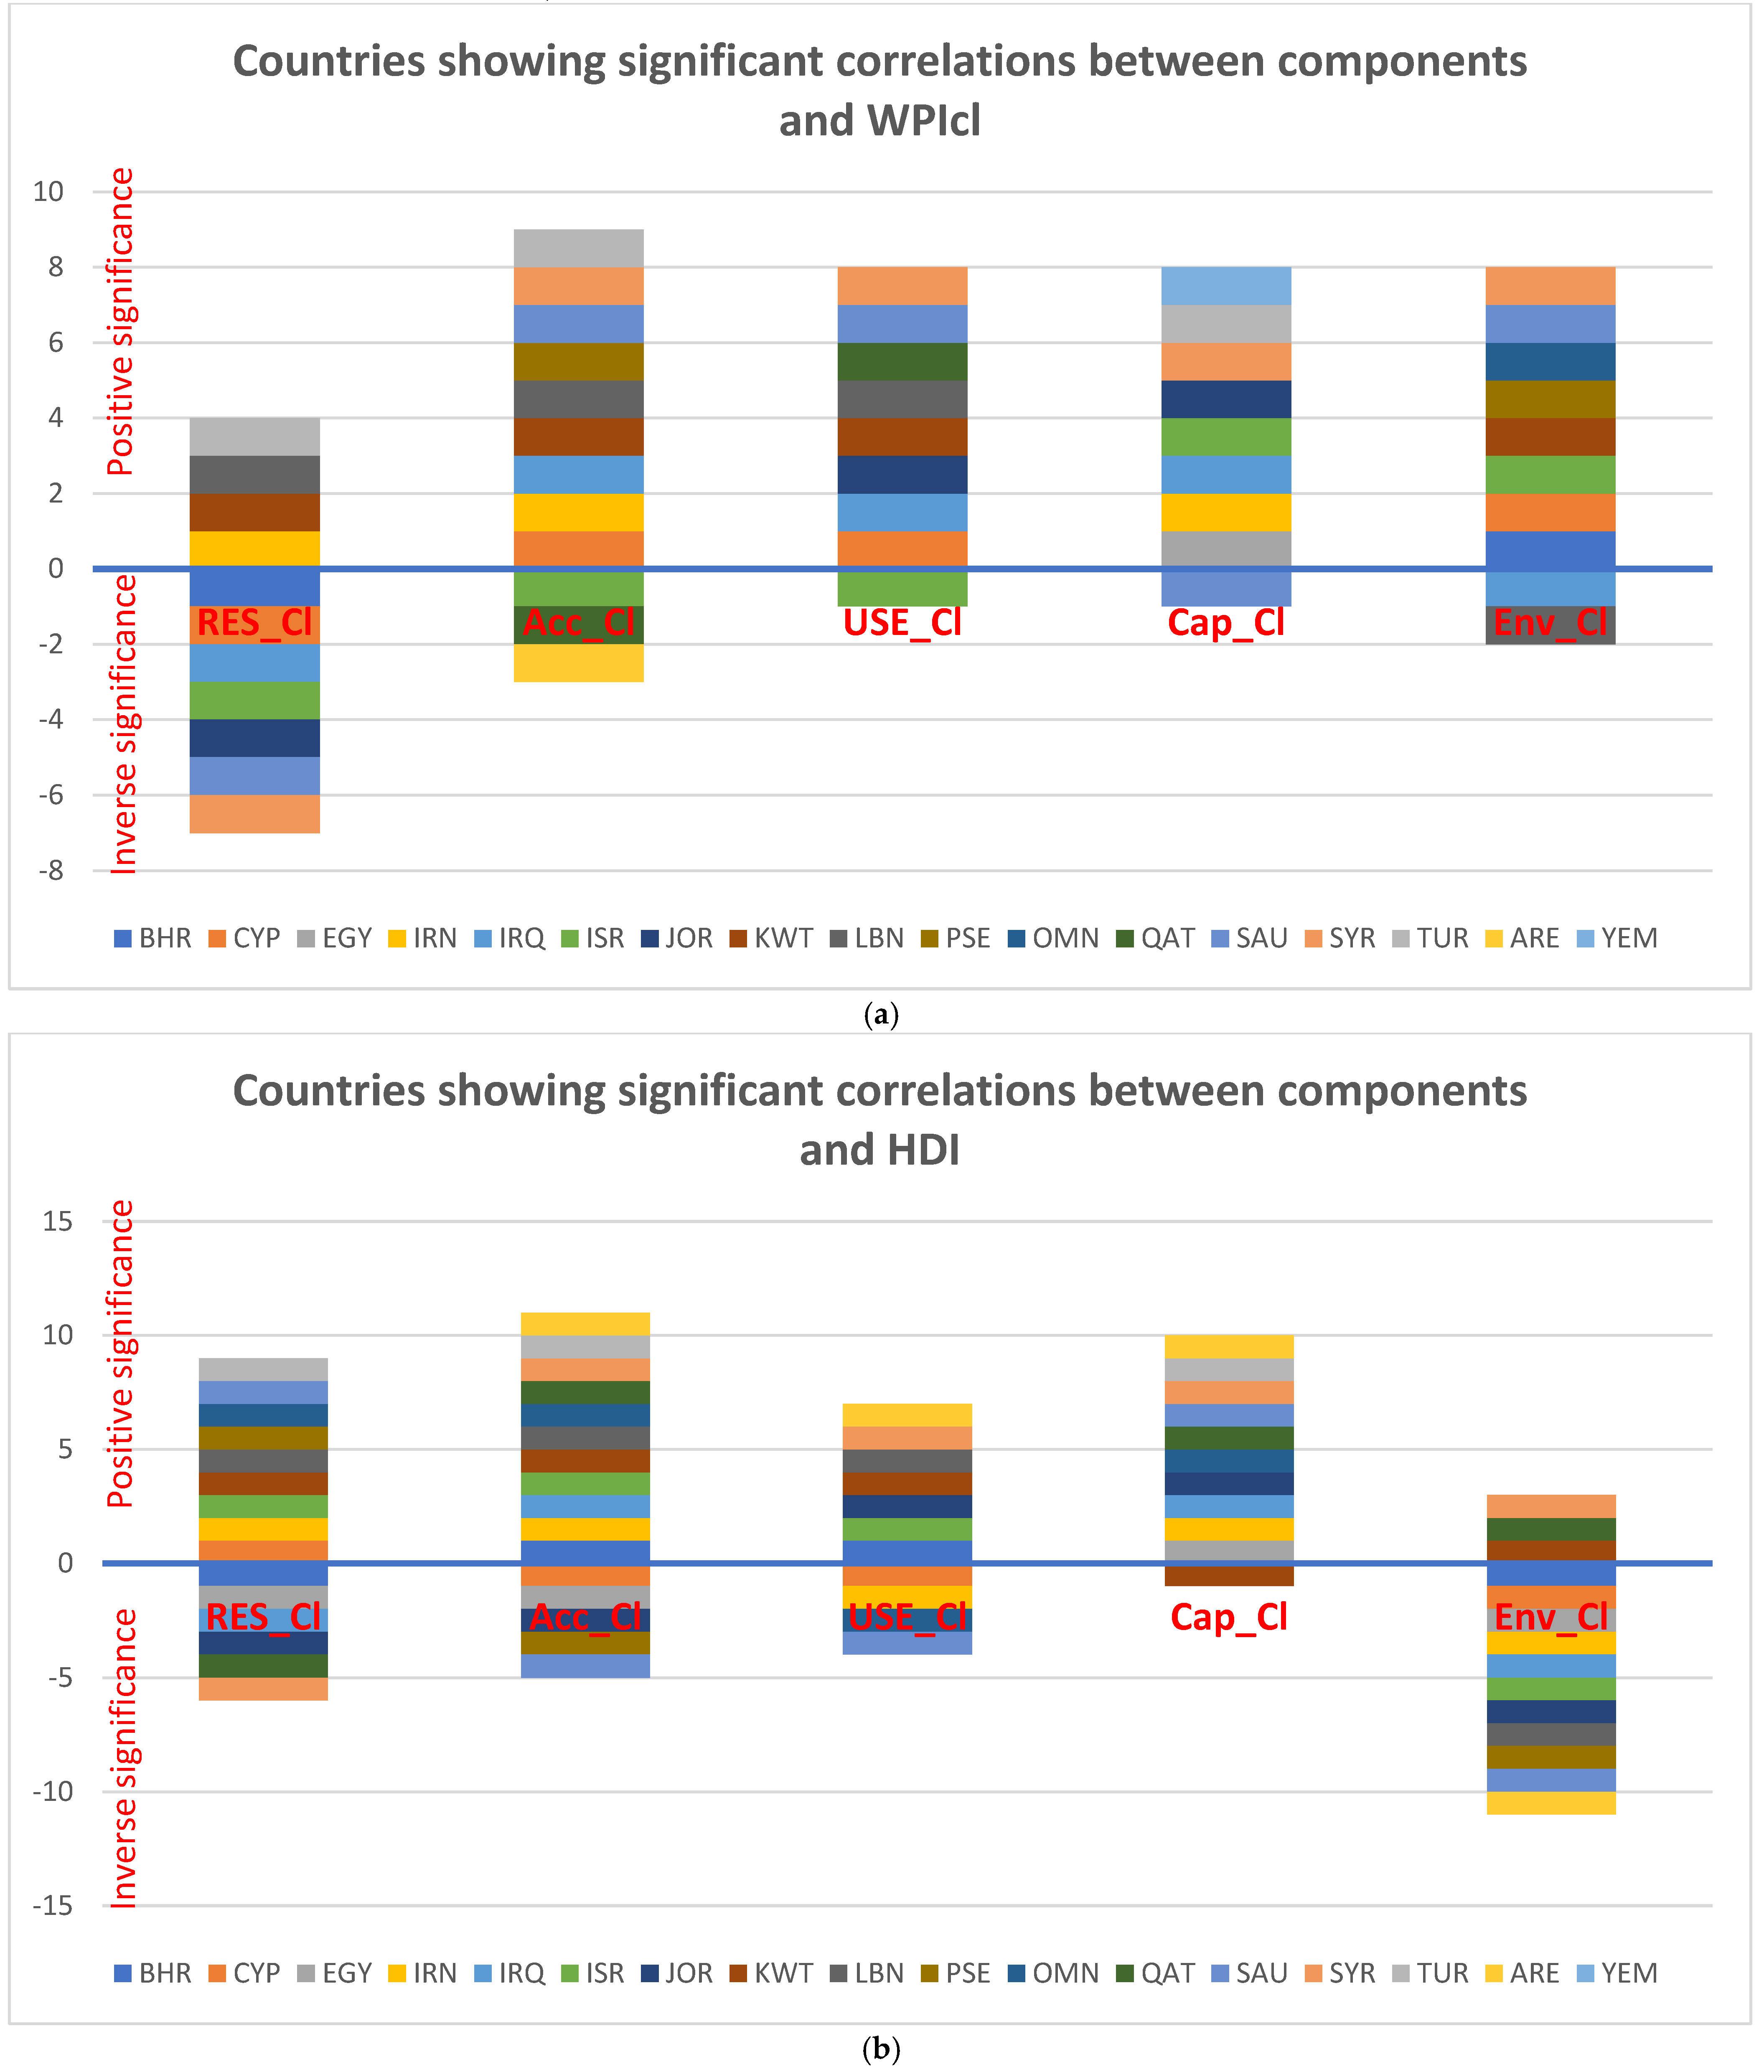
Overall, the number of significant correlations among the five components and WPIcl, FSI, and HDI is found to be much higher when using the improved method than using PCA (see Figure 4). Eleven countries showed a proportional significance between WPIcl and Access. Resources showed an inverse correlation with WPIcl in seven countries. Regarding HDI, a robust correlation was found between the components of WPIcl and HDI. Access was significantly correlated with HDI in 16 countries, then followed by Capacity. However, FSI showed a significant correlation in Environment in the largest number of countries, followed by Access. However, significance was divided between proportional and inverse. The correlation analysis results are in line with the sensitivity results using regression analysis. However, these results are based on analysis applied to the average values of these variables for all years. Therefore, in order to eliminate possibilities of temporal masking, analysis of shorter periods is necessary (refer to Tables S10 and S11).

3.3.2. Correlations Among HDI, FSI, and WPI Components Calculated Using PCA

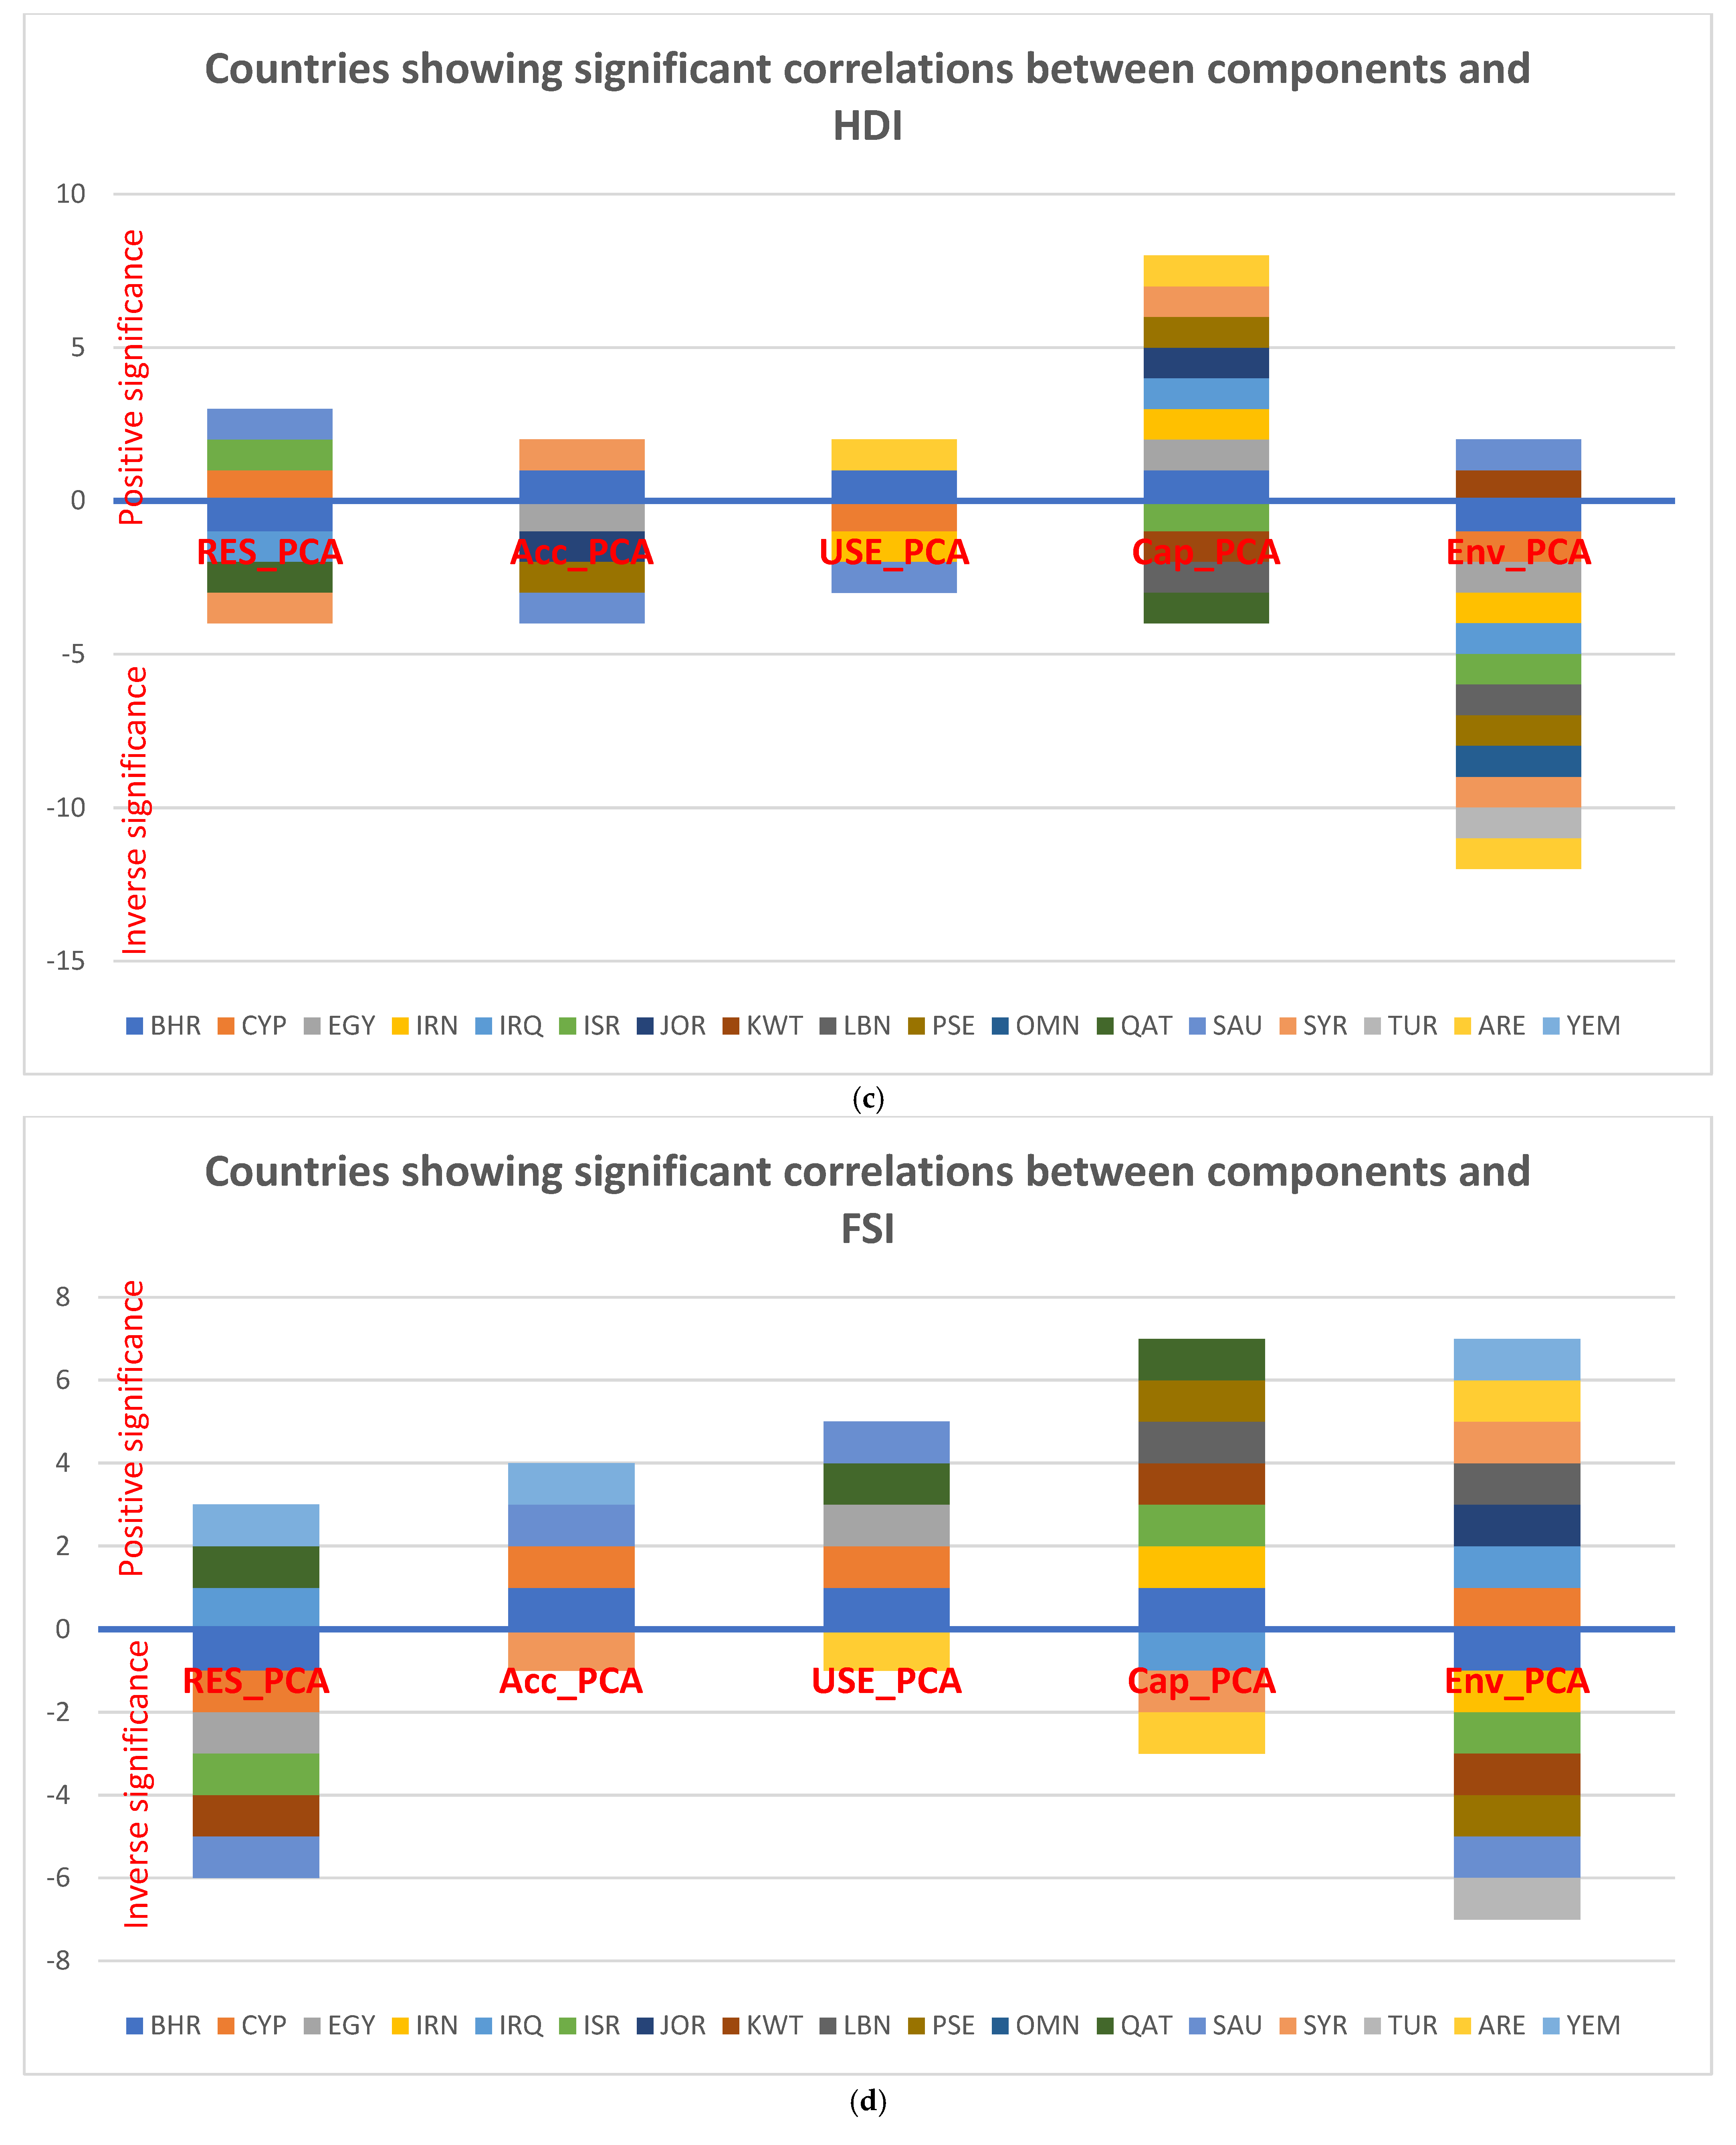
A significance influence of “Access” and “Environment” on WPIa and WPIg, respectively, is found in the majority of countries (Figure 5). Resources components do not have a significant correlation with WPI in most of the countries. Yet, “Capacity” showed a significant correlation with HDI and FSI in seven to eight countries. Nevertheless, an inverse significant correlation is found in 14 countries between the “Environment” component and HDI. Likewise, it has significant correlation with FSI in 14 countries with various FSI categories. The latter significance is mixed between proportional and inverse. This suggests that the correlations between Environment and both FSI and HDI are country specific, and generalizing at a higher spatial scale could lead to masking (refer to Tables S12 and S13).
Applying these results to boost WPI and HDI in the Middle Eastern countries required country-specific measures and actions. Countries with a least a level in Access like that of Yemen and Syria need to advance their water and sanitation infrastructure to realize a significant boost. Likewise, countries with low scores in Capacity, such as Iraq, Syria, and Yemen, are advised to prioritize education, health, and socio-economic development. Regarding the Environmental component, regulating fertilizer consumption, pesticide usage, and promotion of green practices and enhancing biodiversity are advisable to boost WPI and, therefore, HDI. Countries with a low Resources score should prioritize interventions that would increase the quantity of resources in a sustainable manner, such as the usage of seawater desalination using solar or wind energy. Similar recommendations are found in similar studies that assessed Middle Eastern countries. In Jordan and Tunisia, references [10,12] concluded that boosting WPI required strengthening water resource management, public awareness in education, policy reforms, and socio-economic development. The authors suggested also taking necessary measures to prevent ground water pollution by industrial wastewater, adopting green agricultural practices, and enforcing environmental quality monitoring systems.

3.4. Sensitivity Analysis

3.4.1. Sensitivity Analysis of HDI for WPI Components Calculated Using Classical Method

Linear regression was applied between HDI as the dependent variable and the components of WPI using classical and PCA methods, as predictors. As a result, the value of HDI can be predicted using the formula below:
H D I = B 1 × A c c e s s + B 2 × C a p a c i t y + B 3 × E n v i r o n m e n t + B 4 × R e s o u r c e s + B 5 × U s e + C o n s t a n t
The results of regression analysis for HDI sensitivity to the components of WPIcl revealed that all countries’ models were found to have statistical significance, meaning the WPIcl components are likely to have a statistically significant relationship with HDI. Capacity and Access were found to have a significant correlation with the largest number of countries (10 and 8 out of 17, respectively). On the contrary, the Resources component was found to have an inverse correlation with the largest number of countries (8 out of 17). This result indicated that Capacity and Access had the highest influence over HDI in the testing period regardless of the level of fragility of the tested countries. This result aligns with the conclusion reported by [26,51], where countries with higher Capacity (adaptive capacity) can move a country from being water-stressed to water-sufficient. On the other hand, Resources, which is the main factor in traditional water scarcity measurement methods, was found to have a fluctuating correlation with HDI (refer to Table S14).
The results of regression analysis for HDI sensitivity to WPI components using the PCA approach revealed significance in 15 out of 17 countries (the exceptions are Cyprus and Yemen). Environment showed significance with HDI in 12 out of 17 countries. Capacity is ranked as the second most influential component. Therefore, it could be concluded that, despite average WPIa and WPIg being inversely correlated to HDI, Capacity and Environment had the highest proportional effect on HDI. This indicates that strategizing investment in those two components can amplify progress in WPI and HDI in the Middle East context. In other words, the classical and PCA methods showed that Capacity, Environment, and Access are the components that can most effectively boost HDI (refer to Table S15).

3.4.2. Sensitivity Analysis of FSI for WPI Components Calculated Using Classical Method

Linear regression was applied between FSI as the dependent variable and the WPIcl components. The models of 15 out of 17 countries showed significance (the exceptions are Israel and Palestine). The Resources component was found among the highest number of countries to have significance (9 out of 17 countries), which can indicate a linkage between water resources and fragility (e.g., in Egypt and Iraq, where water was one of the causes of conflict [13]) or a factor of decreasing fragility (e.g., Bahrain, Cyprus and Iran). Capacity was found in the highest number of countries with inverse significance. Regarding the PCA-based WPI components, 13 countries showed significant models. Environment showed proportional and inverse significance in six and five countries, respectively. This confirms the result that the improvement in the Environment component was accompanied by an increase in HDI and decrease in FSI. In conclusion, FSI was found to be most inversely sensitive to Capacity and Environment.

3.5. Linkages with Sustainable Development Goals

The results of this study linked strongly to Sustainable Development Goal (SDG) number 6: Clean Water and Sanitation. However, given that SDG 6 gives equal weight to all targets beneath it, this study helps in the prioritization of areas of intervention needed to alleviate water poverty and progress towards SDG 6. Therefore, in light of this study, the following SDG targets needs to 31be prioritized in the Middle East:
  • Target 6.1: Universal and equitable access to safe and affordable drinking water, where “Access” is a crucial factor in water poverty, reinforcing the need for policies that improve water availability in fragile states.
  • Targets 6.3 and 6.6: Improve water quality, wastewater treatment, and safe reuse, and protect and restore water-related ecosystems, where the “Environment” component of WPI aligns with the need to protect water resources, minimize pollution, preserve ecosystems, and ensure environmental sustainability.
  • Target 6.4: Increase water-use efficiency and ensure sustainable withdrawals, where this target covers “Resources” and “Capacity” as key components of water security. This study supports efforts to develop infrastructure for sustainable management.
In addition, this research addresses the intersection between water security, human development, and state fragility, which is critical for SDG 6 implementation in unstable regions. The identification of Capacity and Environment as key drivers of development aligns with the SDG’s emphasis on infrastructure investments, institutional strengthening, and ecosystem protection. Moreover, some of the recommendations—such as prioritizing investments in water infrastructure, adopting finer spatial analyses, and tailoring interventions to local conditions—are directly applicable to SDG 6 strategies, particularly in water-stressed and conflict-affected regions. Applying these recommendations is applicable to the SDG 6 targets.

4. Conclusions

Longitudinal analysis is providing a step forward in WPI analysis, by providing a new dimension of trends analysis that helps decision-makers measure the effectiveness of measurements and policies taken in proper comprehensive management of water resources. Likewise, longitudinal analyses of HDI and FSI were found to be promising for analyzing trends, helping decision-makers in prioritization, and analyzing impacts of changes in context, including changes in FSI. Despite the extremely limited natural water resources in the Gulf countries, high Capacity and Access put them at a higher WPI level. The longitudinal analysis for Middle East, as one block, showed a trend toward a slight increase in WPI, indicating that the region is progressing towards improved WPI despite the increase in population size. Likewise, the longitudinal analysis of most of the tested countries showed improved WPI over the testing period. However, decline is observed in Iraq, Syria, Kuwait, Palestine, Qatar, and Yemen. The three tested WPI versions showed similar Capacity in the fragile context, but WPIcl was statistically more suitable when fragility is factored in. Environment, Capacity, and Access were found to have the highest influence over WPI. WPIa and WPIg were found to be mostly boosted by the Environment component. In this component, Gulf states, especially, UAE, Bahrain, and Kuwait, are among the lowest, suggesting the potential for further improvement if Environment-related intervention was considered. In these countries, seawater desalination and wastewater treatment and reuse for agricultural purposes are expected to have a promising impact.
Although the Middle East-level average HDI did not show a significant correlation with average WPI, for individual countries, 11 out of 17 showed a positive/significant correlation between WPIcl and HDI. In addition, Capacity seems to be the most influential sector for boosting HDI and inhibiting the impact of fragility. Therefore, prioritizing investment in these sectors is expected to have the highest impact on HDI. This study provides empirical evidence and policy insights that can inform SDG 6 implementation, especially in fragile Middle Eastern states, by demonstrating how improved water access, capacity building, and environmental sustainability enhance human development and stability. For future research, it is recommended to conduct more in-depth assessments, with smaller temporal and spatial scales. This will help validate results and tailor interventions relevant to local scales.

Supplementary Materials

The following supporting information can be downloaded at: https://www.mdpi.com/article/10.3390/w17192871/s1, Supplementary Materials are 18 tables show the database that was analyzed to get the results in addition to extra detailed data that is expected to be useful for interested researchers who are willing to build on this research’s results. The tables are according to the below list: Table S1: the weights of subcomponents using the = PCA analysis based on Proportion cumulative >70%. Table S2: The PCA weights for the five components after normalization. Table S3: the values of WPI for the testing period from 1996 to 2023 using the classical, arithmetic and geometric methods for the 17 countries composing Middle east. Table S4: The average value of each component for every country using classical method. Table S5: The average value of each component over the period from 1996 to 2023 according to arithmetic and geometric methods. Table S6: correlations and significance between WPI versions and HDI as well as FSI. Table S7: Correlations and their significance among FSI/HDI with the three versions of WPI. Table S8: Matrix of correlations and their significance levels between the classical WPI and its components with HDI and FSI. Table S9: Matrix of correlations and their significance levels between WPIa and WPIg and their components with HDI and FSI. Table S10: List of countries showed significant correlations between components according to classical approach and WPIcl, HDI and FSI. Table S11: summary of countries showed significant correlations between the five WPI components and WPIcl, HDI and FSI. Table S12: List of countries showed significant correlations between components according to PCA approach and WPIa, WPIg, HDI and FSI. Table S13: summary of countries showed significant correlations between the five WPI components using the improved method and WPIa, WPIg, HDI and FSI. Table S14: The main results of regression analysis for HDI with WPI components calculated using the classical method. Table S15: The main results of regression analysis for HDI with WPI components calculated using the PCA method. Table S16: The main results of regression analysis for FSI with WPI components calculated using the classical method. Table S17: The main results of regression analysis for FSI with WPI components calculated using the improved method. Table S18: Regressions analysis for HDI as dependent variable with WPI and FSI as independent variable; and FSI as dependent variable with WPI and HDI as independent variables. Green colors indicate proportional significance while red colors indicate inverse significance.

Author Contributions

Conceptualization, A.I. and H.J.; methodology, A.I., J.M.M.-A., H.J. and N.M.; software, H.J. and A.I.; validation, J.M.M.-A., H.J. and N.M.; formal analysis, A.I. and H.J., investigation, A.I., H.J., N.M. and J.M.M.-A.; resources, A.I. and H.J.; data curation, A.I. and H.J.; writing—original draft preparation, A.I.; writing—review and editing, J.M.M.-A., H.J. and N.M.; visualization, A.I. and H.J., supervision, J.M.M.-A., H.J. and N.M.; project administration, A.I. and J.M.M.-A. All authors have read and agreed to the published version of the manuscript.

Funding

This research received no external funding.

Data Availability Statement

The original contributions presented in this study are included in the article. Further inquiries can be directed to the corresponding author.

Conflicts of Interest

The authors declare no conflicts of interest.

References

  1. Gine, G.; Pirez-Foguet, A. Improved Method to Calculate a Water Poverty Index at Local Scale. J. Environ. Eng. 2010, 136, 1287–1298. [Google Scholar] [CrossRef]
  2. Gine, R.; Foguet, A. The Water Poverty Index: Assessing Water Scarcity at Different Scales. In Proceedings of the 2nd Congrés UPC Sostenible 2015, Barcelona, Spain, 2015; Grup de Recerca en Cooperació i Desenvolupament Humà Universitat Politècnica de Catalunya: Barcelona, Spain, 2015. [Google Scholar]
  3. Lawrence, P.; Meig, J.; Sullivan, C. The Water Poverty Index: An International Comparison. In Keele Economic Research Papers; Keele University, Department of Economics: Keele, UK, 2002; ISSN 1352-8955. [Google Scholar]
  4. Sullivan, C.; Meigh, J.; Giacomello, A.; Fediw, T.; Lawrence, P.; Samad, M.; Mlote, S.; Hutton, C.; Allan, J.; Schulze, R.; et al. The Water Poverty Index: Development and application at the community scale. Nat. Resour. Forum 2003, 27, 189–199. [Google Scholar] [CrossRef]
  5. Sullivan, C.A.; Vörösmarty, C.J.; Craswell, E.; Bunn, S.; Cline, S.; Heidecke, C.; Storeygard, A.; Proussevitch, A.; Douglas, E.; Bossio, D.; et al. Mapping the Links Between Water, Poverty and Food Security; GWSP Issues in GWS Research, No.1; Global Water System Project (GWSP) International Project Office (IPO): Bonn, Germany; Wallingford, UK, 2006. [Google Scholar]
  6. Alamarah-Tamimi, A.R.; Isayed, A.A.; Mughli, M.A. Using Socio-Economic Indicators for Integrated Water Resources Management: Case Study of Palestine. In Water Resources in the Middle East; Shuval, H., Dweik, H., Eds.; Springer: Berlin/Heidelberg, Germany, 2007; Volume 2. [Google Scholar] [CrossRef]
  7. Fenwick, C. Identifying the Water Poor: An Indicator Approach to Assessing Water Poverty in Rural Mexico. Ph.D. Thesis, The Department of Civil, Environmental and Geomatic Engineering, University College London, London, UK, 2010. [Google Scholar]
  8. Pérez-Foguet, A.; Giné Garriga, R. Analyzing water poverty in basins. Water Resour. Manag. 2011, 25, 3595–3612. [Google Scholar] [CrossRef]
  9. Ladi, T.; Mahmoudpour, A.; Sharif, A. Assessing impacts of the water poverty index components on the human development index in Iran. Habitat Int. 2021, 113, 102375. [Google Scholar] [CrossRef]
  10. Alqatarneh, G.; Al-Zboon, K. Water Poverty Index: A Tool for Water Resources Management in Jordan. Water Air Soil Pollut. 2022, 233, 461. [Google Scholar] [CrossRef]
  11. Gaswami, T.; Ghosal, S. Domestic water poverty in a semi-arid district of eastern India: Multiple dimensions, regional pattern, and association with human development. Environ. Dev. 2022, 44, 100742. [Google Scholar] [CrossRef]
  12. Jemmali, H.; Matoussi, M. A multidimensional analysis of water poverty at local scale: Application of improved water poverty index for Tunisia. Water Policy 2013, 15, 98–115. [Google Scholar] [CrossRef]
  13. Jemmali, H.; Sullivan, C. Multidimensional Analysis of Water Poverty in MENA Region: An Empirical Comparison with Physical Indicators. Soc. Indic. Res. 2014, 115, 253–277. [Google Scholar] [CrossRef]
  14. Carment, D.; Samy, Y. Aid Effectiveness in Fragile and Conflict-Affected Contexts: Lessons from More Than Two Decades of Research; United Nations for Development Economics Research: Helsinki, Finland, 2023. [Google Scholar]
  15. Isayed, A.; Menendez-Aguado, J.M.; Jemmali, H.; Mahmoud, N. Water Poverty Index over the Past Two Decades: A Comprehensive Review and Future Prospects—The Middle East as a Case Study. Water 2024, 16, 2250. [Google Scholar] [CrossRef]
  16. Sullivan, C. Calculating a water poverty index. World Dev. 2002, 30, 1195–1210. [Google Scholar] [CrossRef]
  17. Jemmali, H. Water Poverty in Africa: A Review and Synthesis of Issues, Potentials, and Policy Implications. Soc. Indic. Res. 2016, 136, 335–358. [Google Scholar] [CrossRef]
  18. Ferriera, I.A. Measuring state fragility: A review of the theoretical groundings of existing approaches. Third World Q. 2016, 38, 1291–1309. [Google Scholar] [CrossRef]
  19. Juran, L.; MacDonald, M.C.; Basu, N.B.; Hubbard, S.; Rajagopal, R.; Rajagopalan, P.; Philip, L. Development and application of a multi-scalar, participant-driven water poverty index in post-tsunami India. Int. J. Water Resour. Dev. 2016, 33, 955–975. [Google Scholar] [CrossRef]
  20. Jaren, L.S.; Mondal, M.S. Assessing Water Poverty of Livelihood Groups in Peri-Urban Areas around Dhaka under a Changing Environment. Water 2021, 13, 2674. [Google Scholar] [CrossRef]
  21. Prince, B.; Juran, L.; Sridhar, V.; Bukvic, A.; MacDonald, M. A statistical and spatial analysis of water poverty using a modified Water Poverty Index. Int. J. Water Resour. Dev. 2020, 37, 339–356. [Google Scholar] [CrossRef]
  22. Sullivan, C. The Potential for Calculating a Meaningful Water Poverty Index. Water Int. 2001, 26, 471–480. [Google Scholar] [CrossRef]
  23. Forouzani, M.; Karami, E. Agricultural water poverty index and sustainability. Agron. Sustain. Dev. 2011, 31, 415–432. [Google Scholar] [CrossRef]
  24. Kini, J. Inclusive water poverty index: A holistic approach for helping local water and sanitation services planning. Water Policy 2017, 19, 758–772. [Google Scholar] [CrossRef]
  25. Hailu, R.; Tolossa, D.; Alemu, G. Household Water Security Index: Development and Application in the Awash Basin of Ethiopia. Int. J. River Basin Manag. 2020, 20, 185–201. [Google Scholar] [CrossRef]
  26. Feitelson, E.; Chenoweth, J. Water poverty: Towards a meaningful indicator. Water Policy 2002, 4, 263–281. [Google Scholar] [CrossRef]
  27. Giné Garriga, R.; Pérez Foguet, A. Enhancing the water poverty index: Towards a meaningful indicator. In Proceedings of the IV Congrés Universitat I Cooperació al Desenvolupament, Barcelona, Spain, 12–14 November 2008; Universitat Autònoma de Barcelona: Barcelona, Spain, 2008. [Google Scholar]
  28. De Senna, L.; Maia, A.; De Medeiros, J. The Use of Principal Component Analysis for the Construction of the Water Poverty Index; Revista Brasileira de Recursos Hídricos: Porto Alegre, Brazil, 2019; Volume 24, pp. 1–14. ISSN 2318-0331. [Google Scholar] [CrossRef]
  29. Jemmali, H.; Abu-Ghunmi, L. Multidimensional analysis of the water-poverty nexus using a modified Water Poverty Index: A case study from Jordan. Water Policy 2016, 18, 826–843. [Google Scholar] [CrossRef]
  30. Mehta, L. Water and Human Development. In World Development; Elsevier: Amsterdam, The Netherlands, 2014; Volume 59, pp. 59–69. [Google Scholar]
  31. Bozorg-Haddad, O.; Zolghadr-Asli, B.; Sarzaeim, P.; Aboutalebi, M.; Chu, X.; Loáiciga, H. Evaluation of water shortage crisis in the Middle East and possible remedies. J. Water Supply: Res. Technol. AQUA 2019, 9, 85–98. [Google Scholar]
  32. Fund for Peace, Fragile State Index Reports. Available online: https://fragilestatesindex.org/ (accessed on 25 May 2025).
  33. Hemmati, B.; Forouzani, M.; Yazdanpanah, M.; Khosravipour, B. Comparison application of the analytic network process (ANP) and analytic hierarchy process (AHP) in analysis of the agricultural water poverty index: The case of dezful county. Iran. Agric. Ext. Educ. J. 2016, 11, Pe203–Pe220. [Google Scholar]
  34. El-Gafy, I. The water poverty index as an assistant tool for drawing strategies of the Egyptian water sector. Ain Shams Eng. J. 2018, 9, 173–186. [Google Scholar] [CrossRef]
  35. Zare-Bidaki, R.; Pouyandeh, M.; Zamani-Ahmadmahmoodi, R. Applying the enhanced Water Poverty Index (eWPI) to analyse water scarcity and income poverty relation in Beheshtabad Basin, Iran. Appl. Water Sci. 2022, 13, 53. [Google Scholar] [CrossRef]
  36. Sayyar, L.Z.; Mahdei, K.N.; Fami, H.S.; Motaghed, M. Developing and Analysing the Agricultural Water Poverty Index in West Iran. Sustainability 2022, 14, 1410. [Google Scholar] [CrossRef]
  37. Day, S.J. Managing Water Locally: An Inquiry into Community-Based Water Resources Management in Fragile States. Ph.D. Thesis, Cranfield University, School of Energy, Environmental Technology and Agrifood, Cranfield, UK, 2016. [Google Scholar]
  38. Ohlsson, L. Water Conflicts and Social Resource Scarcity. Phys. Chem. Earth Part B Hydrol. Ocean. Atmos. 2000, 25, 213–220. [Google Scholar] [CrossRef]
  39. Nussbaum, M.C. Capabilities as Fundamental Entitlements: Sen and Social Justice; Routlege Taylor and Francis Group: Oxfordshire, UK, 2003; pp. 33–59, ISSN 1466-4372. [Google Scholar] [CrossRef]
  40. Reddy, S.G.; Daoud, A. Chapter 34: Entitlements and Capabilities. In Cambridge Handbook of the Capability Approach; Cambridge University Press: Cambridge, UK, 2021. [Google Scholar] [CrossRef]
  41. Nabudere, D.W. Beyond Modernization and Development, or Why the Poor Reject Development. Geogr. Ann. Ser. B Hum. Geogr. 1997, 79, 203–215. [Google Scholar] [CrossRef]
  42. Desai, H. States of Fragility and Official Development Assistance. In OECD Development Cooperation Working Papers; No. 76; OECD Publishing: Paris, France, 2020. [Google Scholar] [CrossRef]
  43. Rasul, G. Managing the food, water, and energy nexus for achieving the Sustainable Development Goals in South Asia. Environ. Dev. 2016, 18, 14–25. [Google Scholar] [CrossRef]
  44. Seyoum, B. State fragility and human development: A study with special emphasis on social cohesion. Int. J. Soc. Econ. 2020, 48, 39–61. [Google Scholar] [CrossRef]
  45. World Bank. World Bank’s Data Bank on World’s Development Indicators. Available online: https://databank.worldbank.org/source/world-development-indicators (accessed on 29 August 2024).
  46. Jemmali, H.; Sullivan, C. Understanding Water Conflicts in the MENA Region: A Comparative Analysis Using a Restructured Water Poverty Index. In Routledge Handbook on the Middle East Economy; Taylor & Francis Group: Abingdon, UK, 2021. [Google Scholar] [CrossRef]
  47. United Nations Development Programme, Humnan Development Reports. Available online: https://hdr.undp.org/ (accessed on 1 January 2025).
  48. Slottje, D.J. Measuring the quality of life across countries. Rev. Econ. Stat. 1991, 73, 684–693. Available online: https://www.jstor.org/stable/2109407 (accessed on 18 June 2025). [CrossRef]
  49. Permaver, I.; Smits, J. Inequality in Human Development Across the Globe. In Population and Development Review; Wiley Online Library: Hoboken, NJ, USA, 2020. [Google Scholar]
  50. Anand, P.B. Scarcity, Entitlements and the Economics of Water in Developing Countries; Edward Elgar Publishing: Cheltenham, UK, 2007. [Google Scholar] [CrossRef]
  51. Rijsberman, F.R. Water scarcity: Fact or fiction? Agric. Water Manag. 2006, 80, 5–22. [Google Scholar] [CrossRef]
Figure 1. The five components comprising WPI for the 17 Middle Eastern countries from 1996 to 2023. The first column presents the values using the classic method, while the second one presents the values calculated using the improved method.
Water 17 02871 g001aWater 17 02871 g001b
Figure 2. WPI values for the 17 countries comprising the Middle East for the testing period, and for the Middle East as one block (1996–2023) using arithmetic (a), classical (b), and geometric (c) methods. Figure (d) shows also the weighted average values of WPIs of the aforementioned versions at Middle eastern level, jointly with weighted average of HDI and FSI (based on population sizes of Middle Eastern countries).
Water 17 02871 g002aWater 17 02871 g002b
Figure 3. Maps of WPI using classic, arithmetic, and geometric methods for the Middle Eastern countries for the period 1996–2023.
Water 17 02871 g003
Figure 4. List of countries showing significant correlations between components according to classical approach and WPIcl, HDI, and FSI.
Water 17 02871 g004aWater 17 02871 g004b
Figure 5. List of countries showing significant correlations between components according to PCA approach and WPIa, WPIg, HDI, and FSI.
Water 17 02871 g005aWater 17 02871 g005b
Table 1. The main milestones for WPI development and list of main versions that emerged from 2001 to the present.
#VersionOriginatorMain ComponentsGeographical Scale
1Holistic WPI[22]Water availability, population with access to safe water and sanitation; time and effort taken to collect water for the householdNational and international
2Simple time analysis[22]Time required per person to collect a quantity of 1000 m3National and international
3Classic Water Poverty Index (WPIcl)[16]Resources, Access, Use, Capacity, and EnvironmentCommunity, regional, national, and international
4Water Wealth Index (WWI)[5]Food security
Health
Productivity
Environment
Institutional Capacity and Infrastructure
Natural Baseline Endowment
Basin, regional, and national
5Improved WPI (WPIa and WPIg)[1]Resources, Access, Use, Capacity, and EnvironmentCommunity, regional, national, and international
6Agriculture Water Poverty Index (AWPI)[23]Resources, Access, Use, Capacity, and EnvironmentCommunity, regional, and national
7Modified (multi-scalar, participant-driven) WPI[19]Quality, Quantity, Access, Secondary Sources, and
Capacity
Community
8Inclusive WPI

(IWPI)
[24]Resources, Access, Use, Capacity, Environment, and cohesionCommunity, regional, national, and international
9Household Water Security Index (HWSI) [25]Resources, Access, Use, Capacity, Environment, and institutionsLocal/household level
10Domestic WPI[11]Resources, Access, Use, Capacity, and EnvironmentWas tested at regional level only
Table 3. Correlations among average values of HDI, FSI, WPIcl, WPIa, and WPIg for the 17 countries (1996–2023).
WPIcl_avgWPIa_avgWPIg_avgHDI_avgFSI_avg
WPIcl_avgCorrelation Coefficient1.0000.689 **0.745 **0.1230.203
Sig. (2-tailed)0.0000.002<0.0010.6390.434
WPIa_avgCorrelation Coefficient 1.0000.973 **−0.2820.353
Sig. (2-tailed) 0.000<0.0010.2730.165
WPIg_avgCorrelation Coefficient 1.000−0.2350.370
Sig. (2-tailed) 0.0000.3630.144
HDI_avgCorrelation Coefficient 1.0000.152
Sig. (2-tailed) 0.0000.560
FSI_avgCorrelation Coefficient 1.000
Sig. (2-tailed) 0.000
**. Correlation is significant at the 0.01 level (2-tailed).
Disclaimer/Publisher’s Note: The statements, opinions and data contained in all publications are solely those of the individual author(s) and contributor(s) and not of MDPI and/or the editor(s). MDPI and/or the editor(s) disclaim responsibility for any injury to people or property resulting from any ideas, methods, instructions or products referred to in the content.