Abstract
This study addresses the challenges of water management in China amidst globalization and urbanization, focusing on the conflicts between the agricultural and non-agricultural sectors. An input–output model for 2017 was used to quantify virtual water flows and map the trade networks. The network exhibits “small-world” characteristics with efficient yet sparse connections. It identifies key virtual water exporters and importers, revealing regional disparities and significant spatial mismatches in water resources. Typically, agricultural sectors act as net exporters, whereas non-agricultural sectors are net importers of virtual water. Policy recommendations include tailored water management strategies, enhancing efficiency in provinces with substantial outflows, and establishing market-driven water trading to optimize resource allocations.
1. Introduction
Water, as a fundamental and strategic resource for social development, plays an irreplaceable role in ensuring national food security and promoting sustainable economic growth. China accounts for approximately 18% of the world’s population but accounts for only 7% of the global water resources, with per capita available freshwater resources significantly below the world average. The distribution characteristics and utilization efficiency of water resources are directly related to a country’s sustainable development and the quality of life of its people. China’s water resources exhibit significant regional and seasonal disparities. For example, the northern region holds only approximately 20% of China’s total water resources but sustains more than half of the population [1]. This uneven distribution of water resources has led to tension and conflicts in water demand between agricultural and non-agricultural industries across regions.
Since ancient times, China has placed great importance on water conservancy construction, as the effective management of water resources is crucial for agricultural production, with harvest yields directly impacting social stability. In the current context of building a strong agricultural nation, ensuring food security remains the government’s top priority. The agricultural sector, which accounts for 80% of total water usage, has not changed its status as a major water consumer; thus, improving agricultural water-use efficiency is vital for alleviating water scarcity [2]. Rapid population growth, urbanization, and industrialization are expected to significantly increase China’s agricultural water needs [3]. Since the reform and opening-up period, the share of the non-agricultural sector in the economy has been steadily rising; by 2023, the added value of the secondary and tertiary industries (roughly equivalent to the non-agricultural sector) accounted for 92.9% of China’s gross domestic product [4], becoming a key driver of economic growth and modernization. As industrialization and urbanization progress, the demand for water in the non-agricultural sector is also increasing, leading to a more pronounced impact on water resource consumption [1]. The agricultural and non-agricultural sectors are interdependent and mutually reinforcing: the agricultural sector provides food and raw materials for the non-agricultural sector, whereas the non-agricultural sector supplies fertilizers and agricultural machinery to the agricultural sector. Currently, China is in a stage of unbalanced and inadequate development, where the rapid growth of the non-agricultural sector is squeezing water resources from the agricultural sector. Both sectors exhibit low water-use efficiency, resulting in intensified competition for water resources between industries [5]. This not only threatens food security but also poses potential risks to the modernization process in China.
The competition between the agricultural and non-agricultural sectors for water resources is a form of “invisible” competition, which is hidden within the flow of virtual water between the two sectors. The concept of virtual water was first introduced by Tony Allan [6] and has since been expanded to include the widely accepted definition of virtual water as the amount of water consumed during the production of goods and services [7]. This concept has opened new perspectives in global water resource management. Virtual water trade refers to the indirect transfer of water resources through the trade of products that contain virtual water (i.e., products that require water for their production), thereby optimizing water resource allocation. Regions with abundant water resources can profit from exporting water-intensive products, whereas regions with scarce water resources can alleviate local water pressure by importing these products [8]. Such transactions are widely regarded as effective methods for addressing the uneven distribution of water resources, providing an important pathway for transferring limited water resources to water-scarce areas through regional trade and promoting the redistribution of water resources to achieve a balance between supply and demand [9,10]. However, the mismatch between the flow of virtual water and the availability of physical water resources, particularly the substantial outflow of virtual water from the agricultural sector in water-scarce regions, can exacerbate local water shortages and threaten production in both the agricultural and non-agricultural sectors.
This study aims to construct and analyze China’s virtual water trade network from the dual perspective of the agricultural and non-agricultural sectors. By applying the Leontief value-type input–output model, this study calculates the virtual water trade volume between provincial agricultural and non-agricultural sectors and establishes the corresponding network. Using complex network analysis methods, this study compares the virtual water outputs and inputs of agricultural and non-agricultural sectors across different provinces and regions, explores the impact of socioeconomic factors on the net virtual water trade volumes of these provinces and regions, and reveals the roles and transmission mechanisms of the agricultural and non-agricultural sectors in virtual water transfer.
The main contributions of this study are as follows: First, while traditional research on virtual water trade has focused primarily on interregional water flows, this study overcomes this limitation by shifting the focus to intersectoral exchanges, particularly between the agricultural and non-agricultural sectors. Considering the differences in production and consumption patterns between these sectors and their “invisible” competition for water resources, this study not only provides a new perspective for water resource management but also deepens the understanding of the roles of these two sectors in the virtual water transfer network. Coordinating the development of agricultural and non-agricultural sectors is crucial during this key period of China’s modernization, especially concerning water resource allocation. Thus, the innovative perspective of this study has both theoretical value and significant practical implications; it illuminates the current characteristics of water resource allocation and offers targeted policy recommendations to support water resource management and achieve a balance in water use at the national level. Second, this study integrates knowledge from economics, water resource management, and network science, utilizing the latest spatiotemporal data for analysis. By employing the Leontief value-type input–output model alongside complex network analysis methods, the virtual water trade network between the provincial agricultural and non-agricultural sectors in China can be constructed. This methodological innovation not only provides new research approaches to address the complex issue of water resource management but also holds important practical significance. This study reveals the interactive relationships between the agricultural and non-agricultural sectors within the water resource transfer network, offering a scientific basis for formulating effective water resource management policies and thereby supporting the rational allocation and efficient utilization of water resources as China has progressed through modernization efforts.
2. Literature Review
Research on virtual water in China can be categorized into three levels: international, regional, and interprovincial. (1) International level: Studies at this level focus on the flow of virtual water between China and its trading partners, including virtual water trade with countries involved in the Belt and Road Initiative [11] and Trans-Pacific Partnership countries [12]. Additionally, some studies have examined the evolution and position of China’s virtual water trade within global supply chains [13] and the international virtual water flow related to China’s agricultural product trade [14]. (2) Regional level: Research at the regional level explores virtual water flows between different areas within China, such as between the northern and southern regions [1,15,16]. Some studies have analyzed the status of virtual water trade among provinces within specific watersheds, such as the Yellow River Delta region [17] and the Haihe River Basin [18,19]. (3) Interprovincial level: Research at this level focuses primarily on the water footprint of various provinces in China and the provincial transfers of virtual water, along with their driving factors [10,20,21]. By examining these different levels, the body of research on virtual water in China provides insights into how water resources are managed and allocated across various scales, highlighting the complexities involved in addressing water scarcity and optimizing resource use in the country.
Currently, there are two primary modeling paradigms for accounting for virtual water. The first is the bottom-up model, which is based on the theory of the water footprint and is more commonly applied to the calculation of virtual water content in agricultural products. By calculating the water footprint of agricultural products, one can obtain the virtual water content of these products and, in combination with trade data, further derive the virtual water flow of agricultural products [22]. The other paradigm is the top-down model, which is based on input–output analysis (IOA) for virtual-water accounting. This model typically employs input–output analysis to calculate the water footprint across the entire supply chain, including the direct and indirect total water use for local production intended for final consumption and imports related to local use [13]. The application of input–output models is more extensive, providing the possibility to analyze virtual water flows between different industries and sectors and trace the virtual water flow paths in product trade on the basis of the general relationships between industries [23,24,25], which also offers possibilities for subsequent network analysis.
With increasing attention given to the spatial correlation characteristics of virtual water trade and the complexity of economic and industrial activities, research on the patterns of virtual water trade has shifted toward more systematic and comprehensive network analysis. Konar et al. [26] utilized complex network theory to analyze the structure of the global virtual water trade related to the international food trade. Dalin et al. [2] studied the evolution of the virtual water trade network among countries from 1986 to 2007, finding that the number of trade connections and the volume of water associated with the global food trade more than doubled over 22 years, and they observed persistent organizational characteristics within the network. Fang and Chen [27] used network analysis methods to study the virtual water trade network between regions in China’s Heihe River Basin from 2002 to 2010, discovering that the forestry, animal husbandry, and fishery sectors, as well as the industrial sector, were the main controllers and that the entire trade network tended toward mutual benefit and synergy, but there were still some competitive relationships that weakened the virtual water cycle. Deng et al. [28] employed a multiregional input–output model to measure the virtual water trade of 19 major countries from 2006 to 2015 and combined social network analysis methods to study the characteristics of the virtual water trade network. They reported that the density (average) and asymmetry (import-export difference) of the virtual water trade network of major countries increased in all industries and the three major sectors from 2006 to 2015. In 2015, the outwardness (corresponding to exports) and inwardness (corresponding to imports) of countries in the all-industry virtual water trade network both increased to varying degrees. Wang et al. [29] used environmentally extended multiregional input–output (EE-MRIO) data to establish a multilayered network of goods and services between 31 provinces and 41 economic sectors in 2017, with economic (CNY) and virtual water (cubic meters) weights, and discovered that the virtual water multilayer network is related to addressing water sustainability, scarcity, and risk issues in the supply chain; however, examining the virtual water network in isolation may not identify economically important core nodes, and considering both the economic resource network and the embedded resource network can enhance our understanding of complex supply chains.
In recent years, the field of virtual water research has continuously deepened, with the quantification of virtual water content in commodities and the analysis of its flow paths becoming increasingly sophisticated. These advancements have provided a solid foundation for constructing virtual water trade networks, analyzing their characteristics, studying spatiotemporal changes in virtual water trade patterns, and exploring the driving factors of virtual water flows. In virtual water trade, agriculture plays a pivotal role, and its trade role in different regions and periods, as well as the key factors influencing its virtual water flows, has been studied extensively. Despite this, traditional virtual water trade research has often focused on water flows between regions, with less attention given to virtual water exchanges between sectors, particularly interactions between agricultural and non-agricultural sectors. Given the differences in production and consumption patterns between the agricultural and non-agricultural sectors, studying the virtual water flows and water footprints between these sectors can provide new perspectives for virtual water trade research and promote a more comprehensive understanding of virtual water trade. Methodologically, input–output and network analyses have been widely adopted to comprehensively examine virtual water flows between different industries and sectors, as well as the characteristics of virtual water trade networks. However, calculating virtual water via unclassified input–output tables can be overly cumbersome, and the resulting networks may be too complex to identify the characteristics of different industries and sectors within virtual water trade networks. Consequently, simplified classification methods, such as dividing sectors into primary, secondary, and tertiary industries, have emerged to facilitate the analysis of virtual water trade networks and provide a more diverse perspective on the subject.
3. Methods
To clearly demonstrate the data processing and calculation procedures of this study, we created a detailed research flowchart (Figure 1). This flowchart outlines the complete steps from raw data collection to the final construction and analysis of the virtual water network.
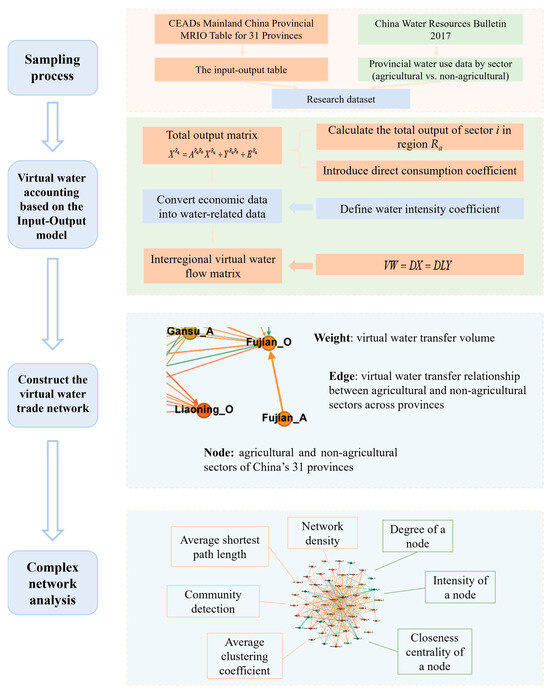
Figure 1.
Research Methodology and Analytical Framework.
3.1. Virtual Water Accounting Based on the Input–Output Model
The multiregional input–output (MRIO) model [30] is an effective tool based on the input–output (IO) table method proposed by Leontief [31]. This model can accurately calculate virtual water flows between regions and comprehensively reveal the intrinsic connections between different regions and industries.
In an economic system consisting of R regions and N economic sectors, the mathematical structure of the interregional input–output model is represented by a system of linear equations of size (m × n). The production activities in each region adhere to the following balancing principle: the total output of each sector is equal to the sum of intermediate consumption, final consumption, and exports outside the system (where a, b < m; m ≤ 31; i, j < n; n ≤ 2; here, m represents the 31 regions of China, and n represents the agricultural and non-agricultural sectors in each region):
where is the total output of sector i in the Ra region; is the intermediate input provided by sector i in the Ra region to sector j in the Rb region; is the input quantity of sector i in the Ra region to the final demand of the Rb region; and is the export volume of sector i in the Ra region to the outside of the system.
The direct consumption coefficient can be introduced to represent the intermediate input consumed by the sector to produce a unit of product. The calculation formula is as follows:
where represents the intermediate input provided by sector i in region Ra to sector j in region Rb and where represents the total output of sector j in region Rb.
Substituting Equation (2) into Equation (1) and transforming it into matrix form, we can obtain the following:
where , , and denote the total output matrix, direct consumption matrix, end-use matrix, and export matrix, respectively.
By simplifying the transformation of the above equation, we can obtain the following:
where X is the total output matrix; A is the direct consumption coefficient matrix; is the Leontief inverse matrix; and Y is the final demand matrix, including the final demand to satisfy local and final demand to satisfy outside the region and exports.
To convert economic data into corresponding water-related data, we first need to define the water use intensity coefficient:
where is the direct water consumption intensity coefficient, and where represents the direct water consumption of sector j, which in this paper refers to the water consumption (100 million m3) of the agricultural and non-agricultural sectors. The data are sourced from the China Water Resources Bulletin 2017 [32]; is the total output of sector j.
Finally, we can obtain the virtual water flow matrix between regions:
where VW represents the interregional virtual water flow matrix, where the rows of the matrix represent the outflow regions and the columns represent the inflow regions. For example, represents the virtual water flow from sector i in the Ra region to sector j in the Rb region. D is the direct water-use intensity coefficient matrix. This formula elucidates the process by which water resources become embedded as virtual water during the production of goods. This process is triggered by the production activities of regional sectors and is transmitted to the final demand side, along with the flow of goods.
3.2. Complex Network Analysis
Complex networks originate from the field of graph theory in mathematics, and as research has progressed, they have gradually integrated knowledge from various disciplines, forming an emerging interdisciplinary and cross-disciplinary frontier. Complex networks are often used as mathematical tools to describe complex relationships within and between entities in social, economic, ecological, and cultural domains. In complex networks, a network can be abstracted as a graph G = (V, E) composed of a large number of nodes V and edges E, where nodes represent individuals in the actual network and edges indicate the connections between individuals.
3.2.1. Overall Structural Characteristics of the Network
The network density is defined as the ratio of the actual number of edges in the network to the total number of possible edges. For a directed weighted network, the network density is expressed as follows:
where D is the density of the network and E is the number of edges in the network.
The clustering coefficient quantifies the extent to which the neighboring nodes of a node come together to form a cluster, the complete graph. The average clustering coefficient of a network is defined as the average of the sum of the clustering coefficients of all nodes in the network, which is expressed as follows:
where is the clustering coefficient of node i in the network, is the degree value of node i, and is the actual number of edges between adjacent nodes of node i.
In a complex network, the distance between nodes i and j is defined as the minimum number of connected edges through which nodes i and j need to establish a connection [33]. The average shortest path length of the network is defined as the average distance between all node pairs in the network, which is expressed as follows:
where L is the average shortest path length of the network and where is the distance between nodes i and j.
In real-world networks, nodes often form densely interconnected groups known as communities [34]. Nodes within the same community typically share functional similarities, and identifying such structures—referred to as community detection—can reveal hidden topological features of the network. In this study, we employ the Louvain method, a widely used modularity-based algorithm. Modularity quantifies the quality of a network partition by comparing the density of internal links within communities to that expected under a null model of random edge distribution. It ranges from −1 to 1, with higher values indicating stronger community structure—i.e., dense intracommunity connections and sparse intercommunity links. Mathematically, modularity is defined as follows:
where the intensity of node i is and the total intensity of the network is ; when nodes i and j are within the same community, ; otherwise, . The Louvain method uses modularity as an objective function, iteratively optimizing community assignments to maximize Q. It heuristically explores network partitions, favoring groupings that maximize intracommunity connectivity while minimizing intercommunity connections, ultimately yielding a high-modularity, interpretable community structure.
3.2.2. Local Structure Characteristics of the Network
The degree of a node is the number of edges connected to that node and is the most direct measure of node centrality [35]. In a directed network, the degree of a node can be divided into in-degree and out-degree degrees on the basis of the direction of the edges. The in-degree of node i is the number of edges that are connected to node i and end at node i, and the out-degree is the number of edges that are connected to node i and start from node i, expressed as follows:
where N is the total number of nodes in the network, and where is the element in the adjacency matrix of the network. If nodes i(j) and j(i) have connected edges, then ; otherwise, , and the degree of node .
The intensity of a node is one of the centrality measures. In a directed network, the intensity of a node is divided into in-degree intensity and out-degree intensity. The in-degree intensity and out-degree intensity reflect the total weights of all incoming and outgoing edges of a node, respectively, and are represented as follows:
where represents the input intensity of node i and where represents the output intensity of node i. is the connected edge weight from node i(j) to node j(i) in the network.
The closeness centrality of a node in a network represents the ease with which a node can visit other nodes. It is defined as the reciprocal of the sum of the minimum number of edges required to connect a node to all other nodes in the network [36]. The formula is as follows:
where represents the proximity centrality of node I, and where is the length of the shortest path from node to node in the network.
3.3. Data
The input–output table used in this study is adapted from the CEADs Mainland China Provincial MRIO Table for 31 Provinces (42 sectors) [37]. Provincial-level water use data for both agricultural and non-agricultural sectors—including all provinces, autonomous regions, and municipalities—are sourced from the China Water Resources Bulletin 2017 [32], published by the Ministry of Water Resources of the People’s Republic of China. The bulletin is publicly available at http://mwr.gov.cn/sj/tjgb/szygb/201811/P020220121619384021110.pdf (accessed on 30 July 2025). Appendix A presents the classification of sectors and water consumption by agricultural and non-agricultural sectors across Chinese provinces.
4. Results and Discussion
4.1. Construction of the Virtual Water Trade Network
This study quantifies interprovincial virtual water flows between agricultural and non-agricultural sectors in China for the year 2017 via a multiregional input–output (MRIO) model. The agricultural and non-agricultural sectors across 31 Chinese provinces are treated as nodes (62 nodes in total), forming a directed, weighted network. In this network, edges represent virtual water transfers between sectors across provinces, with edge weights corresponding to the volume of virtual water traded.
To identify and analyze the dominant pathways within the network, we apply a threshold-based filtering approach. This method reduces network complexity by eliminating weak connections while preserving major structural features, thereby enhancing the effectiveness of subsequent network-theoretical analyses [38]. Statistical analysis reveals that approximately 10.5% of the trade links account for more than 90% of the total virtual water flows—a distribution consistent with the Pareto principle, which posits that a small fraction of components often drives the majority of system activity.
Accordingly, we set the threshold at the top 10.5% of weighted edges to retain only the most significant virtual water flows. Figure 2 shows the distribution of the ratio of the edge weight (the edge weight refers to the virtual water transfer volume carried by the edge) to the total weight (the total virtual water transfer volume) in China’s initial virtual water trade network in 2017 from the perspective of agricultural and non-agricultural duality. The edges are arranged in ascending order of their weight values from left to right, and the orange dashed line in the graph represents the critical threshold.
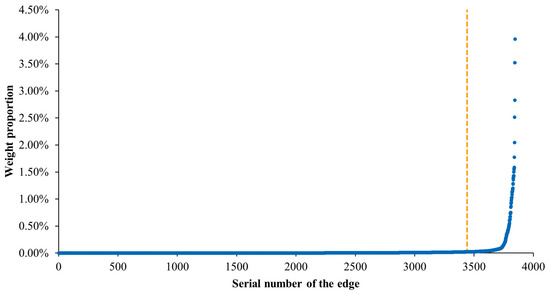
Figure 2.
Probability distributions of edge weights in the initial virtual water trade network. The yellow dotted line represents the screening threshold. Edges to the right of this threshold are retained. The blue dots represent the weight of each individual edge as a proportion of the total weight of all edges.
By applying the above threshold reconstruction network method, this study constructs a virtual water trade-directed weighted network model from the perspective of China’s agricultural and non-agricultural sectors in 2017 (a total of 56 nodes are included, and the non-agricultural sectors of Ningxia, Qinghai, Tibet, Xinjiang and Gansu, and the agricultural sector of Beijing, are removed as isolated nodes). In Figure 3, nodes represent agricultural and non-agricultural sectors in each province, with directed edges indicating virtual water flows (the edge thickness reflects the flow volume). Node colors denote community detection results—nodes of the same color belong to the same community. The node sizes in this figure are for visual clarity only and have no quantitative meaning.
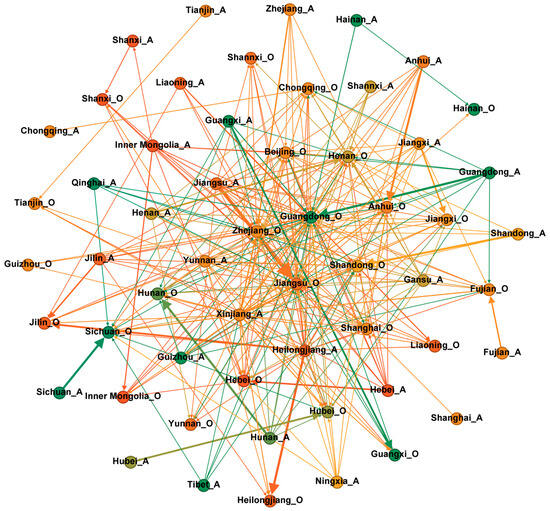
Figure 3.
China’s virtual water trade network from the dual perspective of agriculture and non-agriculture sectors. The suffix _A denotes the agricultural sector of the province, and the suffix _O denotes the non-agricultural sector of the province.
4.2. Analysis of the Overall Structural Characteristics of the Virtual Water Trade Network
4.2.1. The Closeness of the Virtual Water Trade Network Connections
Network density is a key indicator used to evaluate the tightness of connections among network nodes and can reveal the tightness of China’s virtual water trade network from the perspective of agricultural and non-agricultural sectors. The calculation results show that the density value of the network is 0.125, which indicates that the network is sparsely connected. This sparse network structure may indicate that the frequency of cooperation between nodes is not high and that the flow of information is inefficient. This implies that the agricultural or non-agricultural sectors in some provinces may not be closely connected with the corresponding sectors in the core provinces, which is not conducive to synergistic cooperation among provinces in terms of water allocation. Therefore, to promote the ability of water allocation in the interprovincial trade of the agricultural and non-agricultural sectors, the current interprovincial trade structure of the agricultural and non-agricultural sectors needs to be optimized to maintain the appropriate network density and enhance its synergistic effect.
4.2.2. Communication Efficiency and Small-World Characteristics of a Virtual Water Trade Network
The average clustering coefficient of the virtual water trade network is 0.402, which indicates that in the network, there is a probability of approximately 40% that a virtual water trade partner of the agricultural or non-agricultural sector in one province is also a trade partner of the corresponding sector in other provinces. This coefficient reflects the significant aggregation ability of China’s virtual water trade network from the perspective of agriculture and non-agriculture. In addition, the average shortest path length of the network is 1.917, and this small value indicates that the transmission efficiency of virtual water between the agricultural and non-agricultural sectors of the province is very high, which only needs 1.917 intermediate steps to achieve. This structural feature indicates that the network has a “small-world” effect; that is, when the central node in the network is disturbed, its influence can quickly spread to the whole network. On the basis of this feature, if policies to improve water use efficiency are implemented in the agricultural or non-agricultural sectors of key provinces in the virtual water transfer network, the effects of these policies will quickly spread to other provinces in the network, helping to reduce water consumption nationwide.
4.2.3. Community Structure and Roles in the Virtual Water Trade Network
On the basis of the community structure analysis, we can divide the virtual water trade network into several highly interconnected network small groups. Within the same community, the nodes are more closely connected, whereas the nodes between different communities are relatively loosely connected. The community structure analysis helps to reveal some hidden features in the network topology and deepens our understanding of the roles of agricultural and non-agricultural sectors in the virtual water trade network in different regions of China.
We used the Louvain algorithm for community detection, which iteratively optimizes community assignments to maximize the modularity Q. According to the principle of maximization of modularity, when the modularity reaches 0.440, the network community division is considered optimal, and the virtual water trade network is divided into 12 communities at this time, as shown in Table 1. Community 4 is the largest community, including the agricultural and non-agricultural sectors of Beijing, Tianjin, Shanghai, Zhejiang, Fujian and Chongqing. This community does not seem to strictly follow geographical proximity but spans multiple regions of China, covering the “Yangtze River Delta” region, China’s most economically developed region, and some important provinces and cities in Southwest China and Northwest China. It can reflect the economic linkages between China’s eastern coast and inland provinces, especially through trade, investment and technology transfer. Community 10 includes the agricultural or non-agricultural sectors of Guangdong, Guangxi, Hainan, Guizhou and Tibet. The community is also cross-regional, covering Southwest China and South China. As the main economic growth pole in southern China, the Pearl River Delta has a strong radiation effect on the surrounding provinces. These two larger communities show a certain degree of cross-regional combination, reflecting the characteristics of economic development and interregional connections in different regions of China. Both Communities 8 and 9 are formed on the basis of the agricultural and non-agricultural sectors within a single province.

Table 1.
Community analysis results.
The amount of virtual water transferred within the community from high to low is communities 4, 10, 2, 1, 0, 9, 8, 11, 7, 3, 6 and 5. As communities with large internal virtual water transfer volumes, Communities 4 and 10 had 91.93 billion m3 (approximately 8.39% of the total virtual water transfer volume) and 67.49 billion m3 (approximately 6.16% of the total virtual water transfer volume), respectively. The reason for this phenomenon is that these two associations contain major provinces of heavy industry and agriculture in China, which have a large demand for water resources, and the supply–demand relationship within these associations leads to a large number of virtual water transfers.
Communities 4 and 1 are the main virtual water net outflow communities, with net outflows of 12.34 billion m3 and 6.95 billion m3, respectively, and are the main “suppliers” of virtual water in the network. As the main “suppliers” of virtual water, Community 4 includes several economically more developed regions in China, which are relatively water scarce and below the national average, but have frequent foreign trade, especially in the non-agricultural sector. This situation can lead to imbalances in the allocation of regional water resources, especially when water resources are already stressed. Therefore, more active water management measures are needed in these areas to ensure sustainable water use. Additionally, as the main “suppliers” of virtual water, the members of Community 1 have a prominent commonality; that is, they are the “granaries” located on black land and the main grain production base in China, which can be confirmed by the research results of Sun et al. [16]. These regions have developed agriculture and frequent intranational trade, which to some extent alleviates the risk of water shortages caused by agricultural production in other water-scarce regions, but these regions themselves also have insufficient water endowments. To reduce the excessive consumption of water resources, these regions need to strengthen the popularization of water-saving measures in agricultural production and improve the efficiency of water use.
Communities 10 and 2 are the main virtual water net inflow communities, with net inflows of 8.07 billion m3 and 5.82 billion m3, respectively, and are the main “consumers” of virtual water in the network. The area covered by Community 10 is the region with the most abundant water resource endowment in China and should theoretically become the virtual water supplier. However, owing to their large population and limited arable land resources, these regions cannot achieve complete food self-sufficiency and need to rely on imports, thus becoming the main “consumers” of virtual water. This situation, to some extent, increases the risk of water scarcity in other water-scarce regions. To alleviate this problem, these regions can consider improving local food production capacity, reducing external dependence, or improving water use efficiency through technological innovation. As the main consumption place of virtual water, members of Community 2 reduce the consumption of local water resources by importing products with high water consumption, which helps to improve the overall utilization efficiency of water resources and is more reasonable for water resource allocation. Regions such as Shanxi, Jiangsu, and Yunnan can further reduce the pressure on local water resources by optimizing their import strategies and selecting products with higher water utilization efficiency.
4.3. Analysis of the Local Structural Characteristics of the Virtual Water Trade Network
The local structural characteristics of a complex network, particularly the degree distribution of its nodes, are crucial for understanding the roles and importance of individual actors. In the interprovincial virtual water trade network, a node’s In-Degree and Out-Degree serve as key indicators of a province’s position as an importer or exporter. To visually represent these local properties, we present the network with node sizes scaled by In-Degree and Out-Degree in Figure 4 and Figure 5, respectively. Figure 4 highlights nodes with a high number of incoming virtual water connections, whereas Figure 5 emphasizes those with a high number of outgoing connections.
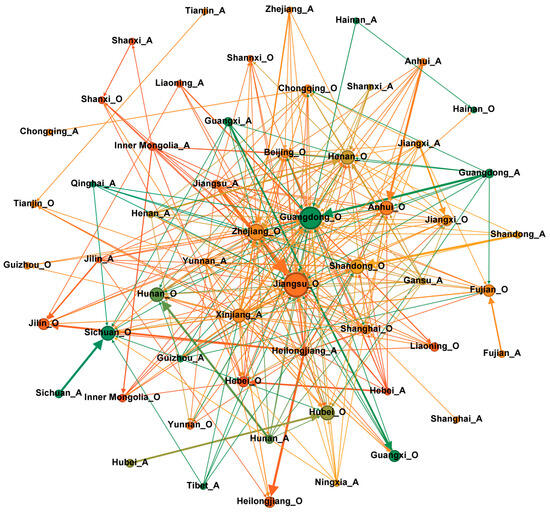
Figure 4.
China’s virtual water trade network from the dual perspective of the agriculture and non-agriculture sectors, with In-Degree as the characteristic index. The size of the node indicates the value of the weighted In-Degree. The edge thickness reflects the flow volume.

Figure 5.
China’s virtual water trade network from the dual perspective of the agriculture and non-agriculture sectors, with Out-Degree as the characteristic index. The size of the node indicates the value of the weighted Out-Degree. The edge thickness reflects the flow volume.
An intuitive observation of Figure 4 and Figure 5 reveals a clear differentiation in the roles of provinces within the virtual water trade network. In Figure 4, where node size is scaled by In-Degree, we can clearly see that the non-agricultural sectors of Guangdong, Zhejiang, and Jiangsu have larger nodes located in the central network area. This visually confirms their status as core virtual water importers.
Similarly, in Figure 5, where node size is determined by Out-Degree, the agricultural sectors of Xinjiang, Heilongjiang, and Jiangsu, despite their non-central geographical positions, present significantly larger nodes. This highlights their critical role as core virtual water exporters.
This preliminary visual analysis provides essential clues. To further quantify and validate these findings, we proceeded with a detailed data-driven analysis of each provincial sector’s virtual water net flow, centrality metrics, and community membership.
4.3.1. Centrality of Agricultural and Non-Agricultural Sectors in Key Provinces Within the Virtual Water Trade Network
In complex network theory, the degree of a node is an indicator of the node’s importance within the network. In this study, the in-degree and out-degree of nodes representing the agricultural and non-agricultural sectors of each province correspond to the number of import and export partners for virtual water in these sectors, respectively. Figure 6 shows the distribution of degree values for the agricultural and non-agricultural sectors of each province within the virtual water trade network. From the perspective of the agricultural sector, all provinces have a low degree, indicating that the agricultural sector primarily acts as an exporter of virtual water. The low in-degree implies that the agricultural sector is less dependent on external imports of virtual water and instead supplies virtual water to other provinces or sectors. Provinces such as Xinjiang, Heilongjiang, Yunnan, Jiangsu, and Gansu have a significantly higher out-degree for their agricultural sectors than other provinces do, indicating that these provinces’ agricultural sectors play a key role as export nodes in the virtual water trade network, with a larger number of virtual water export partners. From the perspective of the non-agricultural sector, the out-degree is generally low, but Jiangsu and Guangdong have a noticeably higher out-degree than other provinces do, suggesting that the non-agricultural sectors in these provinces have a strong export capacity within the virtual water trade network, with many virtual water export partners. Compared with other provinces, Zhejiang, Guangdong, and Jiangsu have significantly greater degrees for their non-agricultural sectors, indicating that these provinces’ non-agricultural sectors have strong import capacity within the virtual water trade network and rely on a greater supply of external virtual water.
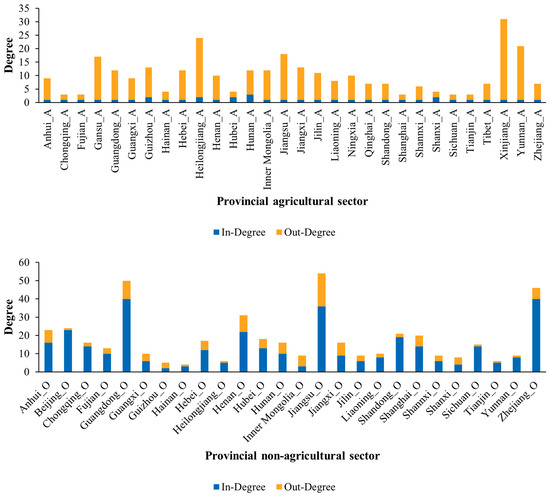
Figure 6.
In-Degree and Out-Degree values for each provincial sector in the interprovincial virtual water trade network. The figure displays the number of connections for each provincial agricultural and non-agricultural sector, representing virtual water imports and exports, respectively.
4.3.2. Centrality and Role Characteristics of Agricultural and Non-Agricultural Sectors in Key Provinces Within the Virtual Water Trade Network
The analysis of the degree values of nodes representing agricultural and non-agricultural sectors in provinces provides insights into the number of trade partners these sectors have. However, this does not fully explain their level of participation in the interprovincial virtual water trade in China. In complex network theory, a node’s participation can be reflected through its intensity. Figure 7 illustrates the in-degree intensity and out-degree intensity of the agricultural and non-agricultural sectors in the virtual water trade network for various provinces. In this study, the in-degree intensity and out-degree intensity of nodes represent the volume of virtual water inflow and outflow for the agricultural or non-agricultural sectors of a province, respectively.
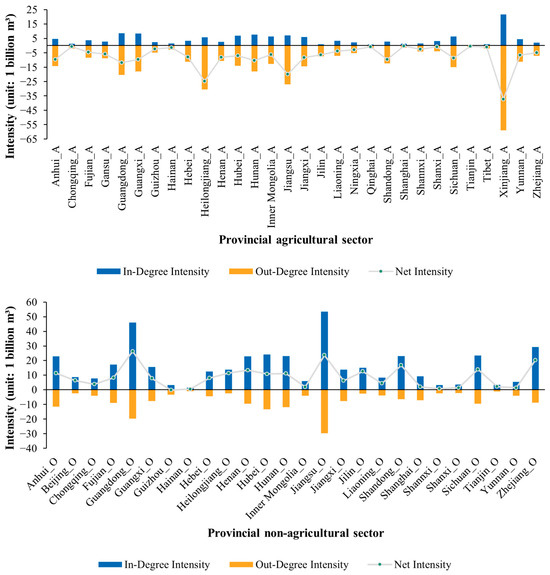
Figure 7.
Values of the In-Degree intensity and Out-Degree intensity for each provincial sector in the interprovincial virtual water trade network. The intensities, in units of 1 billion m3, represent the total volume of virtual water imported by and exported from each provincial sector, respectively.
Provinces such as Jiangsu, Guangdong, Zhejiang, Hubei, Sichuan, Shandong, Hunan, Anhui, and Henan have high in-degree intensity in their non-agricultural sectors, with their combined in-degree intensity accounting for approximately 49.00% of the total in-degree intensity of all provinces’ agricultural and non-agricultural sectors. This indicates that the non-agricultural sectors in these provinces are the primary consumers of the interprovincial virtual water trade in China.
The agricultural sectors in Xinjiang, Heilongjiang, Jiangsu, Guangdong, Guangxi, Hunan, Sichuan, Jiangxi, and Anhui, as well as the non-agricultural sectors in Jiangsu and Guangdong, exhibit high out-degree intensity. The combined out-degree intensity of these provinces’ agricultural and non-agricultural sectors accounts for approximately 48.66% of the total out-degree intensity of all provinces, indicating that they are the main suppliers in interprovincial virtual water trade.
When analyzing the net virtual water flow, a significant phenomenon is observed: all provinces’ agricultural sectors show a net outflow of virtual water, whereas non-agricultural sectors show an inflow. This reveals the important role of the agricultural sector in supporting the development of the non-agricultural sector by providing water-intensive agricultural products, which in turn promotes the prosperity of the non-agricultural sector. However, this transfer may also introduce potential risks. The net outflow of virtual water from the agricultural sector may exacerbate water scarcity issues in certain regions, especially where water resources are already tight. A reduction in agricultural water use could affect crop yields and quality, impacting food security and the sustainable development of agriculture.
The agricultural sectors in Xinjiang, Heilongjiang, and Jiangsu presented more pronounced net outflows of water resources. Xinjiang, which represents the water-scarce western region of China, may further aggravate local water scarcity issues because of its significant outflow of virtual water from the agricultural sector. This phenomenon may be related to Xinjiang’s developed crop cultivation and animal husbandry methods, with wheat, cotton, and corn being the main crops that rely heavily on irrigation, accounting for more than 90% of the total water use [39]. These industries not only require substantial water resources for irrigation and breeding but also for further processing, increasing water consumption. Additionally, the export of agricultural and sideline products in Xinjiang’s trade structure has led to a significant outflow of virtual water, potentially adversely affecting local agricultural water use, especially for the production of food crops. Heilongjiang, as a major grain production base and the largest net exporter of grain in China, has relatively abundant water resources, but compared with other grain-exporting provinces such as Henan and Jilin, its net outflow remains substantial. This indicates that while Heilongjiang has sufficient water resources, there is room for improvement in water-saving technologies in agricultural production. Jiangsu Province, which is located in the eastern coastal region of China and has flatlands and low hills suitable for agriculture and forestry, encourages the production of high-value crops such as fruits, vegetables, and flowers, making it an important exporter of virtual water in the Yangtze River Delta region [40]. The net outflow of virtual water from Jiangsu’s agricultural sector far exceeds that of neighboring Zhejiang, Shanghai, and Anhui, reflecting the need for improved water balance and optimal water resource allocation in Jiangsu. The net outflow of water resources in the agricultural sector is closely related to the region’s agricultural structure, trade patterns, and water resource management strategies. To mitigate the risks of water scarcity, a comprehensive consideration of these factors and the adoption of corresponding water-saving measures and optimal water resource allocation strategies are necessary.
To explore the relationship between virtual water trade and regional natural water resource endowments and analyze the phenomenon of spatial mismatch, this study constructs a four-quadrant diagram based on the total water resources and net virtual water flows for each province in China. Specifically, the analysis uses the national median of total water resources (69.93 billion m3) and a net virtual water flow of zero as benchmarks, which enables the classification of China’s 31 provinces into four distinct categories. This classification allows for a clear identification of “spatial mismatch” cases that challenge conventional understanding.
Figure 8 illustrates the “spatial mismatch” phenomenon:
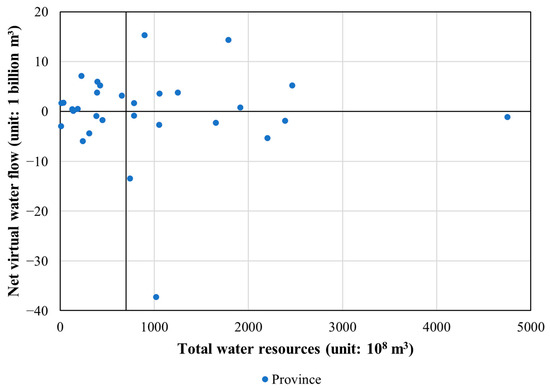
Figure 8.
Quadrant analysis of virtual water net flow and total water resources (unit: 108 m3) across provinces.
First Quadrant: Provinces in this category possess water resources above the national median but exhibit a net inflow of virtual water. This suggests that even regions with relatively abundant water resources import virtual water, indicating an inefficient allocation of resources and revealing a spatial mismatch.
Second Quadrant: Provinces in this quadrant are water scarce but achieve net inflows through virtual water trade. This outcome aligns with expectations, as cross-regional virtual water flows can partially mitigate the impacts of water scarcity, helping to alleviate the supply–demand imbalance between regions.
Third Quadrant: Provinces in this category are both water-scarce exporters and net exporters of virtual water. This finding contradicts the expected logic, as it implies that scarce water resources are further depleted through virtual water exports, exacerbating local water stress.
Fourth Quadrant: Provinces in this quadrant are water-abundant yet net exporters of virtual water. This result is consistent with conventional wisdom, as resource-rich regions typically function as net exporters in the regional division of labor, in alignment with their water resource endowments.
In summary, the provinces located in the second and fourth quadrants together illustrate the existence of a spatial mismatch between natural water resources and virtual water flows. Quantitative analysis further revealed that approximately 38.71% of all provinces exhibited such mismatches, accounting for 39.08% of the total national net virtual water flow. This highlights the widespread nature and significant impact of the mismatch. The identified pattern of spatial imbalance underscores the need for integrated cross-regional water management that considers economic linkages, industrial layouts, and regional water resource endowments to promote more rational and efficient water resource allocation.
4.3.3. Transmission Efficiency of Agricultural and Non-Agricultural Sectors in Key Provinces in the Virtual Water Trade Network
Closeness centrality is a key indicator used to measure the importance of nodes in a network. Figure 9 shows the closeness centrality of nodes of agricultural and non-agricultural sectors in the virtual water trade network of each province. In this study, the closeness centrality of nodes is used to represent the efficiency of virtual water transmission.
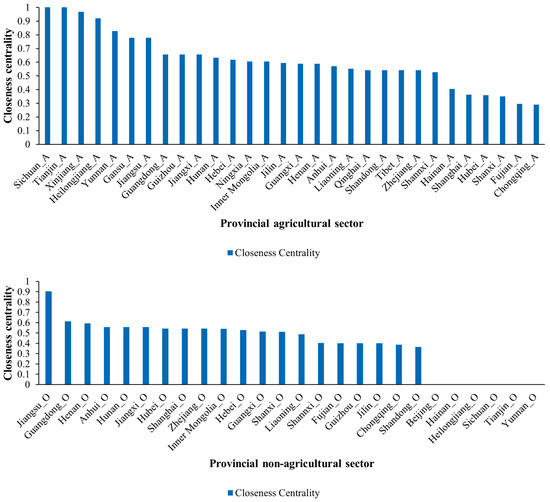
Figure 9.
Closeness Centrality of each provincial sector within the interprovincial virtual water trade network. This measure reflects the efficiency of each sector in exchanging virtual water with all other sectors in the network.
The closeness centrality values of the agricultural sectors of Sichuan, Tianjin, Xinjiang, Heilongjiang, and Yunnan and the non-agricultural sectors of Jiangsu are all above 0.8, indicating that the agricultural or non-agricultural sectors in these provinces can quickly transfer virtual water to the corresponding sectors in other provinces. Provinces with high closeness centrality have a clear advantage in virtual water transmission. These provinces can use their water resources more efficiently to meet the needs of other provinces through rapid virtual water transfer, thus improving the efficiency of water use across the network. The high closeness centrality of these provinces also provides an important reference for regional water resource management. Policymakers can consider using these provinces as the key nodes of virtual water transmission to improve the efficiency of water use in the whole region by optimizing water management at these nodes. However, provinces with high closeness centrality may also face challenges in economic and environmental terms. Rapid virtual water transfer may increase water stress in these provinces, so measures need to be taken to balance water supply and demand and ensure sustainable water use.
4.4. Sensitivity Analysis
To verify the robustness of this study’s core conclusions, we conducted a sensitivity analysis on threshold selection for the virtual water trade network. Beyond the 10.5% threshold adopted in the main study, we also selected two additional thresholds (9% and 12%) for comparative analysis, with the aim of examining the stability of network structural characteristics and key node identification.
As presented in Table 2, the analysis results show that the core indicators of the virtual water trade network remain highly stable at specific threshold levels of 9%, 10.5%, and 12%. First, topological structure indicators—including network density, average clustering coefficient, average shortest path length, and modularity—exhibit an extremely narrow range of variation. This finding indicates that the network constructed in this study remains relatively sparsely connected despite threshold changes, retains its “small-world” property, and shows no significant alterations in its community division structure. These observations thus confirm the rationality of the selected threshold.
Table 2.
Sensitivity analysis of key indicators of the virtual water trade network under different thresholds.
From a sectoral perspective, the average net virtual water flow of provinces in the agricultural sector remains consistently negative, whereas that of the non-agricultural sector remains consistently positive. This finding strongly supports the core conclusion that the agricultural sector functions as a net exporter of virtual water and that the non-agricultural sector functions as a net importer. This further verifies that this sectoral role assignment is not affected by threshold adjustments.
Most notably, the sensitivity analysis of key provincial rankings demonstrates exceptionally high robustness. Across all tested thresholds, Xinjiang, Heilongjiang, and Jiangsu consistently rank among the top three provinces in terms of net virtual water outflow in the agricultural sector; meanwhile, Jiangsu, Zhejiang, and Guangdong consistently hold the top three positions in terms of net virtual water inflow in the non-agricultural sector. This confirms that the identification of key nodes in the virtual water trade network—as conducted in this study—is reliable and stable and not susceptible to minor fluctuations in the data screening threshold.
The results of the sensitivity analysis indicate that the conclusions exhibit good robustness with respect to threshold selection. The 10.5% threshold setting is both reasonable and scientific and accurately reflects the core structure and characteristics of China’s interprovincial virtual water trade network.
5. Conclusions
This study employs the multiregional input–output method to estimate the virtual water flows between agricultural and non-agricultural sectors across 31 provinces and cities in China. Furthermore, this study uses complex network analysis to construct a binary perspective model of China’s virtual water trade network between agriculture and non-agriculture, and conducts an in-depth analysis of its overall and local structural characteristics. The main conclusions of this paper can be summarized as follows:
- The virtual water trade network has significant structural characteristics. The model constructed in this study reveals the complex virtual water flows between the interprovincial agricultural and non-agricultural sectors. Although the network structure is relatively sparse, it displays “small-world” properties, indicating a high transmission efficiency of virtual water between the interprovincial agricultural and non-agricultural sectors. However, to further optimize water resource management, it is necessary to increase the frequency of cooperation and the efficiency of information flow between nodes, providing potential intervention points for water resource management.
- Community structure analysis reveals regional and interregional economic connections and differences in water resource supply and demand. Within the virtual water trade network, several highly interconnected communities exist. Notably, Communities 4 and 10 have significant internal virtual water transfers, reflecting the substantial water demand of heavy industrial and agricultural provinces. Communities 4 and 1 are the main net exporters of virtual water, whereas Communities 10 and 2 are the main net importers. Identifying these key net exporting and importing communities allows for more targeted formulation and implementation of water resource management strategies to achieve efficient use and sustainable management of water resources.
- Regional differences in economic development levels, agriculture, and foreign trade structures may lead to spatial misalignment of water resources. In regions with relatively high levels of economic development but relatively scarce natural water resources (such as the Yangtze River Delta and the Pearl River Delta), these areas become the main net exporters of virtual water; conversely, regions with abundant water resources but limited arable land and dense populations rely more on external inputs to meet their needs. This phenomenon reveals the issue of spatial misalignment of water resources, where virtual water is transferred from water-scarce areas to areas with abundant water resources [41]. This misalignment provides a basis for formulating differentiated water resource management policies.
- The agricultural sector plays the role of a “reservoir” in virtual water trade. The agricultural sector generally acts as a net exporter of virtual water, whereas the non-agricultural sector often plays the role of a net importer. This pattern reveals the intrinsic link between the agricultural sector’s support for the development of the non-agricultural economy and the provision of water-intensive products. However, significant net exports of virtual water from agricultural sectors in certain provinces (such as Xinjiang, Heilongjiang, and Jiangsu) exacerbate local water shortages, which not only threaten local ecological balance but also pose challenges to long-term food security. Therefore, to ensure sustainable development, it is necessary to focus on optimizing agricultural structures and improving water resource efficiency to alleviate this issue while promoting the establishment of a more equitable and reasonable regional water resource allocation mechanism.
Considering the conclusions of the aforementioned study, the following policy recommendations can be derived:
- Implement differentiated water resource management strategies: Based on community structure analysis, key net exporters and importers of virtual water should be identified, and differentiated management strategies for these communities should be implemented. For example, for major net exporters such as Communities 4 and 1, stricter water resource quotas and water-saving technology promotion should be implemented. For net importers such as Communities 10 and 2, exploring the establishment of water resource compensation mechanisms could lead to more efficient use and sustainable management of water resources.
- The agricultural structure should be optimized, and water resource utilization efficiency should be improved. Given the “reservoir” role of the agricultural sector in virtual water trade, optimizing the agricultural structure and promoting water-saving agricultural technologies and crop cultivation to control the rational net export of virtual water are recommended [16]. Drawing upon this foundation, tailored governance strategies can be devised for provincial jurisdictions occupying pivotal positions within the virtual water trade network. As China’s preeminent grain production base, Heilongjiang assumes critical importance in safeguarding national food security through its virtual water flows [42]. Paradoxically, these substantial transfers simultaneously intensify regional hydrological stress. Consequently, while essential food security guarantees are maintained, strategic agricultural restructuring and enhanced irrigation efficiency should be implemented. With respect to Sichuan and Yunnan Provinces, their elevated closeness centrality within the virtual water network presents a unique opportunity to spearhead regional transitions toward water-conserving agricultural practices and ecologically sustainable industrial development [43]. By reinforcing their roles as virtual water network nexus points, these provinces can furnish reliable virtual water provisioning to adjacent regions, thereby optimizing both the operational efficiency and systemic resilience of the broader network.
- Explore the establishment of regional water resource trading markets. Investigate the mechanisms for the rational flow of water resources between different regions to achieve optimal allocation of water resources. Market mechanisms can more effectively allocate water resources and promote their efficient use. The literature has confirmed that water resource trading policies can significantly improve water resource use efficiency and promote regional green growth, especially in coastal areas, areas with strong water supply capabilities, water-rich areas, and areas implementing interregional water resource trading policies, where the effects of these policies are particularly significant [44,45].
Future research can further expand the findings of this study. For example, by introducing data over a longer time series, the long-term trends and cyclical changes in virtual water flows between agricultural and non-agricultural sectors can be analyzed. Additionally, in-depth analysis of specific agricultural products or industries can reveal detailed mechanisms of virtual water flows within those domains. Future studies could also extend our analytical framework to cross-national comparisons, particularly between developing and developed economies, to better understand how institutional, economic, and technological factors shape virtual water trade patterns. Moreover, building and improving risk assessment models for virtual water flows between agricultural and non-agricultural sectors to provide more precise risk warnings and decision support for water resource management is also an important direction for future research.
Author Contributions
Conceptualization, E.P. and T.W.; methodology, T.W.; software, S.M.; formal analysis, T.W.; data curation, S.M. and X.Y.; writing—original draft preparation, T.W.; writing—review and editing, S.M., X.Y., and E.P.; visualization, T.W.; supervision, E.P.; project administration, E.P. All authors have read and agreed to the published version of the manuscript.
Funding
This research received no external funding.
Data Availability Statement
The original China Multi-Regional Input–Output Table 2017 is available from Carbon Emission Accounts and Datasets (CEADs) at https://www.ceads.net/data/input_output_tables (accessed on 30 July 2025). The water usage data of each province derived from the “China Water Resources Bulletin 2017” are available from the Ministry of Water Resources of the People’s Republic of China at http://mwr.gov.cn/sj/tjgb/szygb/201811/P020220121619384021110.pdf (accessed on 30 July 2025). The authors confirm that critical data generated during this research are included in this article as tables and figures. Additional data will be made available upon reasonable request.
Conflicts of Interest
The authors declare no conflicts of interest.
Appendix A
Table A1.
Sector classification of the input–output table.
Table A1.
Sector classification of the input–output table.
| Category | Sector |
|---|---|
| Agricultural sector | Agriculture, Forestry, Animal Husbandry and Fishery |
| Non-agricultural sector | Mining and washing of coal |
| Extraction of petroleum and natural gas | |
| Mining and processing of metal ores | |
| Mining and processing of nonmetal and other ores | |
| Food and tobacco processing | |
| Textile industry | |
| Manufacture of leather, fur, feather and related products | |
| Processing of timber and furniture | |
| Manufacture of paper, printing and articles for culture, education and sports activities | |
| Processing of petroleum, coking, processing of nuclear fuel | |
| Manufacture of chemical products | |
| Manuf. of non-metallic mineral products | |
| Smelting and processing of metals | |
| Manufacture of metal products | |
| Manufacture of general-purpose machinery | |
| Manufacture of special-purpose machinery | |
| Manufacture of transport equipment | |
| Manufacture of electrical machinery and equipment | |
| Manufacture of communication equipment, computers and other electronic equipment | |
| Manufacture of measuring instruments | |
| Other manufacturing and waste resources | |
| Repair of metal products, machinery and equipment | |
| Production and distribution of electric power and heat power | |
| Production and distribution of gas | |
| Production and distribution of tap water | |
| Construction | |
| Wholesale and retail trades | |
| Transport, storage, and postal services | |
| Accommodation and catering | |
| Information transfer, software and information technology services | |
| Finance | |
| Real estate | |
| Leasing and commercial services | |
| Scientific research | |
| Polytechnic services | |
| Administration of water, environment, and public facilities | |
| Resident, repair and other services | |
| Education | |
| Health care and social work | |
| Culture, sports, and entertainment | |
| Public administration, social insurance, and social organizations |
Table A2.
Water consumption in agricultural and non-agricultural sectors across Chinese provinces (unit: 104 m3).
Table A2.
Water consumption in agricultural and non-agricultural sectors across Chinese provinces (unit: 104 m3).
| Province | Agricultural Sector | Non-Agricultural Sector |
|---|---|---|
| Beijing | 51,000 | 344,000 |
| Tianjin | 107,000 | 168,000 |
| Hebei | 1,261,000 | 555,000 |
| Shanxi | 455,000 | 294,000 |
| Inner Mongolia | 1,381,000 | 499,000 |
| Liaoning | 816,000 | 495,000 |
| Jilin | 898,000 | 369,000 |
| Heilongjiang | 3,164,000 | 367,000 |
| Shanghai | 167,000 | 881,000 |
| Jiangsu | 2,806,000 | 3,107,000 |
| Zhejiang | 809,000 | 986,000 |
| Anhui | 1,582,000 | 1,321,000 |
| Fujian | 912,000 | 1,008,000 |
| Jiangxi | 1,563,000 | 917,000 |
| Shandong | 1,340,000 | 755,000 |
| Henan | 1,228,000 | 1,110,000 |
| Hubei | 1,481,000 | 1,422,000 |
| Hunan | 1,937,000 | 1,332,000 |
| Guangdong | 2,203,000 | 2,132,000 |
| Guangxi | 1,958,000 | 891,000 |
| Hainan | 333,000 | 123,000 |
| Chongqing | 254,000 | 520,000 |
| Sichuan | 1,605,000 | 1,079,000 |
| Guizhou | 589,000 | 446,000 |
| Yunnan | 1,085,000 | 481,000 |
| Tibet | 269,000 | 45,000 |
| Shannxi | 582,000 | 348,000 |
| Gansu | 923,000 | 238,000 |
| Qinghai | 192,000 | 66,000 |
| Ningxia | 567,000 | 94,000 |
| Xinjiang | 5,144,000 | 379,000 |
References
- Guan, D.; Hubacek, K. Assessment of Regional Trade and Virtual Water Flows in China. Ecol. Econ. 2007, 61, 159–170. [Google Scholar] [CrossRef]
- Dalin, C.; Konar, M.; Hanasaki, N.; Rinaldo, A.; Rodriguez-Iturbe, I. Evolution of the Global Virtual Water Trade Network. Proc. Natl. Acad. Sci. USA 2012, 109, 5989–5994. [Google Scholar] [CrossRef]
- Guo, S.; Shen, G.Q.; Peng, Y. Embodied Agricultural Water Use in China from 1997 to 2010. J. Clean. Prod. 2016, 112, 3176–3184. [Google Scholar] [CrossRef]
- Statistical Communiqué of the People’s Republic of China on the 2023 National Economic and Social Development. Available online: https://www.stats.gov.cn/english/PressRelease/202402/t20240228_1947918.html (accessed on 27 October 2024).
- Zhu, X.; Li, Y.; Li, M.; Pan, Y.; Shi, P. Agricultural Irrigation in China. J. Soil Water Conserv. 2013, 68, 147A–154A. [Google Scholar] [CrossRef]
- Allan, J.A. Virtual Water: A Strategic Resource Global Solutions to Regional Deficits. Ground Water 1998, 36, 545–546. [Google Scholar] [CrossRef]
- Hoekstra, A.Y.; Hung, P.Q. Globalisation of Water Resources: International Virtual Water Flows in Relation to Crop Trade. Glob. Environ. Change 2005, 15, 45–56. [Google Scholar] [CrossRef]
- Hoekstra, R.; van den Bergh, J.C.J.M. Comparing Structural Decomposition Analysis and Index. Energy Econ. 2003, 25, 39–64. [Google Scholar] [CrossRef]
- Lin, C.; Suh, S.; Pfister, S. Does South-to-North Water Transfer Reduce the Environmental Impact of Water Consumption in China? J. Ind. Ecol. 2012, 16, 647–654. [Google Scholar] [CrossRef]
- Sun, S.; Fang, C. Factors Governing Variations of Provincial Consumption-Based Water Footprints in China: An Analysis Based on Comparison with National Average. Sci. Total Environ. 2019, 654, 914–923. [Google Scholar] [CrossRef]
- Qian, Y.; Tian, X.; Geng, Y.; Zhong, S.; Cui, X.; Zhang, X.; Moss, D.A.; Bleischwitz, R. Driving Factors of Agricultural Virtual Water Trade between China and the Belt and Road Countries. Environ. Sci. Technol. 2019, 53, 5877–5886. [Google Scholar] [CrossRef]
- Zhang, Y.; Zhang, J.; Wang, C.; Cao, J.; Liu, Z.; Wang, L. China and Trans-Pacific Partnership Agreement Countries: Estimation of the Virtual Water Trade of Agricultural Products. J. Clean. Prod. 2017, 140, 1493–1503. [Google Scholar] [CrossRef]
- Tian, X.; Sarkis, J.; Geng, Y.; Qian, Y.; Gao, C.; Bleischwitz, R.; Xu, Y. Evolution of China’s Water Footprint and Virtual Water Trade: A Global Trade Assessment. Environ. Int. 2018, 121, 178–188. [Google Scholar] [CrossRef]
- Zhang, Y.; Zhang, J.; Tang, G.; Chen, M.; Wang, L. Virtual Water Flows in the International Trade of Agricultural Products of China. Sci. Total Environ. 2016, 557–558, 1–11. [Google Scholar] [CrossRef]
- Cai, B.; Zhang, W.; Hubacek, K.; Feng, K.; Li, Z.; Liu, Y.; Liu, Y. Drivers of Virtual Water Flows on Regional Water Scarcity in China. J. Clean. Prod. 2019, 207, 1112–1122. [Google Scholar] [CrossRef]
- Sun, S.; Wang, Y.; Engel, B.A.; Wu, P. Effects of Virtual Water Flow on Regional Water Resources Stress: A Case Study of Grain in China. Sci. Total Environ. 2016, 550, 871–879. [Google Scholar] [CrossRef] [PubMed]
- Zhang, F.; Jin, G.; Liu, G. Evaluation of Virtual Water Trade in the Yellow River Delta, China. Sci. Total Environ. 2021, 784, 147285. [Google Scholar] [CrossRef] [PubMed]
- Zhao, X.; Yang, H.; Yang, Z.; Chen, B.; Qin, Y. Applying the Input-Output Method to Account for Water Footprint and Virtual Water Trade in the Haihe River Basin in China. Environ. Sci. Technol. 2010, 44, 9150–9156. [Google Scholar] [CrossRef] [PubMed]
- Zhi, Y.; Yang, Z.; Yin, X.; Hamilton, P.B.; Zhang, L. Using Gray Water Footprint to Verify Economic Sectors’ Consumption of Assimilative Capacity in a River Basin: Model and a Case Study in the Haihe River Basin, China. J. Clean. Prod. 2015, 92, 267–273. [Google Scholar] [CrossRef]
- Chen, W.; Wu, S.; Lei, Y.; Li, S. China’s Water Footprint by Province, and Inter-Provincial Transfer of Virtual Water. Ecol. Indic. 2017, 74, 321–333. [Google Scholar] [CrossRef]
- Deng, J.; Li, C.; Wang, L.; Yu, S.; Zhang, X.; Wang, Z. The Impact of Water Scarcity on Chinese Inter-Provincial Virtual Water Trade. Sustain. Prod. Consum. 2021, 28, 1699–1707. [Google Scholar] [CrossRef]
- Fu, Y.; Zhao, J.; Wang, C.; Peng, W.; Wang, Q.; Zhang, C. The Virtual Water Flow of Crops between Intraregional and Interregional in Mainland China. Agric. Water Manag. 2018, 208, 204–213. [Google Scholar] [CrossRef]
- Ali, Y.; Pretaroli, R.; Socci, C.; Severini, F. Carbon and Water Footprint Accounts of Italy: A Multi-Region Input-Output Approach. Renew. Sustain. Energy Rev. 2018, 81, 1813–1824. [Google Scholar] [CrossRef]
- Chen, W.; Wu, S.; Lei, Y.; Li, S. Virtual Water Export and Import in China’s Foreign Trade: A Quantification Using Input-Output Tables of China from 2000 to 2012. Resour. Conserv. Recycl. 2018, 132, 278–290. [Google Scholar] [CrossRef]
- Mubako, S.; Lahiri, S.; Lant, C. Input–Output Analysis of Virtual Water Transfers: Case Study of California and Illinois. Ecol. Econ. 2013, 93, 230–238. [Google Scholar] [CrossRef]
- Konar, M.; Dalin, C.; Suweis, S.; Hanasaki, N.; Rinaldo, A.; Rodriguez-Iturbe, I. Water for Food: The Global Virtual Water Trade Network. Water Resour. Res. 2011, 47, W05520. [Google Scholar] [CrossRef]
- Fang, D.; Chen, B. Ecological Network Analysis for a Virtual Water Network. Environ. Sci. Technol. 2015, 49, 6722–6730. [Google Scholar] [CrossRef]
- Deng, G.; Lu, F.; Wu, L.; Xu, C. Social Network Analysis of Virtual Water Trade among Major Countries in the World. Sci. Total Environ. 2021, 753, 142043. [Google Scholar] [CrossRef]
- Wang, J.; Konar, M.; Dalin, C.; Liu, Y.; Stillwell, A.S.; Xu, M.; Zhu, T. Economic and Virtual Water Multilayer Networks in China. J. Clean. Prod. 2022, 381, 135041. [Google Scholar] [CrossRef]
- Leontief, W.; Strout, A. Multiregional Input-Output Analysis. In Structural Interdependence and Economic Development; Barna, T., Ed.; Palgrave Macmillan: London, UK, 1963; pp. 119–150. ISBN 978-1-349-81636-1. [Google Scholar]
- Leontief, W.W. Quantitative Input and Output Relations in the Economic Systems of the United States. Rev. Econ. Stat. 1936, 18, 105. [Google Scholar] [CrossRef]
- Ministry of Water Resources of the People’s Republic of China. China Water Resources Bulletin 2017; 2018. Available online: http://mwr.gov.cn/sj/tjgb/szygb/201811/P020220121619384021110.pdf (accessed on 30 July 2025).
- Wasserman, S.; Faust, K. Social Network Analysis: Methods and Applications, 1st ed.; Cambridge University Press: Cambridge, UK, 1994; ISBN 978-0-521-38707-1. [Google Scholar]
- Lambiotte, R.; Delvenne, J.-C.; Barahona, M. Random Walks, Markov Processes and the Multiscale Modular Organization of Complex Networks. IEEE Trans. Netw. Sci. Eng. 2014, 1, 76–90. [Google Scholar] [CrossRef]
- Jiang, M.; Gao, X.; Guan, Q.; Hao, X.; An, F. The Structural Roles of Sectors and Their Contributions to Global Carbon Emissions: A Complex Network Perspective. J. Clean. Prod. 2019, 208, 426–435. [Google Scholar] [CrossRef]
- Freeman, L.C. Centrality in Social Networks Conceptual Clarification. Soc. Netw. 1978, 1, 215–239. [Google Scholar] [CrossRef]
- Zheng, H.; Bai, Y.; Wei, W.; Meng, J.; Zhang, Z.; Song, M.; Guan, D. Chinese Provincial Multi-Regional Input-Output Database for 2012, 2015, and 2017. Sci. Data 2021, 8, 244. [Google Scholar] [CrossRef] [PubMed]
- Yan, X.; Jeub, L.G.S.; Flammini, A.; Radicchi, F.; Fortunato, S. Weight Thresholding on Complex Networks. Phys. Rev. E 2018, 98, 042304. [Google Scholar] [CrossRef]
- Fan, M.; Xu, J.; Chen, Y.; Li, D.; Tian, S. How to Sustainably Use Water Resources—A Case Study for Decision Sup-port on the Water Utilization of Xinjiang, China. Water 2020, 12, 3564. [Google Scholar] [CrossRef]
- Yang, Y.; Tian, G.; Li, J.; Sun, Z. Evolution of Spatiotemporal Pattern of Virtual Water in the Yangtze River Economic Belt. Ecol. Indic. 2024, 161, 111967. [Google Scholar] [CrossRef]
- Sun, S.; Wu, P.; Wang, Y.; Zhao, X. The Virtual Water Content of Major Grain Crops and Virtual Water Flows between Regions in China. J. Sci. Food Agric. 2013, 93, 1427–1437. [Google Scholar] [CrossRef] [PubMed]
- Sun, J.; Sun, S.; Yin, Y.; Wang, Y.; Zhao, X.; Wu, P. Evaluating Grain Virtual Water Flow in China: Patterns and Drivers from a Socio-Hydrology Perspective. J. Hydrol. 2022, 606, 127412. [Google Scholar] [CrossRef]
- Zhang, Y.; Fang, J.; Wang, S.; Yao, H. Energy-Water Nexus in Electricity Trade Network: A Case Study of Interprovincial Electricity Trade in China. Appl. Energy 2020, 257, 113685. [Google Scholar] [CrossRef]
- Chen, S.; Cao, Y.; Li, J. The Effect of Water Rights Trading Policy on Water Resource Utilization Efficiency: Evidence from a Quasi-Natural Experiment in China. Sustainability 2021, 13, 5281. [Google Scholar] [CrossRef]
- Pan, J.; Peng, J.; Yang, X.; Xuan, S. Does Water Rights Trading Promote Resources Utilisation Efficiency and Green Growth? Evidence from China’s Resources Trading Policy. Resour. Policy 2023, 86, 104235. [Google Scholar] [CrossRef]
Disclaimer/Publisher’s Note: The statements, opinions and data contained in all publications are solely those of the individual author(s) and contributor(s) and not of MDPI and/or the editor(s). MDPI and/or the editor(s) disclaim responsibility for any injury to people or property resulting from any ideas, methods, instructions or products referred to in the content. |
© 2025 by the authors. Licensee MDPI, Basel, Switzerland. This article is an open access article distributed under the terms and conditions of the Creative Commons Attribution (CC BY) license (https://creativecommons.org/licenses/by/4.0/).