The main stakeholders involved in the operation of the aquatic product traceability system are the government, fishers, and consumers. The behaviors of these stakeholders in engaging with the traceability system are characterized by incomplete information and bounded rationality, which makes evolutionary game theory a suitable tool for analysis in such contexts. Evolutionary game theory integrates insights from classical game theory and biological evolution, with participants assumed to have bounded rationality. Using dynamic analysis, it incorporates various factors that influence participants’ behavior into the model. The aim is to examine the evolutionary trends of collective behavior from a system dynamics perspective. This approach studies how participants continuously learn, experiment, and search for optimal strategies in the game, ultimately identifying their evolutionary stable strategies (ESS) and achieving equilibrium in the game.
In the following sections, four evolutionary game models will be constructed to analyze the equilibrium of the game among the stakeholders involved in the operation of the system and the determining factors behind it. The next steps for government policy will be inferred, and corresponding policy recommendations will be proposed.
3.1. Evolutionary Game Analysis of Fishers’ and Government’s Behavior in the Aquatic Product Traceability System Operation
The evolutionary game model considers fishers (referring to those operating aquatic product traceability systems) and the government as the behavioral agents. The objective is to analyze the policy choices and response strategies of the government and fishers within the system, as well as the determining factors influencing these choices. The strategy space for fishers consists of (operating, not operating) the traceability system, while the government’s strategy space consists of (promoting, not promoting) the system. Suppose the probability that fishers choose to operate the traceability system is
x (0 ≤
x ≤ 1), and the probability of not operating is 1 −
x (0 ≤
x ≤ 1). Similarly, the probability that the government chooses to support the construction of the traceability system is
y (0 ≤
y ≤ 1), and the probability of not supporting it is 1 −
y (0 ≤
y ≤ 1). If the government promotes the construction of the traceability system but the fishers choose not to operate it, the fishers cannot obtain the additional benefits provided by the system, resulting in a net revenue of 0 for them. The government’s revenue is also 0, but it incurs a construction cost
C, leading to a net loss of −−
C for the government. When the government supports the construction of the traceability system and the fishers choose to operate it, the revenue per kilogram of sales is
p, and if the sales volume is
k, the total revenue is
pk. In this case, the government gains a social benefit
E, but it also incurs costs related to policy formulation, legal regulations, and platform construction, denoted as
M. Thus, the government’s net revenue is
M −
C. If the government does not promote the operation of the traceability system, but fishers choose to operate it, they must bear the costs of equipment upgrades and online data entry, which are denoted as
I. Since there is no government support through incentives or platform facilitation, the revenue obtained by fishers will be lower than when the government actively promotes the system. The fishers’ revenue in this case can be expressed as
jpk −
I, where 0 ≤
j ≤ 1. When the government does not promote the construction of the traceability system, it does not incur any costs. However, if fishers still choose to operate the system, their actions generate social benefits for the government, such as improved food safety governance, enhanced public health outcomes, and strengthened international trade credibility. Since there are no incentive policies or supportive measures, the sales volume in this scenario is expected to be lower than when the government actively promotes the system. Consequently, the government’s social benefits will also be lower, represented as a proportion of the government’s benefits under the promotion scenario, denoted as
r(
M −
C), where 0 ≤
r ≤ 1. To correspond with the fishers’ revenue, this can also be expressed as
lM −
C, where 0 ≤
l ≤ 1. If neither the government promotes the system nor the fishers operate it, both parties receive a revenue of 0. In this paper, unless otherwise specified, all parameters representing benefits and costs are assumed to be positive. Based on the above assumptions, the payoff matrix for the evolutionary game between fishers and the government is constructed, as shown in
Table 2.
To facilitate calculations,
Table 2 is simplified into
Table 3, with the corresponding relationships as shown below:
From
Table 3, the expected revenue for fishers choosing to operate the traceability system is as follows:
The revenue for choosing not to operate the traceability system is as follows:
Therefore, the average revenue for fishers is as follows:
The replicator dynamic equation for fishers choosing to operate the traceability system is as follows:
Similarly, the expected benefit for the government choosing to support the traceability system construction is as follows:
The expected benefit for the government choosing not to support the traceability system construction is as follows:
The average benefit for the government is as follows:
The dynamic equation for the government’s strategy of supporting the traceability system is as follows:
Let F(x) = 0 and F(y) = 0 hold simultaneously, the stable points of x are ,, ; the stable points of y are , , .
The local equilibrium points are derived as: (0,0), (0,1), (1,0), (1,1), and ().
Next, we verify the stability of the above local equilibrium points by constructing the Jacobian matrix:
The determinant and trace of the Jacobian matrix are as follows:
According to Friedman’s theory [
21], if the following conditions hold
,
, then the point (
,
) is a stable equilibrium point, corresponding to the equilibrium strategy. Otherwise, it is not an equilibrium strategy. The stability of equilibrium points is summarized in
Table 4.
For ease of calculation,
Table 4 has been simplified as
Table 5, and the corresponding results are shown in
Table 5, For the point (0, 0), when
I >
jpk,
det.J > 0; when
I >
jpk −
C,
tr.J < 0. Therefore, if
I >
jpk, (0, 0) is a stable point; if
I <
jpk −
C, (0, 0) is not a stable point. For the point (0, 1), when
I <
pk,
det.J > 0; when
I >
pk +
C,
tr.J < 0. Since
pk +
C > pk, the equilibrium condition cannot be satisfied, meaning (0, 1) is not a stable point. For the point (1, 0), when I > jpk,
det.J > 0; when
I < jpk −
M +
lM,
tr.J < 0. However, since
jpk −
M +
lM < jpk, the equilibrium condition cannot be satisfied, so (1, 0) is not a stable point. For the point (1, 1), when
I < pl,
det.J > 0; when
I < pk +
M −
Ml,
tr.J < 0. Therefore, if
I < pk, (1, 1) is a stable point; if
I > pk +
M −
Ml, (1, 1) is not a stable point. For the point (
x3,
y3),
tr.J = 0, meaning (
x3,
y3) is a saddle point or a center point.
In conclusion, when I > jpk, the final equilibrium of the game between fishers and the government is (not operating, not promoting); while when I < pk, the final equilibrium of the game between fishers and the government is (operating, promoting). It can be seen that the construction cost I of the fishery traceability system and the sales revenue pk of fishers have a significant impact on the equilibrium of the game. As long as the construction cost for fishers to operate the traceability system is low enough, and the sales revenue is high enough, the equilibrium of (operating, promoting) will appear, and the equilibrium of (not operating, not promoting) will not appear. In this case, the government will choose to promote the flow, and the fishers will choose to operate the traceability system. Therefore, when fishers and the government cooperate to support the traceability system, both parties’ benefits will be optimal. Reducing the construction costs for both fishers and the government, and increasing fishers’ revenue (mainly through increased sales volume), will be key directions for the future widespread implementation of the traceability system in the aquatic products industry and its transformation.
Figure 1 illustrates the evolutionary game equilibrium analysis between government support and fishers’ participation in the traceability system. As government support increases, fishers’ participation probability also rises, indicating the significant impact of policy support on participation. The stable equilibrium points (such as (0, 0) and (1, 1)) represent the potential steady-state strategies between the government and fishers. The dashed lines highlight key equilibrium conditions, revealing critical points at which policy interventions may trigger strategic changes. Overall, the chart suggests that effective government policies can encourage fishers’ participation, leading to a stable and sustainable system.
3.2. Evolutionary Game Analysis of Fishers and Consumers in the Operation of the Aquatic Product Traceability System
This evolutionary game model involves two key participants: fishers and aquatic product consumers, and aims to analyze the strategic interactions between them in the aquatic product sales process. The strategy space of fishers is (traceable, non-traceable), and the strategy space of consumers is (buy traceable, do not buy traceable). The probability that a consumer chooses to buy traceable aquatic products is
x(0 ≤
x ≤ 1), and the probability of not buying traceable aquatic products is 1 −
x. The probability that a fisherman chooses to sell traceable aquatic products is
y(0 ≤
y ≤ 1), and the probability of selling non-traceable aquatic products is 1 −
y. The value of
x is influenced by factors such as consumers’ concerns about food safety, their perception of product quality, and their willingness to pay a premium for traceability, all of which shape their expected utility from purchasing traceable products [
40].
The fisherman’s revenue depends on the weight of the aquatic products k and the per kilogram sales revenue k, so the total revenue is kr. At the same time, there are transaction costs associated with selling aquatic products, such as transportation and storage costs, which are denoted as d. The consumer’s revenue depends on the weight m of the purchased aquatic products and their actual value t, so the total revenue is kv. The consumer’s costs include the aquatic product fee paid to the fisherman, kr, and other transaction costs such as transportation fees and time costs, which are represented as d.
When both the fisherman and the consumer cooperate by choosing to sell and buy traceable aquatic products, the traceable product transaction is completed. In this case, the fisherman’s net income is
kr −
t, and the consumer’s net benefit is
kv −
kr −
d. If one party adopts a non-cooperative strategy, meaning one chooses to sell or buy traceable products while the other does not, the traceable product transaction cannot be completed. The non-cooperative party gains neither revenue nor incurs any costs, so their net benefit is 0. On the other hand, the party that attempts to buy or sell traceable products but cannot complete the transaction will incur storage fees, transportation costs, etc., but will not earn any revenue from the transaction, thus resulting in negative net benefits of −
d or −
t. When both parties choose non-cooperation, neither party gains any revenue nor incurs any costs, and their net benefits are both 0. Based on the above assumptions, the payoff matrix between consumers and fishers in the game is constructed as shown in
Table 6.
From
Table 6, the expected benefit for consumers choosing to purchase traceable aquatic products is as follows:
The expected benefit for consumers choosing not to purchase traceable aquatic products is as follows:
Therefore, the average benefit for consumers is the following:
The replicator dynamic equation for consumers choosing to purchase traceable aquatic products is as follows:
Similarly, the expected benefit for fishers choosing to operate the traceability system is as follows:
The expected benefit for fishers choosing not to cooperate is the following:
Therefore, the average benefit for fishers is the following:
The replicator dynamic equation for fishers choosing to operate the traceability system is as follows:
By setting F(x) = 0 and F(y) = 0 simultaneously, the stable points for x and y are obtained as follows:
x stable point: ; y stable point: , . Thus, the local equilibrium points are (0, 0), (0, 1), (1, 0), (1, 1), .
Next, we verify the stability of these five local equilibrium points by constructing the Jacobian matrix:
The determinant and trace of the Jacobian matrix are expressed as follows:
According to Friedman’s theory, if
det.J > 0 and
tr.J < 0, then the point (
x,
y) is a stable equilibrium point, meaning the corresponding strategy is an evolutionarily stable equilibrium strategy. Otherwise, it is not an equilibrium strategy. The stability assessment of equilibrium points is summarized in
Table 7.
For the point (0, 0), since det.J > 0 and tr.J < 0, the point (0, 0) satisfies the stability conditions, meaning that (0, 0) is a stable evolutionary equilibrium solution.
For the point (0, 1), the condition for det.J > 0 is a < kv − kr, while the condition for tr.J < 0 is a > kv − kr + t. However, it is clear that kv − kr + t > kv − kr, meaning that the equilibrium condition cannot be satisfied. Thus, (0, 1) is not a stable point.
For the point (1, 0), the condition for det.J > 0 is c < kr, while the condition for tr.J < 0 is t > kr + d. However, since kr + d > kr, the condition cannot be satisfied. Thus, (1, 0) is also an unstable point.
For the point (1, 1), when a < kv − kr and t < kr, then det.J > 0; and when a < kv − t, then tr.J < 0. Therefore, when a < kv − kr and c < kr, (1, 1) is a stable equilibrium point.
For the point (x3, y3), since tr J = 0, no equilibrium condition exists. Thus, (x3, y3) is not a stable point.
In conclusion, the game between consumers and fishers has two evolutionarily stable equilibrium solutions under specific conditions. When d > 0 and t > 0, the final equilibrium of the game between consumers and fishers is (not purchasing, not operating). However, when d < kv − kr and t < kr, the final equilibrium is (purchasing, operating). Here, a and c represent the transaction costs for consumers and fishers, respectively.
By analyzing these two equilibrium outcomes, it is evident that when the transaction costs for both parties are zero, the only stable equilibrium in the game is (purchasing, operating), meaning that both parties will choose to cooperate, thereby completing the transaction.
In reality, transaction costs always exist and can never be entirely eliminated. However, as long as transaction costs remain sufficiently low, the (purchasing, operating) equilibrium will consistently emerge as an evolutionarily stable strategy. Therefore, similar to the insights gained from the evolutionary game between fishers and the government in the construction of the system, reducing various transaction costs in the development of the traceability system will be a crucial policy choice for ensuring its successful implementation.
3.3. Evolutionary Game Analysis Between Fishers Operating the Traceability System and Other Fishers
This evolutionary game model considers two types of agents: fishers who are willing to operate the traceability system and other fishers. The objective is to analyze the game behavior, equilibrium, and influencing factors in the sales process of aquatic products, where fishers interact and learn from each other. “Other fishers” mainly refer to those who have not adopted the traceability system or other aquatic product distributors in the supply chain. Their decision-making process regarding whether to operate the traceability system differs from that of ordinary fishers in terms of influencing factors and sequence. In addition to competition dynamics, external incentives can significantly influence cooperative behavior among fishers. Government subsidies—such as for traceability equipment, certification, or training—can effectively lower the cost of system adoption. Moreover, policy mechanisms offering exclusive access to high-end or export markets for groups of fishers complying with traceability standards can enhance the benefits of collective action. These interventions help reduce the risk of strategic defection, improve perceived fairness, and foster the emergence of mutually beneficial cooperation as an evolutionarily stable outcome. Therefore, although both groups are fishers, a symmetric evolutionary game model is not used in this analysis. The strategy space for both fishers willing to operate the traceability system and other fishers is (operate, not operate). Suppose the probability that a fisher willing to operate the traceability system chooses to do so is
x (0 ≤
x ≤ 1), while the probability of not operating is 1 −
x. Similarly, the probability that other fishers choose to operate the traceability system is
y (0 ≤
y ≤ 1), while the probability of not operating is 1 −
y. The respective revenues for fishers willing to operate the traceability system and for other fishers are denoted as
T and
N. The total cost of system construction, legal consultation, and information search (i.e., transaction costs) is denoted as e for fishers willing to operate and f for other fishers. When both the willing fishers and other fishers choose to operate the traceability system, they enter into a competitive relationship, leading to lower revenues for both. Assume that their earnings are reduced to
a and
b proportions of the original revenue, respectively (where 0 ≤
a ≤
b ≤ 1). In this case, the net revenue of the fishers operating the traceability system is
aM −
e, and the net revenue of other fishers is
bR −
f (alternatively, it could be assumed that construction costs increase, but this representation is adopted for consistency with previous sections). When fishers willing to operate the traceability system choose to do so, while other fishers choose not to operate, there is no competition, allowing the operating fishers to capture all the revenue from traceable aquatic products. Their net revenue is
T −
e, after deducting the construction and transaction costs. Since the other fishers do not operate the traceability system, they neither gain revenue from traceable products nor incur any costs, so their net revenue is assumed to be 0. Similarly, when fishers willing to operate the traceability system choose not to operate, but other fishers choose to operate, the net revenue of the other fishers is
N −
f, while the willing fishers receive 0. When neither fisher is willing to operate the traceability system nor do other fishers choose to operate, both parties receive a net revenue of 0. Based on these assumptions, the evolutionary game payoff matrix between fishers willing to operate the traceability system and other fishers is constructed, as shown in
Table 8.
According to
Table 8, the expected payoff for fishers willing to operate the traceability system when choosing to operate is the following:
The expected payoff for choosing not to operate is as follows:
Therefore, the average payoff for operating the traceability system is as follows:
The replicator dynamic equation for the strategy of operating the traceability system among willing fishers is the following:
Similarly, the expected payoff for other fishers when choosing to operate is as follows:
The average payoff for other fishers is as follows:
The replicator dynamic equation for the strategy of operating the traceability system among other fishers is as follows:
Let F(x) = 0 and F(y) = 0 hold simultaneously, then the stable points for x are x₁ = 0, x2 = 1, ; the stable points for y are y₁ = 0, y2 = 1, .
From this, the local equilibrium points are (0, 0), (0, 1), (1, 0), (1, 1), and .
Next, we verify the stability of the five local equilibrium points by constructing the Jacobian matrix:
The determinant and trace of the Jacobian matrix are as follows:
According to Friedman’s idea, if
det.J > 0 and
tr.J > 0, the point (
x,
y) is a stable equilibrium point, and the corresponding strategy is a stable equilibrium strategy; otherwise, it is not an equilibrium strategy. The stability of the equilibrium points is determined as shown in
Table 9.
For the point (0, 0), when T < e and N < f, det.J > 0; and when T + N > e + f, tr.J < 0. Combining these two conditions, we conclude that when T < e and N < f, the stability condition is satisfied, and (0, 0) is a stable point.
For the point (0, 1), when e > aT and f < N, det.J > 0; and when aT − N < e − f, tr.J < 0. Combining these two conditions, we conclude that when e < aT and f > N, the stability condition is satisfied, and (0, 1) is a stable point.
For the point (1, 0), when T > e and f > bN, det.J > 0; and when T + f > bN + e, tr.J < 0. Combining these two conditions, we conclude that when T > e and f > bN, the stability condition is satisfied, and (1, 0) is a stable point.
For the point (1, 1), when e < aT and f < bT, det.J > 0; and when e + f > aT + bN, tr.J < 0. Combining these two conditions, we conclude that when e < aT and f < bN, the stability condition is satisfied, and (1, 1) is a stable point.
For the point (x3, y3), since tr.J = 0, there is no stability condition, so (x3, y3) is not a stable point.
In summary, the game between fishers willing to operate the traceability system and other fishers has four evolutionary equilibrium solutions under specific conditions: when
T <
e and
N <
f, the strategy pair (Not Operate, Not Operate) is an evolutionarily stable equilibrium; when
e >
aT and
f <
N, the pair (Not Operate, Operate) is an evolutionarily stable equilibrium; when
T >
e and
f >
bN, the pair (Operate, Not Operate) is an evolutionarily stable equilibrium; and when
e <
aT and
f <
bN, the pair (Operate, Operate) is an evolutionarily stable equilibrium. This shows that the final equilibrium outcome of the game depends on the relative magnitude of benefits and costs. Overall, only when the benefits of operating the traceability system outweigh the costs will operation become the optimal choice for both parties. In addition to competition dynamics, external incentives can significantly influence cooperative behavior among fishers. Government subsidies—such as for traceability equipment, certification, or training—can effectively lower the cost of system adoption. Moreover, policy mechanisms offering exclusive access to high-end or export markets for groups of fishers complying with traceability standards can enhance the benefits of collective action. These interventions help reduce the risk of strategic defection, improve perceived fairness, and foster the emergence of mutually beneficial cooperation as an evolutionarily stable outcome. The costs of operating the system include not only the expenses related to aquatic product sales but also the construction and maintenance costs of the traceability system, as well as the time costs associated with promoting it. The sale of traceable aquatic products results from bargaining between both parties in the transaction, but good infrastructure and a sound traceability system can provide more information and greater convenience, thereby reducing aquatic product expenditures and saving transaction costs. Therefore, the conclusion of this game is consistent with the previous two: facilitating the construction of traceability platforms and reducing query costs will be important policy options for the government to promote the development of traceability systems.
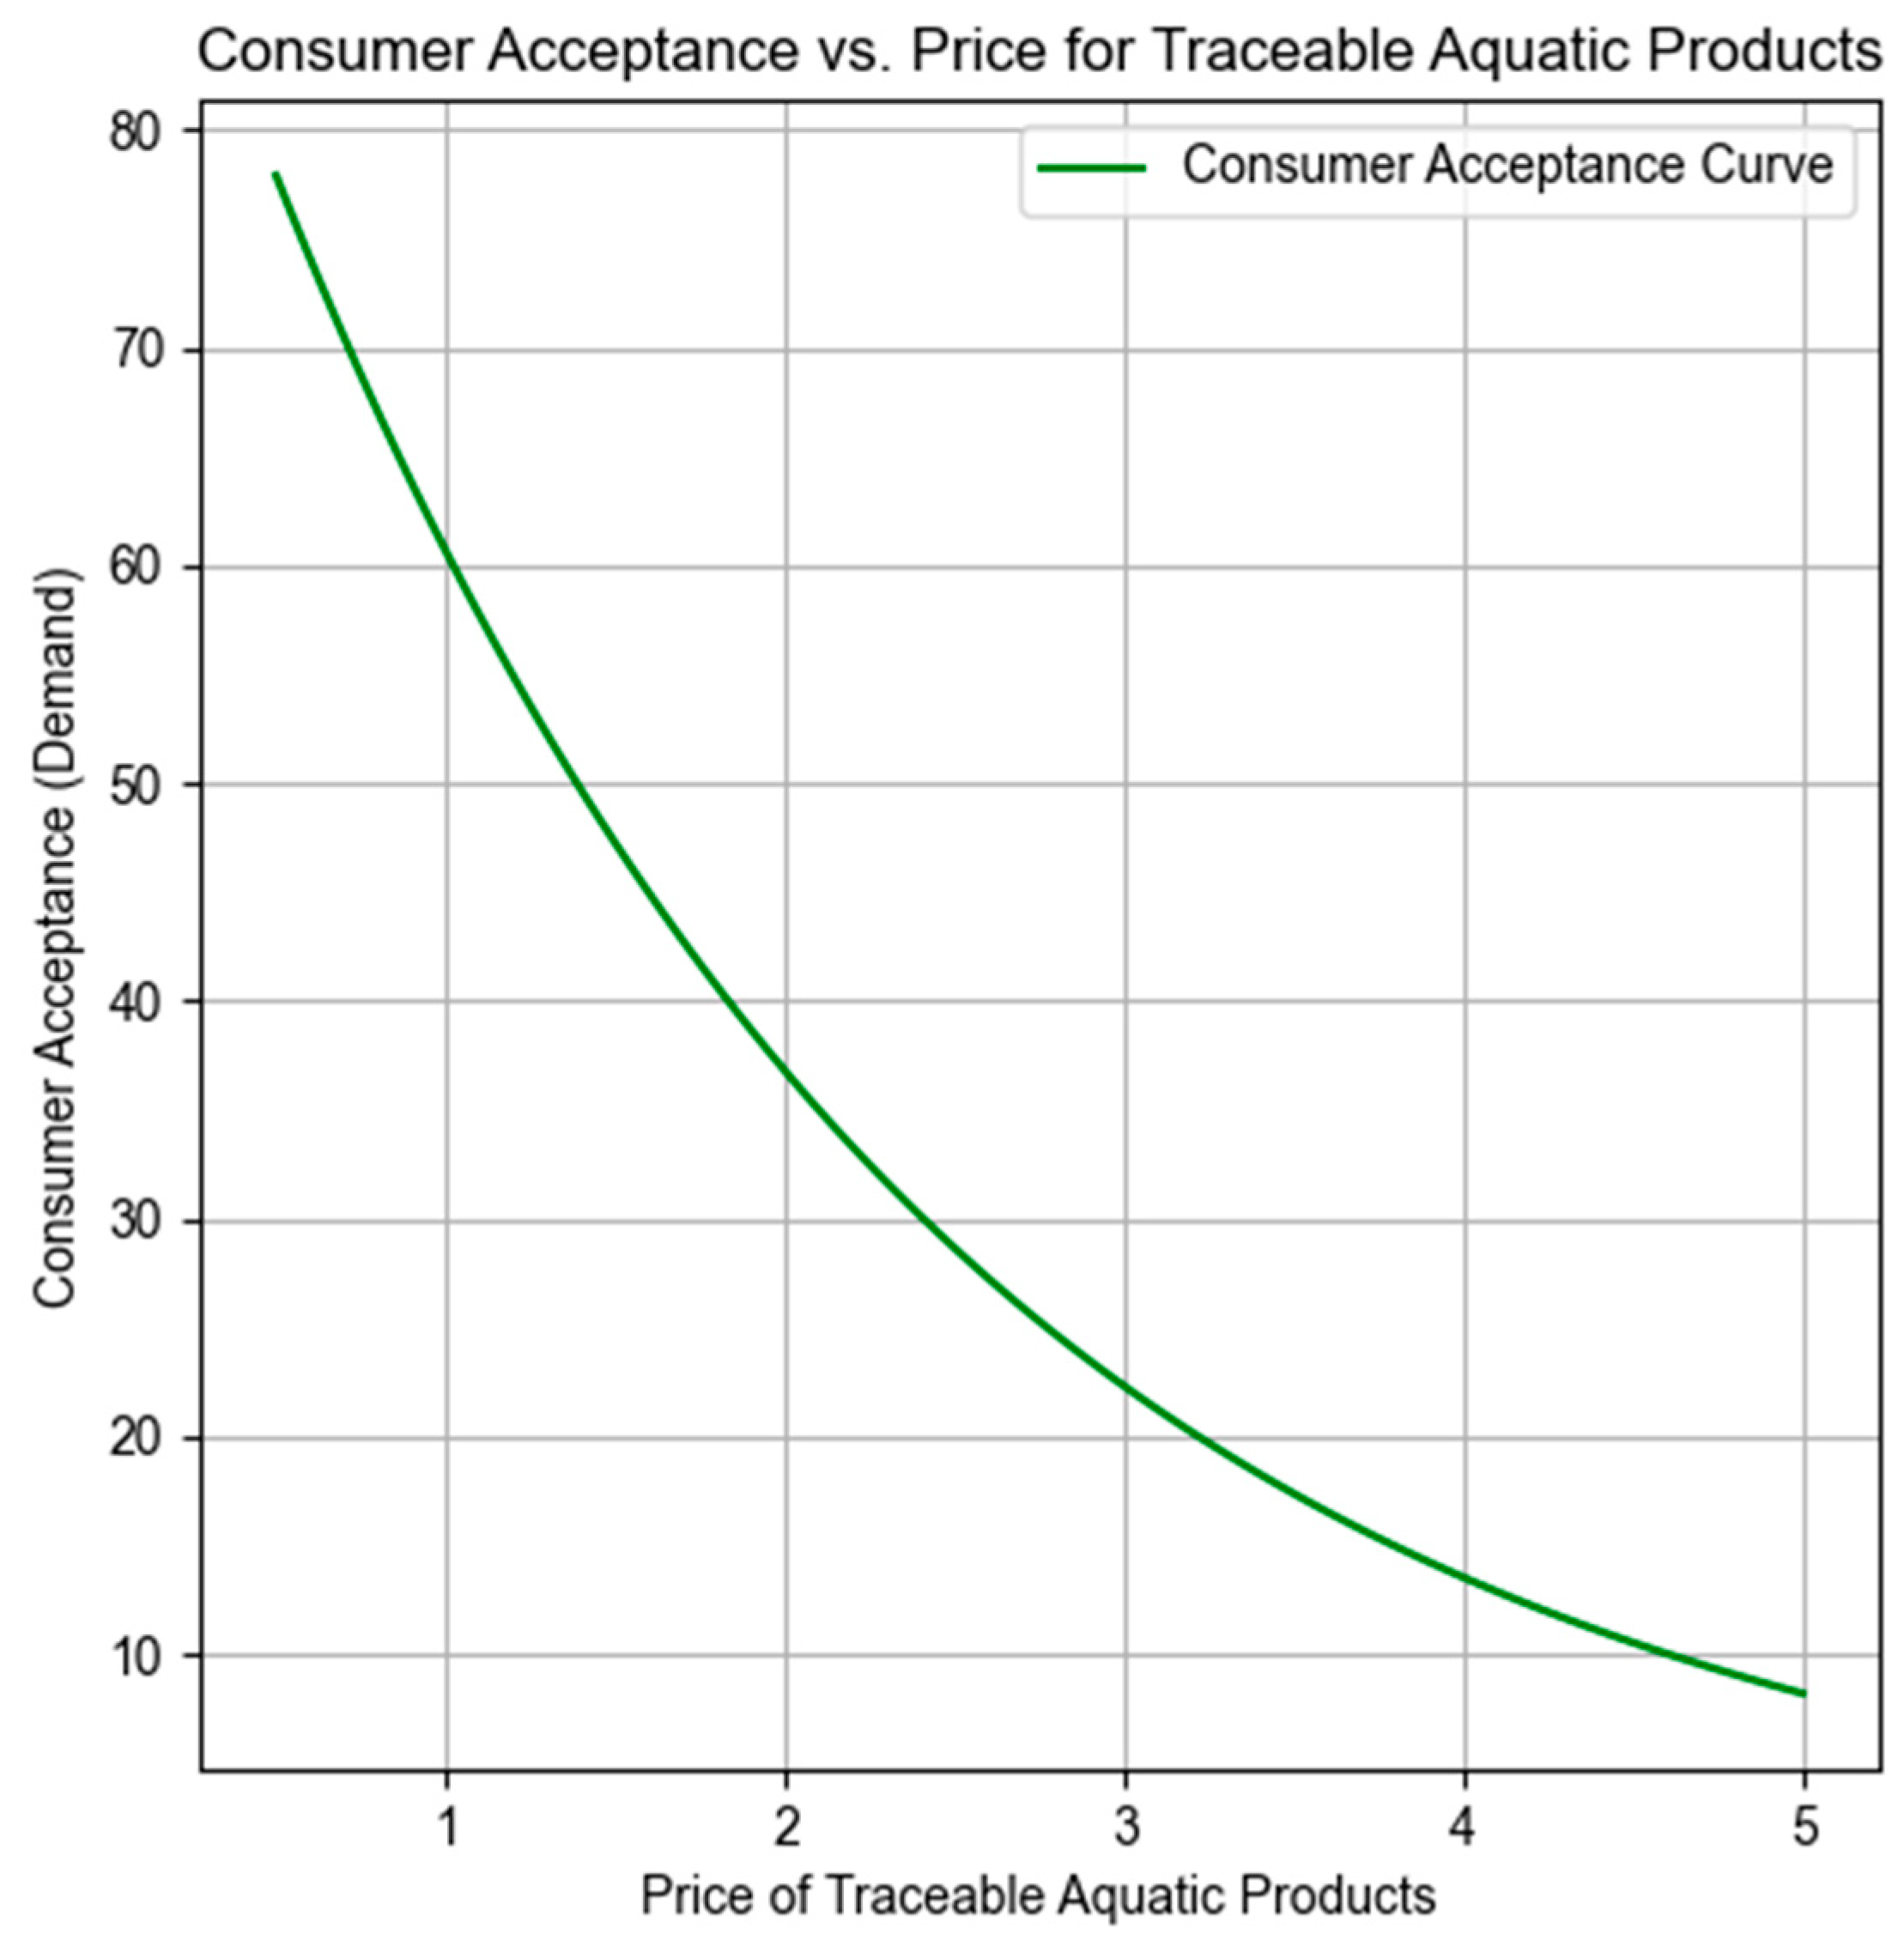
Figure 2 shows that consumer acceptance and the price for traceable aquatic products exhibit a generally inverse relationship, indicating a trend of opposite variation between the two.
3.4. Symmetric Evolutionary Game Analysis Between Consumers
This evolutionary game model considers Consumer 1 and Consumer 2 as the behavioral agents. Assuming both consumers have identical characteristics, the game is modeled as a symmetric evolutionary game, aiming to analyze how consumers influence and learn from each other, as well as to explore game behavior and equilibrium outcomes. The learning process is assumed to occur through social influence mechanisms such as word-of-mouth communication, peer behavior observation, and shared access to traceability-related information (e.g., product labels, certification platforms). These channels shape consumers’ perceived utility of traceable products and affect their probability of imitation, thereby driving the dynamic adjustment of strategy proportions in the population. The strategy space for both consumers is (Buy, Not Buy). Suppose the probability that both Consumer 1 and Consumer 2 choose to buy traceable aquatic products is
x (0 ≤
x ≤ 1), and the probability of not buying is 1 −
x. Both Consumer 1 and Consumer 2 receive a brand benefit E from purchasing traceable aquatic products, and the cost incurred during the purchase is g. When both consumers choose to buy, the psychological brand utility perceived by each is reduced due to the absence of exclusivity, as the symbolic value of traceable products diminishes when they are no longer perceived as scarce or status-enhancing goods. Their benefits are assumed to decrease to a proportion
w of the original value (0 ≤
w ≤ 1). In this case, both consumers’ net benefits are
wE −
g. When Consumer 1 chooses to buy and Consumer 2 does not, Consumer 1 gains the full benefit
E, minus the transaction cost
g, resulting in a net benefit of
E −
g. Since Consumer 2 does not make a purchase, there is no additional utility or cost, and thus the net benefit is assumed to be 0. Similarly, if Consumer 1 does not buy and Consumer 2 buys, Consumer 2’s net benefit is
E −
g, while Consumer 1’s is 0. If neither Consumer 1 nor Consumer 2 buys traceable aquatic products, both receive a net benefit of 0. Based on these assumptions, the payoff matrix for the game between consumers is constructed as shown in
Table 10.
According to the payoff matrix in
Table 10, the payoff for consumers who choose to purchase traceable aquatic products is as follows:
The payoff for not purchasing is as follows:
Therefore, the average payoff for consumers is as follows:
From this, the replicator dynamic equation for consumers choosing to purchase traceable aquatic products is as follows:
Let F(x) = 0, and the solutions to the above replicator dynamic equation are as follows: .
According to the stability principle of differential equations and the properties of evolutionarily stable strategies (ESS), when F(x*) < 0, x* is an evolutionarily stable strategy of the corresponding evolutionary game.
By solving the first derivative of
F(
x) with respect to
x, we obtain the following:
Substituting into the equation, we obtain the following:
. When E − g < 0, x₁* = 0 is an evolutionarily stable strategy. When g − wE < 0, x2* = 1 is an evolutionarily stable strategy. When g − E < 0 and wE − g < 0, that is, wE < g < E, then x3* is an evolutionarily stable strategy.
In summary, the game between consumers regarding the purchase of traceable aquatic products has three evolutionarily stable equilibrium solutions under certain conditions. When g > E, that is, when the benefit of purchasing is less than the cost, all consumers choosing not to purchase traceable aquatic products constitutes an evolutionarily stable equilibrium. When wE > g, meaning the purchase cost is lower than a certain proportion of the utility from not purchasing, all consumers choosing to purchase forms an evolutionarily stable equilibrium. When wE < g < E, a mixed strategy where consumers choose to purchase with a certain probability becomes an evolutionarily stable equilibrium. This implies that while traceable products offer some brand utility, the lack of exclusivity reduces their appeal, and not all consumers will consistently choose to purchase them. In practice, this equilibrium may be reflected in market segments where consumers alternate between traceable and non-traceable options depending on price, occasion, or perceived risk. For example, a consumer may purchase traceable seafood when shopping for family meals but switch to non-traceable options for casual or low-budget consumption. This reflects a coexistence of behavioral types, stabilizing the market at a probabilistic consumption level rather than full adoption. Moreover, the lower the purchase cost and the higher the benefit, the higher the proportion of consumers choosing to purchase in the equilibrium strategy. This indicates that reducing the cost associated with purchasing through the traceability system will strongly promote its adoption and widespread use.
Figure 3 illustrates the relationship between traceability costs and fishers’ profit, showing how profits decrease as costs rise. The shaded area under the curve emphasizes the impact of increasing traceability costs on profitability, with the orange color representing the magnitude of the profit at each cost level. This chart effectively highlights the negative effect of higher costs on fishers’ earnings, offering a clear visual representation of the cost-profit relationship.


