Article

Biological Production and Nitrogen Use Efficiency in a Water-Sharing and Water-Saving System Combining Aquaculture and Vegetable Hydroponic Cultivation

1
Organization for Research Promotion, Osaka Metropolitan University, Sakai 599-8531, Japan
2
Graduate School of Agriculture, Osaka Metropolitan University, Sakai 599-8531, Japan
3
Espec Mic Corporation, Osaka 530-8550, Japan
*
Author to whom correspondence should be addressed.
Water 2025, 17(7), 963; https://doi.org/10.3390/w17070963
Submission received: 1 February 2025 / Revised: 2 March 2025 / Accepted: 10 March 2025 / Published: 26 March 2025
(This article belongs to the Special Issue Aquaculture Productivity and Environmental Sustainability)

Abstract

:
Aquaponics, a biological production system that combines land-based aquaculture and hydroponic cultivation of plants, is a water-sharing and water-saving system that is expected to be a sustainable food production system with water and nutrient resource circulation in agricultural and fisheries fields. The balance among feeding, fish density, and plant absorption capacity was investigated to obtain fundamental data for sustainable aquaponic systems. To clarify the effects of feeding rates on biological production and nitrogen utilization efficiency, fish and plant growth performance and nitrogen flow were evaluated in an aquaponic system that combined loach aquaculture with lettuce hydroponic cultivation. Test groups with different feeding rates and different fish densities were set. As a result, the fertilizer components in loach excreta contributed to plant growth, and the growth rate of lettuce plants tended to be greater than that of control hydroponic cultivation without fish. However, there was no difference in lettuce growth at feeding rates of 0 to 2 g d−1/system, but above 2 g d−1/system, the growth of lettuce plants was suppressed due to an overload of excreta. The yield of loaches increased with increasing daily feeding rate per system, but a minimum feed conversion ratio was detected. The NO2 concentration increased with increasing daily feeding rate per system and amount of excreta. The nitrogen use efficiency did not change at feeding rates ranging from 0 to 1.5 g d−1/system. In this feeding rate range, 80% of NUE in aquaponics was due to NUE in the plant hydroponic cultivation subsystem. However, above 2 g d−1/system, nitrogen use efficiency decreased with increasing daily feeding rate per system. A feeding rate of approximately 1.5 g d−1/system maximized biological production while maintaining high nitrogen utilization efficiency. In conclusion, a balance among feeding, fish density, and plant absorption capacity is essential to maintain a sustainable aquaponic system for sustainable fish and plant production as a food production system, saving water and chemical fertilizer.

1. Introduction

In recent years, creating a recycling-based society has attracted attention as an effective measure to solve problems such as food and energy shortages and environmental degradation, which are global issues. In the fisheries industry, environmental pollution and the discharge of pollutants into natural waters due to high-density aquaculture, the accumulation of sludge and hypoxic water groups, and the generation of harmful substances, such as hydrogen sulfide, are problems. In the agricultural field, there are concerns about food and water resource shortages due to rapid population growth and a shortage of agricultural chemical fertilizers due to changes in social conditions. Therefore, technological development for sustainable food production by improving water use efficiency in agricultural production and reducing chemical fertilizers has become an urgent issue [1].
Aquaponics is expected to solve the abovementioned problems, partly as a sustainable production system with resource circulation in the agricultural and fisheries fields. Aquaponics is a biological production system that combines hydroponic cultivation of plants with land-based aquaculture of fish and shellfish. The water used by hydroponic and aquaculture subsystems can be shared, and cultivated plants can use substances harmful to fish and shellfish, such as inorganic salts contained in fish and shellfish excreta, as fertilizers [2,3]. Therefore, by reusing the nutrients in the fish and shellfish excreta originally derived from feed, the costs of providing chemical fertilizers for plant cultivation, purifying the circulating water for aquaculture, and treating the final wastewater can be significantly reduced compared to the cost of producing each subsystem separately [3]. In addition, water-sharing reduces the amount of water the entire system uses. Furthermore, waste residues such as aged leaves and roots generated during plant production can be recycled as feed for fish and shellfish. In other words, aquaponics is a biological production system that minimizes waste and is friendly to the ecosystem.
For the efficient and stable operation of an aquaponic system, it is important to understand the fertilizer components contained in the culture solution, as well as the fertilizer component loading rate derived from the residue of the fish feed and excreta and the absorption rate of the fertilizer components by the plants, and finally, to calculate the fertilizer component balance. In general, plant growth is suppressed if the amount of nutrients contained in the excreta of cultured fish is excessive or insufficient compared with the amount of nutrients required by plants. Previous studies have mainly focused on systems’ material balance and nutrient flow to solve this problem [4,5,6,7,8].
Nitrogen compounds are essential nutrients for plants. If they are deficient, plant growth is suppressed. On the other hand, if there is excess excreta or leftover food, ammonia and nitrite, which are nitrogen compounds harmful to living organisms, accumulate at high concentrations in the water, suppressing the growth of fish and plants. Therefore, understanding nitrogen dynamics in aquaponics is essential. Recently, there has been a demand for improving nitrogen use efficiency (NUE) in plant production to reduce the use of chemical fertilizers [9]. Therefore, research on the circulation of nitrogen compounds in aquaponics is essential [10].
In aquaponic systems, fish culture waste is used as fertilizer; thus, the nutrient balance in aquaculture affects the NUE of the entire system [11,12,13]. In addition, the balance structure is expected to differ depending on the feeding rate. In general, fish yields increase with increasing feeding rates. Because fertilizer components in waste contribute to plant growth, plant yield increases with increasing feeding rates and subsequent waste. On the other hand, the NUE of the system is thought to decrease due to the accumulation of organic nitrogen compounds contained in surplus feed and solid waste, such as nitrogen residues that plants cannot directly use. Therefore, increasing feeding rates increases biological production, but decreases NUE.
An increase in fertilizer derived from fish culture waste does not necessarily increase plant yield. Chemical fertilizers contain sufficient nutrients for plants; thus, heavy fertilization produces high yields. Fish culture waste contains different levels of nutrients from those required by plants, but it often lacks the specific nutrients plants need [14]. For example, the nitrogen compound ammonia is in excess in loach culture waste. At the same time, the relative contents of essential nutrients such as potassium, iron, and manganese are significantly lower than those of chemical fertilizers [8]. Therefore, excess substances harm fish and plants when the amount of waste produced from the feed increases. In contrast, plant growth is restricted when nutrient deficiencies continue to occur.
In aquaponics, fish culture waste is used as fertilizer for plants; thus, the amount of fertilizer applied to plants depends on the cultivation conditions. As mentioned above, biological production in aquaponics increases with increasing feeding rates, but NUE decreases. Many studies have investigated the NUE of plant production systems alone [9,15,16,17,18], but few have targeted the aquaponic system, including aquaculture [3]. In this study, we established test groups with different feeding rates. We investigated their biological production and NUE under each condition to obtain information on improving productivity and efficiency.
In aquaponics, tilapia fish are generally used, e.g., [19,20]. Tilapia is a freshwater fish of the Perciformes order with greater ammonia tolerance than rainbow trout and carp, e.g., [21], accounting for approximately 5% of the fish species farmed worldwide, e.g., [22]. However, in Australia, where aquaponics is popular, tilapia is restricted from being cultured as a fish species, which disrupts the ecosystem. Hence, Malay cod and barramundi (Asian sea bass) are cultured. Other reported fish species include carp, e.g., [23], channel catfish, e.g., [24], sturgeon, e.g., [25], giant river prawn, e.g., [26], and white-leg shrimp, e.g., [27]. In this study, loaches were used as the fish. Loach is a small freshwater fish that is a traditional food ingredient in Asia. Loach is 100% edible and highly nutritious [28]. It is also highly resistant to salt concentrations similar to those of plant-cultivation nutrient solutions, making it possible to cultivate it in water suitable for plant cultivation. In addition, loaches can breathe through their intestines, making them relatively resistant to dissolved oxygen deficiency. For this reason, loaches were selected as the fish species to be cultivated in this study. In addition to previous studies that focused mainly on medium- to large-sized fish, such as tilapia, carp, and catfish, loach culture experiments provide valuable data as an example of introducing small fish into aquaponics culturing fish in plant cultivation beds with growing roots. The system with small fish cultured in plant cultivation beds can reduce the water required at the beginning of production by almost half compared to systems that produce fish and plants separately.
The lettuce used in this study is a leafy vegetable widely cultivated in plant factories in Japan. Many studies on aquaponics using lettuce have been reported, e.g., [29,30]. Lettuce plants preferentially absorb ammonia, which is considered harmful in nutrient solution cultivation. Lettuce is suitable for systems such as aquaponics, where ammonia generated from fish culture waste is used as a fertilizer source.
This study aimed to clarify the effects of feeding rates on biological production and nitrogen utilization efficiency. Nutrient flow in aquaponics depends on the species of fish and plants combined and their respective growth stages, so research under various fish and plant combination conditions is necessary to obtain more general information [31]. This study used an aquaponic system that combined loach aquaculture with lettuce hydroponic cultivation. We set up test groups with different feeding rates to confirm that components derived from fish culture waste are useful as fertilizers for plant growth and to evaluate the flow of nitrogen compounds within the system.

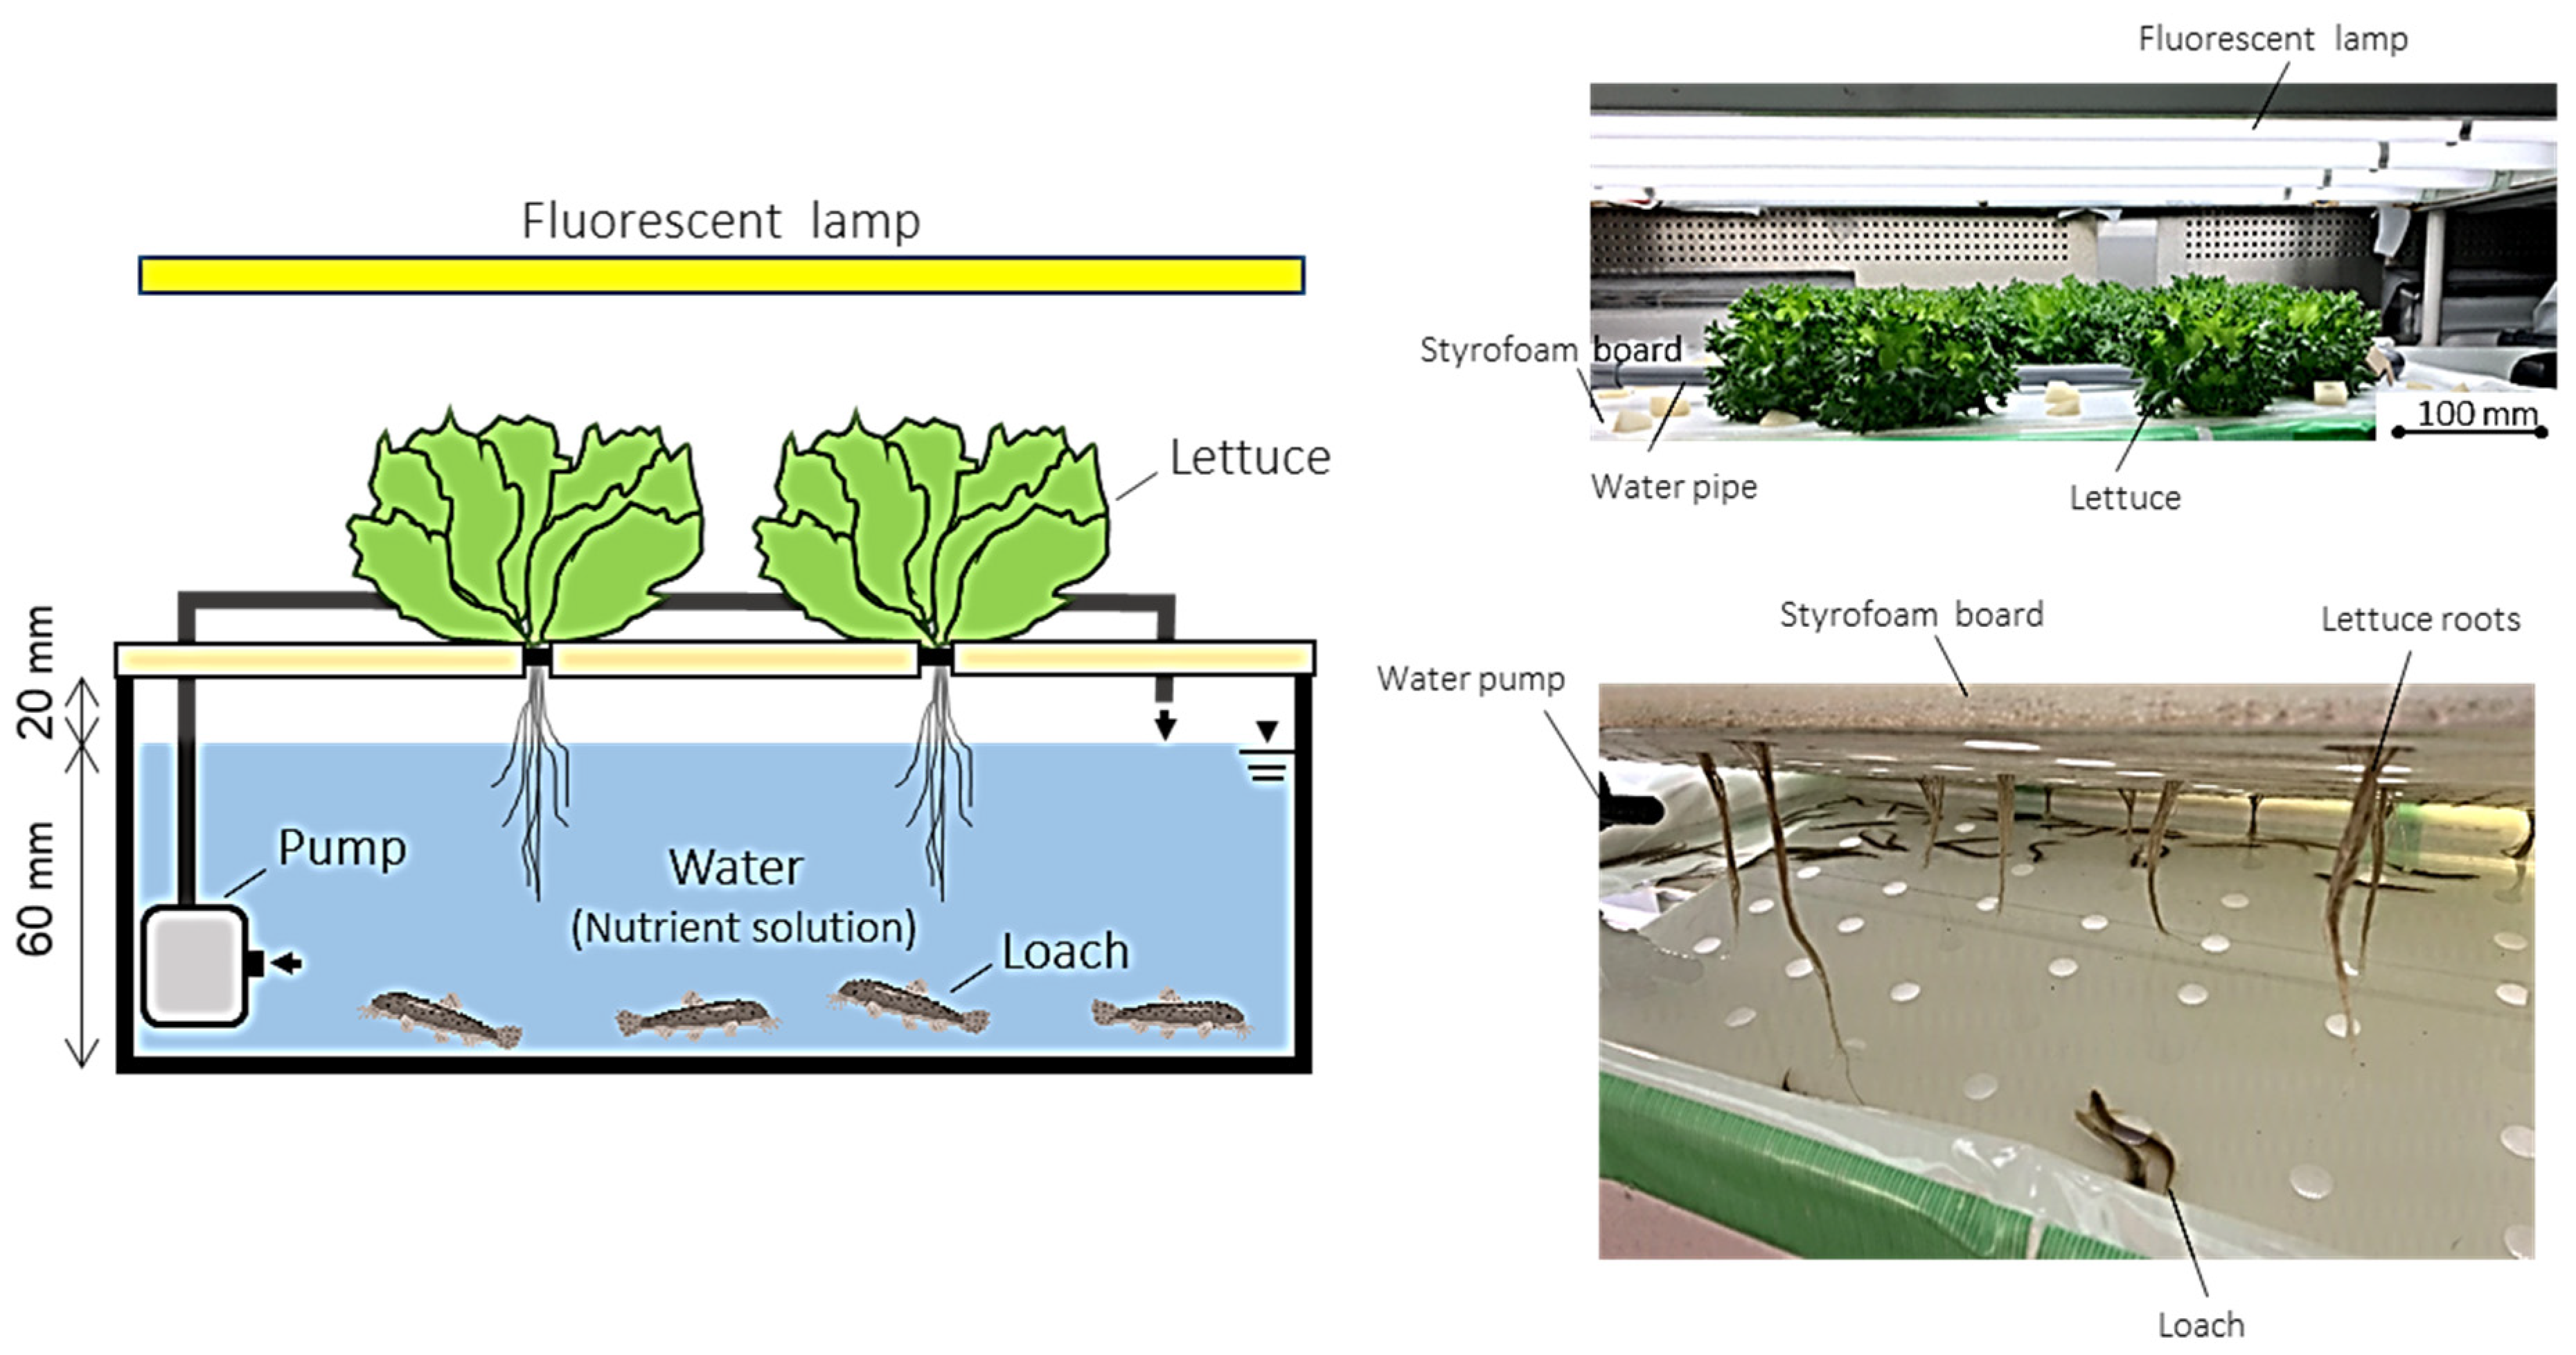
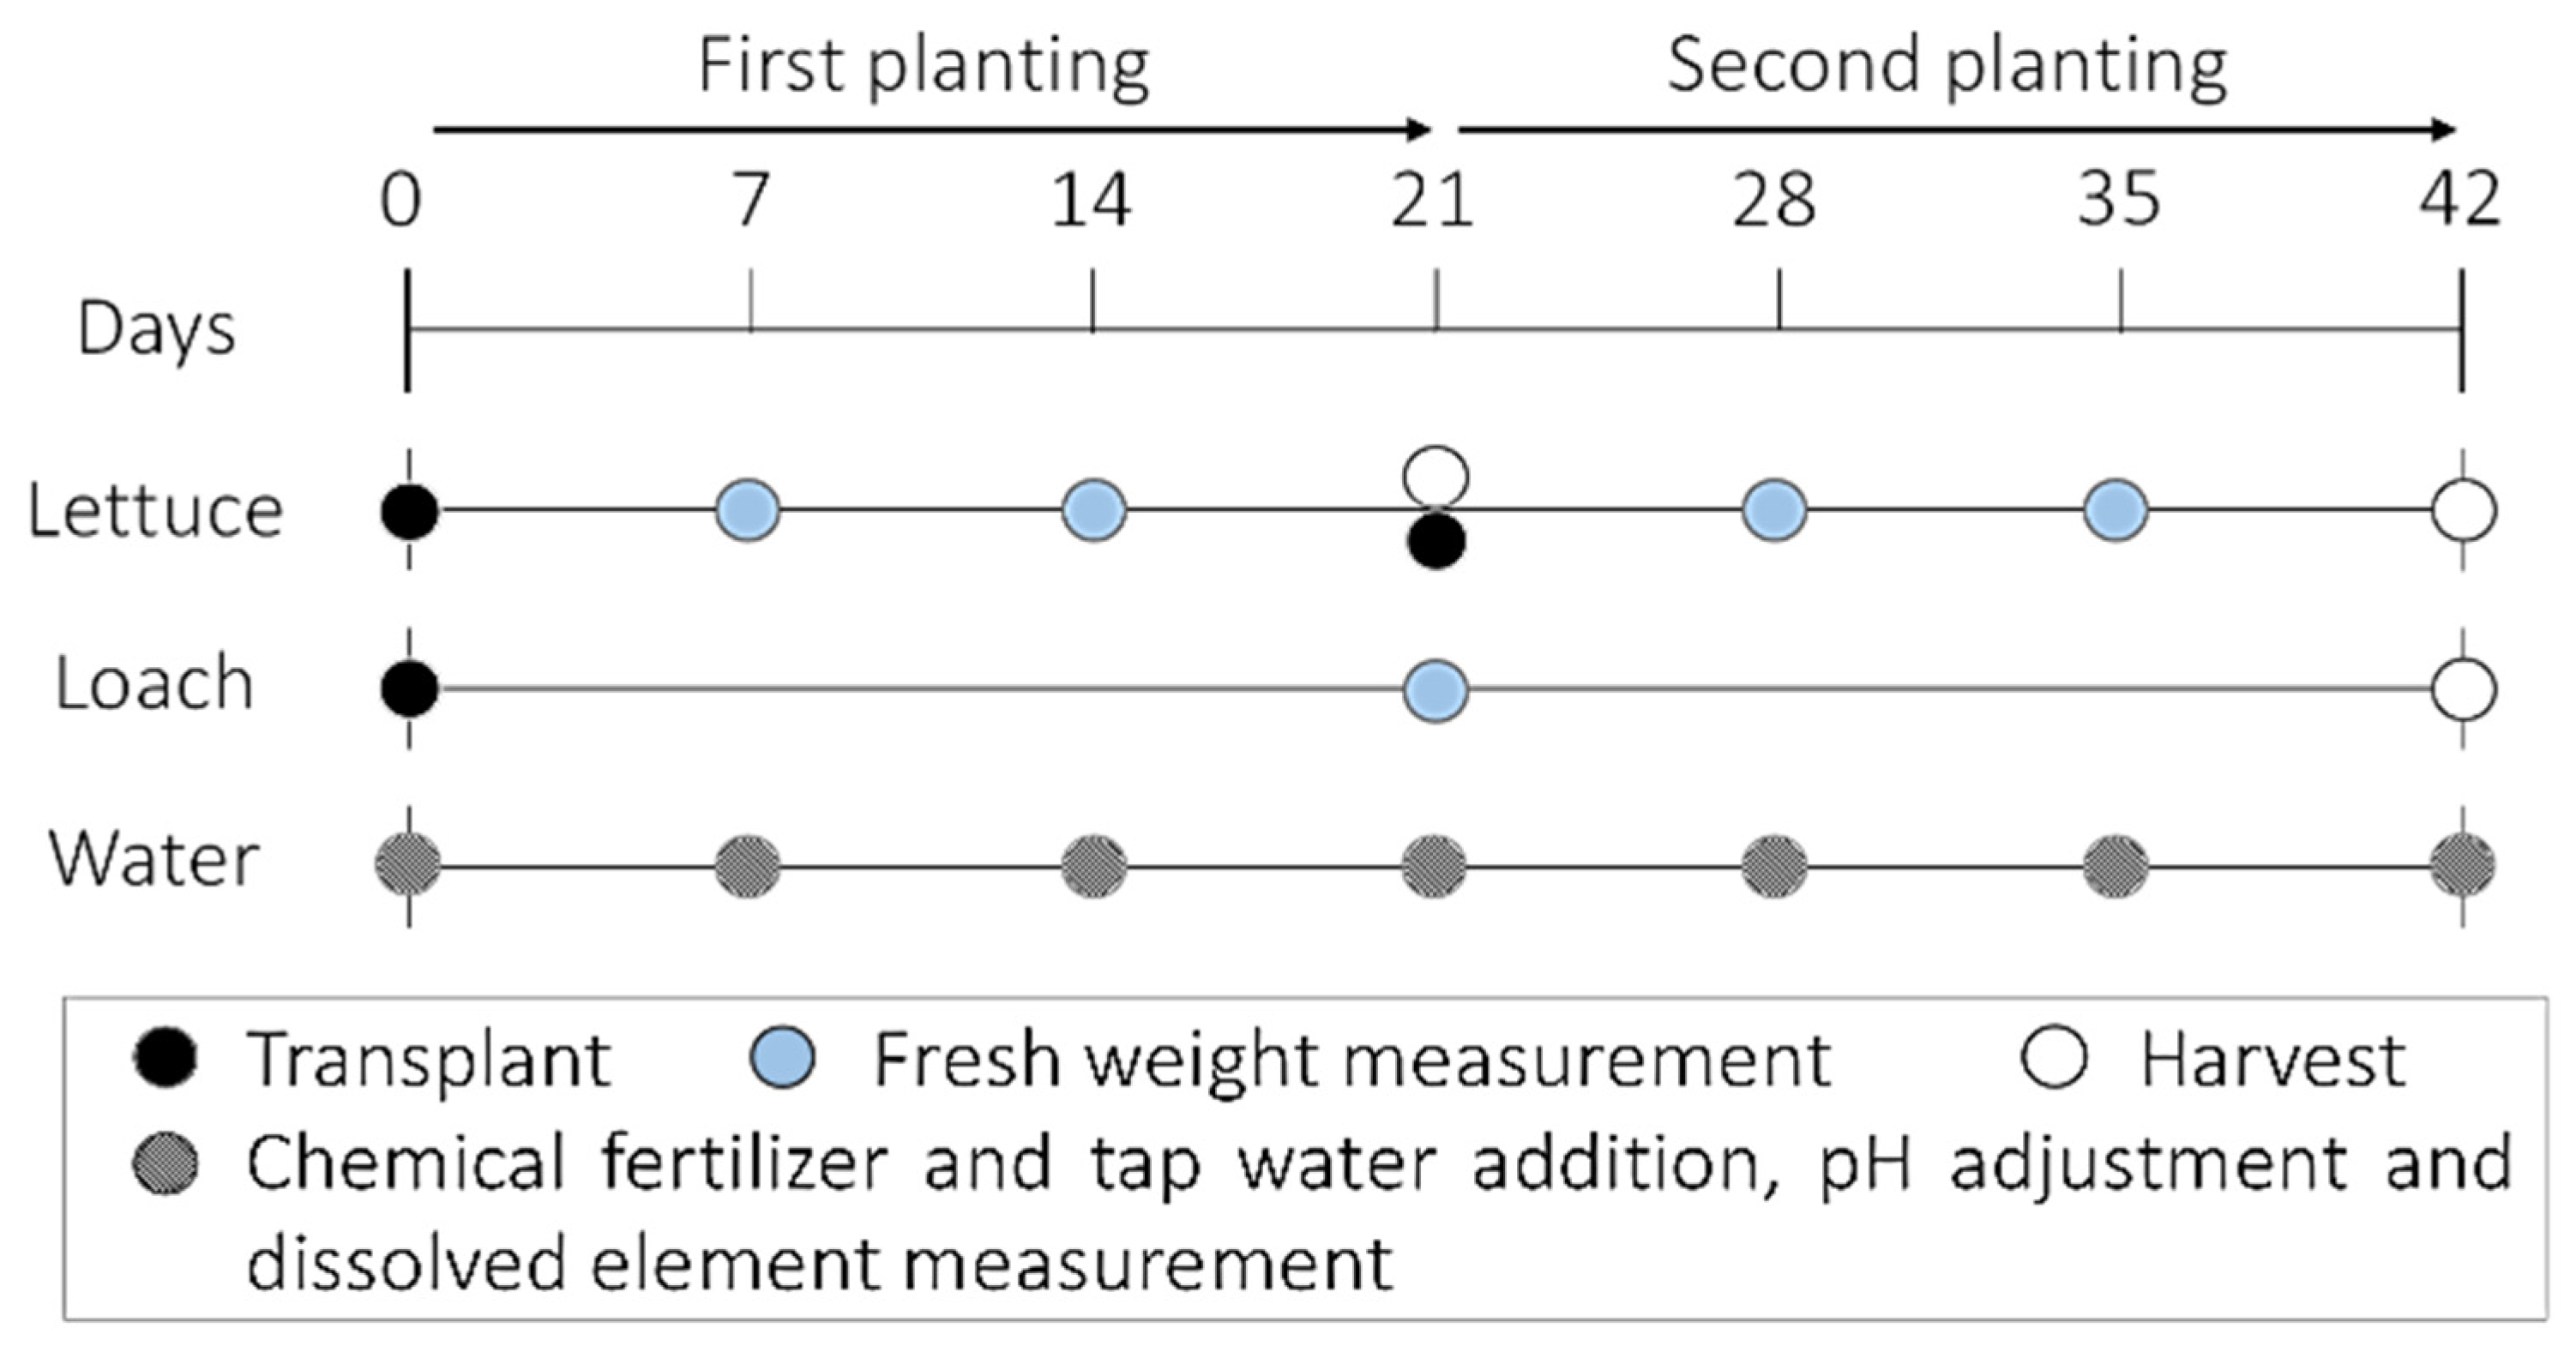
2. Materials and Methods

Loach (Misgurnus anguillicaudatus) was used as the fish, and lettuce (Lactuca sativa L. ‘Fril Ice’) was used as the plant. Juvenile loaches were obtained from the Yasugi Loach Producers Association in Yasugi, Shimane, Japan, and lettuce seeds were obtained from Snow Brand Seed Co., Ltd., Sapporo, Japan.
This study adopted a deep-water method for hydroponic cultivation, and loaches were cultured in hydroponic cultivation beds with growing roots (Figure 1). The cultivation beds were covered with plates on which lettuce seedlings were transplanted 21 days after sowing. The average weight of the loaches at the start of the experiment was 3.1 g/fish. The average fresh weight of the lettuce seedlings was 3.2 g FW/plant in the first planting period and 3.0 g FW/plant in the second lettuce cultivation period. The planting density of lettuce plants was 28 plants m−2. The nutrient solution in the system was constantly circulated using a submersible pump (Compacton 600, EHEIM GmbH & Co., Deizisau, Germany).
The experimental timeline is shown in Figure 2. In the lettuce cultivation experiment, the first harvest was performed 21 days after planting, followed by a second lettuce cultivation for 21 days after the first lettuce cultivation. When the lettuce plants were harvested at the end of the second lettuce cultivation period, loaches were harvested.
The experimental system was installed in an environmentally controlled room with the following settings: temperature (light period 25 °C/dark period 20 °C), relative humidity 70%, CO2 concentration 700 µmol mol−1, photosynthetic photon flux density on the plant cultivation plate surface 200 µmol m−2 s−1, and light period 16 h d−1. White, fluorescent lamps (FHF32EX-D-HX-S, NEC Co., Tokyo, Japan) were the light source.
Commercially available goldfish feed (Saki Hikari, Kyorin Co., Ltd., Himeji, Hyogo, Japan) was used for the loaches. The main feed components are listed in Table 1. The nitrogen compound content in the feed was 7.9% [w/w] in terms of N weight. Feeding was performed twice a day during the light period, with an interval of at least three hours between feedings. The feeding rate of each test group remained constant throughout the culture period.
In the preliminary experiment, loach excreta alone was insufficient to provide the specific fertilizer components necessary for lettuce plant growth, so chemical fertilizer was supplemented. The OAT House A Formula Solution (OAT Agrio Co., Ltd., Tokyo, Japan) was used as the supplementary fertilizer. The composition of the supplementary fertilizer solution is presented in Table 2. The electrical conductivity of the culture medium was controlled to approximately 1.2 dS m−1 by adjusting the amount of supplementary fertilizer solution added. The pH of the solution was adjusted to 5.0–5.5 using dilute sulfuric acid (H2SO4, 1.0 mol L−1). The dissolved oxygen (DO) levels were maintained near saturation by aeration.
The fresh weights of the lettuce plants and loaches and concentrations of ammonium nitrogen, nitrite nitrogen, nitrate nitrogen, pH, and electrical conductivity of the nutrient solution were measured weekly (Figure 2).
The dry weights and nitrogen contents of the lettuce plants and loaches were measured in the final harvest days. Harvested lettuce plants and loaches were dried in a thermostatic oven at 80 °C for one week to measure the dry weight. Three lettuce plants and six loach fish with dry weights close to each mean were selected and powdered to measure nitrogen contents using a CN coder (MT-700 Mark2, Yanako Technical Science Co., Ltd., Tokyo, Japan).
The concentrations of the components in the solutions were measured as follows. The ammonium nitrogen concentration was measured using a spectrophotometer (AT-2000, Central Scientific Co., Ltd., Tokyo, Japan). The nitrite nitrogen concentration was measured using a simple reflectance photometer (RQ flux plus 10, Kanto Scientific Co., Ltd., Tokyo, Japan). The nitrate nitrogen concentration was measured using a nitrate ion meter (LAQUAtwin NO3-11C, Horiba, Ltd., Kyoto, Japan). The pH was measured using a pH meter (LAQUAtwin pH 33B, Horiba, Ltd., Tokyo, Japan). The EC was measured using an EC mater (RAQUAtwin EC-33B, Horiba, Ltd., Kyoto, Japan). Other macronutrients (P, K, Ca, and Mg) were measured using an ICP spectrometer (Seiko Instruments, Tokyo, Japan).

2.1. Test Treatments, Measurements, and Calculations

Ten test groups were set up, including nine aquaponics test groups with three combinations of fish densities (0.5, 1.0, and 1.5 fish L−1), three feeding rates per fish (0.03, 0.06, and 0.09 g d−1/fish), and one control hydroponic cultivation without fish (Table 3). The fish densities of 0.5, 1.0, and 1.5 (fish L−1) correspond to 15, 30, and 45 fish per system, respectively, and the feeding rates of 0.03, 0.06, and 0.09 (g d−1/fish) correspond to 1, 2, and 3% (w/w) of the fresh weight of the loaches, respectively, at the beginning of the experiment. The feeding rate per system (g d−1/system) was calculated as the product of the feeding rate per fish (g d−1/fish) and the number of fish.
The following items were measured and calculated:
The fresh weight, dry weight, and internal nitrogen concentration of lettuce plants were measured.
The fresh weight, dry weight, feed conversion ratio (FCR), and internal nitrogen concentration of loaches were measured.
For the nutrient solution, the water volume, EC value, pH, amount of fertilizer solution, and amount of dilute sulfuric acid added to adjust the pH when adjusting the fertilizer concentration and the dissolved components (NO3, NO2, NH4+, K+) in the nutrient solution were measured.
The FCR was calculated using Equation (1) as the amount of feed required to increase the fresh weight of the fish by 1 g.
FCR = Wfeed/(FWfisht2 − FWfisht1)
The NUE was calculated based on the nitrogen (N) balance in the system, which is expressed by the following formula.
N supply rate to the system = N accumulation rate in fish + N accumulation rate in plants + N accumulation rate as dissolved N compound ions in solution + non-dissolved N as solid N compounds.
The NUE is the ratio of the accumulation rate in fish and plants to the N supply rate in the system. From the viewpoint of the individual production of fish and plants, this can be expressed as the ratio of their accumulation rates in Equation (2).
NUE = ((Nplantt2 − Nplantt1)/(Nfisht2 − Nfisht1)/(Nfeed + Nfertilizer)
In Equations (1) and (2), FW is the fresh weight (g), W is the weight (g), and N is the amount of nitrogen (g). The subscripts are as follows: t1 represents the time of planting, t2 represents the time of harvest, plant represents lettuce plants, feed represents the feed, fish represents loaches, and fertilizer represents the chemical fertilizer supplied.

2.2. Measurement of Nitrogen Content

In addition to actual measurements using a measuring device, the nitrogen content of each element in the system was calculated using the following procedure. The nitrogen content in the nutrient solution resulting from the chemical fertilizer solution being added to each test group was calculated based on the composition provided by the fertilizer manufacturer. The nitrogen content in the feed given to the fish was calculated based on the nitrogen content (g g−1) supplied by the feed manufacturer. No feed was left uneaten during the experiment. The nitrogen content in the loach excreta was determined by measuring the total amount of dissolved nitrogen (g) excreted by 20 loaches over 21 days in the test group, in which only the loaches were cultured.

2.3. Statistical Analysis

During the test period, lettuce cultivation was repeated twice with different plants, but the same fish was continuously used for loach aquaculture, as shown in Figure 2. For data analysis, including analysis of variance (ANOVA) and significance tests, the Excel statistical extension software (Statcel Ver. 3) was used. Significant differences were tested using the Tukey–Kramer method, and the presence or absence of significant differences was indicated at the p < 0.05 level.

3. Results

3.1. Loach Growth and FCR
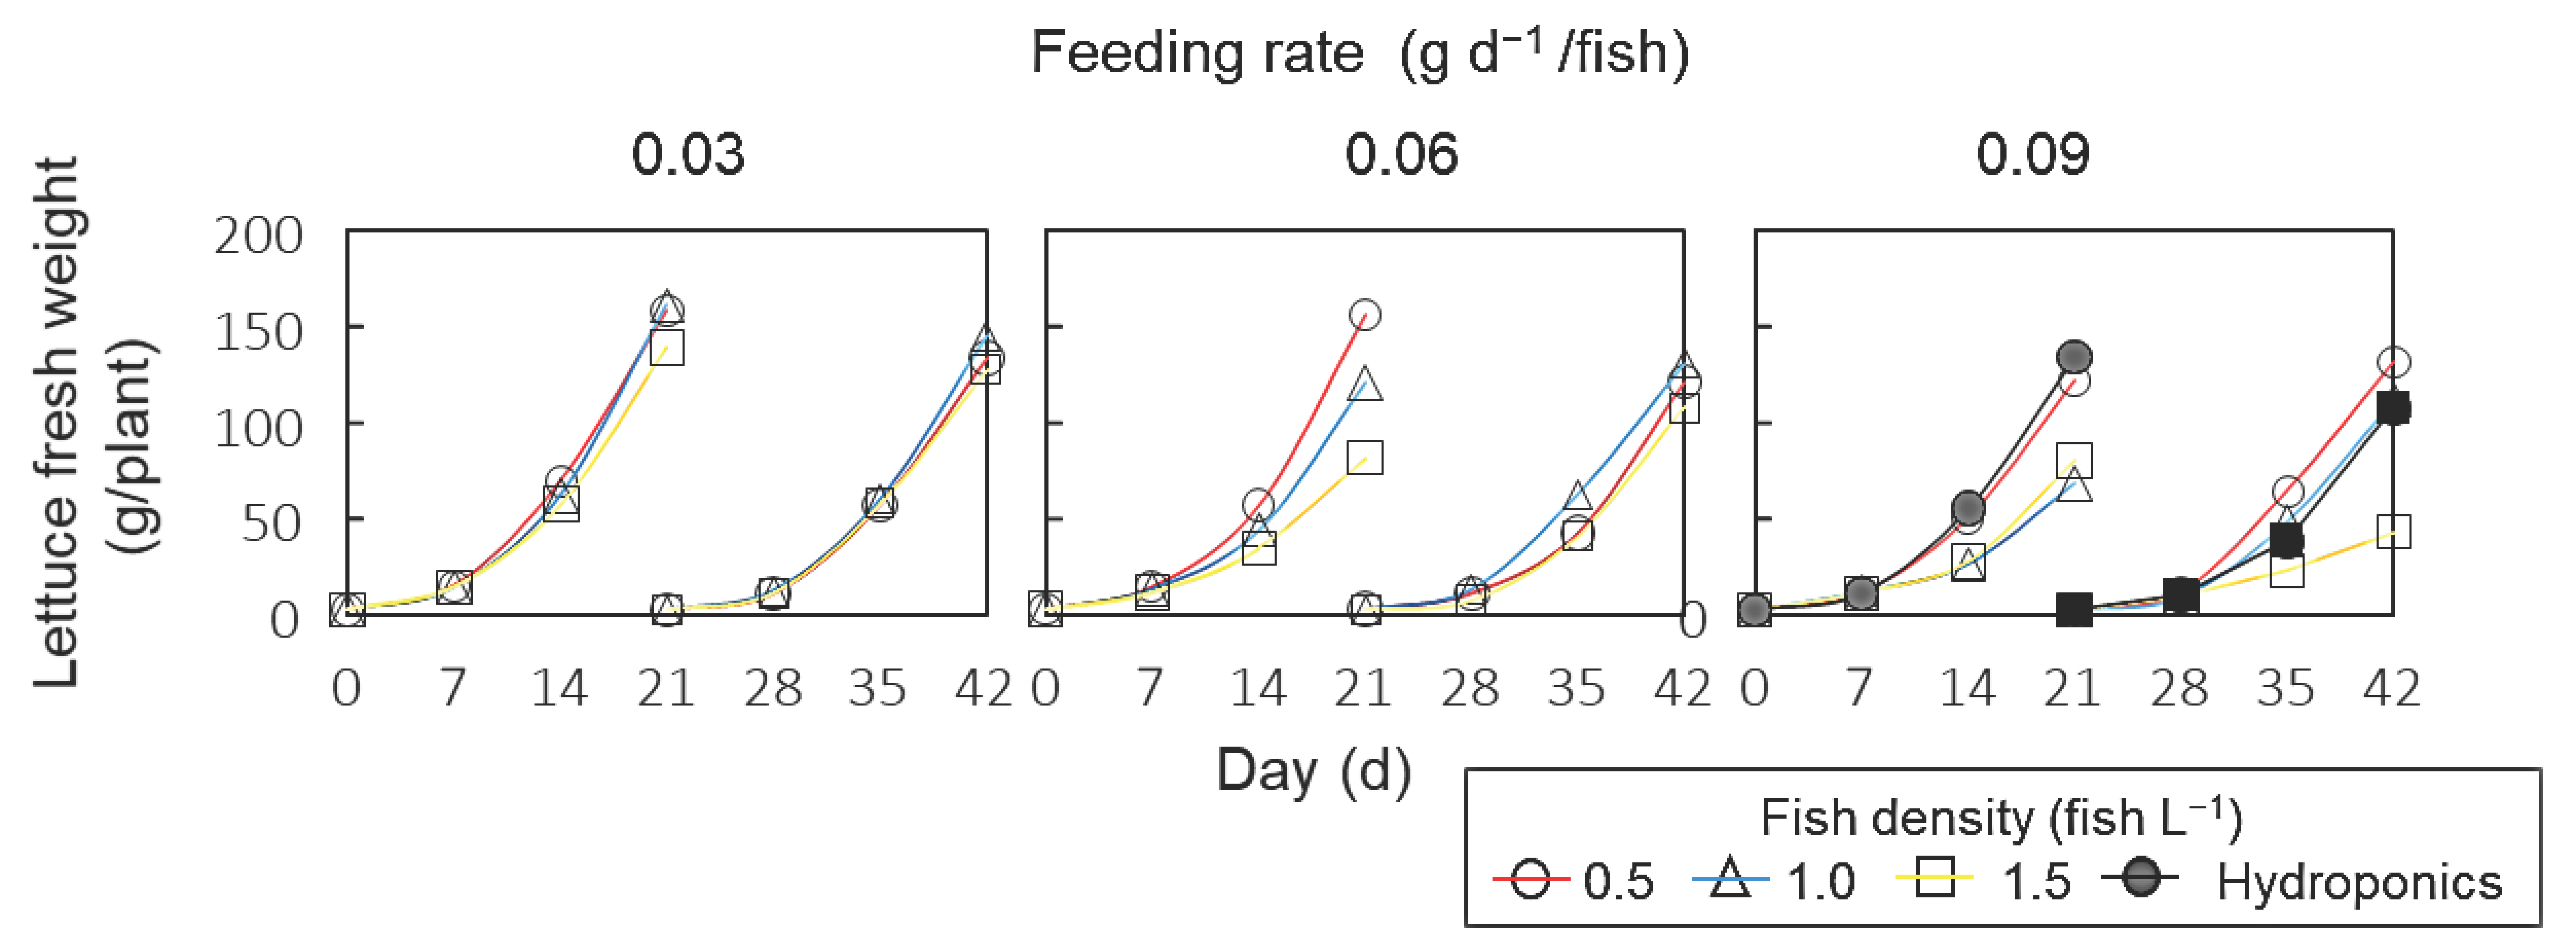
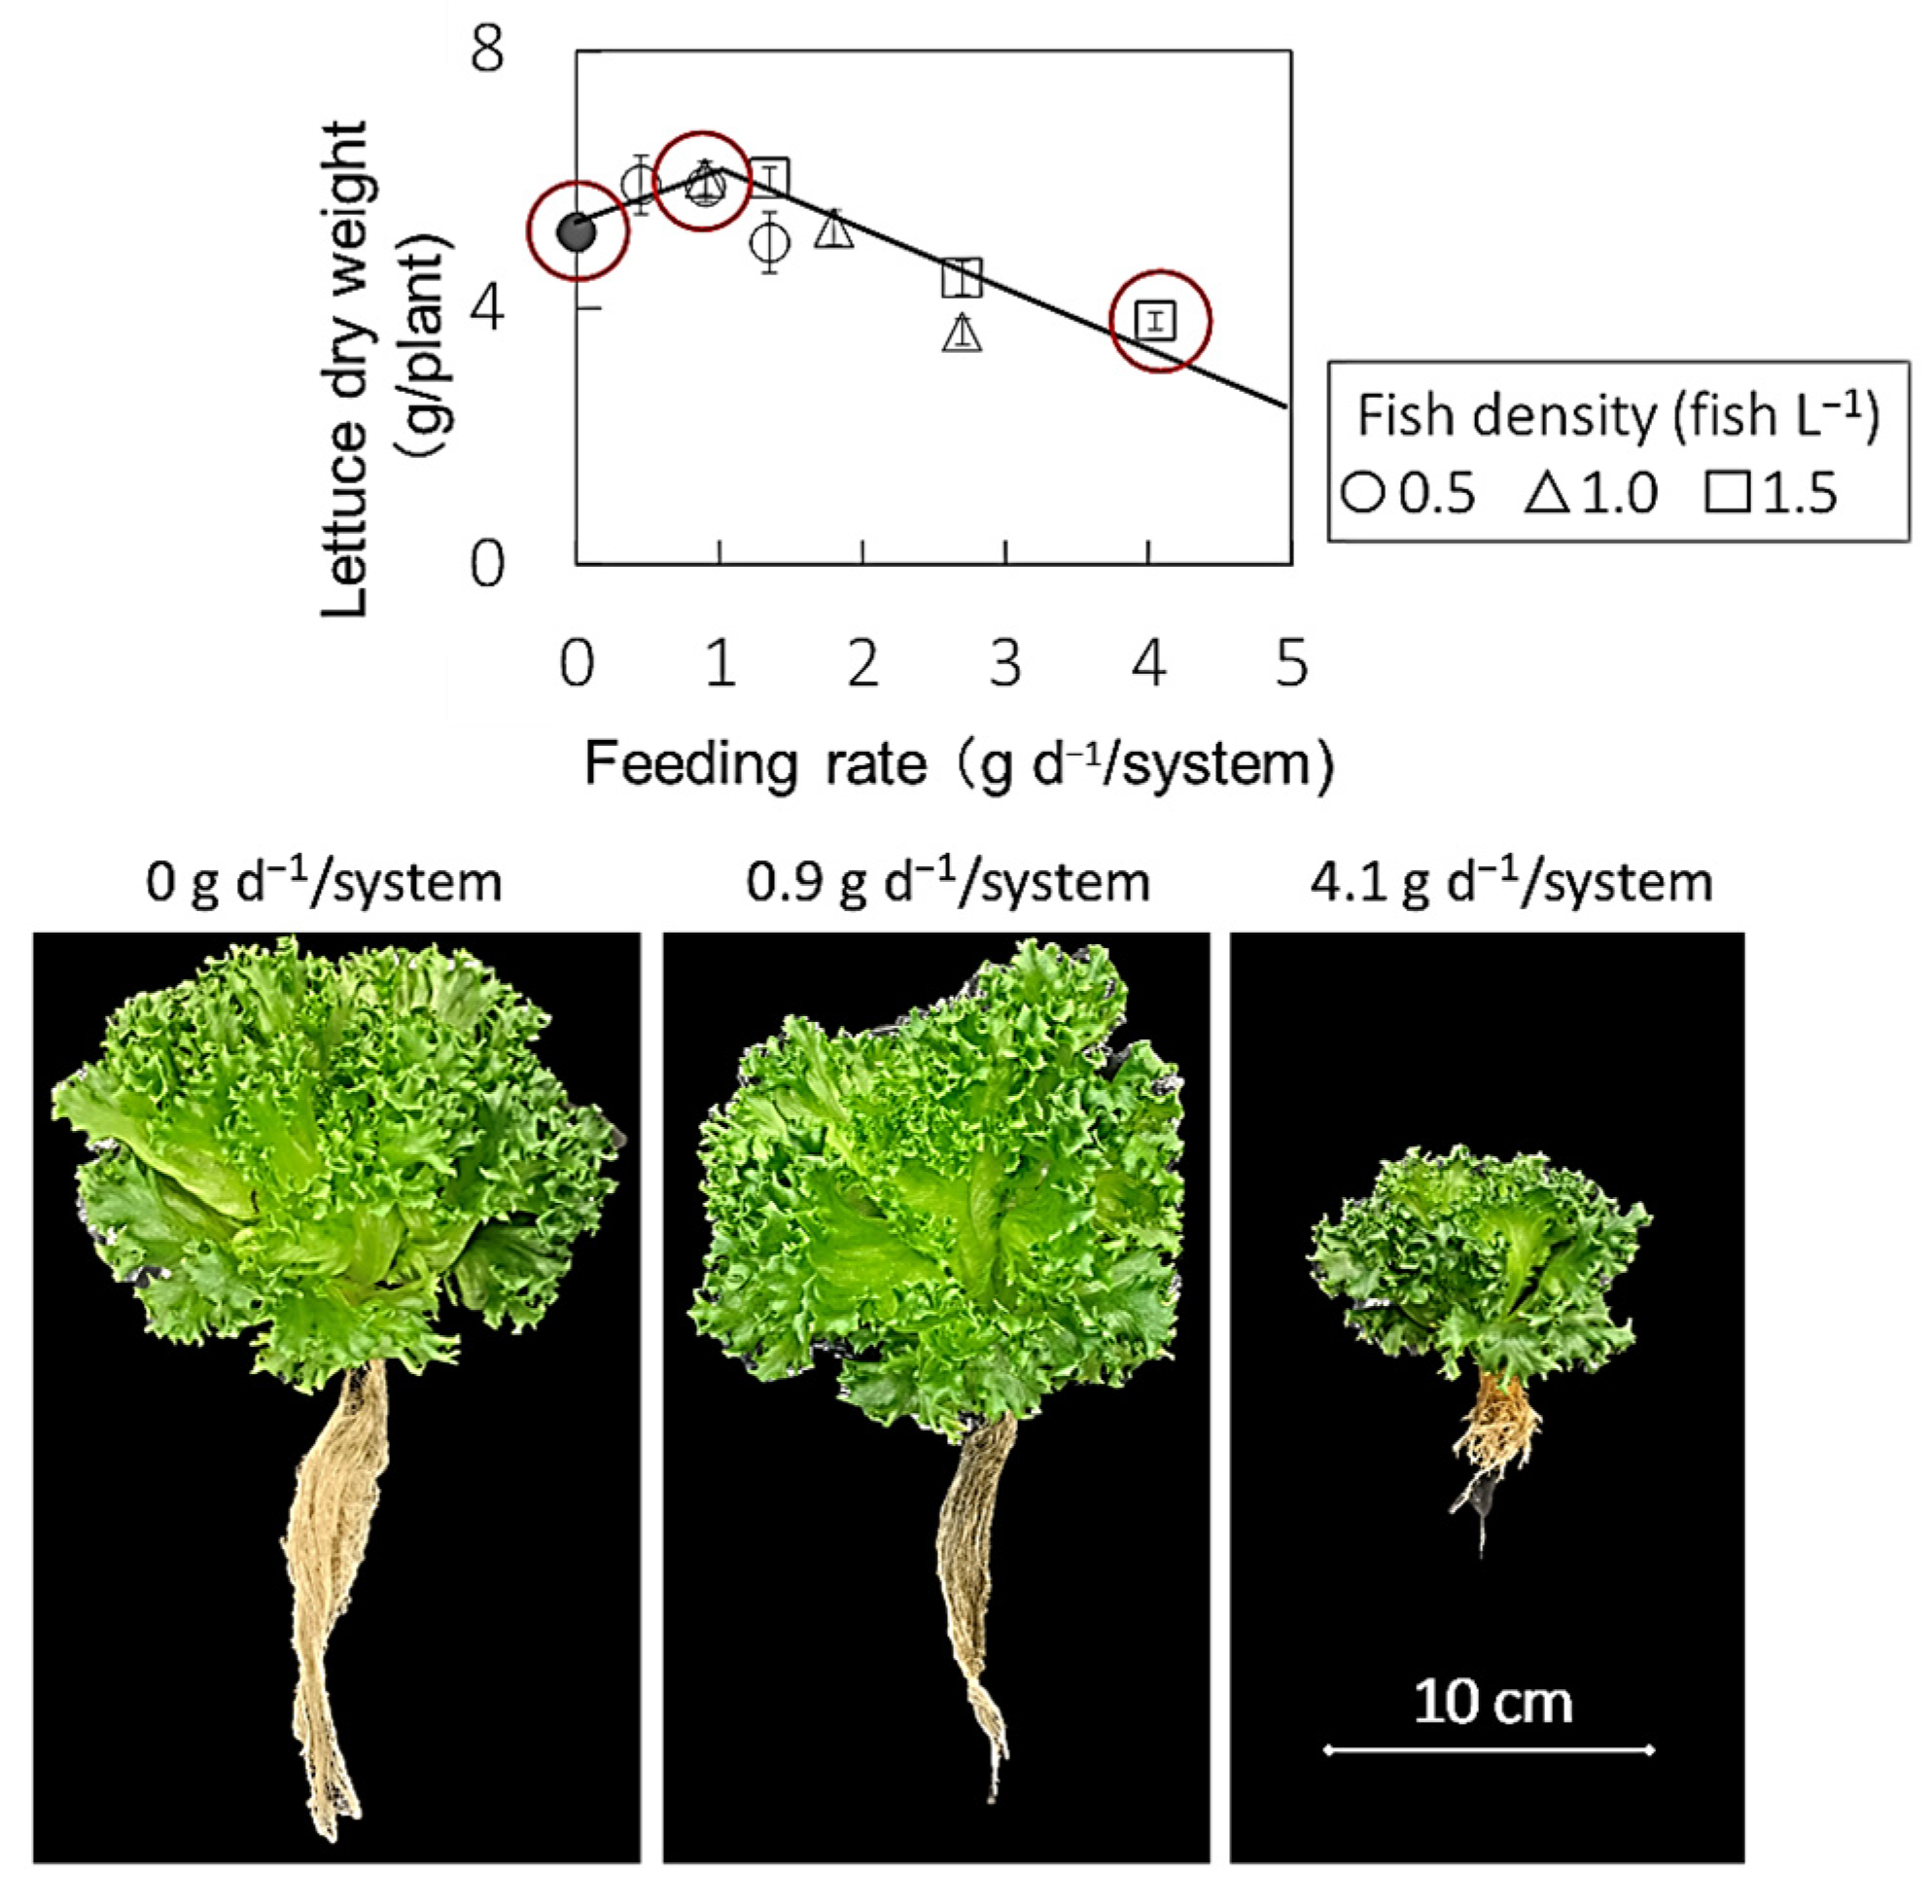
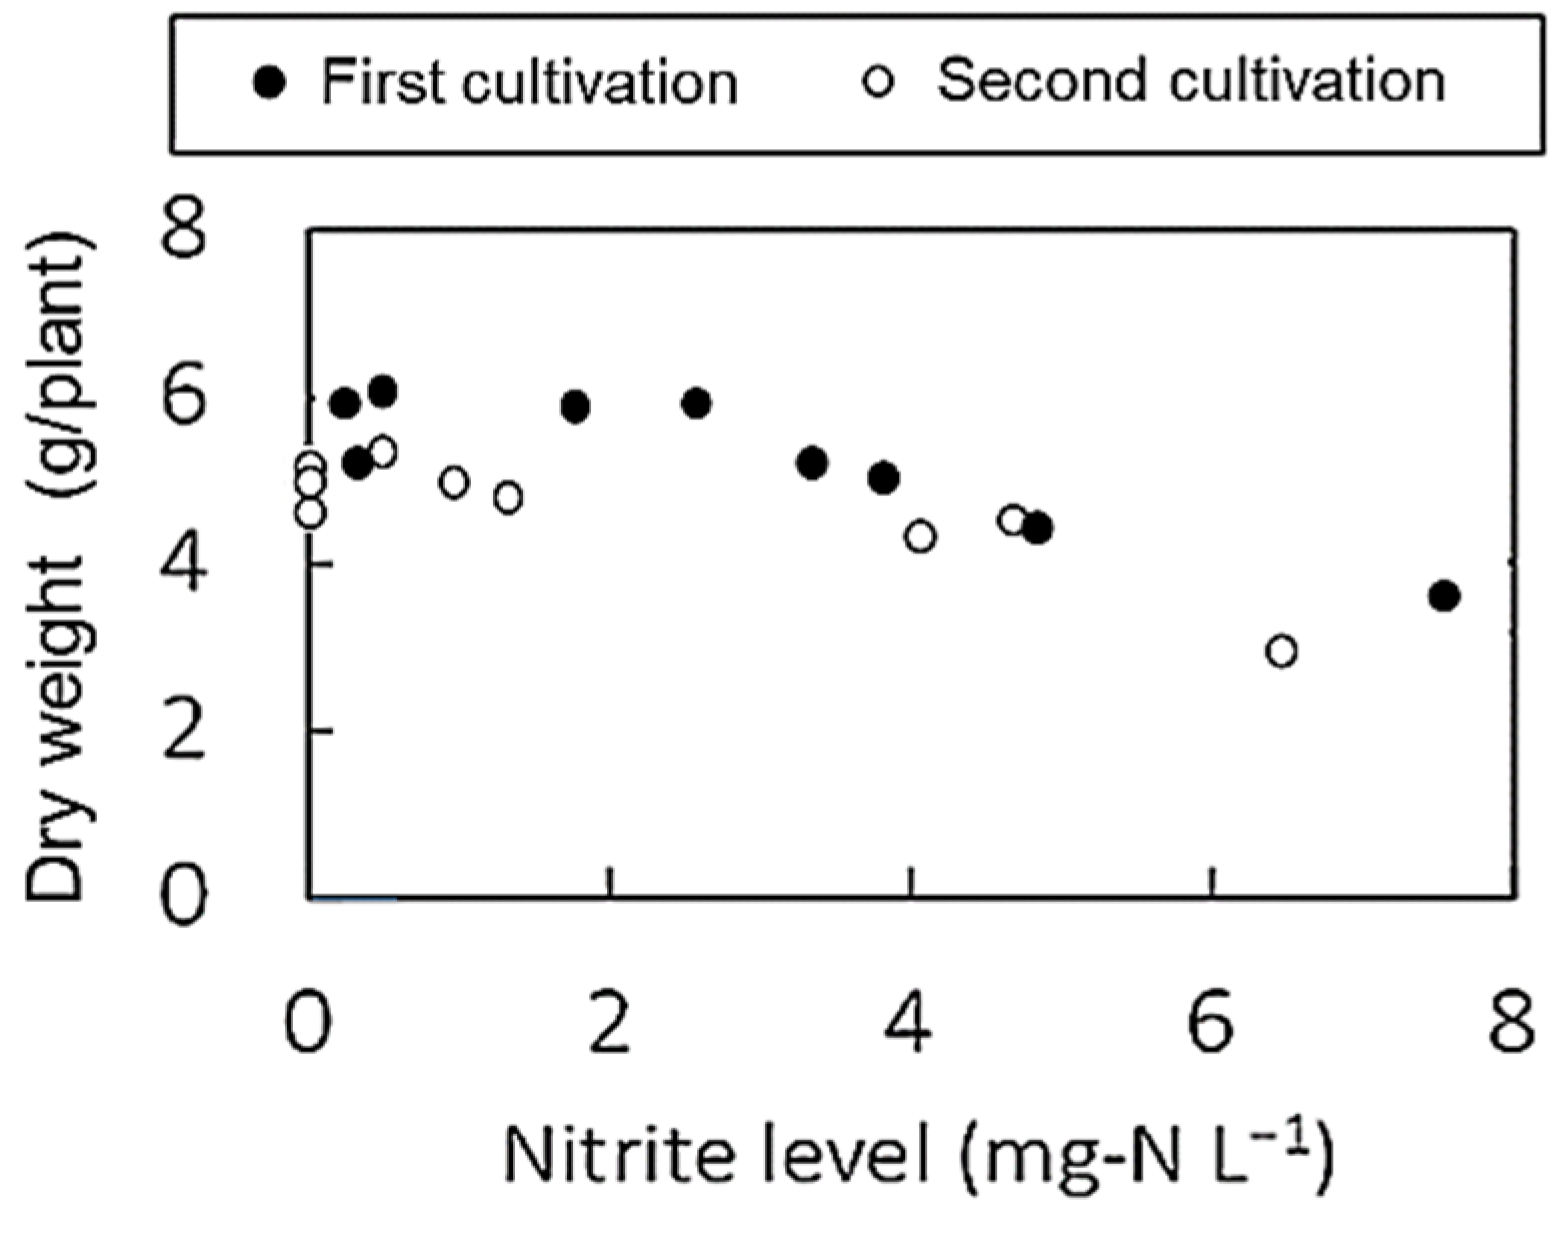
The fresh weight of the loaches increased over time (Figure 3). At a feeding rate (g d−1/fish) of 0.03, the fresh weight increased almost linearly over time, but as the feeding rate increased to 0.6 and 0.9, the fresh weight that increased in the second lettuce cultivation period tended to decrease compared with that in the first lettuce cultivation period (Figure 3). At a feeding rate of 0.9, the fresh weight of each individual tended to decrease with increasing culture density (Figure 3).
Figure 4 shows the effects of feeding rate on total loach yield and FCR. As the feeding rate increased, the total loach yield increased, but the slope increase decreased (Figure 4a). The FCR decreased from 2.8 to 1.0 g g−1 when the feeding rate increased from 0.5 to 2 g d−1/system, reaching a minimum at a feeding rate of 2 g d−1/system, and then tended to increase (Figure 4b).
The FCR decreased when the feeding rate per plant increased from 0.03 to 0.06, but there was no significant difference between 0.06 and 0.09 (Table 4). The FCR also decreased when the culture density increased from 0.5 to 1.0, but no significant difference was observed between the 1.0 and 1.5 (Table 4).

3.2. Lettuce Growth

The fresh weight of the lettuce plants increased exponentially over time (Figure 5). The fresh weight ratio of the stem and leaves to the roots was approximately 9:1. The growth performance of lettuce in each test group is shown in Table 5. The combined treatments of high feeding rates per fish and high fish density tended to decrease the fresh and dry weights of the lettuce plants, showing a significant difference with the control hydroponic plot. The tendency, as mentioned above, was more evident in the fresh weight than in the dry weight. The moisture content decreased in combined treatments with high feeding rates per fish and high fish density (Table 5).
The effects of the feeding rate on dry weight, an index of the material production rate of lettuce plants 21 days after treatment, are shown in Figure 6. The dry weight of lettuce plants increased as the feeding rate per system increased from 0.5 to 1.5 g d−1/system and tended to decrease above 1.5 g d−1.
Photos of representative lettuce plants cultivated at feeding rates per system of 0, 0.9, and 4.1 g d−1/system are indicated by red circles in the above graph.

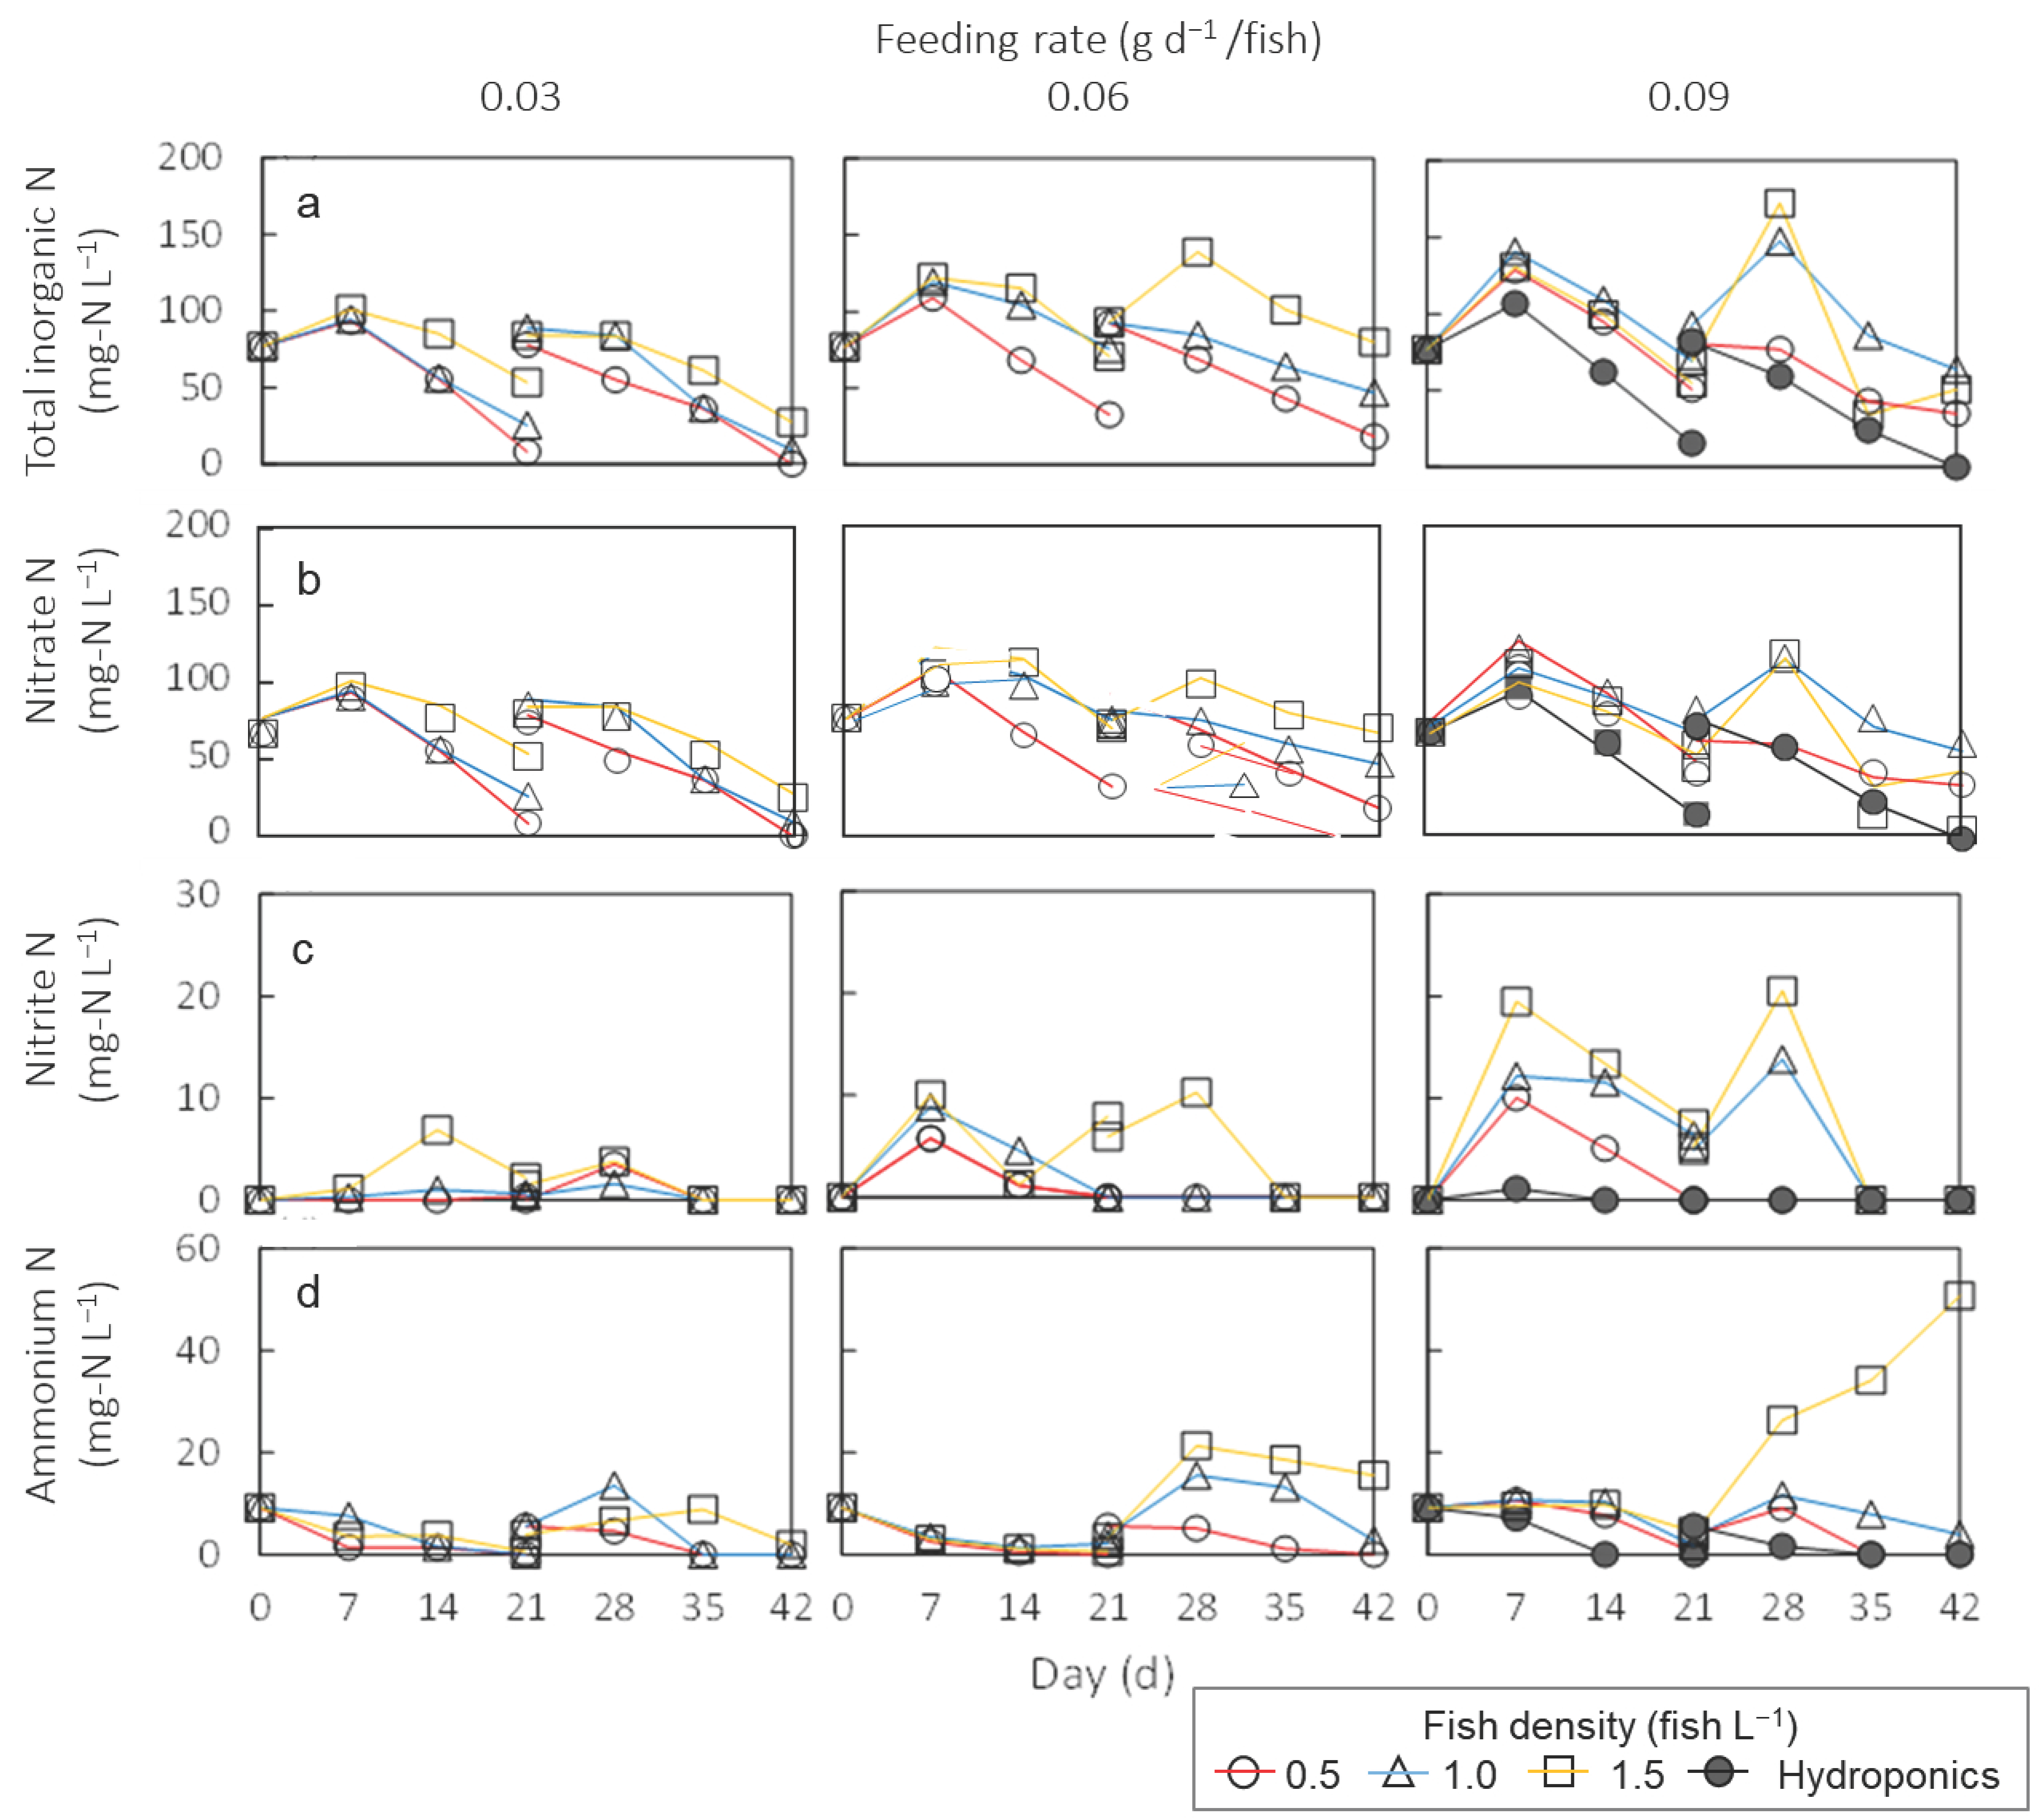
3.3. Nitrogen Dynamics

In the first and second lettuce cultivation periods, the concentration of inorganic nitrogen compounds in the nutrient solution tended to increase with an increasing daily feeding rate per system (Figure 7a). In both cultivation tests, the time course of the concentration of inorganic nitrogen compounds in the nutrient solution tended to decrease after the first week of cultivation (Figure 7). The time course of the NO3 concentration also tended to be similar to that of the concentration of inorganic nitrogen compounds (Figure 7b).
The accumulation of nitrite (NO2) and ammonium (NH4+) tended to increase with the daily feeding rate per fish and the fish density (Figure 7c,d); that is, the daily feeding rate per system promoted their accumulation.
The values for control hydroponic cultivation without fish corresponding to a feeding rate of 0 are plotted in the graph corresponding to a feeding rate of 0.09 g d−1/fish.

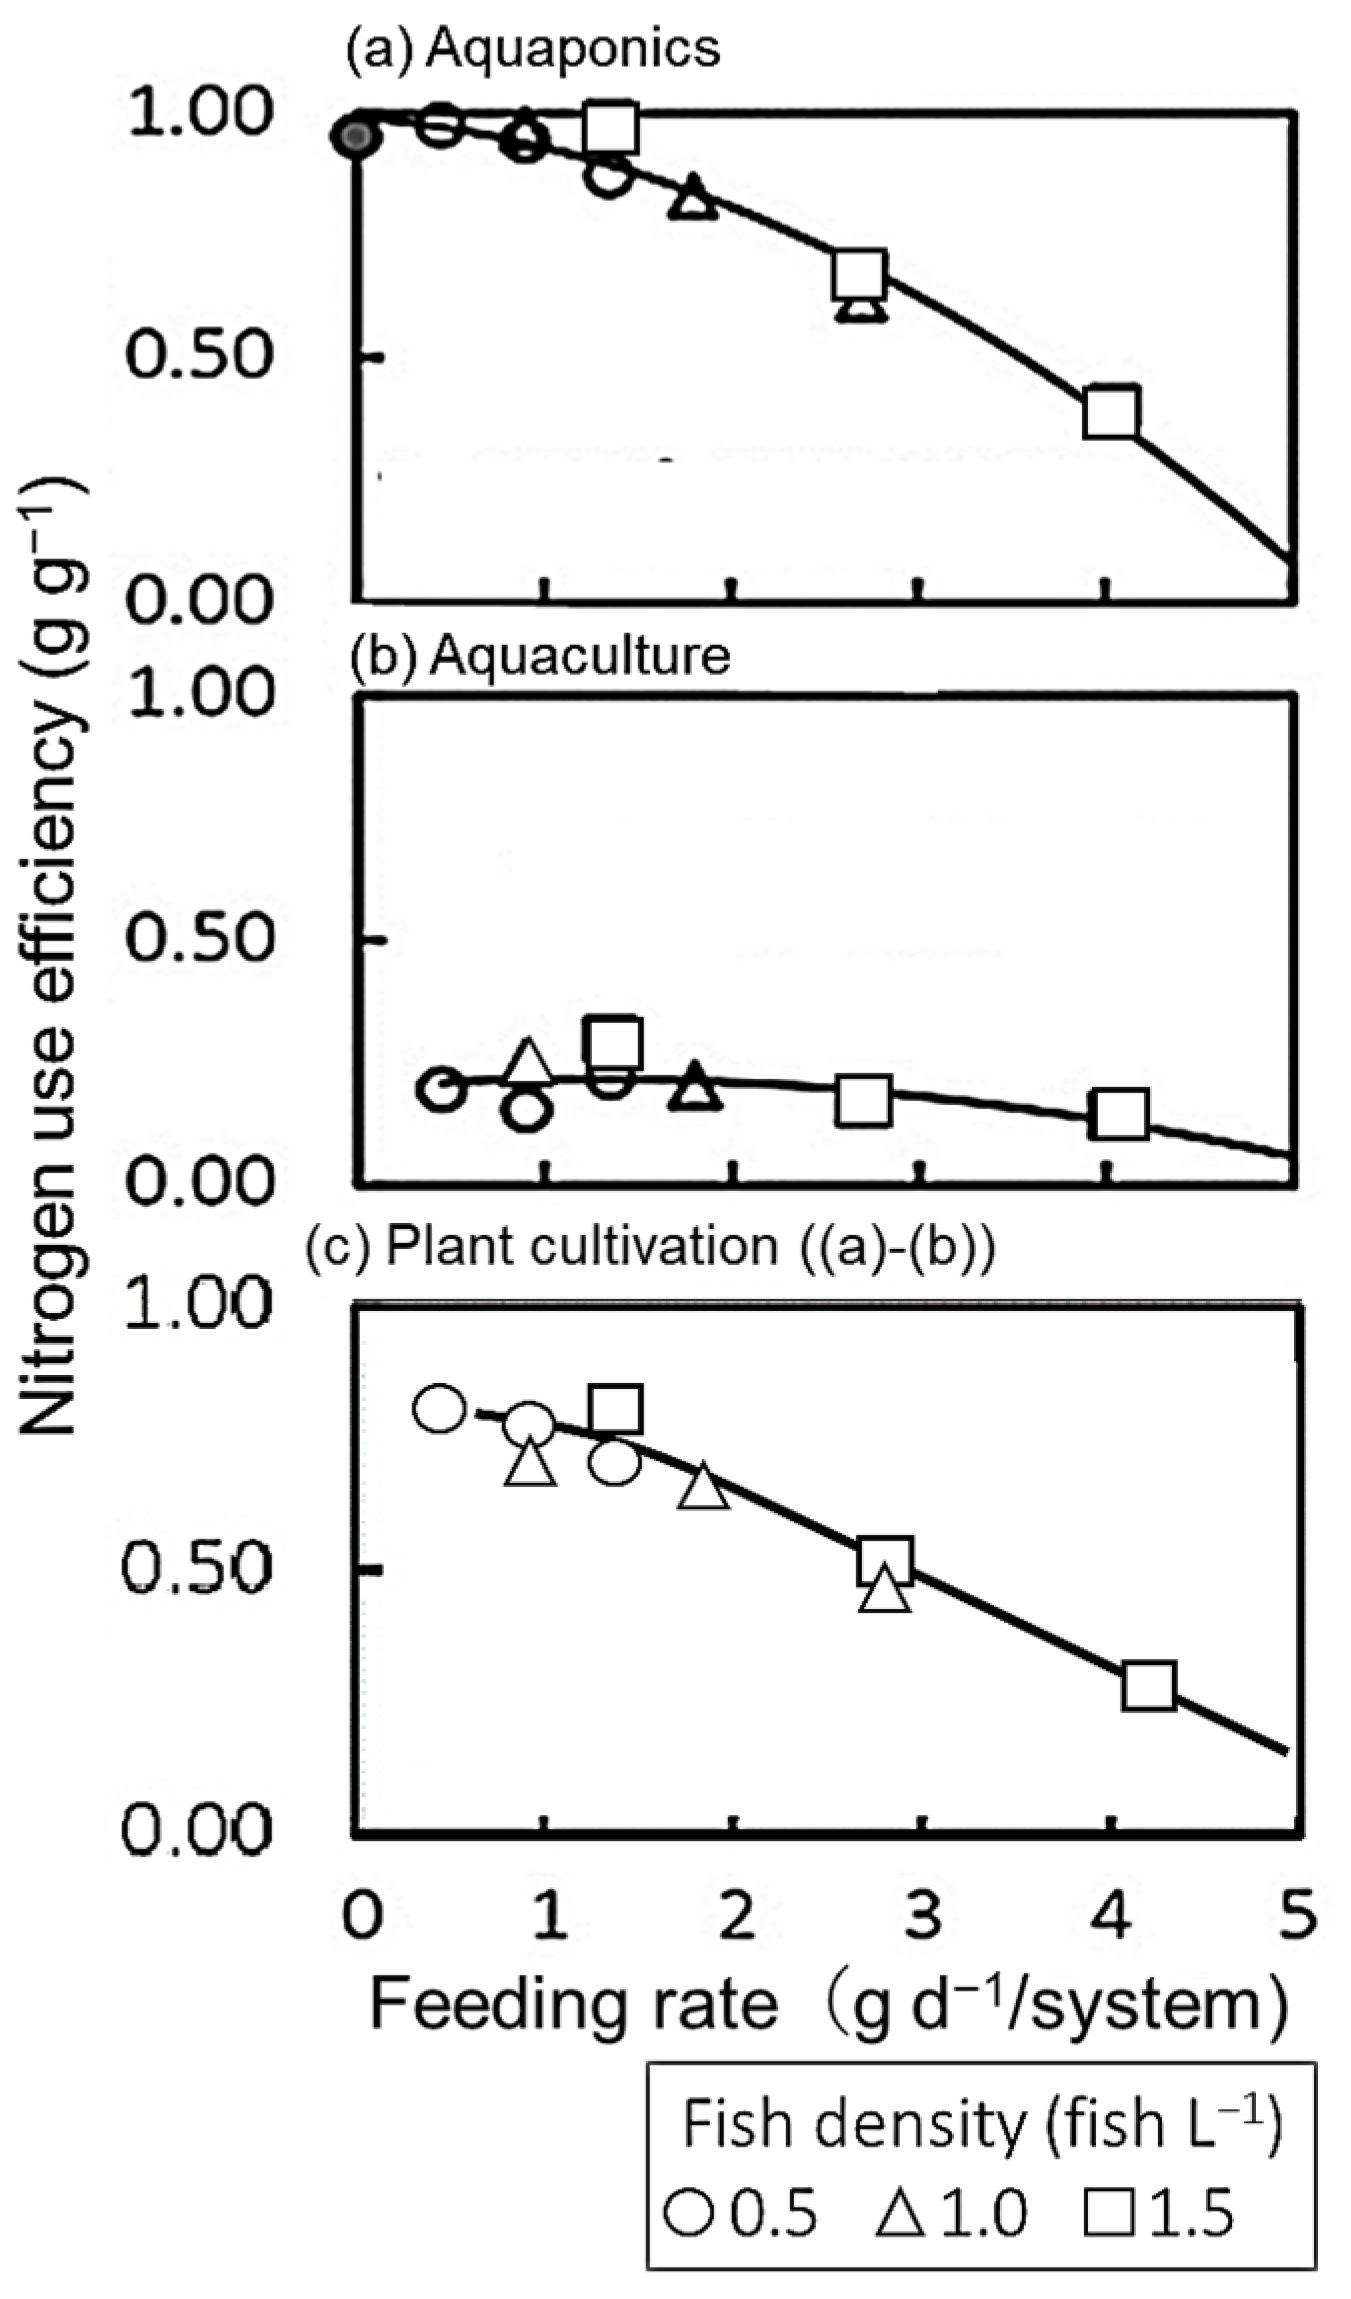
3.4. Nitrogen Use Efficiency (NUE)
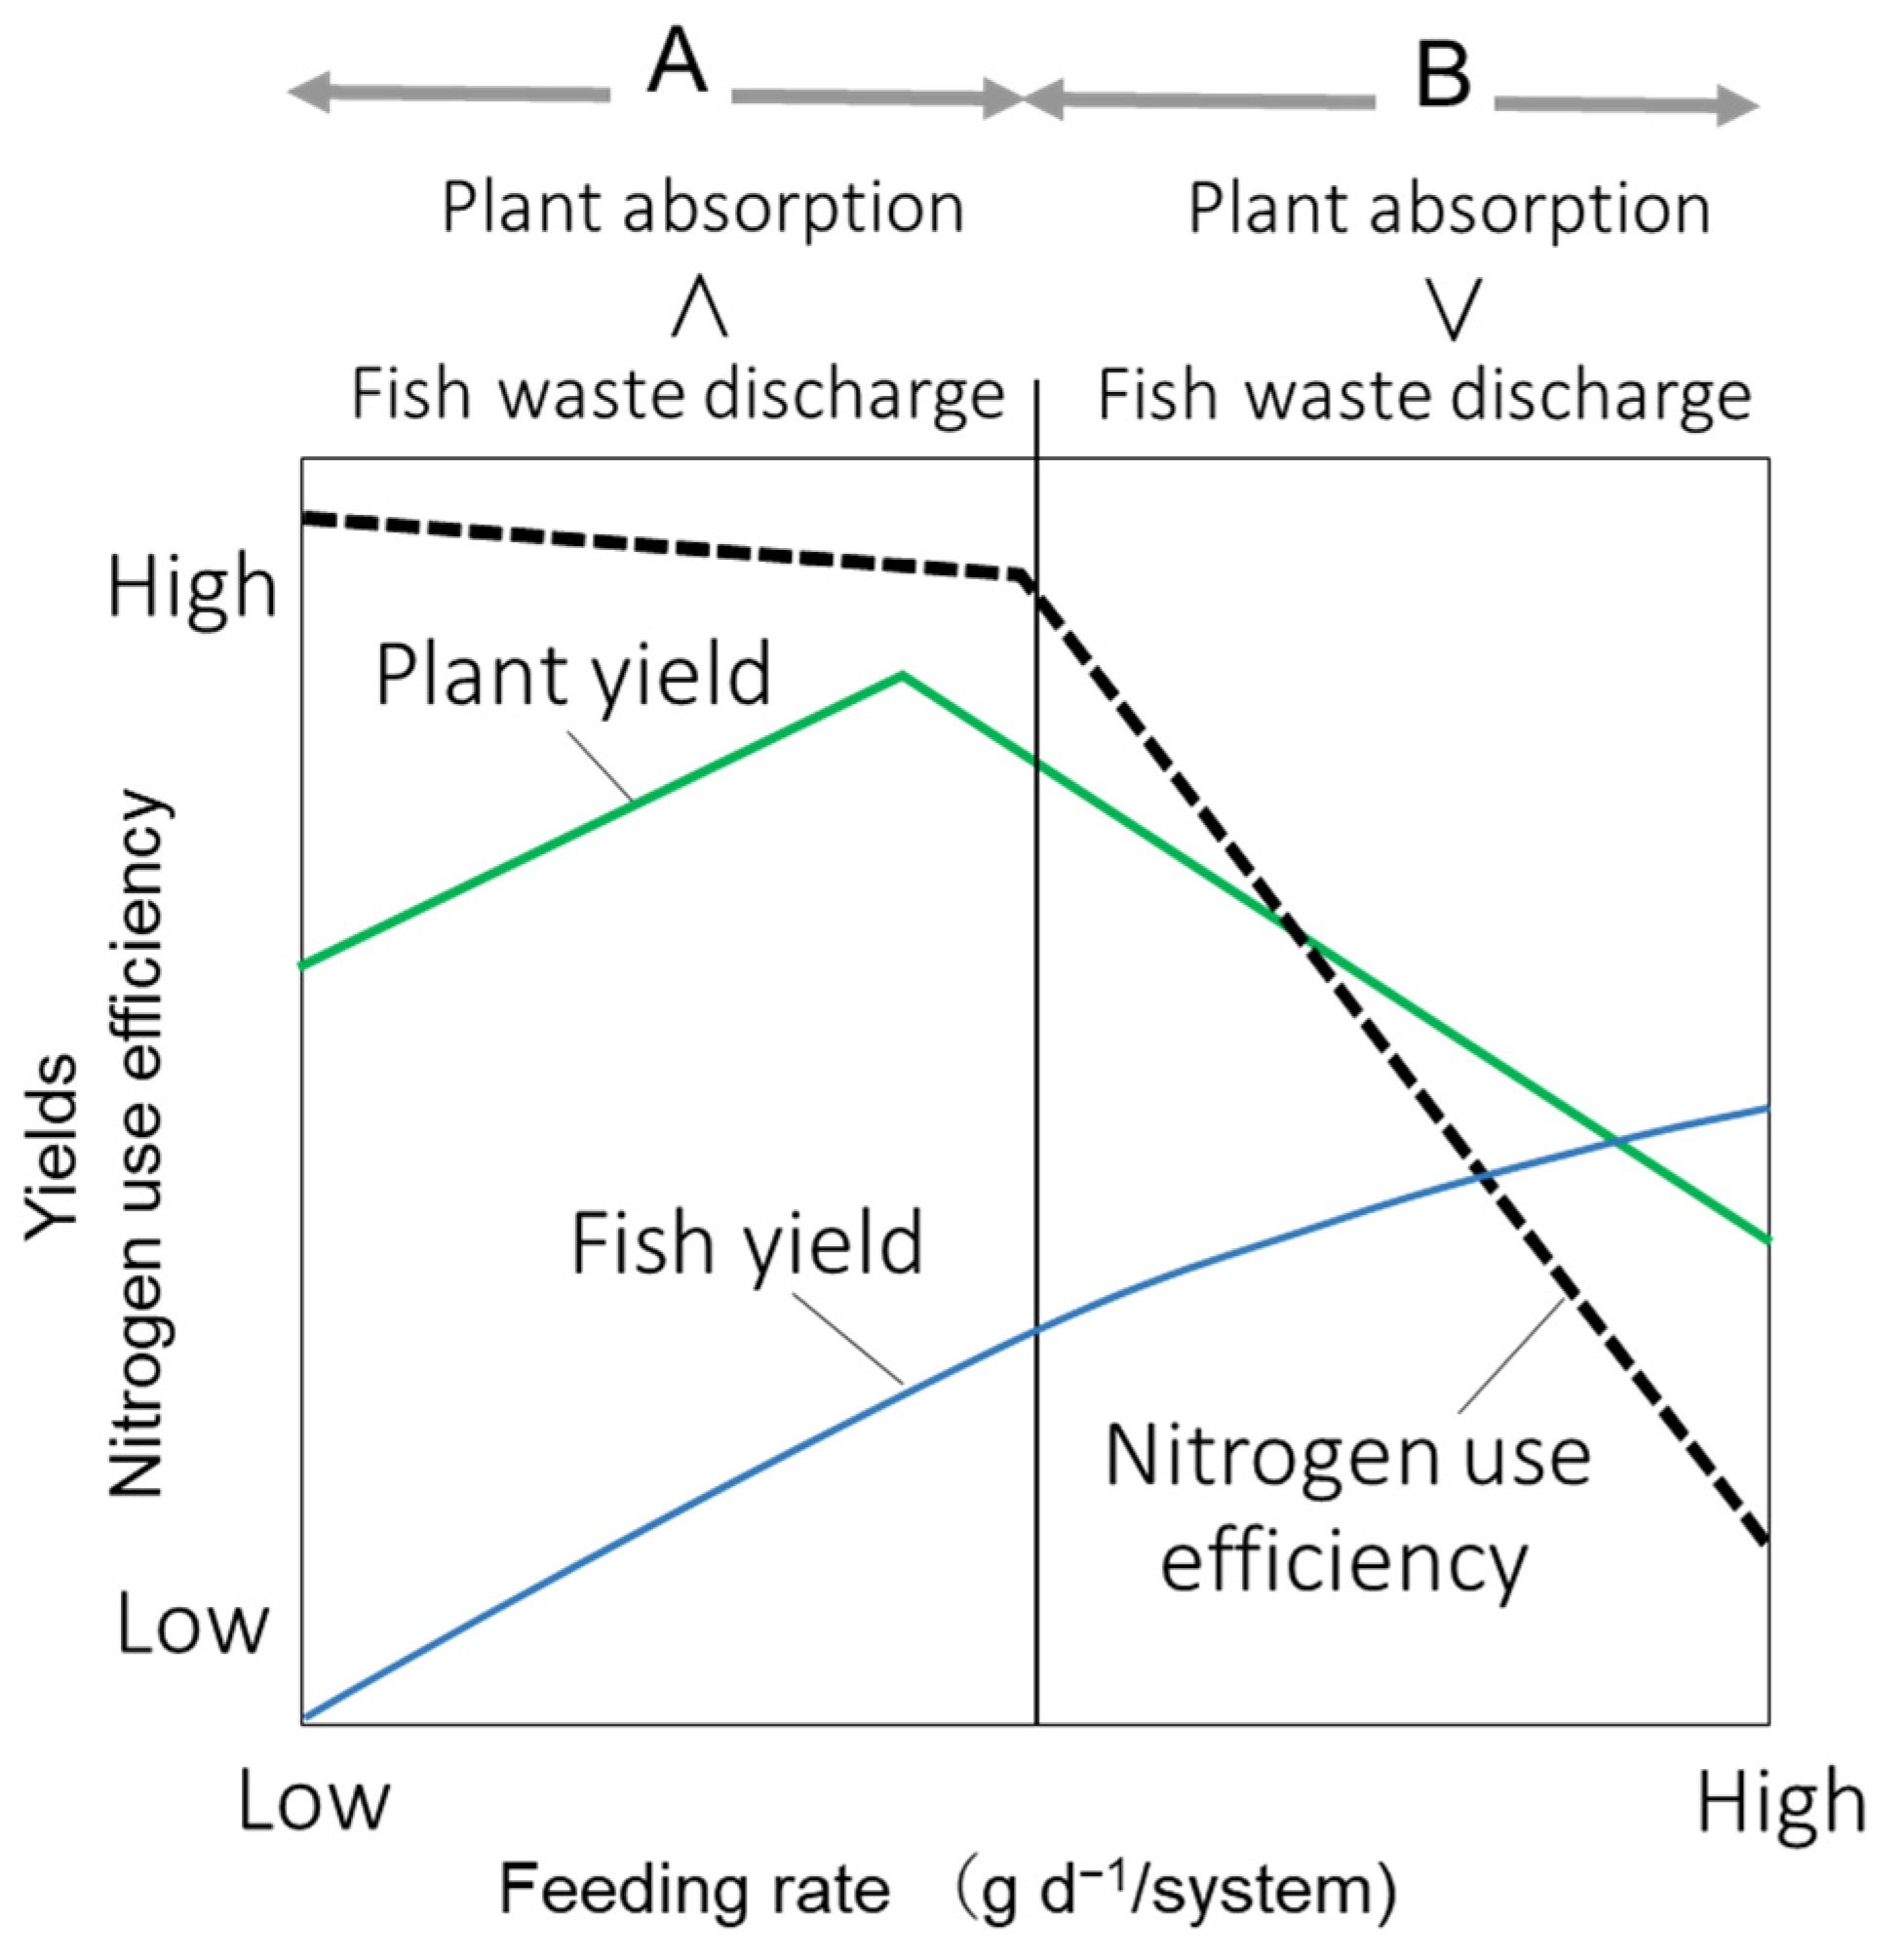
The effects of daily feeding rate per system on NUE in the aquaponic, aquaculture, and plant hydroponic cultivation subsystems are shown in Figure 8. In the feeding rate range of 0–1.5 g d−1/system, no significant changes in NUE were observed in each aquaponic system, aquaculture subsystem, and plant cultivation subsystem. In this feeding rate range, 80% of NUE in aquaponics was due to NUE in the plant hydroponic cultivation subsystem. However, above 1.5 g d−1/system, NUE decreased with increasing feeding rate per system. feeding rate range.

4. Discussion

In this study, macronutrients and micronutrients, excluding N compounds, met the requirements for lettuce growth when supplemented with chemical fertilizer. Therefore, the main fertilizer component that affects the growth of lettuce plants is N compounds, and an increase in nitrate and ammonium ions to threshold levels promotes the growth of lettuce plants.
In this experimental system, the optimal range of the feeding rate was 0.5–1.5 g d−1/system, and the dry weight of the lettuce plants was the same or slightly greater than that of the control hydroponic cultivation in this range (Figure 6); however, the FCR of the aquaponics system decreased significantly above the feeding rate of 2 g d−1/system (Figure 8a). Within the range of the feeding rate being 0.5–1.5 g d−1/system, the NUE of the aquaponic system was 0.88 on average (Figure 8a), indicating that approximately 90% of the supplied nitrogen was utilized for biological production. In this situation, the nitrogen supply from the fish feed was equivalent to approximately 7 mg-N d−1/plant, calculated based on a nitrogen compound ratio of 7.9% [w/w] in the feed.
The dry weight of lettuce plants increased as the feeding rate per system increased from 0.5 to 1.5 g d−1/system (Figure 6). However, when the feeding rate per system exceeded 2 g d−1/system, the growth rate of the lettuce plants decreased and was lower than that of the control hydroponic culture. The suppression of plant growth might correspond to NO2 accumulation in the water (Figure 7c). The dry weight of the lettuce plants was negatively correlated with the average NO2 concentration during each test period in both the first and second lettuce cultivation periods (Figure 7). The dry weight of head-type lettuce plants decreased by 14–24% when only 5 mg-N L−1 NO2 was present in the nutrient solution [32]. It has also been reported that an insufficient nitrogen supply in the early growth period leads to a decrease in biomass accumulated later, so nitrogen fertilization is essential in the early growth period [33].
It was initially assumed that there were sufficient nitrifying bacteria and that NO2 or NH4+ would not accumulate in the water; however, the accumulation of NO2 and NH4+ was confirmed in some test groups (Figure 7c,d). Figure 9 shows the effect of the NO2 concentration of the solution (from Figure 7c) on the growth of lettuce plants (Figure 5). The generation of NO2 tended to suppress the growth of lettuce plants at concentrations greater than 4 mg-N L−1 (Figure 9); thus, an improved medium that promotes nitrification is necessary. Typically, nitrification filters based on microbial oxidation are used [3]. However, issues such as the extended period for microorganisms to adapt to the filter, the need to maintain a high dissolved oxygen concentration in the water to supply the oxygen required for oxidation, and the high aeration cost have been noted [34]. In addition, the optimal pH values for lettuce plants and nitrifying bacteria differ. The optimum pH for the growth and activity of nitrifying bacteria is 7.8–8.0 [35,36]. In contrast, the pH of the nutrient solution used for hydroponic cultivation of lettuce plants should be preferably acidic. Increasing the pH from 5.8 to 7.0 reduced the dry weight of the aboveground parts of lettuce plants by approximately 23% [29]. Therefore, it may not be easy to adopt this method in simplified laboratory-scale cultivation and aquaculture systems, such as those used in this study. A more sophisticated system design on a commercial scale is necessary to provide plants, fish, and microorganisms with suitable pH values and other environments (Figure 4).
In this study, we did not observe the dynamics of the nitrifying bacteria in the system. However, the above fluctuations are thought to be caused by the balance between the rate at which ammonia is converted to nitrate via nitrite by nitrite and nitrate bacteria and the rate at which plants absorb nitrate. As the number of nitrite and nitrate bacteria in water increases, the rate of ammonia to nitrate is promoted. Because the surface of plant roots can act as a carrier for these microorganisms, root development is expected to promote their activity.
Figure 10 shows the effects of feeding rate per system on fish and plant production and NUE. When the plant nutrient absorption rate exceeds the fish excretion rate (Figure 10A), the amount of fertilizer components within it increases, and the plant yield increases with increasing fish excreta. The fish yield increases with increasing feeding rate per system (Figure 10A,B).
In an ideal case where satiation is not exceeded, no residual feed is produced, and most of the nitrogen contained in feed and chemical fertilizers is utilized for biological production, plant yields and the NUE of the entire system are maintained high.
When the plant nutrient absorption rate is lower than the loach excretion rate (Figure 10B), the fish yield increases with increasing feeding rate per system, whereas the amount of leftover feed increases because the amount of feeding exceeds the saturation amount. When the mass balance is disturbed by excessive discharge, harmful substances such as NH4+ and NO2 accumulate in the solution, thereby inhibiting plant and fish growth. When plant growth is inhibited, the rate of nitrogen absorption decreases, creating a negative spiral in which harmful nitrogen components accumulate.
In general, this scheme is applicable to aquaponics. However, quantitatively, it is considered to be dependent on the species and varieties of fish and plants in systems, biological conditions such as the density and activity of nitrifying bacteria, chemical conditions such as the ingredients of the feed and the supplemental chemical fertilizer, pH, physical environmental conditions such as temperature, light, atmospheric humidity, CO2 concentration, water volume, water circulation rate, and dissolved O2 concentration, and management conditions such as the frequency of exchanging water and the frequency of harvesting fish and plants.
In general, the total biomass of cultured fish increases over time in aquaponics. The present study did not investigate nutrient flow dynamics over time, including accumulation in loaches as they grew. To accurately manage nutrient flow in aquaponic systems, it will be necessary to explore the dynamics of nutrient flow over time using a system in which fish at different growth stages are cultured in multiple tanks and frequently harvested, while plants at various growth stages are simultaneously cultivated in a series of water cycles to keep the biomass of fish and plants throughout the system nearly constant [31].
Under the present experimental conditions, a feeding rate of approximately 1.5 g d−1/system maximized biological production while maintaining high nitrogen utilization efficiency. Technological improvements are necessary to increase biological productivity at higher feeding rates. Although this experimental model is small-scale and qualitative, it is expected to help construct practical production models that can achieve high biological production with high nitrogen utilization efficiency for various species and larger systems.
In addition, aquaponics, which combines aquaculture and vegetable hydroponic cultivation and can share water, reduces water consumption by half compared to when each system is conducted individually. Therefore, aquaponics is a promising method for sustainable aquacultural and agricultural food production that reduces not only chemical fertilizer use, but also water consumption.

5. Conclusions

The combined treatments of high feeding rates per fish and high fish density suppressed the growth of loach fish and lettuce plants mainly due to the accumulation of nitrite (NO2) and ammonium (NH4+).
It is concluded that a balance among feeding, fish density, and plant absorption capacity is essential to maintain the system sustainably from the following: (1) up to a threshold feeding rate, the nutrients in the fish waste contribute to plant growth and plant growth rates may be higher than those of control hydroponically grown plants, but above that threshold feeding rate, plant growth is inhibited by excessive fish waste loading, (2) up to a threshold feeding rate, the NUE was mostly constant in the system. However, above the threshold feeding rate, the NUE decreased with increasing feeding rate per system, (3) fish yield increased with increasing feeding rate per system, but a minimum FCR was found at the threshold feeding rate mentioned above, and (4) the NO2 concentration increased with increasing feeding rate per system and amount of fish excreta, which may be because the amount of NH4+ produced from the excreta exceeded the absorption capacity of the plants. This result was attributed to the amount of NH4+ generated from excreta exceeding the absorption capacity of lettuce plants. Developing a technology that can rapidly nitrify (NH4+ → NO2 → NO3) is necessary.

Author Contributions

Conceptualization, Y.K.; methodology, Y.K.; validation, Y.K., T.W., R.E. and T.S.; formal analysis, Y.K. and Y.S.; investigation, Y.K. and Y.S.; resources, K.N.; data curation, Y.K. and Y.S.; writing—original draft preparation, Y.K. and Y.S.; writing—review and editing, R.E. and T.S. All authors have read and agreed to the published version of the manuscript.

Funding

This research received no external funding.

Data Availability Statement

The original contributions presented in this study are included in the article. Further inquiries can be directed to the corresponding author.

Conflicts of Interest

Author Kenji Nakamura was employed by the company Espec Mic Corporation. The remaining authors declare that the research was conducted in the absence of any commercial or financial relationships that could be construed as a potential conflict of interest.

Abbreviations

The following abbreviations are used in this manuscript:
NUENitrogen use efficiency
FCRFeed conversion ratio

References

  1. Yamada, S. Development of Aquaponics Combined with Open Culture Adapting to Arid Regions for Sustainable Food Production. Science and Technology Research Partnership for Sustainable Development. 2015, pp. 1–20. Available online: https://www.macs-g20.org/fileadmin/macs/Annual_Meetings/2020_SaudiArabia/Documents/Activites/water__Energy__Food_Nexus/1.Session_1/1.4_Session_Mexico_Acuaponia_Tottori_CIBNOR_G20workshop_Final_26_ago_2020.pdf (accessed on 1 March 2022).
  2. Goddek, S.; Delaide, B.; Mankasingh, U.; Ragnarsdottir, K.V.; Jijakli, H.; Thorarinsdottir, R. Challenges of sustainable and commercial aquaponics. Sustainability 2015, 7, 4199–4224. [Google Scholar] [CrossRef]
  3. Wongkiew, S.; Hu, Z.; Chandran, K.; Lee, J.W.; Khanal, S.K. Nitrogen transformations in aquaponic systems: A review. Aquac. Eng. 2017, 76, 9–19. [Google Scholar]
  4. Endut, A.; Jusoh, A.; Ali, N.; Wan Nik, W.B. Nutrient removal from aquaculture wastewater by vegetable production in aquaponics recirculation system. Desalin. Water Treat. 2011, 32, 422–430. [Google Scholar]
  5. Neto, R.M.; Ostrensky, A. Nutrient load estimation in the waste of Nile tilapia Oreochromis niloticus (L.) reared in cages in tropical climate conditions. Aquac. Res. 2013, 46, 1309–1322. [Google Scholar]
  6. Petrea, S.M.; Cristea, V.; Dediu, I.; Contoman, M.; Ion, S.P.; Mocanu, M.C.; Antache, A. A Study of Nitrogen Cycle in an Integrated Aquaponic System with Different Plant Densities. Bull. UASVM Anim. Sci. Biotechnol. 2013, 70, 55–64. [Google Scholar]
  7. Shimakawa, Y.; Kitaya, Y.; Shibuya, T.; Endo, R. Plant Growth and Nitrogen Flow in an Aquaponics System Integrating Lettuce Hydroponics and Loach Aquaculture. Discov. Agric. Food Sci. 2023, 11, 89–95. [Google Scholar]
  8. Kitaya, Y.; Kawamoto, T.; Endo, R.; Shibuya, T. Effect of fish density on biological production in aquaponics combining lettuce hydroponics and loach aquaculture for controlled ecological life support systems in space. Front. Astron. Space Sci. 2023, 10, 1197402. [Google Scholar]
  9. Xu, G.; Fan, X.; Miller, A.J. Plant nitrogen assimilation and use efficiency. Annu. Rev. Plant Biol. 2012, 63, 153–182. [Google Scholar] [CrossRef]
  10. Yang, T.; Kim, H.J. Characterizing nutrient composition and concentration in tomato-, basil-, and lettuce-based aquaponic and hydroponic systems. Water 2020, 12, 1259. [Google Scholar] [CrossRef]
  11. Tyson, R.V.; Simonne, E.H.; White, J.M.; Lamb, E.M. Reconciling water quality parameters impacting nitrification in aquaponics: The pH levels. Proc. Fla. State Hortic. Soc. 2004, 117, 79–83. [Google Scholar]
  12. Yildiz, H.Y.; Robaina, L.; Pirhonen, J.; Mente, E.; Domínguez, D.; Parisi, G. Fish welfare in aquaponic systems: Its relation to water quality with an emphasis on feed and feces—A review. Water 2017, 9, 13. [Google Scholar] [CrossRef]
  13. Kasozi, N.; Tandlich, R.; Fick, M.; Kaiser, H.; Wilhelmi, B. Iron supplementation and management in aquaponic systems: A review. Aquac. Rep. 2019, 15, 100221. [Google Scholar]
  14. Vandam, D.A.; Anderson, T.S.; De Villiers, D.; Timmons, M.B. Growth and tissue elemental composition response of spinach (Spinacia oleracea) to hydroponic and aquaponic water quality conditions. Horticulturae 2017, 3, 32. [Google Scholar] [CrossRef]
  15. Raun, W.R.; Solie, J.B.; Johnson, G.V.; Stone, M.L.; Mutten, R.W.; Freeman, K.W.; Thomason, W.E.; Lukina, E.V. Improving nitrogen use efficiency in cereal grain production with optical sensing and variable rate application. Agron. J. 2002, 94, 815–820. [Google Scholar]
  16. Rathke, G.W.; Behrens, T.; Diepenbrock, W. Integrated nitrogen management strategies to improve seed yield, oil content and nitrogen efficiency of winter oilseed rape (Brassica napus L.): A review. Agric. Ecosyst. Environ. 2006, 117, 80–108. [Google Scholar]
  17. Fang, Y.; Hu, Z.; Zou, Y.; Fan, J.; Wang, Q.; Zhu, Z. Increasing economic and environmental benefits of media-based aquaponics through optimizing aeration pattern. J. Clean. Prod. 2017, 162, 1111–1117. [Google Scholar]
  18. Groenveld, T.; Kohn, Y.Y.; Gross, A.; Lazarovitch, N. Optimization of nitrogen use efficiency by means of fertigation management in an integrated aquaculture-agriculture system. J. Clean. Prod. 2019, 212, 401–408. [Google Scholar]
  19. Love, D.C.; Fry, J.P.; Li, X.; Hill, E.S.; Genello, L.; Semmens, K.; Thompson, R.E. Commercial aquaponics production and profitability: Findings from an international survey. Aquaculture 2015, 435, 67–74. [Google Scholar]
  20. Kitaya, Y.; Hirai, H.; Islam, A.F.M. An aquaponic system with hydroponic culture of sweet potato and tilapia culture. J. Agric. Ecol. Res. Int. 2022, 23, 62–72. [Google Scholar]
  21. Benlì, A.Ç.K.; Köksal, G. The acute toxicity of ammonia on tilapia (Oreochromis niloticus L.) larvae and fingerlings. Turk. J. Vet. Anim. Sci. 2005, 29, 339–344. [Google Scholar]
  22. Miao, W.; Wang, W. Trends of aquaculture production and trade: Carp, tilapia, and shrimp. Asian Fish. Sci. 2020, 33, 1–10. [Google Scholar]
  23. Maucieri, C.; Nicoletto, C.; Zanin, G.; Birolo, M.; Trocino, A.; Sambo, P.; Borin, M.; Xiccato, G. Effect of stocking density of fish on water quality and growth performance of European Carp and leafy vegetables in a low-tech aquaponic system. PLoS ONE 2019, 14, e0217561. [Google Scholar] [CrossRef] [PubMed]
  24. Oladimeji, S.A.; Okomoda, V.T.; Olufeagba, S.O.; Solomon, S.G.; Abol-Munafi, A.B.; Alabi, K.I.; Hassan, A. Aquaponics production of catfish and pumpkin: Comparison with conventional production systems. Food Sci. Nutr. 2020, 8, 2307–2315. [Google Scholar] [PubMed]
  25. Petrea, Ş.M.; Cristea, V.; Dediu, L.; Contoman, M.; Stroe, M.D.; Antache, A.; Coadă, T.; Placinta, S. Vegetable production in an integrated aquaponic system with stellate sturgeon and spinach–Matador variety. Sci. Pap. Anim. Sci. Biotechnol. 2014, 47, 235. [Google Scholar]
  26. Fadhilah, N.; Estim, A.; Fatihah, S.N. Water quality and growth performance of giant freshwater prawn, Macrobrachium rosenbergii and green bean, Phaseolus vulgaris in aquaponics system at different flow rates. Trans. Sci. Technol. 2019, 6, 1–8. [Google Scholar]
  27. Chu, Y.T.; Brown, P.B. Evaluation of Pacific whiteleg shrimp and three halophytic plants in marine aquaponic systems under three salinities. Sustainability 2020, 13, 269. [Google Scholar] [CrossRef]
  28. Ministry of Education. Standard Tables of Food Composition in Japan. 2020. Available online: https://www.mext.go.jp/a_menu/syokuhinseibun/mext_01110.html (accessed on 10 January 2022).
  29. Anderson, T.S.; De Villiers, D.; Timmons, M.B. Growth and tissue elemental composition response of butterhead lettuce (Lactuca sativa, cv. flandria) to hydroponic and aquaponic conditions. Horticulturae 2017, 3, 43. [Google Scholar] [CrossRef]
  30. Delaide, B.; Goddek, S.; Gott, J.; Soyeurt, H.; Jijakli, M.H. Lettuce (Lactuca sativa L. var. Sucrine) growth performance in complemented aquaponic solution outperforms hydroponics. Water 2016, 8, 467. [Google Scholar] [CrossRef]
  31. Goddek, S.; Espinal, C.A.; Delaide, B.; Jijakli, M.H.; Schmautz, Z.; Wuertz, S.; Keesman, K.J. Navigating toward decoupled aquaponic systems: A system dynamics design approach. Water 2016, 8, 303. [Google Scholar] [CrossRef]
  32. Hoque, M.M.; Ajwa, H.A.; Smith, R. Nitrite and Ammonium Toxicity on Lettuce Grown under Hydroponics. Commun. Soil Sci. Plant Anal. 2007, 39, 207–216. [Google Scholar] [CrossRef]
  33. Farnesellia, M.; Benincasaa, P.; Tostia, G.; Simonneb, E.; Guiduccia, M.; Tei, F. High fertigation frequency improves nitrogen uptake and crop performance in processing tomato grown with high nitrogen and water supply. Agric. Water Manag. 2015, 154, 52–58. [Google Scholar] [CrossRef]
  34. Gichana, Z.M.; Liti, D.; Waidbacher, H.; Zollitsch, W.; Drexler, S.; Waikibia, J. Waste management in recirculating aquaculture system through bacteria dissimilation and plant assimilation. Aquac. Int. 2018, 26, 1541–1572. [Google Scholar] [CrossRef]
  35. Jones, R.D.; Hood, M.A. Effects of temperature, pH, salinity, and inorganic nitrogen on the rate of ammonium oxidation by nitrifiers isolated from wetland environments. Microb. Ecol. 1980, 6, 339–347. [Google Scholar] [CrossRef]
  36. Antoniou, P.; Hamilton, J.; Koopman, B.; Jain, R.; Holloway, B.; Lyberatos, G.; Svoronos, S.A. Effect of temperature and pH on the effective maximum specific growth rate of nitrifying bacteria. Water Res. 1990, 24, 97–101. [Google Scholar] [CrossRef]
Figure 1. A schematic of an aquaponics experiment combining loach aquaculture and hydroponic lettuce cultivation.
Water 17 00963 g001
Figure 2. Timeline of this experiment.
Water 17 00963 g002
Figure 3. Time course of loach fresh weight.
Water 17 00963 g003
Figure 4. (a) Fish yield and (b) feed conversion ratio (FCR) affected by the feeding rate per system. The yield is the weight increment of the total fish during the culture period.
Water 17 00963 g004
Figure 5. Time course of the fresh weight of lettuce plant weight.
Water 17 00963 g005
Figure 6. Effects of daily feeding rates on leaf lettuce growth.
Water 17 00963 g006
Figure 7. Concentrations of total nitrogen, nitrate nitrogen, nitrite nitrogen, and ammonium nitrogen in solutions according to fish density during the two experimental periods.
Water 17 00963 g007
Figure 8. Effects of daily feeding rate per system on nitrogen use efficiency (NUE) in (a) aquaponics (fish + plants), (b) aquaculture (fish), and (c) plant cultivation (difference between the values in (a,b) at each feeding rate).
Water 17 00963 g008
Figure 9. Effects of nitrite concentration on the dry weight of leaf lettuce in aquaponics.
Water 17 00963 g009
Figure 10. Expected trends in plant and fish yields and nitrogen use efficiency in aquaponics as affected by daily feeding rates per system. (A,B) show the range in which the plant nutrient absorption rate exceeds the fish excretion rate and the reverse range.
Water 17 00963 g010
Table 1. Components of the fish feed.
ComponentContent (%)
Protein43
Lipid7
Crude fiber3
Ash20
Phosphorus1.7
Moisture10
Table 2. Concentrations of chemical fertilizer elements.
ElementsConcentration (mg L−1)
Anmonium-N12
Nitrate-N117
P2O560
K2O203
CaO115
MgO30
MnO0.75
B2O30.75
Fe1.35
Cu0.015
Zn0.045
Mo0.015
Table 3. Outline of the experimental treatments.
Fish Density
(fish L−1)
No. of Fish
(fish)
No. of Lettuce
(plant)
Feeding RateNitrogen Supply
by Feeding
(mg-N d−1/plant)
(g d−1/fish)(g d−1/system)
0.515150.030.452.4
1.0300.904.7
1.5451.357.1
0.515150.060.904.7
1.0301.809.4
1.5452.7014.1
0.515150.091.357.1
1.0302.7014.1
1.5454.0521.2
0 (Hydroponics)-15---
Table 4. Effects of feeding rates and fish density on FCR.
FCR
Feeding rate
(g d−1/fish)
0.032.0 ± 0.5a
0.061.3 ± 0.1b
0.091.4 ± 0.2b
Fish density
(fish L−1)
0.51.7 ± 0.4a
1.01.5 ± 0.2ab
1.51.5 ± 0.1ab
Notes: The value is the mean ± standard error (n = 15–45). The different letters indicate the significant difference (Tukey–Kramer test, p < 0.05).
Table 5. Fresh and dry weights and water contents of lettuce plants in each treatment at the end of the first and second planting period.
Fish Density
(fish L−1)
Feeding RateFresh Weight (g/plant)Dry Weight (g/plant)Water Contents
(%)
(g d−1/fish)(g d−1/system)First Second First Second
0.50.030.45159 ± 10a134 ± 4ab5.9 ± 0.5ab5.0 ± 0.2a96.3 ± 0.3a
1.00.90162 ± 7a146 ± 5ab6.0 ± 0.3ab5.3 ± 0.2a96.3 ± 0.3a
1.51.35139 ± 4abc128 ± 4abc6.0 ± 0.2ab4.8 ± 0.2a95.6 ± 0.3a
0.50.060.90157 ± 5ab121 ± 4b5.9 ± 0.2ab4.8 ± 0.1a96.2 ± 0.3a
1.01.80121 ± 6c131 ± 5ab5.2 ± 0.3abc5.0 ± 0.2a95.7 ± 0.3ab
1.52.7082 ± 5d108 ± 3c4.5 ± 0.3bcd4.3 ± 0.1a94.5 ± 0.2c
0.50.091.35123 ± 11bc132 ± 4ab5.0 ± 0.5abcd5.2 ± 0.1a95.9 ± 0.3ab
1.02.7069 ± 4d112 ± 7b3.6 ± 0.2d4.6 ± 0.3a94.8 ± 0.2c
1.54.0580 ± 4d43 ± 2d3.8 ± 0.1cd2.9 ± 0.1b95.3 ± 0.2b
0 (Hydroponics) 134 ± 9abc108 ± 5c5.2 ± 0.3abc4.7 ± 0.2a96.1 ± 0.3a
Notes: The value is the mean± standard error (n = 15). The different letters indicate the significant difference (Tukey Kramer test, p < 0.05).
Disclaimer/Publisher’s Note: The statements, opinions and data contained in all publications are solely those of the individual author(s) and contributor(s) and not of MDPI and/or the editor(s). MDPI and/or the editor(s) disclaim responsibility for any injury to people or property resulting from any ideas, methods, instructions or products referred to in the content.

