Article

Optimization and Evaluation of Wetland Ecological Networks for Mitigating Urban Flooding

1
School of Environment, Northeast Normal University, Changchun 130117, China
2
State Environmental Protection Key Laboratory of Wetland Ecology and Vegetation Restoration, School of Environment, Northeast Normal University, Changchun 130117, China
*
Author to whom correspondence should be addressed.
Water 2025, 17(10), 1461; https://doi.org/10.3390/w17101461
Submission received: 27 March 2025 / Revised: 19 April 2025 / Accepted: 12 May 2025 / Published: 12 May 2025

Abstract

:
Innovative solutions are needed for urban flooding exacerbated by climate change. In light of this, this study developed an integrated framework for urban wetland flood control that combines Morphospatial Pattern Analysis (MSPA), minimum cumulative resistance (MCR) modeling, and complex network theory for optimizing an ecological network of flood control and mitigation wetlands in Changchun, China. The results show that the optimized ecological network significantly improved connectivity and flood mitigation efficiency. The node degree increased from 2.737 to 3.433, and the average clustering coefficient exhibited an increase from 0.074 to 0.231, enhancing material flow efficiency. Robustness analysis revealed that the optimized network’s connectivity robustness improved by 12.6%, 18.4%, and 24.1% under random, malicious, and controlled attack scenarios, respectively. Additionally, ecological corridors with a width of 30–50 m were identified as the optimal range for water conveyance potential, effectively dispersing peak runoff and reducing flood risk. This study provides both a transferable methodology for flood-resilient planning and specific policy actions, including priority conservation of high-betweenness nodes and restoration of fragmented wetlands, offering practical solutions for high-density cities facing similar climate challenges.

Graphical Abstract

1. Introduction

Urban flooding has emerged as a pressing global challenge, with increasing frequency and intensity of extreme rainfall events under climate change [1]. Rapid urbanization has further exacerbated flood risks through landscape fragmentation and increased impervious surfaces [2]. According to the China Climate Change Blue Book 2023 and the 2023 China Climate Bulletin, the average annual precipitation in China has shown an increasing trend from 1961 to 2022, with flood disasters causing direct economic losses exceeding CYN 330.6 billion in 2023, accounting for 44.2% of total meteorological disaster impacts. This highlights the urgent need for innovative flood management solutions that complement traditional gray infrastructure [3].
Wetlands have long been recognized for their flood mitigation capacity, functioning as natural sponges that can store floodwaters and reduce peak flows by 30–50% [4,5]. The vegetation structure of wetlands, including trees and root systems, additionally contributes to floodwater retardation [6]. However, the effectiveness of individual wetlands is often limited during extreme events, emphasizing the importance of wetland connectivity through ecological networks [7]. While the concept of ecological networks was first proposed in the 1980s [8], its application to urban flood management remains underexplored, particularly in high-density urban environments.
Recent advances in landscape ecology have provided powerful tools for ecological network analysis. Morphological Spatial Pattern Analysis (MSPA) has proven effective in identifying core habitat patches and ecological corridors [9,10], while Minimum Cumulative Resistance (MCR) models offer robust approaches for corridor extraction [11,12]. However, these methods have primarily been applied to biodiversity conservation [13], with limited attention paid to their potential in flood mitigation planning. Furthermore, the integration of complex network theory, which has transformed network analysis across multiple disciplines [14], remains scarce in wetland ecological studies [15].
The current research landscape reveals three critical gaps. First, most wetland flood mitigation studies focus on individual wetland functions [16,17], neglecting the systematic analysis of wetland networks. Second, existing ecological network studies often overlook quantitative assessments of network connectivity and robustness [18], despite their importance for flood resilience. Third, there is limited integration between wetland network optimization and urban planning policies, such as China’s Sponge City Initiative [19], which could significantly enhance practical implementation.
This study addresses these gaps through an integrated approach combining MSPA, MCR modeling, and complex network theory, with Changchun City as a case study. Changchun represents a typical high-density urban area facing increasing flood risks, as evidenced by the catastrophic impacts of Typhoon Doksuri in 2023. Our research makes three key contributions: (1) We develop a novel framework for constructing flood mitigation-oriented wetland ecological networks; (2) we introduce complex network metrics to quantitatively evaluate network connectivity and robustness; and (3) we provide policy-relevant optimization strategies tailored to urban flood management needs.
The findings of this study offer significant implications for urban planning and flood risk reduction. By demonstrating the effectiveness of optimized wetland networks in enhancing urban flood resilience, we provide a scientific basis for ecological security planning in high-density cities. Furthermore, our integrated methodology bridges the gap between theoretical ecology and practical urban management, offering a transferable approach for cities facing similar challenges worldwide.

2. Materials and Methods

2.1. Study Area

Changchun is located in the mid-latitude region of the Northern Hemisphere, on the eastern coast of the Eurasian continent, in the heart of the Northeast China Plain. The climate of Changchun is characterized by a temperate continental semi-humid monsoon climate, with distinct seasons and simultaneous rainfall and heat during the summer. Annual precipitation ranges from 600 to 700 mm, primarily concentrated in the summer months, especially July and August, which account for about 35% of annual rainfall. Consequently, flooding is more likely during the high-precipitation summer months. Winter precipitation is minimal, mainly in the form of snow. Changchun City administratively consists of 7 districts, 1 county, and 3 county-level cities, covering a total area of 24,592 km2. The total water resources in Changchun amount to 1203 million m3, with groundwater resources totaling 356 million m3. The total wetland area is 2420.9 km2, accounting for 9.84% of the city’s total land area. The focus of this study is the main urban area of Changchun, including the districts of Kuancheng, Erdao, Lvyuan, Nanguan, and Chaoyang, which are densely populated and highly urbanized (Figure 1).

2.2. Data Sources

Daily precipitation data were obtained from the China Daily Precipitation Dataset provided by the National Tibetan Plateau Data Center (https://data.tpdc.ac.cn/home) (accessed on 4 June 2024). Topographic data were sourced from the ASTER GDEM 30M resolution digital elevation data available on the Geographic Information System (https://www.gscloud.cn/home) (accessed on 8 October 2024). Land cover data were derived from the Sentinel-2 10 m land use/land cover time series of the world, produced by Impact Observatory and Esri (https://livingatlas.arcgis.com/landcoverexplorer/#mapCenter) (accessed on 13 May 2024) [20]. Administrative boundary data and other relevant data were obtained from the Resource and Environment Science and Data Center of the Chinese Academy of Sciences (https://www.resdc.cn/) (accessed on 12 October 2024).

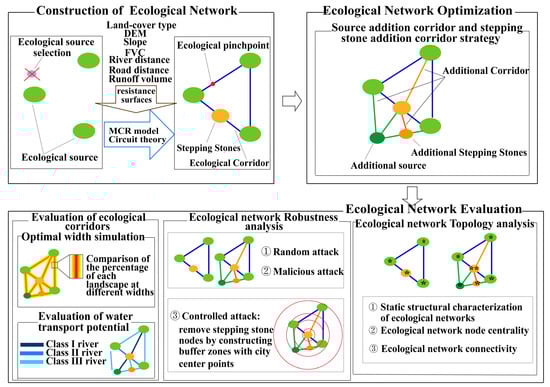
2.3. Construction of Ecological Networks

2.3.1. Identification of Ecological Source

Ecological sources are areas within the landscape that play a critical role in maintaining ecological processes and biodiversity, forming the foundation of ecological network construction [9,10,13]. These sources also play a significant role in regional flood control. Morphological Spatial Pattern Analysis (MSPA) is a method based on the geometric characteristics of landscapes for identifying and classifying important ecological elements [10,21]. MSPA uses image processing techniques to divide the foreground into seven landscape types: core, bridge, islet, edge, perforation, branch, and loop. Morphological Spatial Pattern Analysis (MSPA) was applied to classify wetland and water bodies (foreground) into seven landscape types using GuidosToolbox 3.0. Then, spatial autocorrelation analysis (Moran’s I index) was performed based on the results of the MSPA to verify the level of significant clustering of high-importance core patches.
Setting a minimum area threshold for ecological sources is an important method for screening ecological sources [22,23]. Considering the impact of patch area thresholds on the number and total area of ecological sources, a patch area-based screening strategy was developed. Area thresholds of 0.5, 1, 3, 5, 7, 9, 10, 20, 30, 50, and 100 hm2 were used to count the number and area of patches. Given the importance of wetland water storage capacity in mitigating flood disasters, surface water storage capacity was used to analyze ecological sources. Surface water storage capacity (calculated via ArcGIS’s Surface Volume tool) and patch area were normalized and equally weighted to derive the Source Importance Score (SIS). To validate source selection, we conducted supplementary multi-criteria ranking using Promethee II (see Supplementary S1).
X = x x min / x max x min
S I S = A x + V x
where x is the sample value, xmin and xmax are the minimum and maximum sample values, Ax is the normalized area index, Vx is the normalized surface water storage capacity index, and SIS is the Source Importance Score. A higher SIS indicates greater importance of the source patch.

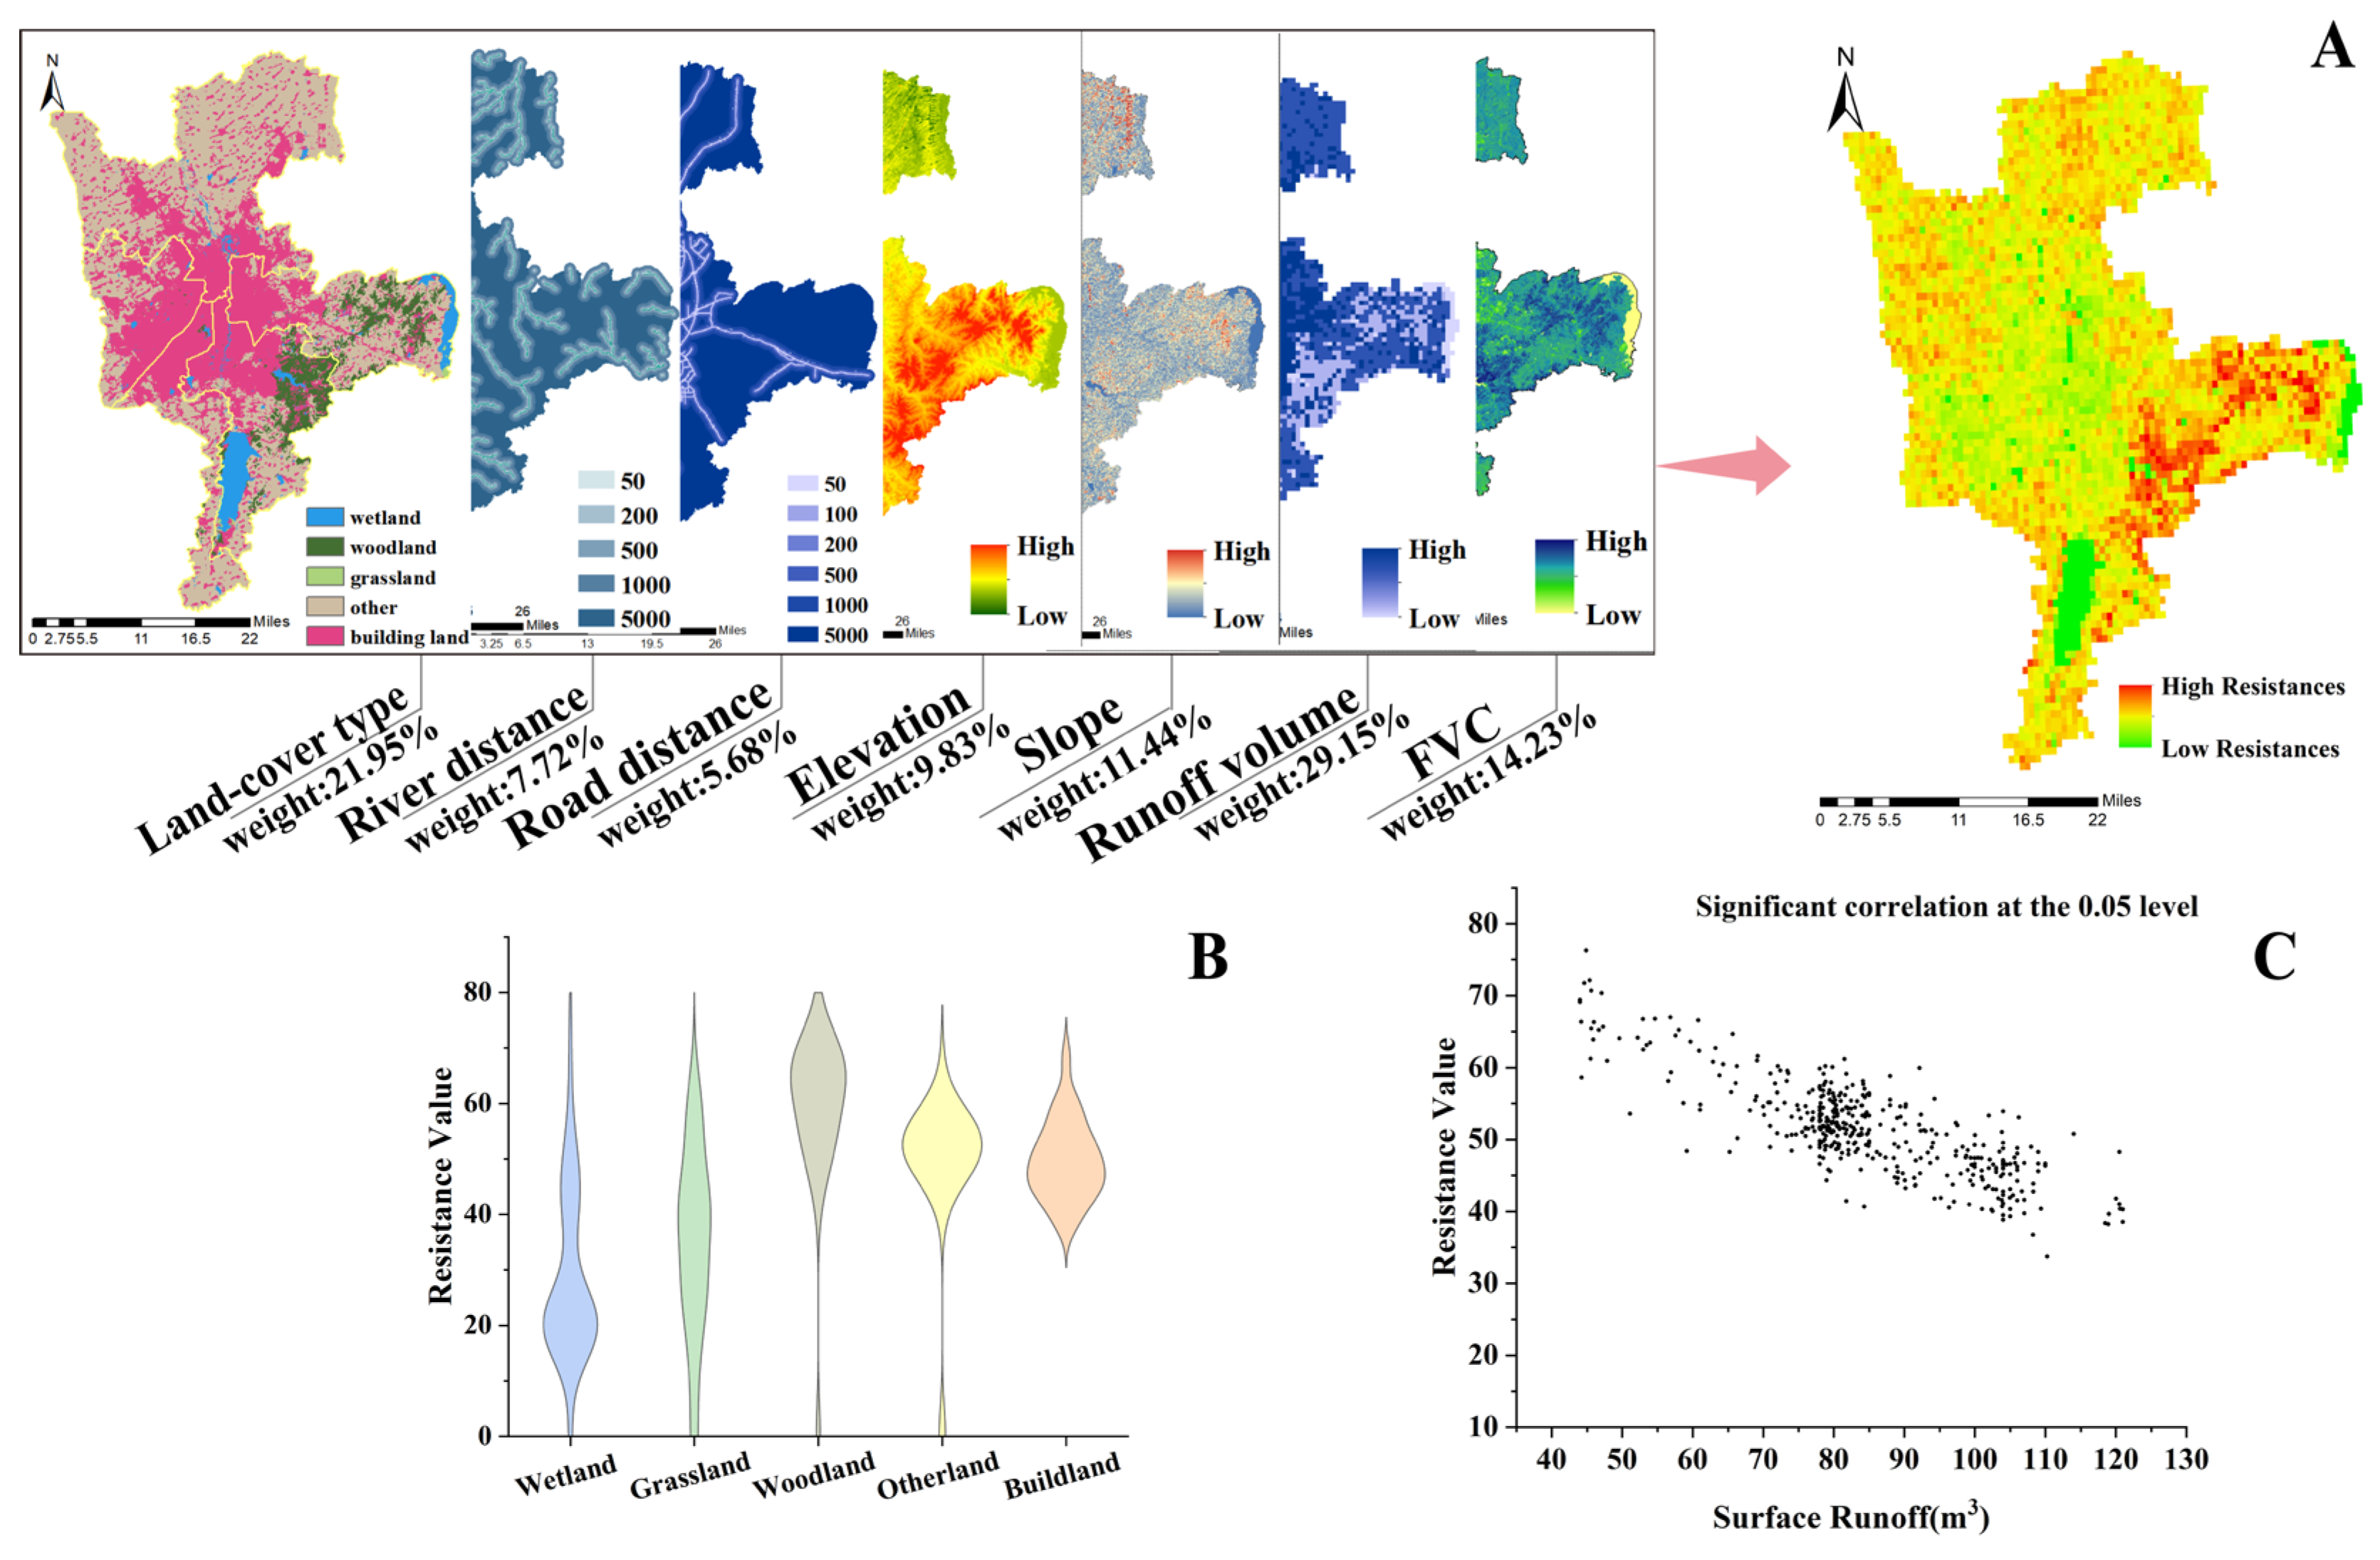
2.3.2. Construction of Resistance Surfaces

The resistance surface reflects the degree of interference or obstruction that material must overcome when moving between different landscape units [21]. In the context of flooding, the resistance surface reflects the ease of flood flow within a region. This study integrated natural (elevation, slope, soil permeability, FVC, river proximity) and anthropogenic factors (land cover, road proximity) (Table 1) to construct a comprehensive resistance surface (Table 1). Data for elevation, slope, vegetation coverage, distance to rivers, land cover types, and distance to roads were sourced as described in Section 2.2. The SCS-CN model, based on soil permeability, was used to calculate surface runoff [24,25]. Higher soil permeability results in weaker flood formation and flow, creating resistance. This study used the SCS-CN model to calculate surface runoff, indirectly reflecting soil permeability (Supplementary S2). AHP-weighted factors were combined via ArcGIS’s Raster Calculator (Supplementary S3).

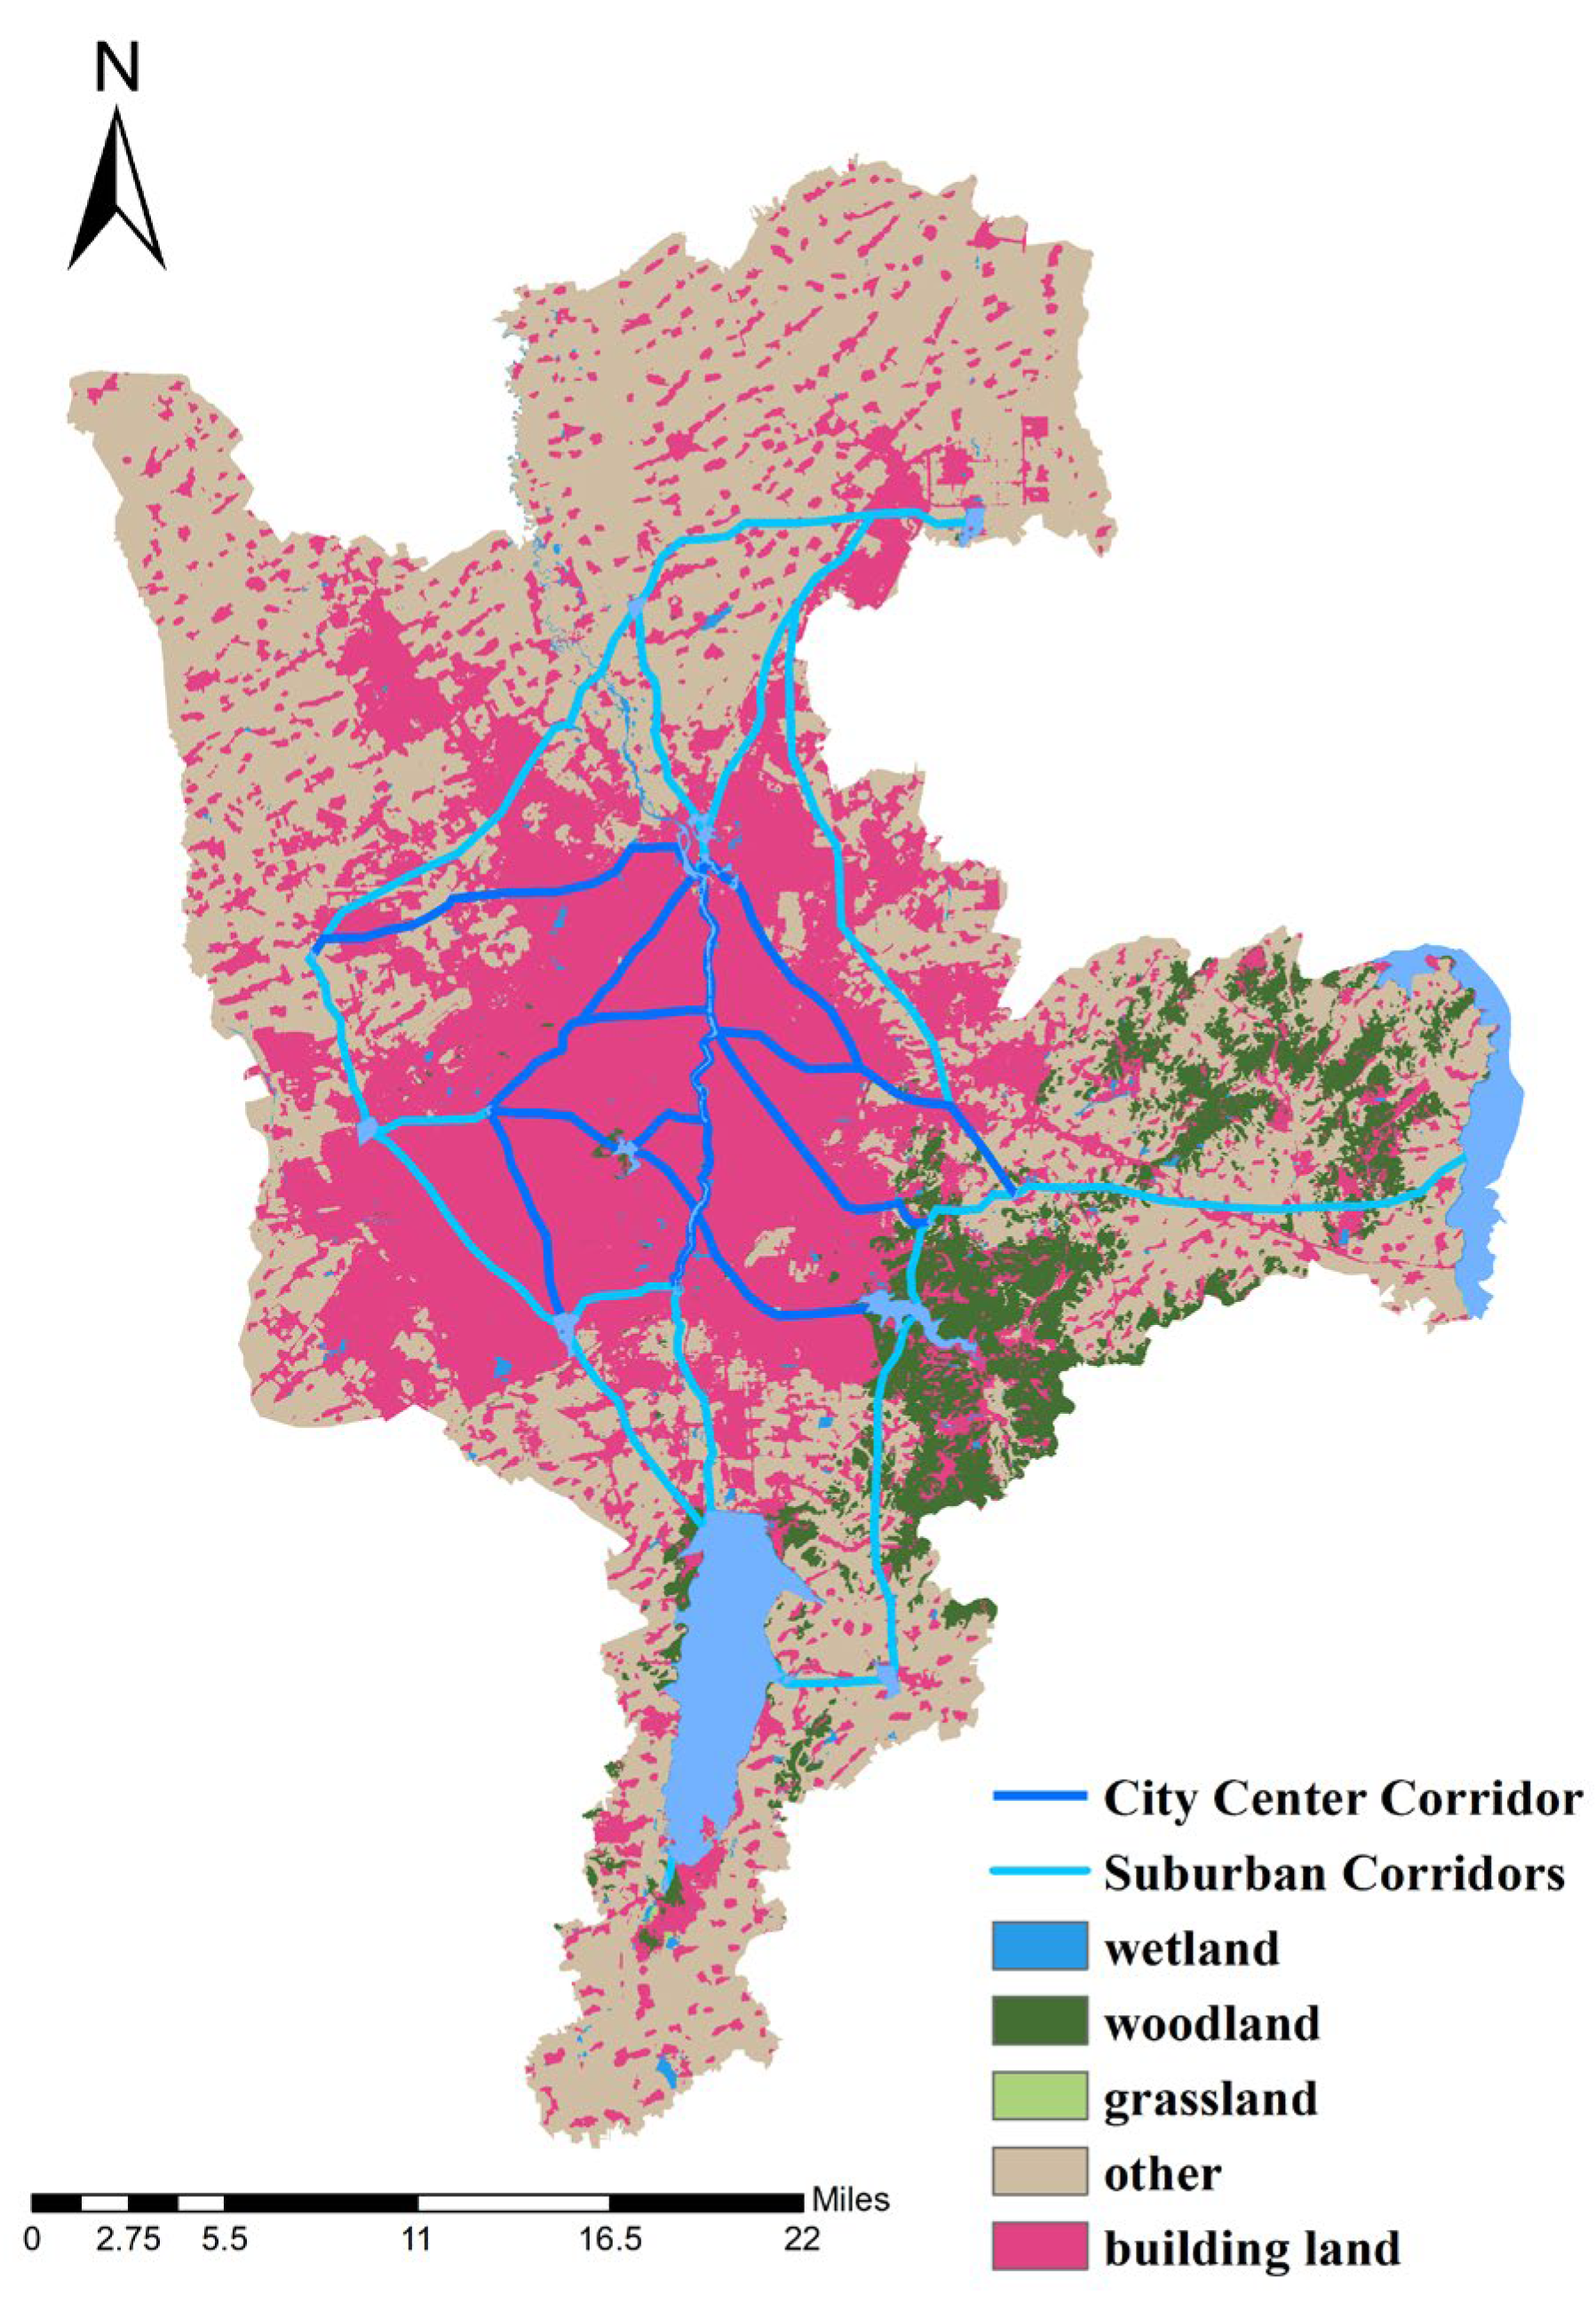
2.3.3. Extraction of Ecological Corridors

Ecological corridors are channels that connect different ecological sources within the landscape, playing a crucial role in ecosystems. For flood diffusion, ecological corridors can serve as channels for flood conveyance, mitigating flood disasters. Ecological corridors are typically extracted using the Minimum Cumulative Resistance (MCR) method. This method calculates the cumulative resistance value along the path from one ecological source to another to determine the optimal path for flood migration and diffusion [12,26]. The Cost Path tool and Linkage Mapper toolbox in ArcGIS automated corridor extraction.
M C R = f min j = n i = m D i j × R i
where fmin is the Minimum Cumulative Resistance positively correlated with the ecological process, Dij is the spatial distance from ecological source i to j, Ri is the resistance value at ecological source i, n is the number of source points, and m is the number of resistance surface grids.

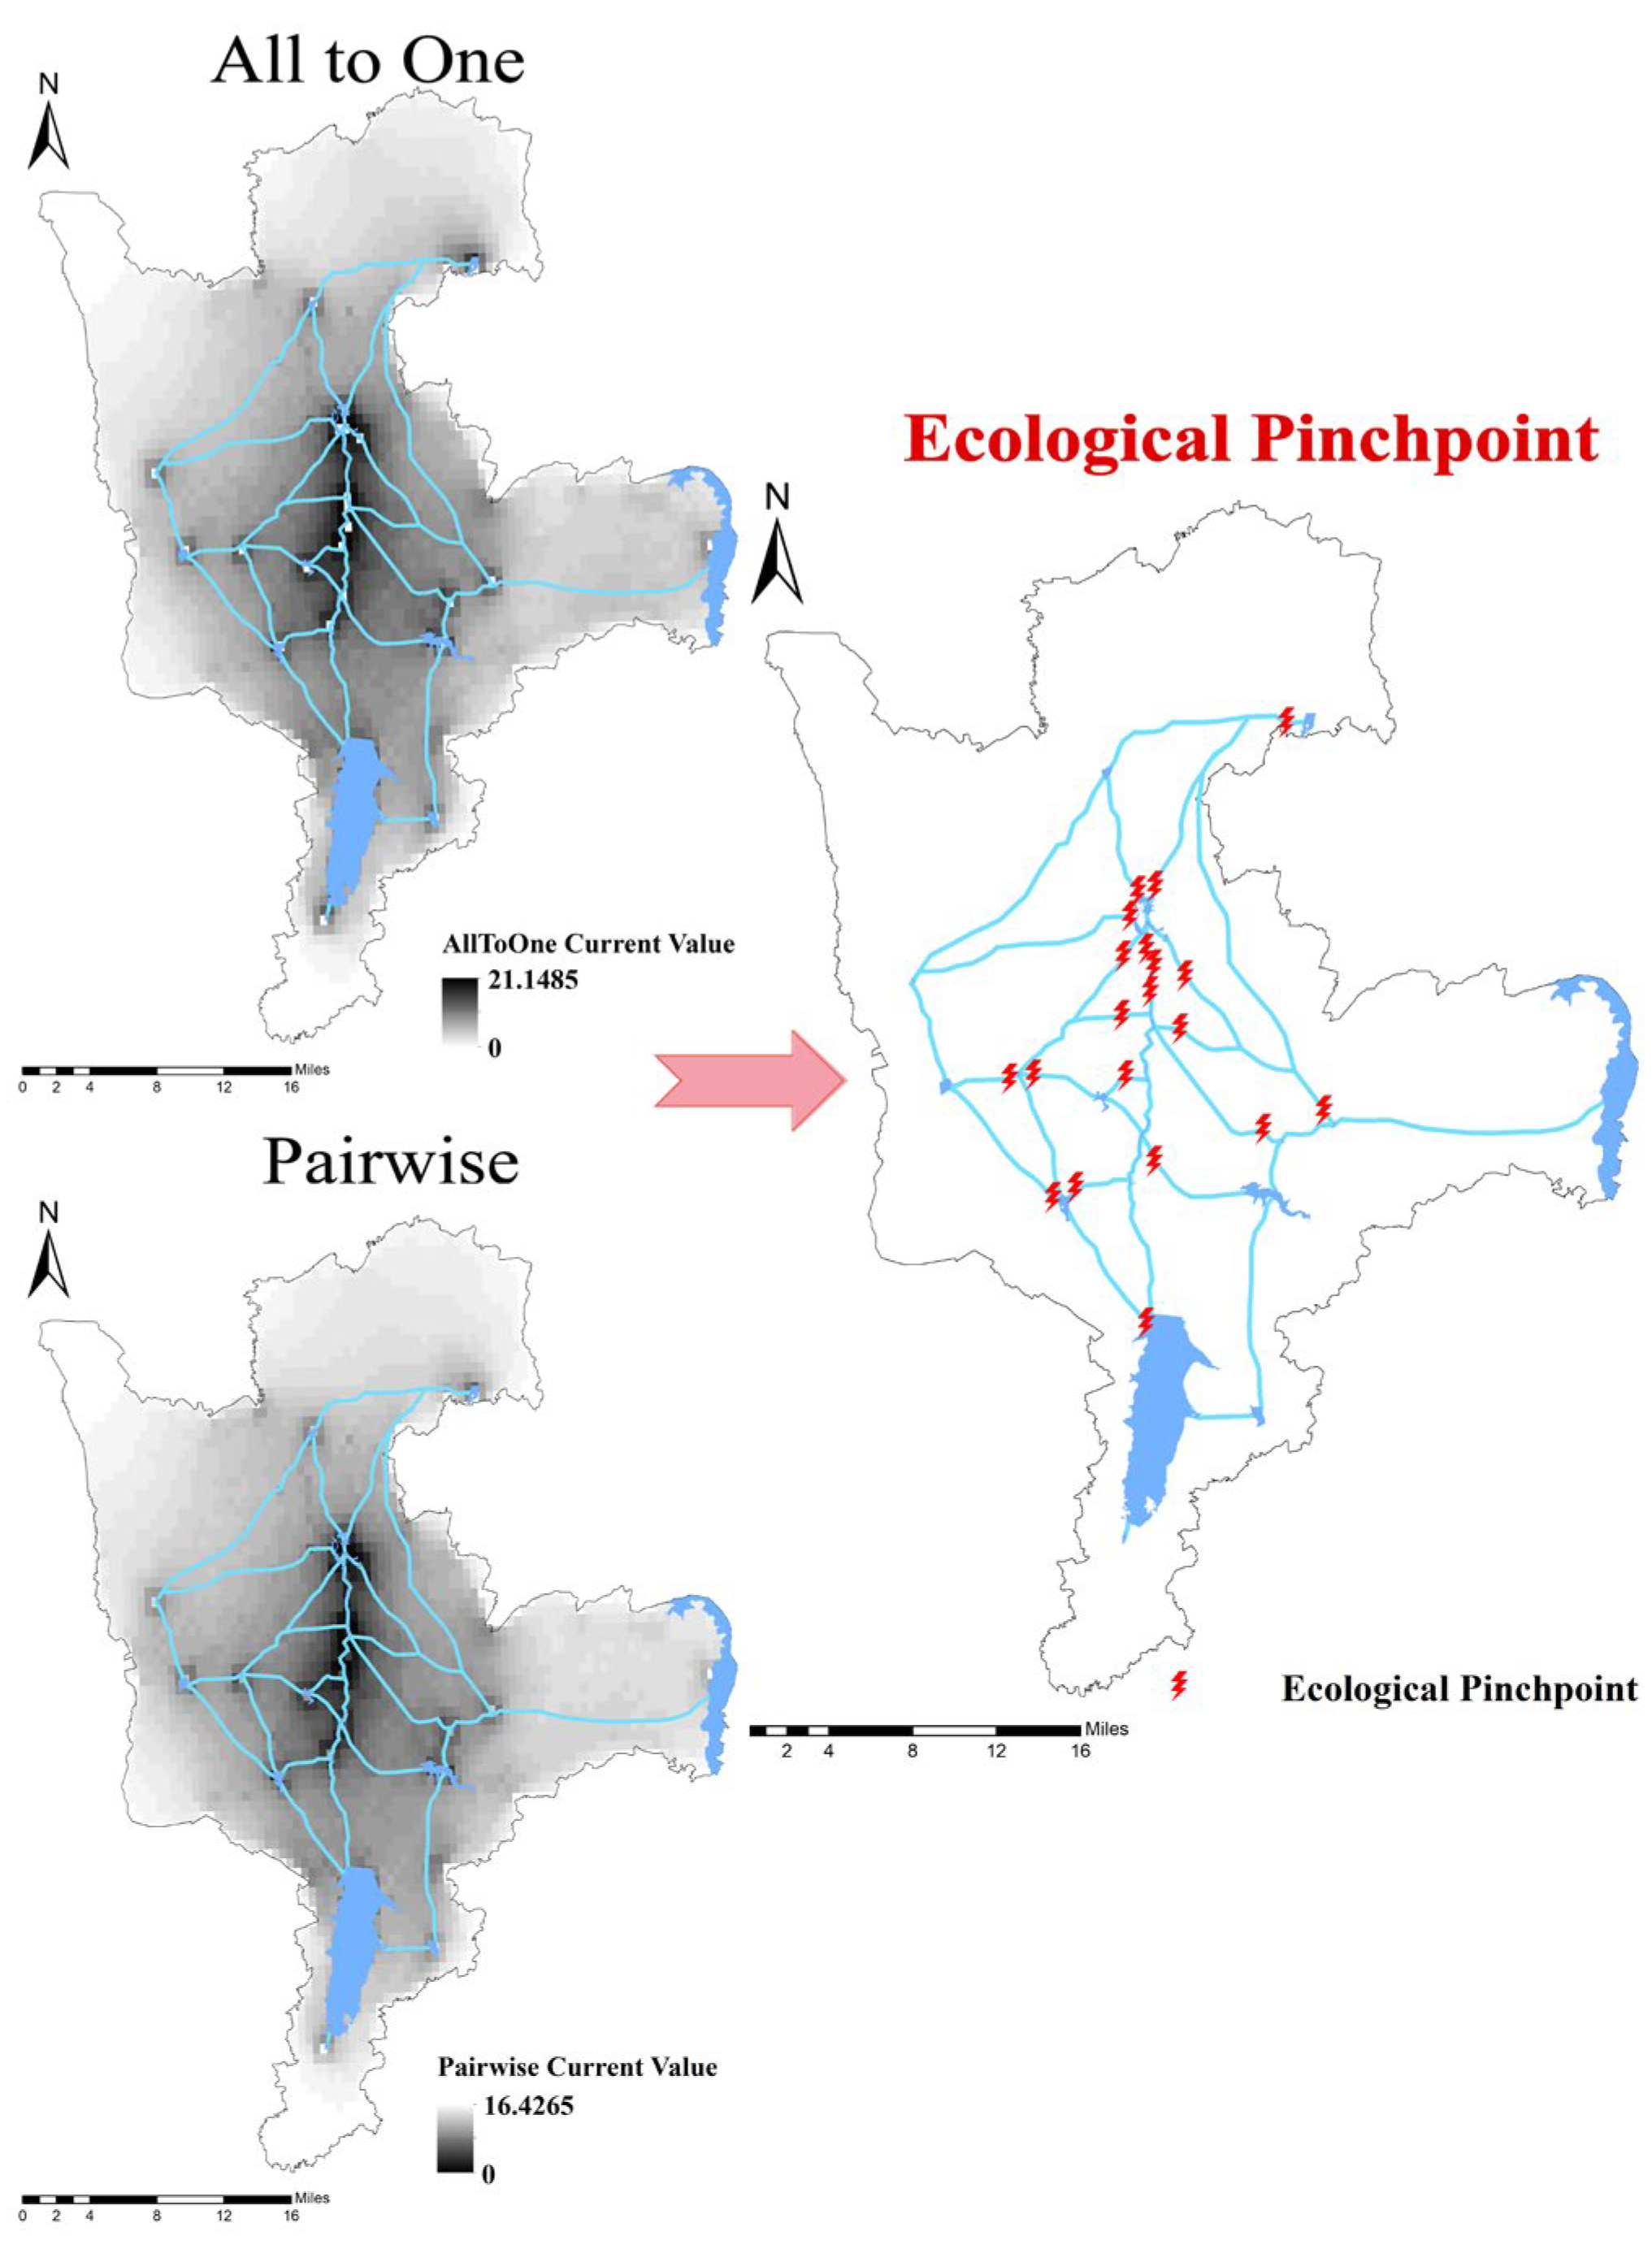
2.3.4. Extraction of Ecological Pinch Points and Stepping Stones

Circuit theory analogizes ecological flows in landscapes to electron flows in circuits, where landscape elements are treated as conductors with different resistance values [23]. Ecological pinch points are areas with low resistance values in the ecological network, crucial for maintaining ecological stability and overall network connectivity [27]. Based on this theory, landscape elements can be assigned different resistance values based on their obstruction to flood flow. Low resistance values at pinch points indicate high flood flow capacity, making them beneficial for flood discharge [28]. Circuit theory identified pinch points (low-resistance flood flow zones) via Pinchpoint Mapper and Circuitscape.
Stepping stone patches are small patches scattered between large ecological patches, forming channels for material migration, enhancing connectivity between large patches, and increasing the frequency of material flow between patches [29]. By increasing the number and optimizing the spatial distribution of stepping stone patches, the dispersion of source patches can be reduced, improving corridor density, connectivity strength, and ecosystem stability [30]. Stepping stones (>0.5 hm2) were selected from wetland–corridor overlaps to enhance connectivity.

2.4. Ecological Network Optimization Strategies

This study supplemented ecological sources based on landscape connectivity indices and implemented edge addition strategies using stepping stone patches to optimize the structure and function of the ecological network. Within this framework, ecological sources were defined as source nodes, while stepping stone patches were treated as stepping stone nodes. By expanding ecological sources and constructing potential networks of stepping stone patches, the ecological service function radiation range of sources to surrounding areas was expanded, fully leveraging the ecological potential of stepping stone patches [31,32]. This approach not only enhanced the connectivity of the ecological network but also improved its overall functionality [19].
Landscape connectivity is a key indicator for measuring the level of patch connectivity within a region, playing a significant role in evaluating landscape patterns and functions [33,34]. This study selected the Probability of Connectivity (PC) and the Patch Importance Index (dPC) to assess the connectivity of ecological sources. Given that smaller patches in the study area may contribute significantly to landscape connectivity, an area threshold of 3 hm2 was set, and landscape connectivity indices were used to screen source supplement patches. The Conefor 2.6 software package was used to calculate the landscape connectivity indices of ecological sources, with a connectivity probability threshold of 0.5. The relevant index formulas are as follows:
P C = i = 1 n j = 1 n a i a j p i j * / A L 2
d P C = P C P C r e m / P C × 100
where ai and aj are the areas of patch i and patch j, respectively,   p i j * is the maximum value of the product of the probability of all paths between patch i and patch j, A L is the total area of the landscape in the study area, PC is the probable connectivity index of a patch within the landscape of the study area, PCrem is the probable connectivity index of a patch after removing a particular patch, and dPC denotes the heaviness of a patch, with a higher value of dPC indicating higher contribution to landscape connectivity by the patch.

2.5. Evaluation of Optimized Ecological Network

2.5.1. Topological Structure Analysis of the Ecological Network

The topological structure of an ecological network refers to the organizational relationship between all nodes in the ecosystem. Ecological sources and corridors were abstracted as nodes and edges in the network. Given the multidirectional nature of energy flow in ecological networks, this study assumed the wetland ecological network to be an undirected complex network. The analysis was conducted from three dimensions: basic static structural characteristics, node centrality, and network connectivity. The metrics included node degree, node centrality, clustering coefficient, network diameter, and average path length (Supplementary S4). These calculations were performed using Gephi 0.10. The optimization of the ecological network’s topological structure significantly impacts the efficiency of material and energy flow [35,36].
Node degree reflects the number of connections each node has, while node centrality reveals the importance of nodes within the network. The clustering coefficient indicates the tightness of local connections around a node, and the network diameter and average path length reflect the maximum and average distances between any two nodes in the network, respectively. Longer network diameters and average path lengths indicate greater resistance to material and energy flow within the network. These metrics collectively reflect the efficiency and stability of the network.

2.5.2. Robustness Analysis Based on Complex Network Theory

This study introduced robustness analysis from complex network theory to comprehensively evaluate the robustness of the optimized wetland ecological network. To assess changes in the robustness of the optimized ecological network, two key metrics were selected: connectivity robustness (Rc) and global efficiency (E). These metrics effectively evaluate the structural stability of complex networks under attack and changes in the network’s ability to transmit material and energy [35]. Node removal experiments were conducted to observe changes in these metrics after node removal, thereby evaluating the robustness of the complex network. The formulas for connectivity robustness and global efficiency are as follows:
R c = C max / n n
E = i j G 1 d i j · 1 n n 1
where Cmax is the number of nodes in the maximum connected subgraph of the current network, n is the total number of nodes, n is the number of nodes removed, i and j denote nodes, G is the set of nodes, and E0 is the global efficiency of the initial network.
This study designed three node removal scenarios to evaluate the robustness of the ecological network under different disturbances. The first scenario was random attack, simulating the random impact of natural disasters on the ecological network by randomly removing nodes to test network stability. The second scenario was malicious attack, simulating human-induced damage to key nodes by removing nodes in descending order of node degree to test the network’s sensitivity to the loss of key nodes. The third scenario was controlled attack, simulating the gradual impact of urban expansion on the ecological network. Seven circular buffers with intervals of 2 km, 5 km, 10 km, 15 km, 20 km, 30 km, and 40 km were constructed around the centroid of the study area, and nodes were removed within each buffer based on node degree. This scenario aimed to simulate the impact of urban development on the robustness of the ecological network under the policy of protecting ecological sources. Specifically, the third scenario targeted only stepping stone nodes in the optimized ecological network to assess the specific impact of urban development-induced loss of stepping stone patches on network structural robustness.

2.5.3. Evaluation of Optimized Ecological Corridors

Ecological corridors, as channels with width information, have width as a key factor in evaluating corridor function [37,38]. Therefore, this study aimed to analyze the optimal width for ecological corridor construction in the study area, considering the potential interference of different widths on corridor construction and material flow within the corridor. Based on the study scale, buffer zones of 10, 20, 30, 50, 100, 150, 300, and 500 m were set using the buffer tool in ArcGIS 10.8, and the proportion of different landscape elements within each buffer zone was calculated.
Furthermore, the river network was extracted and classified using the hydrological analysis function in Arc GIS’s Spatial Analyst toolbox. This process primarily involved calculating surface runoff based on flow direction and flow accumulation rasters and classifying surface runoff with a certain flow using the STRAHLER method [39]. This method simulates the differences in surface runoff after rainfall based on topographic factors, resulting in different levels of potential runoff. After river network classification, the optimized network’s ecological corridors were overlaid with the river network to classify the water conveyance potential of ecological corridors. This step aimed to assess the water conveyance potential of ecological corridors and identify key water conveyance channels.

3. Results

3.1. Construction of the Ecological Network

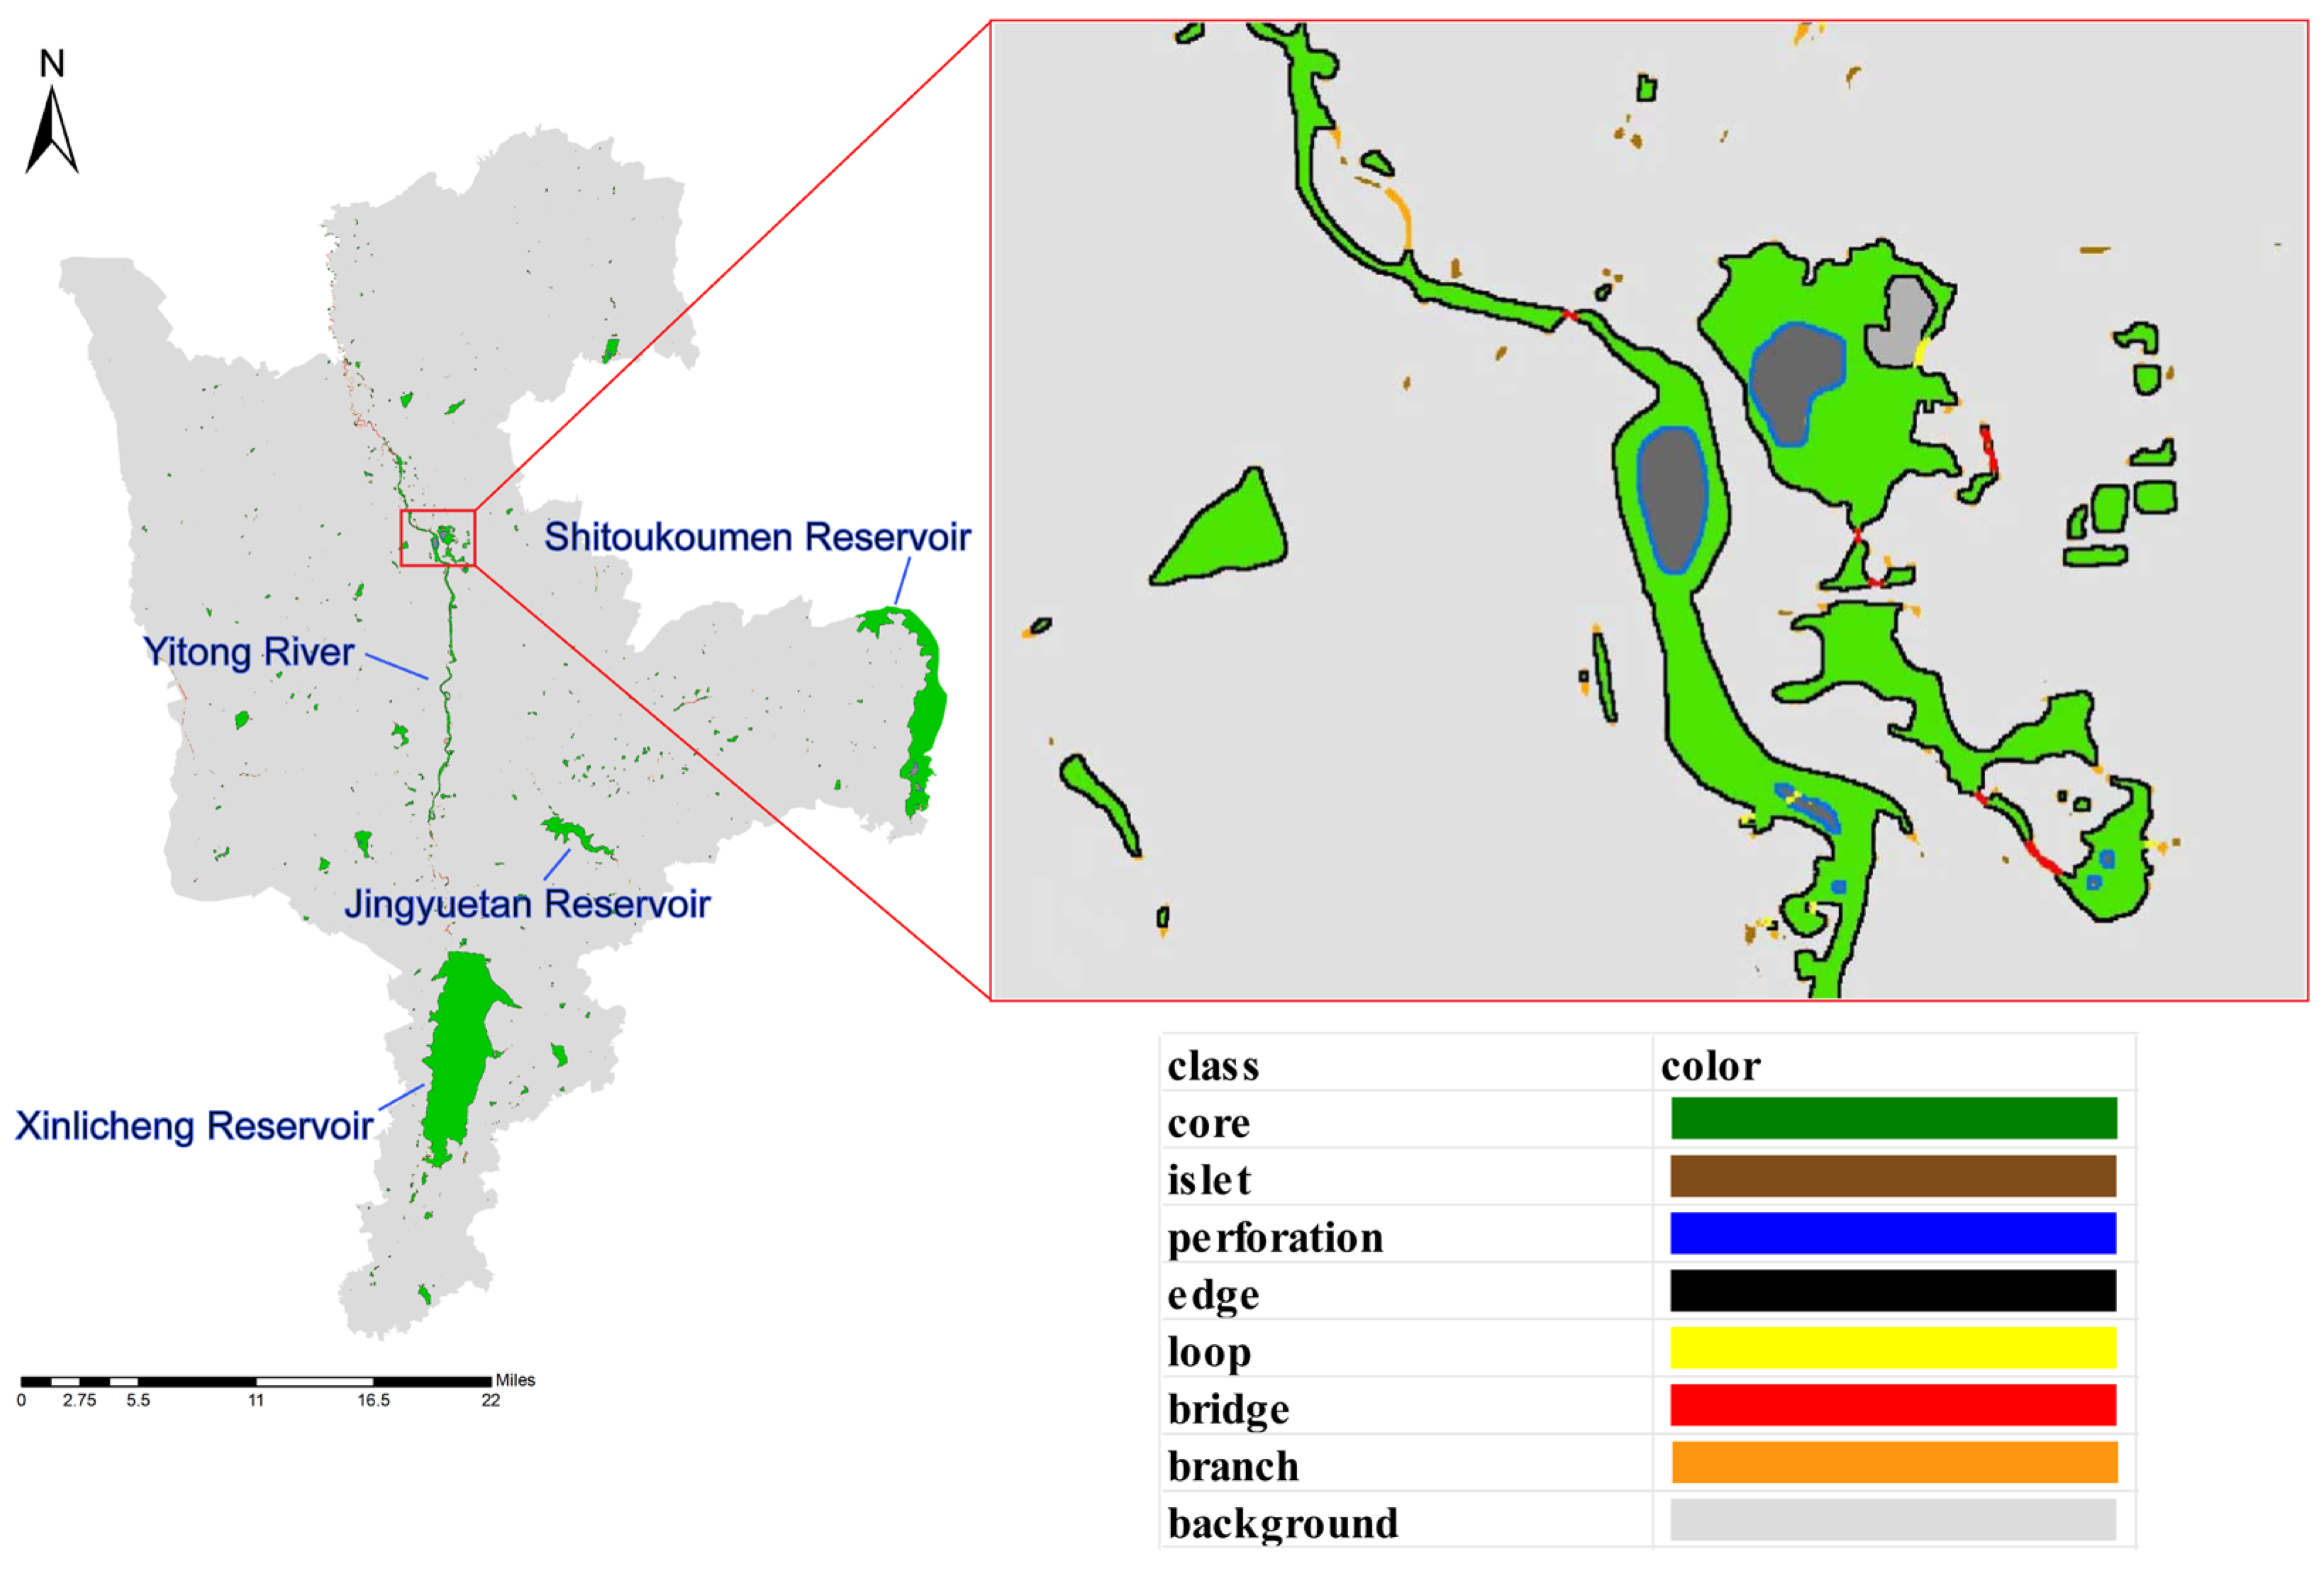
3.1.1. Selection of Ecological Sources

  • Identification of Wetland Landscape Elements Based on MSPA
The MSPA results revealed distinct spatial patterns of wetland patches in Changchun (Figure 2). Core areas (87.11% of total wetland area) were predominantly clustered along the Yitong River and around major reservoirs (e.g., Xinlicheng, Shitoukoumen), forming the backbone of the ecological network. Edge areas (9.64%) exhibited a fragmented distribution, indicating transitional zones between wetlands and urban land. Notably, islet patches (0.99%) were spatially isolated, primarily located in the northern suburbs, suggesting vulnerability to connectivity loss. Bridge patches (0.61%) were concentrated at hydrological confluences, serving as critical junctions for floodwater dispersion.
Spatial autocorrelation analysis (Moran’s I = 0.32, p < 0.05) confirmed significant clustering of high-importance core patches. This pattern aligns with the “source–sink” theory, where centralized core areas enhance flood storage capacity, while dispersed edge/islet patches weaken landscape connectivity. The MSPA spatial metrics (Table 2) quantitatively support these observations, providing a foundation for subsequent corridor optimization.
The core area covered 10,937.65 hm2, accounting for 87.11% of the total area. Other elements, such as bridge, islet, edge, perforation, branch, and loop, accounted for less than 10% each. The edge and branch areas followed, covering 1210.91 hm2 and 155.32 hm2, respectively, accounting for 9.64% and 1.24%. The islet area covered 124.6 hm2, accounting for 0.99%, indicating that nearly 1% of wetlands were weakly connected, forming “isolated islands”. The bridge area covered 76.82 hm2, accounting for 0.61%, mainly distributed at river and water body connections. The perforation and loop areas were the smallest, covering 33.64 hm2 and 17.63 hm2, accounting for 0.14% and 0.27%, respectively.
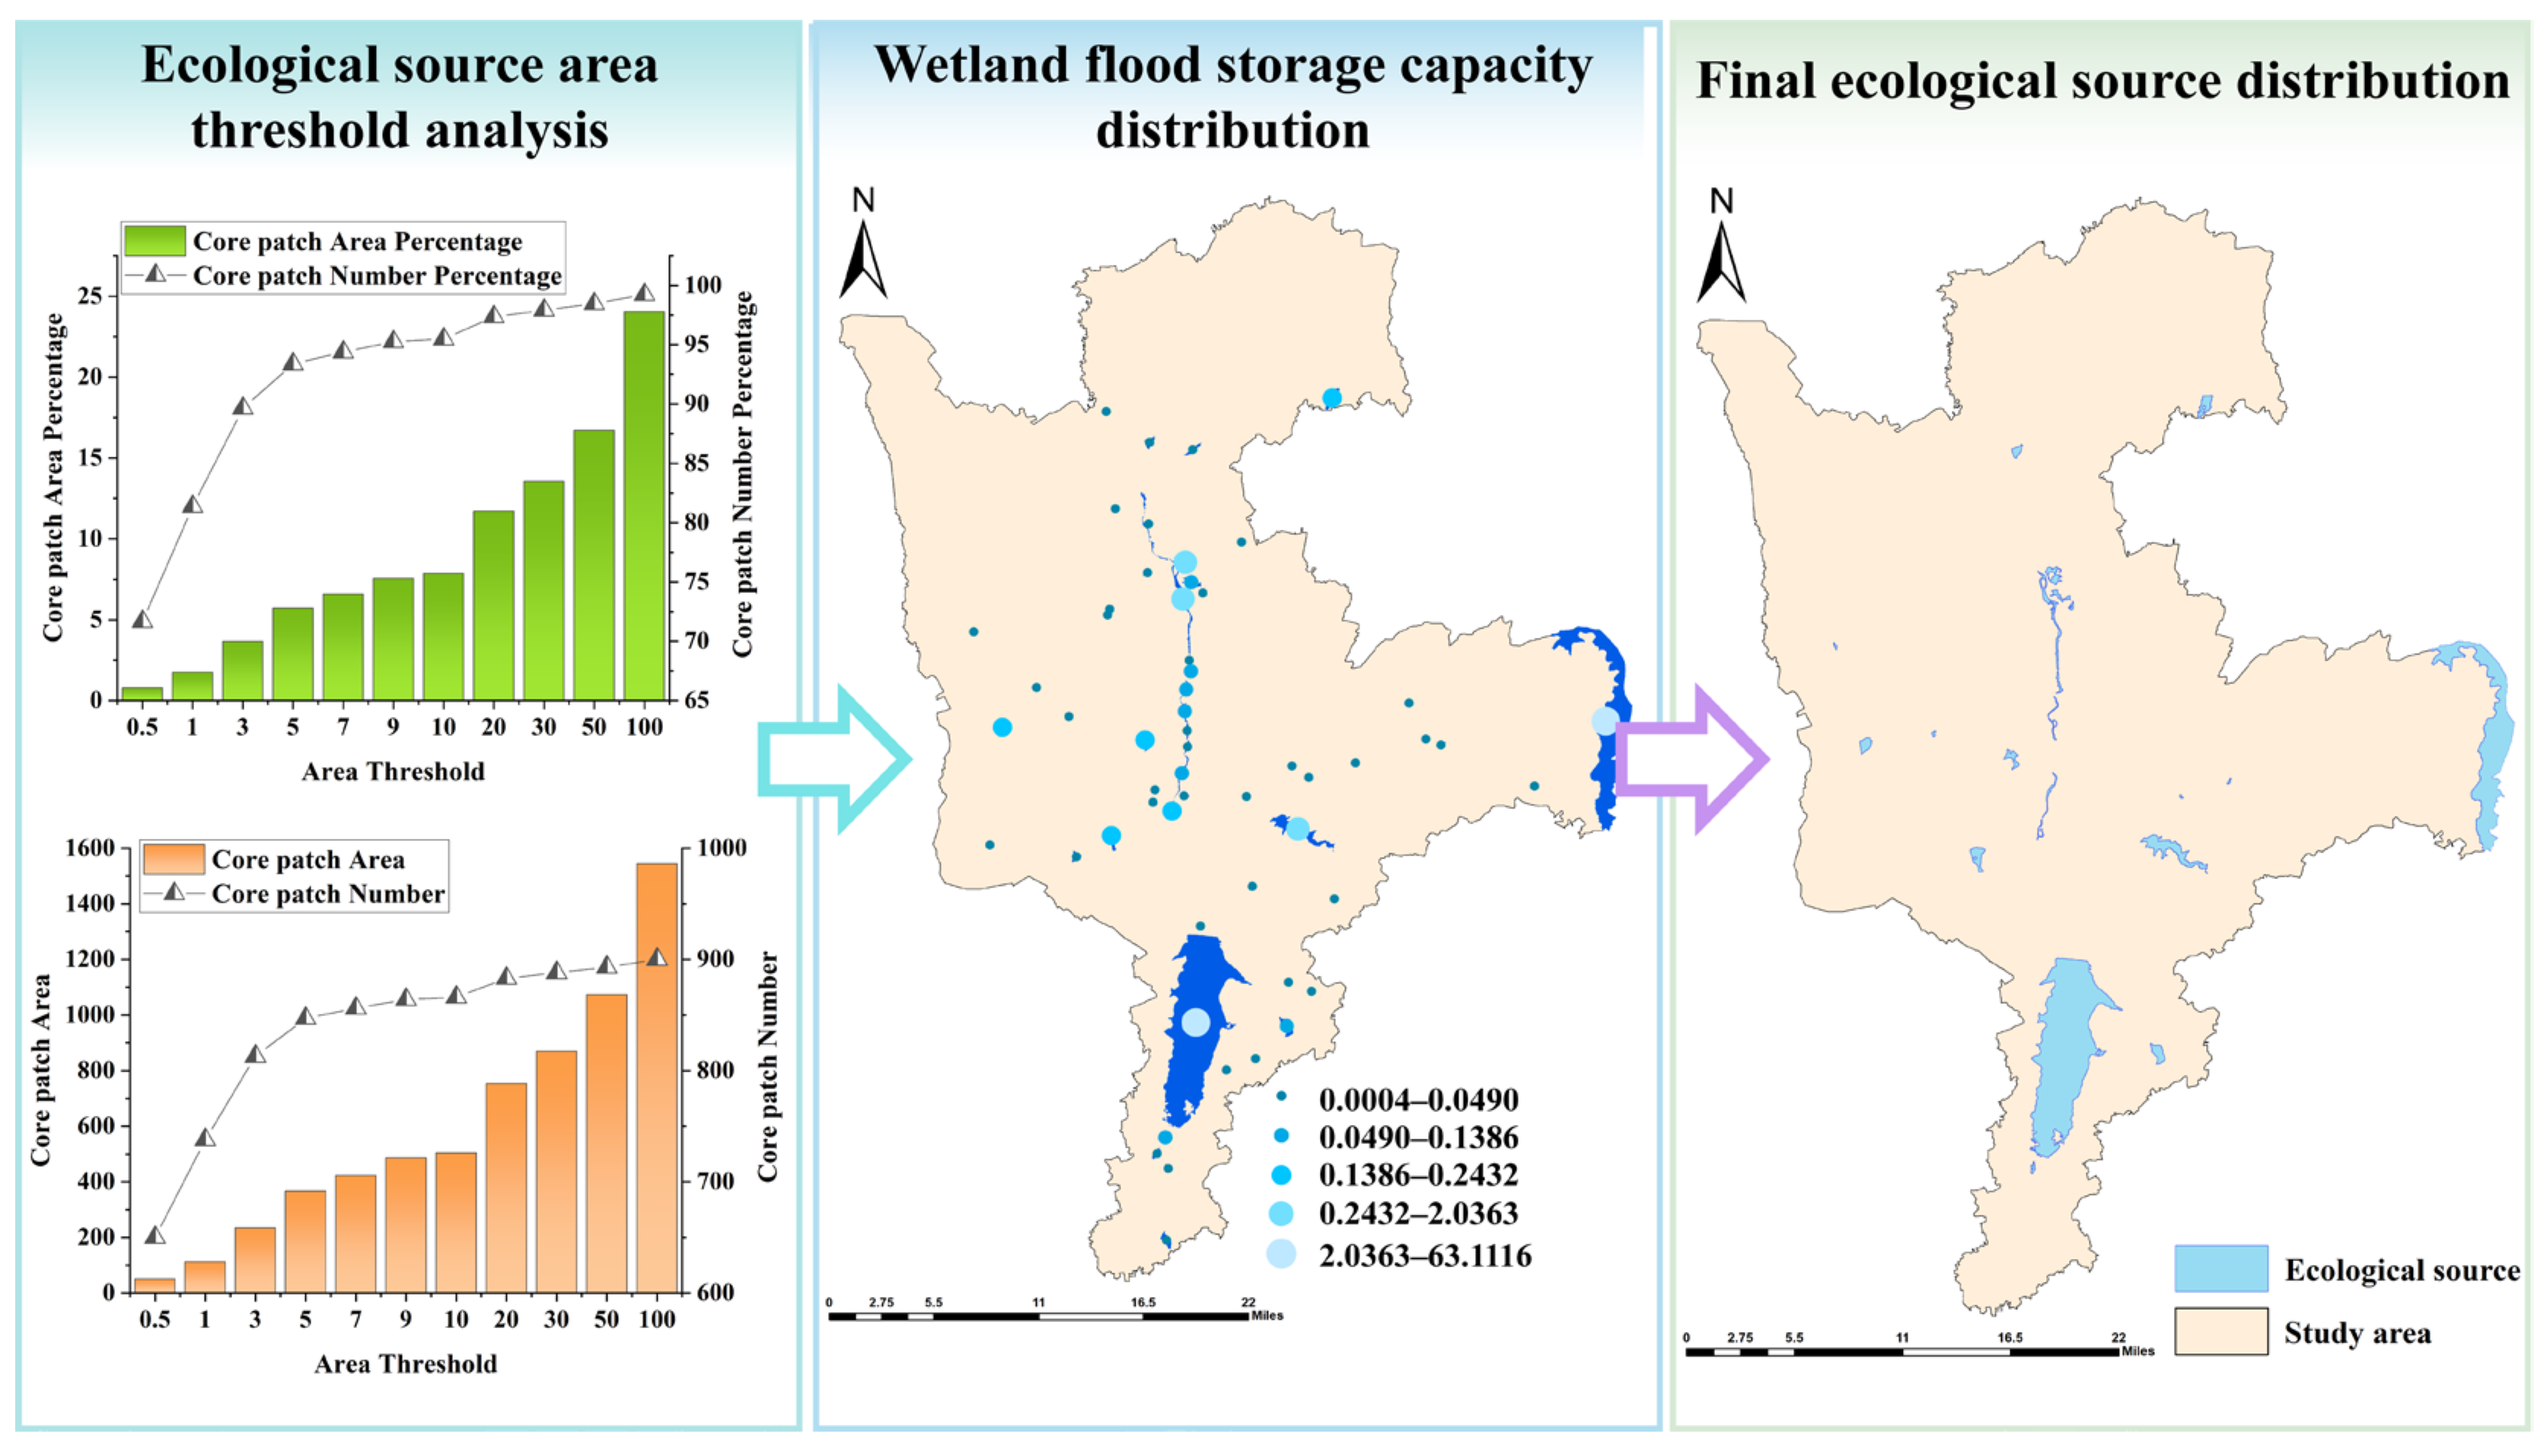
  • Determination of Ecological Source Area Threshold
Based on the statistical results (Figure 3), when the area threshold increased from 0.5 hm2 to 100 hm2, the number of patches increased from 650 to 900, and the total area increased from 51.31 hm2 to 1544.77 hm2. During this process, the proportion of patch numbers increased significantly from 71.66% to 99.23%, covering almost all patches in the study area. When the maximum patch area threshold reached 5 hm2, a turning point occurred in the change in patch numbers and area. At this point, there were 847 patches, covering 367.47 hm2, accounting for 93.38% and 5.72% of the study area, respectively. This indicates that 93.38% of the patches in the core area were smaller than 5 hm2, while only 56 patches were larger than 5 hm2. Therefore, 5 hm2 was set as the ecological source area threshold.
  • Analysis of Wetland Flood Storage Capacity
The surface water storage capacity of 56 wetland patches larger than 5 hm2 was calculated, and the natural break method was used to classify the storage capacity (Figure 3). The Shitoukoumen Reservoir had the highest storage capacity at 1.265 billion m3, while the smallest wetland had a storage capacity of only 73,600 m3. High-capacity wetlands were relatively dispersed. However, in the central urban area, due to the presence of the Yitong River, the storage capacity of nearby wetlands was significantly higher than that of wetlands farther from the river.
  • Final Determination of Ecological Sources
Although there are 24 sources in the dataset, only 16 are shown in the results (Supplementary S1), because the remaining IDs (11, 14, 15, 20–24) have net flows below −1 and are ranked further down. Promethee II analysis confirmed that 90% of the high-grade patches (top 10) matched our SIS selection (Figure 4). And after Pearson correlation analysis (Supplementary S1), the correlation coefficient value was 0.773, showing significance at the 0.01 level, thus indicating that there is a significant positive correlation between SIS rank and Promethee II rank.
Patches with an SIS greater than 0.05 were identified as final ecological sources (Table 3). A total of 24 ecological sources were identified (Figure 3). The total area of ecological sources in Changchun was 10,036.53 hm2, accounting for 57.36% of the total wetland area in the study area. The largest source was the Xinlicheng Reservoir, covering 5730.69 hm2. Overall, the distribution of ecological sources was relatively dispersed, with fewer sources in the north and east, and most sources concentrated in the central region. The Yitong River wetland, running through the city center, was a key corridor connecting most ecological sources in the study area.

3.1.2. Construction of the Ecological Resistance Surface

High-resistance areas were mainly distributed in the eastern part of the study area, characterized by higher elevation and vegetation density, and densely populated urban areas with high road densities and low permeability (Figure 5A).
To validate the constructed resistance surface, correlation analyses were conducted between landscape types and runoff volume with resistance values. Fifty random sample points were created for each land cover type, and their resistance values were compared (Figure 5B). High-resistance land cover types included woodland, other land, and built land, with average resistance values of 58.77, 49.37, and 49.78, respectively. Wetlands had the lowest resistance value, averaging 28.63. Pearson correlation analysis based on 500 random sample points in the study area (Figure 5C) showed a significant negative correlation between resistance values and surface runoff at the 0.05 level, indicating that resistance values decreased as runoff increased. High-resistance areas in the study area significantly limited the construction and function of corridors, while low-resistance areas were potential locations for corridor distribution and connection.

3.1.3. Extraction of Ecological Corridors and Identification of Ecological Nodes

  • Extraction of Ecological Corridors
Based on the potential ecological corridors extracted using Linkage Mapper, after removing redundant and overlapping corridors, 37 ecological corridors were identified (Figure 6). The average length of corridors in the ecological network was 11.28 km. The corridors exhibited a radial structure and were unevenly distributed in the study area. Corridor density was higher in the main urban area, with shorter average lengths of 9.44 km, while the longest corridor was 20.08 km. In suburban areas, corridors were sparsely distributed, with an average length of 12.85 km, and the longest corridor was 40.76 km.
  • Identification of Ecological Pinch Points and Stepping Stone Patches
Ecological pinch points were mainly distributed near wetland patches and at the intersections of ecological corridors (Figure 7). Overlaying pinch point areas with the ecological resistance surface showed that pinch point areas had low resistance values, averaging 42.14, with the lowest resistance value of 23.08. Areas surrounding pinch points had high resistance values. Pinch points located within ecological sources were removed, resulting in 20 pinch points requiring improvement and protection.
Patches larger than 0.5 hm2 were selected as stepping stone patches, resulting in 14 stepping stone patches in the study area (Figure 8). The total area of stepping stone patches was 68.39 hm2, with an average area of 4.88 hm2, accounting for 0.62% of the total wetland area in the study area. The largest stepping stone patch covered 19.13 hm2, while the smallest covered 0.53 hm2. Most stepping stone patches were located in the main urban area and densely distributed, while in suburban areas, they were more dispersed, mainly consisting of small wetland patches and isolated wetland clusters, with a predominance of pond wetlands. On average, each ecological corridor in the study area’s source ecological network contained only 0.38 stepping stone patches. The Nanguan District had the most stepping stone patches (5), while the Chaoyang District had none.

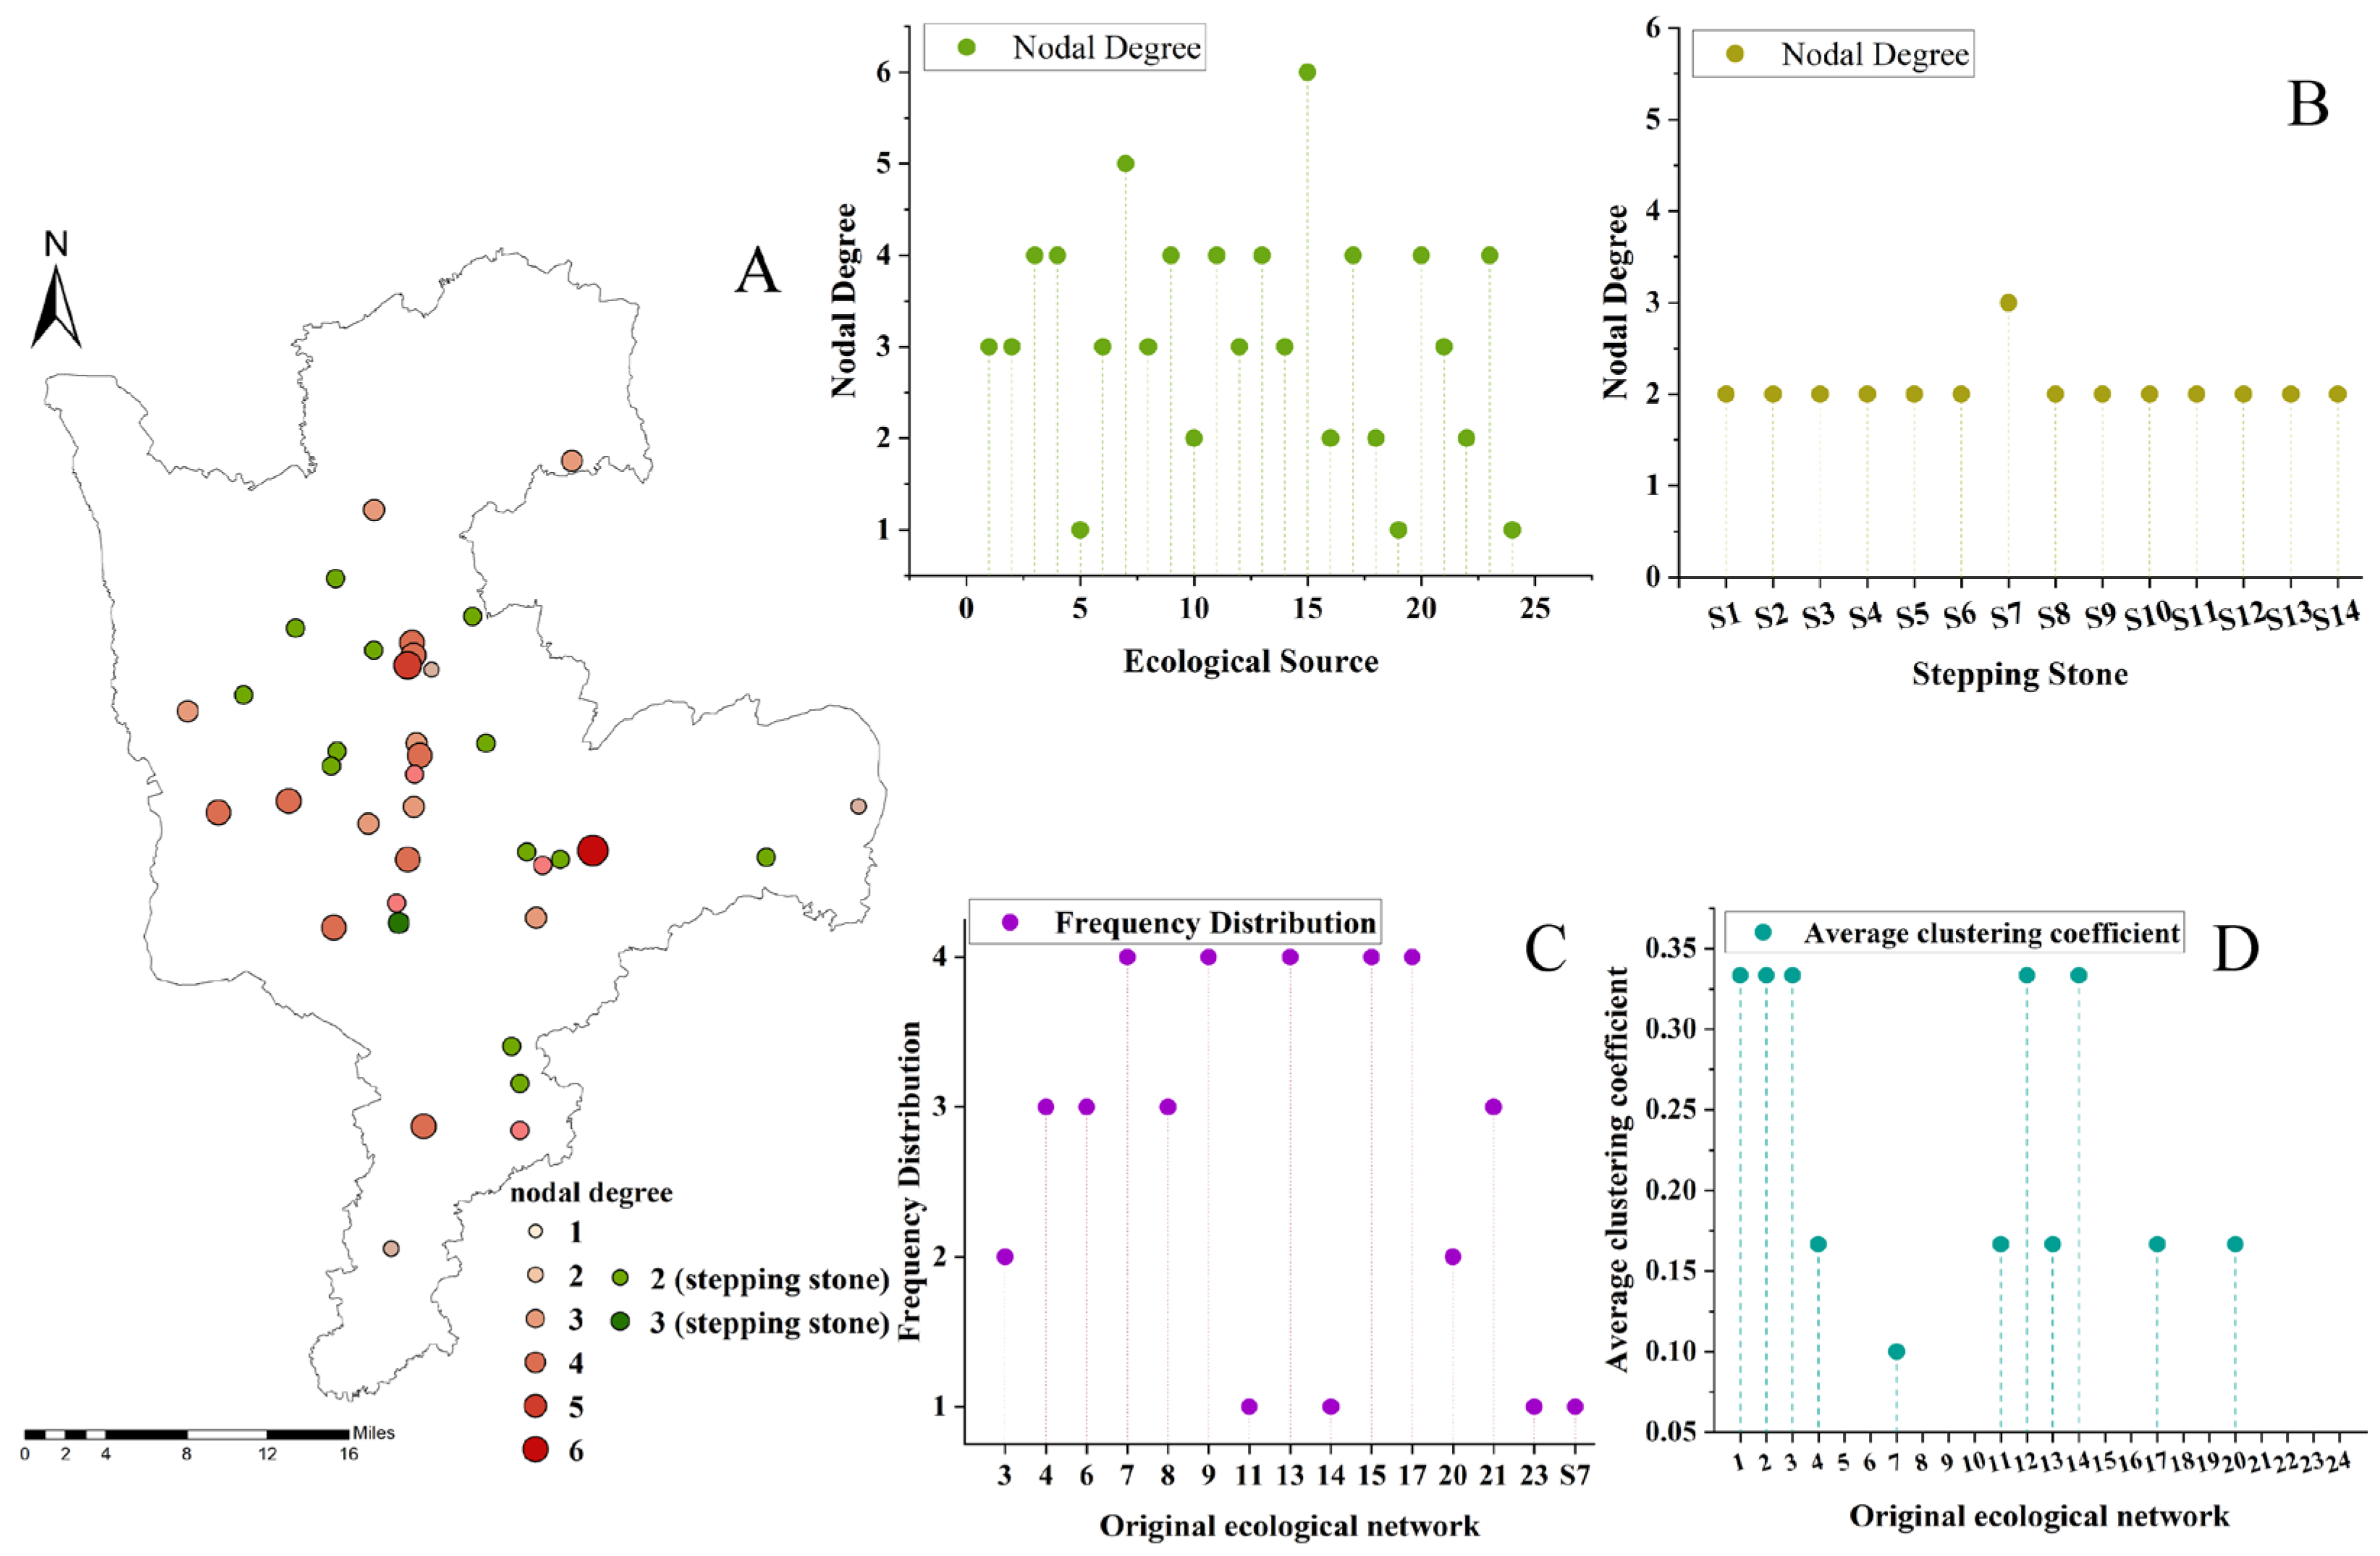
3.1.4. Evaluation of the Original Ecological Network’s Topological Structure

  • Basic Static Structural Characteristics of the Original Ecological Network
This study extracted 38 nodes and 52 undirected edges from the original ecological network. The average node degree of the original ecological network was 2.737 (Figure 9B), meaning that each ecological node was directly connected to an average of 2.737 other nodes. There were no nodes with a degree of 0, and only three nodes had a degree of 1. The majority of nodes had a degree of 2 (17 nodes), accounting for 44.73% of the total nodes. One node had the highest degree of 6, meaning it was directly connected to six other nodes. Nodes with a degree greater than 2 accounted for 47.36% of the total nodes, indicating that nearly half of the nodes were connected to more than three other nodes. Combining the degree results with the spatial distribution of nodes (Figure 9A), nodes with a degree of 1 were located downstream of the Xinlicheng Reservoir in the south (Source 24), the Shitoukoumen Reservoir in the east, and the Beihu Wetland Park in the central region (Source 5). Nodes with a degree of 2 were mainly stepping stone patches distributed along ecological corridors. Nodes with a degree greater than 5 were located in the northeast of Jingyuetan (Source 15) and the Beihu Wetland Park (Source 7). Nodes with higher degrees were mainly distributed in the central region of the study area, serving as important hubs connecting ecological sources.
  • Node Centrality in the Original Ecological Network
Centrality measures the importance of nodes in a network. This study used four centrality algorithms—betweenness centrality, closeness centrality, eigenvector centrality, and harmonic closeness centrality—to analyze node centrality and identify nodes critical to the ecological network.
The top 10 nodes (top 25%) from each centrality algorithm were ranked, and frequency distribution analysis was conducted (Figure 9C). Five nodes had a centrality frequency of 4, nodes 7, 9, 13, 15, and 17, all located in the central region, with three (nodes 7, 9, and 17) along the Yitong River. Nine nodes had a frequency greater than 2, accounting for 60% of the total, indicating their importance in the network. Among the 15 nodes, only one stepping stone node had a frequency of 1.
  • Connectivity of the Original Ecological Network
The network diameter of the original ecological network was 8, and the average path length was 3.844. Both the diameter and average path length were relatively long, indicating that the shortest path between the most distant nodes required traversing eight paths, and the average shortest path between any two nodes required traversing 3.844 nodes. The average clustering coefficient was 0.074 (Figure 9D), with 11 nodes (28.94%) having values above the average, mainly distributed in the central and northern regions of the study area.

3.2. Ecological Network Optimization Strategies

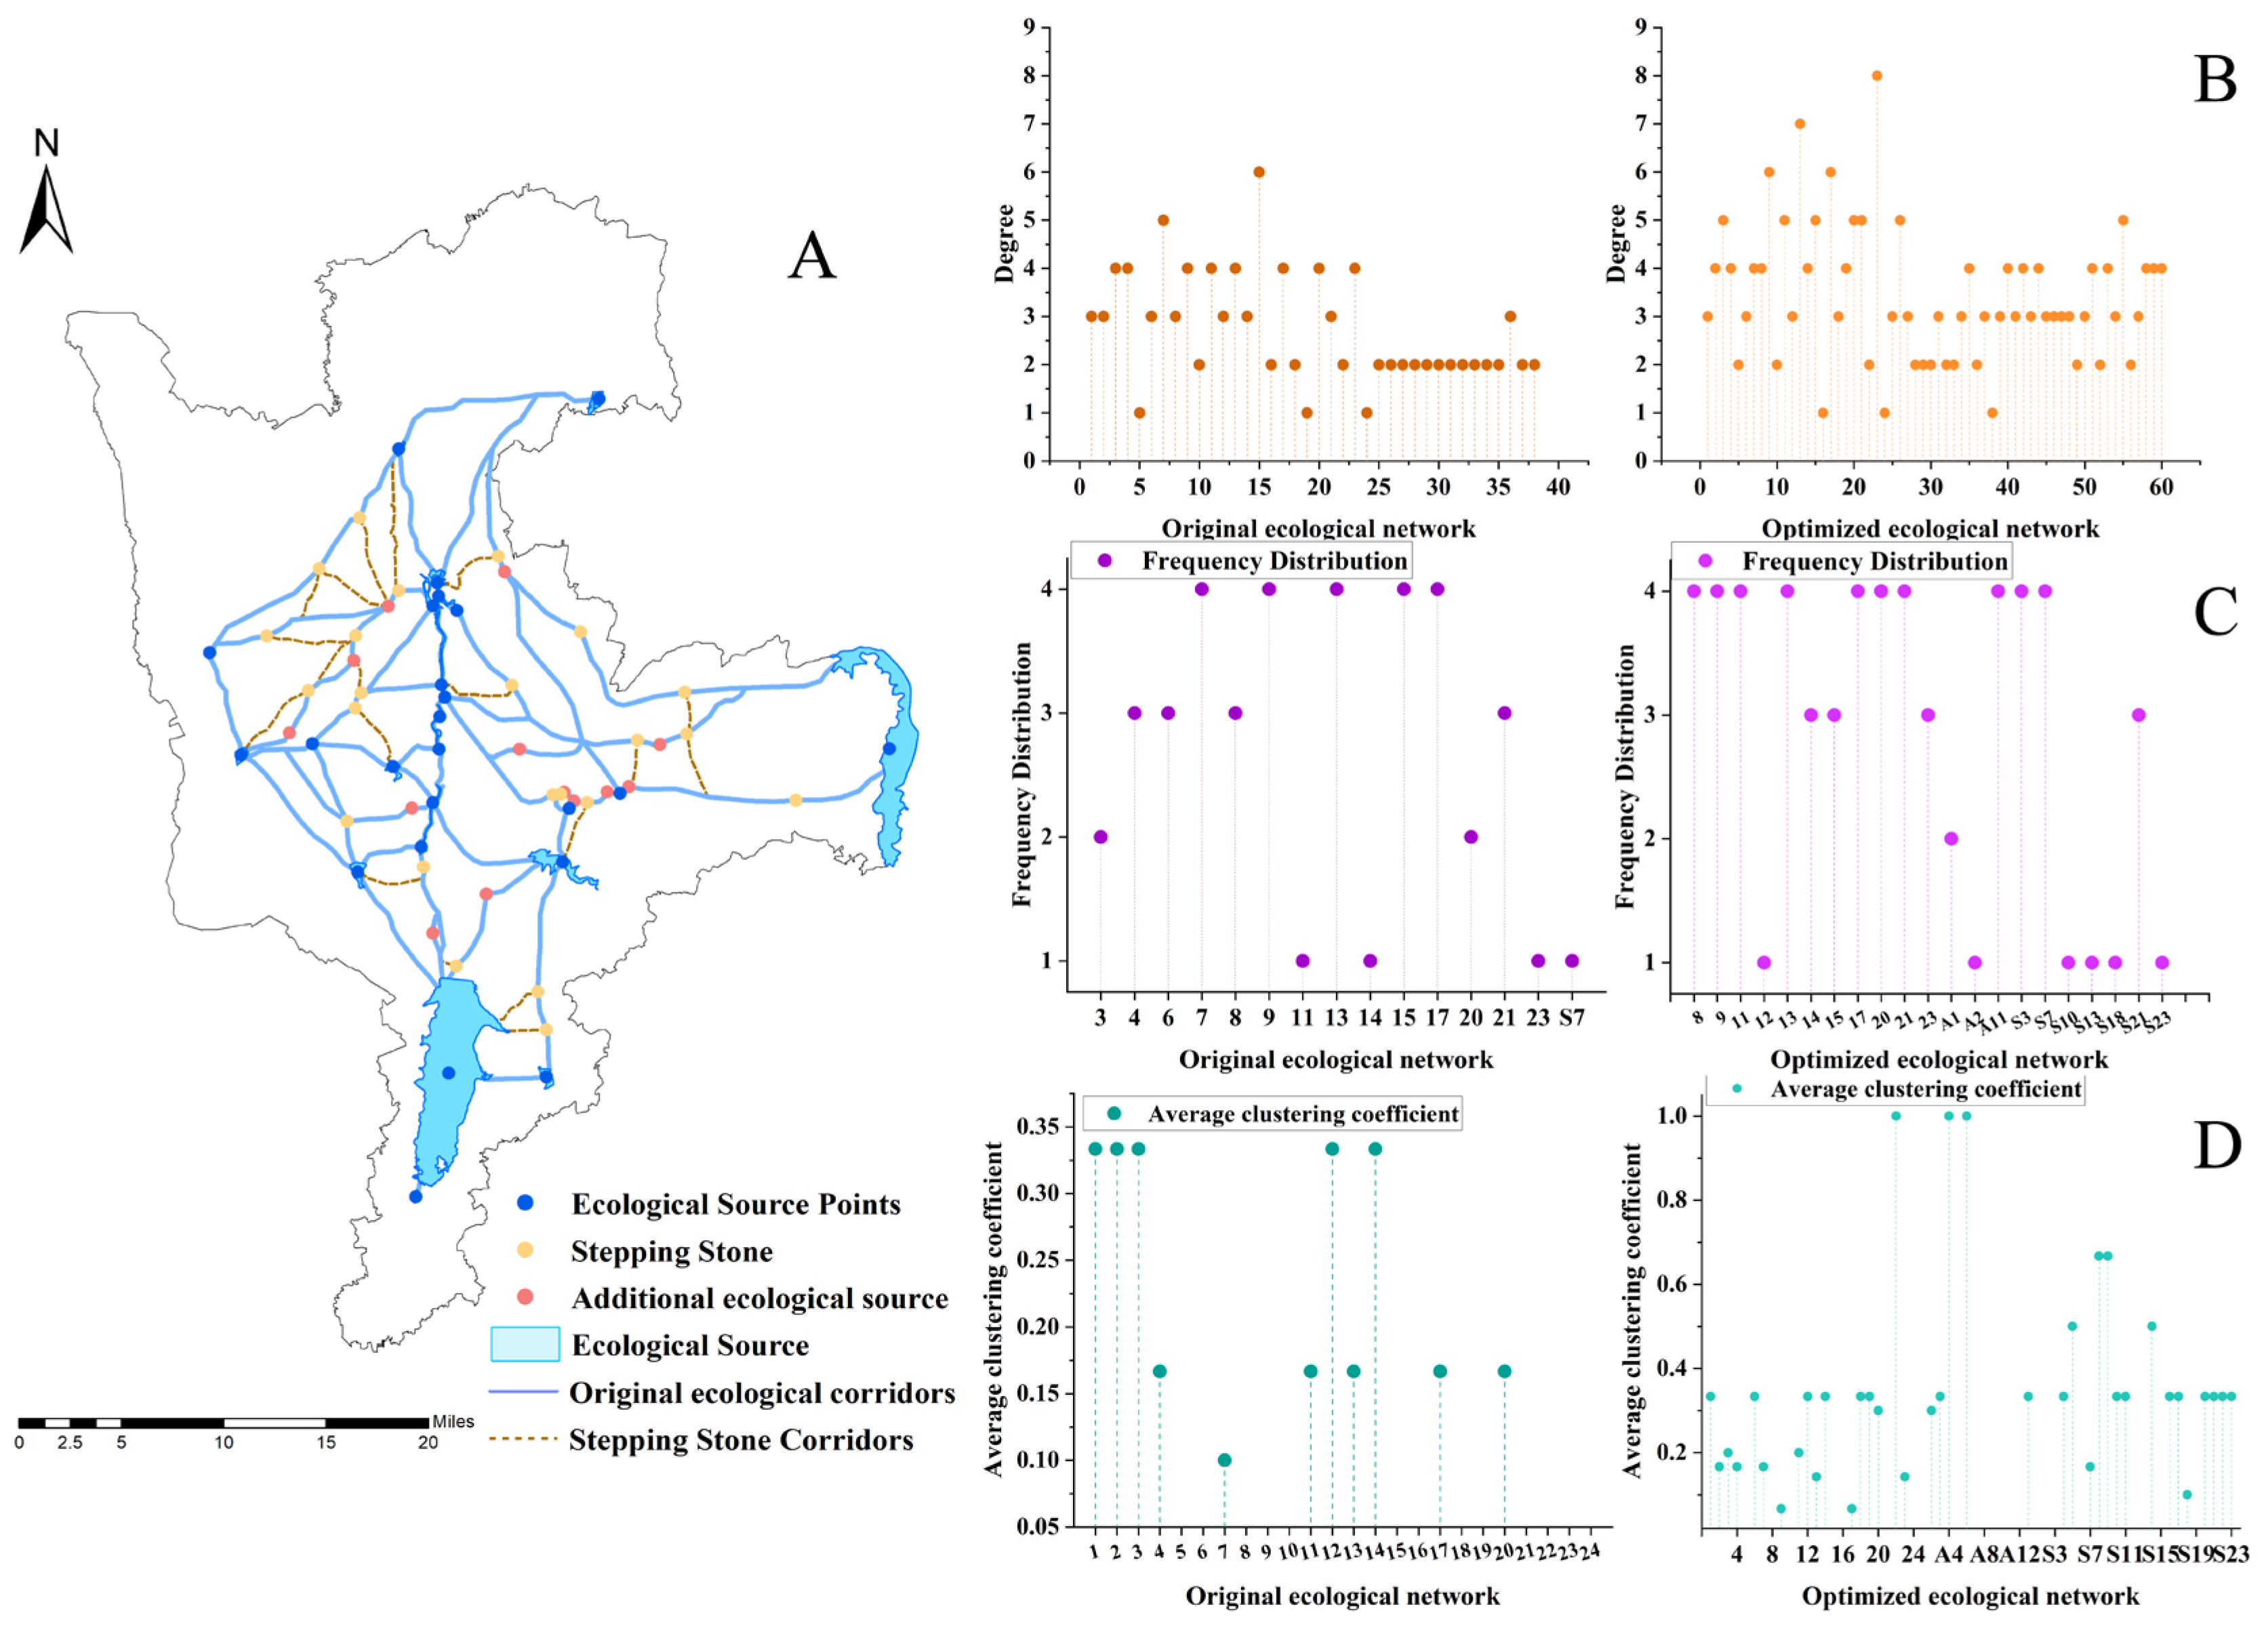
3.2.1. Source Addition Strategy

Based on the landscape connectivity index, ecological sources with a connectivity index greater than 3 were selected, and wetland patches overlapping with ecological sources were removed, resulting in 13 core ecological source patches with a dPC value greater than 3 (Table 4). The new sources were renumbered (1–13), and the Linkage Pathway tool in the Linkage Mapper toolbox was used to overlay them with the original ecological network, resulting in the Source Network for the study area.
Based on landscape connectivity analysis, 13 ecological sources were added, with the largest being Source 11 in the northeast of Jingyuetan, covering 4.51 hm2, and the smallest being Source 6 in the east of Yuehe Cultural Park, covering 3.46 hm2. The added sources were mainly distributed in the urban area, around the Yitong River. The source addition strategy added 16 ecological corridors, with Sources 1 and 5 increasing the number of corridors from the Shitoukoumen Reservoir in the east from one to three, improving its connectivity. No new sources or corridors were added in the northern suburban area. The average length of ecological corridors decreased by 4.82 km compared to the original network.

3.2.2. Stepping Stone Addition Strategy

The overlap tool in Arc GIS was used to overlay corridors and wetland boundaries to extract stepping stone patches. Wetland patches larger than 1 hm2 along new corridors were selected as new stepping stone patches. Based on the source addition strategy, the Linkage Pathway tool in the Linkage Mapper toolbox was used to extract potential stepping stone corridors, which were overlaid with the Source Addition Strategy-optimized ecological network to create the Source–Stepping Stone Network (Figure 10A).
Based on the optimization strategy overlay analysis, 10 new stepping stone patches were added to the study area, with the largest being the Qingquan Lake Wetland, covering 19.13 hm2, and the smallest covering only 0.1 hm2, with an average area of 5.28 hm2. The ecological network in the study area now contained 23 stepping stone patches. Combining the new stepping stones and ecological sources, a total of 20 potential stepping stone corridors were extracted (Figure 10A). From the spatial distribution of the stepping stone network, the addition of stepping stones increased the number of paths in the ecological network, with fewer stepping stone corridors in the southern part of the study area. After overlaying the source addition strategy, the entire network was reclassified, resulting in a total of 103 ecological corridors. The average length of the optimized ecological network corridors was 6.68 km.

3.3. Evaluation of the Optimized Ecological Network

3.3.1. Evaluation of Optimization Results Based on Topological Metrics

The network topology analysis results (Figure 10) show that the optimized network had a maximum node degree of 8, higher than the original network’s maximum of 6. The average node degree increased from 2.737 to 3.433. The number of nodes with a degree greater than 2 increased from 18 to 45, accounting for 75% of the total nodes, up from 47.36%. The top 15 nodes (top 25%) from the four centrality algorithms in the optimized network were ranked (Figure 10C). Ten nodes had a frequency of 4, accounting for 47.61% of the total. Fourteen nodes had a frequency greater than 2, accounting for 66.67%, higher than the original network’s 60%. Among the 21 nodes, 3 were added ecological sources, and 7 were stepping stone sources. The network diameter remained unchanged, while the average path length increased from 3.844 to 3.984. The average clustering coefficient increased from 0.074 to 0.231 (Figure 10D), with 24 nodes (40%) having values above the average, higher than the 28.94% in the original network.

3.3.2. Robustness Analysis Based on Complex Network Theory

  • Random Attack Scenario
Figure 11 shows the changes in network connectivity robustness and global efficiency under the random attack scenario. The inflection points in the curves reflect the network’s fragmentation trend. The original network’s initial connectivity robustness was 0.886, while the optimized network’s initial connectivity robustness was 0.998.
For the original network, robustness declined rapidly in the early stages. When the first node was removed, the rate of decline in connectivity robustness accelerated, accompanied by a decline in global efficiency, indicating an increase in the rate of network fragmentation. The original network showed a rapid decline in robustness when 1–12 nodes were removed, exhibiting an “emergence phenomenon”. When 50% of the nodes were removed, connectivity robustness decreased by 0.22, after which the rate of decline in both connectivity robustness and global efficiency slowed. At this point, the largest connected subgraph contained 12 nodes, and when all 24 nodes were removed, connectivity robustness dropped to 0. For the optimized network, connectivity robustness remained stable in the early stages of random attack. When 18% of the nodes were removed, the rate of network fragmentation increased, showing an “emergence phenomenon”, with the largest connected subgraph containing 49 nodes. When 60 nodes were removed, connectivity robustness under random attack dropped to 0.67, with the largest connected subgraph containing 21 nodes. After this point, the rate of decline in connectivity robustness slowed. Comparing the network efficiency of the two networks, the optimized network’s initial efficiency was 0.315, higher than the original network’s 0.312. However, the optimized network’s efficiency declined more gradually, while the original network’s efficiency declined more rapidly.
  • Malicious Attack Scenario
For the original network, connectivity robustness declined rapidly in the early stages of malicious attack. When 16% of the nodes were removed, connectivity robustness decreased by 0.052, and when 63% of the nodes were removed, the largest connected subgraph contained fewer than 10 nodes. In the malicious attack scenario, the original network showed regular fluctuations in connectivity robustness when 5–13 nodes were removed. When the first node was removed, global efficiency dropped sharply, and when sixteen nodes were removed, global efficiency dropped to 0. For the optimized network, connectivity robustness declined more slowly in the malicious attack scenario. When 0–5 nodes were removed, connectivity robustness remained at 1. After 8% of the nodes were removed, connectivity robustness began to show an “emergence phenomenon”. When 46% of the nodes were removed, connectivity robustness reached its lowest value of 0.187. Comparing the global efficiency of the two networks, the optimized network’s efficiency dropped to 0 when 93% of the nodes were removed, while the original network’s efficiency dropped to 0 when 66% of the nodes were removed. The optimized network’s efficiency declined more gradually than that of the original network.
  • Controlled Attack Scenario
The controlled attack scenario simulated the impact of urban development on the robustness of the ecological network under the policy of protecting all ecological sources. In this scenario (Figure 11C), connectivity robustness changed little in the early stages of the attack. When 10 nodes were removed, connectivity robustness remained around 0.98, after which an “emergence phenomenon” occurred. When 69% of the nodes were removed, connectivity robustness reached its lowest value of 0.744. After all stepping stone patches were removed, connectivity robustness remained at the minimum value of 0.744 due to the protection of all ecological sources. Overall, in the scenario of protecting all sources, the rate of decline in both connectivity robustness and network efficiency was slower than in the random and malicious attack scenarios.

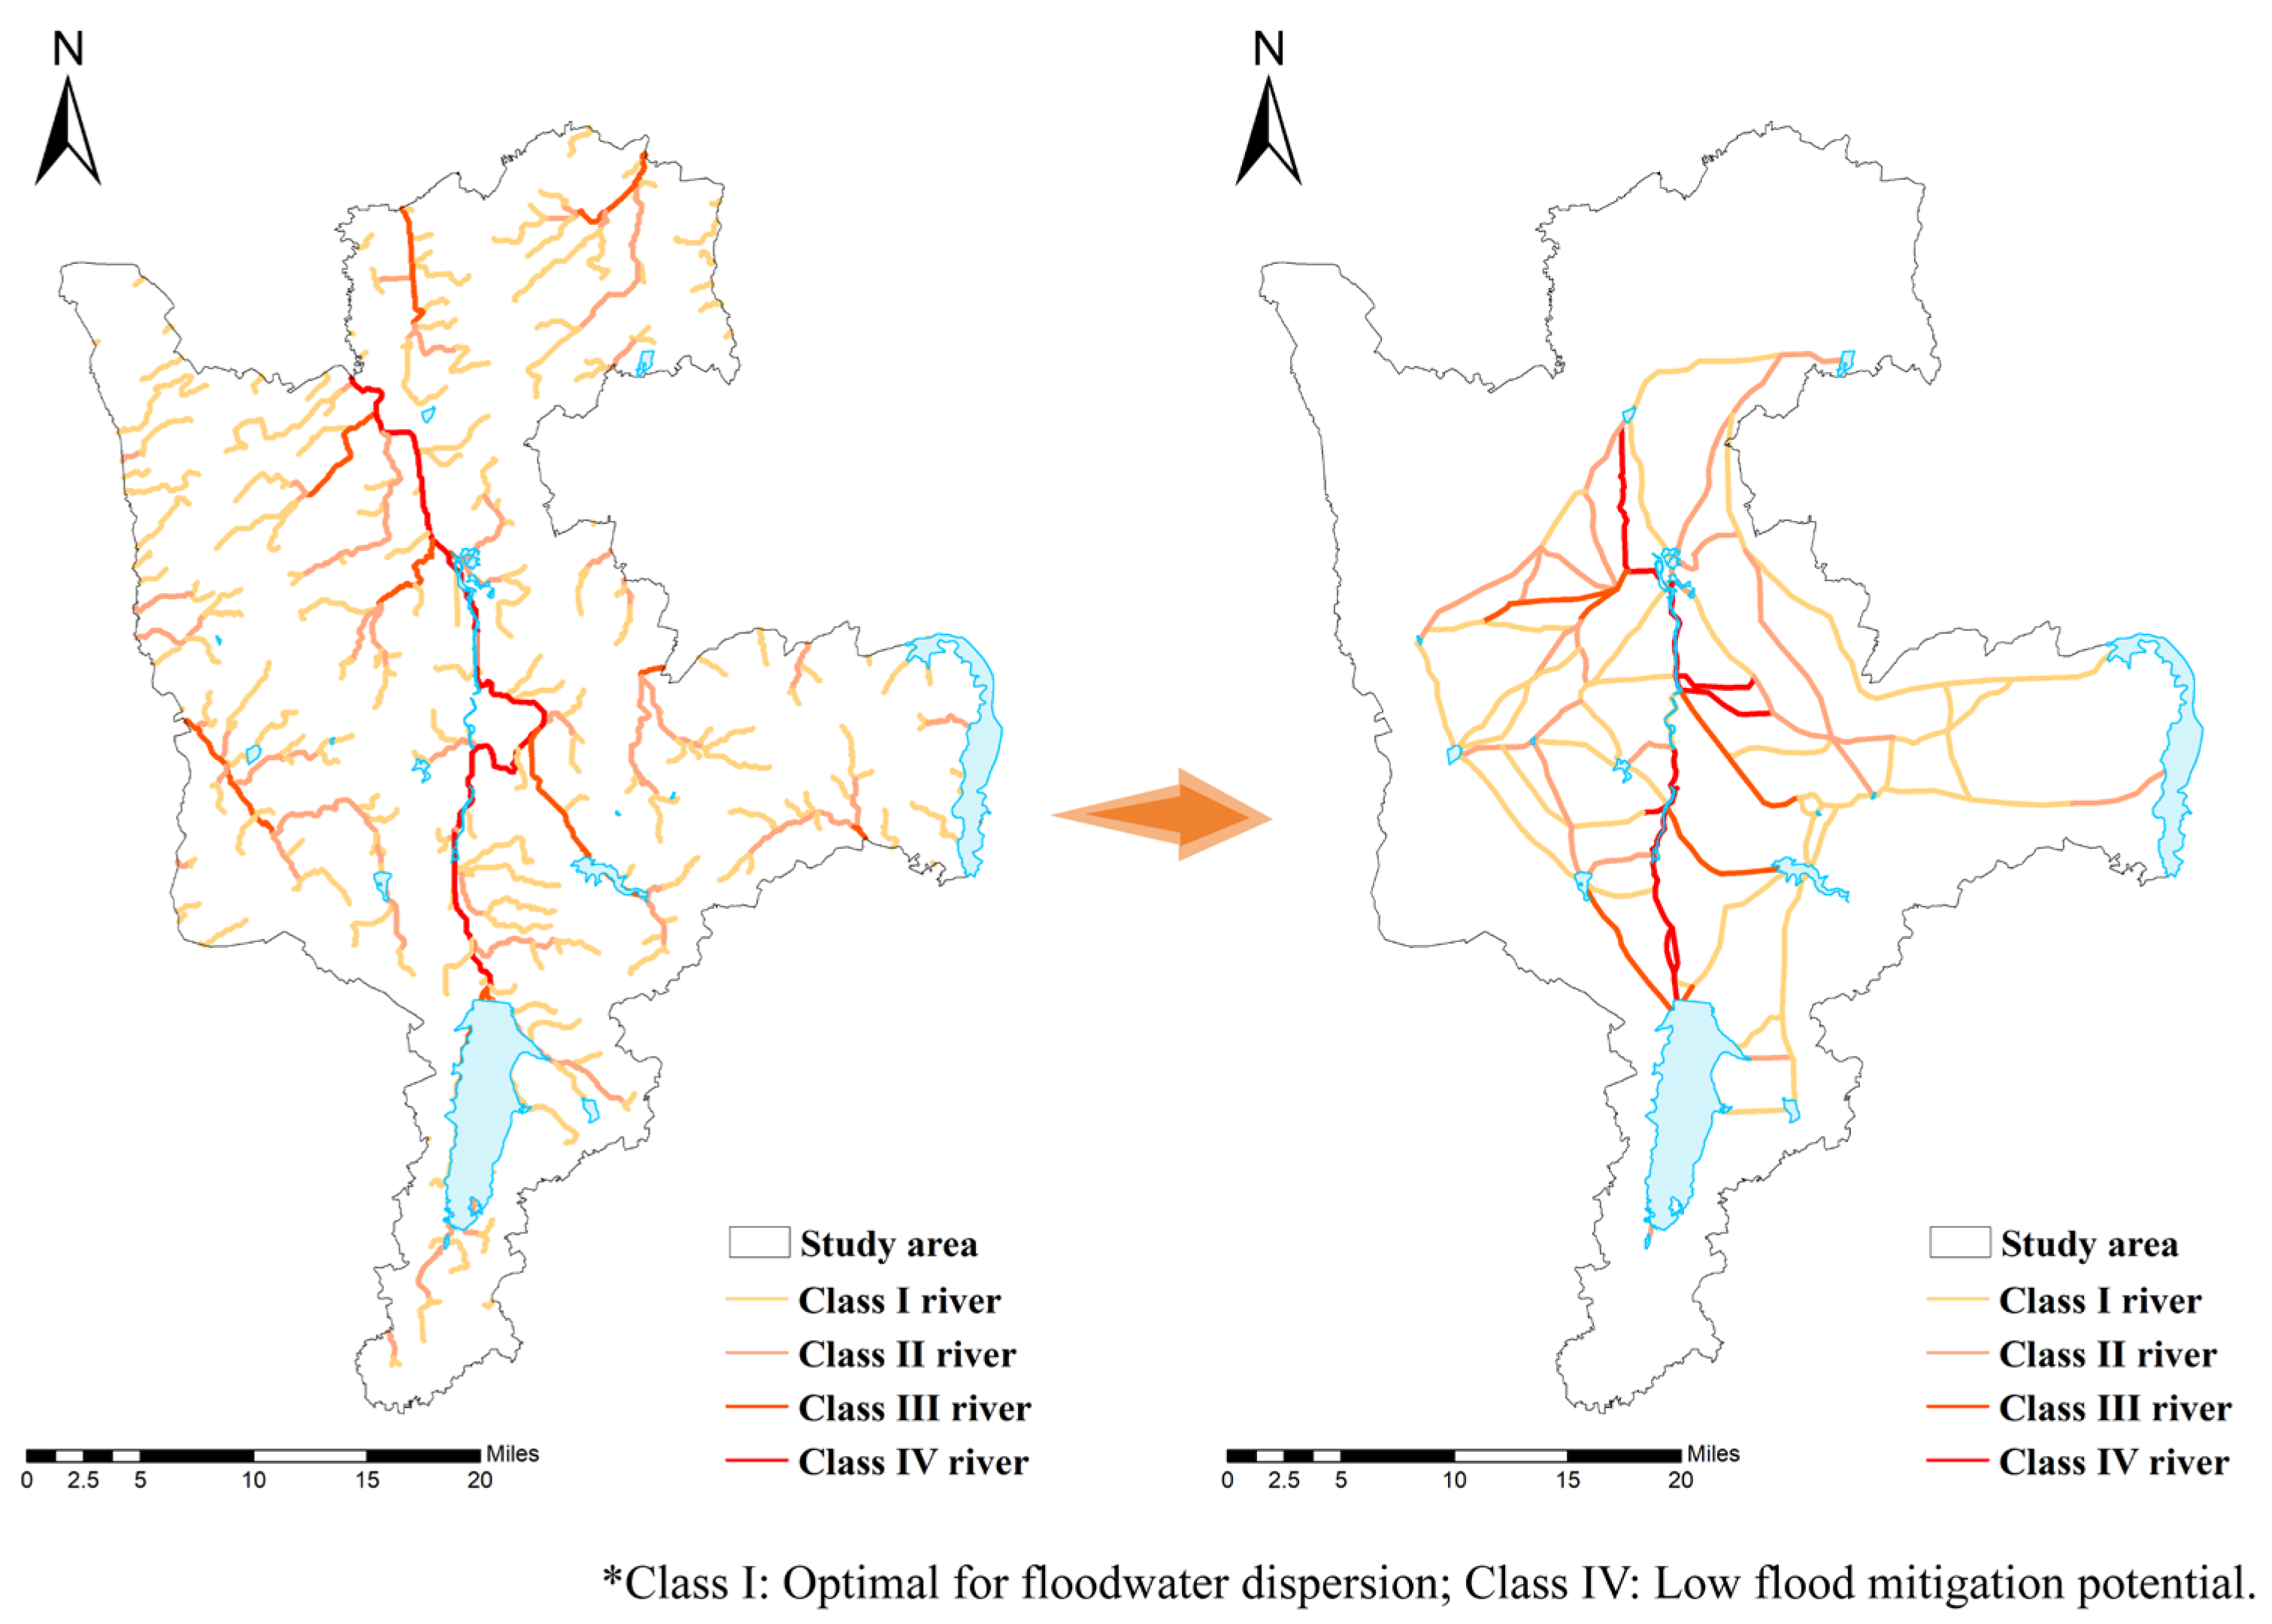
3.3.3. Evaluation of Ecological Corridors

  • Simulation of Optimal Ecological Corridor Width
At a buffer width of 10 m (Figure 12A), built land, wetlands, woodland, and grass land accounted for 72.89% of the corridor, with built land accounting for the highest proportion at 51.18%. After a width of more than 10 m, the proportion of ecological elements generally decreased, with grass land and wetlands showing a continuous decline. The proportion of built land increased with corridor width, with two inflection points at 100–150 m and 300–500 m (Figure 12B). Built land in the study area’s corridors was relatively stable and dominated the corridor composition, with an average change rate of 1.41%. The overall proportions do not change much, but the proportion of build land and other land increases significantly after the 50-m simulation.
  • Assessment of Ecological Corridor Water Conveyance Potential
In the overlaid ecological corridor water conveyance potential distribution (Figure 13), Class I corridors were the most numerous, with 57 corridors accounting for 55.33% of the total. The number of Class IV corridors was 14, accounting for 13.59%, with an average length of 7.07 km. Class IV corridors were mainly distributed along the Yitong River and its surrounding areas. The number of corridors above Class II was 21, accounting for 20.38%, indicating that nearly one-fifth of the corridors played an important role in water flow convergence in the ecological network.

4. Discussion

The role of wetlands in flood mitigation has been widely studied, but most research focuses on the functional analysis of single landscape elements (e.g., patches, corridors). The function of wetland ecological networks in biodiversity conservation has also been extensively studied, but their role in mitigating urban flooding, especially in high-density urban areas, has not been effectively verified. This study integrated Morphological Spatial Pattern Analysis (MSPA), the Minimum Cumulative Resistance (MCR) model, and complex network theory to construct and optimize a flood mitigation wetland ecological network in Changchun. The optimized network significantly improved flood mitigation performance, effectively dispersing peak runoff and reducing flood risk.

4.1. Analysis of the Original Wetland Ecological Network

Based on the MSPA results, ecological sources were mainly distributed near the Yitong River, particularly around large wetland patches such as the Xinlicheng Reservoir, Shitoukoumen Reservoir, and Jingyuetan (Figure 2). Wetland patches in the central urban area were more concentrated, while those in the north and east were relatively sparse. This distribution pattern may be closely related to Changchun’s urbanization process, as urban expansion has led to the fragmentation of wetland patches [21], especially in urban fringe areas [40]. The Yitong River, as the main river in Changchun, runs through the city center, connecting multiple wetland patches and forming the core corridor of the ecological network. This “symbiotic” relationship not only enhances the flood storage capacity of wetlands but also reduces flood risk by slowing flood flow [41]. However, some wetland patches are weakly connected to others, forming “isolated islands”, which may weaken the overall connectivity of the ecological network. During extreme rainfall events, isolated wetlands have limited flood storage capacity and cannot synergize with other wetlands [42]. Therefore, future wetland conservation and restoration efforts should focus on these isolated wetlands, enhancing their connectivity to the main network by adding stepping stone patches or ecological corridors.
The construction of the resistance surface is a key step in ecological network analysis. This study integrated natural conditions (e.g., elevation, slope, vegetation coverage) and anthropogenic factors (e.g., land use types, distance to roads) to construct a comprehensive resistance surface for Changchun (Figure 5A). The results showed that high-resistance areas were mainly distributed in woodland and built land (Figure 5B), where flood flow resistance is high, hindering rapid flood discharge [43,44]. In contrast, low-resistance areas were mainly concentrated near wetlands and water bodies, making them ideal locations for ecological corridor construction. Pearson correlation analysis (Figure 5C) showed a significant negative correlation between resistance values and surface runoff, indicating the accuracy of the resistance surface construction. This result provides a reliable basis for subsequent ecological corridor extraction and network optimization. However, high resistance values in densely urbanized areas may limit the construction of ecological corridors, especially as urban expansion increases the density of built land, further increasing flood flow resistance [45]. Therefore, future urban planning should minimize the encroachment on wetlands and water bodies to ensure the connectivity of ecological corridors.
Using the MCR model, this study extracted 37 ecological corridors (Figure 6). Ecological corridors can increase flood storage space and discharge capacity [46,47,48]. In Changchun’s main urban area, corridors are densely distributed, while in suburban areas, they are relatively sparse. This result indicates that wetland patches in the urban area form a tightly connected network through ecological corridors, while suburban wetland patches are relatively isolated, facing greater development pressure. The identification of ecological pinch points further revealed key nodes in the ecological network. These pinch points, with low resistance values, facilitate flood flow and play a positive role in flood discharge [28]. Pinch points were mainly distributed near wetland patches and at the intersections of ecological corridors (Figure 7), indicating their importance in flood discharge. The number of stepping stone patches was relatively low (Figure 8), with an average of only 0.38 stepping stone patches per ecological corridor, which may limit the connectivity and resilience of the ecological network [29,30]. Therefore, future ecological network optimization should focus on increasing stepping stone patches, especially in suburban areas, by adding small wetland patches or artificial wetlands to enhance network connectivity.

4.2. Evaluation of the Flood Mitigation Efficacy of the Optimized Network

4.2.1. Ecological Network Optimization Strategies

Based on landscape connectivity index analysis, this study selected 13 ecological sources with a dPC value greater than 3 (Table 4) and added 16 ecological corridors via the source addition strategy (Figure 10A). This optimization strategy significantly improved the connectivity of Changchun’s ecological network, especially along the Yitong River, where new corridors enhanced the connectivity of key wetlands such as the Shitoukoumen Reservoir. This indicates that the source addition strategy can effectively enhance the overall functionality of the ecological network, particularly in high-density urban areas, by increasing ecological sources and corridors to improve flood storage capacity and discharge efficiency. However, no significant increase in ecological sources and corridors was observed in the northern suburban area, likely due to the limited number of wetland patches in this region. Therefore, future ecological network optimization should focus on wetland restoration and conservation in suburban areas, adding small wetland patches or artificial wetlands to improve ecological connectivity.
Through the stepping stone addition strategy, this study added 10 stepping stone patches and extracted 20 potential stepping stone corridors (Figure 10A). This optimization strategy significantly increased the number of paths and connectivity in the ecological network, especially in the main urban area, where the addition of stepping stone patches enhanced network redundancy and resilience. Stepping stone patches play an important role in ecological networks, particularly in high-density urban areas [19]. By increasing stepping stone patches, the stability and flood discharge efficiency of the ecological network can be effectively improved [31]. However, fewer stepping stone corridors were distributed in the southern region, likely due to the limited number of wetland patches in this area. Therefore, future ecological network optimization should focus on wetland restoration and conservation in the southern region, adding small wetland patches or artificial wetlands to improve ecological connectivity.

4.2.2. Evaluation of the Optimized Ecological Network

Topological structure analysis showed that the optimized ecological network had significant improvements in node degree, centrality, and clustering coefficient. The average node degree increased from 2.737 to 3.433 (Figure 10B), indicating higher network connectivity. Additionally, the proportion of nodes with a centrality frequency greater than 2 increased from 60% to 66.6% (Figure 10C), and the average clustering coefficient increased from 0.074 to 0.231 (Figure 10D), indicating that the optimized network outperformed the original network at the node level, with significant improvements in node connectivity and resilience, better able to withstand various external disturbances and attacks [36]. However, the network diameter and average path length slightly increased, likely due to the addition of new ecological sources and stepping stone patches. Although the increase in network diameter and average path length may slightly reduce the efficiency of material flow, the overall improvement in node connectivity and resilience is more significant.
Robustness analysis under random, malicious, and controlled attack scenarios (Figure 11) showed that the optimized ecological network exhibited higher stability under various attacks. Especially in random and malicious attack scenarios, the decline in connectivity robustness and global efficiency was smaller in the optimized network than in the original network. This indicates that the optimized ecological network has higher resilience and can maintain stability under external disturbances [19,49,50]. However, in the controlled attack scenario, the decline in connectivity robustness was more pronounced, especially when stepping stone patches were attacked, significantly reducing network stability. This indicates that stepping stone patches play a crucial role in the ecological network, and their protection and management should be a focus of ecological network planning, especially during urban expansion [19].
Through ecological corridor width simulation and water conveyance potential assessment, this study found that ecological corridors with a width of 30–50 m performed best in terms of water conveyance potential (Figure 12). The width of ecological corridors significantly affects their water conveyance capacity, especially in high-density urban areas, where 30–50 m wide corridors can effectively disperse peak runoff and reduce flood risk. However, as corridor width increases, the proportion of built land and other land significantly rises, which may limit the water conveyance capacity of ecological corridors. Therefore, future ecological corridor construction should focus on 30–50 m wide corridors, a finding consistent with Xie et al. [38]. Efforts should be made to minimize the encroachment of built land and other land to ensure the water conveyance potential of ecological corridors. In the water conveyance potential assessment of corridors (Figure 13), 21 corridors above Class II accounted for 20.38% of the total, indicating that nearly one-fifth of the corridors play an important role in water flow convergence in the ecological network, more likely to collect more surface runoff and mitigate urban flooding.

4.3. Policy Implications

In the sustainable development of Changchun, the protection and optimization of ecosystems have become key issues. The Changchun Territorial Space Master Plan (2021–2035) explicitly proposes the construction of a systematically connected ecological security pattern, enhancing the connectivity of urban green spaces and optimizing the urban green space system. In this context, Jilin Province has comprehensively implemented the river chief system, strengthened the restoration and protection of river wetlands, and accelerated the construction of artificial wetlands in key areas such as the Shitoukoumen and Xinlicheng Reservoirs. Additionally, Changchun has implemented water system connectivity and river ecological water replenishment projects, effectively enhancing the connectivity of water systems. Based on the findings of this study, we recommend prioritizing the protection of key ecological nodes, especially stepping stone wetlands, to improve the connectivity of the ecological network. Meanwhile, the protection of the Yitong River and its surrounding wetlands should be a prerequisite for urban development, ensuring their integrity in flood mitigation and ecological functions. Below are some comprehensive recommendations:
Key Node Protection: Strictly protect nodes ranking in the top 10% for betweenness centrality (e.g., Source 7, Source 15) and prohibit high-intensity development in surrounding areas.
Stepping Stone Patch Restoration: Enhance the flood storage capacity of small, dispersed stepping stone patches in suburban areas (e.g., patches smaller than 1 hm2) through artificial wetland construction or vegetation restoration.
Comprehensive Management of the Yitong River: Combine river dredging with wetland restoration along the riverbanks to enhance its role as the core corridor of the ecological network, while establishing buffer zones to limit built land expansion.
Multi-Scale Planning Integration: Incorporate ecological network optimization schemes into the Changchun Territorial Space Master Plan to ensure coordinated protection measures at both the city and community levels.

4.4. Limitations

Despite the success of the current study in constructing and optimizing the wetland ecological network in Changchun City through the utilization of MSPA, the MCR model, and complex network theory, there are certain limitations that must be acknowledged. Primarily, this study overlooked the impact of seasonal variations and the long-term succession of wetland landscapes on network functionality. Wetland ecosystems are known to undergo substantial changes in different seasons and years, such as fluctuations in water levels and changes in vegetation cover. These variations may have a bearing on the flood storage capacity and ecological connectivity of wetlands. This may result in an inaccurate assessment of the flood control efficacy of wetland networks. Secondly, this study primarily focused on high-density urban areas and did not conduct a multi-scale analysis. Wetland ecological networks at different spatial scales may exhibit different structural and functional characteristics [51], and the results of small-scale studies may not be directly generalizable to large-scale regions [52]. For instance, wetland networks within urban areas may differ considerably from those at the regional scale with regard to connectivity and flood control functions.
In order to surmount the limitations identified, it is recommended that subsequent studies consider the introduction of time-series data for the purpose of analyzing the effects of seasonal and long-term changes in wetland landscapes on ecological network functioning. The combination of remotely sensed time-series data facilitates the dynamic monitoring of the changing trends of wetlands [53] and the assessment of their responsiveness during extreme rainfall events. Furthermore, multi-scale analyses can be conducted to explore the structural and functional differences of wetland ecological networks at various spatial scales [53]. For instance, wetland ecological networks can be constructed and optimized at urban, regional, and watershed scales to analyze their flood control effectiveness and ecological connectivity at different levels. Through multi-scale analysis, more targeted suggestions can be provided for urban planning and management at different levels.

5. Conclusions

This study constructed and optimized a wetland ecological network in Changchun by integrating Morphological Spatial Pattern Analysis (MSPA), Minimum Cumulative Resistance (MCR) modeling, and complex network theory. The key findings are as follows:

5.1. Enhanced Connectivity and Flood Mitigation

  • The optimized network increased node degree (2.737 → 3.433) and clustering coefficient (0.074 → 0.231), significantly improving floodwater dispersion efficiency.
  • Ecological corridors with 30–50 m widths were identified as optimal for peak runoff reduction, aligning with Sponge City construction standards.

5.2. Robustness Under Urban Pressures

  • The network maintained 12.6–24.1% higher connectivity robustness under random, malicious, and urban expansion scenarios (Figure 11), demonstrating resilience to climate and anthropogenic disturbances.

5.3. Policy Actions

  • Priority Protection: Key nodes (e.g., Source 7, 15) and stepping stone wetlands (<1 ha) require conservation to prevent fragmentation.
  • Yitong River Restoration: Dredging and buffer-zone establishment are critical to sustain its role as the core corridor.
  • Multi-Scale Integration: Network optimization should be embedded in the Changchun Territorial Space Master Plan (2021–2035).

5.4. Limitations and Future Work

  • Seasonal wetland dynamics (e.g., water-level fluctuations) were not considered; long-term hydrological monitoring is recommended.
  • Scaling the methodology to regional watersheds (e.g., Songhua River Basin) could validate broader applicability.
This study provides a transferable framework for flood-resilient ecological planning in high-density cities, bridging landscape ecology and urban flood management.

Supplementary Materials

The following supporting information can be downloaded at: https://www.mdpi.com/article/10.3390/w17101461/s1, Table S1. data for ecological sources. Table S2. PROMETHEE II Parameters. Table S3. PROMETHEE II Ranking results. Table S4. PROMETHEE II Ranking results. Table S5. Soil wetness classification. Figure S1. (a) Soil texture distribution in Changchun; (b) Soil type distribution based on SCS-CN. Table S6. CN values of different land use types. Table S7. AHP data. Table S8. AHP Analyze results. Table S9. Consistency test result summary. References [47,54,55] are cited in the supplementary materials.

Author Contributions

H.T.: data acquisition and curation, writing—original draft. Y.C.: conceptualization, visualization, validation, writing—review and editing. Y.Z.: methodology. All authors have read and agreed to the published version of the manuscript.

Funding

This research was funded by the Key Project of Jilin Province Science and Technology Development Plan, grant number 20220203003SF.

Data Availability Statement

The data presented in this study are available on request from the corresponding author. The processed data are not publicly available as the data also form part of an ongoing study.

Conflicts of Interest

The authors declare that they do not have any commercial or associative interests that represent conflicts of interest in connection with the work submitted.

References

  1. Jenkins, K.; Surminski, S.; Hall, J.; Crick, F. Assessing surface water flood risk and management strategies under future climate change: Insights from an Agent-Based Model. Sci. Total Environ. 2017, 595, 159–168. [Google Scholar] [CrossRef] [PubMed]
  2. Ertan, S.; Çelik, R.N. The Assessment of Urbanization Effect and Sustainable Drainage Solutions on Flood Hazard by GIS. Sustainability 2021, 13, 2293. [Google Scholar] [CrossRef]
  3. Bai, T.; Mayer, A.L.; Shuster, W.D.; Tian, G.H. The Hydrologic Role of Urban Green Space in Mitigating Flooding (Luohe, China). Sustainability 2018, 10, 3584. [Google Scholar] [CrossRef] [PubMed]
  4. U.S. Environmental Protection Agency. Wetlands: Protecting Life and Property from Flooding; U.S. Environmental Protection Agency: Washington, DC, USA, 2006.
  5. Jia, H.; Ma, H.; Wei, M. Urban wetland planning: A case study in the Beijing central region. Ecol. Complex. 2011, 8, 213–221. [Google Scholar] [CrossRef]
  6. Uluocha, N.O.; Okeke, I.C. Implications of wetlands degradation for water resources management: Lessons from Nigeria. GeoJournal 2004, 61, 154. [Google Scholar] [CrossRef]
  7. Jaramillo, F.; Desormeaux, A.; Hedlund, J.; Jawitz, J.W.; Clerici, N.; Piemontese, L.; Rodríguez-Rodriguez, J.A.; Anaya, J.A.; Blanco-Libreros, J.F.; Borja, S.; et al. Priorities and Interactions of Sustainable Development Goals (SDGs) with Focus on Wetlands. Water 2019, 11, 619. [Google Scholar] [CrossRef]
  8. Jones-Walters, L. Pan-European ecological networks. J. Nat. Conserv. 2007, 15, 262–264. [Google Scholar] [CrossRef]
  9. Luo, J.L.; Zhu, L.; Fu, H. Construction of wetland ecological network based on MSPA-Conefor-MCR: A case study of Haikou City. Ecol. Indic. 2024, 166, 112329. [Google Scholar] [CrossRef]
  10. Xu, F.; Yin, H.; Kong, F.; Xu, J. Developing ecological networks based on mspa and the least-cost path method: A case study in bazhong western new district. Acta Ecol. Sin. 2015, 35, 6425–6434. [Google Scholar]
  11. Ma, J.; Yu, Q.; Wang, H.Y.; Yang, L.Z.; Wang, R.R.; Fang, M.Z. Construction and Optimization of Wetland Landscape Ecological Network in Dongying City, China. Land 2022, 11, 1226. [Google Scholar] [CrossRef]
  12. Yu, K.J. Landscape Ecological Security Patterns for Biological Conservation. Acta Ecol. Sin. 1999, 19, 8. [Google Scholar]
  13. Chi, Y.; Xie, Z.; Wang, J. Establishing archipelagic landscape ecological network with full connectivity at dual spatial scales. Ecol. Model. 2019, 399, 54–65. [Google Scholar] [CrossRef]
  14. Strogatz, S.H. Exploring complex networks. Nature 2001, 410, 268–276. [Google Scholar] [CrossRef] [PubMed]
  15. Shi, Q.; Lu, J.; Han, J. Studying the spatiotemporal variations of the ecological network and carbon utilization efficiency in Southeast Tibet based on complex network theory. Ecol. Indic. 2024, 166, 112521. [Google Scholar] [CrossRef]
  16. Guo, H.; Yu, Q.; Pei, Y.; Wang, G.; Yue, D. Optimization of landscape spatial structure aiming at achieving carbon neutrality in desert and mining areas. J. Clean. Prod. 2021, 322, 129156. [Google Scholar] [CrossRef]
  17. Dou, P.; Cui, B.S. Dynamics and integrity of wetland network in estuary. Ecol. Inform. 2014, 24, 1–10. [Google Scholar] [CrossRef]
  18. Gao, C.; Pan, H.; Wang, M.; Zhang, T.; He, Y.; Cheng, J.; Yao, C. Identifying priority areas for ecological conservation and restoration based on circuit theory and dynamic weighted complex network: A case study of the Sichuan Basin. Ecol. Indic. 2023, 155, 111064. [Google Scholar] [CrossRef]
  19. Zhang, Y.; Tian, N.; Chen, A.; Qiu, J.; He, C.; Cao, Y. Identification of a wetland ecological network for urban heat island effect mitigation in Changchun, China. Ecol. Indic. 2023, 150, 110248. [Google Scholar] [CrossRef]
  20. Karra, K.; Kontgis, C.; Statman-Weil, Z.; Mazzariello, J.C.; Mathis, M.; Brumby, S.P. Global land use/land cover with Sentinel-2 and deep learning. In Proceedings of the 2021 IEEE International Geoscience and Remote Sensing Symposium (IGARSS 2021), Brussels, Belgium, 11–16 July 2021; IEEE: New York, NY, USA, 2021. [Google Scholar]
  21. Cui, L.; Wang, J.; Sun, L.; Lv, C. Construction and optimization of green space ecological networks in urban fringe areas: A case study with the urban fringe area of Tongzhou district in Beijing. J. Clean. Prod. 2020, 276, 124266. [Google Scholar] [CrossRef]
  22. Ding, M.; Liu, W.; Xiao, L.; Zhong, F.; Lu, N.; Zhang, J.; Zhang, Z.; Xu, X.; Wang, K. Construction and optimization strategy of ecological security pattern in a rapidly urbanizing region: A case study in central-south China. Ecol. Indic. 2022, 136, 108604. [Google Scholar] [CrossRef]
  23. Huang, K.; Peng, L.; Wang, X.; Deng, W. Integrating circuit theory and landscape pattern index to identify and optimize ecological networks: A case study of the Sichuan Basin, China. Environ. Sci. Pollut. Res. 2022, 29, 66874–66887. [Google Scholar] [CrossRef] [PubMed]
  24. Shi, Z.-H.; Chen, L.-D.; Fang, N.-F.; Qin, D.-F.; Cai, C.-F. Research on the SCS-CN initial abstraction ratio using rainfall-runoff event analysis in the Three Gorges Area, China. Catena 2009, 77, 1–7. [Google Scholar] [CrossRef]
  25. Soulis, K.X.; Valiantzas, J.D. SCS-CN parameter determination using rainfall-runoff data in heterogeneous watersheds—The two-CN system approach. Hydrol. Earth Syst. Sci. 2012, 16, 1001–1015. [Google Scholar] [CrossRef]
  26. Ye, H.; Yang, Z.; Xu, X. Ecological Corridors Analysis Based on MSPA and MCR Model-A Case Study of the Tomur World Natural Heritage Region. Sustainability 2020, 12, 959. [Google Scholar] [CrossRef]
  27. Kwon, O.-S.; Kim, J.-H.; Ra, J.-H. Landscape Ecological Analysis of Green Network in Urban Area Using Circuit Theory and Least-Cost Path. Land 2021, 10, 847. [Google Scholar] [CrossRef]
  28. McRae, B.H.; Dickson, B.G.; Keitt, T.H.; Shah, V.B. Using circuit theory to model connectivity in ecology, evolution, and conservation. Ecology 2008, 89, 2712–2724. [Google Scholar] [CrossRef]
  29. Dickson, B.G.; Albano, C.M.; McRae, B.H.; Anderson, J.J.; Theobald, D.M.; Zachmann, L.J.; Sisk, T.D.; Dombeck, M.P. Informing Strategic Efforts to Expand and Connect Protected Areas Using a Model of Ecological Flow, with Application to the Western United States. Conserv. Lett. 2017, 10, 564–571. [Google Scholar] [CrossRef]
  30. Luo, Y.; Wu, J.; Wang, X.; Wang, Z.; Zhao, Y. Can policy maintain habitat connectivity under landscape fragmentation? A case study of Shenzhen, China. Sci. Total Environ. 2020, 715, 136829. [Google Scholar] [CrossRef]
  31. Nie, W.; Shi, Y.; Siaw, M.J.; Yang, F.; Wu, R.; Wu, X.; Zheng, X.; Bao, Z. Constructing and optimizing ecological network at county and town Scale: The case of Anji County, China. Ecol. Indic. 2021, 132, 108294. [Google Scholar] [CrossRef]
  32. Wei, W.; Liu, C.; Ma, L.; Xie, B.; Zhou, J.; Nan, S. Optimization strategies of ecological security patterns through importance of ecosystem services and ecological sensitivity-A case study in the Yellow River Basin. Land Degrad. Dev. 2024, 35, 985–1001. [Google Scholar] [CrossRef]
  33. Goodwin, B.J.; Fahrig, L. How does landscape structure influence landscape connectivity? Oikos 2002, 99, 552–570. [Google Scholar] [CrossRef]
  34. Changguang, W.U.; Zhixiang, Z.; Pengcheng, W.; Wenfa, X.; Mingjun, T. The concept and measurement of landscape connectivity and its applications. Acta Ecol. Sin. 2010, 30, 1903–1910. [Google Scholar]
  35. Song, S.; Xu, D.; Hu, S.; Shi, M. Ecological Network Optimization in Urban Central District Based on Complex Network Theory: A Case Study with the Urban Central District of Harbin. Int. J. Environ. Res. Public Health 2021, 18, 1427. [Google Scholar] [CrossRef] [PubMed]
  36. Wang, Z.H.; Li, Z.H.; Wang, Y.F.; Zheng, X.Q.; Deng, X.Z. Building green infrastructure for mitigating urban flood risk in Beijing, China. Urban For. Urban Green. 2024, 93, 128218. [Google Scholar] [CrossRef]
  37. Ruefenacht, B.; Knight, R.L. Influences of corridor continuity and width on survival and movement of deermice Peromyscus maniculatus. Biol. Conserv. 1995, 71, 269–274. [Google Scholar] [CrossRef]
  38. Xie, Y.S.; Wang, Q.N.; Xie, M.Q.; Shibata, S. Construction feasibility evaluation for potential ecological corridors under different widths: A case study of Chengdu in China. Landsc. Ecol. Eng. 2023, 19, 381–399. [Google Scholar] [CrossRef]
  39. Kocyigit, M.B.; Akay, H. Estimation of potential flash flood risk in a basin using morphometric parameters: A case study of Akcay Basin. J. Fac. Eng. Archit. Gazi Univ. 2018, 33, 1321–1332. [Google Scholar] [CrossRef]
  40. Wang, Y.; Han, Y.L.; Pu, L.J.; Jiang, B.; Yuan, S.F.; Xu, Y. A Novel Model for Detecting Urban Fringe and Its Expanding Patterns: An Application in Harbin City, China. Land 2021, 10, 876. [Google Scholar] [CrossRef]
  41. Wu, Y.F.; Zhang, G.X.; Rousseau, A.N.; Xu, Y.J.; Foulon, É. On how wetlands can provide flood resilience in a large river basin: A case study in Nenjiang river Basin, China. J. Hydrol. 2020, 587, 125012. [Google Scholar] [CrossRef]
  42. Tiner, R.W. Geographically isolated wetlands of the United States. Wetlands 2003, 23, 494–516. [Google Scholar] [CrossRef]
  43. Zhou, Q.; Mikkelsen, P.S.; Halsnæs, K.; Arnbjerg-Nielsen, K. Framework for economic pluvial flood risk assessment considering climate change effects and adaptation benefits. J. Hydrol. 2012, 414–415, 539–549. [Google Scholar] [CrossRef]
  44. Zhang, Y.; Wei, Y.; Yao, R.; Sun, P.; Zhen, N.; Xia, X. Data Uncertainty of Flood Susceptibility Using Non-Flood Samples. Remote Sens. 2025, 17, 375. [Google Scholar] [CrossRef]
  45. Guillen-Ludena, S.; Lopez, D.; Mignot, E.; Riviere, N. Characterization of flow resistance in a floodplain for varying building density. In Proceedings of the 4th International Association for Hydro-Environment Engineering and Research (IAHR) Congress, Liege, Belgium, 27–29 July 2016; pp. 45–48. [Google Scholar]
  46. Li, B.; Gan, T. Construction of water security pattern of Changsha-Zhuzhou-Xiangtan urban agglomeration based on ArcGIS and GAP analysis. Water Resour. Prot. 2019, 35, 80–88. [Google Scholar]
  47. Chen, H.; Liu, Y.; Hu, L.; Zhang, Z.; Chen, Y.; Tan, Y.; Han, Y. Constructing a Flood-Adaptive Ecological Security Pattern from the Perspective of Ecological Resilience: A Case Study of the Main Urban Area in Wuhan. Int. J. Environ. Res. Public Health 2023, 20, 385. [Google Scholar] [CrossRef]
  48. Li, C.L.; Sun, N.; Lu, Y.H.; Guo, B.Y.; Wang, Y.; Sun, X.K.; Yao, Y.K. Review on Urban Flood Risk Assessment. Sustainability 2023, 15, 765. [Google Scholar] [CrossRef]
  49. Yu, Q.; Yue, D.P.; Wang, Y.H.; Kai, S.; Fang, M.Z.; Ma, H.; Zhang, Q.B.; Huang, Y. Optimization of ecological node layout and stability analysis of ecological network in desert oasis: A typical case study of ecological fragile zone located at Deng Kou County (Inner Mongolia). Ecol. Indic. 2018, 84, 304–318. [Google Scholar] [CrossRef]
  50. Men, D.; Pan, J. Ecological network identification and connectivity robustness evaluation in the Yellow River Basin under a multi-scenario simulation. Ecol. Model. 2023, 482, 110384. [Google Scholar] [CrossRef]
  51. Fan, J.P.; Wang, Q.; Ji, M.; Sun, Y.J.; Feng, Y.G.; Yang, F.S.; Zhang, Z. Ecological network construction and gradient zoning optimization strategy in urban-rural fringe: A case study of Licheng District, Jinan City, China. Ecol. Indic. 2023, 150, 110251. [Google Scholar] [CrossRef]
  52. Chao, Y.; Yan, Y.; Yan, S.; Pan, H.; Wu, L. County Scale Ecological Security Pattern Construction Based on MCR Model A Case Study of Yongchun County, Fujian Province. Bull. Soil Water Conserv. 2023, 43, 203–210. [Google Scholar]
  53. Bertassello, L.E.; Jawitz, J.W.; Aubeneau, A.F.; Botter, G.; Rao, P.S.C. Stochastic dynamics of wetlandscapes: Ecohydrological implications of shifts in hydro-climatic forcing and landscape configuration. Sci. Total Environ. 2019, 694, 133765. [Google Scholar] [CrossRef]
  54. Schoener, G.; Stone, M.C. Impact of antecedent soil moisture on runoff from a semiarid catchment. J. Hydrol. 2019, 569, 627–636. [Google Scholar] [CrossRef]
  55. Giglou, A.N.; Nazari, R.; Jazaei, F.; Karimi, M. Assessing the effects of increased impervious surface on the aquifer recharge through river flow network, case study of Jackson, Tennessee, USA. Sci. Total Environ. 2023, 872, 162203. [Google Scholar] [CrossRef]
Figure 1. (a) Geographic location of the study area (b) land cover distribution [20].
Water 17 01461 g001
Figure 2. Geographic location of study area and land cover distribution.
Water 17 01461 g002
Figure 3. The ecological source screening process.
Water 17 01461 g003
Figure 4. Promethee II validates source selection.
Water 17 01461 g004
Figure 5. Ecological resistance surface analysis. (A) Spatial distribution of comprehensive resistance surfaces; (B) comparison of resistance values by landscape type; (C) Pearson correlation analysis of resistance values and runoff volume.
Water 17 01461 g005
Figure 6. Spatial distribution of ecological corridors in Changchun’s main city and suburbs.
Water 17 01461 g006
Figure 7. Spatial distribution of ecological pinch points.
Water 17 01461 g007
Figure 8. Spatial distribution of stepping stone patches.
Water 17 01461 g008
Figure 9. Original ecological network topology evaluation: (A) node degree spatial distribution; (B) node degree frequency statistics; (C) centrality frequency distribution; (D) average clustering coefficient.
Water 17 01461 g009
Figure 10. Ecological network optimization strategy. (A) Optimized ecological network; (B) node degree analysis; (C) centrality frequency; (D) average clustering coefficient.
Water 17 01461 g010
Figure 11. Variation in network robustness in different scenarios: (A) simulating buffer distributions in policy-protected ecological source scenario; (B) random attack scenario; (C) malicious and controlled attack scenarios.
Water 17 01461 g011
Figure 12. Analysis of the optimal width of ecological corridors: (A) the percentage of landscape components at different width thresholds; (B) the growth rate of landscape components with width.
Water 17 01461 g012
Figure 13. Class distribution of water conveyance potential in ecological corridors.
Water 17 01461 g013
Table 1. Comprehensive resistance surface evaluation system and factor weight assignment.
Resistance FactorGrading MethodResistance ValueWeight
Land cover typeWetland10.21949
Grass land10
Woodland30
Other land50
Built land70
Elevation (m)<150100.09827
150–20030
200–25050
250–30070
>30090
Slope (°)<5100.11441
5–1030
10–1550
15–2070
>2090
FVC<0.2100.14227
0.2–0.430
0.4–0.650
0.6–0.870
>0.890
River distance (m)<5050.07724
50–10010
100–20030
200–50050
500–100070
>100090
Road distance (m)<5050.05678
50–10010
100–20030
200–50050
500–100070
>100090
Normalized runoff volume<0.79100.29154
0.63–0.7930
0.47–0.6350
0.22–0.4770
<0.2290
Table 2. Area statistics for MSPA elements.
TypeArea (hm2)Percentage
Core10,937.6587.11%
Bridge76.820.61%
Islet124.60.99%
Edge1210.919.64%
Perforation33.640.27%
Branch155.321.24%
Loop17.630.14%
Total12,556.57100%
Table 3. Ecological source indicator values and Source Importance Scores (SISs).
IDArea (hm2)Volume (%)SISIDArea (hm2)Volume (%)SIS
12922.05100150.9451340.740.180.801
25730.6946.95146.951415.020.380.551
3386.482.038.6891516.420.190.386
486.393.224.6381618.650.120.355
5148.181.514.0071719.030.110.351
6124.40.32.3821814.660.0870.252
7112.820.252.130 1915.560.0660.247
8105.570.0891.842208.260.0510.104
982.580.361.711218.130.0520.103
1071.550.331.489227.90.0550.102
1150.820.0540.851236.060.0530.068
1239.390.210.807245.180.0560.056
Table 4. Additional source area and dPC.
IDAreadPC
14.233.61551
23.573.157548
34.353.819444
44.463.627463
53.753.415335
63.463.355452
74.374.070733
84.083.871542
94.083.83618
104.514.275026
114.323.968203
123.953.510841
134.213.533849
Disclaimer/Publisher’s Note: The statements, opinions and data contained in all publications are solely those of the individual author(s) and contributor(s) and not of MDPI and/or the editor(s). MDPI and/or the editor(s) disclaim responsibility for any injury to people or property resulting from any ideas, methods, instructions or products referred to in the content.

