Article

Transboundary Urban Basin Analysis Using GIS and RST for Water Sustainability in Arid Regions

1
Alamoudi Water Research Chair, King Saud University, P.O. Box 2460, Riyadh 11451, Saudi Arabia
2
Department of Agricultural Engineering, College of Food & Agriculture Sciences, King Saud University, P.O. Box 2460, Riyadh 11451, Saudi Arabia
3
Department of Agricultural Engineering, Faculty of Agriculture, Ain Shams University, Hadayek Shoubra, P.O. Box 68, Cairo 11241, Egypt
4
New Mexico Water Resources Research Institute and the Department of Animal and Range Sciences, New Mexico State University, Las Cruces, NM 88003, USA
*
Authors to whom correspondence should be addressed.
Water 2025, 17(10), 1463; https://doi.org/10.3390/w17101463
Submission received: 10 March 2025 / Revised: 7 May 2025 / Accepted: 9 May 2025 / Published: 12 May 2025
(This article belongs to the Section Water Resources Management, Policy and Governance)

Abstract

:
Water, often described as the elixir of life, is a critical resource that sustains life on Earth. The acute water scarcity in the major basins of the Arabian Peninsula has been further aggravated by rapid population growth, urbanization, and the impacts of climate change. This situation underscores the urgent need for a comprehensive analysis of the region’s morphometric characteristics. Such an analysis is essential for informed decision-making in water resource management, infrastructure development, and conservation efforts. This study provides a foundational basis for implementing sustainable water management strategies and preserving ecological systems by deepening the understanding of the unique hydrological processes within the Arabian Peninsula. Additionally, this research offers valuable insights to policymakers for developing effective flood mitigation strategies by identifying vulnerable areas. The study focuses on an extensive investigation and assessment of morphometric parameters in the primary basins of the Arabian Peninsula, emphasizing their critical role in addressing water scarcity and promoting sustainable water management practices. The findings reveal that the Arabian Peninsula comprises 12 major basins, collectively forming a seventh-order drainage system and covering a total land area of 3.24 million km2. Statistical analysis demonstrates a strong correlation between stream order and cumulative stream length, as well as a negative correlation between stream order and stream number (R2 = 99%). Further analysis indicates that many of these basins exhibit a high bifurcation ratio, suggesting the presence of impermeable rocks and steep slopes. The hypsometric integral (HI) of the Peninsula is calculated to be 60%, with an erosion integral (EI) of 40%, indicating that the basin is in a mature stage of geomorphological development. Importantly, the region is characterized by a predominantly coarse drainage texture, limited infiltration, significant surface runoff, and steep slopes, all of which have critical implications for water resource management.

1. Introduction

Water, a fundamental resource for sustaining life [1], is facing scarcity, a pressing global issue that affects over two billion people living in high-water-stress regions, as highlighted by Boretti and Rosa [2]. This challenge disproportionately impacts areas with arid and semi-arid climates [3], where the reliance on non-renewable groundwater and limited surface water intensifies the crisis. The situation threatens sustainable development, socio-economic stability, and environmental conservation [4], presenting significant hurdles for ecosystems and societies where water demand exceeds supply [5]. The Arabian Peninsula, home to seven countries, suffers from a severe water deficit due to its arid climate and increasing demand [6]. In addition to high temperatures and significant evaporation rates, climate change has led to altered precipitation patterns, which increased surface runoff, consequently causing socioeconomic losses, soil erosion, infrastructure damage, and urban flooding [7,8]. The World Resources Institute predicts that by 2040, the Arabian Peninsula will be the most water-stressed region globally [9]. According to the Sustainable Development Goals, specifically SDG 13 [10], continuous climate change exacerbates this issue, necessitating region-specific strategies to address water scarcity [6].
In this context, transboundary water resources can either foster collaboration or spark disputes among neighboring nations. Water scarcity has increasingly harmed populations in several regions over the past decade [11], largely due to surging water demand driven by continuous population growth, industrial expansion, and intensive agriculture, coupled with the impacts of recent climate change [12]. These factors are key contributors to the water shortage observed in numerous cross-border river basins [11]. A transboundary basin, by definition, encompasses interconnected water systems crossing multiple countries and converging at a common outlet. These basins, shaped by both climatic and anthropogenic influences, confront issues like heightened water demand, uneven developmental progress, limited water resources, and adverse socioeconomic and environmental consequences for downstream areas. Such difficulties can provoke disputes over water rights and distribution among nations. Moreover, conflicts surrounding shared transboundary waters frequently escalate into hydro-political tensions, necessitating proactive hydro-political diplomacy to resolve them [13].
Across the globe, 263 river basins and nearly 300 aquifers traverse national boundaries, with over 140 countries dependent on these shared water systems. This offers a fertile ground for policymakers and researchers to investigate optimal strategies for managing transboundary water resources [14]. The growing risk of competition over transboundary groundwater has been highlighted by hydro-political studies, identifying various threats to regional peace and security. Addressing these challenges necessitates intergovernmental collaboration to navigate hydrogeological, political, transboundary, and external dependencies concerning shared water bodies, including rivers and aquifers [15]. According to SDG 6, the absence of cooperation agreements on shared water resources remains a potential conflict trigger for most nations [10]. While research on transboundary basins is extensive, there remains a notable knowledge and expertise gap in the governance and collaboration required for managing shared aquifers and groundwater resources [15].
According to Article 6 of the UN Watercourses Convention, utilization of an international watercourse equitably and reasonably requires considering all relevant factors and circumstances, including geographic, hydrographic, hydrological, climatic, ecological, and other factors of a natural character [11]. Hence, understanding the region’s hydrology and watershed morphology is essential, and recent studies emphasize the importance of innovative water management strategies in stressed environments [16]. It stands as a formidable tool in hydrological studies, offering a quantitative assessment of watershed characteristics by leveraging remotely sensed data and geographical information systems. Globally acknowledged for its efficacy in addressing water-related challenges, this method provides a detailed understanding of the topography, size, shape, and drainage patterns of watersheds [17,18,19]. By identifying potential water storage and harvesting sites, estimating water availability, and tailoring flood mitigation strategies, morphometric analysis supports sustainable water management and ecosystem conservation in arid regions [20,21]. Its significance extends to environmental planning, improving water use efficiency, reducing flood risks, and fostering responsible land use with minimal ecological impact [22]. Furthermore, it aids in addressing climate change-induced challenges like increased runoff and urban flooding [23,24], aligning with regional sustainability goals [25,26].
Morphometric analysis, as elucidated by Radwan and Alazba [27] and Singh and Karan [28], offers an in-depth understanding of a watershed’s behavior and its response to precipitation events through the analysis of parameters such as drainage pattern, slope, relief, stream frequency, stream order, basin area and shape, and channel network, providing valuable insights into the characteristics and behavior of watersheds. In essence, morphometric analysis is a cornerstone in the hydrological scientific arsenal, enabling a holistic comprehension of watershed dynamics and empowering informed decision-making for sustainable water resource management. Additionally, the analysis enhances the understanding of hydrological processes and watershed morphology, which is essential for ecosystem conservation and restoration in this arid region [29,30]. Morphometric analysis offers important perspectives on the structure of drainage basins in dry areas, guiding knowledge and controlling water flow and accumulation. It is important for the strategic location of rainwater collecting and artificial recharge systems, researchers can find places with great runoff potential by assessing criteria like stream order, basin form, drainage density, and slope. The special geomorphology of the Arabian Peninsula, which is rather prone to flash flooding, emphasizes even more the need of such studies in identifying flood-prone areas and directing appropriate conservation and risk-reducing activities. Furthermore, mapping morphometric features over several basins helps to identify areas of groundwater recharge, therefore providing a way to lower pressure on already heavily depleted aquifers. These tests help to build strong water infrastructure capable of maintaining water delivery during droughts, which, under changing climatic circumstances, are predicted to grow more frequent and severe. Overall, morphometric analysis is a fundamental tool for comprehending the hydrological processes of the Arabian Peninsula, supporting water resource planning, flood risk mitigation, and the creation of sustainable water management strategies to tackle the persistent issue of water scarcity in the region.
The cross-border nature of basins introduces complex challenges in water governance, requiring collaborative efforts among neighboring nations to ensure sustainable water resource management, where effective water management in an arid desert environment, such as the Arabian Peninsula, hinges on the conservation of every drop of water. The novelty of this study lies in its methodology and the unique dataset utilized for conducting a comprehensive morphometric analysis of the major basins in the Arabian Peninsula. This study focuses on analyzing the linear, areal, and relief geomorphometric characteristics of the peninsula’s main basins, given that larger basins can collect more water. The study addresses a notable knowledge gap, as existing literature lacks a detailed analysis of the geomorphometric features of the Arabian Peninsula. This research makes a significant contribution by revealing that several major basins in the Arabian Peninsula traverse administrative borders, linking multiple countries. This finding highlights the critical need for coordinated, transboundary water management strategies, an aspect that has not been previously addressed in literature. This study is among the first to emphasize the importance of such coordinated strategies, filling a notable gap in existing research on the region’s hydrological systems.
This research aims to significantly enhance the scientific community’s understanding of watershed characteristics in water-scarce regions like the Arabian Peninsula. Furthermore, the study will extend to identifying flash flood risk zones, rainwater harvesting opportunities, groundwater reservoir locations, and recharge areas to promote integrated water resource management in future work. By combining GIS with remote sensing techniques (RST), the study can more accurately and automatically map out drainage networks, which is especially helpful in dry areas where it’s difficult to gather information on the ground. The research provides new insights into the hydrological behavior of the peninsula’s watersheds, offering critical data for water resource management and flood risk mitigation. Additionally, this approach presents a replicable framework that can be applied to other arid regions globally, thereby addressing a crucial gap in hydrological and morphometric studies. The insights generated by this study will support stakeholders, planners, and decision-makers in addressing the complex water challenges facing the region and thereby contributing to a sustainable water future.

2. Materials and Methods
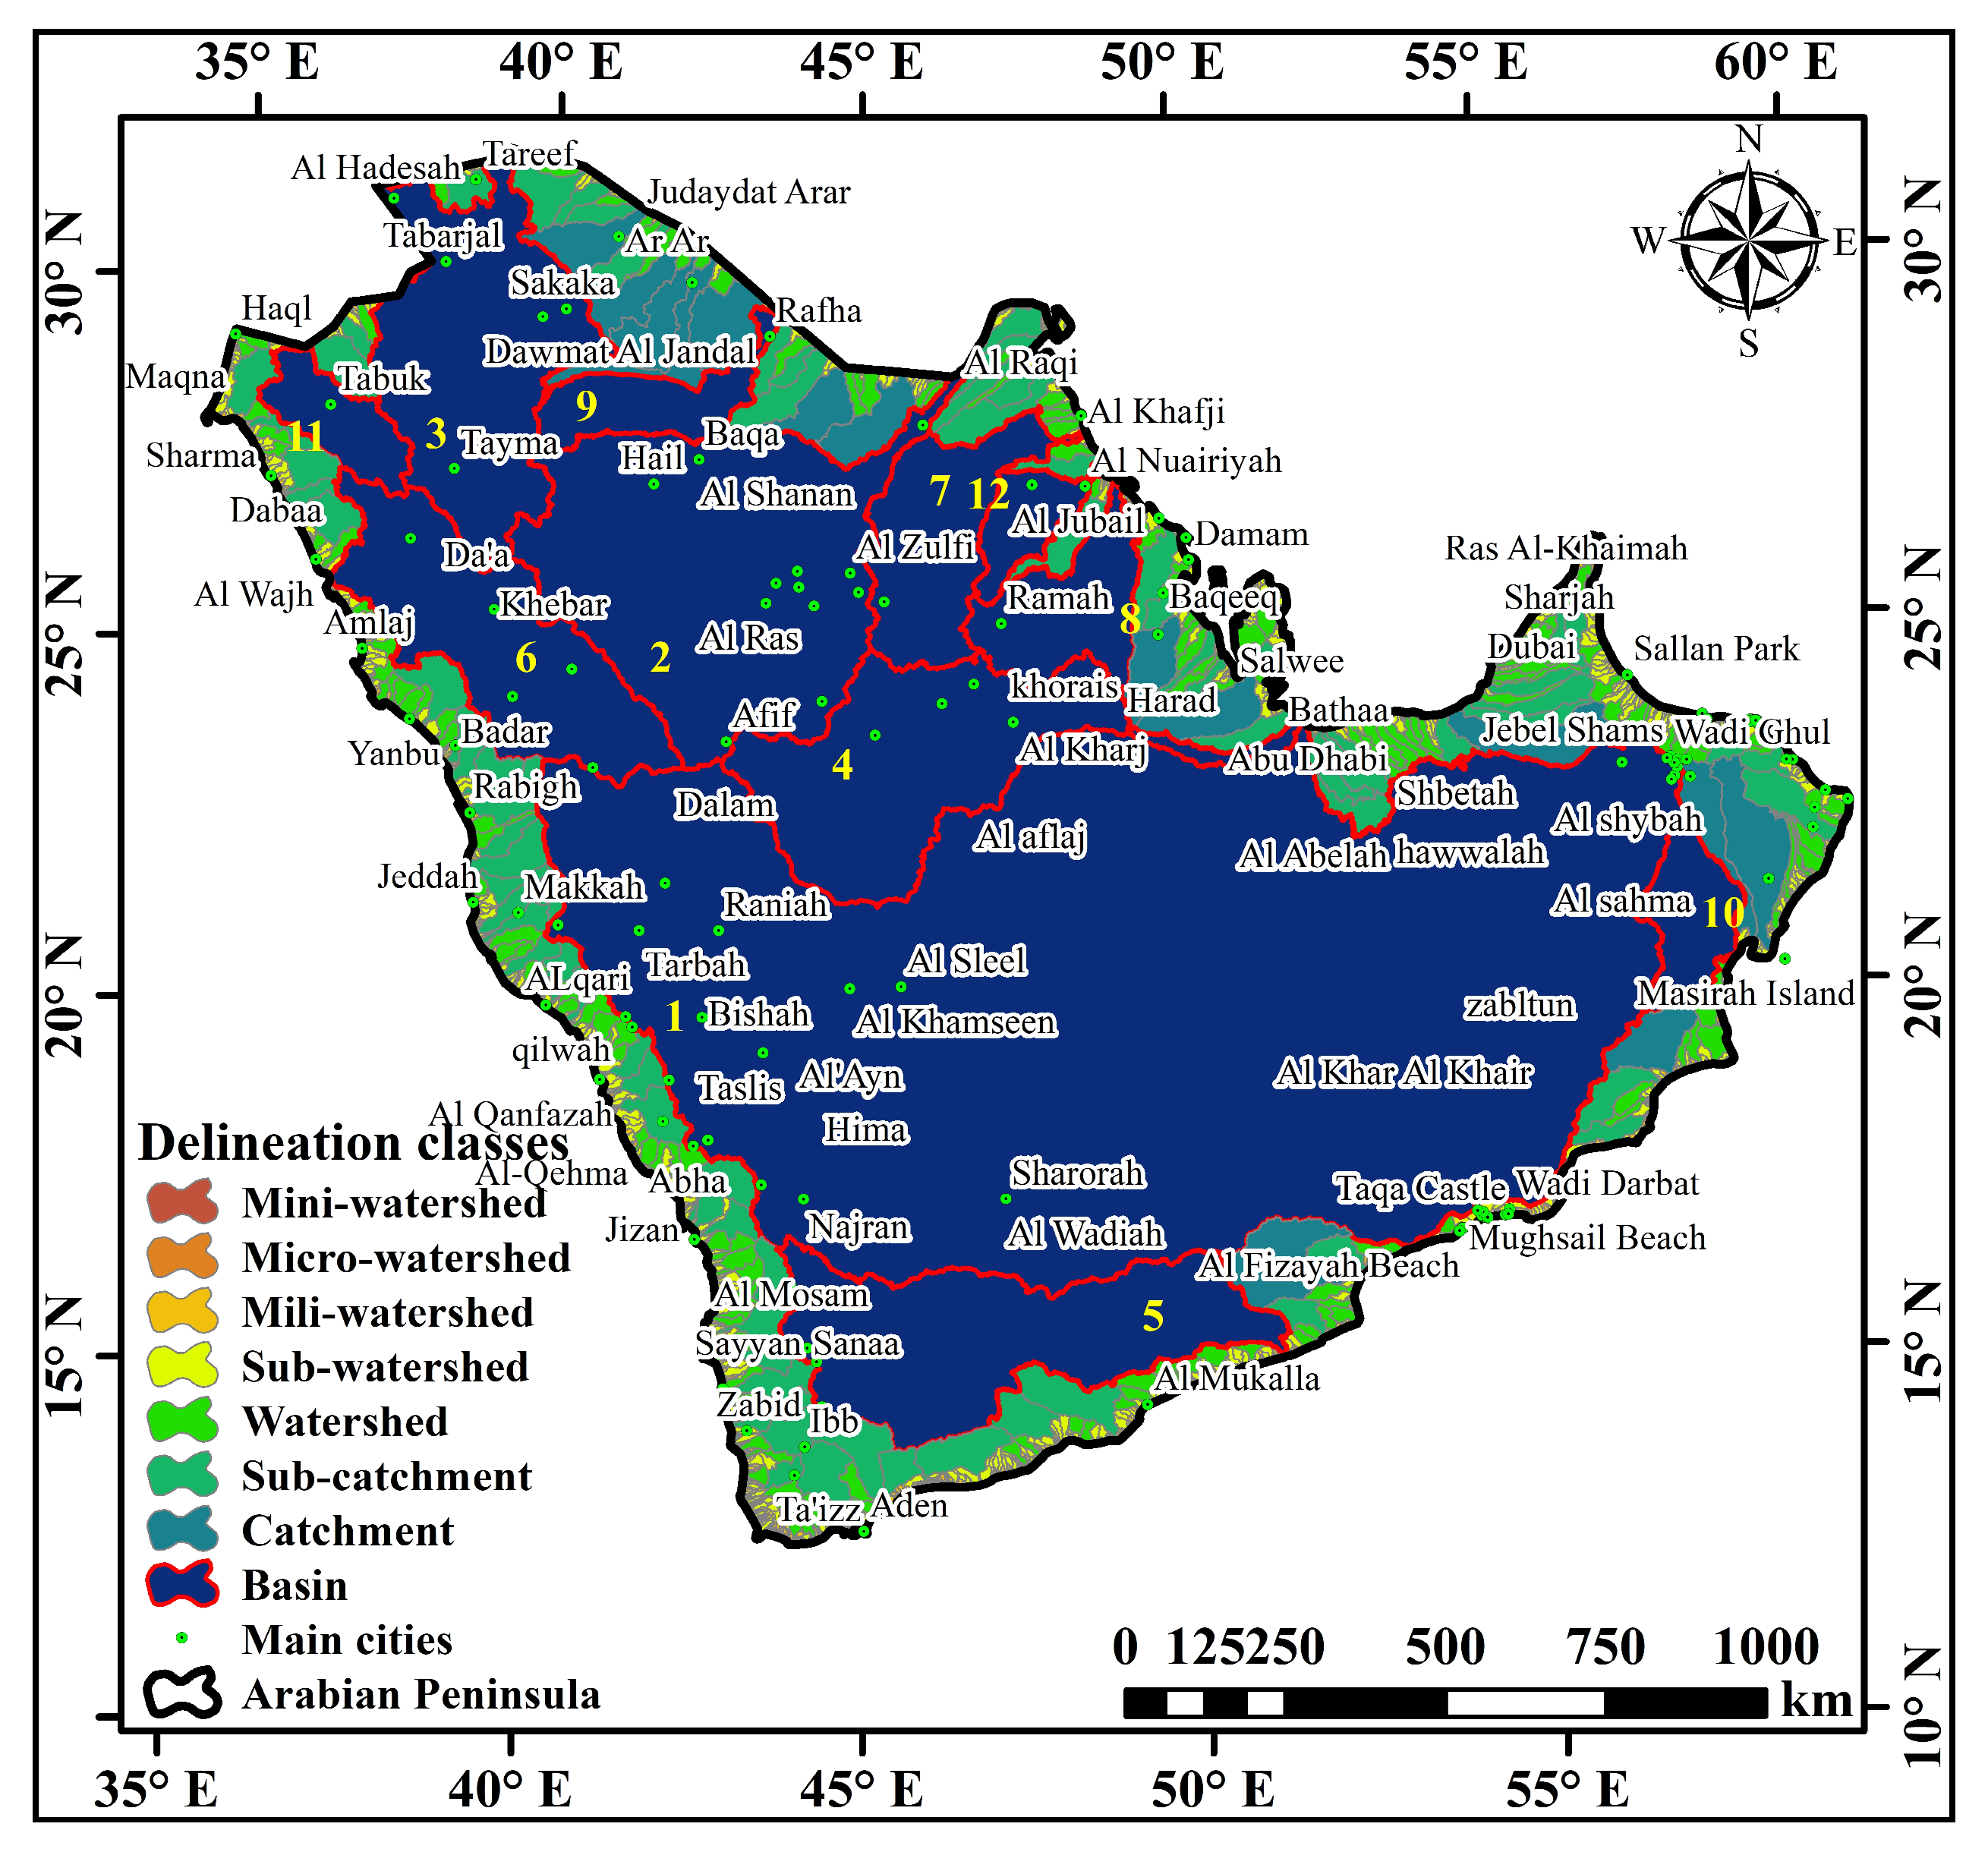
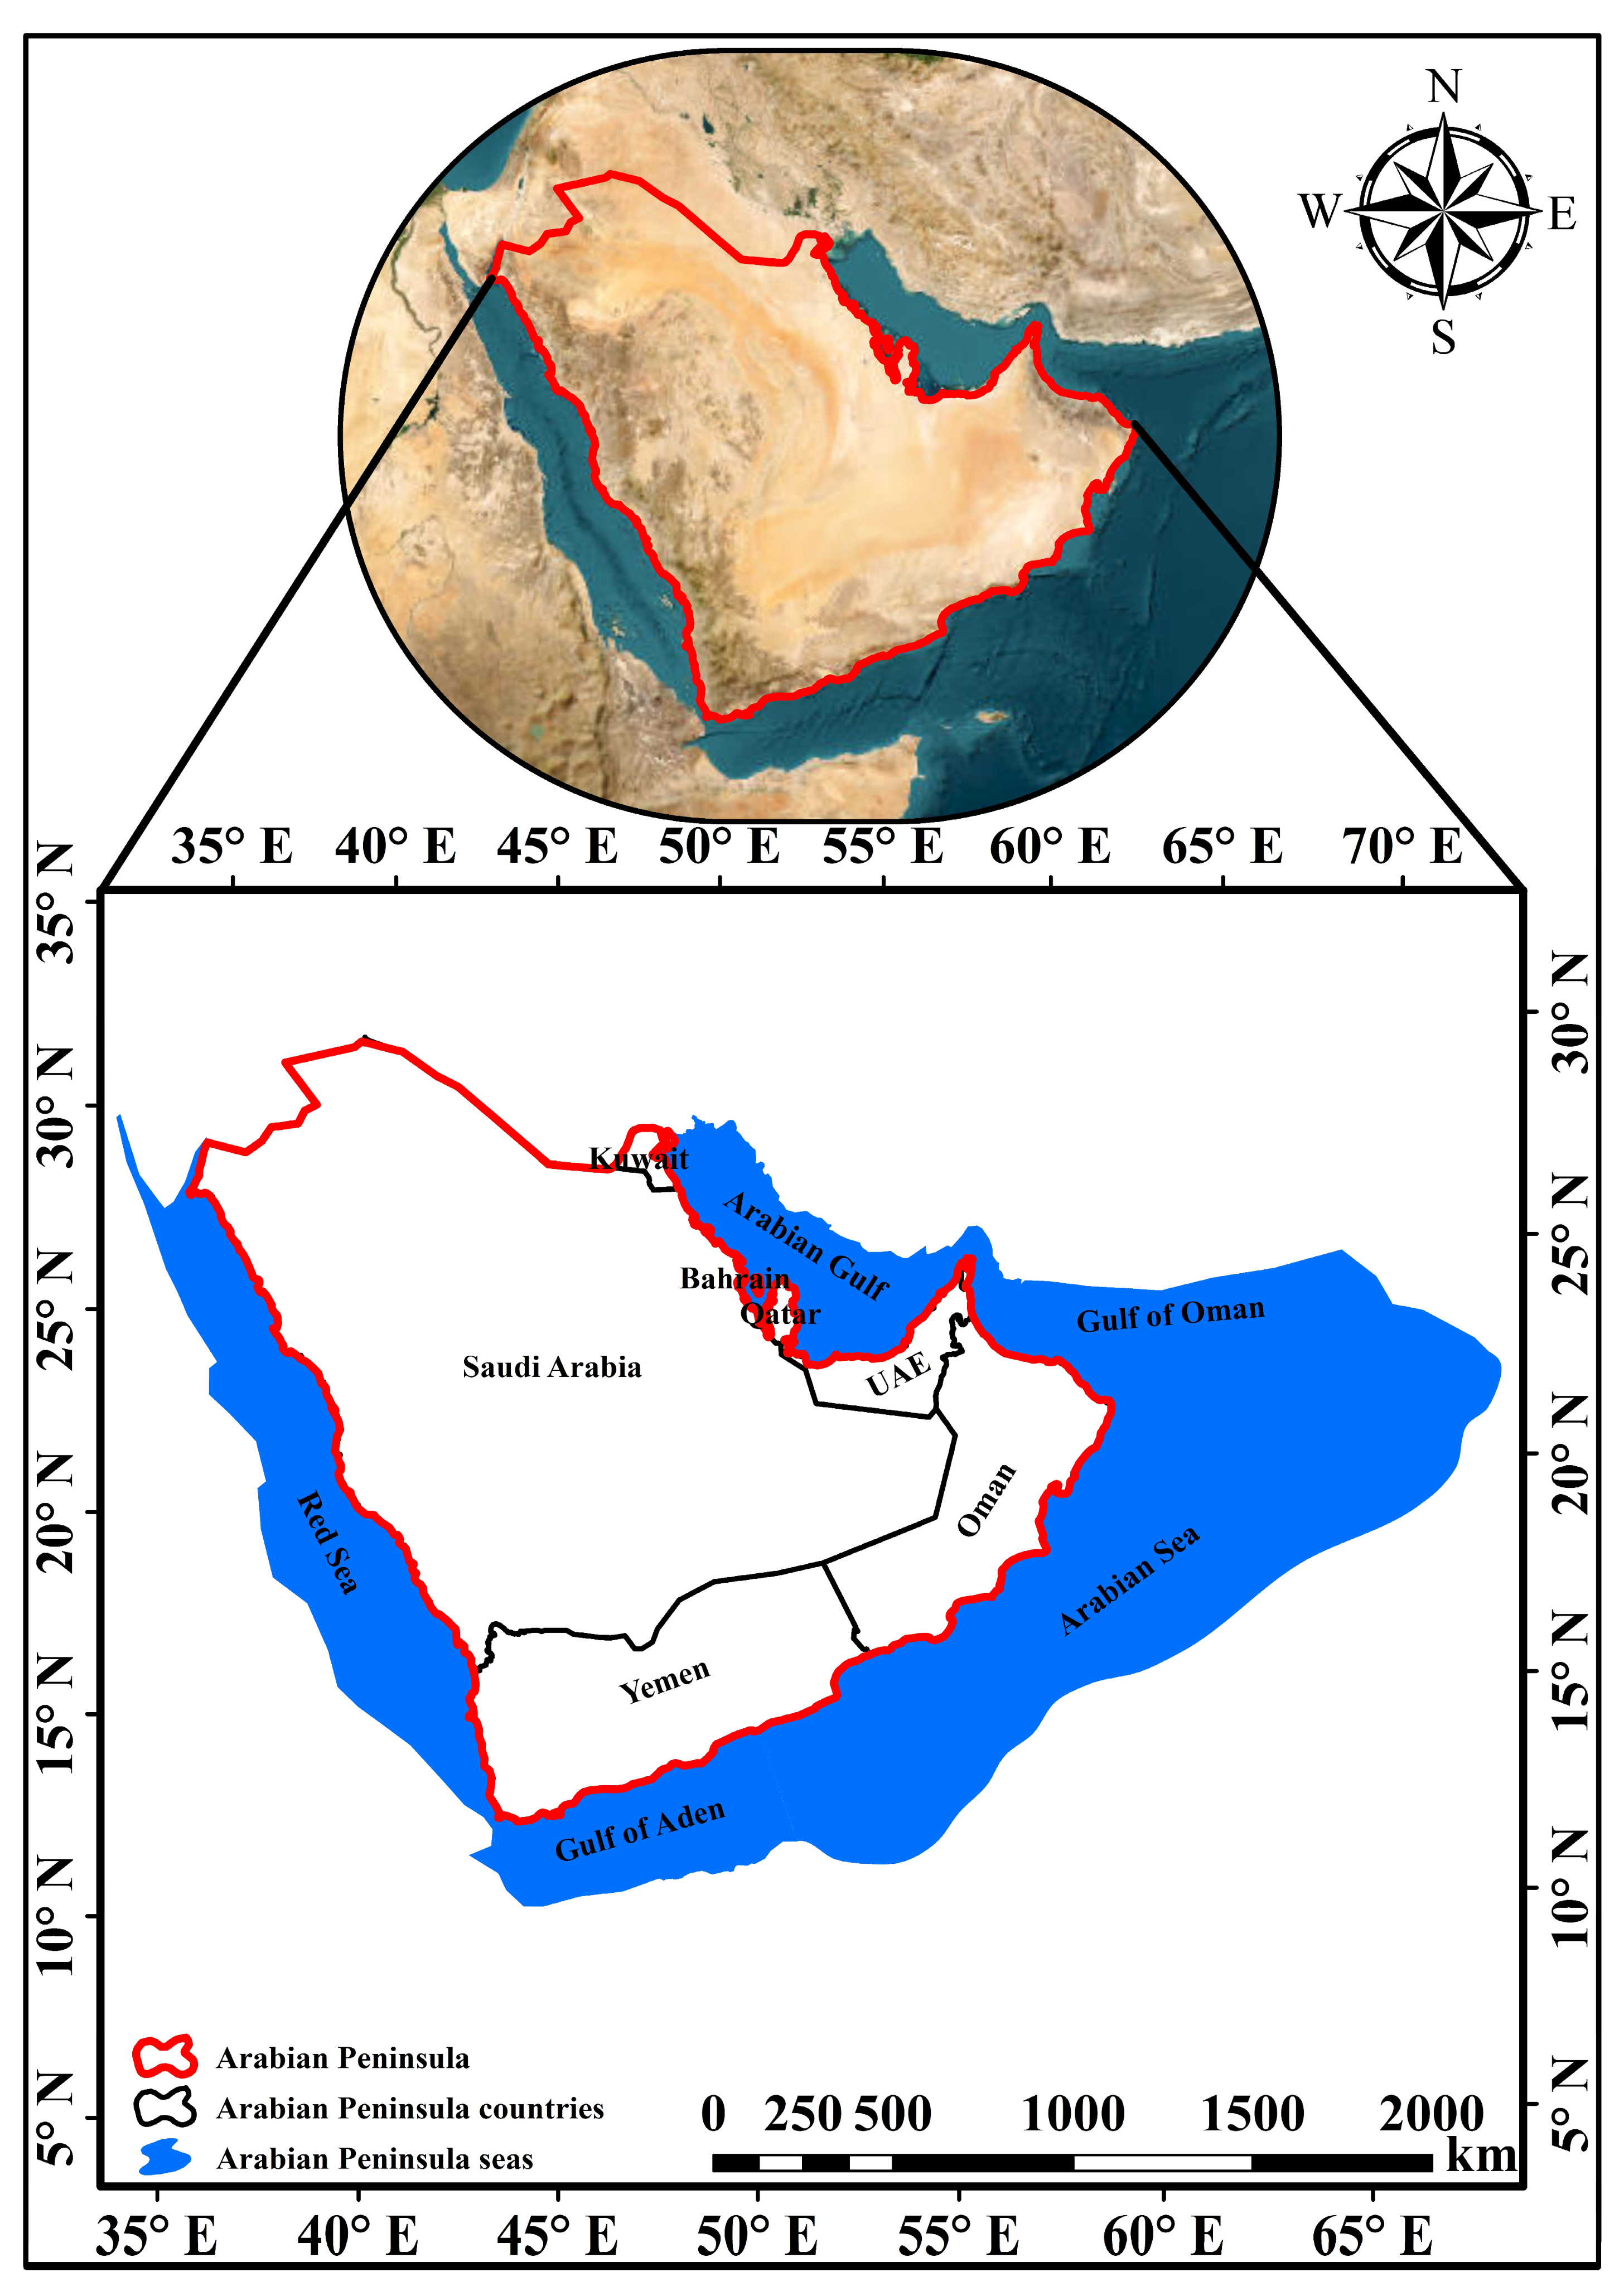
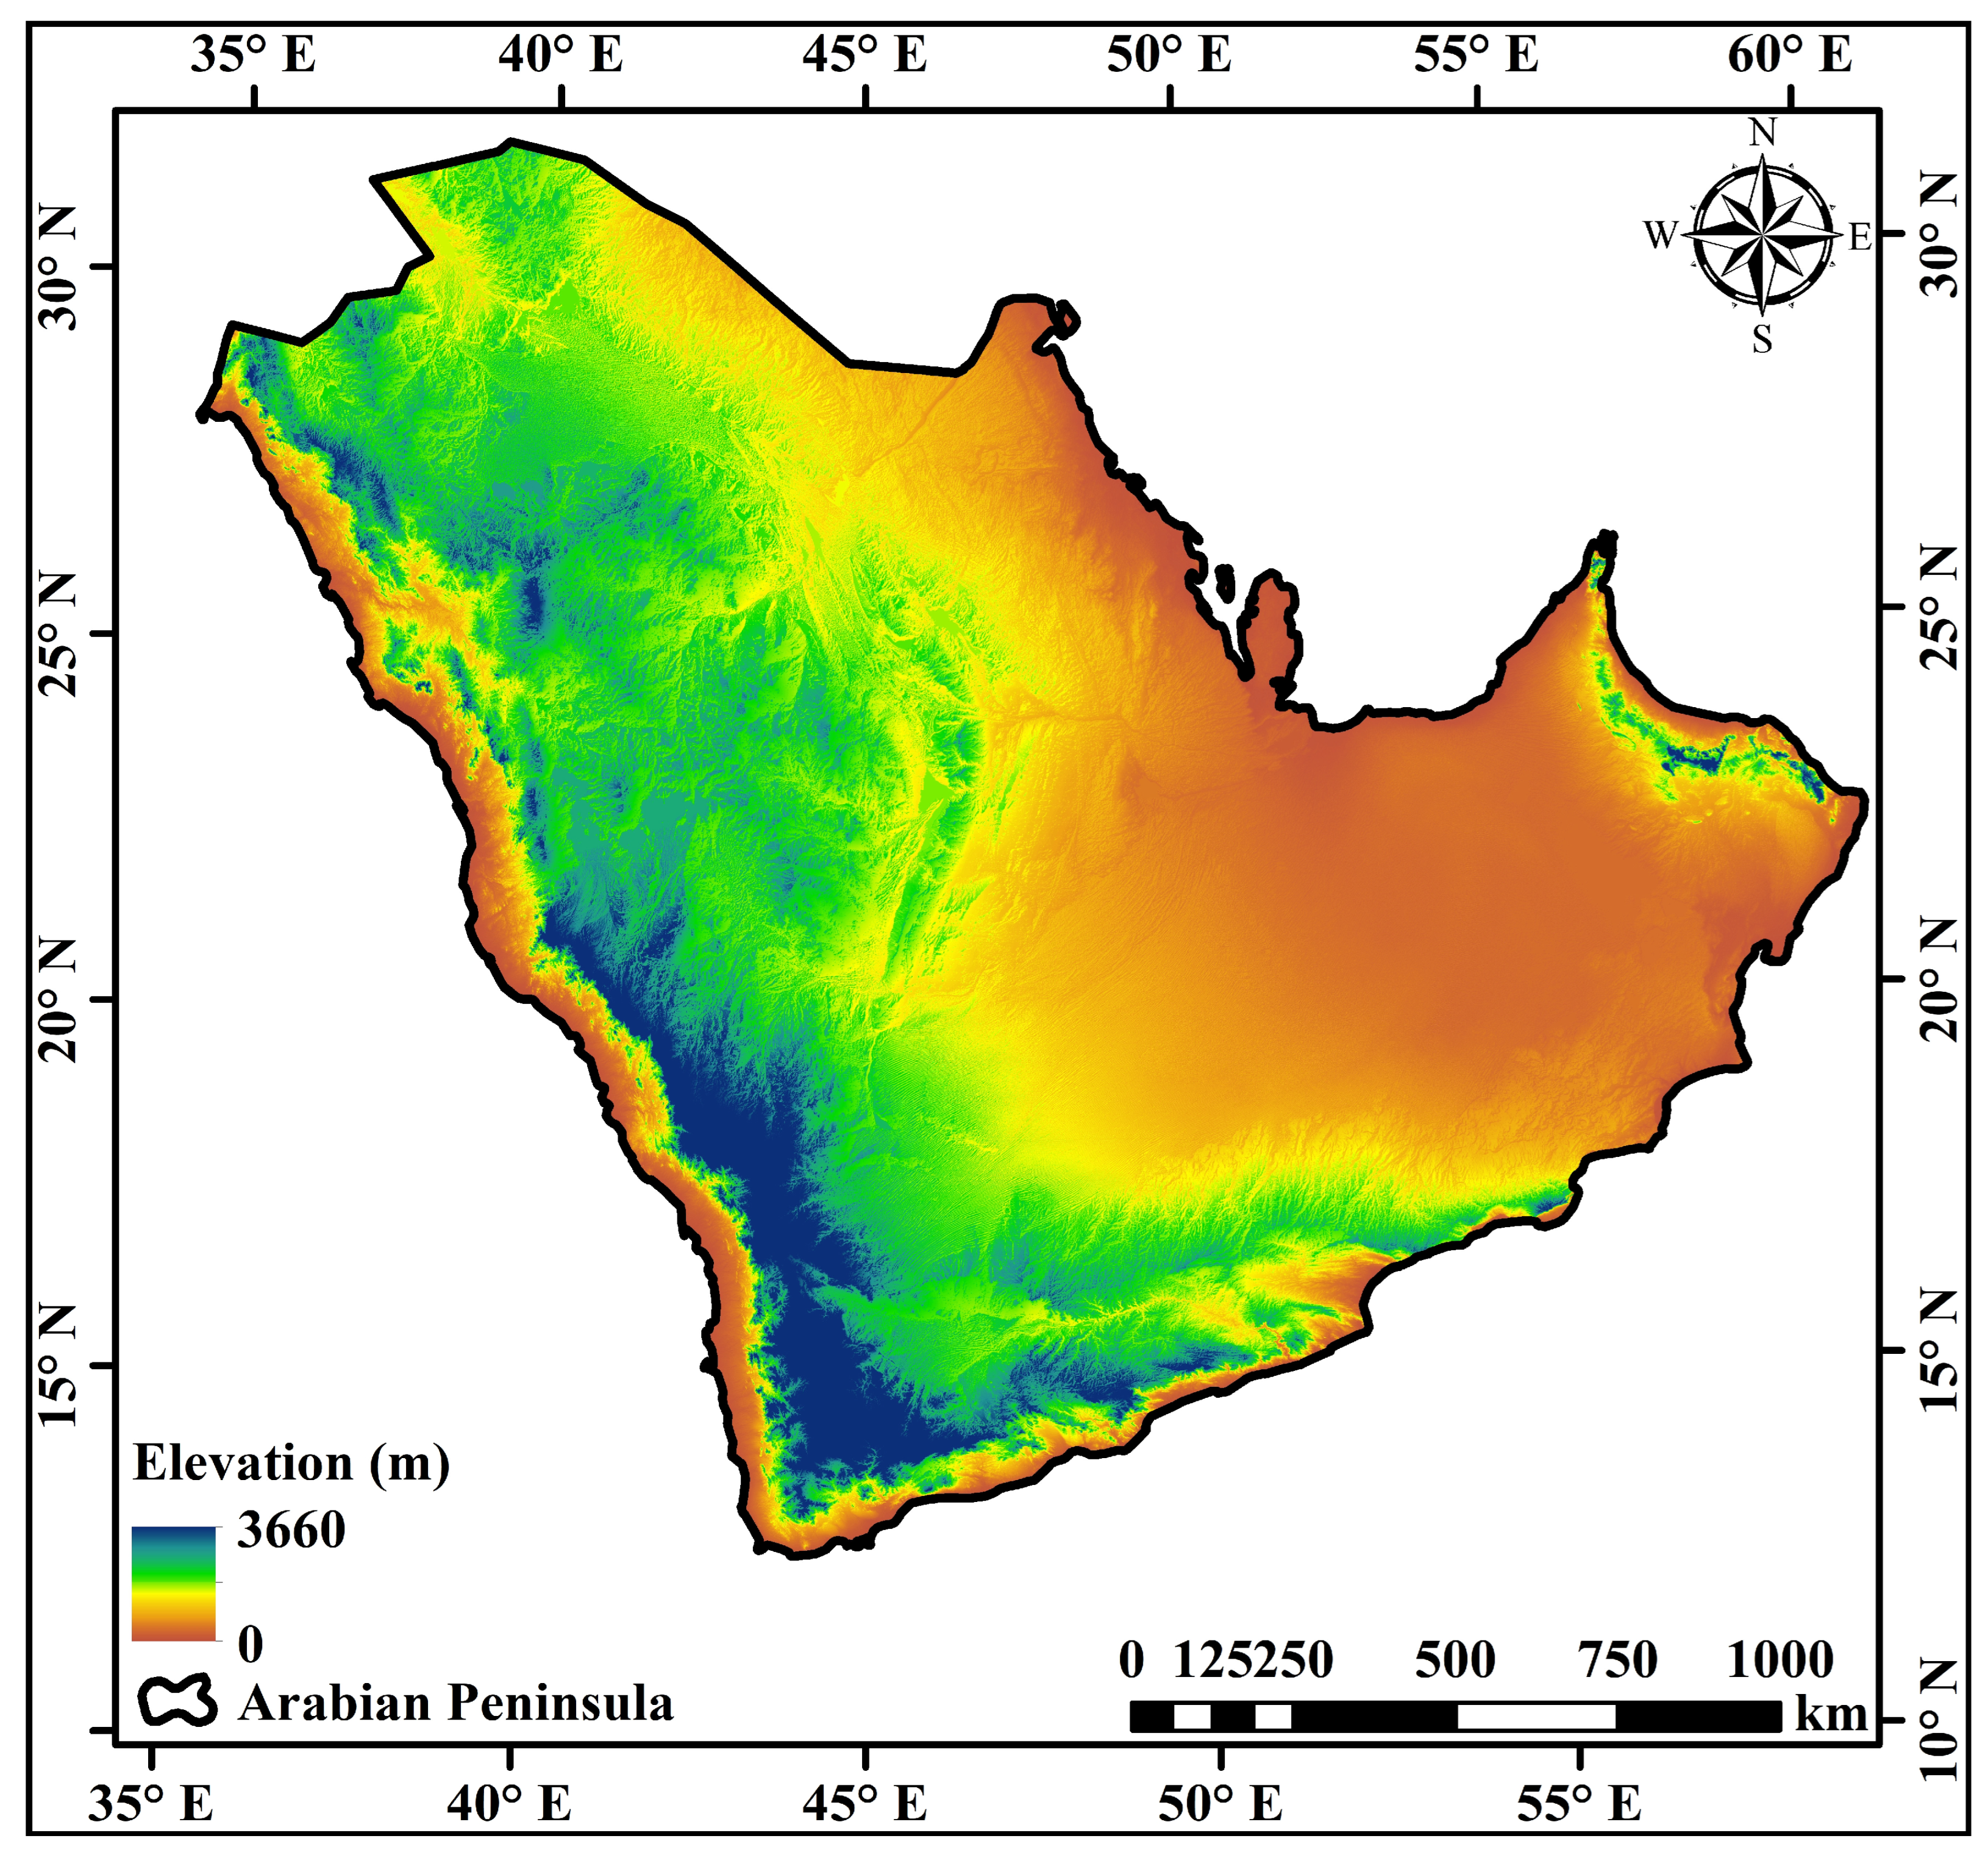
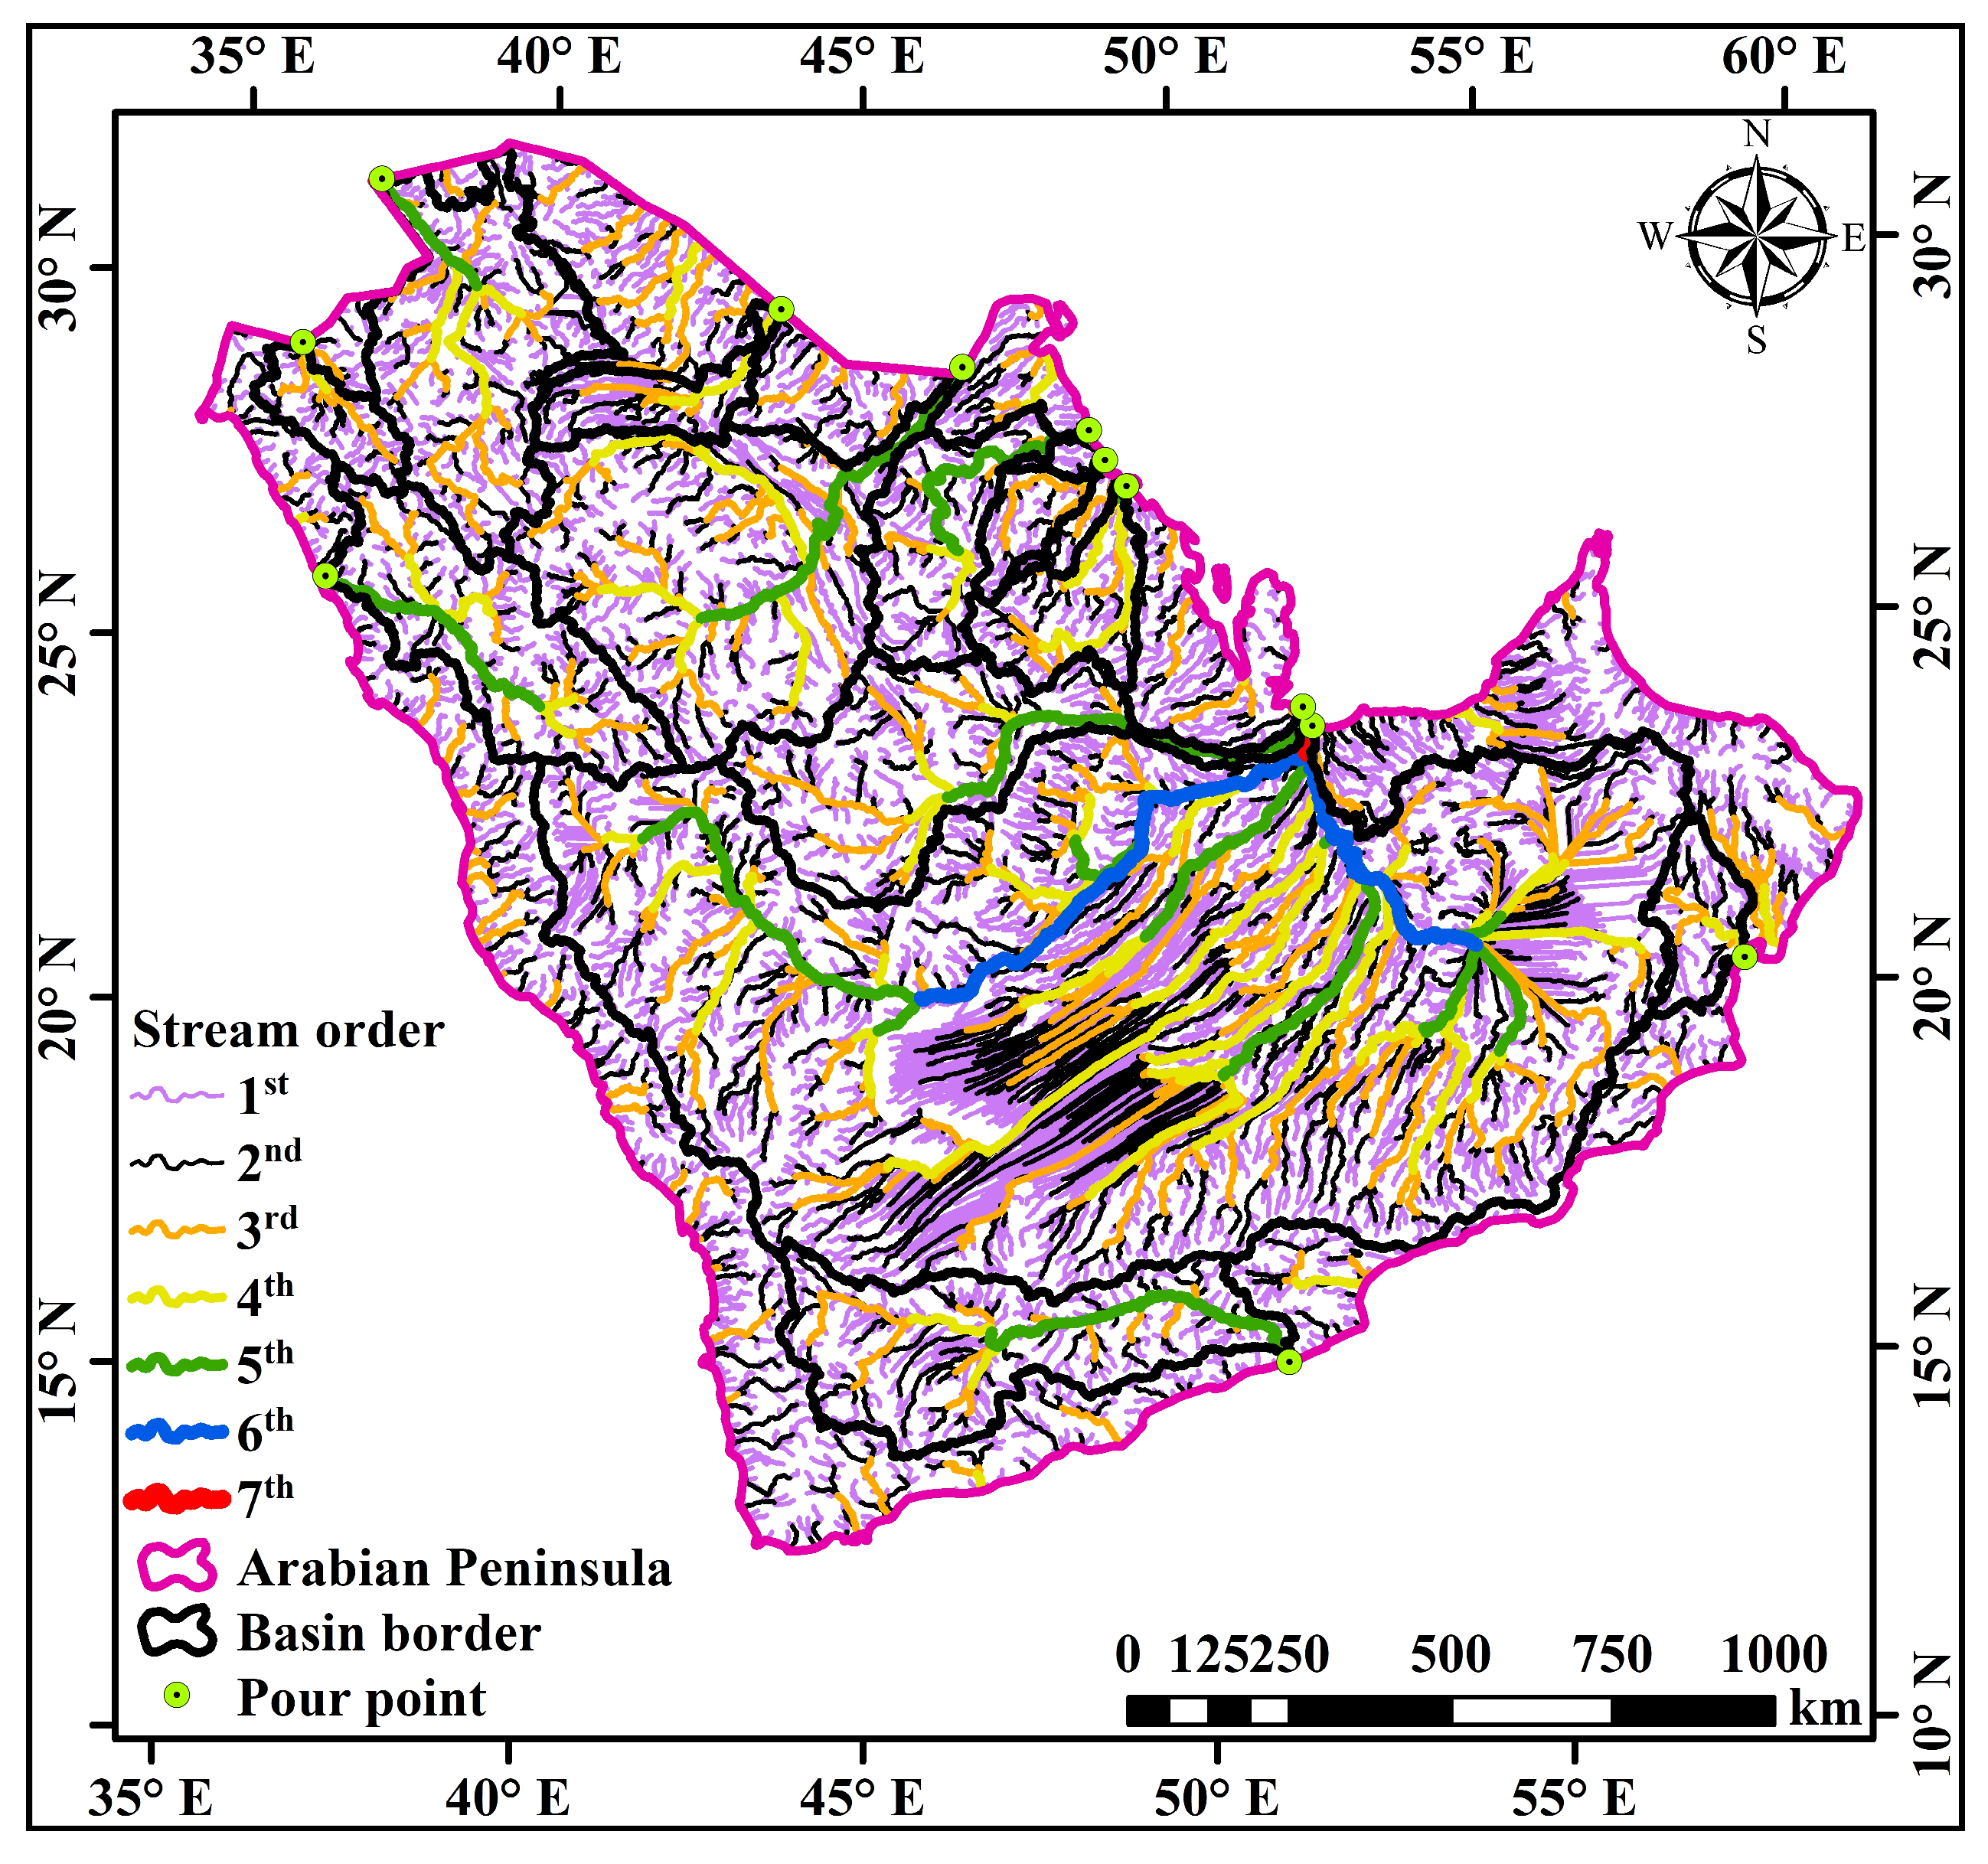
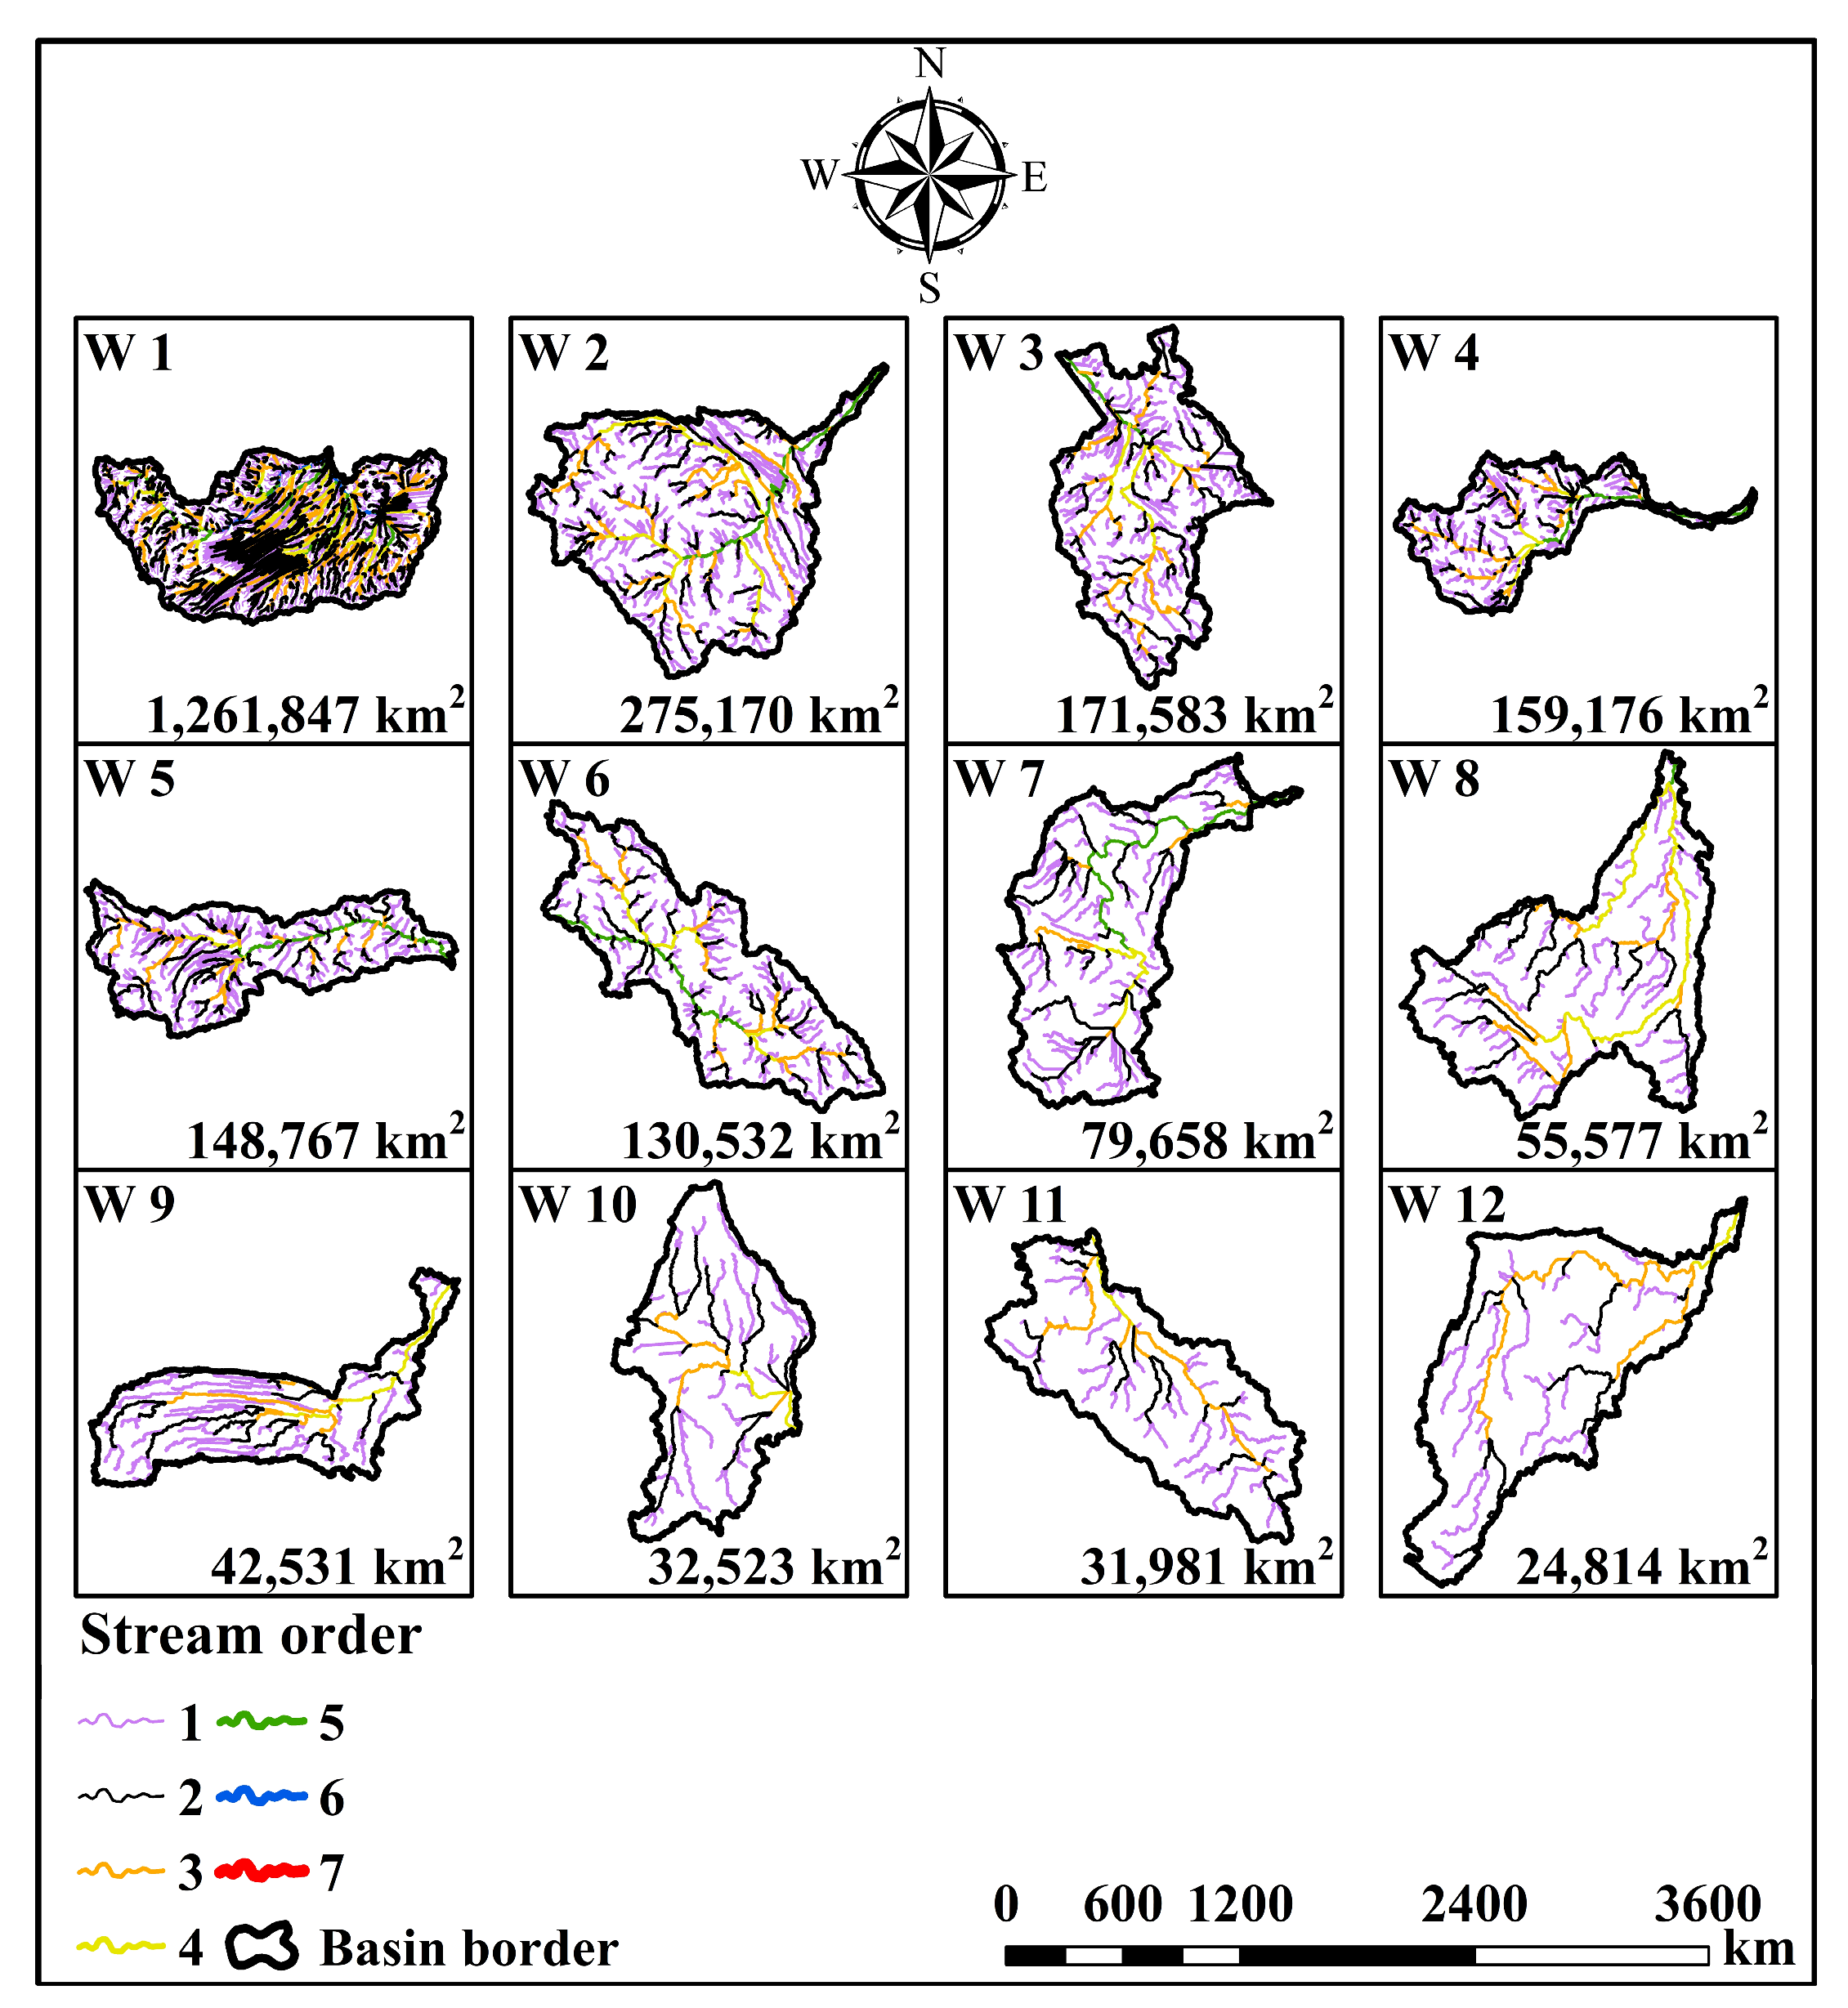
2.1. Study Area

The Arabian Peninsula (Figure 1), the world’s largest peninsula, spans approximately 3.24 million square kilometers, extending from the Arabian Gulf in the east to the Red Sea in the west, and from the Arabian Sea in the south to the Syrian Desert and Mesopotamia in the north. Encompassing seven countries—Saudi Arabia, Yemen, Oman, United Arab Emirates, Qatar, Bahrain, and Kuwait—each with distinct climatic, hydrological, and geological characteristics, this region offers a rich tapestry for scientific exploration. Featuring diverse topography, the Peninsula transitions from coastal plains at its periphery to mountainous regions, culminating in a vast central desert. The Asir and Hijaz mountain ranges in the west, as well as the Hajar mountain range in the east, are crucial watersheds, rendering the area highly conducive to morphometric analysis [31]. Extending approximately 2100 km from north to south and 2000 km from east to west, the Arabian Peninsula boasts a complex geological makeup [32]. Its western edge meets the Red Sea, while the Arabian Sea bathes its southern and eastern shores. The interior is dominated by the expansive Arabian Shield, a geological formation exposing Precambrian and Paleozoic rocks [33]. This ancient massif, shaped over millennia by erosion, gives rise to towering peaks like Jabal Sawda (3133 m), the highest point in Saudi Arabia [34]. To the east, the Rub’ al Khali, the world’s largest sand desert, blankets over a quarter of the peninsula, its undulating dunes narrating tales of epochs gone by.
The climate of the Arabian Peninsula is predominantly arid, marked by elevated temperatures, low humidity, and meager rainfall. With an average annual temperature ranging from 25 to 29 °C [35]. Rainfall is scarce, measuring below 100 mm for over 90% of the area, with heightened precipitation observed in mountainous terrains [36]. This climatic paradigm significantly influences the hydrological characteristics of the watersheds across the region. Serving as a climatic crossroads, the Arabian Peninsula witnesses the convergence of continental monsoonal influences from the Indian Ocean and the subtropical aridity of the Sahara [37]. Summer temperatures reach extremes, exceeding 50 °C in specific regions [38]. Precious rain occurs primarily in the mountainous south and west, averaging around 200 mm annually but displaying notable interannual variability [39]. Evapotranspiration rates, fueled by intense heat and constant sunshine, far surpass precipitation, leaving extensive areas of the peninsula arid and barren. This intricate interplay of climatic factors shapes the hydrological dynamics of the watersheds, underscoring the critical need for comprehensive analysis in this region.

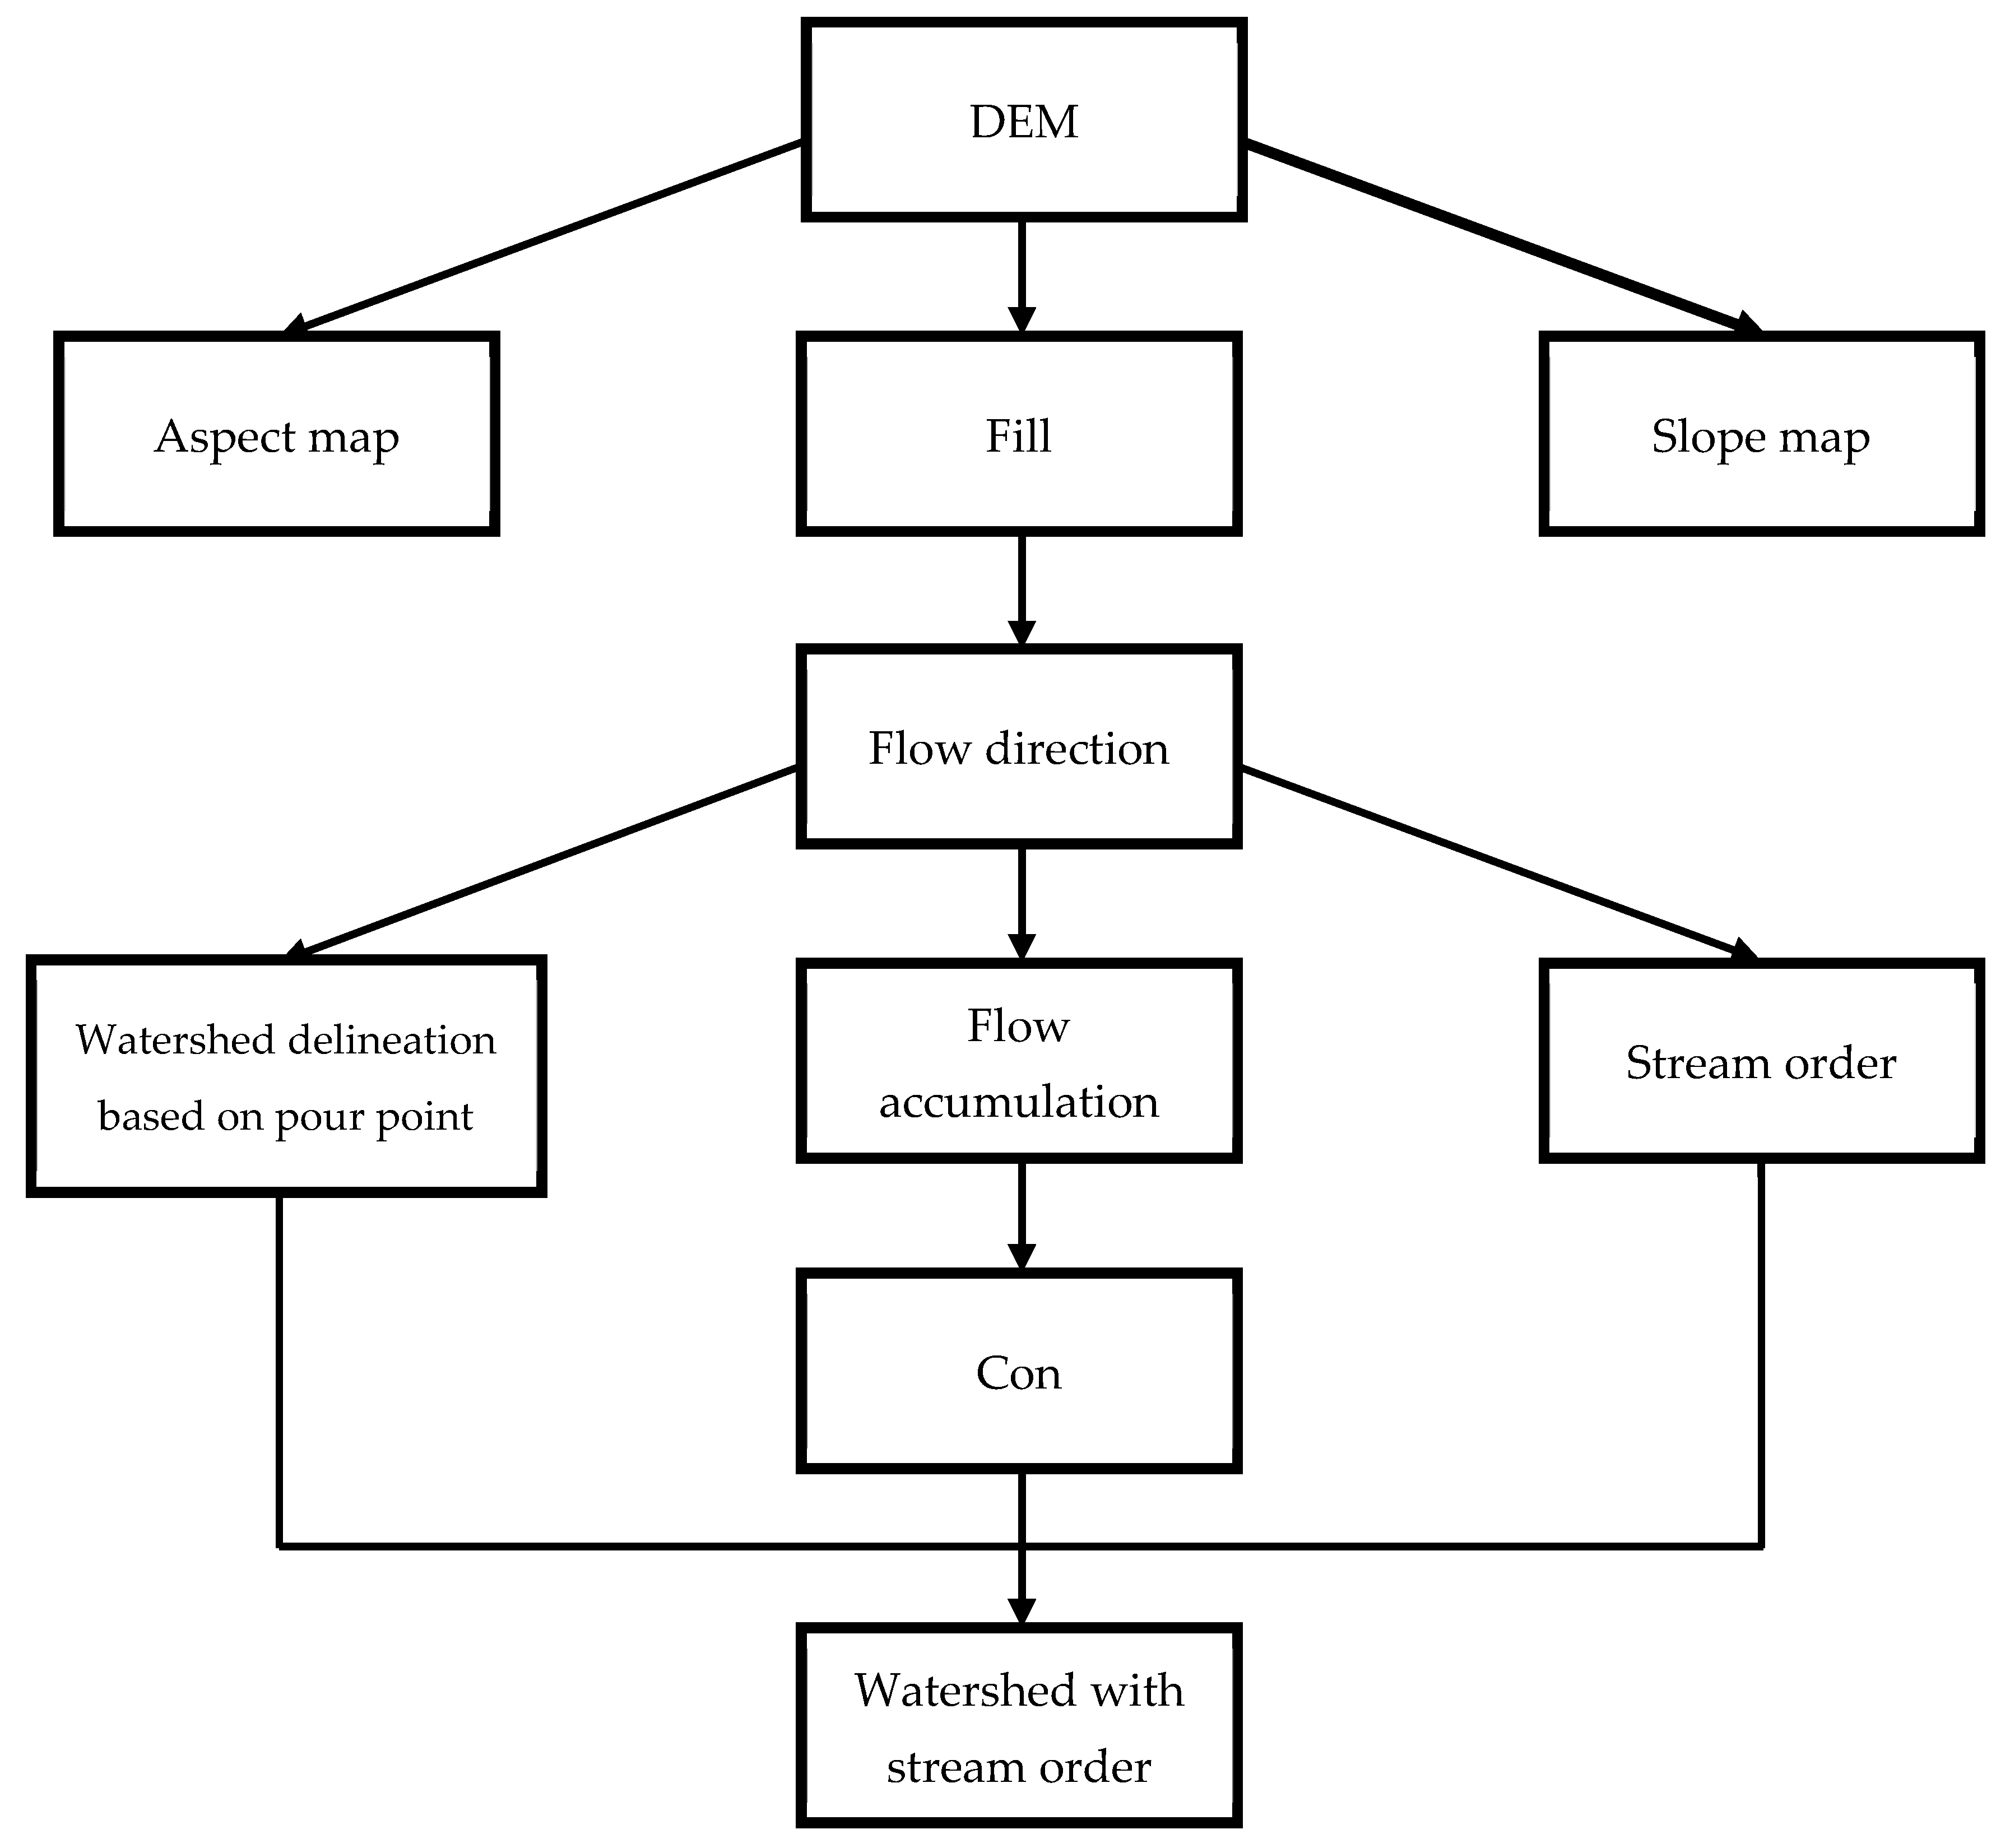
2.2. Morphometric Parameters Analysis

Morphometry is a mathematical representation of the Earth’s surface arrangement, which includes factors such as shape, elevation, slope, and landform dimensions. It plays a crucial role in comprehending the characteristics of watersheds [40]. An essential aspect of comprehending a basin’s hydrologic response is the quantitative evaluation of drainage systems. Morphometric metrics play a vital role in indicating the processes of landform change [41]. Basin morphometry is utilized to anticipate or characterize geomorphic phenomena, such as predicting the highest points of flooding, evaluating the amount of sediment produced, and determining the rates of erosion [30]. Morphometric analysis provides useful insights for geological and hydrological investigations by yielding metrics such as basin area, basin length, stream order and length, drainage density, drainage frequency, bifurcation ratio, relief ratio, circularity ratio, and others. The potential flood hazard of a basin is directly associated with specific morphometric parameters, whereby a larger drainage density is indicative of an increased risk of flooding [21]. Horton created the mathematical basis for expressing the correlation between streams of different magnitudes. He introduced a quantitative approach to analyze drainage networks [42,43]. Strahler enhanced the order system by assigning distinct orders to stream segments, categorizing smaller permanent streams as 1st order streams. According to Strahler [44], when the stream order increases, it requires two streams of the same order to come together. The combination of lower and higher-order streams does not have any impact on the higher stream order.
According to Radwan and Alazba [19], each basin has measurable geometric attributes that determine its linear, areal, and relief characteristics. These variables are associated with morphometric parameters and follow statistical connections. Horton [42], Horton [43], Strahler [44], Miller [45], Schumm [46], Strahler [47] have specified many morphometric factors such as stream order, basin length, drainage density and frequency, bifurcation ratio, circularity ratio, form factor, and relief ratio. According to Pande, Moharir [48], the parameters can be classified into two categories: linear scale measures, which include stream length, relief, and basin length, facilitate size comparisons; and dimensionless numbers, such as length ratio, bifurcation ratio, and relief ratio, enable comparisons of basin or channel networks. Geographic information systems and remote sensing techniques (GIS-RST) are commonly used to evaluate the morphometric features of drainage basins. GIS has the capability to accept diverse data formats, such as digital representations of rivers, hills, and valleys. Guth, Van Niekerk [49] assert that the digital elevation model (DEM), obtained by remote sensing methodologies, furnishes topographical data by assigning elevation values to specific pixels. Different online sources, such as EOSDIS (NASA’s Earth Observing System Data and Information System) and USGS (U.S. Geological Survey), provide access to DEM data acquired through remote sensing.

2.2.1. Data Collection and Sources

The present investigation processed high-resolution satellite scenes (Landsat 8 for land use/cover and SRTM for elevation) using RST. Each image was orthorectified and co-registered to a common UTM/WGS84 grid. The USGS provided these images with a resolution of 30 m. The image was first classified using unsupervised and supervised classifications. The study employed ENVI 5.3 for both classifications. Supervised LULC classification used a maximum likelihood algorithm, which assigns each pixel to the land-cover class that is most likely based on its unique color and brightness patterns. The study identified training samples for main classes (mixed, >75% crops, 75% non-vegetated, 50–75% crops, 50–75% grass/shrub, 50–75% non-vegetated, and >50% artificial) from reference imagery.
DEM data obtained from the United States Geological Survey website was utilized to demarcate basins within the Arabian Peninsula. The study utilized the latest version of the 1-Arc SRTM DEM, which has a precision of 30 m, to ensure precise morphometric analysis (Figure 2). The hydrology tool incorporated into the ArcGIS platform was utilized to automatically outline a watershed, which has a resemblance to a basin-like landform. The procedure encompassed various essential stages, such as the filling of the DEM, the identification of flow direction, the accumulation of flow, the establishment of conditional parameters, the determination of stream order, and the conversion of stream order data from raster to vector format (Figure 3).
The conventional method for extracting watershed networks entails the human determination of stream order, which is a laborious and time-intensive procedure. On the other hand, the research utilized a contemporary methodology that leverages the effectiveness of automated watershed delineation via DEM processing. Significant problems were encountered throughout the data collection process for morphometric analysis in the Arabian Peninsula. One notable challenge entailed the acquisition and administration of a considerable quantity of DEM files. In order to tackle this issue, the researchers collected over 350 DEM files and carefully combined them to form a cohesive dataset for defining the basins of the Arabian Peninsula. The successful completion of this assignment necessitated meticulous attention to data integrity, resolution, and consistency in order to guarantee the precision of morphometric analysis. Notwithstanding these obstacles, the methodology employed facilitated a thorough and meticulous analysis of the primary basins in the Arabian Peninsula within a certain period, thus establishing a significant basis for the study. To guarantee consistency and accuracy of the results, the generated watershed boundaries were validated by superimposing them on Google Earth Pro 7.3 software. Furthermore, the DEM data were employed to produce slope, contour, geomorphic landforms, and hillshade maps, thus offering additional understanding of the topographical intricacies of the Arabian Peninsula.

2.2.2. Morphometric Parameter Classification and Calculation

Georeferenced satellite data was employed in this study to conduct morphometric parameter analysis. Mathematical formulas and GIS measurements were utilized on the SRTM DEM within the GIS environment. The morphometric characteristics were classified into three distinct categories, namely linear elements, areal elements, and relief elements. The linear parts of this study pertain to the x-axis calculations of stream attributes. These calculations involve several parameters such as stream order, stream number, stream length, mean stream length, stream length ratio, bifurcation ratio, and length of overland flow. The computation of these parameters was performed using established methodologies and formulas as outlined in Table 1. Areal morphometric analysis encompasses the utilization of two-dimensional parameters in the computation of x- and y-axis values for the drainage basin. This analysis incorporates various characteristics that are determined through the processing of DEM, including the length, perimeter, and area of the basin. The formulas in Table 1 were used to calculate additional areal variables such as basin form factor, elongation ratio, circularity ratio, drainage density, stream frequency, drainage texture, and infiltration rate. The relief morphometric study took into account three-dimensional factors associated with computations on the x-, y-, and z-axes. Table 1 provides a comprehensive overview of several variables, including total relief, relative relief, relief ratio, hypsometric analysis, and gradient ratio.
The following section provides a detailed explanation of selected morphometric parameters and their derivation methods. The analysis of drainage watersheds begins with the identification of stream order (u), which can be determined using various ordering techniques documented in the literature [43]. This study adopts the approach proposed by Strahler [47], where the smallest stream segment is designated as first-order. When two first-order streams converge, they form a second-order stream, and this process continues, creating third-order streams from the convergence of two second-order streams, and so forth. When streams of different orders merge, the higher order is assigned. The Horton [43] approach is applied to determine the number of streams within the same order (stream number, Nu). The hydrological property of stream length (Lu) is of significant importance within the watershed, serving as a key indicator of surface runoff characteristics. Stream length is measured according to Horton’s law [43], which defines it as the distance from the mouth of the basin to the drainage divide [40]. The mean stream length (Lsm) is calculated by dividing the total length of streams of a given order by the number of streams in that order.
To assess the bifurcation ratio (Rb), this study follows the method proposed by Schumm [46], which represents the ratio of the number of streams of a specific order to the number of streams of the next higher order. The basin length, representing the distance from the mouth of the main stream to the drainage divide or “outlet” varies significantly between basins. In evaluating the hydrological characteristics of a basin, three key ratios are particularly significant: the form factor (Rf), the elongation ratio (Re), and the circularity ratio (Rc). These ratios are critical in defining the shape and configuration of the drainage basin, and their computational methods are briefly summarized in Table 1. The form factor is a numerical measure of the basin’s shape, calculated by dividing the basin area by its length. Drainage texture is determined by calculating the total number of stream segments across all orders and dividing this by the basin’s perimeter. Stream frequency is obtained by dividing the total number of streams by the basin area. The hypsometric curve, which illustrates the relationship between the area of the watershed and its elevation, is generated by dividing the total watershed area by the number of altitude classes. The methodology employed in this study integrates sophisticated morphometric analytic techniques, utilizing up-to-date and precise data sources, as well as cutting-edge tools and platforms. The data collection process encountered various problems, which were effectively addressed through strategic solutions to ensure the robustness and reliability of the morphometric parameters analysis for the key basins in the Arabian Peninsula. Using the World Geodetic System 1984 Universal Transverse Mercator (WGS 84 UTM) Coordinate System to project DEM data is crucial because it improves how well the results work together and their reliability.

3. Results and Discussion

An extensive examination was carried out to analyze the morphometric parameters of the primary basins situated in the Arabian Peninsula. The study gained a thorough understanding of the landscape and its implications for the study area by analyzing the connections between morphometric parameters and several environmental elements, including soil type, geology, erosion factors, and geological formations. The analysis was strengthened by a comprehensive examination of pertinent literature and prior research, guaranteeing the robustness and reliability of the conclusions. The publicly available high-resolution data from the 1-Arc Shuttle Radar Topography Mission Digital Elevation Model (SRTM-DEM), with an accuracy of 30 m, were used to create slope, contour, landform, and hillshade maps, providing further insights into the detailed landscape of the Arabian Peninsula (Figure 4, Figure 5, Figure 6 and Figure 7, respectively). These maps represent the first step in analyzing geomorphometric metrics. Sophisticated geospatial technologies divided the Arabian Peninsula into numerous significant basins, mostly based on their respective areas, as illustrated in Figure 8. According to the criteria defined by Singh [54] and Chelladurai, and BharaniPriya [55], the studied area categorization encompasses a total of 12 basins, 14 catchments, 76 sub-catchments, 164 watersheds, 372 sub-watersheds, 1321 mili-watersheds, 783 micro-watersheds, and 61,761 mini-watersheds. Table 2 provides a comprehensive overview of the watershed classifications and counts within the designated study region. The accurate analysis of landforms was improved by correctly identifying and outlining the main basins in the area, facilitated by the use of this detailed and precise information. This approach ensured a comprehensive and precise depiction of the peninsula’s geographical features.
The outcomes derived from these morphometric factors were categorized into three primary morphometric dimensions: linear, areal, and relief aspects. Each of these dimensions offers unique insights into the basin characteristics and their response to hydrological and geomorphological processes. The linear aspect focuses on the configuration and orientation of the drainage networks within the basin, providing insights into the underlying geological structures and the potential paths of water flow. The areal aspect, on the other hand, explores the spatial characteristics of the basin, including its size, shape, and the distribution of landforms within it. The relief aspect delves into the vertical dimension of the landscape, examining factors like elevation, slope, and relief ratio. These parameters are crucial for understanding the basin’s susceptibility to erosion and potential for flood risks. Furthermore, the analysis provided detailed results for each cell within the studied basins. This level of granularity allowed for a fine-grained examination of the morphometric parameters, enabling a more nuanced understanding of their spatial distribution and variations across the study area. The intricate findings presented here constitute valuable insights for decision-makers, planners, and researchers engaged in water resource management, environmental planning, and land use management throughout the Arabian Peninsula. These results provide a detailed comprehension of the morphometric attributes inherent in the major basins of the Arabian Peninsula, offering instrumental knowledge to shape sustainable strategies for water resource management within the region. The in-depth results of each morphometric parameter, of every individual cell within the delineated basins, are presented in the following sections.
Figure 4. A slope map of the area under study.
Water 17 01463 g004
Note: the following classes are used, namely very gentle (<2°), gentle (2–10°), moderate (>10–15°), steep (>15–30°), and excessively steep (>30°).
Figure 5. A contour map of the area under study.
Water 17 01463 g005
Note: the grades of the contours are very low (<300 m), low (300–500 m), medium (>500–800 m), high (>800–1000 m), and very high (>1000–3660 m).
Figure 6. Geomorphic landforms map of the Peninsula.
Water 17 01463 g006
Figure 7. The Hillshade map of the research region.
Water 17 01463 g007
Note: the classes of the area are very low (<23), low (23–69), medium (>69–112), high (>112–152), and very high (>152–182).
Figure 8. Watersheds’ delineation map of the Arabian Peninsula.
Water 17 01463 g008
Note: the classes are mini-watershed (<5), micro-watershed (5–10), mili-watershed (>10–100), sub-watershed (>100–500), watershed (>500–2000), sub-catchment (>2000–10,000), catchment (>10,000–20,000), and basin (>20,000) km2.

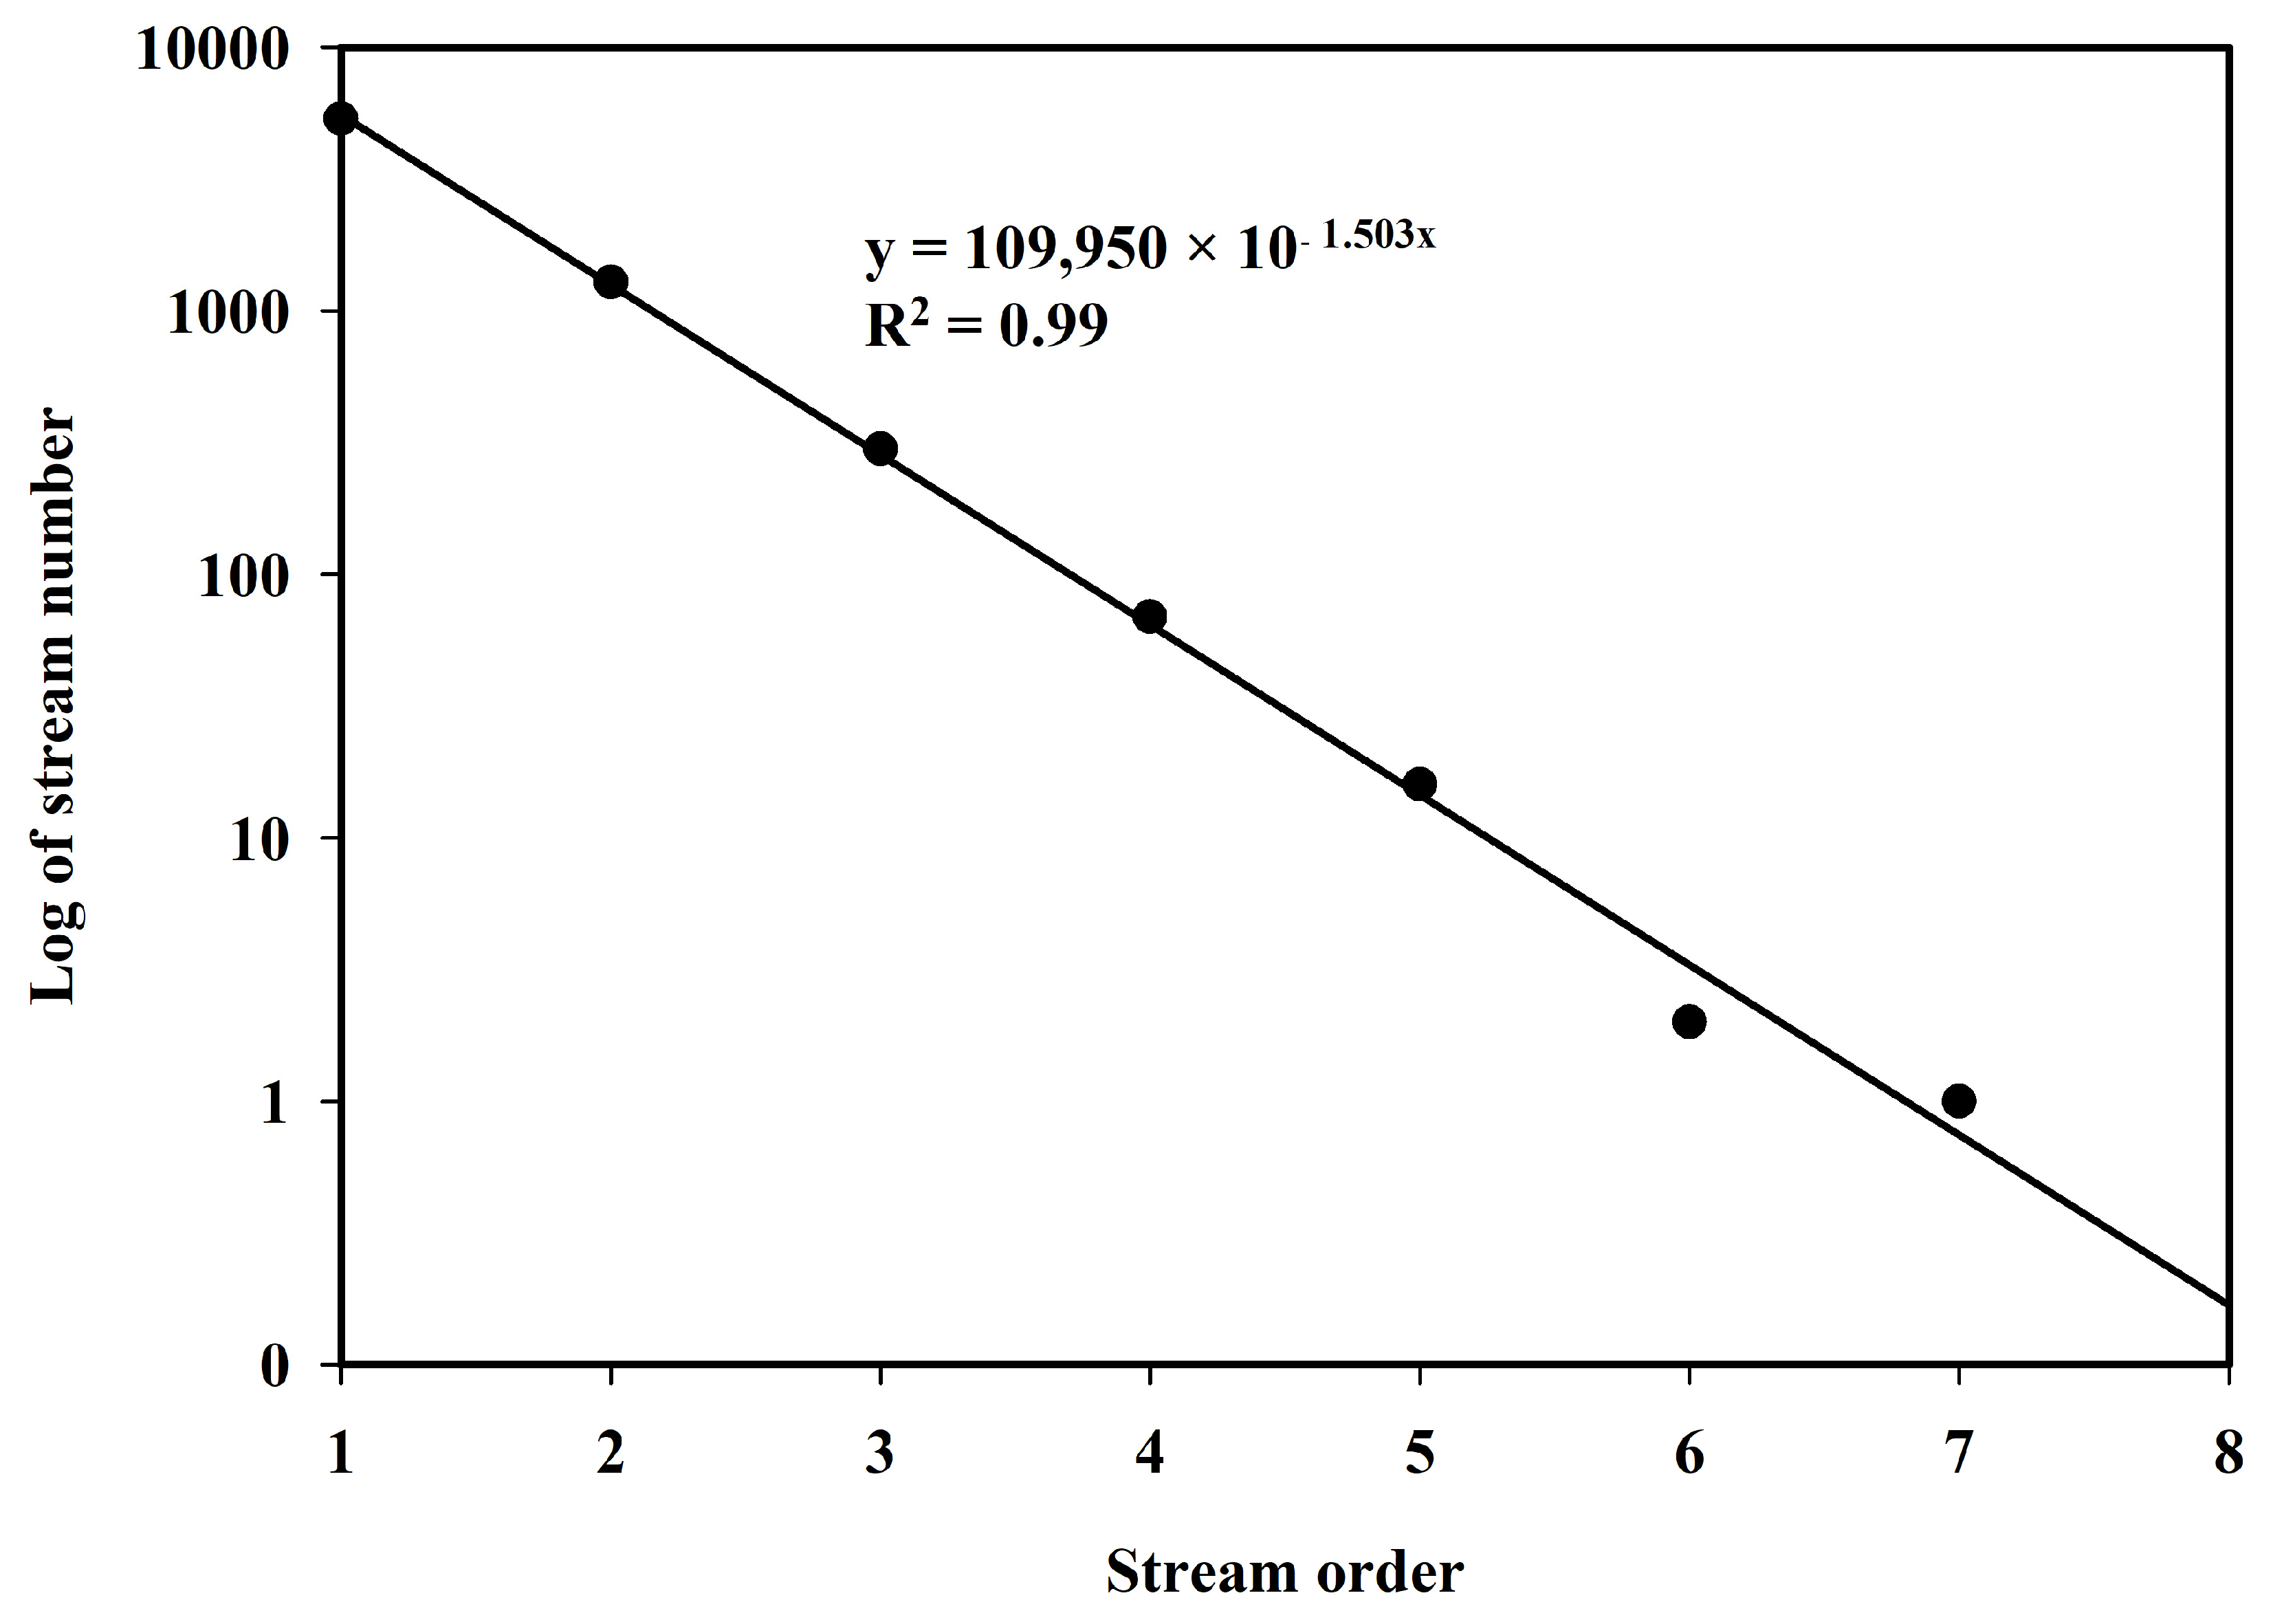
3.1. Linear Morphometric Parameters

The linear characteristics of a basin are closely interconnected with the pattern of its drainage network, which is significantly influenced by topographic factors [19]. Below, a comprehensive analysis of each linear aspect is presented. Figure 9 depicts the classification of stream orders (u) in the Arabian Peninsula basins, demonstrating that the lowest stream order corresponds to the largest stream count, and vice versa. The Arabian Peninsula is divided into 12 primary basins, each displaying differences in stream sequence, magnitude, and morphometric characteristics (Figure 10). In general, the Peninsula is classified as a seventh-order drainage basin, where the size and hierarchy of the basin are determined by the order of the streams. Table 3 provides a comprehensive overview of the stream order of the identified basins, with a range from the fourth to the seventh order. Basin 1 is characterized by its seventh-order classification, whilst basins 9 to 12 exhibit a minimum order of fourth order. Figure 11 illustrates an inverse relationship between stream order and stream number (Nu), consistent with Horton [43] law. The connection under consideration exhibits a coefficient of determination (R2) of 99% across the entirety of the Peninsula region. This indicates that as the stream order increases, there is a gradual decrease in the total number of streams. The geometric series under observation exhibits conformity with Horton’s law [43], wherein the highest order stream begins with a singular stream and subsequently increases in accordance with a constant bifurcation ratio. The seventh- and first-order streams have a total count ranging from 1 to 5366, as seen in Table 4. In summary, the basins that possess a stream count over 200 encompass the initial six basins, whereas the combined stream counts of the first and second stream orders account for approximately 63% of the streams in the examined basins. The remaining percentage of stream numbers is comprised of the higher stream orders. The results of this study are of significant importance in the examination of basin attributes, including drainage patterns [56,57], since they serve as dependable indicators of impermeability and infiltration capacity [29,58].
It is worth mentioning that the maximum length of the stream (Lu) is primarily found in the first-order streams, demonstrating a progressive decline as the stream order increases [47]. Together, the first and second stream orders make up over 81% of the whole length of the stream, whereas the higher stream orders make up less than 19% of the total length. The stream length of the major basin ranges from 53.6 to 157,193.2 km for the seventh- and first-order streams, respectively. According to Adhikari [59], a greater length of stream indicates a more gradual slope, hence highlighting the hydrological consequences. Table 3 provides a comprehensive breakdown of the total stream length for the identified basins, revealing a variation ranging from 1895 to 141,096 km for basins 12 and 1, respectively. The mean stream length (Lsm) provides valuable information about the drainage network and the surfaces that are connected to it [47]. The average length of streams over the Arabian Peninsula ranges from 29.3 to 881.3 km for streams of the first and sixth orders. The total length of the stream in the entire research region is 1750.5 km, and it is worth noting that the average length of the stream increases in direct proportion to the order of the streams. In addition, the total length of the streams in the basins increases as the stream order increases, as shown by a coefficient of determination (R2) of 97% (Figure 12). This figure presents the relationship between the logarithm of cumulative stream length and stream order. The high R2 value observed strongly supports the accuracy of the findings in basin identification and drainage basin network extraction, in alignment with the principles of Horton’s law. As the R2 value approaches one, the quality of extraction improves, ensuring consistency with the established hydrological framework and enhancing the precision of the derived outcomes.
The study region displays a wide variety of stream length ratios across various stream orders, ranging from 0.4 to 16.4 for the fifth and seventh orders, respectively. Table 3 illustrates that the major stream length for the designated basins ranges from 39 to 899 km for basins 8 and 4. The aforementioned observations are in accordance with the existence of rocks with moderate resistance, steep slopes, and topographical features in the landscape, all of which are in line with the noteworthy discoveries documented by Radwan, Alazba [27]. The range of bifurcation ratio (Rb) values for the sixth and fifth orders is between 2 and 8, respectively. The mean Rb value for the entire Peninsula is 4.52. Prior studies indicate that basins that do not possess distinct geologic control generally demonstrate an average bifurcation ratio that falls within the range of 3 to 5 [60,61]. According to the data presented in Table 3, the Rb values for all delineated basins are within the expected range, with basins 8 and 2 exhibiting values ranging from 3.2 to 4.8, respectively. The presence of less permeable rocks with steep slopes is indicated by a larger mean bifurcation ratio, whereas a lower bifurcation ratio reveals the existence of porous rocks with reduced structural control [62,63]. The measurement of the overland flow length in the Arabian Peninsula is documented at 5.8 km. In Table 3, it is observed that the overland flow length for basins 1 and 6 ranges between 4.5 and 8 km, respectively. The aforementioned values are of utmost importance in the hydrologic and physiographic progression of basin regions, as they have a significant impact on the amount of water needed to exceed a particular erosion threshold. According to Obeidat and Awawdeh [64], a reduced extent of overland flow may suggest an increased likelihood of flood threats within the basin.

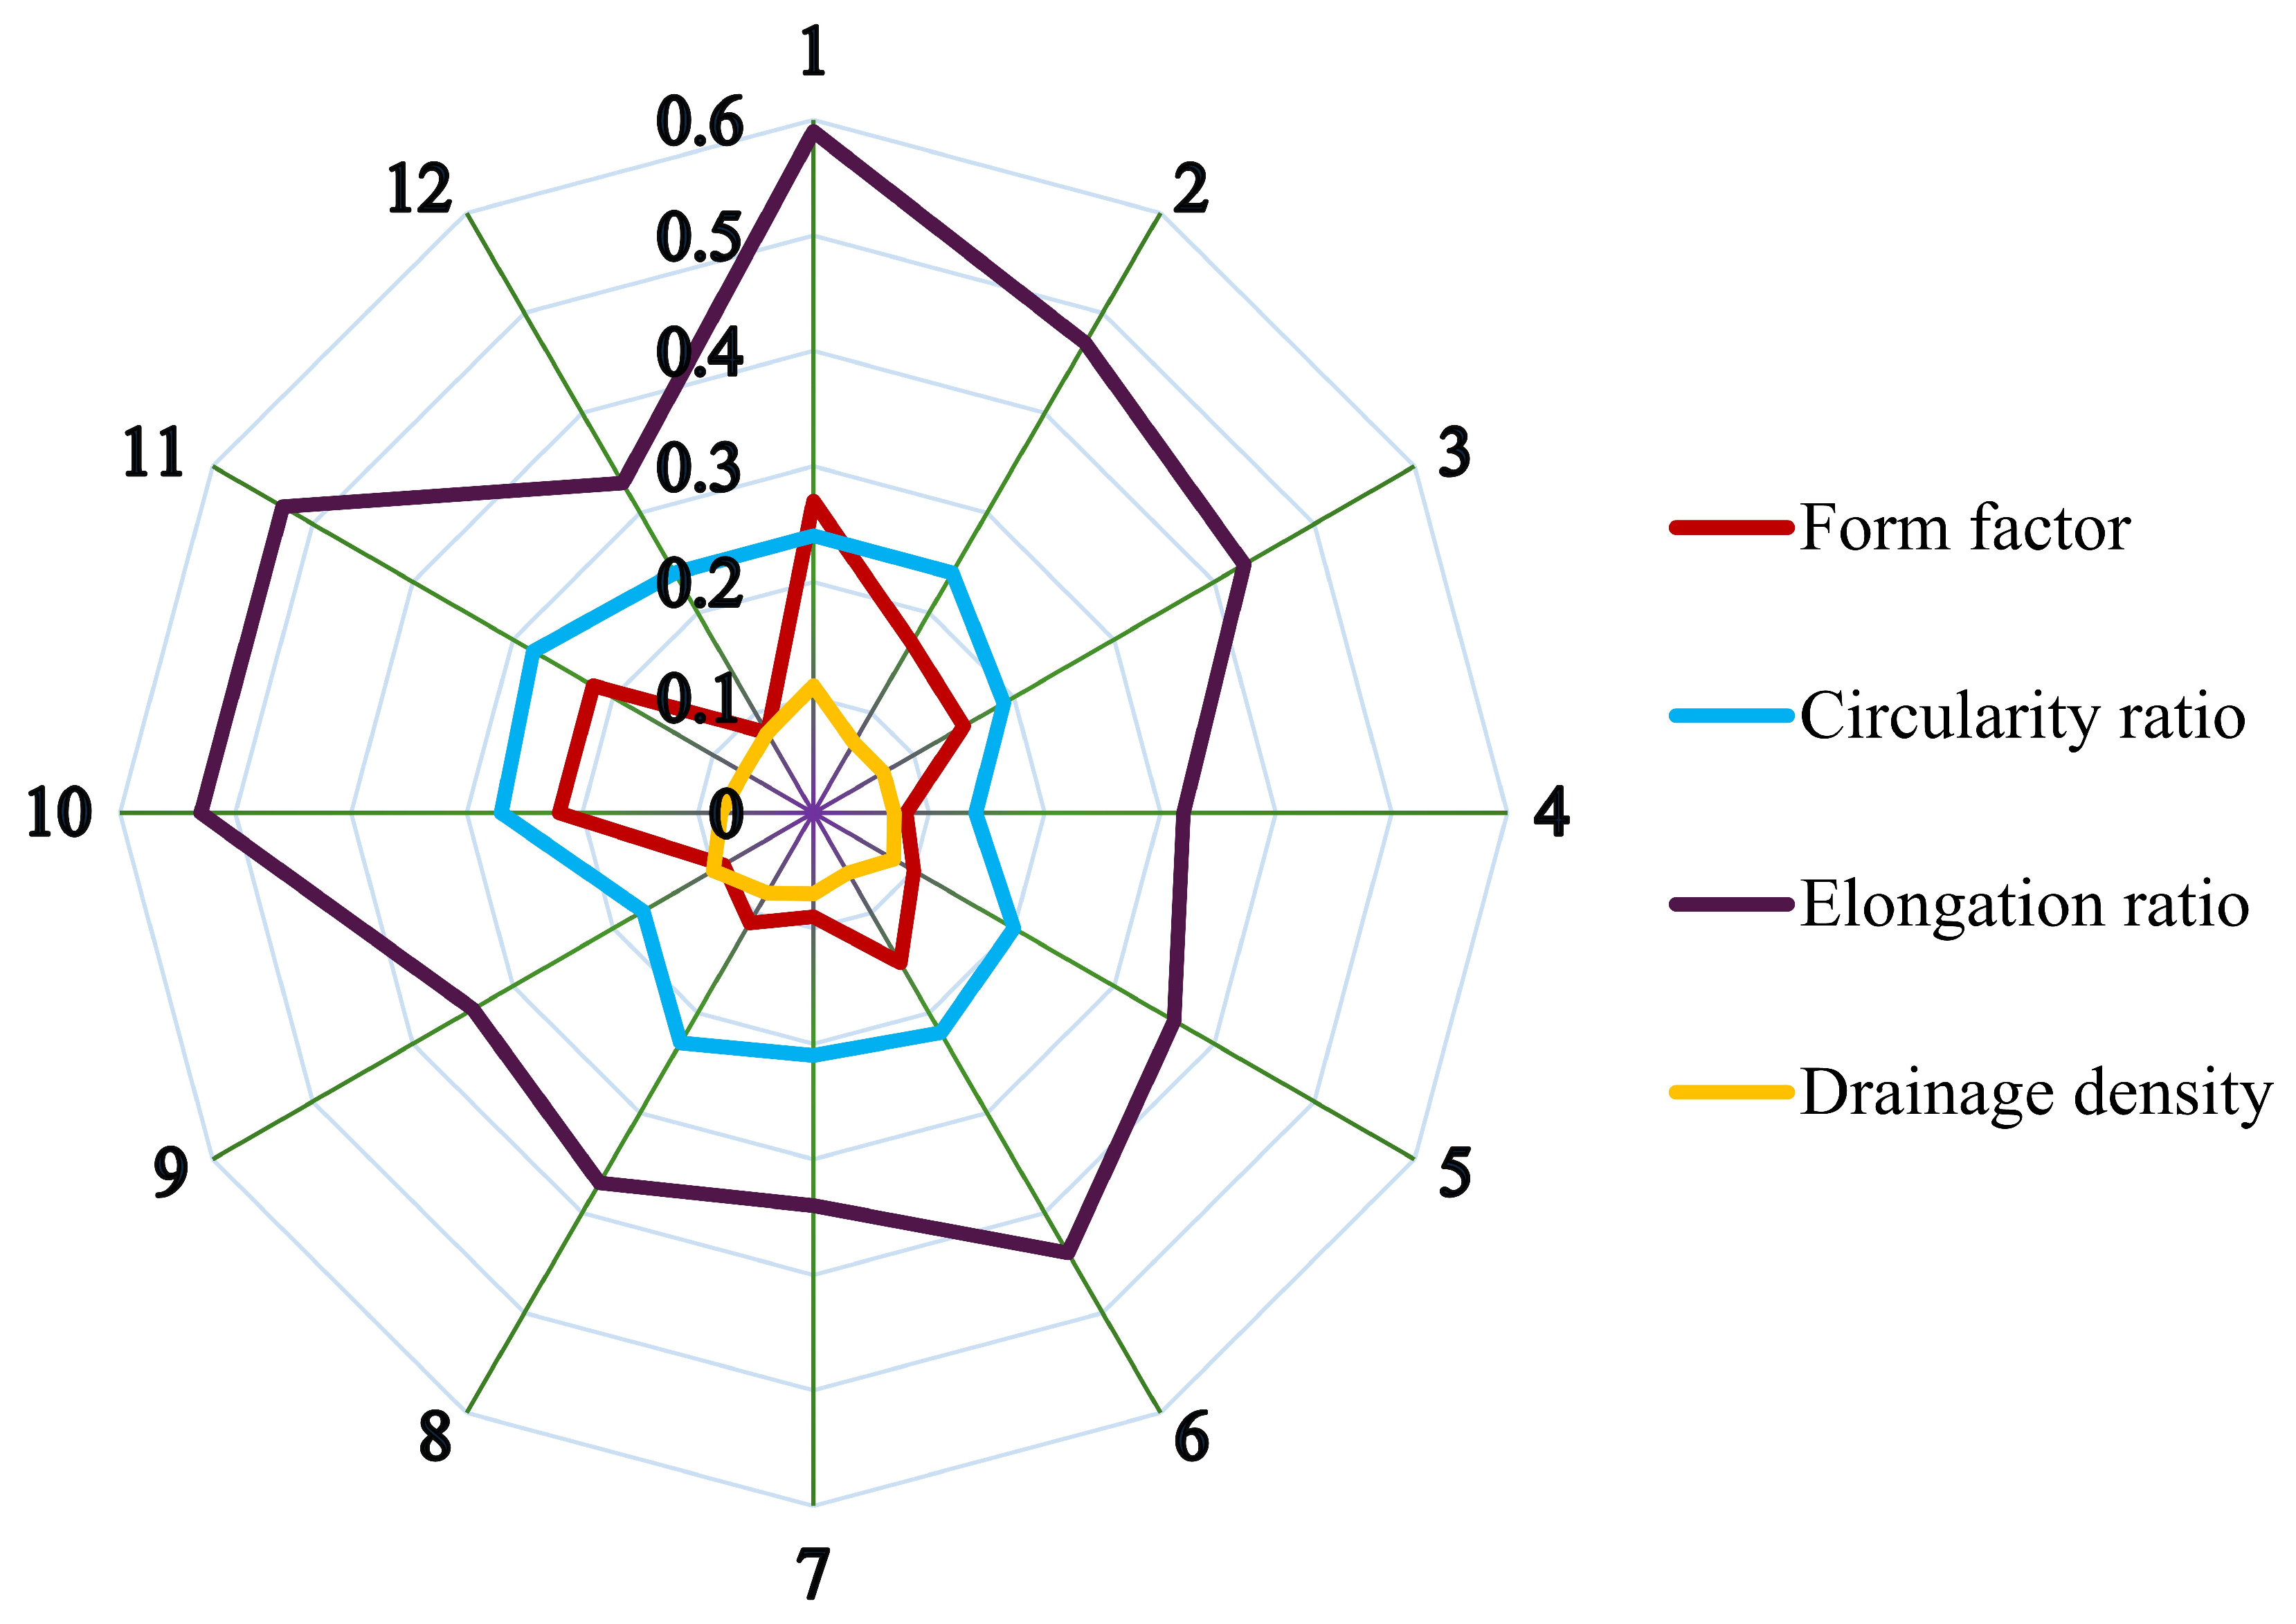
3.2. Areal Morphometric Parameters

The significance of drainage basins can be better understood by examining their areal morphometric parameters, which provide valuable insights into their geological composition, climate conditions, basin development, and denudation history. This examination covers various elements, such as the length, perimeter, area, shape factor, elongation ratio, circularity ratio, drainage density, stream frequency, drainage texture, and infiltration rate of the basin. The Arabian Peninsula, which spans a total area of 3.24 million km2, contains a wide range of basins, each with distinct characteristics. Figure 13 and Table 5 provide a comprehensive overview of the areal outcomes pertaining to the specified basins within the designated study region. The basins have a considerable variation in dimensions, ranging from 24,814 to 1,261,847 km2 for basins 12 and 1, respectively. The study region is carefully divided into many watersheds based on its size, resulting in a thorough categorization that includes 12 basins, 14 catchments, 76 sub-catchments, 164 watersheds, 372 sub-watersheds, 1321 mili-watersheds, 783 micro-watersheds, and 61,761 mini-watersheds. The classification presented in this study adheres to the accepted standards outlined by Singh [54], Chelladurai, and BharaniPriya [55], which serve as a strong basis for the ensuing analysis. An important element that leads to increased rainfall and a higher proportion of surface water and runoff is the expansion of the basin area. Basins 11 and 1, as indicated in Table 5, exhibit a range of 383 to 2167 km in length. Notably, the first five basins, arranged in declining order, showcase basins that surpass 1000 km in length. In general, the elongation of a basin is influenced by an increase in its length, resulting in a noticeable characteristic observed in the basin’s perimeter, which serves as the external boundary. The extended nature of the basins is further emphasized by the varying basin perimeters, which range from 8101 to 1149 km for basins 12 and 1, respectively (Table 5). In descending order, the top seven basins exhibit a perimeter that surpasses 2000 km. The physical arrangement of the basins suggests that they are primarily located in an extended region, which is closely linked to their hydrological properties. Kant and Kumar [65] and Ganie and Posti [66] have provided elucidation on the association between extended basins and greater peak streams, as well as longer lag times. These characteristics are described by elongation and circularity ratios (Figure 13).
The form factor (Rf) of the Peninsula is 0.69, with basins 12 and 1 exhibiting a range of 0.08 to 0.27, as depicted in Figure 13. The results of this study are consistent with Horton [42] assertion that the form factor should not exceed 0.75, thereby providing confirmation of the elongated characteristics of the basins under investigation. As a result, these basins are prone to experiencing larger peak flows that last for longer periods of time [30]. Regarding basin elongation, a low Rf value signifies a basin that is more elongated and has a longer flow direction and more recharge opportunity [67]. Elongated basins have a notable advantage in managing flood flows more effectively than circular basins [65]. According to Sukristiyanti and Maria [68], there is a distinction between an elongated basin, which exhibits low peak flows over a prolonged period, and a circular basin, which encounters high peak flows over a shorter timeframe. There is a noticeable correlation between the basin form factor and its circular or elongated shape. The studied area has an elongation ratio of approximately 0.88, indicating that the prevalent basin morphology is an encompassing oval shape [69]. The basin elongation ratios for basins 4 and 1 range from 0.32 to 0.59, as indicated in Figure 13. According to Pareta and Pareta [70], the majority of delineated basins have a more elongated shape (less than 0.5), except for basins 1, 10, and 11, which have a shape ranging from 0.5 to 0.7. The elongation ratio values discovered in the study indicate that the basins under investigation have a more elongated configuration, which is characterized by reduced infiltration, increased surface runoff, and steep slopes [71]. These lower numbers may also provide insight into the relatively lower quantities of precipitation in the region. The examined main basin exhibits a circulation ratio of roughly 0.3. The circulatory ratio values for basins 4 and 11 exhibit a range of 0.14 to 0.28, as indicated in Figure 13. In general, these figures serve to validate the elongated shape of the basins. According to Sutradhar and Mondal [24] and Bogale [25], an elongated basin exhibits reduced flood dangers in comparison to a circular basin, mostly attributed to its extended flow durations and lower peak flows. The interaction between form elements and ratios highlights the intricate hydrological dynamics that influence the susceptibility of these basins to flooding occurrences.
The drainage texture reveals the complex system of drainage currents inside the basin, providing insights into the topographical features and infiltration capabilities of the land. According to Chandrashekar and Lokesh [72], the drainage texture can be classified into five distinct groups: extremely coarse (<2), coarse (2–4), medium (>4–6), fine (>6–8), and very fine (>8). An in-depth analysis of the defined drainage patterns in Table 5 shows a range of values, starting from 0.05 in basins 9 and 12, and reaching 0.34 in basin 1. The Arabian Peninsula has a primarily coarse drainage texture, as indicated by these figures. According to Table 5, the stream frequency is 0.002 for all main basins, with the exception of basin 11, where it is slightly higher at 0.003. The implications of this study suggest that the basins exhibit a scarcity of vegetation and a restricted ability for infiltration, in addition to significant relief and runoff. The combined observations derived from many geographical factors, including drainage density, drainage texture, and stream frequency, suggest the presence of significant impermeability, distinct lithology, and considerable runoff within the area. The calculation of the infiltration number, which is obtained by adding the drainage density and frequency, enhances the comprehension of the characteristics of a basin. The infiltration number on the Arabian Peninsula is nearly negligible. This alignment serves to strengthen the results pertaining to the capacity for runoff and infiltration. The determination of this infiltration number, in accordance with the methods explained by Zavoiance [50], enhances the understanding of the infiltration dynamics within the basin. The findings pertaining to drainage density and stream frequency provide significant insights into the infiltration characteristics of the basin area. A basin’s diminished capacity to absorb and retain water through infiltration is shown by higher infiltration numbers, which are correlated with decreased infiltration rates and increased surface runoff. The aforementioned observation demonstrates a distinct inverse correlation between the infiltration number and the basin’s water absorption capacity. Essentially, a higher infiltration value indicates a greater amount of runoff and a reduced ability to filter water [73]. This observation highlights the importance of comprehending the dynamics of infiltration in the management of water resources within the basin and provides valuable guidance for making strategic decisions in order to achieve sustainable watershed management.
The drainage density (Dd) across the Arabian Peninsula is depicted in Figure 14. The crucial aspect is in the interaction between drainage density and texture, which are essential elements determined by surface characteristics, land use/land cover patterns, and soil composition within the basin. The variable Dd functions as a quantitative measure that encompasses several factors such as basin infiltration capacity, surface runoff potential, meteorological conditions, landscape features, and vegetation cover. The descriptor provides a thorough description, revealing the basin’s ability to respond to runoff processes which is closely connected to surface geological formations and vegetation dynamics. The Dd register of the Arabian Peninsula is measured at 0.1 km/km2, with a range of 0.06 to 0.11 km/km2 for basins 6 and 1, as shown in Figure 13. A basin with low Dd values indicates insufficient drainage, which is characterized by a slow hydrologic response. In these particular cases, the rapid removal of surface runoff from the basin is hindered, making it extremely vulnerable to the occurrence of flooding and erosion in gullies. On the other hand, higher Dd values indicate a rapid hydrological reaction to rainfall occurrences, suggesting the possibility of heightened and expedited drainage during precipitation. The increased drainage density frequently corresponds to impermeable subsurface materials, limited vegetation, and hills or elevated terrain [74]. The convergence of these elements renders the basin susceptible to the simultaneous risks of floods and erosion, regardless of the magnitude of the Dd value. The intricate correlation between the density of drainage and the frequency of flood events remains less apparent. Surprisingly, the existence of low drainage density does not automatically indicate a decrease in the likelihood of flooding [68]. Instead, it suggests that a substantial proportion of precipitation events seep into the soil, requiring a reduced number of flow routes to transport runoff. This highlights the complex interplay of drainage density, infiltration dynamics, and vulnerability to flooding. On the other hand, a high drainage density can be indicative of a topography characterized by limited vegetation and mountainous terrain, hence presenting distinct difficulties associated with the occurrence of floods and erosion [75]. The complex interplay of these factors emphasizes the need for a holistic understanding of drainage density’s implications in the context of flood hazards and basin management.
The supervised LULC map of the Arabian Peninsula was created using satellite imagery from Landsat 8 (Figure 15). The USGS provided these images with a resolution of 30 m. The image was first classified using unsupervised and supervised classification methods. The study employed ENVI 5.3 for both classifications. The supervised classification of the LULC was divided into seven classes: mixed (0.3%), >75% crops (0.3%), 75% non-vegetated (96%), 50–75% crops (0.3%), 50–75% grass/shrub (0.3%), 50–75% non-vegetated (2.5%), and >50% artificial (0.3%) of the entire area. The LULC map was based on supervised classification, as it can more accurately distinguish the land features of the study area as compared to unsupervised classification.
Note: the classes of the LULC map include mixed (0.3%), >75% crops (0.3%), 75% non-vegetated (96%), 50–75% crops (0.3%), 50–75% grass/shrub (0.3%), 50–75% non-vegetated (2.5%), and >50% artificial (0.3%) of the entire area.
The daily precipitation data were obtained directly from the National Meteorological Centers of the Arabian Peninsula countries, which maintain the region’s official weather stations. These authentic historical records, spanning more than 40 years (1980–2021), were compiled, quality-checked, and formatted for spatial interpolation. Unlike model re-analyses, this study relies on real observational data to construct the precipitation map. Using the isohyetal method, the investigation mapped the average daily precipitation into five classes: very low (<30 mm), low (30–40 mm), medium (40–50 mm), high (50–60 mm), and very high (60–300 mm) (Figure 16). The spatial distribution of these classes covers 2.3%, 13.5%, 19.0%, 19.6%, and 45.6% of the study area, respectively, with the high and very high categories dominating most of the region.
Note: the classes of the rainfall include very low (<30 mm), low (30–40 mm), medium (>40–50 mm), high (>50–60 mm), and very high (> 60–300 mm).

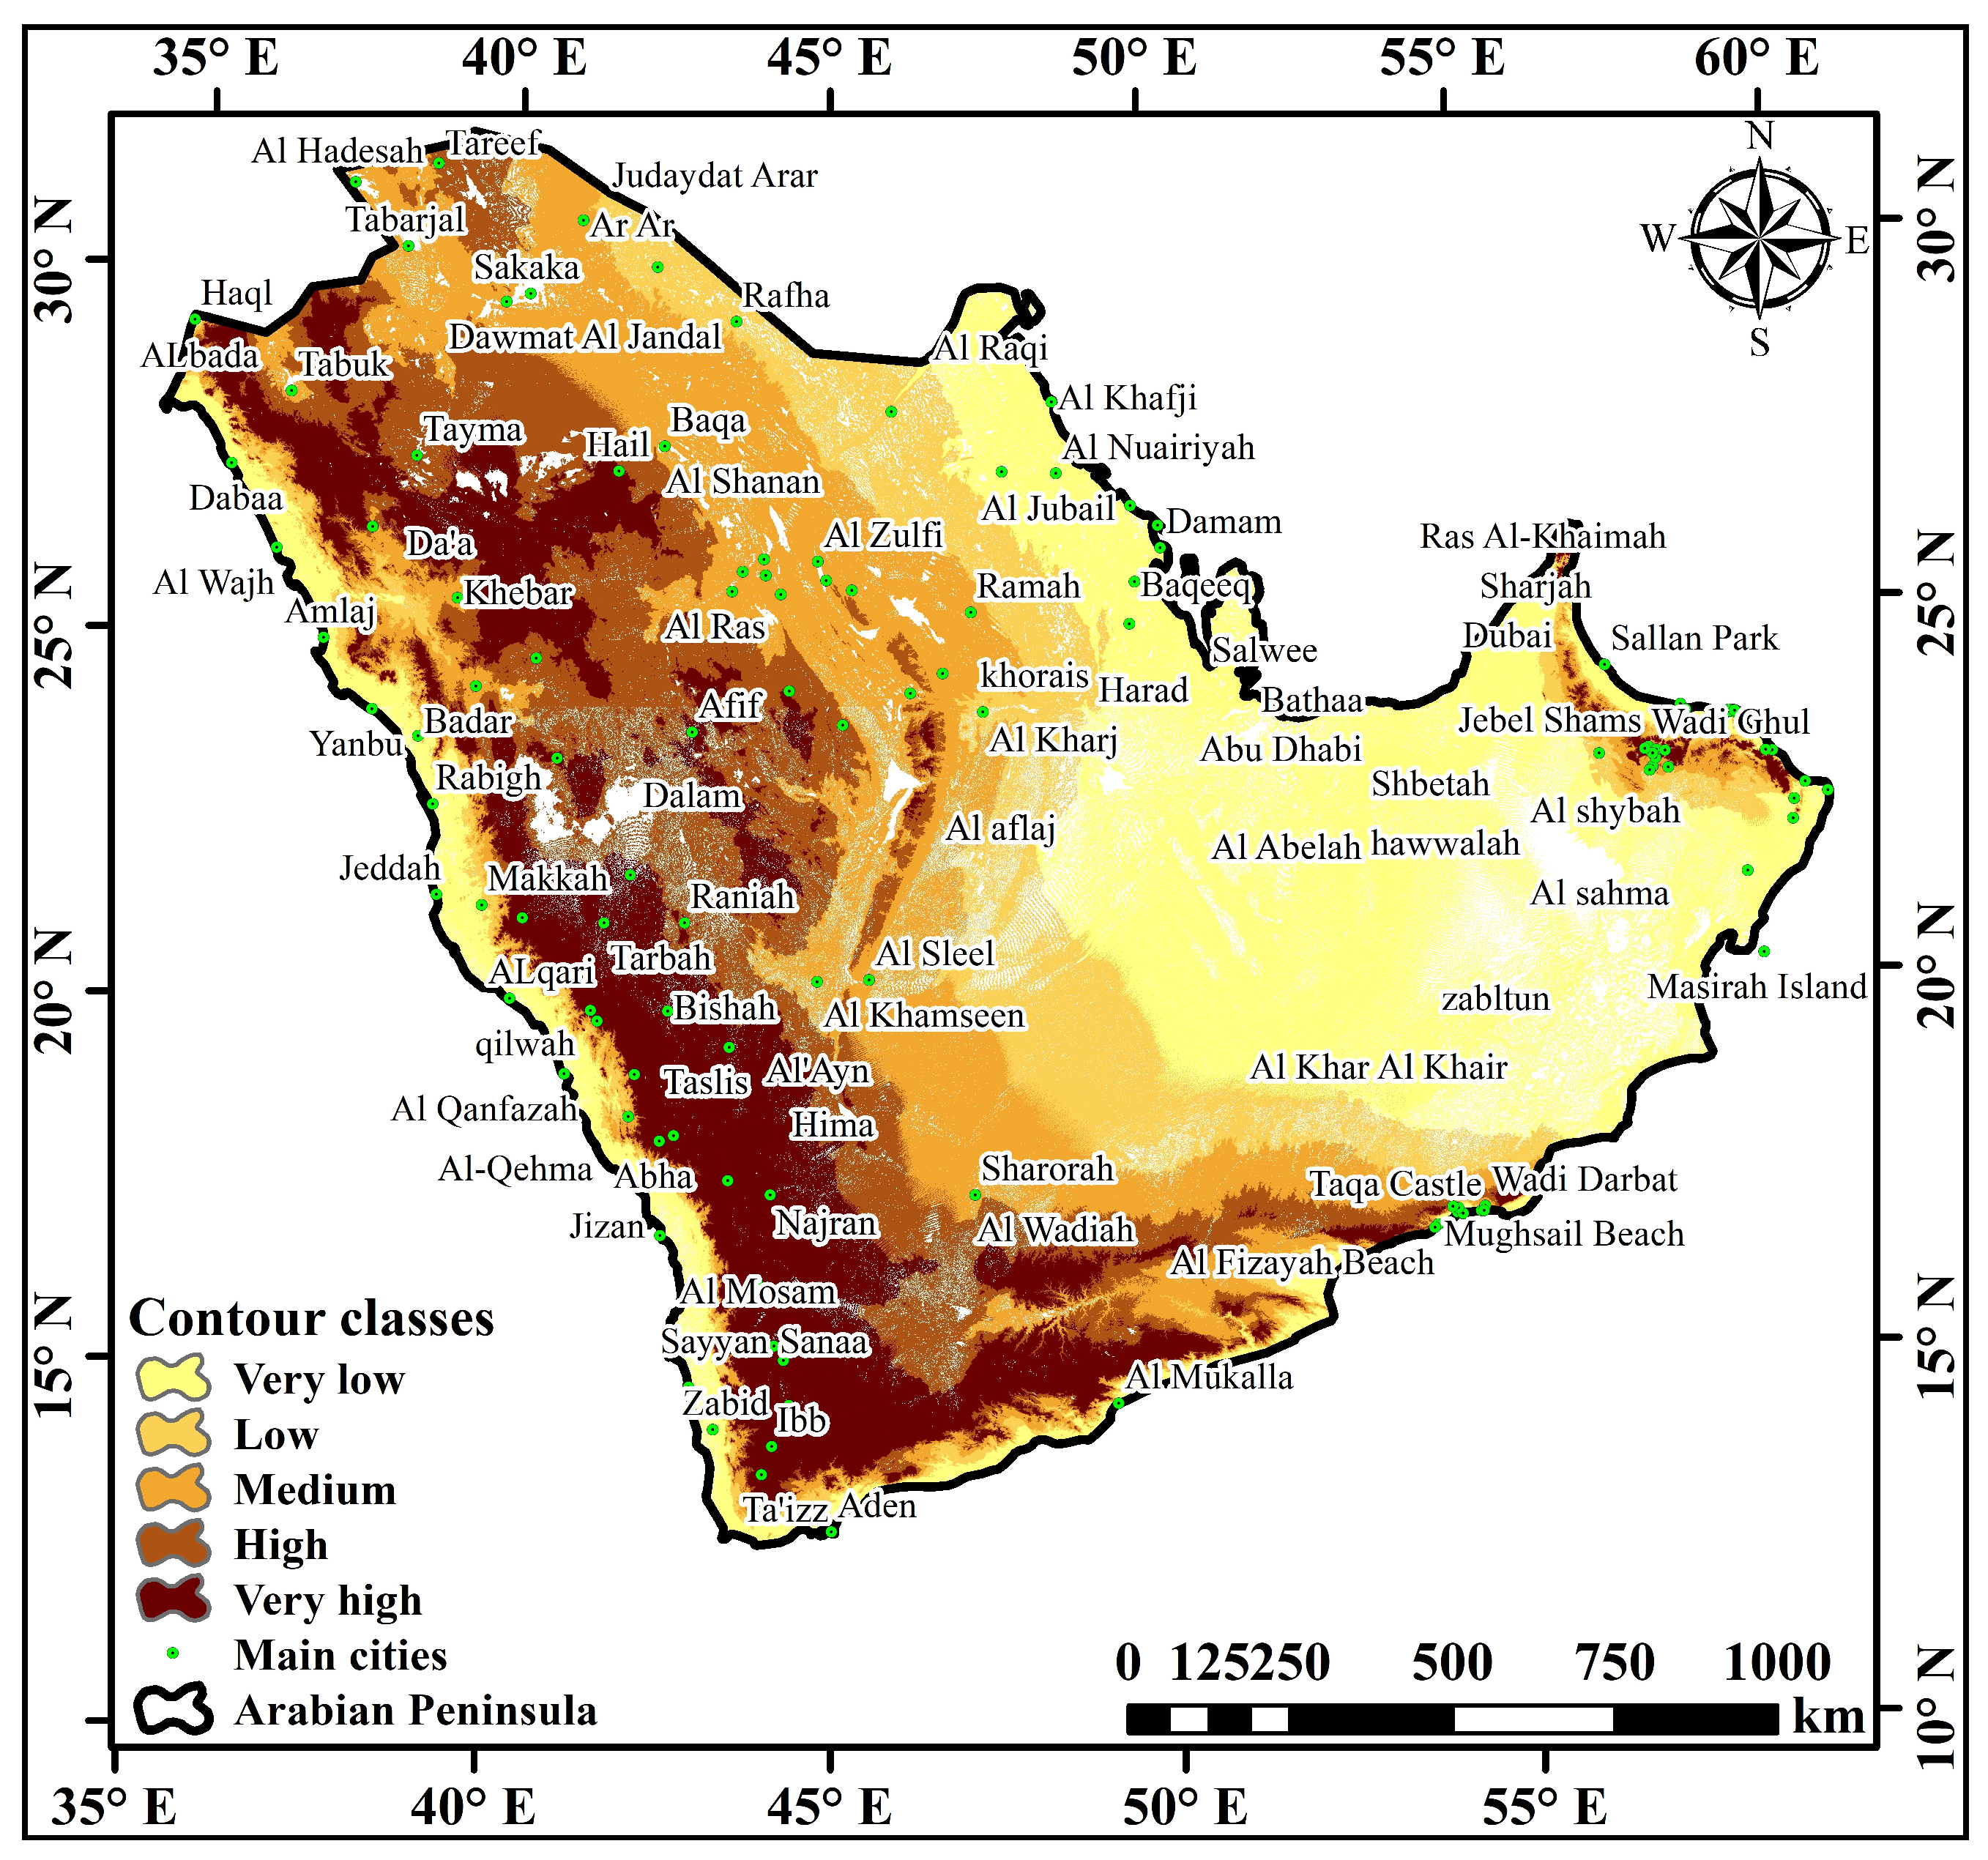
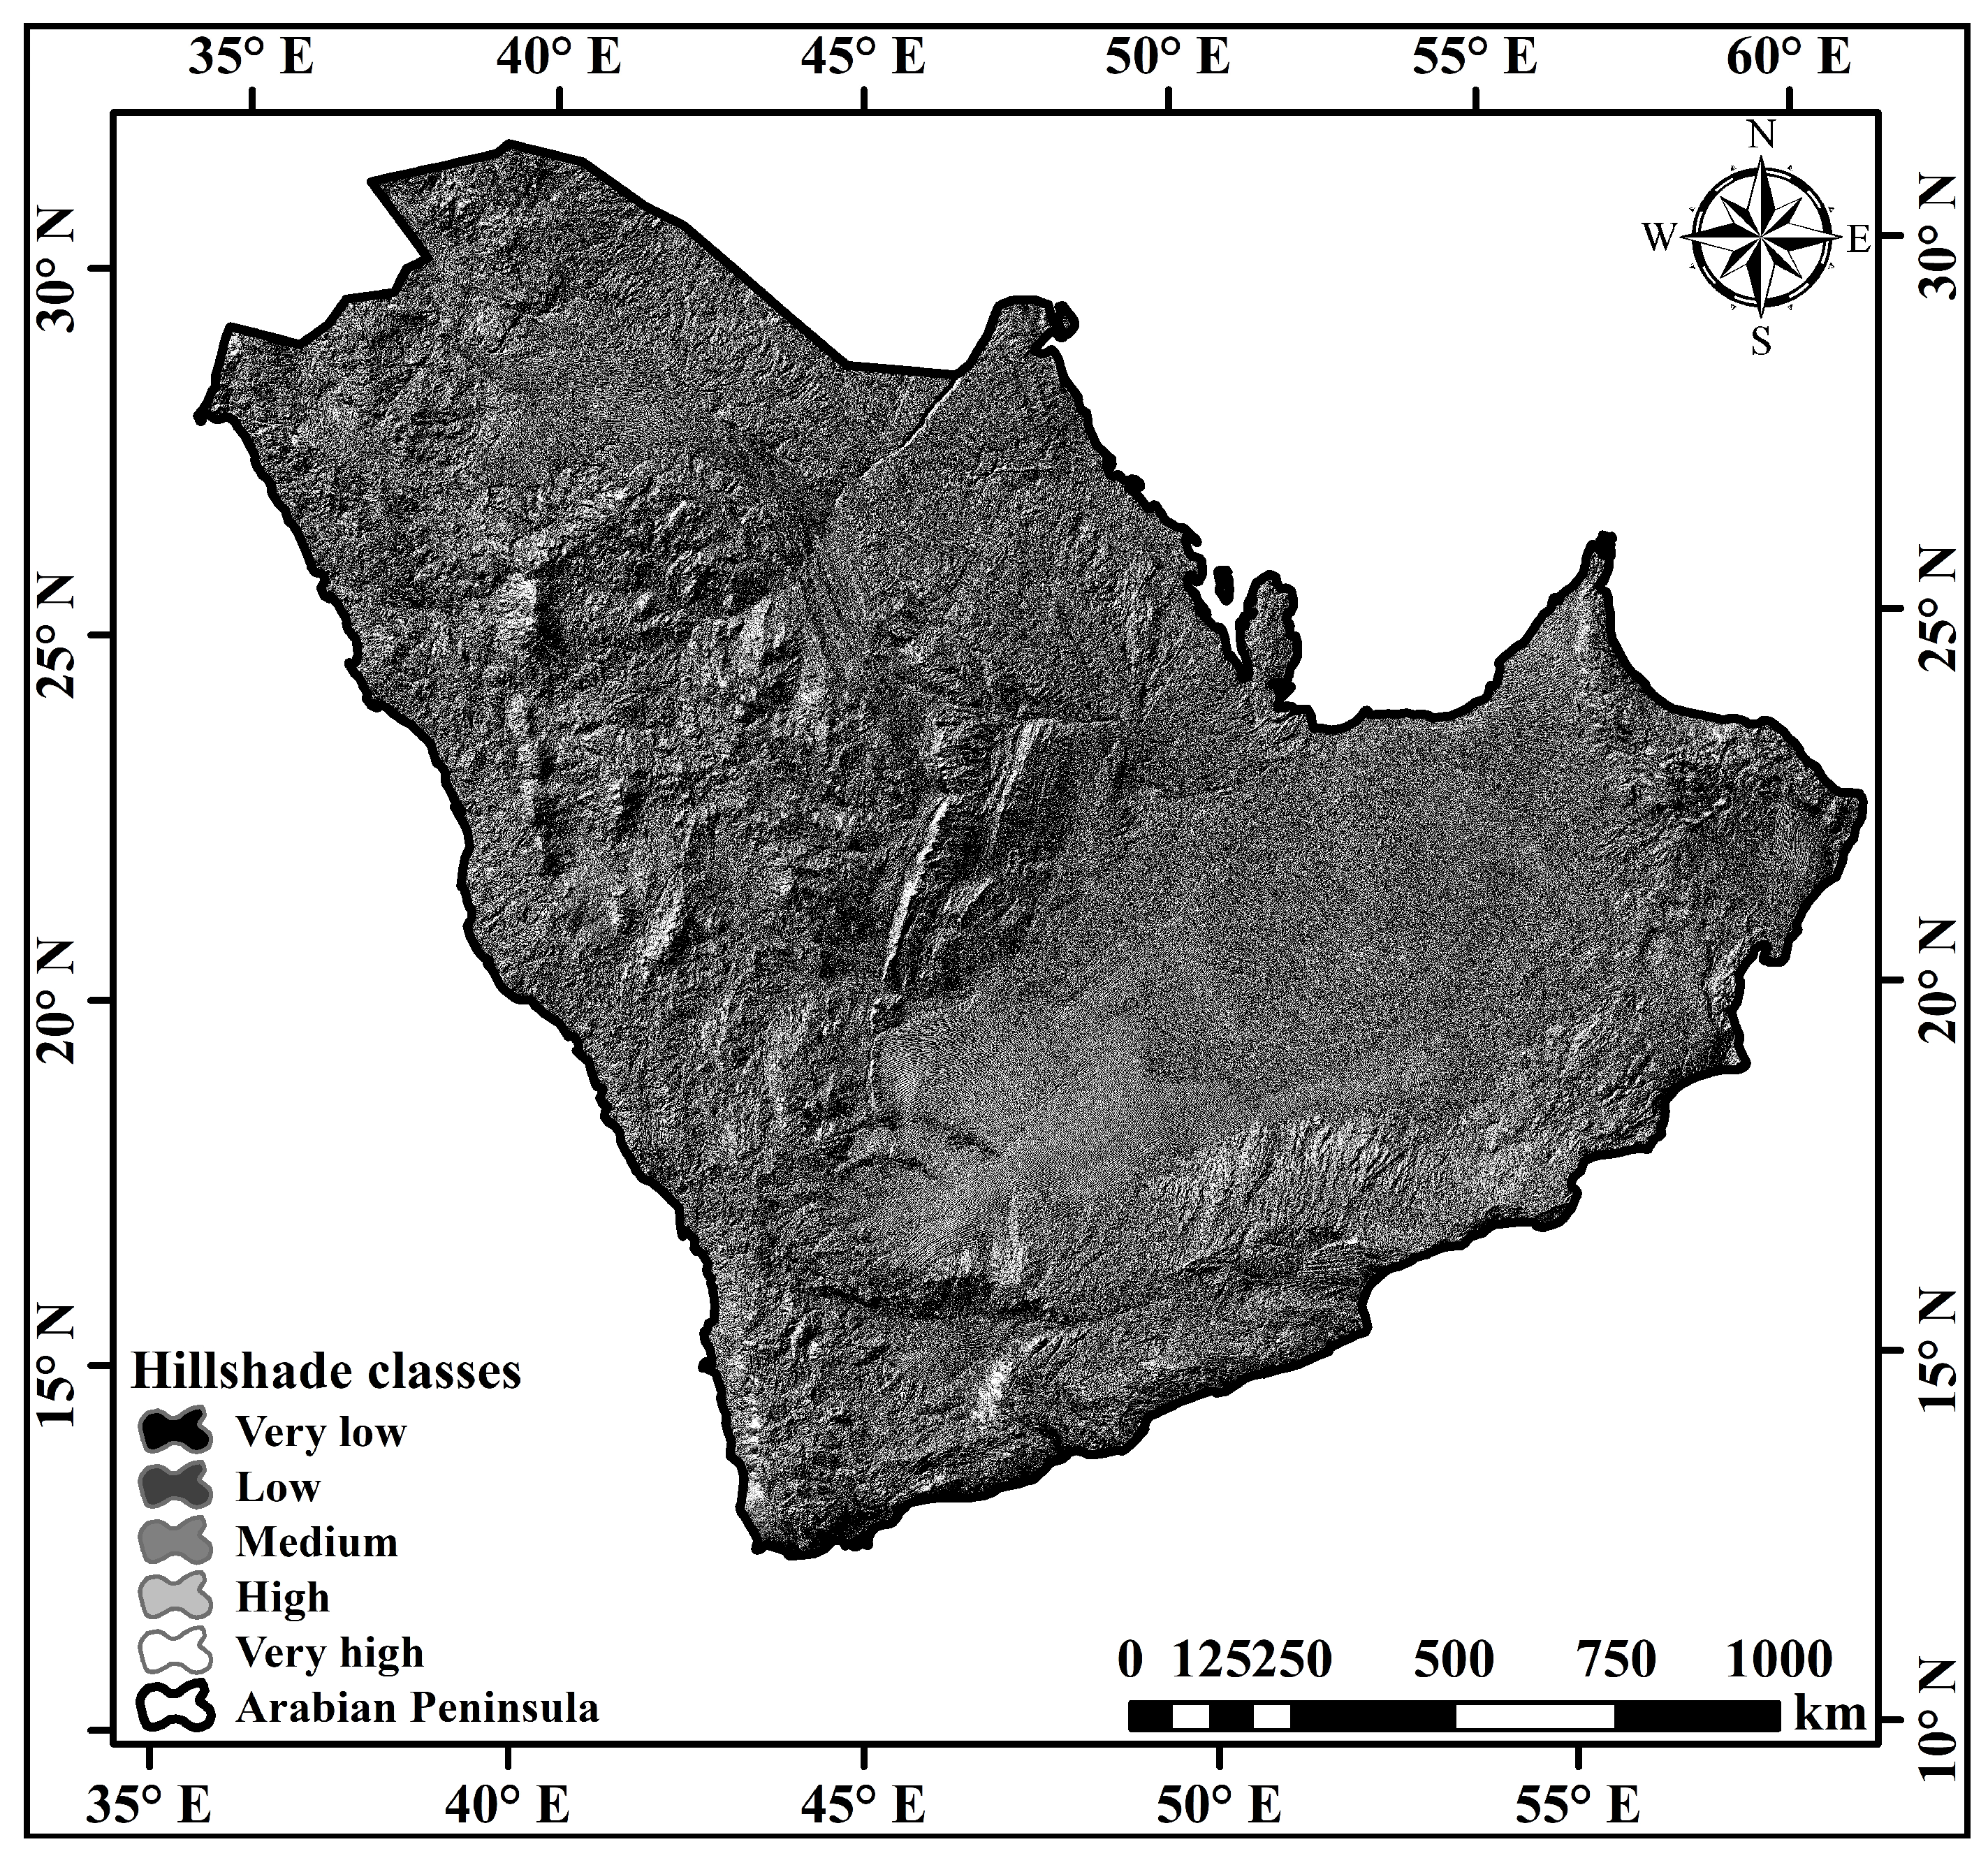
3.3. Relief Morphometric Parameters

The significance of relief morphometry in the examination of basin erosional characteristics has been acknowledged by Benzougagh and Meshram [76] and Tukura and Akalu [77]. The present work examines four fundamental morphometric relief parameters, namely basin total relief (H), relative relief (R), relief ratio (Rh), and gradient ratio (Rg), in order to gain a deeper understanding of the dynamic alterations in landforms throughout the Arabian Peninsula. Table 6 methodically presents the exact relief results for each basin in the region, ensuring clarity.
The dynamic nature of the topography of the Arabian Peninsula is revealed by the assessment of relative relief (R) values, which are derived from the Melton [51] equation. The major basins exhibit substantial variance, highlighting the different relief characteristics across the Peninsula, with a maximum relief of 1721 m and a low of 0 m. The Arabian Peninsula exhibits a mean relief value of 950 m, whereas particular basins display a range of 127 to 1233 m. These findings highlight the diverse and varied character of relief features in the region.
The utilization of the Strahler [44] formula in total relief estimates provides additional understanding of the dynamics of the terrain. The found low relative relief values, which range from 0.01 to 0.06, suggest that the drainage basin contains rocks with lower resistance. This observation is consistent with the research conducted by Qiu and Cui [78] and Bhunia and Samanta [79], which highlights the significance of lithological parameters in influencing the characteristics of relief.
The relief ratio (Rh) is a significant indicator that offers insights into the correlation between basin area and size. It is seen that the Peninsula exhibits a relief ratio of zero, while individual basins display a range of 0 to 0.001. The observed inverse connection implies a gradual incline in the topography, indicating the possible impact of topographical elements on the characteristics of the relief. The findings are further supported by the gradient ratio (Rg), which ranges from 0.001 to 0.018. This indicates a uniform lithology and a lack of structural control within the basins. The Rg has been calculated using the formula proposed by Sreedevi, Subrahmanyam [53].
The detailed relief characteristics explained in this work provide a thorough comprehension of the morphometric complexities of the major basins in the Arabian Peninsula. The aforementioned findings make a valuable contribution to the wider academic conversation around the development of landscapes, highlighting the intricate relationship between lithological characteristics, structural influences, and topographical elements. Additional investigation into these relief factors, in conjunction with GIS technology, has the potential to augment the capacity to forecast and alleviate erosional phenomena, thereby providing valuable insights for the development of sustainable land use and water resource management approaches in the area.

3.4. Hypsometric Analysis

The investigation of hypsometric integral (HI) values in various geographical areas demonstrates their importance in identifying developmental phases and geological formations. Within the Arabian Peninsula, the HI exhibits a noteworthy trend, characterized by a decline from substantial values during the early developmental phase to comparatively smaller values during the latter stages of life. The Peninsula’s hypsometric properties were precisely calculated by categorizing the land area of each basin into classes using the contour map (Figure 5) and employing the triangulated irregular network (TIN) map. As illustrated in Figure 17, the hypsometric curve reveals that around 26% of the region is located at an elevation of 1050 m, while the majority, specifically 60%, of the Peninsula’s surface is positioned at an elevation of 500 m.
The utilization of the hypsometric curve is a crucial method in the estimation of HI, since it establishes a correlation between the average elevation and the range of relief within a certain basin. The relationship between this integral and total relief, slope steepness, drainage density, and channel gradients are inverse. The equation provided by Pike and Wilson [52] is utilized for the validation of the HI value. The predicted HI value in the research area is 60%, whereas the erosion integral (EI) is 40%. The observed distribution suggests that a significant proportion of the land area, spanning 162,000 km2, is located at relatively lower altitudes, specifically below 1500 m. According to Radwan, Alazba [27], the computed HI value corresponds to the maturity stage of the basin, indicating an erosion stage.
The geologic stages of the basin have been clarified by identifying hypothetical criteria (Table 7) derived from the research conducted by Radwan, Alazba [22], Pareta and Pareta [80]. The HI value, in conjunction with these standards, offers a thorough comprehension of the morphological evolution of the Arabian Peninsula. The mature stage, as determined by the HI value, signifies a state of equilibrium between erosional and depositional processes, which gradually mold the landscape. The ramifications of this result are of great importance in terms of comprehending the geomorphic evolution and anticipated future alterations in the basins of the Peninsula.
The computed HI and EI values enhance the comprehension of the erosional and depositional dynamics in the primary basins of the Arabian Peninsula. The prevalence of lower elevations and the erosion stage correspond to the geological context and climatic circumstances of the region. Additional research endeavors aimed at exploring the correlation between HI values and distinct geological formations have the potential to augment the understanding of the fundamental mechanisms that influence the topography. The present research establishes the foundation for forthcoming investigations into the morphometric development of basins, providing significant contributions to the understanding of the intricate interaction between geological, climatic, and hydrological elements in the Arabian Peninsula.

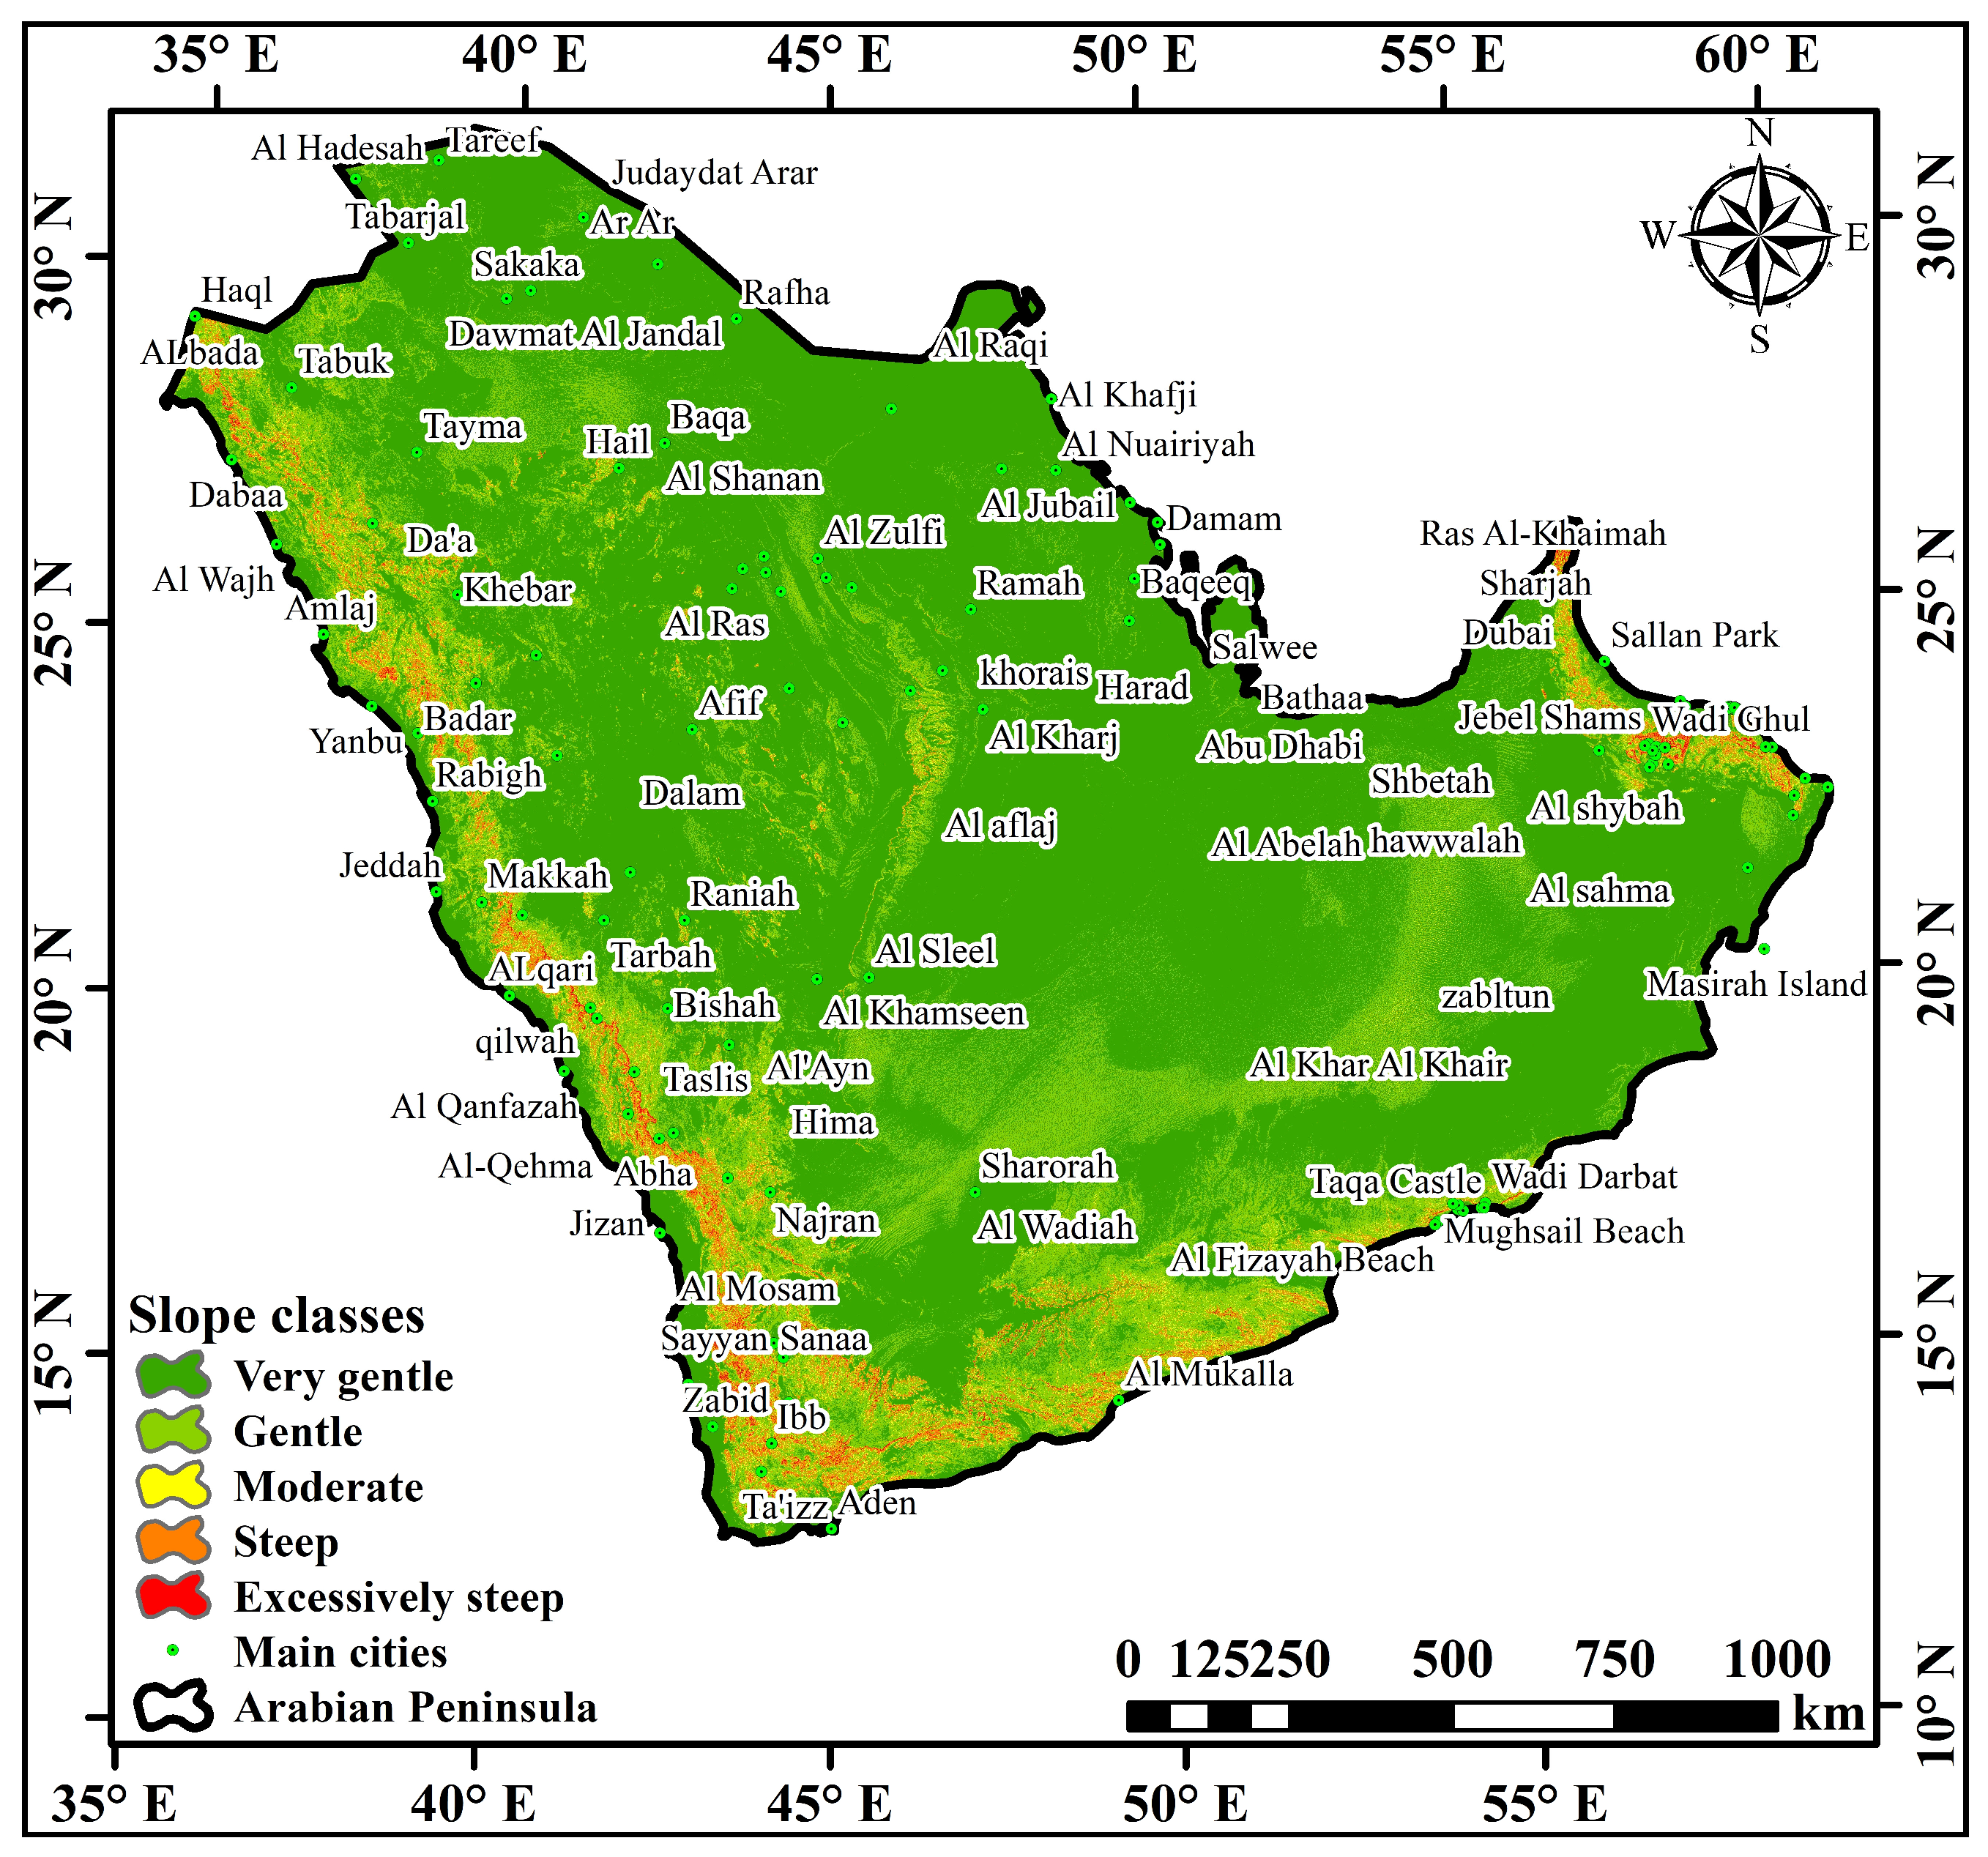
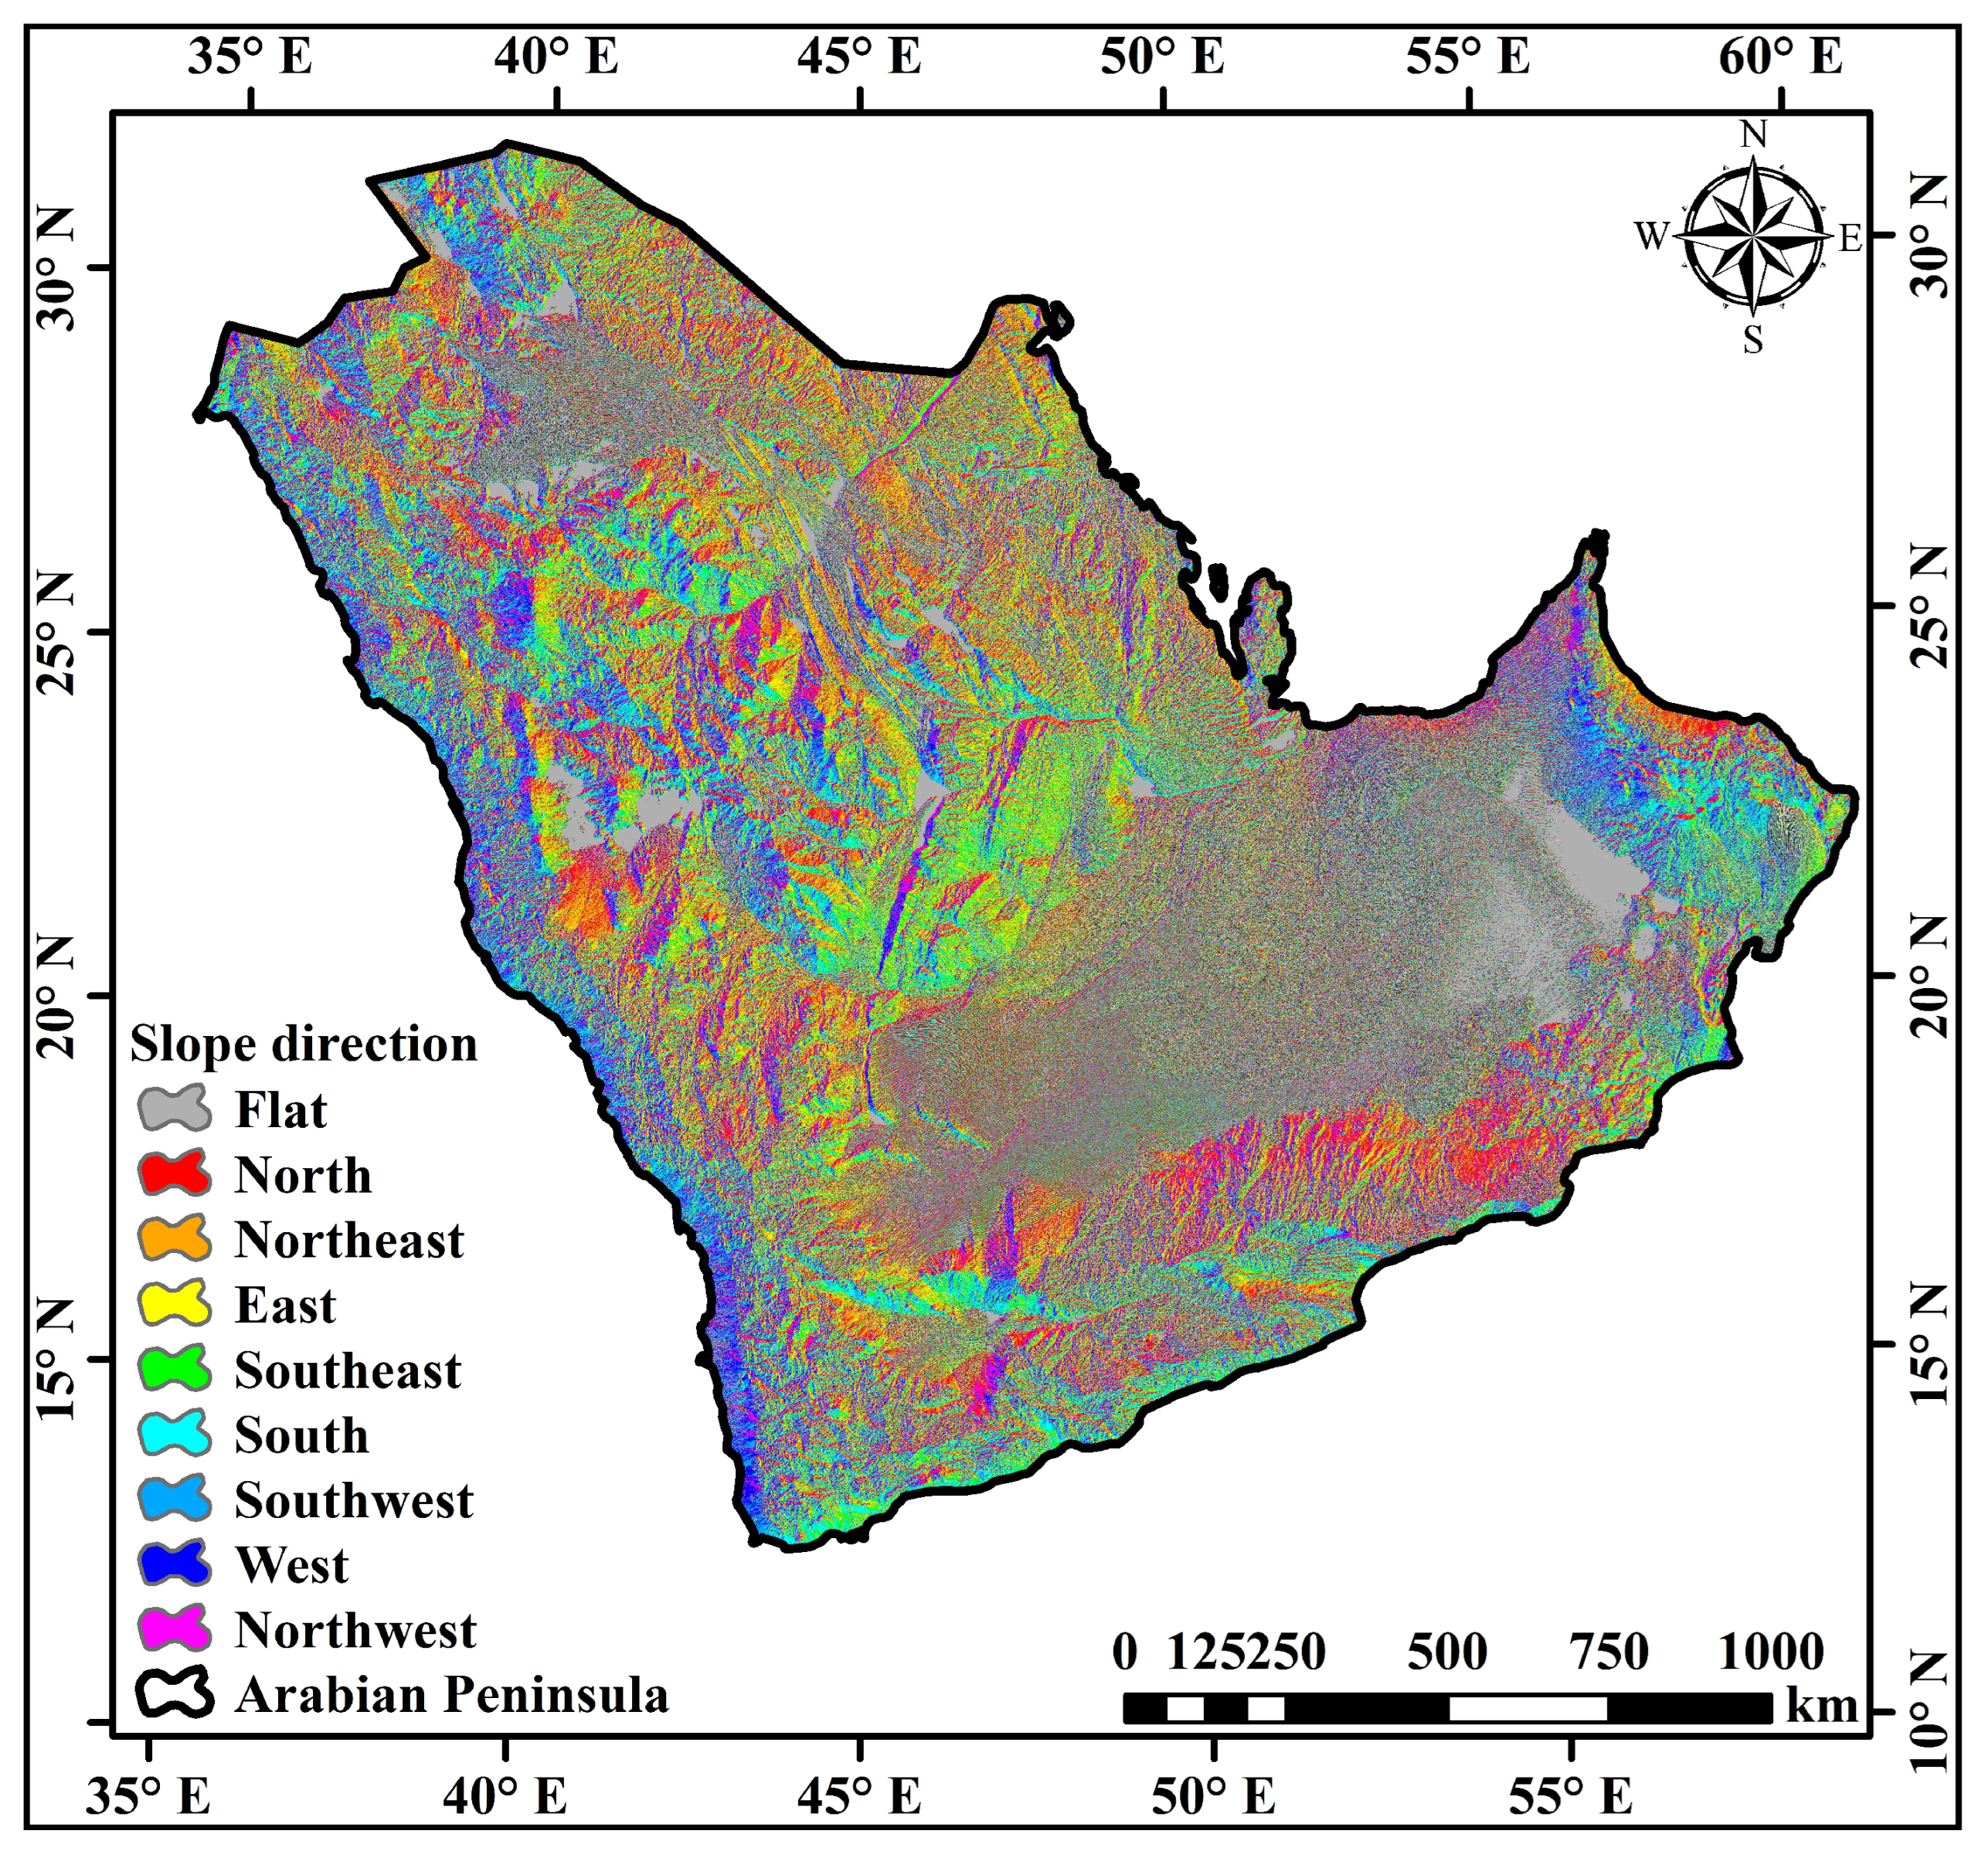
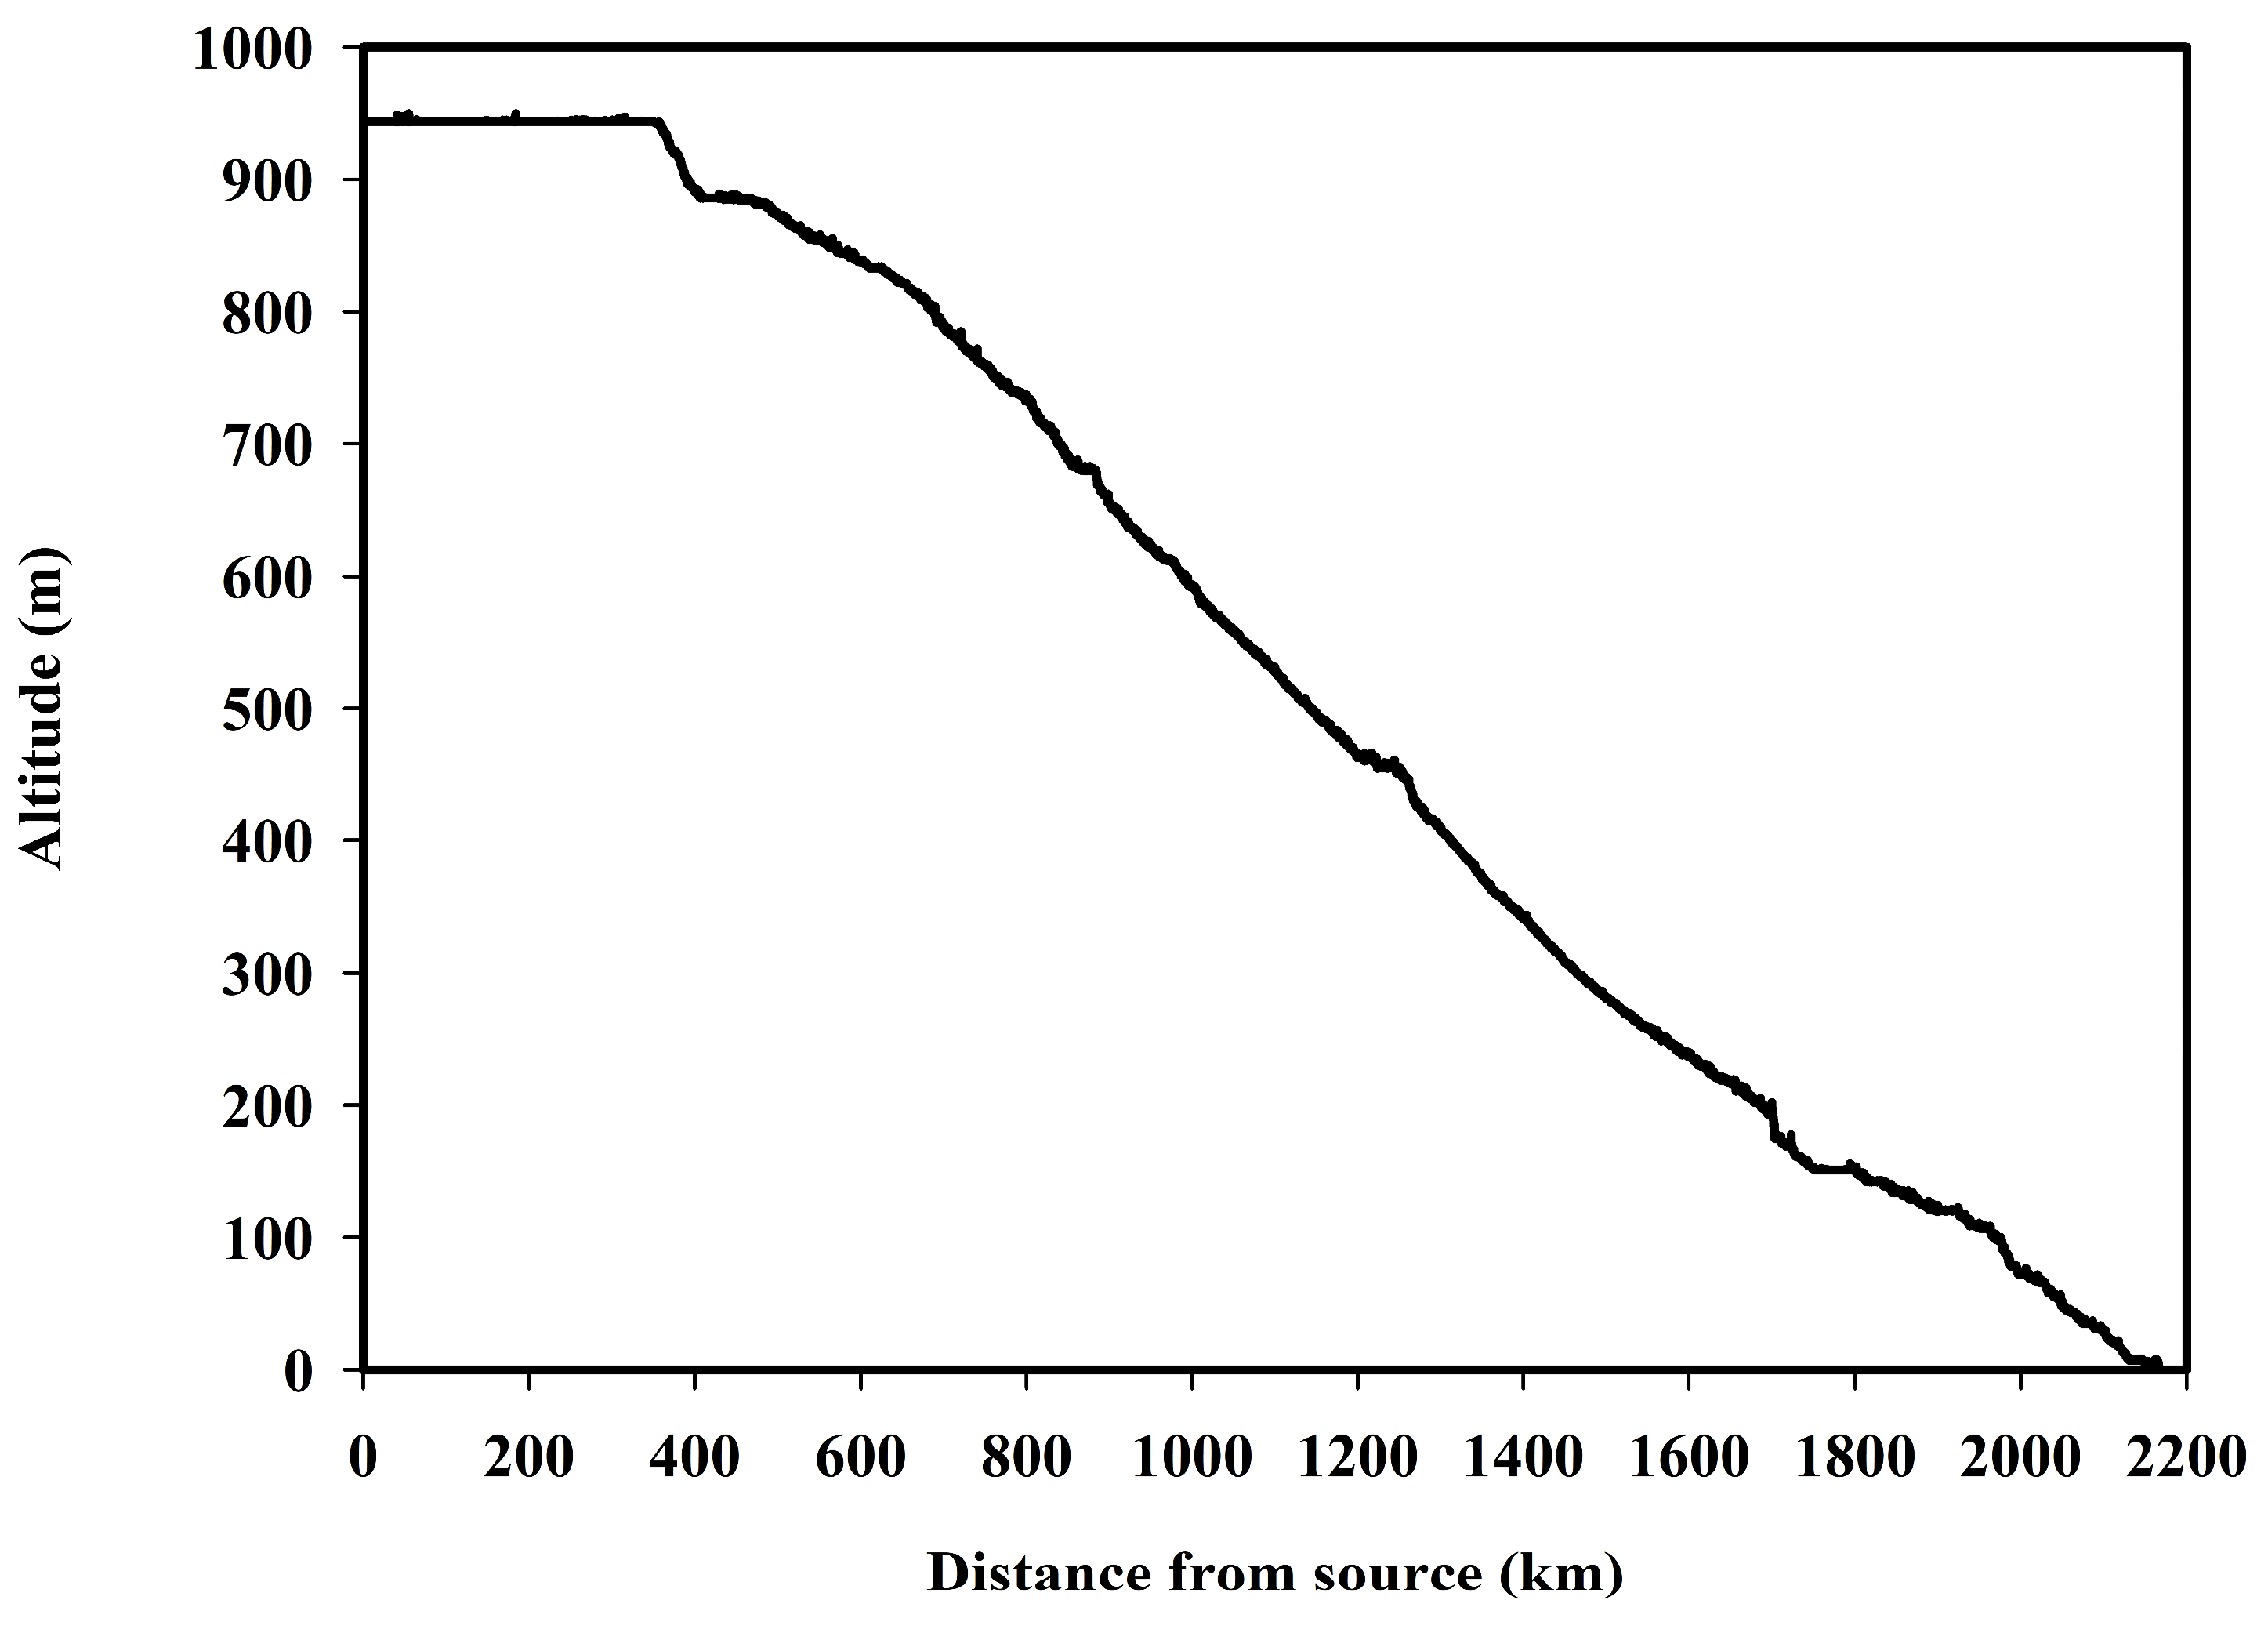
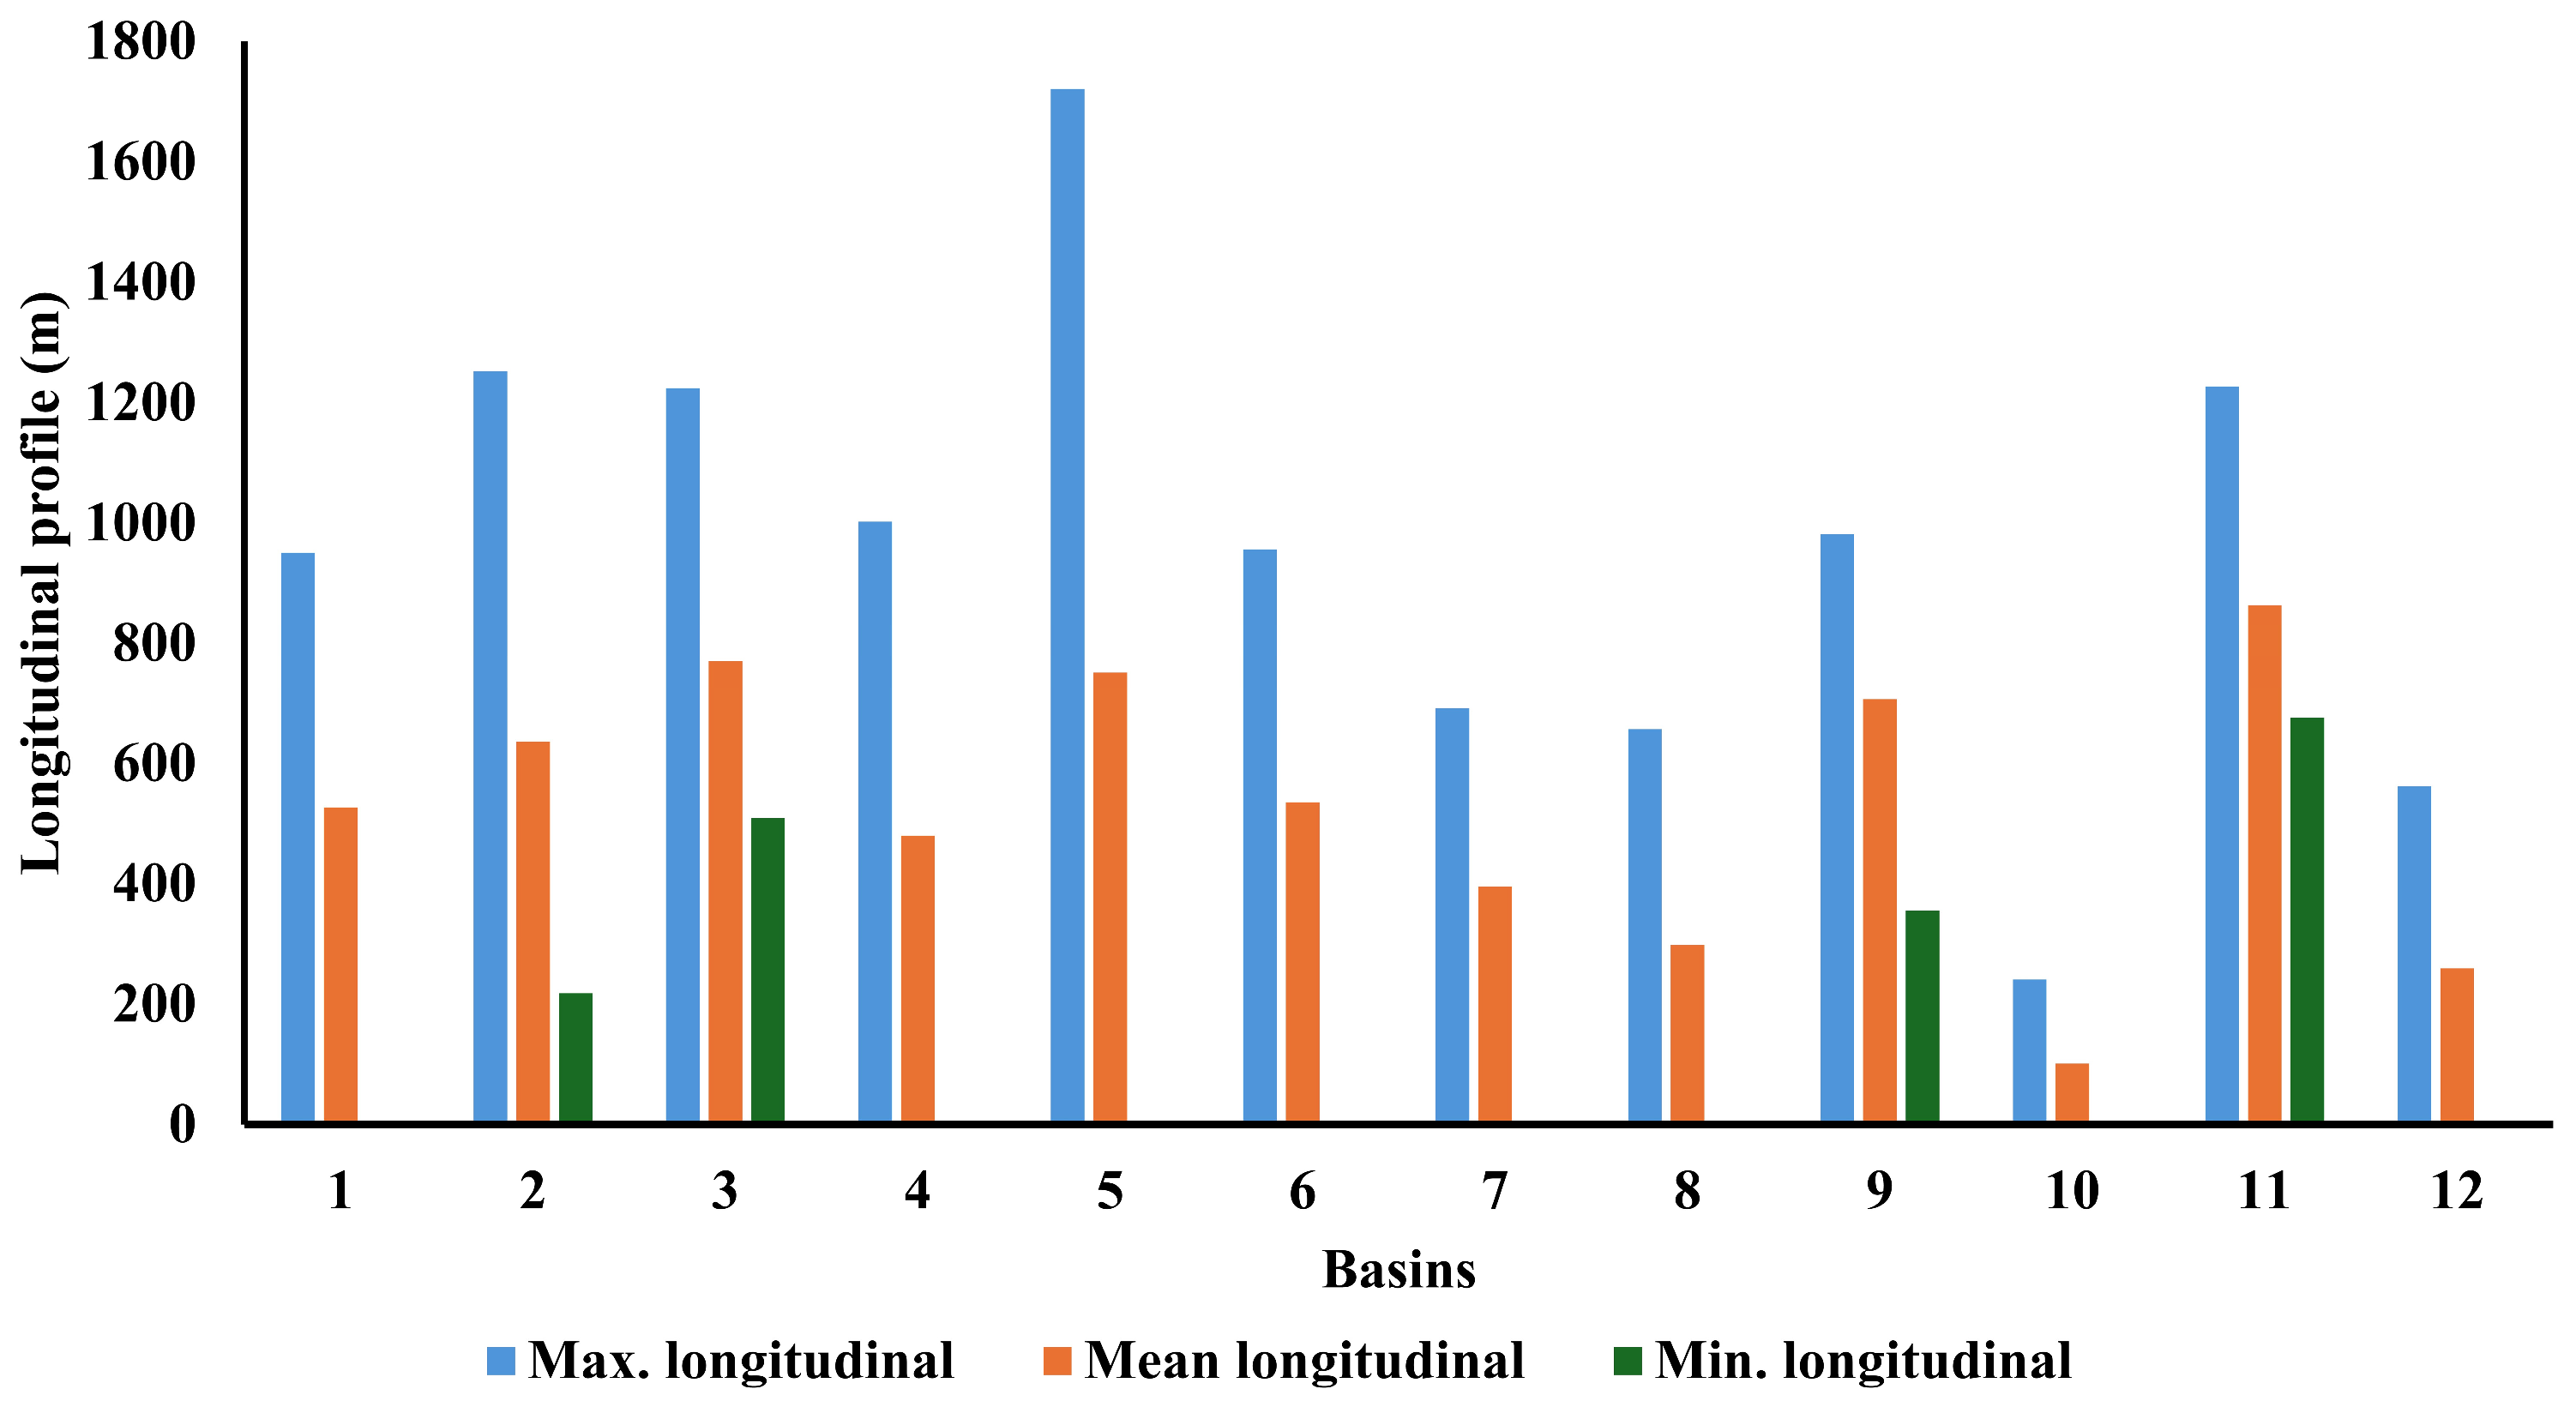
3.5. Slope and Basin Profile

The examination of the major basins in the Arabian Peninsula through morphometric analysis yields valuable insights that are crucial for comprehending the hydrological characteristics and geomorphic aspects of the region. The slope distribution across the Peninsula is depicted in Figure 4, with a range from 0 to 67°, with an average slope of 2.5°. According to the classification provided by Radwan and Alazba [3] and FAO [81], the slope is divided into five categories: very mild (less than 2°), gentle (2–10°), moderate (more than 10–15°), steep (greater than 15–30°), and excessively steep (greater than 30°). This categorization provides essential understanding of the topography, which affects the flow of water and the process of water infiltration. It corresponds to the linear and areal morphometric characteristics observed in the basins.
The slopes can be observed by examining contours, geomorphic landforms, and hill shade maps (Figure 5, Figure 6 and Figure 7, respectively), all of which clearly indicate a clear geographical distribution from west to east, south, and especially from southeast to south. The observed hydrological responses in the basins are influenced by geographic variation in slope, which in turn affects parameters such as drainage density, stream frequency, and runoff characteristics. The longitudinal profile, which depicts changes in elevation along the main basin, is a good indicator of the topographic characteristics of the basin. The profiles for the main basin of the Arabian Peninsula vary from 0 to 950 m, as shown in Figure 18. The longitudinal profile is used to validate the quality of mainstream selection, guaranteeing that the highest point corresponds to the source of the basin and the lowest point corresponds to the mouth of the basin.
The examination of Figure 19 provides additional insights into the longitudinal characteristics seen within the designated basins. In basins 10 and 5, the greatest longitudinal profile ranges from 241 to 1721 m, with an average of 955 m. The range of minimum values is from 0 to 676, with an average value of 147 m. The comprehensive examination of this profile not only encompasses a wide variety of altitudes but also makes a geometric contribution to effectively depicting basin formations [20,70]. The acquisition of comprehensive morphometric data is of utmost importance in the evaluation of potential flood hazards, vulnerability to erosion, and the overall behavior of basins.
The results of the morphometric analysis provide crucial insights into the hydrological behavior of the region’s basins, directly informing water resource management strategies and environmental planning. Identifying key morphometric parameters such as drainage density, basin shape, and stream order helps recognize areas prone to high runoff and flood susceptibility, which are vital for developing effective flood mitigation measures and optimizing rainwater harvesting. Furthermore, the analysis offers practical applications for sustainable water management by identifying optimal locations for groundwater recharge, artificial storage, and rainwater harvesting systems. This is particularly significant in the water-scarce Arabian Peninsula, where climate change and groundwater over-extraction intensify water scarcity. The Sinú River Basin example shows how factors like drainage density and slope can help in planning rainwater harvesting systems [82], while the Baruband watershed shows how morphometric data can be used to create groundwater recharge and erosion control plans [83]. These case studies highlight the shift from generic recommendations to precise, site-specific interventions, supported by GIS and remote sensing technologies. By integrating morphometric analysis with land use and climatic data, as seen in the Murredu and Geba River Basin studies, water managers can prioritize resources effectively, ensuring sustainable management of water and soil resources [83,84]. Continued advancements in DEM accuracy and parameter standardization will further enhance the applicability of this approach in diverse hydrological contexts. The findings guide targeted water conservation efforts, reduce flash flood risks, and promote efficient use of limited resources, contributing to the region’s long-term sustainability. The efficiency of runoff and groundwater recharge is affected by slope variations, underscoring the need for region-specific techniques. Additionally, longitudinal profiles offer insights into the altitudinal distribution within basins, aiding in the identification of flood-prone areas and flood risk assessments. This morphometric analysis lays a foundation for future studies, providing a comprehensive understanding of the primary basins in the Arabian Peninsula and supporting the development of sustainable water management strategies for the region.
The current study created a soil texture map for the area under investigation to help understand infiltration, rock types, and the likelihood of runoff (Figure 20). The soil texture is classified into seven classes, each accounting for a percentage of the total area: clay (0.1%), sand (10%), sandy loam (25.7%), silt (19%), silt loam (41.3%), silty clay (3.2%), and silty clay loam (0.7%).
Note: the classes of the soil texture map include clay (0.1%), sand (10%), sandy loam (25.7%), silt (19%), silt loam (41.3%), silty clay (3.2%), and silty clay loam (0.7%), each accounting for a percentage of the total area.
The morphometric measurements point to a predominantly infiltration-controlled hydrological regime. In the studied Arabian basins, the drainage density is extremely low (0.06–0.11 km/km2), implying a very coarse, permeable landscape in which few channels form [67,71]. In such settings most rainfall percolates rather than runs off, so subsurface flow and recharge dominate. Indeed, low drainage density has been linked to a high void ratio and strong groundwater recharge potential, whereas dense stream networks correlate with rapid runoff and reduced recharge [85]. Likewise, the virtually zero relief ratio (0–0.001) and minimal relative relief (0.01–0.06) denote exceptionally gentle slopes. These subdued gradients further slow overland flow and favor infiltration, and they greatly limit the overall erosive power [86]. Schumm [46] showed that sediment yield rises directly with relief ratio. Nonetheless, any localized steep reaches (for example, narrow rocky ravines or sudden escarpments) could concentrate flow and mobilize sediment. In fact, steep rocky terrain is known to produce flash floods even under modest rainfalls [87]. Thus, while the basin’s morphology implies generally moderate-to-low runoff with high infiltration and recharge (consistent with a mid-range hypsometric integral of ~60%), it also indicates that intense, short-lived flooding and erosion remain possible in the rare steep sectors. In simple terms, steep mountain areas like the Asir and Hijaz ranges, along with wadi systems, usually have a lot of drainage density, high elevation differences, and short distances for water to flow over land, while the more gently sloping central and high Arabian basins have less drainage density and lower relief [88,89].

4. Conclusions

The Arabian Peninsula is currently facing a significant issue of water scarcity, which requires a thorough understanding of the hydrological processes and morphometric properties of the region. This study presents a thorough examination of the primary basins in the Arabian Peninsula, focusing on morphometric parameters. The investigation has provided valuable insights on the hydrological and geomorphic attributes of the area. The detailed study of various features, like basin length, perimeter, area, shape factor, elongation ratio, circularity ratio, drainage density, stream frequency, drainage texture, infiltration rate, and stream order, has led to a better understanding of basins. The morphometric analysis reveals arid basins with high bifurcation ratios, coarse drainage texture, steep slopes, and generally low natural infiltration. These characteristics imply rapid runoff and flash-flood risks, with limited natural groundwater recharge. Such terrain demands planning and management strategies explicitly tailored to basin geometry and geology. Rocks with lower resistance, shown by low relative relief values, suggest that drainage basins might be less stable and more at risk of erosion. The relationship between the length of basins and their general shape demonstrates a significant elongation, which has an impact on both peak flows and lag times. The significance of basin shape in flood control has been underscored by the analysis of form factor, elongation ratio, and circularity ratio. It has been seen that elongated basins exhibit reduced peak flows over extended periods of time. The variability in infiltration capacity, surface runoff potential, and climatic circumstances is indicated by the drainage density and texture on the Arabian Peninsula. The drainage texture seen in the basins exhibits a range of coarseness, which corresponds to the geographic features and soil composition of the basins. The examination of stream order has yielded significant insights regarding the hierarchical structure and arrangement of the drainage network. Understanding how easily water can flow through the basin and its structure is improved by the inverse relationship observed between stream order and stream number, along with the bifurcation ratio. Furthermore, the analysis of stream length and overland flow length underscores their importance in assessing surface runoff properties and the possibility of flooding.
The findings of this study have ramifications that go beyond the realm of academia. The study urges governments and regional agencies in the Arabian Peninsula to adopt various measures, ensuring that national basin plans, and cross-border agreements fully incorporate these geomorphological insights. These measures involve creating shared open-access data platforms, using shared data to inform joint planning to mitigate risk or make gains, and implementing coordinated risk reduction protocols for extreme events. Consequently, these will strengthen resilience to water scarcity and build the transboundary collaboration needed for sustainable water security. In practice, water authorities should treat the morphological map as a fundamental layer in integrated water resources management (IWRM), using it to prioritize where to focus interventions and monitoring. Understanding basin morphometry will help decision-makers improve water management strategies in arid regions.
This study uses one fixed 30 m SRTM DEM and related GIS layers, which do not show changes over time in the shape of the basin caused by climate changes, land use changes, or development of infrastructure. Although key outlet points and basin boundaries were checked against Google Earth imagery and a limited number of field landmarks, comprehensive field surveys across the 3.24 million km2 study area were not feasible. The study emphasizes physical basin features without specifically addressing socioeconomic elements. To overcome these limitations, the study suggests using multi-temporal high-resolution DEMs and land-cover change datasets to overcome these constraints; running focused field campaigns for channel cross-sections and soil-infiltration tests; coupling morphometric outputs with hydrological and climate models; and including socio-economic and governance analyses to support overall IWRM strategies.

Author Contributions

Conceptualization, F.R.; data curation, A.A.A. and F.R.; formal analysis, A.A.A. and F.R.; investigation, F.R.; methodology, A.A.A. and F.R.; project administration, A.A.A.; software, A.A.A. and F.R.; validation, A.A.A. and F.R.; visualization, F.R.; writing—original draft, F.R.; writing—review and editing, A.A.A., A.M., H.M.E.G., A.E.-S., M.E., N.A. and F.R. All authors have read and agreed to the published version of the manuscript.

Funding

This project was funded by the National Plan for Science, Technology and Innovation (MAARIFAH), King Abdulaziz City for Science and Technology, Kingdom of Saudi Arabia, Award Number (3-17-01-001-0011) and the APC was funded by (MAARIFAH).

Data Availability Statement

The data can be provided by the corresponding author upon reasonable request.

Acknowledgments

This project was funded by the National Plan for Science, Technology and Innovation (MAARIFAH), King Abdulaziz City for Science and Technology, Kingdom of Saudi Arabia, Award Number (3-17-01-001-0011).

Conflicts of Interest

No conflicts of interest are declared by the authors in relation to the publication of this research.

References

  1. Mosa, M.; Radwan, F.; Al-Ghobari, H.; Fouli, H.; Alazba, A.A. Impact of varied fog collector designs on fog and rainwater harvesting under fluctuating wind speed and direction. Earth Sci. Inform. 2023, 17, 617–631. [Google Scholar] [CrossRef]
  2. Boretti, A.; Rosa, L. Reassessing the projections of the world water development report. NPJ Clean Water 2019, 2, 15. [Google Scholar] [CrossRef]
  3. Radwan, F.; Alazba, A.A. Suitable sites identification for potential rainwater harvesting (PRWH) using a multi-criteria decision support system (MCDSS). Acta Geophys. 2023, 71, 449–468. [Google Scholar] [CrossRef]
  4. Ezzeldin, M.; Alazba, A.A.; Alrdyan, N.; Radwan, F. Rationalizing Irrigation Water Consumption in Arid Climates Based on Multicomponent Landscape Coefficient Approach. Earth Syst. Environ. 2024, 9, 277–298. [Google Scholar] [CrossRef]
  5. Radwan, F.; Alazba, A.A.; Alotaibi, M.; Mossad, A. Site suitability analysis for desalination plants based on the complementarity of GIS, RST, MCE, and spatial AHP in arid and semiarid regions. Arab. J. Geosci. 2022, 15, 1763. [Google Scholar] [CrossRef]
  6. IPCC. Climate Change and Land: An IPCC Special Report on Climate Change, Desertification, Land Degradation, Sustainable Land Management, Food Security, and Greenhouse Gas Fluxes in Terrestrial Ecosystems. In Climate Change and Land; Shukla, P.R., Skea, J., Buendia, E.C., Masson-Delmotte, V., Pörtner, H.O., Roberts, D., Zhai, P., Slade, R., Connors, S., et al., Eds.; IPCC: Geneva, Switzerland, 2019. [Google Scholar]
  7. Radwan, F.; Alazba, A.A.; Mossad, A. Flood risk assessment and mapping using AHP in arid and semiarid regions. Acta Geophys. 2019, 67, 215–229. [Google Scholar] [CrossRef]
  8. Radwan, F.; Alazba, A.A.; Mossad, A. Estimating potential direct runoff for ungauged urban watersheds based on RST and GIS. Arab. J. Geosci. 2018, 11, 748. [Google Scholar] [CrossRef]
  9. Altinbilek, D.; Hatipoglu, M.A. Water Resources Development. In Water Resources of Turkey; Harmancioglu, N.B., Altinbilek, D., Eds.; Springer International Publishing: Cham, Switzerland, 2020; pp. 61–84. [Google Scholar]
  10. UN. The Sustainable Development Goals Report 2022. 2022. Available online: https://unstats.un.org/sdgs/report/2022/ (accessed on 23 April 2025).
  11. Gorgoglione, A.; Crisci, M.; Kayser, R.H.; Chreties, C.; Collischonn, W. A New Scenario-Based Framework for Conflict Resolution in Water Allocation in Transboundary Watersheds. Water 2019, 11, 1174. [Google Scholar] [CrossRef]
  12. Zittis, G.; Almazroui, M.; Alpert, P.; Ciais, P.; Cramer, W.; Dahdal, Y.; Fnais, M.; Francis, D.; Hadjinicolaou, P.; Howari, F. Climate change and weather extremes in the Eastern Mediterranean and Middle East. Rev. Geophys. 2022, 60, e2021RG000762. [Google Scholar] [CrossRef]
  13. Arfa, A.; Ayyoubzadeh, S.A.; Shafizadeh-Moghadam, H.; Mianabadi, H. Transboundary hydropolitical conflicts and their impact on river morphology and environmental degradation in the Hirmand Basin, West Asia. Sci. Rep. 2025, 15, 2754. [Google Scholar] [CrossRef]
  14. Daoudy, M.; Al-Saidi, M.; Al Manji, A.; Ayoub, J.; Bateh, F.; Dajani, M.; El Sheikh, R.; El Musa, S.; Mahmoud, M.; Shuker, Z. Troubled Waters in Conflict and a Changing Climate: Transboundary Basins Across the Middle East and North Africa; Carnegie Endowment for International Peace: Washington, DC, USA, 2024. [Google Scholar]
  15. Abdulrazzak, M.J.; Oikonomou, P.D.; Grigg, N.S. Transboundary groundwater cooperation among countries of the Arabian Peninsula. J. Water Resour. Plan. Manag. 2020, 146, 05019023. [Google Scholar] [CrossRef]
  16. Kolokytha, E.; Malamataris, D. Integrated water management approach for adaptation to climate change in highly water stressed basins. Water Resour. Manag. 2020, 34, 1173–1197. [Google Scholar] [CrossRef]
  17. Sajadi, P.; Singh, A.; Mukherjee, S.; Sang, Y.-F.; Chapi, K.; Salari, M. Drainage network extraction and morphometric analysis in an Iranian basin using integrating factor analysis and geospatial techniques. Geocarto Int. 2022, 37, 896–925. [Google Scholar] [CrossRef]
  18. Erosemiah, D.; Viji, R. Study on drainage network pattern and morphometric analysis by using hydrology support algorithm. J. Geol. Soc. India 2023, 99, 1006–1014. [Google Scholar] [CrossRef]
  19. Radwan, F.; Alazba, A. Integrated Hydrologic Study of the Arid and Semi-arid Regions using RST and GIS in the Riyadh Metropolitan Area, Saudi Arabia. J. Geol. Soc. India 2021, 97, 539–554. [Google Scholar] [CrossRef]
  20. Radwan, F.; Alazba, A.; Mossad, A. Analyzing urban watersheds morphometric in arid and semiarid regions using the complementarity of RST and GIS. Arab. J. Geosci. 2020, 13, 1237. [Google Scholar] [CrossRef]
  21. Abu El-Magd, S.A.; Orabi, H.O.; Ali, S.A.; Parvin, F.; Pham, Q.B. An integrated approach for evaluating the flash flood risk and potential erosion using the hydrologic indices and morpho-tectonic parameters. Environ. Earth Sci. 2021, 80, 694. [Google Scholar] [CrossRef]
  22. Radwan, F.; Alazba, A.; Mossad, A. Watershed morphometric analysis of Wadi Baish Dam catchment area using integrated GIS-based approach. Arab. J. Geosci. 2017, 10, 256. [Google Scholar] [CrossRef]
  23. Portuguez-Maurtua, M.; Arumi, J.L.; Stehr, A.; Lagos, O.; Chávarri-Velarde, E.; Rivera-Ruiz, D. Mapping of Areas Vulnerable to Flash Floods by Means of Morphometric Analysis with Weighting Criteria Applied. Water 2023, 15, 1053. [Google Scholar] [CrossRef]
  24. Sutradhar, S.; Mondal, P. Prioritization of watersheds based on morphometric assessment in relation to flood management: A case study of Ajay river basin, Eastern India. Watershed Ecol. Environ. 2023, 5, 1–11. [Google Scholar] [CrossRef]
  25. Bogale, A. Morphometric analysis of a drainage basin using geographical information system in Gilgel Abay watershed, Lake Tana Basin, upper Blue Nile Basin, Ethiopia. Appl. Water Sci. 2021, 11, 122. [Google Scholar] [CrossRef]
  26. Tiwari, R.N.; Kushwaha, V.K. Watershed prioritization based on morphometric parameters and PCA technique: A case study of deonar river sub basin, sidhi area, Madhya Pradesh, India. J. Geol. Soc. India 2021, 97, 396–404. [Google Scholar] [CrossRef]
  27. Radwan, F.; Alazba, A.A.; Mossad, A. Analyzing the geomorphometric characteristics of semiarid urban watersheds based on an integrated GIS-based approach. Mod. Earth Syst. Environ. 2020, 6, 1913–1932. [Google Scholar] [CrossRef]
  28. Singh, D.; Karan, K.; Singh, S.K.; Chauhan, P.; Berndtsson, R. Fusing morphometric characteristics with extreme precipitation indices for identifying the most vulnerable sub-basin at risk of flooding. J. Hydro-Environ. Res. 2023, 50, 44–56. [Google Scholar] [CrossRef]
  29. Ghosh, M.; Gope, D. Hydro-morphometric characterization and prioritization of sub-watersheds for land and water resource management using fuzzy analytical hierarchical process (FAHP): A case study of upper Rihand watershed of Chhattisgarh State, India. Appl. Water Sci. 2021, 11, 17. [Google Scholar] [CrossRef]
  30. Mahala, A. The significance of morphometric analysis to understand the hydrological and morphological characteristics in two different morpho-climatic settings. Appl. Water Sci. 2020, 10, 33. [Google Scholar] [CrossRef]
  31. Jaber, S.M.; Abu-Allaban, M.M.; Sengupta, R. Spatial and temporal patterns of indicators of climate change and variability in the Arab world in the past four decades. Sci. Rep. 2023, 13, 15145. [Google Scholar] [CrossRef]
  32. Sadry, B.N.; Abdel Maksoud, K.M.; Zahabnazouri, S. Geotourism Development in the Middle East: A Comparative Study of Iran, Saudi Arabia, Oman and Jordan. In Tourism Planning and Development in the Middle East; CABI GB: Carson, CA, USA, 2022; pp. 126–141. [Google Scholar]
  33. Alsharhan, A.S.; Kendall, C.G.S.C. Paleozoic sequence stratigraphy, depositional systems, and hydrocarbon habitats across the Arabian plate. AAPG Bull. 2021, 105, 1149–1198. [Google Scholar] [CrossRef]
  34. Valjarević, A.; Algarni, S.; Morar, C.; Grama, V.; Stupariu, M.; Tiba, A.; Lukić, T. The coastal fog and ecological balance for plants in the Jizan region, Saudi Arabia. Saudi J. Biol. Sci. 2023, 30, 103494. [Google Scholar] [CrossRef]
  35. Almazroui, M.; Nazrul Islam, M.; Athar, H.; Jones, P.; Rahman, M.A. Recent climate change in the Arabian Peninsula: Annual rainfall and temperature analysis of Saudi Arabia for 1978–2009. Int. J. Climatol. 2012, 32, 953–966. [Google Scholar] [CrossRef]
  36. Al-Sakkaf, A.S.; Jiahua, Z.; Fengmei, Y.; Hamed, M.M.; Simbi, C.H.; Ahmed, A.; Shahid, S. Assessing exposure to climate extremes over the Arabian Peninsula using ERA5 reanalysis data: Spatial distribution and temporal trends. Atmos. Res. 2024, 300, 107224. [Google Scholar] [CrossRef]
  37. Yamagami, Y.; Tatebe, H.; Kataoka, T.; Suzuki, T.; Watanabe, M. Impacts of oceanic mesoscale structures on sea surface temperature in the Arabian Sea and Indian summer monsoon revealed by climate model simulations. J. Clim. 2023, 36, 5477–5490. [Google Scholar] [CrossRef]
  38. Almazroui, M. Changes in temperature trends and extremes over Saudi Arabia for the period 1978–2019. Adv. Meteorol. 2020, 2020, 8828421. [Google Scholar] [CrossRef]
  39. Patlakas, P.; Stathopoulos, C.; Flocas, H.; Bartsotas, N.S.; Kallos, G. Precipitation climatology for the arid region of the Arabian Peninsula—Variability, trends and extremes. Climate 2021, 9, 103. [Google Scholar] [CrossRef]
  40. Bharath, A.; Kumar, K.K.; Maddamsetty, R.; Manjunatha, M.; Tangadagi, R.B.; Preethi, S. Drainage morphometry based sub-watershed prioritization of Kalinadi basin using geospatial technology. Environ. Chall. 2021, 5, 100277. [Google Scholar] [CrossRef]
  41. Sarkar, P.; Kumar, P.; Vishwakarma, D.K.; Ashok, A.; Elbeltagi, A.; Gupta, S.; Kuriqi, A. Watershed prioritization using morphometric analysis by MCDM approaches. Ecol. Inform. 2022, 70, 101763. [Google Scholar] [CrossRef]
  42. Horton, R.E. Drainage-basin characteristics. Trans. Am. Geophys. Union 1932, 13, 350–361. [Google Scholar]
  43. Horton, R.E. Erosional development of streams and their drainage basins; hydrophysical approach to quantitative morphology. Geol. Soc. Am. Bull. 1945, 56, 275–370. [Google Scholar] [CrossRef]
  44. Strahler, A.N. Dynamic basis of geomorphology. Geol. Soc. Am. Bull. 1952, 63, 923–938. [Google Scholar] [CrossRef]
  45. Miller, V.C. A Quantitative Geomorphic Study of Drainage Basin Characteristics in the Clinch Mountain Area Virginia and Tennessee; Columbia University: New York, NY, USA, 1953. [Google Scholar]
  46. Schumm, S.A. Evolution of drainage systems and slopes in badlands at perth amboy, New Jersey. Geol. Soc. Am. Bull. 1956, 67, 597–646. [Google Scholar] [CrossRef]
  47. Strahler, A.N. Quantitative Geomorphology of Drainage Basin and Channel Networks. In Handbook of Applied Hydrology; McGraw-Hill: New York, NY, USA, 1964. [Google Scholar]
  48. Pande, C.; Moharir, K.; Pande, R. Assessment of morphometric and hypsometric study for watershed development using spatial technology—A case study of Wardha river basin in Maharashtra, India. Int. J. River Basin Manag. 2021, 19, 43–53. [Google Scholar] [CrossRef]
  49. Guth, P.L.; Van Niekerk, A.; Grohmann, C.H.; Muller, J.-P.; Hawker, L.; Florinsky, I.V.; Gesch, D.; Reuter, H.I.; Herrera-Cruz, V.; Riazanoff, S. Digital elevation models: Terminology and definitions. Remote Sens. 2021, 13, 3581. [Google Scholar] [CrossRef]
  50. Zavoiance, I. Morphometry of Drainage Basins (Developments in Water Science); Elsevier Science: Amsterdam, The Netherlands, 1985; Volume 20, pp. 104–105. [Google Scholar]
  51. Melton, M.A. An Analysis of the Relations Among Elements of Climate, Surface Properties, and Geomorphology; Columbia University: New York, NY, USA, 1957. [Google Scholar]
  52. Pike, R.J.; Wilson, S.E. Elevation-relief ratio, hypsometric integral, and geomorphic area-altitude analysis. Geol. Soc. Am. Bull. 1971, 82, 1079–1084. [Google Scholar] [CrossRef]
  53. Sreedevi, P.; Subrahmanyam, K.; Ahmed, S. The significance of morphometric analysis for obtaining groundwater potential zones in a structurally controlled terrain. Environ. Geol. 2005, 47, 412–420. [Google Scholar] [CrossRef]
  54. Singh, V.P. Elementary Hydrology; Prentice Hall of India Private Limited: New Delhi, India, 1992. [Google Scholar]
  55. Chelladurai, V.; BharaniPriya, A.; Mullaivasanthan, M. Groundwater Level Analysis of Sathyamangalam Region, Tamil Nadu, India Using GIS. IOP Conf. Ser. Earth Environ. Sci. 2023, 1258, 012005. [Google Scholar] [CrossRef]
  56. Kasi, V.; Pinninti, R.; Landa, S.R.; Rathinasamy, M.; Sangamreddi, C.; Kuppili, R.R.; Dandu Radha, P.R. Comparison of different digital elevation models for drainage morphometric parameters: A case study from South India. Arab. J. Geosci. 2020, 13, 1050. [Google Scholar] [CrossRef]
  57. Taib, H.; Hadji, R.; Hamed, Y. Erosion patterns, drainage dynamics, and their environmental implications: A case study of the hammamet basin using advanced geospatial and morphometric analysis. J. Umm Al-Qura Univ. Appl. Sci. 2023, 1–16. [Google Scholar] [CrossRef]
  58. Jha, A.; Gupta, N.C.; Dey, B. Morphometric Analysis of Gandak River Drainage Basin Using Geographic Information System (GIS) And SRTM-DEM. Geology 2022, 4, 31. [Google Scholar] [CrossRef]
  59. Adhikari, S. Morphometric analysis of a drainage basin: A study of Ghatganga River, Bajhang District, Nepal. Geogr. Base 2020, 7, 127–144. [Google Scholar] [CrossRef]
  60. Khan, M.Y.A.; ElKashouty, M. Watershed prioritization and hydro-morphometric analysis for the potential development of Tabuk Basin, Saudi Arabia using multivariate statistical analysis and coupled RS-GIS approach. Ecol. Indic. 2023, 154, 110766. [Google Scholar] [CrossRef]
  61. Shivhare, V.; Gupta, C.; Mallick, J.; Singh, C.K. Geospatial modelling for sub-watershed prioritization in Western Himalayan Basin using morphometric parameters. Nat. Hazards 2022, 110, 545–561. [Google Scholar] [CrossRef]
  62. Dongare, C.U.; Deota, B.S.; Deshpande, R.D. High resolution morphometric studies with special reference to hydrological setup of Khapri watershed, Dangs district, Gujarat, Western India. Geocarto Int. 2022, 37, 3697–3720. [Google Scholar] [CrossRef]
  63. Hema, H.; Vittala, S.; Govindaiah, S. Quantitative morphometric infer in the hard rock Terrain based on SRTM-DEM and GIS-Chintamani Watershed, Chikkaballapur District, Karnataka, India. Sustain. Water Resour. Manag. 2021, 7, 57. [Google Scholar] [CrossRef]
  64. Obeidat, M.; Awawdeh, M.; Al-Hantouli, F. Morphometric analysis and prioritisation of watersheds for flood risk management in Wadi Easal Basin (WEB), Jordan, using geospatial technologies. J. Flood Risk Manag. 2021, 14, e12711. [Google Scholar] [CrossRef]
  65. Kant, C.; Kumar, G.; Meena, R.S. Modeling morphometric and geomorphological parameters of mountainous river basin for water resource management using remote sensing and GIS approach. Mod. Earth Syst. Environ. 2023, 9, 2151–2163. [Google Scholar] [CrossRef]
  66. Ganie, P.A.; Posti, R.; Bharti, V.S.; Sehgal, V.K.; Sarma, D.; Pandey, P.K. Striking a balance between conservation and development: A geospatial approach to watershed prioritisation in the Himalayan Basin. Conservation 2023, 3, 460–490. [Google Scholar] [CrossRef]
  67. Dimple, D.; Rajput, J.; Al-Ansari, N.; Elbeltagi, A.; Zerouali, B.; Santos, C.A.G. Determining the hydrological behaviour of catchment based on quantitative morphometric analysis in the hard rock area of Nand Samand Catchment, Rajasthan, India. Hydrology 2022, 9, 31. [Google Scholar] [CrossRef]
  68. Sukristiyanti, S.; Maria, R.; Lestiana, H. Watershed-based morphometric analysis: A review. IOP Conf. Ser. Earth Environ. Sci. 2018, 118, 012028. [Google Scholar] [CrossRef]
  69. Shekar, P.R.; Mathew, A. Morphometric Analysis of Watersheds: A Comprehensive Review of Data Sources, Quality, and Geospatial Techniques. Watershed Ecol. Environ. 2024, 6, 13–25. [Google Scholar] [CrossRef]
  70. Pareta, K.; Pareta, U. Quantitative morphometric analysis of a watershed of Yamuna basin, India using ASTER (DEM) data and GIS. Int. J. Geomat. Geosci. 2011, 2, 248. [Google Scholar]
  71. Ullah, S.; Iqbal, M.; Waseem, M.; Abbas, A.; Masood, M.; Nabi, G.; Tariq, M.A.U.R.; Sadam, M. Potential Sites for Rainwater Harvesting Focusing on the Sustainable Development Goals Using Remote Sensing and Geographical Information System. Sustainability 2024, 16, 9266. [Google Scholar] [CrossRef]
  72. Chandrashekar, H.; Lokesh, K.; Sameena, M.; Roopa, J.; Ranganna, G. Coastal and Ocean Engineering (Mangalore). In Proceedings of the 2015 International Conference on Water Resources and Environment, Beijing, China, 25–28 July 2015; pp. 1345–1353. [Google Scholar]
  73. Makhamreh, Z.; Al-Hawary, M.; Odeh, S. Assessment of morphometric characteristics of Wadi Al-Shumar catchment in Jordan. Open J. Geol. 2020, 10, 155. [Google Scholar] [CrossRef]
  74. Maqsoom, A.; Aslam, B.; Khalid, N.; Ullah, F.; Anysz, H.; Almaliki, A.H.; Almaliki, A.A.; Hussein, E.E. Delineating groundwater recharge potential through remote sensing and geographical information systems. Water 2022, 14, 1824. [Google Scholar] [CrossRef]
  75. Bashir, B.; Alsalman, A. Identifying Soil Erosion-Prone Areas in the Wadi Haly Catchment, Saudi Arabia Using Morphometric Analysis and Watershed Features. Appl. Sci. 2024, 14, 10854. [Google Scholar] [CrossRef]
  76. Benzougagh, B.; Meshram, S.G.; Dridri, A.; Boudad, L.; Baamar, B.; Sadkaoui, D.; Khedher, K.M. Identification of critical watershed at risk of soil erosion using morphometric and geographic information system analysis. Appl. Water Sci. 2022, 12, 8. [Google Scholar] [CrossRef]
  77. Tukura, N.G.; Akalu, M.M.; Hussein, M.; Befekadu, A. Morphometric analysis and sub-watershed prioritization of Welmal watershed, Ganale-Dawa River Basin, Ethiopia: Implications for sediment erosion. J. Sediment. Environ. 2021, 6, 121–130. [Google Scholar] [CrossRef]
  78. Qiu, H.; Cui, P.; Regmi, A.D.; Hu, S.; Zhang, Y.; He, Y. Landslide distribution and size versus relative relief (Shaanxi Province, China). Bull. Eng. Geol. Environ. 2018, 77, 1331–1342. [Google Scholar] [CrossRef]
  79. Bhunia, G.S.; Samanta, S.; Pal, B. Quantitative analysis of relief characteristics using space technology. Int. J. Phys. Soc. Sci. 2012, 2, 350–365. [Google Scholar]
  80. Pareta, K.; Pareta, U. Quantitative geomorphological analysis of a watershed of Ravi River basin, HP India. Int. J. Remote Sens. GIS 2012, 1, 47–62. [Google Scholar]
  81. FAO. World Reference Base for Soil Resources, 2006: A Framework for International Classification, Correlation, and Communication; Food and Agriculture Organization of the United Nations: Rome, Italy, 2006; Volume 103. [Google Scholar]
  82. López-Ramos, A.; Medrano-Barboza, J.P.; Martínez-Acosta, L.; Acuña, G.J.; Remolina López, J.F.; López-Lambraño, A.A. Assessment of morphometric parameters as the basis for hydrological inferences in water resource management: A case study from the sinú river basin in Colombia. ISPRS Int. J. Geo-Inf. 2022, 11, 459. [Google Scholar] [CrossRef]
  83. Dash, B.; Nagaraju, M.; Sahu, N.; Nasre, R.; Mohekar, D.; Srivastava, R.; Singh, S. Morphometric analysis for planning soil and water conservation measures using geospatial technique. Int. J. Curr. Microbiol. Appl. Sci. 2019, 8, 2719–2728. [Google Scholar] [CrossRef]
  84. Godif, G.; Manjunatha, B. Prioritizing sub-watersheds for soil and water conservation via morphometric analysis and the weighted sum approach: A case study of the Geba river basin in Tigray, Ethiopia. Heliyon 2022, 8, e12261. [Google Scholar] [CrossRef] [PubMed]
  85. Kaewdum, N.; Chotpantarat, S. Mapping potential zones for groundwater recharge using a GIS technique in the lower Khwae Hanuman Sub-Basin Area, Prachin Buri Province, Thailand. Front. Earth Sci. 2021, 9, 717313. [Google Scholar] [CrossRef]
  86. Sakthivel, R.; Jawahar Raj, N.; Sivasankar, V.; Akhila, P.; Omine, K. Geo-spatial technique-based approach on drainage morphometric analysis at Kalrayan Hills, Tamil Nadu, India. Appl. Water Sci. 2019, 9, 24. [Google Scholar] [CrossRef]
  87. Khosh Bin Ghomash, S.; Bachmann, D.; Caviedes-Voullième, D.; Hinz, C. Impact of rainfall movement on flash flood response: A synthetic study of a semi-arid mountainous catchment. Water 2022, 14, 1844. [Google Scholar] [CrossRef]
  88. Alsaihani, M.; Alharbi, R. Mapping of Soil Erosion Vulnerability in Wadi Bin Abdullah, Saudi Arabia through RUSLE and Remote Sensing. Water 2024, 16, 2663. [Google Scholar] [CrossRef]
  89. Bashir, B.; Alsalman, A. Morphometric and Soil Erosion Characterization Based on Geospatial Analysis and Drainage Basin Prioritization of the Rabigh Area Along the Eastern Red Sea Coastal Plain, Saudi Arabia. Sustainability 2024, 16, 9008. [Google Scholar] [CrossRef]
Figure 1. Geographical location map of the investigated area.
Water 17 01463 g001
Figure 2. Digital elevation model (DEM) representation of the Arabian Peninsula.
Water 17 01463 g002
Figure 3. Utilization of a geographic information system (GIS)-based approach for morphometric analysis in the research area.
Water 17 01463 g003
Figure 9. Stream orders for the Arabian Peninsula utilizing Strahler’s method.
Water 17 01463 g009
Figure 10. Stream order depiction for each individual basin.
Water 17 01463 g010
Figure 11. The logarithmic correlation between the number of streams and their order.
Water 17 01463 g011
Figure 12. The logarithmic correlation between the cumulative length of a stream and its order.
Water 17 01463 g012
Figure 13. Radar plot of specific areal morphometric aspects.
Water 17 01463 g013
Figure 14. Drainage density map of the Arabian Peninsula.
Water 17 01463 g014
Figure 15. Supervised LULC map of the Arabian Peninsula.
Water 17 01463 g015
Figure 16. Precipitation classes map of the Arabian Peninsula.
Water 17 01463 g016
Figure 17. The research region’s hypsometric curve.
Water 17 01463 g017
Figure 18. Illustration depicting the longitudinal profile of the area under investigation.
Water 17 01463 g018
Figure 19. The longitudinal profile measurements for the study area.
Water 17 01463 g019
Figure 20. Soil texture map of the Arabian Peninsula.
Water 17 01463 g020
Table 1. Fundamental morphometric parameter values and computational techniques.
P a r a m e t e r s F o r m u l a / D e f i n i t i o n R e f e r e n c e s
L i n e a r S t r e a m   o r d e r   ( u ) Hierarchical rankStrahler [47]
S t r e a m   n u m b e r (Nu)Nu = Rb(k–u)
where Rb = bifurcation ratio; k = highest order of the basin; u = basin order
Horton [43]
S t r e a m   l e n g t h (Lu)Length of the stream (km)Horton [43]
M e a n   s t r e a m   l e n g t h (Lsm)Lsm = Lu/Nu
where Lu = total stream length of order u (km)
Nu = total number of stream segments of order u
Strahler [47]
S t r e a m   l e n g t h   r a t i o (RL)RL = Lsmu/(Lsmu − 1)
where Lsmu = mean stream length of order u; Lsmu − 1 = mean stream length of its next lower order
Horton [43]
B i f u r c a t i o n   r a t i o (Rb)Rb = Nu/(Nu +1)
where Nu = total number of stream segments of the order u
Nu + 1 = number of segments of the next higher order
Schumm [46]
M e a n   b i f u r c a t i o n   r a t i o (Rbm)Rbm = average of bifurcation ratios of all ordersStrahler [47]
L e n g t h   o f   o v e r l a n d   f l o w (Lg)Lg = 1/(2 × Dd) (km)
where Lg = length of overland flow and Dd = drainage density
Horton [43]
A r e a l B a s i n   l e n g t h (Lb)The longest dimension of the basin which parallels to the principal drainage (km)Schumm [46]
B a s i n   p e r i m e t e r   ( P ) Total length of outer boundary of drainage basin (km)Schumm [46]
B a s i n   a r e a   ( A ) Area of the basin (km2)Strahler [47]
F o r m   f a c t o r (Rf)Rf = A/Lb2
where A = basin area (km2); Lb2 = square of basin length
Horton [42]
E l o n g a t i o n   r a t i o (Re)Re = 2√(A/π)/Lb
where A= area of the basin (km2); Lb = basin length (km)
Schumm [46]
C i r c u l a r i t y   r a t i o (Rc)Rc = 4πA/P2
where A = basin area (km2); P2 = square of basin perimeter
Miller [45]
D r a i n a g e   d e n s i t y (Dd)Dd = L/A (km/km2)
where L = total length of stream segments of a basin (km)
A = basin area (km2)
Horton [42]
S t r e a m   f r e q u e n c y (Fs)Fs = Nu/A
where Nu = total number of stream segments of all orders
A = basin area (km2)
Horton [42]
D r a i n a g e   t e x t u r e (Dt)Dt = Nu/P
where Nu = total number of stream segments of all orders
P = basin perimeter (km)
Horton [43]
I n f i l t r a t i o n   n u m b e r (If)If = Dd × Fs
where Dd = drainage density, Fs = stream frequency
Zavoiance [50]
R e l i e f M a x i m u m   r e l i e f   ( Z ) The highest elevation at the source of the basinGIS platform
Minimum relief (z)The lowest elevation at the mouth of the basinGIS platform
Mean relief (Ź)Statistical analysisStatistical analysis
Total relief (H)H = Z − zStrahler [44]
Relative relief (R)R = H/P
where H = Total basin relief
P = perimeter of the basin
Melton [51]
Relief ratio (Rh)Rh = H/Lb
where H = Total basin relief
Lb = maximum basin length
Schumm [46]
Hypsometric integral (HI)(Ź − z)/(Z − z)Pike and Wilson [52]
Gradient ratio (Rg)Rg = (Z − z)/Lb
where Z = elevation at source
z = elevation at mouth
Lb = length of main stream
Sreedevi, Subrahmanyam [53]
Table 2. Watershed classification and enumeration in the Arabian Peninsula based on criteria by Singh [54] and Chelladurai and BharaniPriya [55].
CategorySize (km2)Count
Basin>20,00012
Catchment>10,000–20,00014
Sub-catchment>2000–10,00076
Watershed>500–2000164
Sub-watershed>100–500372
Mili-watershed>10–1001321
Micro-watershed5–10783
Mini-watershed<561,761
Table 3. Linear metrics for transboundary basins across the entire study area.
Basin.
No. *
Stream
Order
Stream
Number
Total Stream
Length (km)
Mainstream Length (km)Mean Bifurcation RatioLength of Over Land Flow (km)Shared
Countries
172714141,096543.74.5KSA, Oman, Yemen, UAE
2557019,6898904.87.0KSA, Kuwait
3536212,1802924.27.0KSA
4532411,0928994.17.2KSA, UAE
5535211,1277314.16.7Yemen
6530081895903.98.0KSA
7515958526163.46.8KSA, Kuwait
851234415393.26.3KSA
948943583574.24.9KSA
1046924811373.76.6Oman
1148423341054.06.9KSA
124531895693.76.5KSA
Note: * is the basin code.
Table 4. Stream counts for each order in the Arabian Peninsula.
Stream OrderStream NumberMin. Stream Number 1Max. Stream Number 2
15366402045
2128610502
33002120
469135
51619
6222
7111
Note: 1 The lower limit of streams in a single basin for this particular order. 2 The upper limit of streams in a single basin for this particular order.
Table 5. In-depth analysis of areal morphometric parameters in the study region.
Basin No. *Basin Length (km)Perimeter (km)Area (km2)Stream FrequencyDrainage Texture
1216781011,261,8470.0020.34
212693815275,1700.0020.15
310773332171,5830.0020.11
414223775159,1760.0020.09
512083028148,7670.0020.12
69322761130,5320.0020.11
7938219079,6580.0020.07
8712175155,5770.0020.07
9690179242,5310.0020.05
10386122632,5230.0020.06
11383119031,9810.0030.07
12545114924,8140.0020.05
Note: * is the basin code.
Table 6. The comprehensive set of relief morphometric measures pertaining to the research area.
Basin No. *Minimum Relief (m)Mean
Relief (m)
Maximum Relief (m)Total
Relief (m)
Relief
Ratio
Relative Relief (m)Dissection IndexHypsometric IntegralGradient
Ratio
105749509500.0000.011.00.600.018
2218850125210340.0010.030.80.610.001
350983312247150.0010.020.60.450.002
40725100210020.0010.031.00.720.001
501233172117210.0010.061.00.720.002
608909569560.0010.041.00.930.002
705046926920.0010.031.00.730.001
813646576560.0010.041.00.550.017
93557589816260.0010.040.60.640.002
1001272412410.0010.021.00.530.002
11676104312275510.0010.050.50.670.005
1223005625600.0010.051.00.530.008
Note: * is the basin code.
Table 7. The geological stages of basin development, as depicted using hypsometric integral by Radwan and Alazba [22].
Geologic   Stages %   of   Hypsometric   Integrals
Old30
Mature30–60
Youth60–80
Middle80–100
Initial100
Disclaimer/Publisher’s Note: The statements, opinions and data contained in all publications are solely those of the individual author(s) and contributor(s) and not of MDPI and/or the editor(s). MDPI and/or the editor(s) disclaim responsibility for any injury to people or property resulting from any ideas, methods, instructions or products referred to in the content.

