
Risk Colored Snake (RCS): An Innovative Method for Evaluating Flooding Risk of Linear Hydraulic Infrastructures

 ,
,  ,
, 
 ,
,  and
and
Abstract
1. Introduction
2. Materials
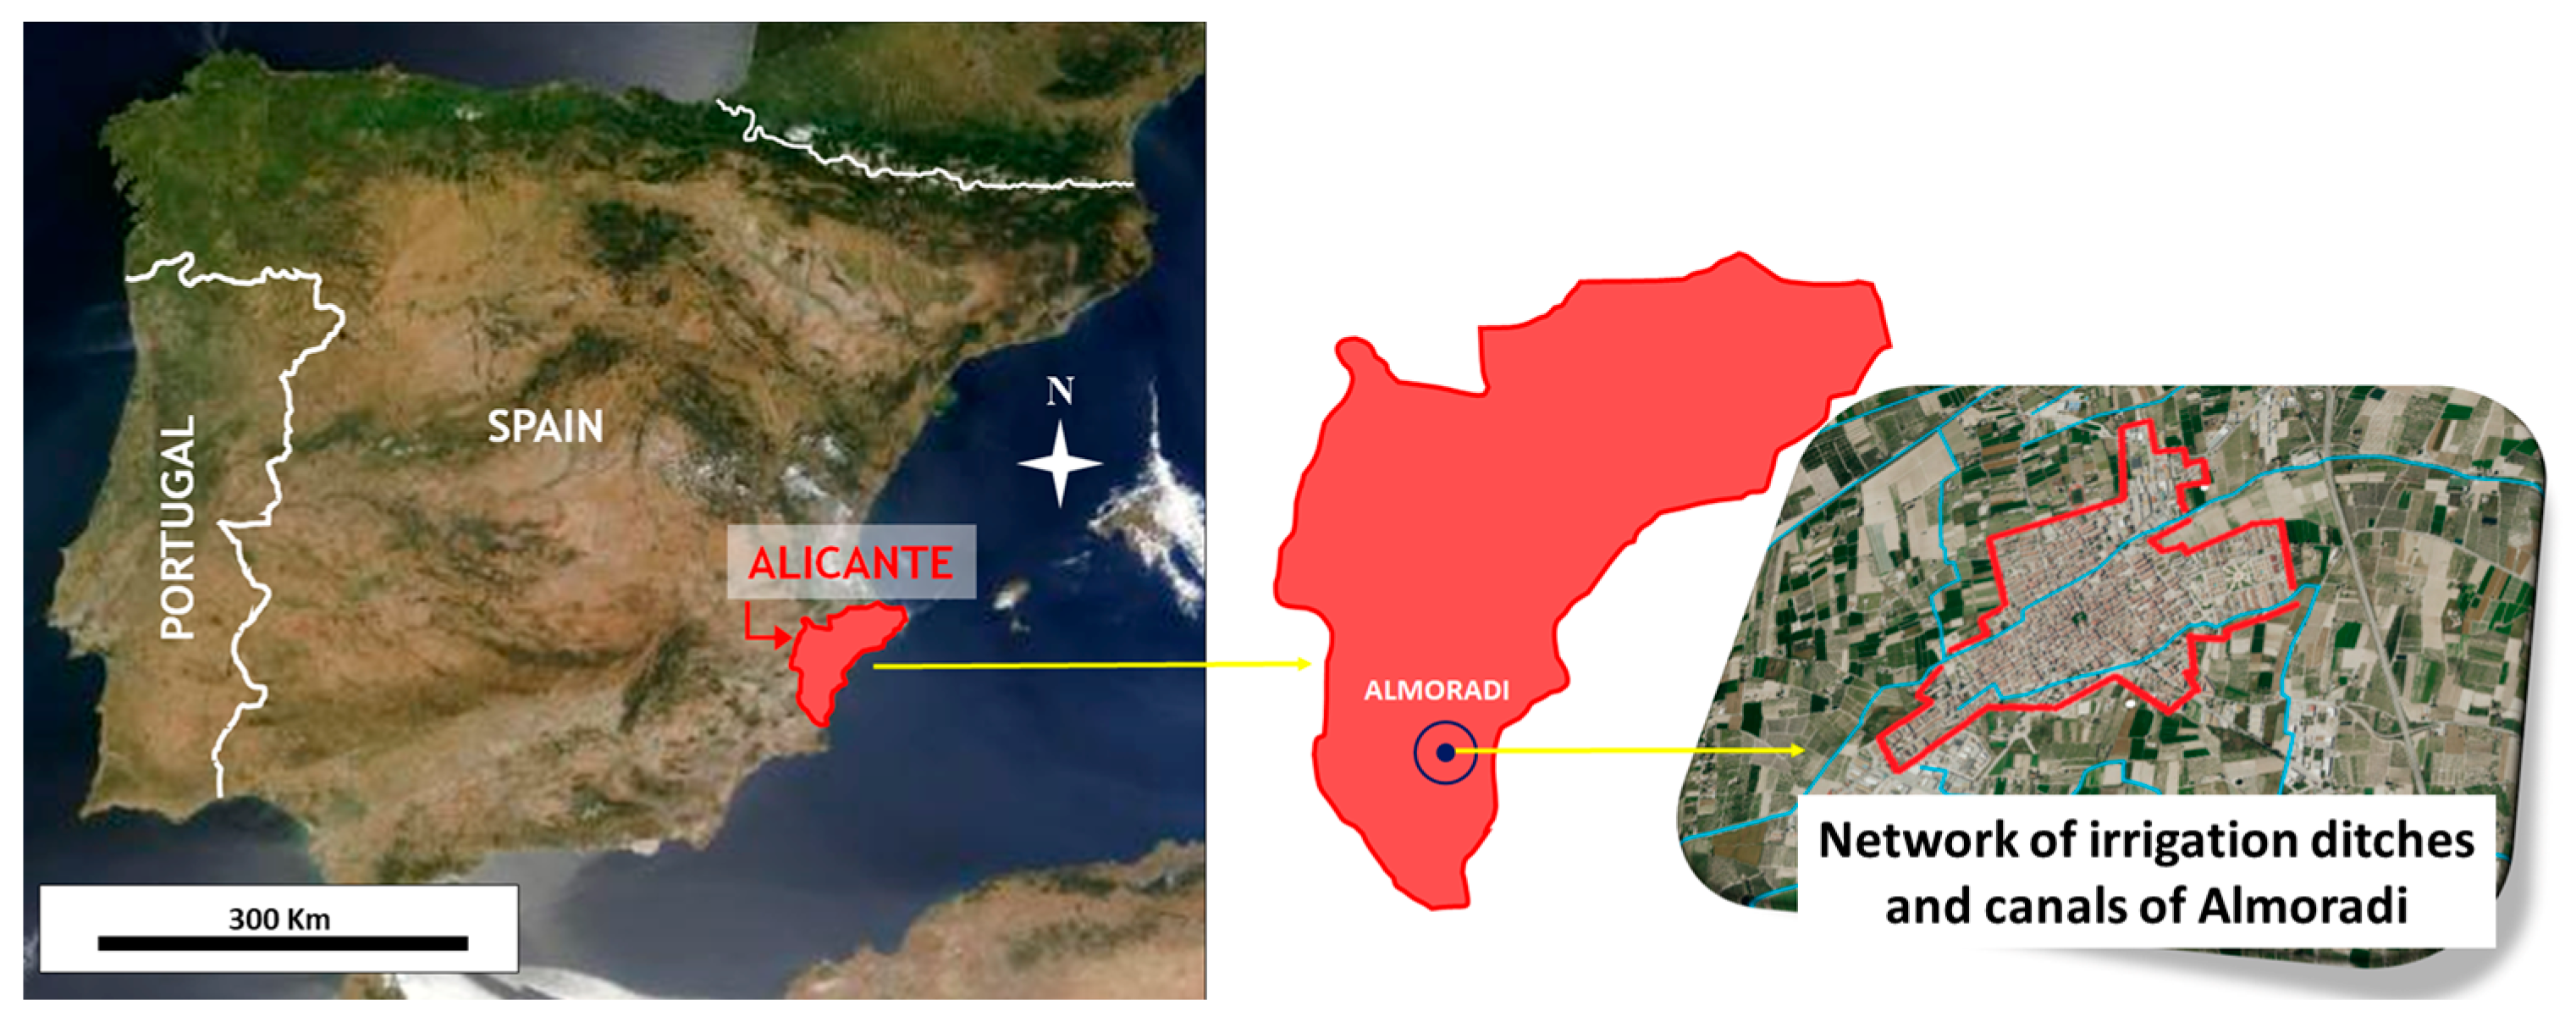
2.1. Case Study
2.2. Flood Hazards Cartography Considered
2.3. Data Acquisition
2.4. Software and Tools
3. Methodology
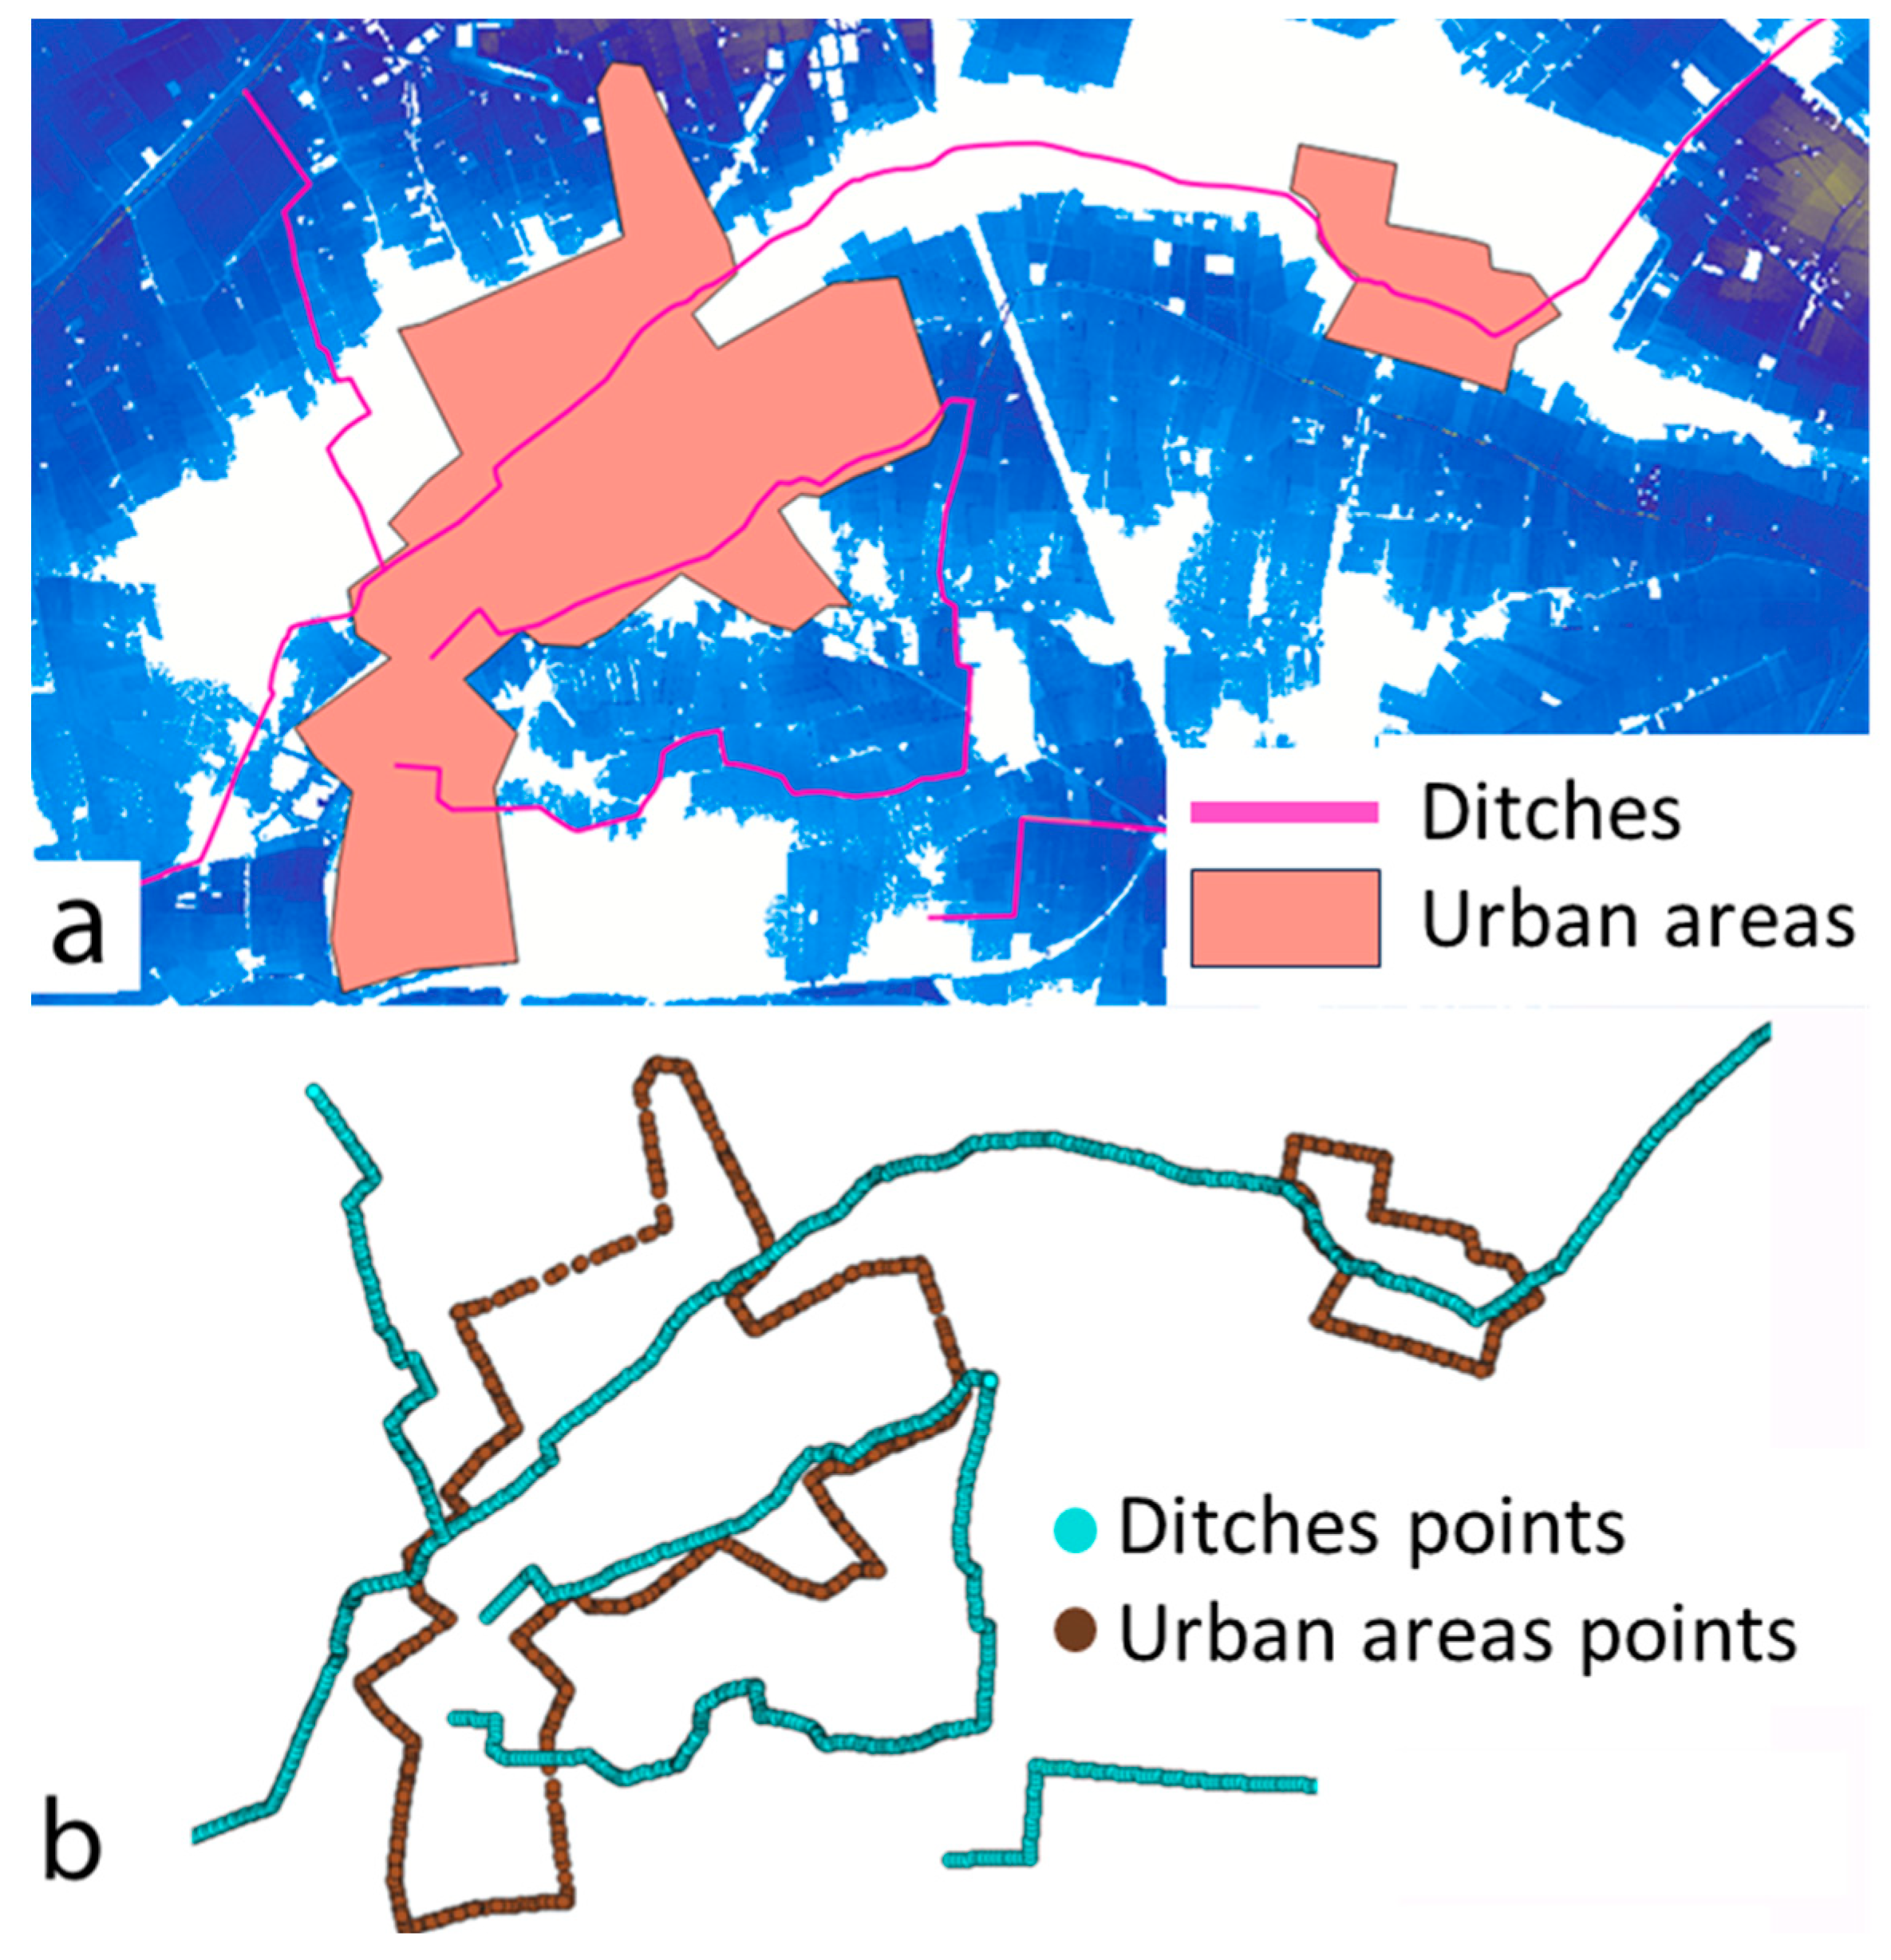
3.1. Step 1: Topological Process
3.2. Step 2: Parameter Calculation
3.3. Step 3: Risk Calculation
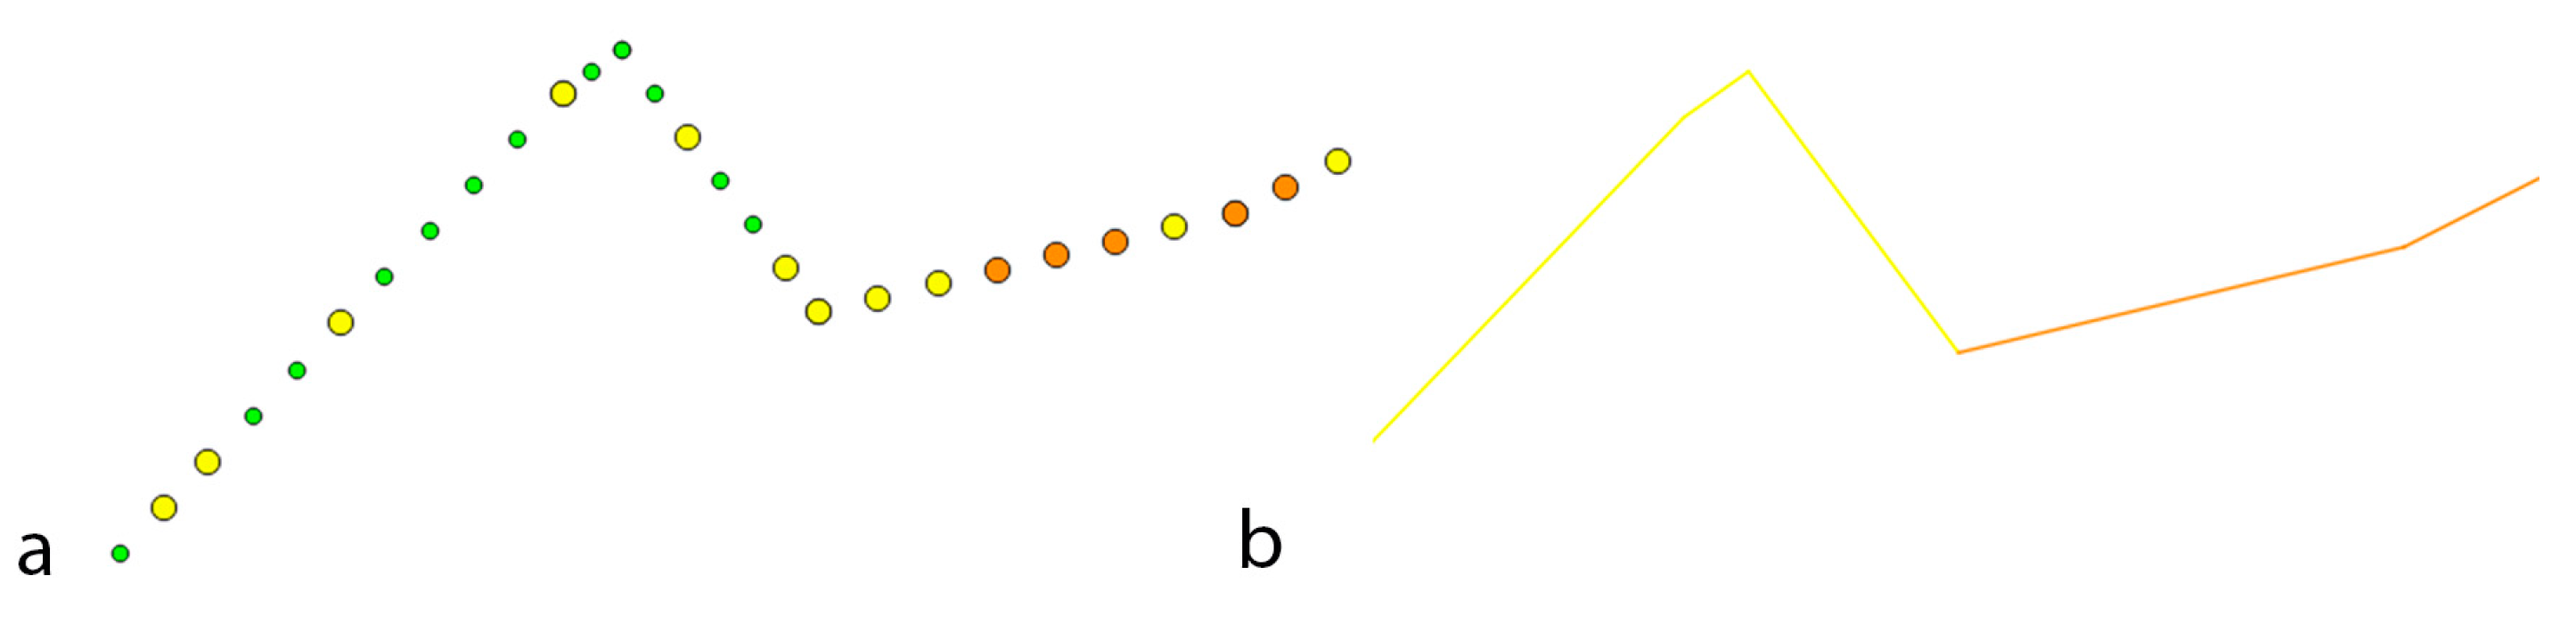
3.4. Step 4: Risk Colored Snakes (RCSs) Generation
4. Results
4.1. Influence of “K” Parameter
4.2. Influence of Discretization Distance
5. Discussion
6. Conclusions
Author Contributions
Funding
Data Availability Statement
Acknowledgments
Conflicts of Interest
References
- Ogie, R.I.; Holderness, T.; Dunn, S.; Turpin, E. Assessing the vulnerability of hydrological infrastructure to flood damage in coastal cities of developing nations. Comput. Environ. Urban Syst. 2018, 68, 97–109. [Google Scholar] [CrossRef]
- Arrighi, C.; Pregnolato, M.; Castelli, F. Indirect flood impacts and cascade risk across interdependent linear infrastructures. Nat. Hazard. Earth Syst. Sci. 2021, 21, 1955–1969. [Google Scholar] [CrossRef]
- Valipour, M.; Krasilnikof, J.; Yannopoulos, S.; Kumar, R.; Deng, J.; Roccaro, P.; Mays, L.; Grismer, M.E.; Angelakis, A.N. The Evolution of Agricultural Drainage from the Earliest Times to the Present. Sustainability 2020, 12, 416. [Google Scholar] [CrossRef]
- Chen, P. On the Diversity-Based Weighting Method for Risk Assessment and Decision-Making about Natural Hazards. Entropy 2019, 21, 269. [Google Scholar] [CrossRef]
- Barros, V.R.; Field, C.B.; Dokke, D.J.; Mastrandrea, M.D.; Mach, K.J.; Bilir, T.E.; Chatterjee, M.; Ebi, K.L.; Estrada, Y.O.; Genova, R.C. IPCC. Climate Change 2014: Impacts, Adaptation, and Vulnerability. Part B: Regional Aspects; Contribution of Working Group II to the Fifth Assessment Report of the Intergovernmental Panel on Climate Change; Cambridge University Press: Cambridge, UK; New York, NY, USA, 2014. [Google Scholar]
- Jongman, B.; Hochrainer-Stigler, S.; Feyen, L.; Aerts, J.C.J.H.; Mechler, R.; Wouter Botzen, W.J.; Bouwer, L.M.; Pflug, G.; Rojas, R.; Ward, P.J. Increasing stress on disaster-risk finance due to large floods. Nat. Clim. Chang. 2014, 4, 264–268. [Google Scholar] [CrossRef]
- Zazo, S.; Rodríguez-Gonzálvez, P.; Molina, J.-L.; González-Aguilera, D.; Agudelo-Ruiz, C.; Hernández-López, D. Flood Hazard Assessment Supported by Reduced Cost Aerial Precision Photogrammetry. Remote Sens. 2018, 10, 1566. [Google Scholar] [CrossRef]
- Insurance Compensation Consortium. Available online: https://www.consorseguros.es/web/documents/10184/44193/Estadistica_Riesgos_Extraordinarios_1971_2014/14ca6778-2081-4060-a86d-728d9a17c522 (accessed on 20 May 2023).
- Kron, W. Flood Risk=Hazard•Values•Vulnerability. Water Int. 2005, 30, 58–68. [Google Scholar] [CrossRef]
- Kappes, M.S.; Keiler, M.; von Elverfeldt, K.; Glade, T. Challenges of analyzing multi-hazard risk: A review. Nat. Hazard. 2012, 64, 1925–1958. [Google Scholar] [CrossRef]
- Mladineo, N.; Mladineo, M.; Benvenuti, E.; Kekez, T.; Nikolić, Ž. Methodology for the Assessment of Multi-Hazard Risk in Urban Homogenous Zones. Appl. Sci. 2022, 12, 12843. [Google Scholar] [CrossRef]
- Criado, M.; Martínez-Graña, A.; San Román, J.; Santos-Francés, F. Flood Risk Evaluation in Urban Spaces: The Study Case of Tormes River (Salamanca, Spain). Int. J. Environ. Res. Public Health 2018, 16, 5. [Google Scholar] [CrossRef] [PubMed]
- Davoine, P.A.; Arnaud, A.; Gensel, J.; Martin, H. A tool for historical cartography about natural hazards. In Proceedings of the 22nd International Cartographic Conference, A Coruña, Spain, 9–16 July 2005. [Google Scholar]
- Kellens, W.; Vanneuvile, W.; Ooms, K.; De Maeyer, P. Communicating flood risk to the public by cartography. In Proceedings of the 24th International Cartographic Conference, Santiago, Chile, 15–21 November 2009. [Google Scholar]
- Ministerio Para la Transformación Ecológica y el Reto Demográfico. Available online: https://www.miteco.gob.es/es/agua/temas/gestion-de-los-riesgos-de-inundacion/guia-evaluacion-resiliencia-nucleos-urbanos-riesgo-inundacion_tcm30-503725.pdf (accessed on 10 April 2023).
- Milanesi, L.; Pilotti, M.; Ranzi, R. A Conceptual Model of People’s Vulnerability to Floods. Water Resour. Res. 2015, 51, 182–197. [Google Scholar] [CrossRef]
- Zazo, S.; Molina, J.-L.; Macian-Sorribes, H.; Pulido-Velazquez, M. Assessment of the predictability of inflow to reservoirs through Bayesian Causality. Hydrol. Sci. J. 2023, 68, 1323–1337. [Google Scholar] [CrossRef]
- Oliva Cañizares, A.; Sainz-Pardo Trujillo, A.; Sánchez Almodóvar, E. La Cartografía de Vulnerabilidad Como Base de Los Planes de Emergencia: Análisis-Diagnóstico del Término Municipal de Daya Vieja (Alicante); University of Alicante: Alicante, Spain, 2020. [Google Scholar]
- Abellán Contreras, F. Medidas y Acciones Preventivas Contra Inundaciones en la Cuenca Del Segura: Una Perspectiva Histórico-Jurídica; University of Alicante: Alicante, Spain, 2020. [Google Scholar]
- Maurandi Guirado, A.; Romero Díaz, M.A. Las Inundaciones en la Cuenca Del Segura en Las Dos Últimas Décadas Del Siglo xx. Actuaciones de Prevención; Serie Geográfica; University of Alcala de Henares: Álcala de Henares, Spain, 2020; pp. 93–120. [Google Scholar]
- Canales Martínez, G. Avenamiento y Utilización de Aguas Muertas. La Cultura Del Agua en la Cuenca Del Segura (Murcia); Fundación Cajamurcia: Murcia, Spain, 2004; pp. 439–477. [Google Scholar]
- Morato, J.V.B.G.; Oxinaga, P.I.M.; Abdilla, J.M. Corredores Hidráulicos Verdes y Lagunas de Laminación en la Vega Baja Del Segura. Inundaciones y Sequías: Análisis Multidisciplinar Para Mitigar el Impacto de Los Fenómenos Climáticos Extremos; University of Alicante: Alicante, Spain, 2021; pp. 471–492. [Google Scholar]
- Brémond, P.; Grelot, F.; Agenais, A.L. Economic evaluation of flood damage to agriculture–review and analysis of existing methods. Nat. Hazard. Earth Syst. Sci. 2013, 13, 2493–2512. [Google Scholar] [CrossRef]
- Cohen, A.N.; Fishhendler, I. An archetype for insurance thresholds for extreme natural events in the agricultural sector. Clim. Risk Manag. 2022, 36, 100434. [Google Scholar] [CrossRef]
- Cronología de Riadas en la Cuenca Del Segura. Available online: https://www.chsegura.es/es/confederacion/unpocodehistoria/cronologia-de-riadas-en-la-cuenca-del-Segura (accessed on 22 May 2023).
- Olcina-Cantos, J. Inundaciones de Septiembre de 2019 en la Vega Baja Del Segura. La Oportunidad Del Plan “Vega Renhace”; University of Alicante: Alicante, Spain, 2019. [Google Scholar]
- Pedreño, J.; Lucas, I.G. Los Servicios Ecosistémicos Del Suelo y su Papel en la Mitigación de Las Inundaciones; University of Miguel Hernández : Elche, Spain, 2021. [Google Scholar]
- Ojeda, A.O.; Ortiz, M.I.; Melgarejo, J. Crecidas, inundaciones y resiliencia: Restauración fluvial contra los falsos mitos. In Riesgo de Inundación en España: Análisis y Soluciones Para la Generación de Territorios Resilientes; University of Alicante: Alicante, Spain, 2020; pp. 549–568. [Google Scholar]
- Olcina-Cantos, J.; Oliva Cañizares, A.; Sánchez Almodóvar, E.; Martí Talavera, J.; Biener Camacho, S. Cartografías para la acreditación del riesgo de inundaciones: SNCZI y PATRICOVA en la Comunidad Valenciana (España). GeoFocus Rev. Int. Cienc. Tecnol. Inf. Geográfica 2021, 27, 19–53. [Google Scholar] [CrossRef]
- Agroseguro. Available online: https://agroseguro.es/wp-content/uploads/2022/10/Informe_Anual_2020.pdf (accessed on 23 May 2023).
- Informe de Fundación AON España. Available online: https://fundacionaon.es/wp-content/uploads/2022/03/Informe-Coste-Catastrofes-Naturales-2016-2020.pdf (accessed on 23 April 2023).
- Trapote, A.; Roca Roca, J.F.; Mejgarejo, J. Azudes y Acueductos Del Sistema de Riego Tradicional de la Vega Baja Del Segura (Alicante, España); University of Alicante: Alicante, Spain, 2015. [Google Scholar]
- Morote Seguido, Á.F.; Gómez Espín, J.M.; Hervás Avilés, R.M. Patrimonio Hidráulico y Cultura Del Agua en el Mediterráneo. Murcia; Investigaciones Geográficas: Fundación Séneca. Regional Campus of Excellence “Campus Mare Nostrum”; Agencia Española de Cooperación Internacional para el Desarrollo: Madrid, Spain, 2012; 287p. [Google Scholar]
- PATRICOVA. Available online: https://visor.gva.es/visor/ (accessed on 25 May 2023).
- Xia, K.; Wei, C. Study on Real-Time Navigation Data Model Based on ESRI Shapefile. In Proceedings of the International Conference on Embedded Software and Systems Symposia (ICESS), Chengdu, China, 29–31 July 2008. [Google Scholar]
- Ritter, N.; Ruth, M. The GeoTiff data interchange standard for raster geographic images. Int. J. Remote Sens. 1997, 18, 1637–1647. [Google Scholar] [CrossRef]
- Centro Nacional de Información Geográfica. Información Geográfica Temática. Available online: https://centrodedescargas.cnig.es/CentroDescargas/index.jsp (accessed on 24 April 2023).
- Plan Nacional de Ortofotografía Aérea. Available online: https://pnoa.ign.es/web/portal/pnoa-lidar/especificaciones-tecnicas (accessed on 28 April 2023).
- Graser, A.; Olaya, V. Processing: A Python Framework for the Seamless Integration of Geoprocessing Tools in QGIS. ISPRS Int. J. Geo-Inf. 2015, 4, 2219–2245. [Google Scholar] [CrossRef]
- Ozgur, C.; Colliau, T.; Rogers, G.; Hughes, Z. MatLab vs. Python vs. R. J. Data Sci. 2021, 15, 355–372. [Google Scholar] [CrossRef]
- Van Rossum, G.; Drake, F.L. The Python Language Reference. Release 3.6.0; Python Software Foundation: Wilmington, DE, USA, 2017; p. 157. [Google Scholar]
- Lawhead, J. QGIS Python Programming Cookbook; Packt Publishing Ltd.: Birmingham, UK, 2015; p. 318. [Google Scholar]
- Lemenkova, P.; Debeir, O. GDAL and PROJ Libraries Integrated with GRASS GIS for Terrain Modelling of the Georeferenced Raster Image. Technologies 2023, 11, 46. [Google Scholar] [CrossRef]
- Willman, J. Modern PyQt: Create GUI Applications for Project Management, Computer Vision, and Data Analysis; Apress: Berkeley, CA, USA, 2021; pp. 1–42. [Google Scholar]
- Cox, R.J.; Shand, T.D.; Blacka, M.J. Australian Rainfall and Runoff revision project 10: Appropriate safety criteria for people. Water Res. 2010, 978, 085825-9454. [Google Scholar]
- IGA Ingeniería y Gestión del Agua (University of Salamanca, Ávila, Spain). Proyecto: SOS-AGUA XXI: Sostenibilidad, Agua y Agricultura en el Siglo XXI; Technical Report Task 1.5; University of Salamanca: Ávila, Spain, 2023. [Google Scholar]
- Ranzi, R.; Mazzoleni, M.; Milanesi, L.; Pilotti, M.; Ferri, M.; Giuriato, F.; Mikoš, M. Critical Review of Non-Structural Measures for Water-Related Risks; KULTURisk: Delft, The Netherlands, 2011; p. 42. [Google Scholar]
- Gil-Guirado, S.; Pérez-Morales, A.; Pino, D.; Peña, J.C.; Martínez, F.L. Flood impact on the Spanish Mediterranean coast since 1960 based on the prevailing synoptic patterns. Sci. Total Environ. 2022, 807, 150777. [Google Scholar] [CrossRef]
- Vietz, G.J.; Rutherfurd, I.D.; Fletcher, T.D.; Walsh, C.J. Thinking outside the channel: Challenges and opportunities for protection and restoration of stream morphology in urbanizing catchments. Landsc. Urban Plan. 2016, 145, 34–44. [Google Scholar] [CrossRef]
- Esteve, P.; Varela-Ortega, C.; Blanco-Gutiérrez, I.; Downing, T.E. A hydro-economic model for the assessment of climate change impacts and adaptation in irrigated agriculture. Ecol. Econ. 2015, 120, 49–58. [Google Scholar] [CrossRef]
- Prenger-Berninghoff, K.; Cortes, V.J.; Sprague, T.; Aye, Z.C.; Greiving, S.; Głowacki, W.; Sterlacchini, S. The connection between long-term and short-term risk management strategies for flood and landslide hazards: Examples from land-use planning and emergency management in four European case studies. Nat. Hazard. Earth Syst. Sci. 2014, 14, 3261–3278. [Google Scholar] [CrossRef]


| “q” Parameter | “K” Parameter | ||
|---|---|---|---|
| Depth 1 | “q” Value | Urban Area Distance (d 1) | “K” Value |
| Depth = 0 | 0 | d ≥ 2000 | 1 |
| 0 < Depth ≤ 0.5 | 5 | 1000 ≤ d < 2000 | 2 |
| 0.5 < Depth ≤ 1.0 | 10 | 500 ≤ d < 1000 | 3 |
| 1.0 < Depth ≤ 1.5 | 15 | 100 ≤ d < 500 | 4 |
| Depth > 1.5 | 20 | 0 ≤ d < 100 or urban zone | 5 |
| Risk Value/Assessment | Color Coding | |
|---|---|---|
| [0, 5) | No risk | |
| [5, 10) | Low risk | |
| [10, 15) | Medium risk | |
| [15, 20) | High risk | |
| [20, 25] | Extreme risk | |
| Name | Depth * | Rbase | Inside Polygon | Distance * | “K” Parameter | Risk |
|---|---|---|---|---|---|---|
| 1. Major Ditch | 0.059 | 5 | False | 317.884 | 4 | 9 |
| 2. Major Ditch | 0.957 | 10 | False | 103.205 | 4 | 14 |
| 3. Major Ditch | 1.018 | 15 | False | 99.184 | 5 | 20 |
| 4. Calvario Ditch | 0.000 | 0 | True | 123.631 | 5 | 5 |
| 5. Calvario Ditch | 0.433 | 5 | True | 122.179 | 5 | 10 |
| 6. Calvario Ditch | 0.569 | 10 | True | 11.617 | 5 | 15 |
| 7. Calvario Ditch | 0.000 | 0 | True | 98.146 | 5 | 5 |
Disclaimer/Publisher’s Note: The statements, opinions and data contained in all publications are solely those of the individual author(s) and contributor(s) and not of MDPI and/or the editor(s). MDPI and/or the editor(s) disclaim responsibility for any injury to people or property resulting from any ideas, methods, instructions or products referred to in the content. |
© 2024 by the authors. Licensee MDPI, Basel, Switzerland. This article is an open access article distributed under the terms and conditions of the Creative Commons Attribution (CC BY) license (https://creativecommons.org/licenses/by/4.0/).
Share and Cite
Molina, J.-L.; Zazo, S.; Espejo, F.; Patino-Alonso, C.; Blanco-Gutiérrez, I.; Zarzo, D. Risk Colored Snake (RCS): An Innovative Method for Evaluating Flooding Risk of Linear Hydraulic Infrastructures. Water 2024, 16, 506. https://doi.org/10.3390/w16030506
Molina J-L, Zazo S, Espejo F, Patino-Alonso C, Blanco-Gutiérrez I, Zarzo D. Risk Colored Snake (RCS): An Innovative Method for Evaluating Flooding Risk of Linear Hydraulic Infrastructures. Water. 2024; 16(3):506. https://doi.org/10.3390/w16030506
Chicago/Turabian StyleMolina, José-Luis, Santiago Zazo, Fernando Espejo, Carmen Patino-Alonso, Irene Blanco-Gutiérrez, and Domingo Zarzo. 2024. "Risk Colored Snake (RCS): An Innovative Method for Evaluating Flooding Risk of Linear Hydraulic Infrastructures" Water 16, no. 3: 506. https://doi.org/10.3390/w16030506
APA StyleMolina, J.-L., Zazo, S., Espejo, F., Patino-Alonso, C., Blanco-Gutiérrez, I., & Zarzo, D. (2024). Risk Colored Snake (RCS): An Innovative Method for Evaluating Flooding Risk of Linear Hydraulic Infrastructures. Water, 16(3), 506. https://doi.org/10.3390/w16030506