Article

Changes in the Hydrological Characteristics of the Attabad Landslide-Dammed Lake on the Karakoram Highway

1
Xining Natural Resources Comprehensive Survey Center, China Geological Survey, Xining 810000, China
2
Qinghai Province Key Laboratory of Physical Geography and Environmental Process, College of Geographical Science, Qinghai Normal University, Xining 810000, China
3
Key Laboratory of Tibetan Plateau Land Surface Processes and Ecological Conservation (Ministry of Education), Qinghai Normal University, Xining 810000, China
*
Author to whom correspondence should be addressed.
Water 2024, 16(5), 714; https://doi.org/10.3390/w16050714
Submission received: 19 January 2024 / Revised: 23 February 2024 / Accepted: 27 February 2024 / Published: 28 February 2024
(This article belongs to the Special Issue Water, Geohazards, and Artificial Intelligence)

Abstract

:
Understanding the evolving hydrological characteristics of landslide-induced barrier lakes is crucial for flood control, forecasting, early warning, and safety measures in reservoir areas. This study examines the changes in the hydrological characteristics of the Attabad landslide-dammed lake over the past decade after the occurrence of the landslide, focusing on lake area dynamics and sediment concentration. High-resolution satellite images from QuickBird, Pleiades, and WorldView2 over seven periods were analyzed. The findings indicate that the lake area has gradually decreased, with the center of mass shifting towards the lake dam, indicating a trend towards stability. The suspended sediment in the barrier lake is distributed in a strip running from north to south, then northeast to southwest, with the sediment concentration decreasing from the lake entrance to the dam and from the lake bank to the center. Over time, the average sediment concentration has decreased from 2010 to 2020, with higher concentrations in summer than in winter. Notably, during the 2017–2020 period, the lower-middle parts of the lake experienced a higher sediment concentration, while the dam area witnessed lower concentrations, thereby reducing the sediment impact on the dam. Furthermore, the sediment content in the middle of the dammed lake is relatively high, which may lead to the formation of a new dammed dam in the middle and the division of the original dammed lake into two smaller lakes, which will affect the stability of the dammed lake.

1. Introduction

The China–Pakistan Karakoram Highway (KKH) serves as the vital land route connecting China and Pakistan, starting from Kashgar, Xinjiang, China in the north, traversing the convergence of the Hindu Kush, Karakorum, and Himalayan Mountains, and reaching Takot city in Pakistan’s south [1,2,3]. At 11:30 on 4 January 2010, a giant rocky landslide (N36°18’26.6″, E74°48’54.9″) occurred in the Attabad village of the Hunza River Valley along the KKH, with a total volume of about 25 million m3 [4,5,6]. The landslide body quickly formed a barrier dam of about 1100 m in length, 600 m in width, and 200 m in visible dam height, completely blocking the Hunza River Valley, formed a barrier lake about 23 km long, buried 23 km of the KKH, caused 25 deaths, and the highway reconstruction project took 3 years to complete [7,8].
The real-time acquisition of the hydrological characteristics of the barrier lake has been a major difficulty in the process of barrier lake risk prevention and control and secondary disaster prevention and control [9,10,11]. The two most fundamental elements of the hydrology of a dammed lake are the extent of the lake area and the sedimentation [12]. Brideau et al. (2019) indicated that the lake area will be influenced by sedimentation within the lake as the overflow channel becomes more incised [12]. Knowing the extent of the lake area can help to understand the lake elements such as the water level and reservoir capacity (high-precision elevation) of the dammed lake, showing that the sediment concentration plays an important role in the outburst of the dammed lake [13,14,15]. In addition, the change of sediment accumulation in the reservoir area of the lake will also affect the movement pattern of the breach flood and the peak flow rate of the breach, so it is important to obtain the change of the area and SSC of the barrier lake in time for the prediction and early warning of the lake breach and for safety prevention [16,17,18,19,20,21]. Since the formation of the Attabad landslide-dammed lake, Chen et al. (2019) calculated the peak burst discharge of the barrier lake and the variation law of flood discharge along the break by using the formula of peak burst discharge based on the field investigation of the Attabad landslide dams and the analysis results of the incoming water and sediment data in the upper reaches of the dammed lake [22]. Chen et al. (2020) researched the formation conditions and triggering mechanism of the Attabad landslide through field investigation, which was conducted on the classic geomorphy, climate, engineering geology, hydrogeology, seism, and neotectonic movement of the Attabad village [1,4,23,24]. In response to the Attabad landslide and the KKH and railroad damaged by the barrier lake, some researchers investigated the water damage characteristics, formation causes, prevention and control principles, and main engineering measures of the highway along the river in Karakorum, as well as the design strategy of the new railroad disaster mitigation selection line [24,25,26]. In the existing literature, the research on the Attabad landslide-dammed lake is mainly focused on the formation mechanism of the landslide and the risk of lake failure, and there is a lack of research on the monitoring of the long-term series of hydrological characteristics and long-term evolutionary trends of the Attabad landslide-dammed lake. At the same time, due to the constraints of the observation methods and instruments, the complexity of suspended sediment movement on the surface of the barrier lake and other conditions, no large-scale hydrological sediment observation has been conducted in the remote Hunza Valley of northern Pakistan, and long-term monitoring of the area and SSC of the lake is lacking.
In terms of innovation, this paper is the first to study the sediment content of dammed lakes. With the development of remote sensing for lakes, remote sensing technology has been widely used for highland lake change and sea, estuarine and near-shore, lake suspended sediment monitoring studies, and many mature suspended sediment quantitative remote sensing inversion models have been established [27,28,29,30,31,32,33]. In the study of lake changes, multispectral optical remote sensing images such as Landsat MSS/TM/ETM+/OLI, Gaofen series satellites (GF-1/2), and Sentinel data (Sentine-2) have been used for the monitoring of lake area changes on the Qinghai–Tibet Plateau since the 1970s, among which, the Landsat data series are most widely used because they provide more high-quality free data [34]. In terms of suspended sediment monitoring in lakes, many researchers analyzed the spatial and temporal distribution characteristics of suspended sediment in the surface layer of marine waters using TM, ETM, MODIS, and GF-1 images [35,36,37,38,39,40,41] and conducted a study on the identification of floods with high SSCs based on remote sensing data. However, the above studies mainly focus on the water bodies with low SSCs such as lakes and sea areas for quantitative inversion, and do not focus on the water bodies of barrier lakes with high SSCs in mountainous areas, so this paper firstly draws on the mature quantitative inversion model of lake SSC to study the changes in the SSC of the lake.
In this paper, we examine the changes in the hydrological characteristics of the Attabad landslide-dammed lake over the past decade after the occurrence of the landslide, focusing on lake area dynamics and sediment concentration. Firstly, the water body index is used as a research method to extract the extent of the lake from 2010 to 2020, and to analyze the evolutionary trends of the lake in terms of its area change, landscape pattern index, and geometric features. Secondly, based on the extent of the above extracted lake, a mature remote sensing quantitative inversion model of lake suspended sediment is used to extract the relative SSC of the lake, and to analyze the spatial and temporal distribution characteristics of the suspended sediment and the dynamic changes in the SSC of the lake from 2010 to 2020, with a view to provide data references to forecast an early warning of the lake failure and provide safety prevention. This paper firstly and systematically studied the changes in the suspended sediment of the landslide-dammed lake, and this work is crucial for flood control, forecasting, early warning, and safety measures in the reservoir area.

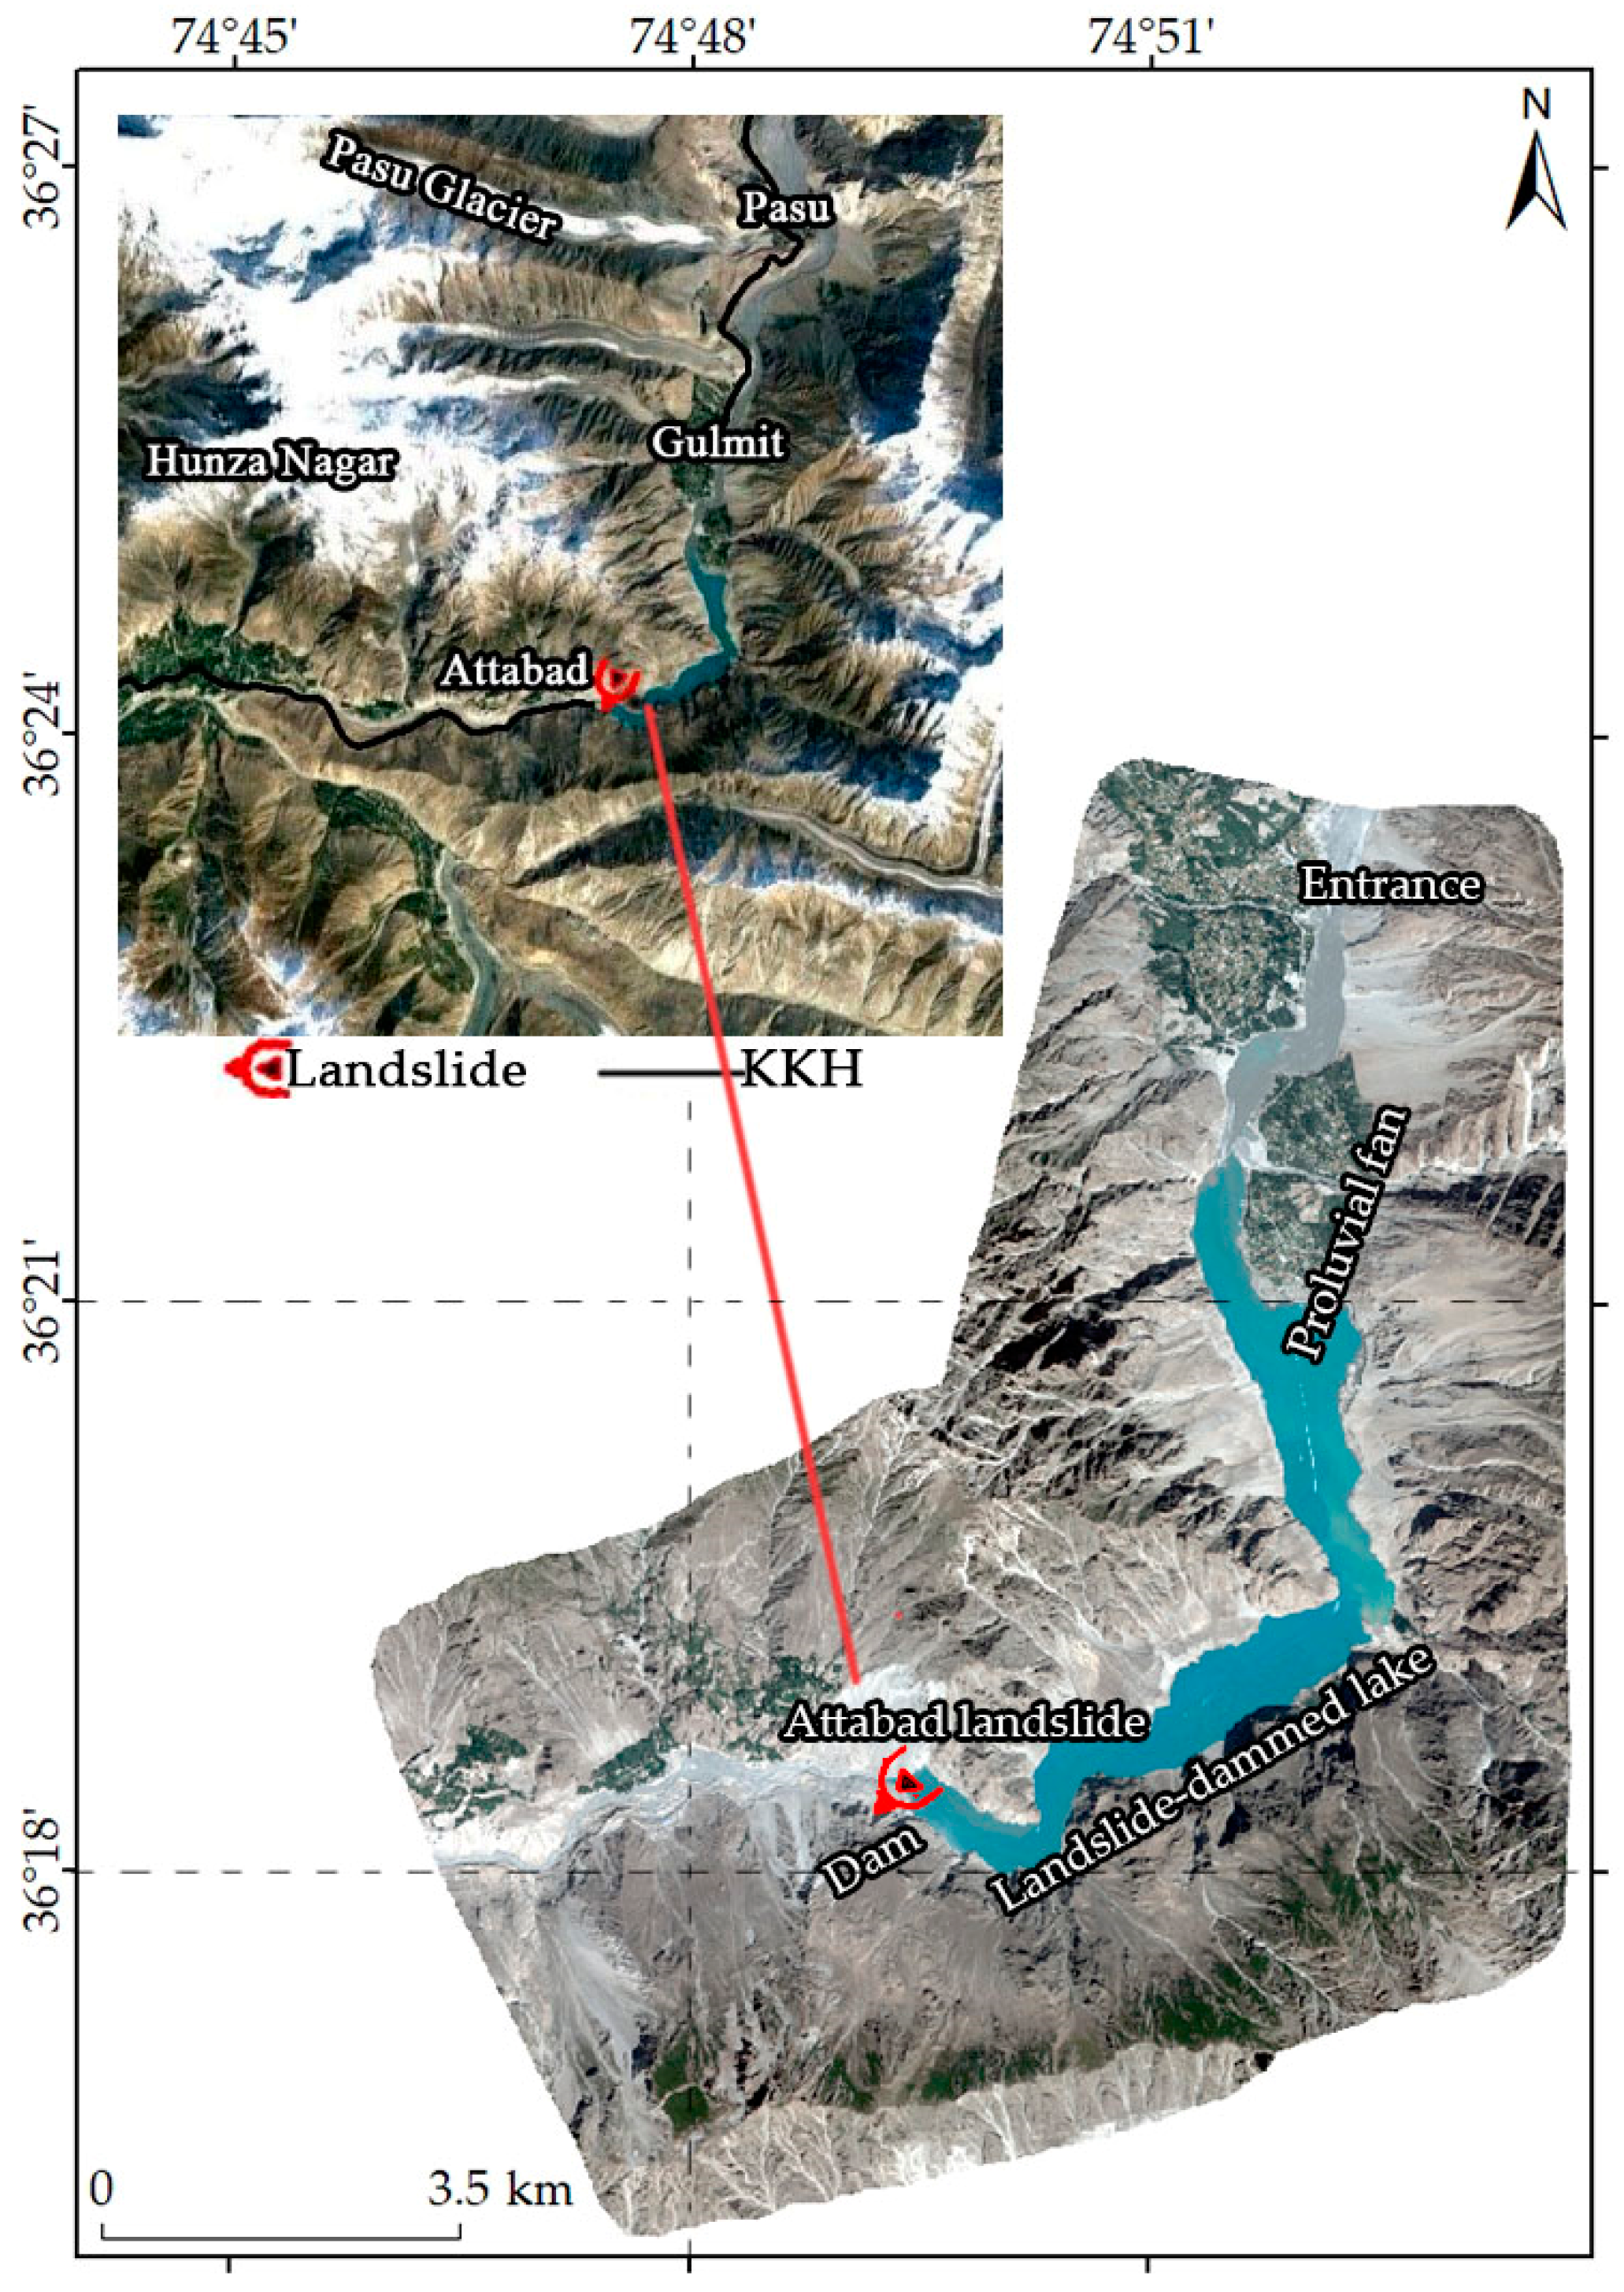
2. Overview of the Study Area

The Attabad landslide-dammed lake is located in the Kashmir region of northern Pakistan, about 570 km from Kashgar, China, where the Hindu Kush, Karakorum and Himalayas meet, with strong neotectonic movements and frequent earthquakes [3]. The overall shape of the lake is an “L”, the water level elevation is about 2379 m, the water depth is 81.3 m, the reservoir capacity is about 192 million m3, and the overflow mouth is about 118 m above the bottom of the old riverbed. Both sides of the lake are typical high-mountain deep canyon landforms, with exposed high and steep slope mountains, the slope of which is mostly between 50°–60° (Figure 1). The middle and upper parts of the mountains are covered by permanent snow (thickness of 50–300 mm) and glaciers all year round, which easily produce abundant snow and ice melt water in the summer [42].
The Attabad landslide-dammed lake is located in the arid and semi-arid alpine snow glacier zone, which belongs to the inland plateau mountain climate zone, with scarce annual rainfall, a dry and cold climate, large temperature differences between day and night, strong freezing and thawing effects, a fragile ecological environment and a poor anti-disturbance ability. In summer, the maximum temperature in the valley can reach more than 40 °C, and the lowest temperature in the valley at night can reach −30 °C. It can be seen that the temperature in the region can vary greatly, even up to 70 °C, which can lead to strong freeze-thaw effects. The average monthly precipitation in the study area in the past ten years has remained below 50 mm (Figure 2). The water recharge of the lake mainly comes from the mainstream of the Hunza River and the three tributaries of Batura glacier meltwater, Pasu glacier meltwater, and Ghulkin glacier meltwater, among which the inflow from the Hunza River and Batura glacier meltwater tributaries is larger [43]. The newly reconstructed KKH passes through the mountain tunnel on the right bank of the lake [25,44].

3. Data and Methods

3.1. Data Collection

Previous studies on Suspended Sediment Concentration (SSC) in lakes and seas have primarily utilized Hyperspectral data with a MODIS/TM/ETM medium resolution [29,45,46]. However, considering the complex mountainous terrain and the small size of the lake in the study, a different approach was adopted. Seven periods of high-resolution panchromatic and multispectral historical archived data (Table 1) were collected to ensure comprehensive coverage and accuracy. Subsequently, the panchromatic and multispectral images were fused, radiometrically calibrated, and atmospherically corrected using ENVI 5.3 [47]. The main processing steps involved were as follows:
(a)
Orthorectification: High-precision control information was used to orthorectify the panchromatic and multispectral data into the CGCS2000 coordinate system;
(b)
Downscaling: The orthorectified results were downgraded to obtain 8-bit panchromatic and multispectral orthorectified images;
(c)
Image Fusion: The orthorectified panchromatic and multispectral images were fused, resulting in a combined image with both high resolution and rich color information;
(d)
Data Screening and Mosaic: After image fusion, data screening and image mosaic were performed to ensure seamless stitching and smooth transitions between all of the image’s edges;
(e)
Geometric Alignment: Due to the significant terrain deformation in the study area, remote sensing images from the seven phases exhibited differences in the same features at various times and with different sensors. To better visualize the trend of lake area change, geometric alignment was carried out, using the 2010 remote sensing images as a benchmark for absolute radiation correction and FLASH atmospheric correction was used on the other six phases of images.

3.2. Methods

3.2.1. The Methods for Extracting Lake Water Bodies and Studying Lake Geometric Features

The Methods for Lake Water Body Extraction

The main methods for lake water body extraction are the thematic classification method [48,49], linear mixed model, single-band threshold method, and spectral water body index method [30,50,51]. Previous studies, through experimental evaluation of these methods, generally concluded that the traditional normalized difference water body index (NDWI) method is more effective in extracting water body information and can distinguish water body and non-water body information in remote sensing images to the maximum extent, but it is vulnerable to mountain shadows, snow and ice, and mist [31,34,52,53,54,55,56,57,58]. Although the Attabad landslide-dammed lake in this study is a special kind of lake, the water body information is also slightly different from that of other lakes, and the topography of the study area is strongly deformed and there are more mountain shadows, so the water body information cannot be extracted directly using the traditional NDWI [46,59].
To address shortcomings in the original NDWI model, Wang et al. (2021) proposed the comprehensive water body index model (CWI) based on GF-2 images [60]. Their research shows that the CWI model can suppress the influence of buildings, shadows, and bright ground objects, and extract water information well. The overall accuracy and Kappa coefficient are 99.97% and 94.86%, respectively, indicating a significant improvement in accuracy compared to other methods. The CWI model is also suitable for GF-1 and WorldView2 images, with good water extraction results, significantly higher water extraction accuracy than other water indices, and the Kappa coefficient is higher than 94.62% (Table 2). The CWI model has the advantage of effectively expanding the difference of reflectance between the NIR band and blue–green band to suppress the influence of mountain shadows.
Therefore, this paper adopts the CWI model to extract the extent of the Attabad landslide-dammed lake. Finally, the visual interpretation check is then combined with the original images to exclude snow, shadows, and other non-water bodies to further revise the boundary extent of the lake accurately. The confusion matrix was used to verify the accuracy. The formula of the comprehensive water body index model is as follows:
C W I = 3 × B 4 B 2 B 1
where B1 is the blue band, B2 is the green band and B4 is the near infrared band.

The Methods for Studying the Geometric Characteristics of the Lake

(1)
Rate of change of lake area
K is the rate of change of the lake area with time. The formula is as follows:
K = S b S a S b × 1 T × 100 %
where K is the rate of change of the lake area in the study period, Sa and Sb are the lake areas in the initial and final periods, respectively, and T is the study duration. A positive K value indicates that the lake area increases, while the opposite indicates that the lake area decreases, and the larger the absolute value of K, the more drastic the lake area changes [55].
(2)
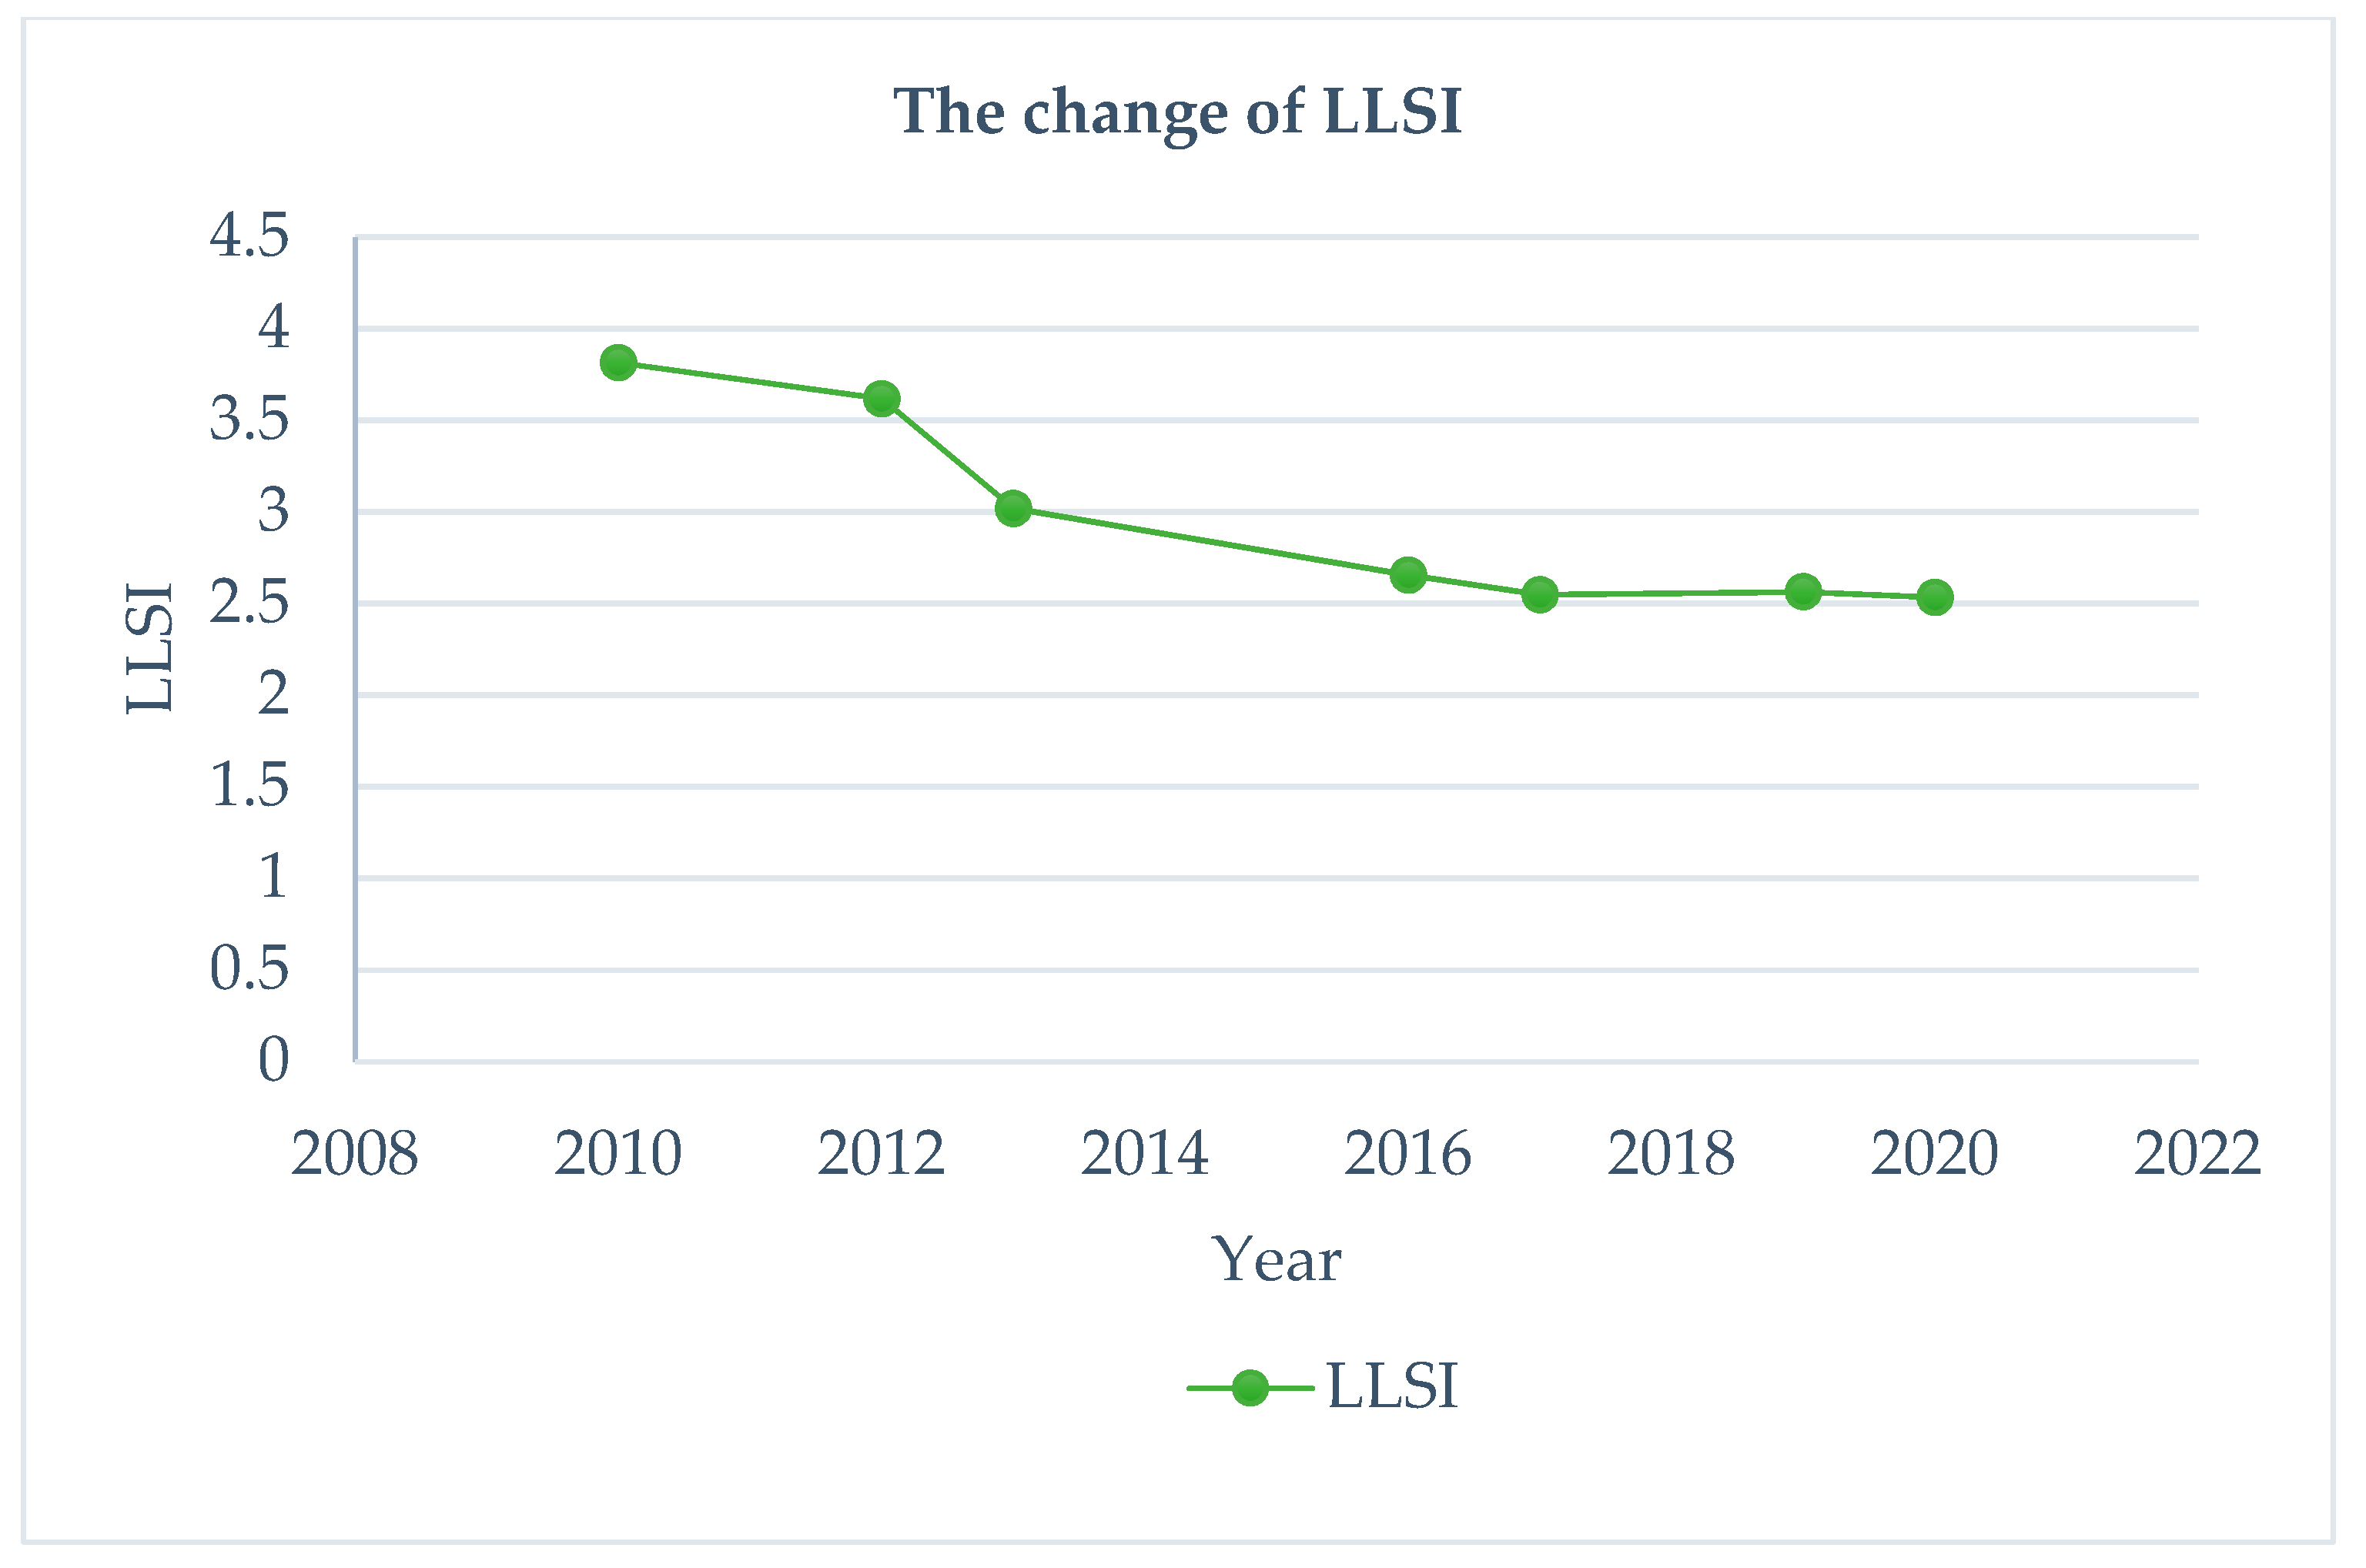
Lake landscape Shape Index
The Lake Landscape Shape Index (LLSI) serves as a valuable tool to analyze the susceptibility of natural landscapes to external disturbances, including human influences. Additionally, it provides insights into landscape complexity and vulnerability. Chukwuka et al. (2022) used morphology (surface area of lake, lake perimeter, and shape index i.e., form factor) to assess the landscape structure and human disturbance features across the lake wetland [61]. In the context of this study focusing on lake landscapes, the calculation formula for LLSI is as follows:
L L S I = L 4 A × 100 %
where LLSI is the lake landscape shape index, L is the length of the lake, and A is the area of the lake. The smaller the landscape index, the more vulnerable the lake is to external disturbances [55].
(3)
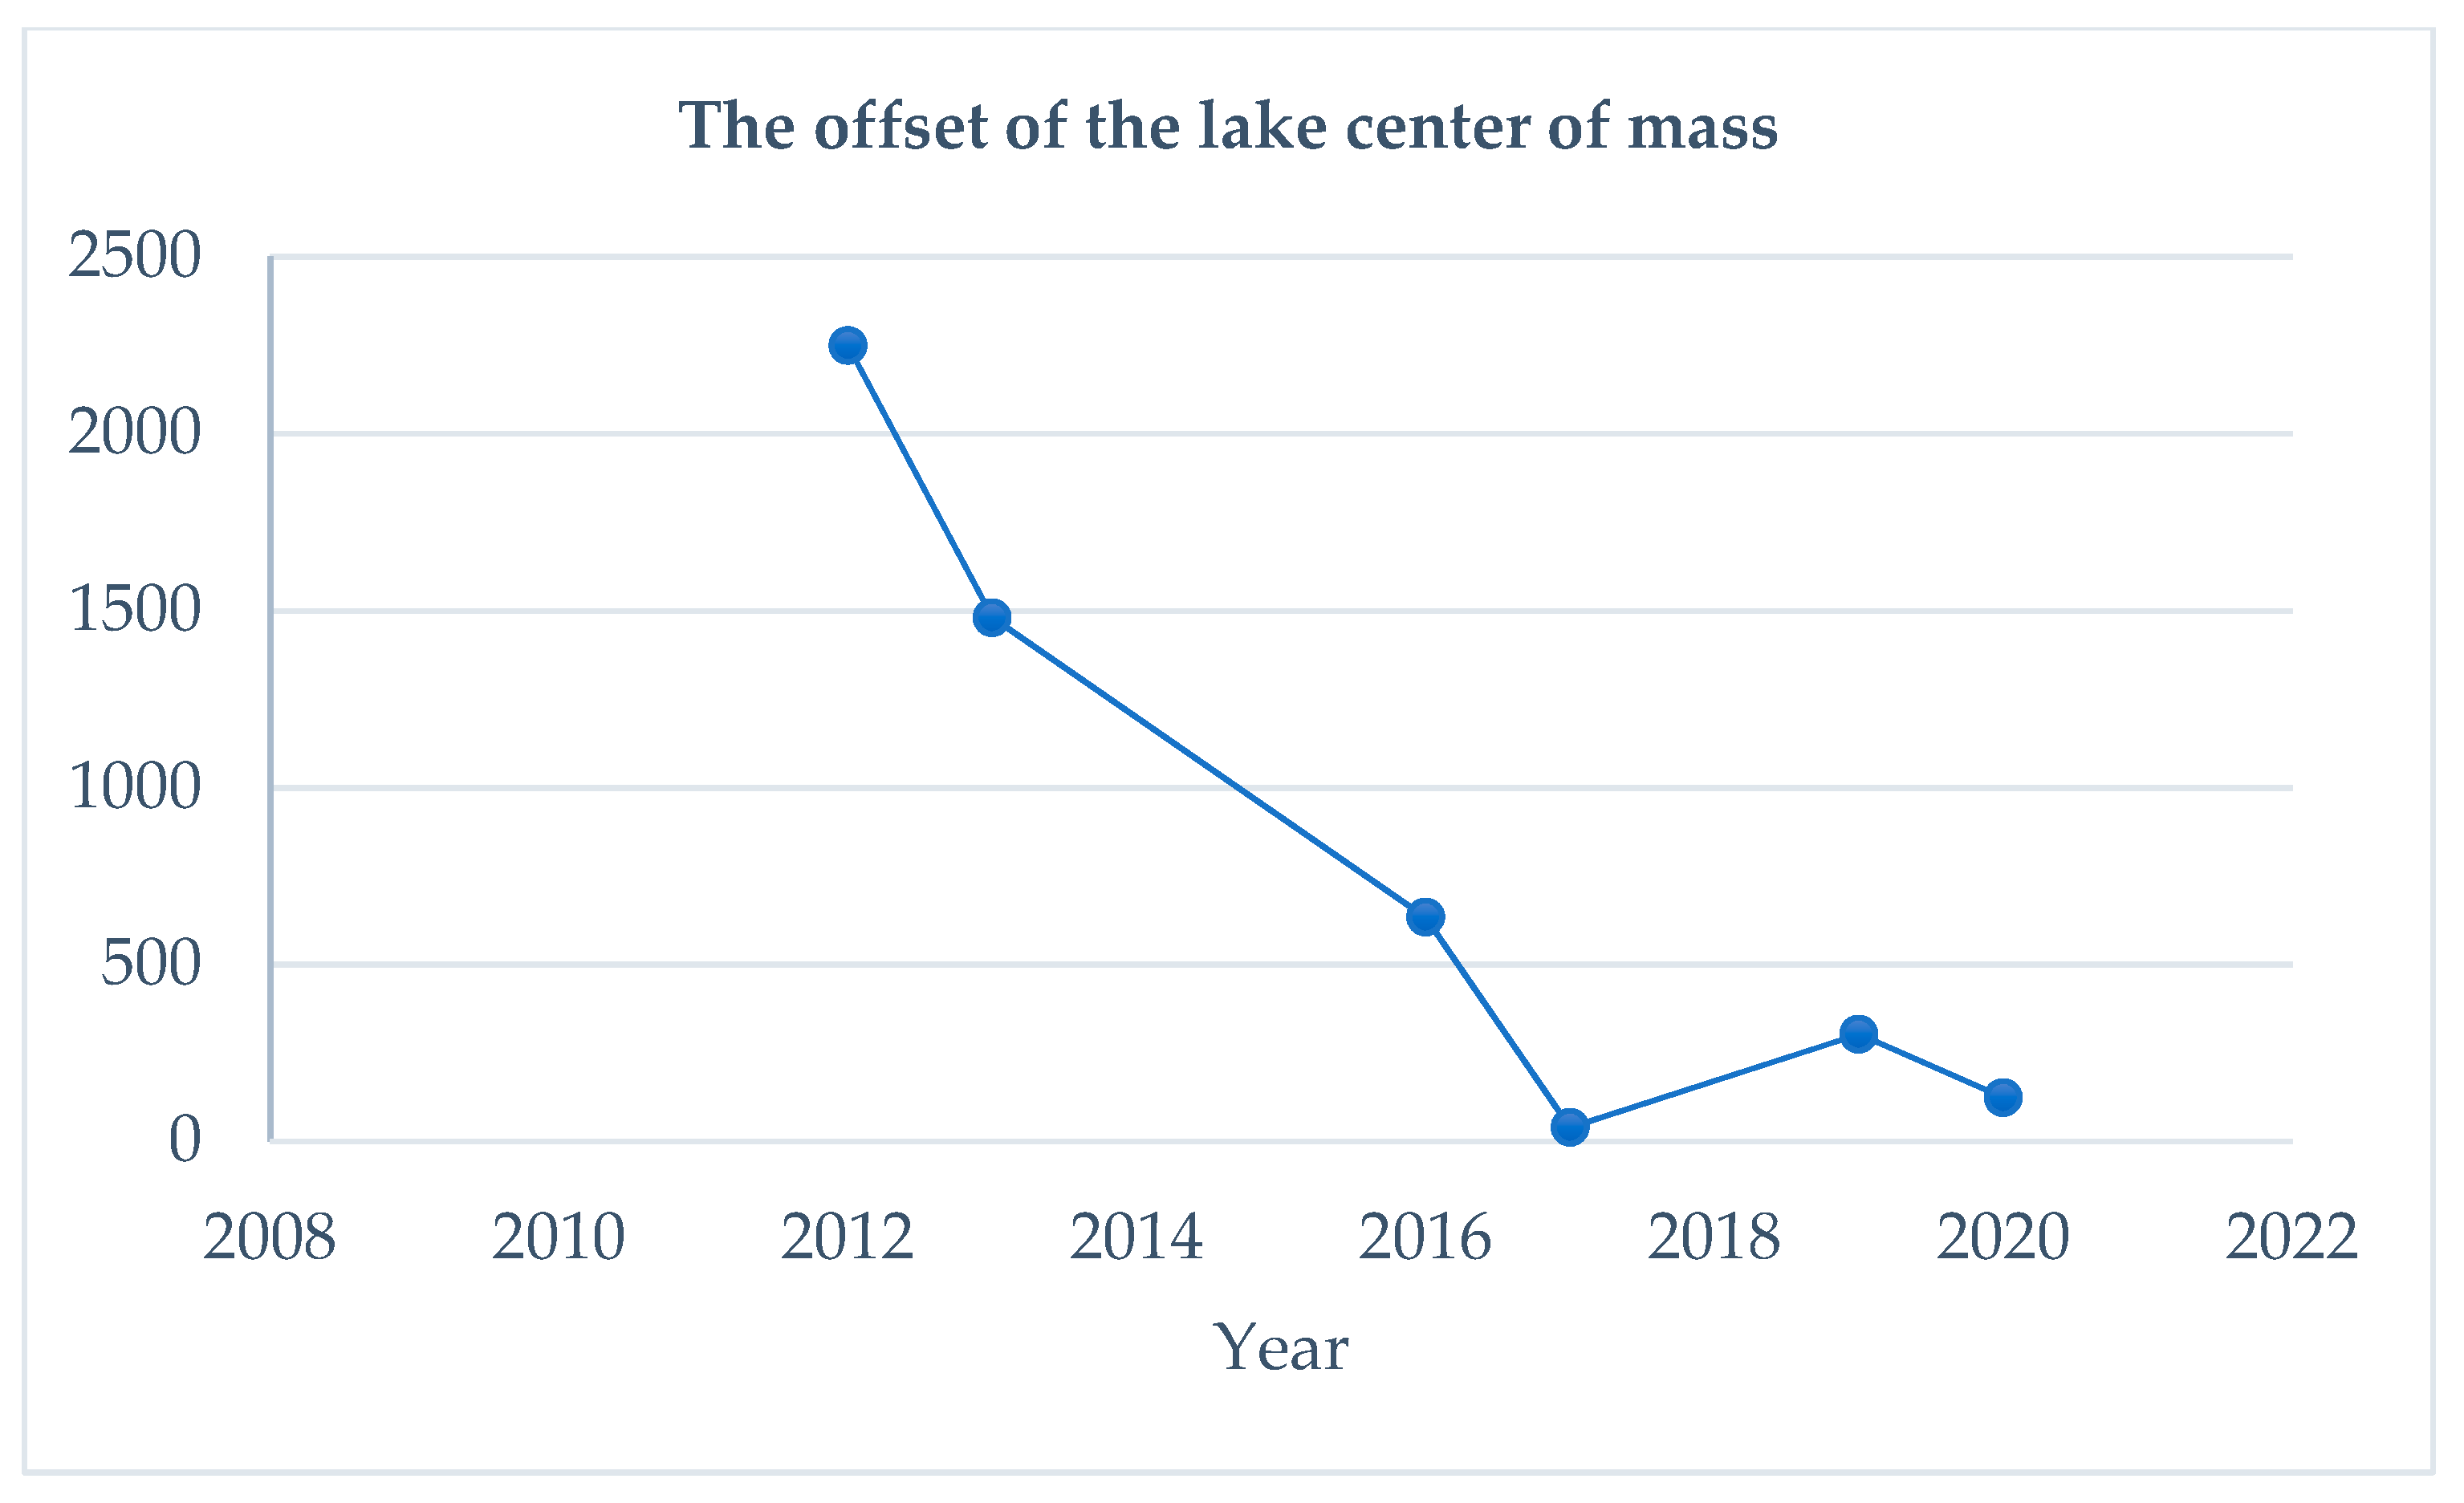
Offset of the lake center of mass
The offset of the lake center of mass can, to some extent, reflect the evolution of the lake and the pattern of its spatial properties, and is calculated as follows:
δ = ( X t + t X t ) 2 + ( Y t + t Y t ) 2
where δ is the offset of the lake center of mass, X t + t and Y t + t are the transverse and longitudinal coordinates of the mass center of the lake after ∆t time, respectively, and X t and Y t are the transverse and longitudinal coordinates of the original mass center of the lake [55].

3.2.2. The Methods for the SSC of the Attabad Landslide Dammed Lake

The current methods used for the inversion of the SSC in lakes are mainly single-band [29], band-ratio, multi-band combinations [35], and other methods. Han et al. (2022) [62] pointed out that the accuracy of single-band and band-ratio inversion is low, the accuracy of multi-band is good, the accuracy of the near-infrared band in single-band is low, the accuracy of green band and red band is good, the accuracy of green band/red band in band-ratio is good, and the accuracy of B1/(B2 + B3) in multi-band is high (Table 3).
In the table, B1 is the blue band, B2 is the green band and B3 is the red band.
In addition, Cai (2020) [63] pointed out that the green band B2 has a certain ability to penetration the water body and can be used to reflect underwater characteristics, such as water turbidity. The red band B3 is more sensitive to the sediment in the water body, leading to a B2 + B3 value that can reflect the high and low sand content of the water body, and the correlation between B2/B3 and the SSC is high. Therefore, this paper draws on the multi-band combination model proposed by Cai (2020) [63] to extract the relative SSC of the Attabad landslide-dammed lake and to analyze the characteristics of sediment distribution changes in the lake during 2010–2002. The commonality between their research area (Bohai Bay) and the barrier lake is that the sediment content is relatively high, and the method is simple and easy to implement. The formula of the SSC index model is as follows:
S S C I = B 2 + B 3 B 2 / B 3
where B2 is the green band and B3 is the red band.
The research process in this paper unfolds as follows: Firstly, 7-phase high-resolution satellite images (QuickBird, Pleiades, and WorldView2) of the Attabad landslide-dammed lake over the past decade are utilized. The lake’s extent from 2010 to 2020 is extracted using the comprehensive water body index method, and the area change, landscape pattern index, and geometric characteristics of the lake are calculated to infer its evolutionary trends.
Secondly, building upon the extent of the extracted lake, a remote sensing quantitative inversion model for the suspended sediment is employed. This model is based on existing lakes with similarity to our study area (similarity refers to both having a high SSC), allowing for the relative Suspended Sediment Concentration (SSC) of the lake to be extracted. The spatial and temporal distribution characteristics of the suspended sediment within the lake are then analyzed, and the dynamic changes in the SSCs from 2010 to 2020 are examined.
Finally, a comprehensive analysis of the hydrological characteristics’ dynamic change process in the lake from 2010 to 2020 is conducted. This analysis provides a valuable data reference for predicting and warning against potential lake failure and informs safety prevention measures.

4. Results and Discussion

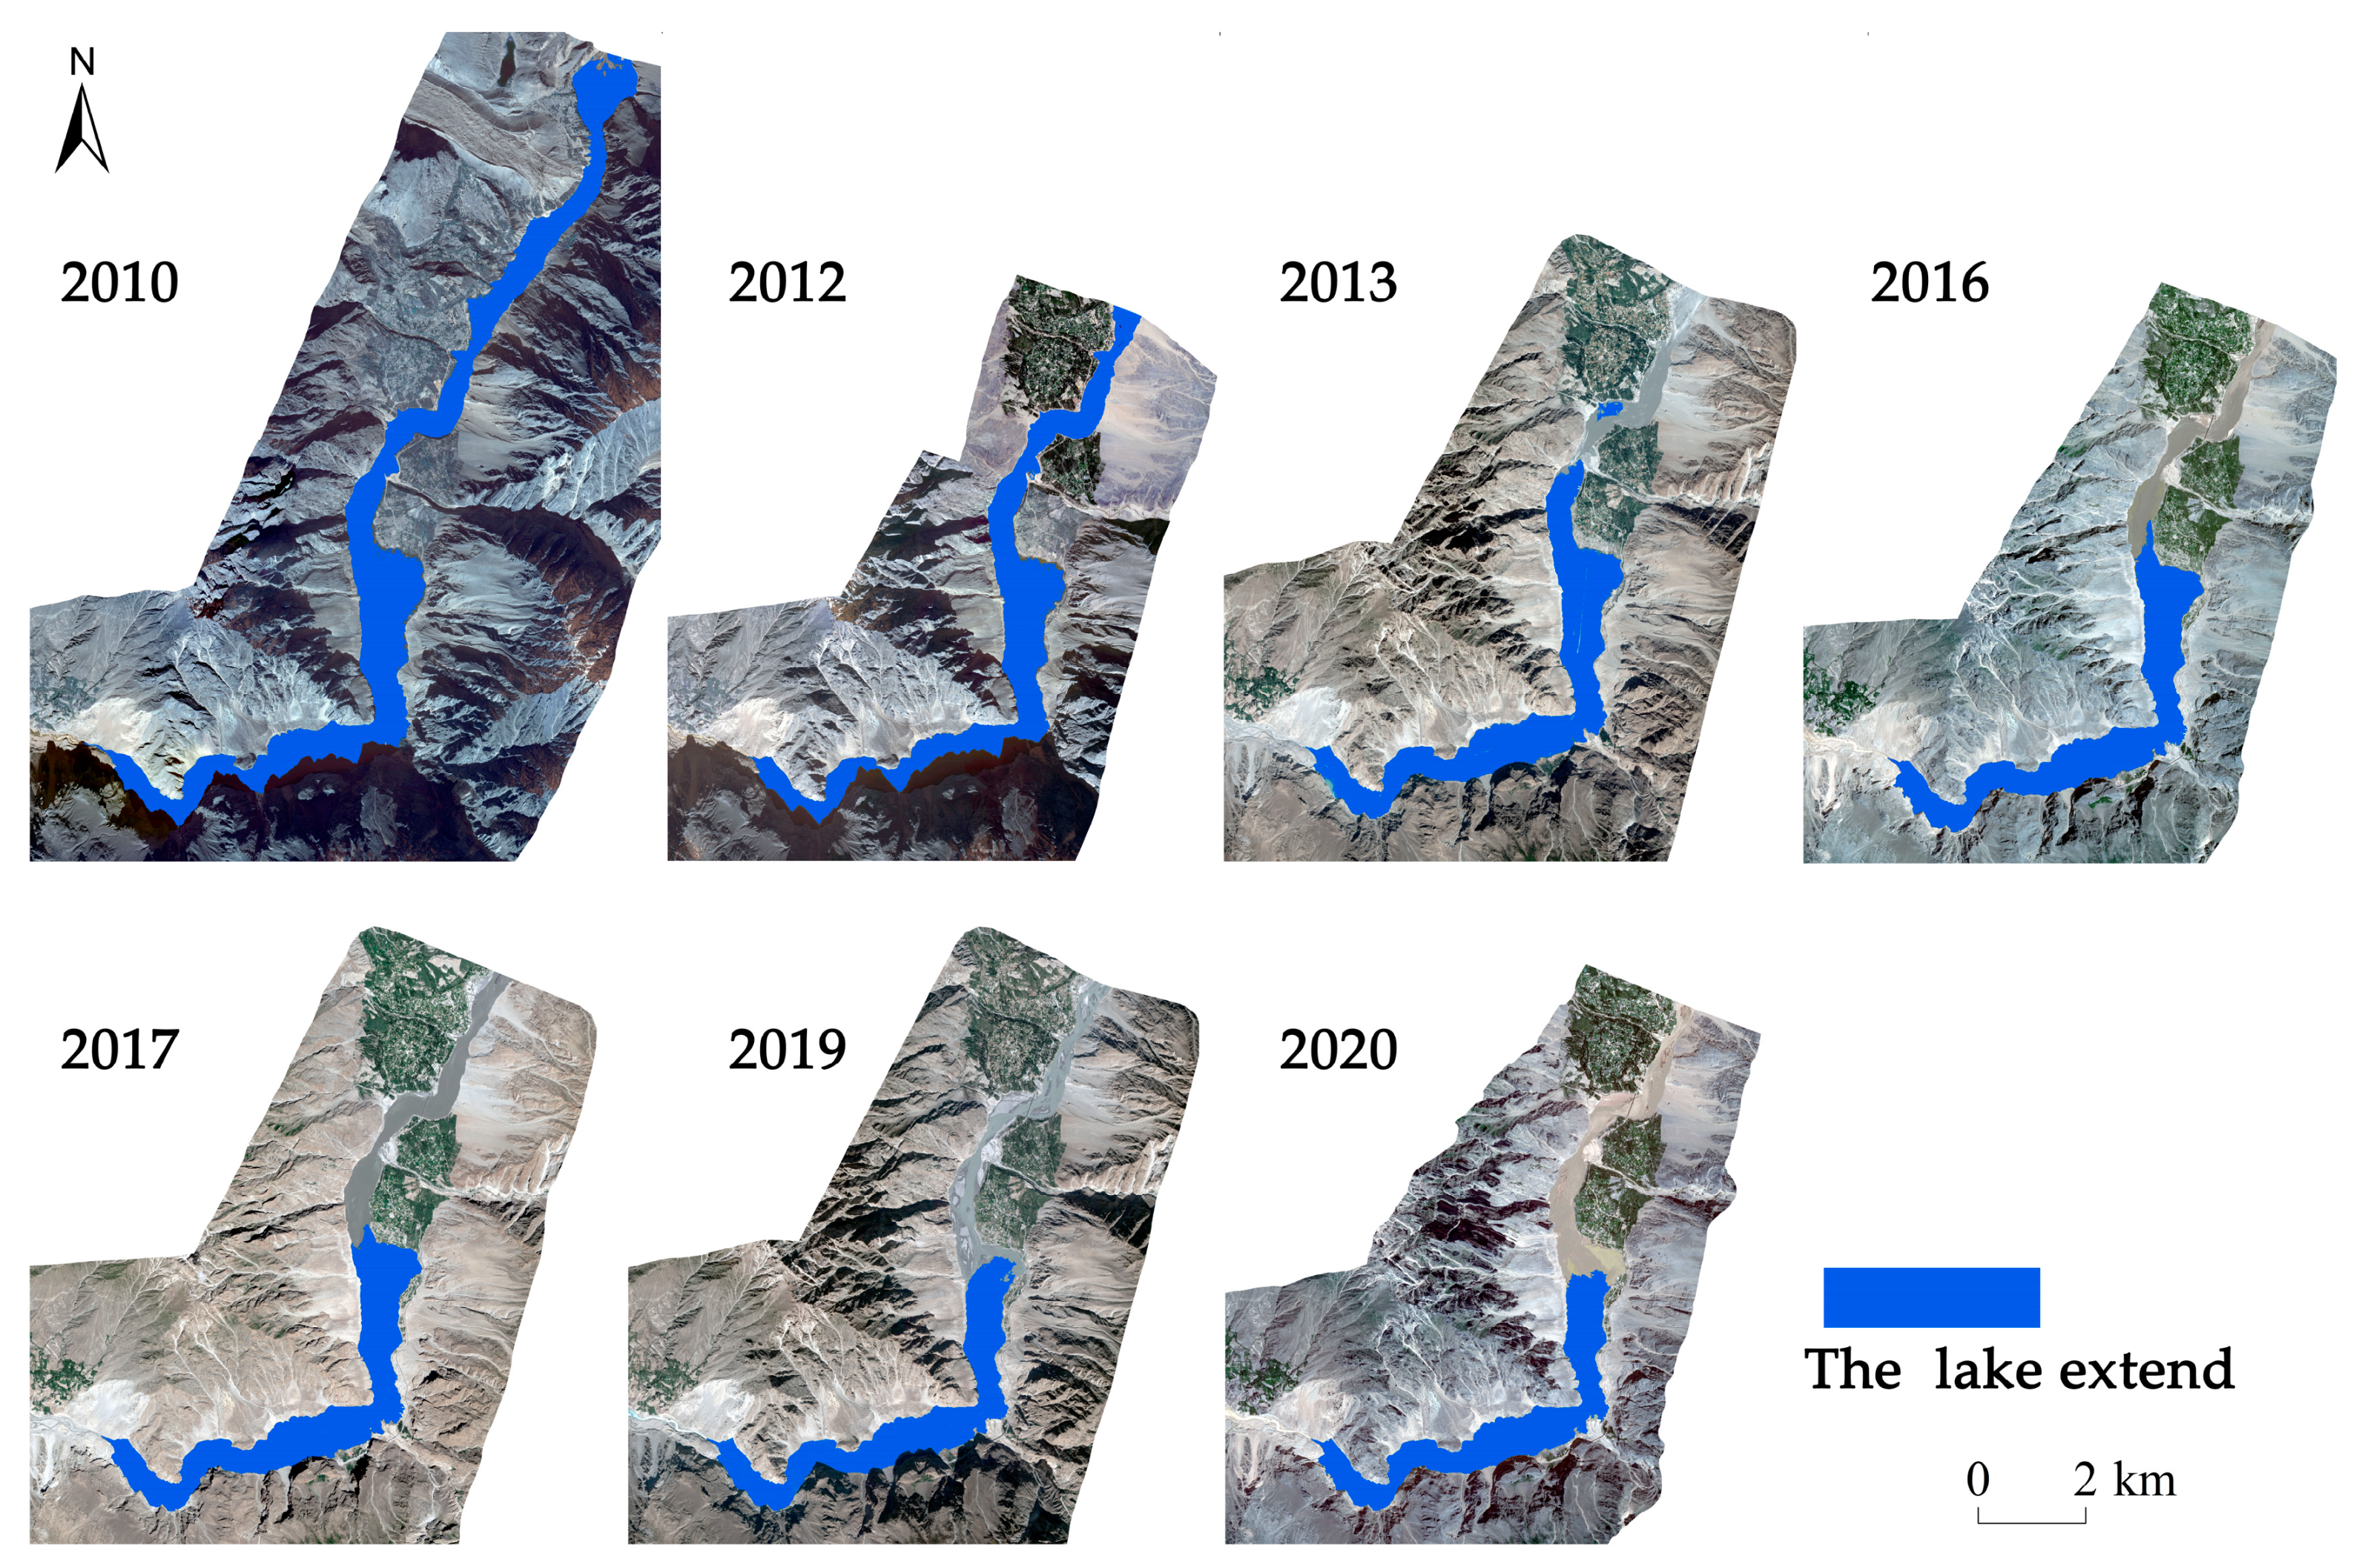
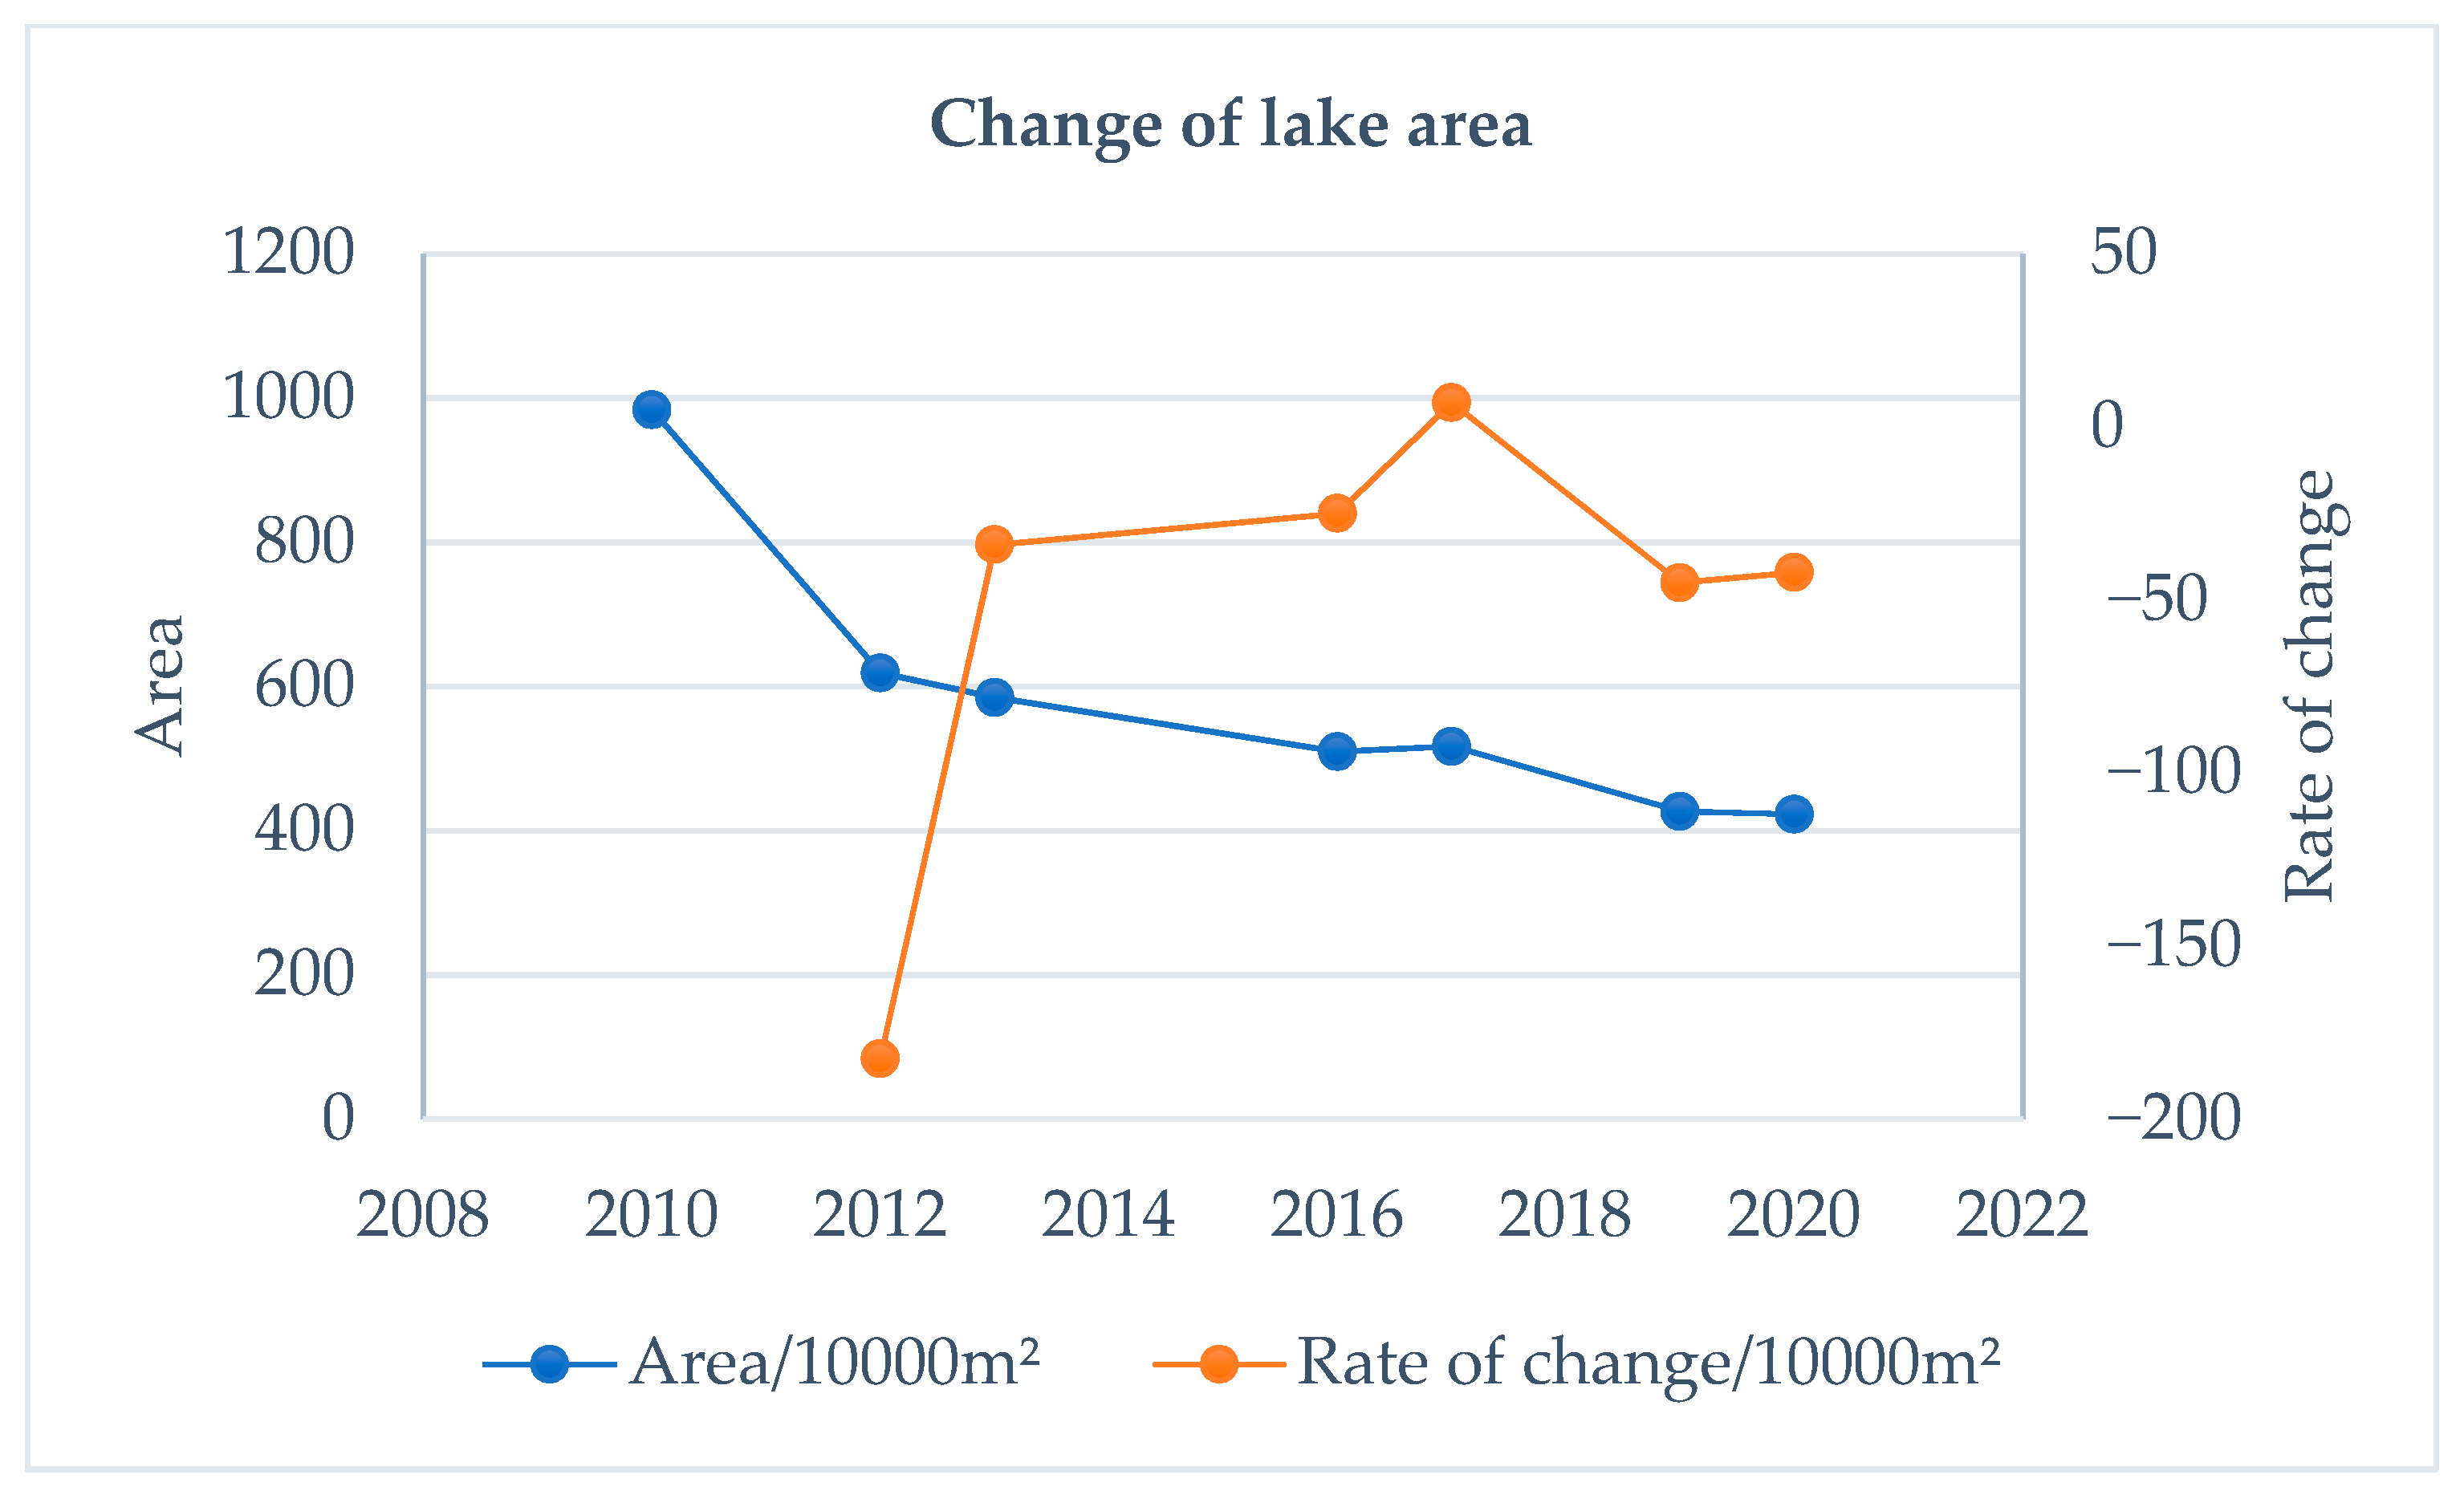
4.1. Change of the Attabad Landslide-Dammed Lake Area

The watershed map of the Attabad landslide-dammed lake for the period spanning from 2010 to 2020 was generated using the CWI method (Figure 3). The confusion matrix was used to verify the accuracy, and the results are shown in Table 4 below, with an overall accuracy of 89.31% and a Kappa coefficient of 0.84, which achieved the expected results. The figure reveals that the Attabad lake has an overall north–south direction, following the course of the narrow river valley. Notably, the northern estuary of the lake exhibits more pronounced changes due to the steep terrain and high slope of the lake shore. In contrast, the east–west shoreline experiences relatively minor changes, and the lake gradually recedes downstream towards the dam. Analysis of the lake area extraction data (Table 5) indicates a consistent trend of a gradual reduction in the lake area over the 10-year period from 2010 to 2020. Specifically, the lake area contracts by 561 km2 during this time, with an average area of 581 km2. The lake reaches its largest extent in 2010 and gradually diminishes thereafter. As the lake recedes, sediment accumulates at the upstream northern estuary, leading to a gradual increase in the sediment area.
During the period from 2010 to 2020, the lake area exhibited an overall decreasing trend, with a slight increase observed in 2017 (Figure 4). The most significant reduction in lake area occurred between 2010 and 2013, while changes in the lake area after 2016 were comparatively smaller, indicating a trend towards stability (Figure 4). The Lake Landscape Shape Index (LLSI) showed a gradual decrease from 2010 to 2020, suggesting a diminishing degree of external disturbance to the lake and a reduced risk of lake collapse (Figure 5).
Moreover, the center of mass of the lake underwent an overall offset reduction, indicating a gradual movement towards the downstream of the lake (dam). This shift in the center of mass, combined with the decreasing lake area, further supports the trend of the lake gradually stabilizing (Figure 6).

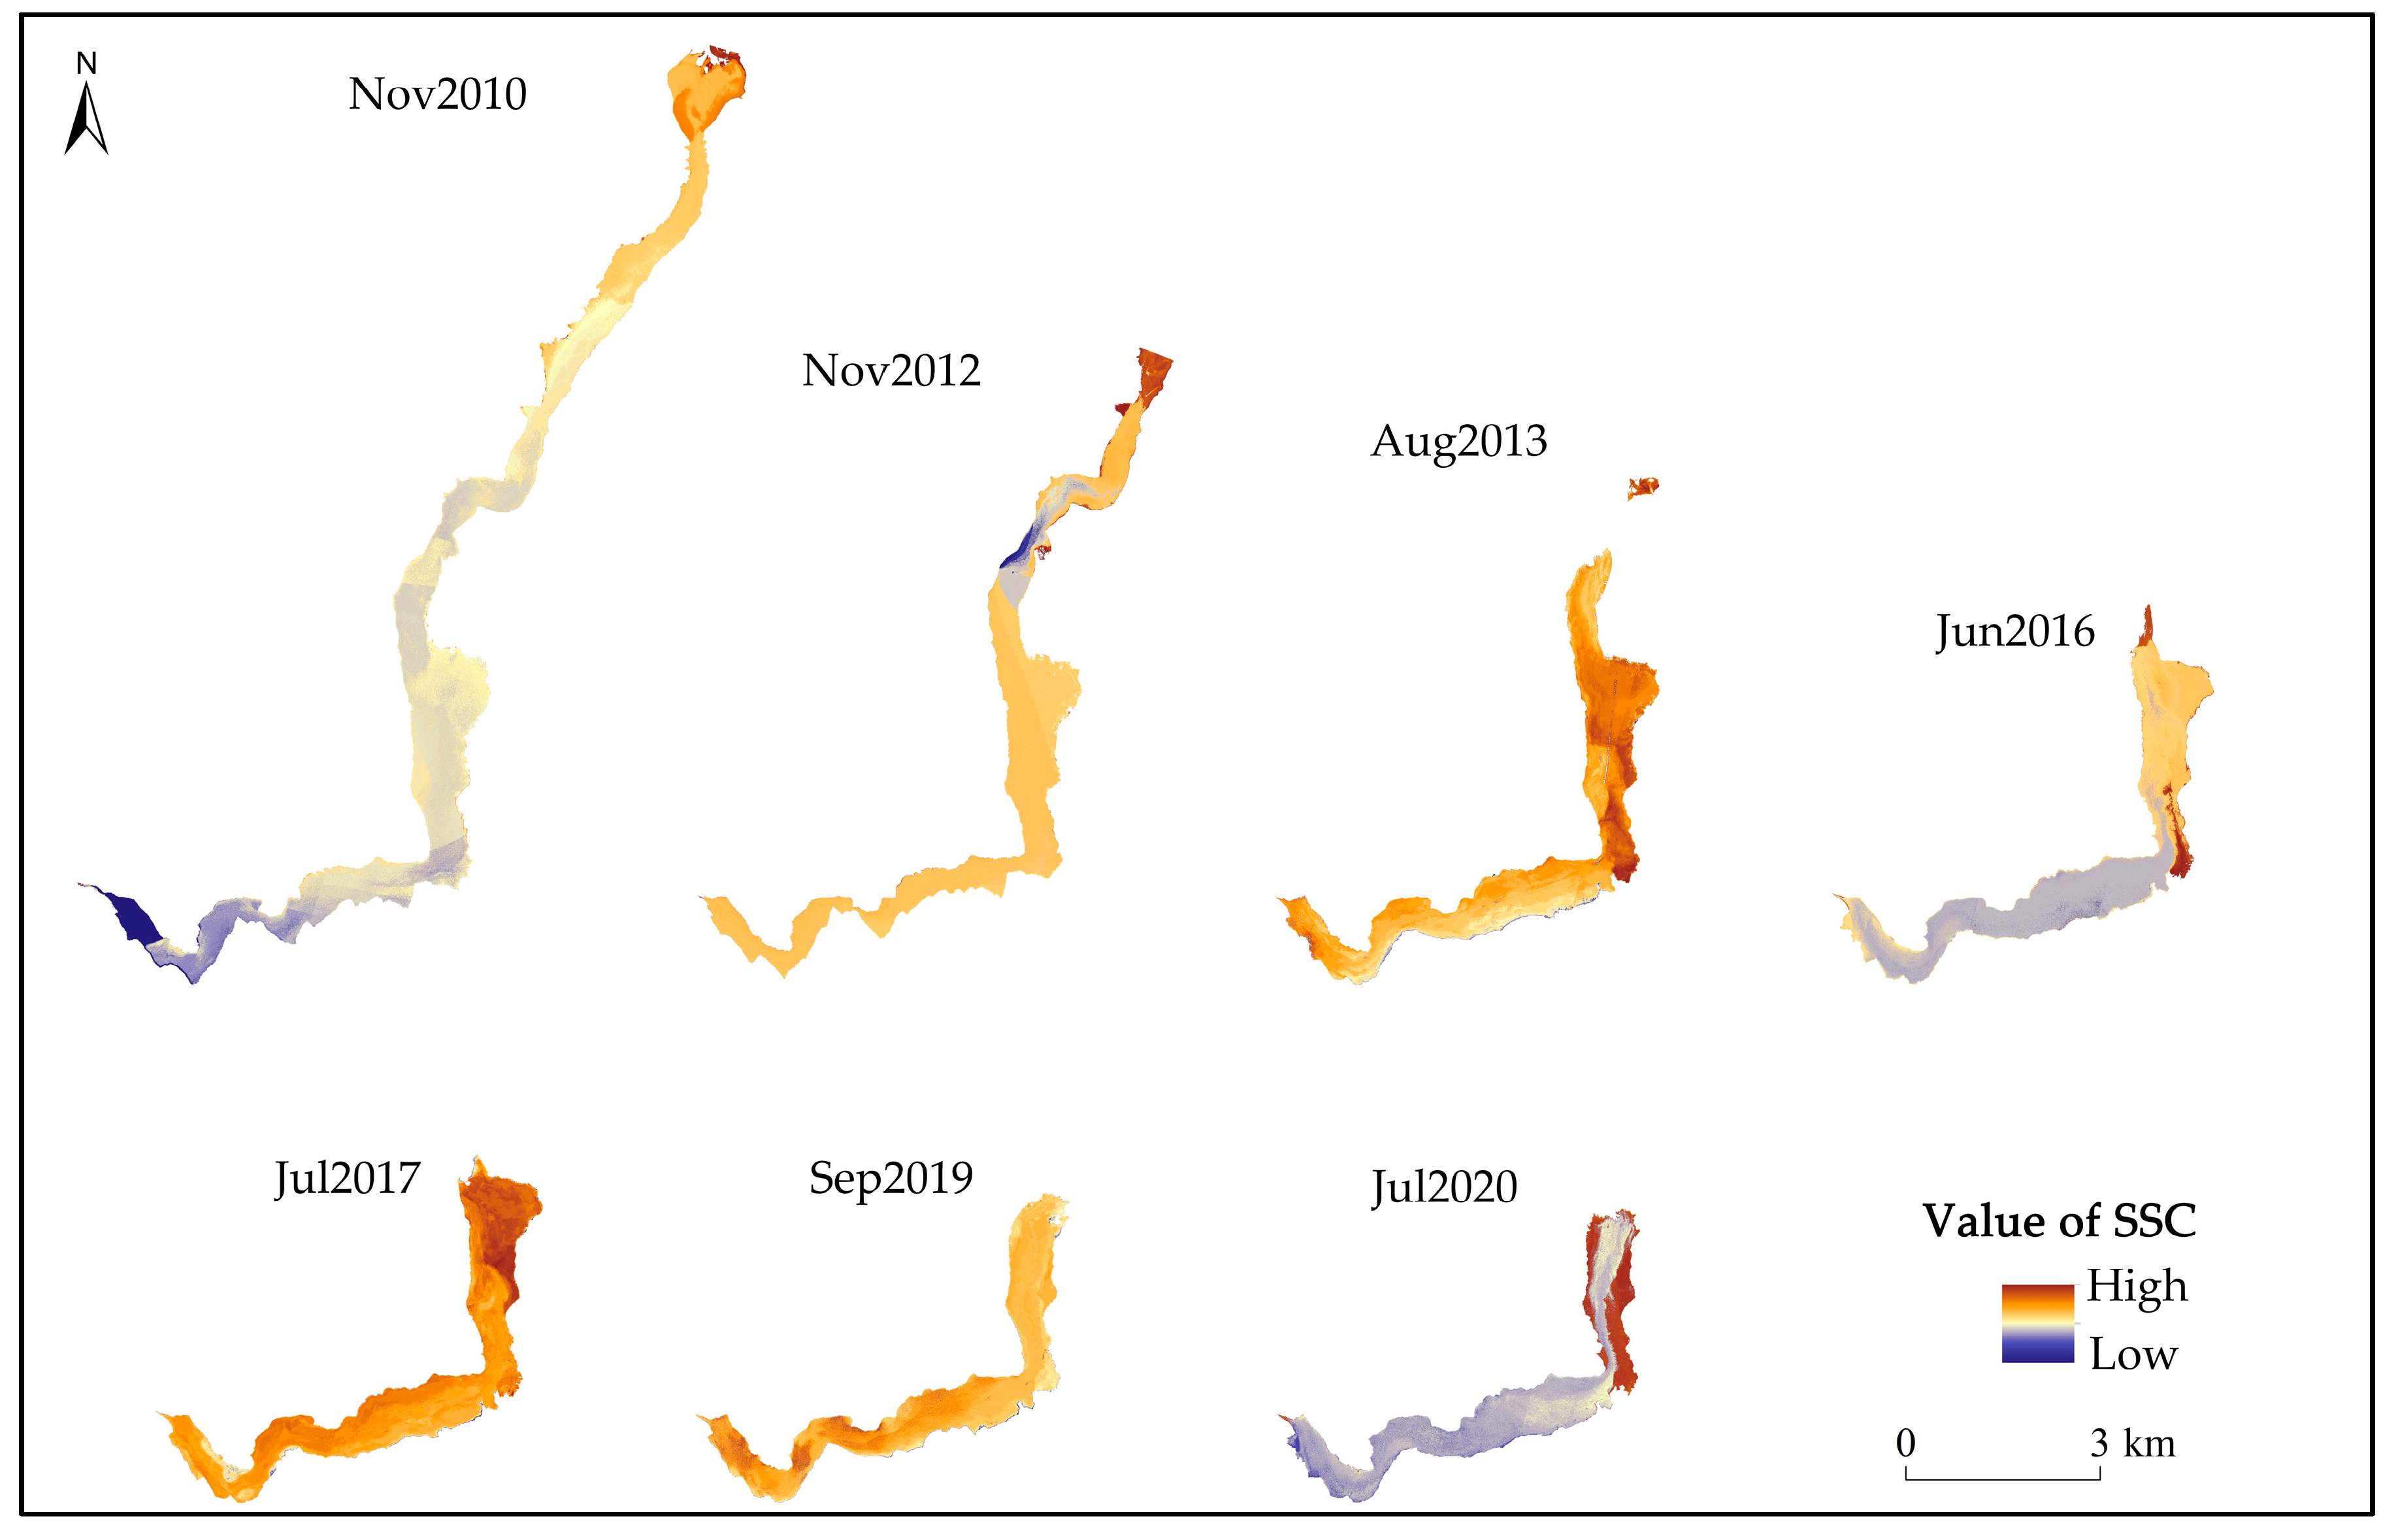
4.2. Changes in SSC of Attabad Landslide-Dammed Lake

The SSC map of Attabad landslide-dammed lake for the periods from 2010 to 2020 was produced using the SI method (Figure 7). The spatial distribution of the SSC exhibited a consistent strip-like pattern, aligned with the north–south direction, in accordance with the lake’s bank. The SSC gradually decreased from the lake’s entrance towards the downstream dam, and from the lake bank towards the lake center. In November 2010, higher SSC levels were observed at the lake’s entrance and shore, gradually decreasing downstream, with lower SSC levels at the dam. By November 2012, a higher SSC was observed at the entrance, with lower SSCs in the middle and upper parts of the lake, gradually increasing towards the lake shore. In August 2013, the SSC was primarily concentrated in the middle of the lake, with a relatively low SSC in the lower-middle downstream area, while a higher SSC was found near the dam. By June 2016, a higher SSC was observed in the middle and upper-middle parts of the lake, with a lower SSC in the downstream region, increasing towards the lake shore. In July 2017, a higher SSC was observed at the entrance and in the lower-middle part of the lake, gradually decreasing downstream. In September 2019, a higher SSC was mainly located near the lower-middle part of the downstream dam. By July 2020, a higher SSC was present in the middle and upper parts of the lake, near the lake shore, and a lower SSC was observed near the dam.
The spatial distribution of sediment is influenced by the topography of the lake and the location of the sediment recharge source. The topography of the lake is a long and narrow river valley from north to south, and the river channel changes to the southwest under the influence of the fault in the lower and middle position. The SSC of the upstream and downstream at the turning point of the river channel change direction is obviously different in the upper-middle and lower-middle position of the lake in 2010, the upper-middle position in 2012, the middle of the 2013, the middle of the 2016, the middle-lower position in 2017, the middle-lower position in 2019, the middle and middle-lower position in 2020, and the SSC of the downstream is obviously lower than that of the upstream, indicating that the turning point of the river channel has the effect of sand interception; in addition, the SSC in the inner bay is lower than that in the outer bay when the river channel changes direction and bends, and the sediment is mostly deposited in the outer bay. The main sources of sediment recharge of the lake are glacial debris flow and loose avalanche accumulation on the bank slope. The debris flow is mainly the glacial debris flow generated by the Pasu glacier movement at the entrance of the lake and the Shishkat debris flow (floodplain fan) in the middle and upper part of the lake [43]. Therefore, there are more sediment deposits at the entrance of the lake and the middle and upper part of the lake, and the lake is also wider and has a higher SSC. The SSC is relatively low in the narrow part of the lake. The main reason for this phenomenon is that the slope of the lake shore is large and the sediment in the narrow area is not easily deposited. In addition, the shore slopes of the lake are mostly unstable slopes with many small landslides and debris flows, so the loose landslide accumulation keeps entering the lake, resulting in a higher SSC on the shore of the lake than in the middle of the lake.
Between 2012 and 2019, higher SSC values migrated from the upper and central sections of the lake to the lower part, suggesting continuous sediment movement from the upper to the lower regions. From 2012 to 2016, a higher SSC was observed at the lake’s entrance and near the floodplain fan, while from 2017 to 2019, a higher SSC was evident near the floodplain fan and in the middle-lower areas of the lake. This indicated a trend of sediment gradually shifting from the upper to the dam-end of the lake.
The SSC of the lake is generally higher in summer than in winter. November 2010 and November 2012 exhibited lower SSCs than other years (mainly summer) due to fewer sediment recharge sources during the freezing period when glaciers and seasonal permafrost are less active. Conversely, during the melting period from June to September, an influx of snow and ice meltwater, as well as groundwater, carried sediment into the lake, resulting in an increased SSC at the entrance and near the floodplain fan. Additionally, the ongoing influence of groundwater led to continuous avalanche slide accumulation slipping into the lake from both sides of the bank slope.
Temporally, the average SSC of the lake gradually decreases overall from 2010 to 2020, and the SSC of the lake gradually increases from 2010 to 2013, gradually decreases from 2013 to 2016, gradually increases from 2016 to 2017, and gradually decreases from 2017 to 2020, with the lowest SSC of the lake in 2020. In the recent 2017–2020 period, the SSC in the lower-middle part of the lake is higher, while the SSC is lower near the dam, resulting in less influence of sediment on the dam.
In summary, the spatial distribution of suspended sediment in the Attabad landslide-dammed lake follows a north–south and then northeast–southwest trending strip, corresponding to the direction of the lake bank. The SSC gradually decreases from the lake’s entrance to the downstream dam and from the lake shore to the center. This distribution is primarily influenced by the lake’s topography and sediment recharge sources. From 2012 to 2019, higher SSC values shifted from the upper-middle to the lower part of the lake, indicating continuous sediment movement. Overall, the SSC is higher in summer compared to winter, and the average SSC of the lake decreased from 2010 to 2020. During the recent period from 2017 to 2020, a higher SSC was observed in the lower-middle parts of the lake, while a lower SSC was evident near the dam.

4.3. Discussion

The main reason for the change in the water range of the dammed lake is the artificial and regular treatment of the dam. In 2010, when the dammed lake was first formed, the water body reached its maximum, and then after the artificial excavation of the dam the water body area was sharply reduced, and the change rate reached 170. After that, the extent of the dammed lake gradually decreased, and the range of change was basically stable within 50. Changes in SSCs have a lot to do with changes in sediment sources. In the summer, the melting of the glaciers in the upper reaches will carry more sediment into the lake area, increasing the sediment concentration in the lake area, and in the winter, less glacial meltwater from the upper reaches enters the lake area and the sediment concentration is lower. In the vicinity of the debris alluvial fan, the sediment concentration in the lake area is relatively high, mainly due to the frequent debris flows and the introduction of slope sediments into the lake area.
From 2010 to 2020, the decreasing trend in the extent of the dammed lake indicates that the risk of outburst for the dammed lake is small. In addition, the sediment content in the middle of the dammed lake is relatively high, and a large amount of sediment accumulated in the central part from 2013 to 2020, which may lead to the formation of a new dammed dam in the middle and the division of the original dammed lake into two smaller lakes, which will affect the stability of the dammed lake.
However, it is essential to acknowledge some limitations in this study due to the lack of objective data. Firstly, the analysis of the lake’s SSC mainly relied on remote sensing technology, lacking actual measured SSC values, resulting in the derived SSC being relative rather than quantitatively analyzed. Secondly, it is crucial to investigate whether the images were taken after rainfall events or under normal conditions, as sediment concentration tends to vary under specific circumstances. Unfortunately, we do not know the specific rainfall conditions before imaging. Additionally, the boundary between the water body and slope in the lake extent from 2010 to 2013 was not clearly defined due to mountain shadows. Finally, regarding the formation of new barrier lakes and dams in the center, based on remote sensing we speculate that the suspended sediment in the lake will gradually deposit in the narrow areas of the lake (with high suspended sediment content), to form bed load and a new dam structure. The most effective way to verify this idea is to measure the terrain on site, but due to the special controversy of the area, we are temporarily unable to carry out this work. Due to the lack of effective validation methods, our methods are only applicable to specific plateau barrier lakes. Our next plan is to investigate 5–10 typical barrier lakes in the Qinghai Tibet Plateau region for sediment content extraction and collect sediment content on site for verification to ensure the effectiveness and applicability of those methods.
Despite these limitations, the findings provide valuable insight into the changes in the Attabad landslide-dammed lake’s area and suspended sediment concentration over the past decade. The observed trends and spatial patterns offer critical information for understanding the lake’s dynamics and potential implications for safety concerns related to sedimentation and lake failure.
To overcome the limitations of this study and enhance future research, it is recommended to incorporate actual measured SSC data to quantitatively assess sediment concentrations. Moreover, exploring advanced technologies and methodologies, such as in-situ measurements and high-resolution imaging, could lead to more accurate and comprehensive results. Furthermore, further investigation into the impact of sediment redistribution on the lake’s ecological environment and surrounding communities would add significant value to the understanding of the overall dynamics of the Attabad landslide-dammed lake.

5. Conclusions and Discussion

From 2010 to 2020, the area of the Attabad landslide-dammed lake showed a gradual decreasing trend, with the center of mass moving toward the dam and the lake tending to a stable state. The waters of the lake with more obvious changes were mainly located at the northern estuary of the lake, while the east and west shorelines did not change much, and the lake gradually retreated toward the downstream dam. During the lake’s recession, sedimentation appeared at the upstream northern estuary, and the sediment area gradually increased.
The suspended sediment in the lake followed a strip-like pattern, trending from north to south and then northeast to southwest, aligning with the lake bank’s direction. The suspended sediment concentration (SSC) decreased gradually from the lake’s entrance to the downstream dam and from the lake bank to its center. Temporally, the average SSC of the lake showed a gradual decrease from 2010 to 2020, with higher SSC values generally observed in summer compared to winter. Notably, during the recent period from 2017 to 2020, a higher SSC was noted in the lower-middle parts of the lake, while a lower SSC was observed near the dam, indicating a reduced sediment impact on the dam. In addition, the sediment content in the middle of the dammed lake is relatively high, and a large amount of sediment accumulated in the central part from 2013 to 2020, which may lead to the formation of a new dammed dam in the middle and the division of the original dammed lake into two smaller lakes, which will affect the stability of the dammed lake.
The limitations of this study are that the analysis of the lake’s SSC mainly relied on remote sensing technology, lacking actual measured SSC values, resulting in the derived SSC being relative rather than quantitatively analyzed. Additionally, the boundary between the water body and slope in the lake extent from 2010 to 2013 was not clearly defined due to mountain shadows. In the subsequent deeper research, it is recommended to incorporate actual measured SSC data to quantitatively assess sediment concentrations. Furthermore, further investigation into the impact of sediment redistribution on the lake’s ecological environment and surrounding communities would add significant value to the understanding of the overall dynamics of the Attabad landslide-dammed lake.
In conclusion, this study sheds light on the changing dynamics of the Attabad landslide-dammed lake and its suspended sediment concentrations over a decade. While the findings offer valuable insights, continuous research and data refinement are essential for a comprehensive understanding of the lake’s behavior and its potential implications for safety and environmental management.

Author Contributions

All authors contributed to the study conception and design. Data collection and analysis were performed by H.Y., Y.Q., W.Y., Y.W. and G.C. The first draft of the manuscript was written by Y.L. and all authors commented on previous versions of the manuscript. All authors have read and agreed to the published version of the manuscript.

Funding

This work was supported by the Geological survey project of China Geological Survey [DD20191016, ZD20220409, ZD20220125, DD20211570].

Data Availability Statement

The original contributions presented in the study are included in the article, further inquiries can be directed to the corresponding author.

Acknowledgments

This work was supported by the Geological survey project of China Geological Survey. The authors are grateful to insightful comments suggested by the editor and the anonymous reviewers.

Conflicts of Interest

The authors declare no conflicts of interest.

References

  1. Butt, M.J.; Umar, M.; Qamar, R. Landslide dam and subsequent dam-break flood estimation using HEC-RAS model in Northern Pakistan. Nat. Hazards 2012, 65, 241–254. [Google Scholar] [CrossRef]
  2. Su, X.-J.; Zhang, Y.; Meng, X.-M.; Yue, D.-X.; Ma, J.-H.; Guo, F.-Y.; Zhou, Z.-Q.; Rehman, M.U.; Khalid, Z.; Chen, G.; et al. Landslide mapping and analysis along the China-Pakistan Karakoram Highway based on SBAS-InSAR detection in 2017. J. Mt. Sci. 2021, 18, 2540–2564. [Google Scholar] [CrossRef]
  3. Ding, M.; Huai, B.; Sun, W.; Wang, Y.; Zhang, D.; Guo, X.; Zhang, T. Surge-type glaciers in Karakoram Mountain and possible catastrophes alongside a portion of the Karakoram Highway. Nat. Hazards 2017, 90, 1017–1020. [Google Scholar] [CrossRef]
  4. Chen, X.; Cui, P.; You, Y.; Cheng, Z.; Khan, A.; Ye, C.; Zhang, S. Dam-break risk analysis of the Attabad landslide dam in Pakistan and emergency countermeasures. Landslides 2016, 14, 675–683. [Google Scholar] [CrossRef]
  5. Zhang, H.R.; Zhong, Y.G.; Reng, Y. Analyses and prevention and treatment measures of water-distroyed highway along rivers in Karakorum range area in Pakistan. Highway 2013, 4, 182–186. (In Chinese) [Google Scholar]
  6. Khan, H.; Shafique, M.; Khan, M.A.; Bacha, M.A.; Shah, S.U.; Calligaris, C. Landslide susceptibility assessment using Frequency Ratio, a case study of northern Pakistan. Egypt. J. Remote Sens. Space Sci. 2019, 22, 11–24. [Google Scholar] [CrossRef]
  7. Ahmed, M.F.; Rogers, J.D.; Abu Bakar, M.Z. Hunza river watershed landslide and related features inventory mapping. Environ. Earth Sci. 2016, 75, 522–533. [Google Scholar] [CrossRef]
  8. Bacha, A.S.; Shafique, M.; van der Werff, H. Landslide inventory and susceptibility modelling using geospatial tools, in Hunza-Nagar valley, northern Pakistan. J. Mt. Sci. 2018, 15, 1354–1370. [Google Scholar] [CrossRef]
  9. Brideau, M.-A.; Shugar, D.H.; Bevington, A.R.; Willis, M.J.; Wong, C. Evolution of the 2014 Vulcan Creek landslide-dammed lake, Yukon, Canada, using field and remote survey techniques. Landslides 2019, 16, 1823–1840. [Google Scholar] [CrossRef]
  10. Liu, N.; Cheng, Z.L.; Cui, P.; Chen, N.S. Dammed Lake and Risk Management; Science Press: Beijing, China, 2013. (In Chinese) [Google Scholar]
  11. Vergara, I.; Garreaud, R.; Moreiras, S.; Araneo, D.; Beigt, D. Exploring the association between landslides and fluvial suspended sediment in a semi-arid basin in central Chile. Geomorphology 2022, 402, 108129. [Google Scholar] [CrossRef]
  12. Shen, D.; Shi, Z.; Peng, M.; Zhang, L.; Jiang, M. Longevity analysis of landslide dams. Landslides 2020, 17, 1797–1821. [Google Scholar] [CrossRef]
  13. Kumar, V.; Gupta, V.; Jamir, I.; Chattoraj, S.L. Evaluation of potential landslide damming: Case study of Urni landslide, Kinnaur, Satluj valley, India. Geosci. Front. 2018, 10, 753–767. [Google Scholar] [CrossRef]
  14. Nian, T.K.; Wu, H.; Chen, G.Q.; Zheng, D.F.; Zhang, Y.J.; Li, D.Y. Research progress on stability evaluation method and disaster chain effect of landslide dam. Chin. J. Rock Mech. Eng. 2018, 37, 25–41. [Google Scholar]
  15. Wang, F.; Chen, Y.; Yan, K. A destructive mudstone landslide hit a high-speed railway on 15 September 2022 in Xining city, Qinghai province, China. Landslides 2023, 20, 871–874. [Google Scholar] [CrossRef]
  16. Cao, B.; Yang, S.; Ye, S. Integrated Application of Remote Sensing, GIS and Hydrological Modeling to Estimate the Potential Impact Area of Earthquake-Induced Dammed Lakes. Water 2017, 9, 777. [Google Scholar] [CrossRef]
  17. Zhou, J.-W.; Cui, P.; Fang, H. Dynamic process analysis for the formation of Yangjiagou landslide-dammed lake triggered by the Wenchuan earthquake, China. Landslides 2013, 10, 331–342. [Google Scholar] [CrossRef]
  18. Zhang, Y.Z.; Huang, C.Z.; Zhou, Y.L.; Pang, J.L.; Zha, X.C.; Zhou, Q.; Guo, Y.Q.; Chen, Y.L.; Zheng, Z.X.; Hu, Y.; et al. Formation and development of the prehistorical landslide dammed-lake in the Jishixia gorge along the upper Yellow River. Sci. Sin. Terrae 2017, 47, 1357–1370. (In Chinese) [Google Scholar]
  19. Zhang, L.M.; Xiao, T.; He, J.; Chen, C. Erosion-based analysis of breaching of Baige landslide dams on the Jinsha River, China, in 2018. Landslides 2019, 16, 1965–1979. [Google Scholar] [CrossRef]
  20. Argentin, A.-L.; Hauthaler, T.; Liebl, M.; Robl, J.; Hergarten, S.; Prasicek, G.; Salcher, B.; Hölbling, D.; Pfalzner-Gibbon, C.; Mandl, L.; et al. Influence of rheology on landslide-dammed lake impoundment and sediment trapping: Back-analysis of the Hintersee landslide dam. Geomorphology 2022, 414, 108363. [Google Scholar] [CrossRef]
  21. Li, J.; Cao, Z.; Cui, Y.; Fan, X.; Yang, W.; Huang, W.; Borthwick, A. Hydro-sediment-morphodynamic processes of the baige landslide-induced barrier Lake, Jinsha River, China. J. Hydrol. 2021, 596, 126134. [Google Scholar] [CrossRef]
  22. Chen, H.Y.; Chen, X.Q.; Zhao, W.Y.; Luo, Z.G. The effects of Attabad landslide secondary geohazard on the Karakoram Highway. J. Catastrophology 2019, 34, 81–85. (In Chinese) [Google Scholar]
  23. Chen, W.T.; Yang, Z.Q.; Zhu, Y.Y.; Zhang, Z.W. Analyses on formation conditions and triggering mechanism of Attabad landslide. China Saf. Sci. J. 2020, 30, 148–155. (In Chinese) [Google Scholar]
  24. Gardezi, H.; Bilal, M.; Cheng, Q.; Xing, A.; Zhuang, Y.; Masood, T. A comparative analysis of Attabad landslide on January 4, 2010, using two numerical models. Nat. Hazards 2021, 107, 519–538. [Google Scholar] [CrossRef]
  25. Wang, C.Z.; Yao, L.K.; Huang, Y.D.; Ali, S. Railway Alignment design in high risk area of landslide and collapse damming with the chain of quake lake disasters. Railw. Stn. Des. 2019, 63, 17–22. (In Chinese) [Google Scholar]
  26. You, Y.; Wei, Y.X.; Liu, J.F.; Yang, Z.J.; Zhang, G.Z. Mountain disasters and countermeasures of traffic engineering along China-Pakistan Economic Corridor. High Speed Railw. Technol. 2018, S02, 38–42. [Google Scholar]
  27. Nguyen, B.D.; Dang, T.M. Estimation of suspended sediment concentration in downstream of the Ba river basin using remote sensing images. Inzynieria Miner. Pol. Miner. Eng. Soc. 2021, 1, 293–303. [Google Scholar] [CrossRef]
  28. Chau, P.M.; Wang, C.-K.; Huang, A.-T. The spatial-temporal distribution of Goci-derived suspended sediment in Taiwan coastal water induced by typhoon Soudelor. Remote Sens. 2021, 13, 194. [Google Scholar] [CrossRef]
  29. Yu, S.; Mantravadi, V.S. Study on distribution characteristics of suspended sediment in yellow river estuary based on remote sensing. J. Indian Soc. Remote Sens. 2019, 47, 1507–1513. [Google Scholar] [CrossRef]
  30. Zeng, M.; Peng, J.; Jiang, L.; Feng, J. Temporal and spatial distribution of suspended sediment concentration in lakes based on satellite remote sensing and internet of things. IEEE Access 2021, 9, 87849–87856. [Google Scholar] [CrossRef]
  31. Jiang, W.; Ni, Y.; Pang, Z.; Li, X.; Ju, H.; He, G.; Lv, J.; Yang, K.; Fu, J.; Qin, X. An effective water body extraction method with new water index for sentinel-2 imagery. Water 2021, 13, 1647. [Google Scholar] [CrossRef]
  32. Wang, Z.; Liu, J.; Li, J.; Zhang, D.D. Multi-Spectral Water Index (MUWI): A native 10-m multi-spectral water index for accurate water mapping on sentinel-2. Remote Sens. 2018, 10, 1643. [Google Scholar] [CrossRef]
  33. Kwon, S.; Seo, I.W.; Lyu, S. Investigating mixing patterns of suspended sediment in a river confluence using high-resolution hyperspectral imagery. J. Hydrol. 2023, 620, 129505. [Google Scholar] [CrossRef]
  34. Zhang, G.Q.; Wang, M.M.; Zhou, T.; Chen, W.F. Progress in remote sensing monitoring of lake area. Remote Sens. Bull. 2022, 26, 115–125. (In Chinese) [Google Scholar] [CrossRef]
  35. Chen, Y.-M.; Xu, S.-D.; Lin, Q. Quantitative application study on remote sensing of suspended sediment. China Ocean Eng. 2012, 26, 483–494. [Google Scholar] [CrossRef]
  36. Lin, Q.; Chen, Y.M. Mult-temporal analyses of remote sensing on distribution of suspended sediment in Xiamen Estuary. Port Water Eng. 2008, 422, 51–57. (In Chinese) [Google Scholar]
  37. Lin, Q.; Chen, Y.M.; Huang, Y.G. An analysis of distribution of suspended sediment in Estuary by using remote sensing technology. Port Waterw. Eng. 2008, 421, 19–22. (In Chinese) [Google Scholar]
  38. Jiang, X.; Tang, J.; Zhang, M.; Ma, R.; Ding, J. Application of MODIS data in monitoring suspended sediment of Taihu Lake, China. Chin. J. Oceanol. Limnol. 2009, 27, 614–620. [Google Scholar] [CrossRef]
  39. Chen, Y.; Kong, J.L.; Sun, X.M.; Du, D.; Chen, P. Retrieval of sea surface suspended sediment concentration of Bohai gulf offshore area based on semi-analysis model. Geogr. Geo-Inf. Sci. 2014, 30, 33–36. (In Chinese) [Google Scholar] [CrossRef]
  40. Huang, G.R.; Zhang, X.Y.; Han, Y.C.; Chen, J.X.; Zhang, Y.J. Observation of suspended sediment in sea area around Dajin Island based on multi-source remote sensing data. J. Zhejiang Univ. Eng. Sci. 2020, 54, 985–995. (In Chinese) [Google Scholar]
  41. Li, D.K. Identifying flood with high bedload content using MODIS data. J. Catastrophology 2005, 20, 29–35. [Google Scholar]
  42. Bazai, N.A.; Cui, P.; Liu, D.; Carling, P.A.; Wang, H.; Zhang, G.; Li, Y.; Hassan, J. Glacier surging controls glacier lake formation and outburst floods: The example of the Khurdopin Glacier, Karakoram. Glob. Planet. Chang. 2022, 208, 103710. [Google Scholar] [CrossRef]
  43. Zhang, S.; Xu, M.; Xu, J.; Zhao, Q.; Hagemann, S. Estimating the characteristics of runoff inflow into Lake Gojal in ungauged, highly glacierized upper Hunza River Basin, Pakistan. J. Earth Sci. 2013, 24, 234–243. [Google Scholar] [CrossRef]
  44. Bazai, N.A.; Cui, P.; Carling, P.A.; Wang, H.; Hassan, J.; Liu, D.; Zhang, G.; Jin, W. Increasing glacial lake outburst flood hazard in response to surge glaciers in the Karakoram. Earth-Science Rev. 2021, 212, 103432. [Google Scholar] [CrossRef]
  45. Zhou, Y.; Luo, Z.; Shen, Z.; Hu, X.; Yang, H. Multiscale water body extraction in urban environments from satellite images. Remote Sens. 2014, 7, 4301–4312. [Google Scholar] [CrossRef]
  46. Du, Y.; Zhang, Y.; Ling, F.; Wang, Q.; Li, W.; Li, X. Water Bodies’ Mapping from Sentinel-2 Imagery with Modified Normalized Difference Water Index at 10-m Spatial Resolution Produced by Sharpening the SWIR Band. Remote Sens. 2016, 8, 354. [Google Scholar] [CrossRef]
  47. Alcaras, E.; Falchi, U.; Parente, C.; Vallario, A. Accuracy evaluation for coastline extraction from Pléiades imagery based on NDWI and IHS pan-sharpening application. Appl. Geomat. 2022, 15, 595–605. [Google Scholar] [CrossRef]
  48. Chen, Y.; Fan, R.; Yang, X.; Wang, J.; Latif, A. Extraction of urban water bodies from high-resolution remote-sensing imagery using deep learning. Water 2018, 10, 585. [Google Scholar] [CrossRef]
  49. Fu, G.; Liu, C.; Zhou, R.; Sun, T.; Zhang, Q. Classification for high resolution remote sensing imagery using a fully convolutional network. Remote Sens. 2017, 9, 498. [Google Scholar] [CrossRef]
  50. Fan, Y.C.; Zhou, T.G.; Li, C.F. Urban water extraction based on multi-source remote sensing images. In Proceedings of the Eplww3s 2011: 2011 International Conference on Ecological Protection of Lakes-Wetlands-Watershed and Application of 3s Technology, Nanchang, China, 25–26 June 2011; Volume 3, pp. 312–315. [Google Scholar]
  51. Xiong, L.; Deng, R.; Li, J.; Liu, X.; Qin, Y.; Liang, Y.; Liu, Y. Subpixel Surface Water Extraction (SSWE) Using Landsat 8 OLI Data. Water 2018, 10, 653. [Google Scholar] [CrossRef]
  52. McFeeters, S.K. The use of the Normalized Difference Water Index (NDWI) in the delineation of open water features. Int. J. Remote Sens. 1996, 17, 1425–1432. [Google Scholar] [CrossRef]
  53. Qiao, C.; Luo, J.; Sheng, Y.; Shen, Z.; Zhu, Z.; Ming, D. An Adaptive Water Extraction Method from Remote Sensing Image Based on NDWI. J. Indian Soc. Remote Sens. 2011, 40, 421–433. [Google Scholar] [CrossRef]
  54. Feyisa, G.L.; Meilby, H.; Fensholt, R.; Proud, S.R. Automated water extraction index: A new technique for surface water mapping using Landsat imagery. Remote Sens. Environ. 2014, 140, 23–35. [Google Scholar] [CrossRef]
  55. Li, Y.; Xie, K.; Liang, Z.L. Change monitoring of key lakes in Jiangsu province in 2009–2019 based on remote sensing. J. Geomat. 2022, 47, 172–176. (In Chinese) [Google Scholar] [CrossRef]
  56. Özelkan, E. Water Body Detection Analysis Using NDWI Indices Derived from Landsat-8 OLI. Pol. J. Environ. Stud. 2007, 29, 1759–1769. [Google Scholar] [CrossRef] [PubMed]
  57. Jawak, S.; Luis, A. A Rapid Extraction of Water Body Features from Antarctic Coastal Oasis Using Very High-Resolution Satellite Remote Sensing Data. Aquat. Procedia 2015, 4, 125–132. [Google Scholar] [CrossRef]
  58. Yilmaz, O.S.; Gulgen, F.; Sanli, F.B.; Ates, A.M. The performance analysis of different water indices and algorithms using sentinel-2 and landsat-8 images in determining water surface: Demirkopru dam case study. Arab. J. Sci. Eng. 2023, 48, 7883–7903. [Google Scholar] [CrossRef]
  59. Kaplan, G.; Avdan, U. Water extraction technique in mountainous areas from satellite images. J. Appl. Remote Sens. 2017, 11, 046002. [Google Scholar] [CrossRef]
  60. Wang, C.X.; Zhang, J.; Li, Y.X. Construction and validation of GF-2 image water body index in complex environment. Remote Sens. Nat. Resour. 2022, 34, 50–58. (In Chinese) [Google Scholar]
  61. Chukwuka, A.V.; Egware, T.U.; Okali, K.D.; Fadahunsi, A.A.; Oluwakotanmi, P.G.; Emasoga, P.; Ibor, O.R.; Oni, A.A.; Adeogun, A.O. The Influence of Lake Morphology, Landscape Structure, and Urbanization Factors on Bird Community Composition in Wetlands of Four Tropical Lakes. Wetlands 2022, 42, 1–15. [Google Scholar] [CrossRef]
  62. Han, X.; Du, C.; Liu, F.Q.; Li, R. Analysis of suspended sediment concentration in Songhua River based on remote sensing technology. J. Eng. Heilongjiang Univ. 2022, 13, 18–24. (In Chinese) [Google Scholar]
  63. Cai, X. Retrieve of Spatial and Temporal Distribution of Suspended Sediment in Bohai Bay Based on GF-1 Remote Sensing Satellite. J. Atmos. Environ. Opt. 2020, 15, 134–142. (In Chinese) [Google Scholar]
Figure 1. Location of the Attabad landslide-dammed lake. The red line in the picture is the indicator line for the location of the landslide.
Water 16 00714 g001
Figure 2. The map of precipitation changes (The blue dots represent the average monthly precipitation per year. Data from https://www.uea.ac.uk/groups-and-centres/climatic-research-unit, accessed on 17 November 2023).
Water 16 00714 g002
Figure 3. Spatial distribution of the watershed area of Attabad landslide-dammed lake from 2010 to 2020.
Water 16 00714 g003
Figure 4. The change of lake area.
Water 16 00714 g004
Figure 5. The change of LLSI (LLSI is a relative value and is a dimensionless unit).
Water 16 00714 g005
Figure 6. The offset of the lake center of mass (It is a relative value and is a dimensionless unit).
Water 16 00714 g006
Figure 7. Spatial distribution of the SSC in the Attabad landslide-dammed lake from 2010 to 2020 (SSC is a relative value and is a dimensionless unit).
Water 16 00714 g007
Table 1. Table of remote sensing data.
TimeTypes of DataSpatial Resolution
1NOV2010QuickBird0.6 m, 4-band bundling
2NOV2012QuickBird0.6 m, 4-band bundling
3AUG2013Pleiades0.5 m, 4-band bundling
4JUN2016WorldView20.5 m, 4-band bundling
5JUL2017Pleiades0.5 m, 4-band bundling
6SEP2019Pleiades0.5 m, 4-band bundling
7JUL2020WorldView20.5 m, 4-band bundling
Table 2. Result of accuracy assessment in literature (%).
DataGF-2WorldView2GF-1
ModelNDWICWICWICWI
Overall accuracy99.3399.9799.3100
Kappa coefficient45.3194.8694.62100
Table 3. Table of the accuracy of the model inversion.
ModelAccuracy
1single-bandnear-infrared bandlow
green bandhigh
red bandhigh
2band-ratiogreen band/red bandlow
3multi-bandB1/(B2 + B3)high
Table 4. Result of accuracy assessment for dammed lakes in each phase.
Year2010201220132016201720192020Average
Overall accuracy/%86.0287.3290.1391.1391.2789.290.1289.31
Kappa coefficient/%81.2982.6685.7686.1286.8883.5784.1984.35
Table 5. Table of watershed area of Attabad landslide-dammed lake.
Year2010201220132016201720192020
Area/104 m2984619585510517427423
Disclaimer/Publisher’s Note: The statements, opinions and data contained in all publications are solely those of the individual author(s) and contributor(s) and not of MDPI and/or the editor(s). MDPI and/or the editor(s) disclaim responsibility for any injury to people or property resulting from any ideas, methods, instructions or products referred to in the content.

