Abstract
On numerous occasions, we often have very little information or must make a decision considering qualitative aspects that are difficult to evaluate. This study focuses on obtaining objective criteria to assist in decision-making in the design phase of pressurized water pipes in collective irrigation networks. In the layout of these networks, various types of paths and roads for laying pipes can be encountered, and it is not always a simple task to obtain the least costly layout or the one with the fewest issues during construction. In order to obtain objective results, different layout alternatives are evaluated using the Analytic Hierarchy Process (AHP) Multicriteria Analysis Methodology and the Dijkstra algorithm to obtain optimal solutions. This is applied to twelve case studies where the types of available layout paths are identified as alternatives, and four criteria are established for their evaluation. Recognized experts in irrigation modernization conduct the evaluation to derive weighting coefficients for selecting the optimal layout. The coefficients or resistances obtained weigh the lengths of the pipes, allowing the selection of the most suitable alternative based on the defined criteria. The results are compared with a network designed by an expert using classical methodologies, revealing cost improvements in the design phase and a reduction in conflict points, thus leading to faster execution of the works.
1. Introduction
Water management is one of the most critical topics in public and private policies at local, national, and international levels. In this context, studies focusing on the implementation of new technologies in irrigation management are crucial for sustainable water policies and infrastructure [1]. In recent decades, there has been an increasing need to rationalize water resources in the agricultural sector, given the growing scarcity and the associated higher cost of exploitation. Improving technical efficiency, as suggested by works such as those of [2,3,4], benefits sectors like agriculture and industry and reduces associated political and social stress. The current trend in irrigation modernization involves replacing traditional gravity irrigation systems, such as ditches, with pressurized pipe networks that transport water from the collection network (wells, channels, rivers, reservoirs, etc.). This is achieved through a distribution network that extends to consumption nodes or hydrants, from which individual intakes lead to the base of each plot [5,6]. This ensures the possibility of establishing pressurized irrigation. This trend is inseparable from the use of Information and Communication Technologies (ICT) in both design and operation phases [7,8,9] to achieve high water use efficiency, increase network and crop profitability [10,11], and align with Sustainable Development Goal 6, “Clean Water and Sanitation”, of the 2030 Agenda [12].
For proper irrigation facility design, methodologies ensuring high water and energy efficiency at minimal installation and operating costs are essential [13]. Networks must be designed to meet minimum technical requirements such as functionality, service capacity, and durability [14]. These predominantly branched networks are sized using technical and financial optimization techniques, aiming to minimize a function encompassing fixed installation and operating costs [15] or only operating costs [16]. Some projects focus solely on speed criteria for sizing [17]. However, the preliminary phase of terrain recognition, network layout, and hydrant placement is often carried out without technical criteria or knowledge of the irrigable area [18]. Pressurized irrigation pipes tend to be laid along rural roads, dirt or asphalt, crossing roads or other types of paths, without exploring alternatives that could lead to a more economical and/or straightforward layout [19] and reducing execution-related problems such as permission acquisition or soil geotechnics. While it may seem logical to minimize pipe length for a lower-cost network [20], the layout must also consider various impediments, such as environmental impacts, permission difficulties, soil types, etc. [21].
Sometimes, we have limited information or must make decisions based on qualitative aspects that are challenging to assess. Having objective technical criteria for pressurized irrigation pipe layouts is crucial for designing efficient, cost-effective networks that reduce the impact during execution and operation. Therefore, this study uses the Analytic Hierarchy Process (AHP) to establish a methodology for selecting optimal pressurized water pipe layouts in collective irrigation networks based on objective criteria.
In summary, AHP is a method that selects alternatives based on a set of criteria, typically hierarchized, which may conflict. In this hierarchical structure, the ultimate goal is at the highest level, with criteria and sub-criteria at lower levels. To be effective, it is crucial to carefully choose well-defined, relevant, and mutually exclusive criteria.
The main purpose of this research is to establish a methodology for objective criteria in choosing pressurized water pipe layouts in collective irrigation networks. This methodology, based on AHP, will assign resistance values to each type of layout path, weighting pipe lengths and favoring layouts with lower resistance values. Resistance is understood as the multiplying or increasing coefficient affecting each layout alternative, which, after AHP evaluation by experts, modifies its length. Therefore, the one with lower resistance is a better solution. To validate the methodology, it is applied to twelve case studies, serving as explanatory examples and enabling decisions on which layouts offer less resistance to pipe installation based on objective criteria.
2. Materials and Methods
The methodology analyzes possible solutions to the pipe layout problem using a Multicriteria Analysis Theory, obtaining resistances processed through raster images in a Geographic Information System (GIS). The Dijkstra algorithm, applied in a GIS (QGIS 3.X), identifies the layout with the least resistance for each considered segment. This method, used as a basis for layout in other studies [22,23], is implemented in Python on QGIS to calculate the least resistant layouts for irrigation pipes. QGIS 3.X, a software used for designing [24] and modeling these networks, supports this task through plugins [25,26].
2.1. Case Studies
The proposed methodology is validated using twelve case studies located in different municipalities in the Valencian Community, Spain, all of them devoted to citrus cultivation. These studies cover irrigable areas ranging from 119.08 ha to 180.83 ha. To extrapolate the results to similar irrigation zones, selected areas must meet criteria such as current crop cultivation and plot sizes between 0.25 ha and 1.25 ha per plot. Since the study aims to characterize only irrigable areas, the methodology can be extrapolated to all those with similar characteristics in other geographic regions.
The initial data taken for the twelve case studies regarding their surface characteristics, number of plots, type of collection, crop, demanded flow rates, and installation cost is shown in Table 1.

Table 1.
Characteristic data of the irrigation areas studies.
The following Figure 1 shows the location of the irrigable surfaces mentioned in the previous table. All of them belong to the province of Valencia, Spain.
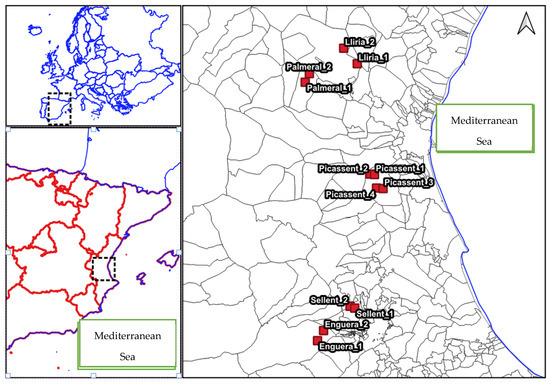
Figure 1.
Location of the irrigated areas studied.
2.2. Objective and Problem Statement
The main objective of this study is to obtain the resistances to the layout offered by each typology of road or candidate path for laying pipes. Therefore, obtaining reliable results from this part of the process will improve the final installation results both from a technical and economic perspective.
The problem involves decision-making based on a selection of alternatives according to a series of criteria or variables. In this case, decision-making will not be carried out solely based on economic criteria, as is often the case [27], but with the involvement of various criteria such as impacts, types of terrains, issues in obtaining permissions, etc. Hence, it is decided to use methodologies from the Multicriteria Decision Theory. In these methods, decisions are not made based on a single criterion; instead, a balance or compromise is sought among a usually conflicting set of criteria or goals associated with the objectives [28].
Therefore, decision-making will be undertaken using the Analytic Hierarchy Process (AHP) method proposed by Th. Saaty in 1980 [29]. This method is based on the hierarchical decomposition of the problem into its goal, decision criteria, and alternatives.
In the use of this method, the role of decision-makers is crucial. They must be professionals with recognized experience in the field of application and will be responsible for the final decision-making [30].
2.3. AHP Methodology
AHP methodology aids decision-making and is widely used in the business world. It allows for establishing a priority list for a set of possible alternatives through pairwise comparisons between elements with a scale designed specifically for the method. The numerical scale was established by Saaty for the use of the method [29] (Table 2).
Table 2.
Fundamental scale of pairwise comparisons [29].
By comparing the alternatives pairwise for each criterion and using the scale from the previous table, square decision matrices are obtained that must satisfy the properties of reciprocity (if aij = x, then aji = 1/x), homogeneity (if i and j are equally important, aij = aji = 1, and also aii = 1 for all i), and consistency (the matrix must not contain contradictions in the valuation). The dimensions of the decision matrix depend on the number of criteria and alternatives selected, always being square as both criteria and alternatives are compared pairwise. The eigenvector vai of the proposed matrix indicates the importance or weighting of each alternative for each criterion.
The methodology allows evaluation of the inconsistency of expert decisions through the consistency ratio (CR). The ability to measure the consistency of results is one of the strengths of the method, as it ensures that the information entered into the model is correct. The calculation is carried out as follows:
where
- CI: consistency index;
- n: dimension of the comparison matrix;
- λmax: dominant eigenvalue.
- RI: random index;
- n: dimension of the comparison matrix.
Generally, the following values can be taken depending on the range of the matrix (Table 3).
Table 3.
Consistency ratio of paired comparison matrices [29].
In case these values are not met, the obtained judgments must be reviewed, or the matrix must be discarded.
Regarding the criteria to be used, a high number of them can, in some cases, be quite complex. Miller sets this limit at seven, which is called the ‘magic number’, as higher sets are difficult to handle [31]. In this case, four criteria have been selected, an appropriate number that encompasses the entirety of the issues to be addressed.
This method is empirically validated in various applications, practically in almost all knowledge sectors such as economics and transportation [32,33,34], resource localization [35,36,37], healthcare [38,39], marketing [40], agriculture [41,42], project management [43], and hydrology [44].
In this case, the method will be used to determine the best layout for each segment of the irrigation network. Various studies exist where the method is utilized to find solutions for the least costly routes for transportation and movement [45] and where combined methods with GIS are applied for pipeline layout [46].
Alternatives
At this point, the possible layout alternatives that can be found in the design of pressurized irrigation networks are established. Identifying these alternatives for each specific case study is important because the uniqueness of each area will lead to different results for each alternative. In this case, those considered primary and prioritized are established. Not all of them are present in the case studies, so for their evaluation, only the ones detected in the cases are used. Shown in Table 4.
Table 4.
Classification and coding of layout alternatives.
Criteria
Once those geographical elements that can be used as pathways for the layout of pressurized irrigation pipelines are defined, it is time to determine the importance or weight of each of them. Given their characteristics, not all alternatives can be used under the same conditions, because each of them has its particularities, making the layout more difficult or easier depending on the criteria considered.
The relevance of each layout option will be defined by the pairwise comparison of all participating criteria in the study, as well as the comparison of the different alternatives among themselves. For this case study, the following criteria have been defined.
Criterion A: Type of roadway
This criterion aims to determine the negative impact that the temporary occupation or cutting of the roadway will have on the installation of pipelines. The complexity of carrying out work on different types of roads, such as highways, main roads, paths, etc., varies significantly depending on various factors. These factors are related to the difficulty of access to the roads and the possible impacts that may arise during the execution of the works. Roads with high traffic intensity, such as highways or main roads, can generate more problems of impact and access than roads with lower traffic, such as a rural path.
Criterion B: Type of pavement
The type of pavement and composition of the road or pathway to be laid out affects the costs of demolition and replacement of the road, as well as the total execution time of the work [18]. In terms of optimizing the layout, it is advisable to avoid those that involve higher costs, both for trenching and replacement, and longer execution times.
Simplifying all types of pavements [47] found in the case studies, they can be included in the following three main groups shown in Table 5.
Table 5.
Subcriteria of Criterion B.
In this case, experts must assess both the demolition task of the existing pavement, if any, and the replacement based on the type of roadway along which the pipeline is traced.
Criterion C: Permission obtaining
Obtaining permits and licenses is a relevant issue when carrying out any type of construction. There are studies stating that it is one of the main causes of construction delays [48,49]. This criterion aims to consider the problems and delays in execution that obtaining a construction permit can trigger, depending on the relevant authority. General aspects of the permit application are considered. Experts must consider the following aspects:
- Number of permissions to be requested;
- Functioning of the issuing authority;
- Ease of obtaining the permission;
- Number of documents per permission;
- Resolution time.
Criterion D: Accessibility to the roadway
Although there are many definitions for the concept of spatial accessibility, here we refer to it as the ‘ease with which a service can be reached from a location’ [50]. We will measure this ease as the speed at which the network manager or technician can access the tracing element in question using mobile vehicles. This implies that for each layout alternative, objective criteria must be established for later pairwise comparison. In case the element cannot be traversed, the speed of the roadway will be determined as 0 km/h. To allow experts to provide their assessments, the following maximum speed values are established in Table 6 for each of the roadways detected in the case studies.
Table 6.
Accessibility coefficients for each type of element [51].
Expert panel
Finally, once the criteria and alternatives were obtained, categorized, and analyzed, the selection of experts took place. This phase is a critical step in the application of the methodology. The selection of the right experts ensures the quality and reliability of the results [52]. The criteria considered for their selection were as follows:
- Solid knowledge directly related to the modernization of irrigation;
- Practical experience in the design phase of such projects;
- Impartiality and without personal interest in decision-making;
- Familiarity with the methodology to be applied.
Five interviews were conducted with technical specialists with extensive and recognized experience in the design, execution, and maintenance of irrigation and irrigation modernization projects. The profiles of the five experts were men and women between 30 and 60 years old with degrees in Agricultural Technical Engineering, Agricultural Engineering, and Ph.D., professionals with project management capabilities.
Hierarchical Structure
The hierarchical structure applied to the problem in question is shown in Figure 2. The highest level locates the decision problem, i.e., the objective. Elements affecting the decision are represented at lower levels so that criteria occupy the intermediate level. Finally, at the lowest level, decision options or alternatives are represented. Consensus among all parties involved is required for construction.
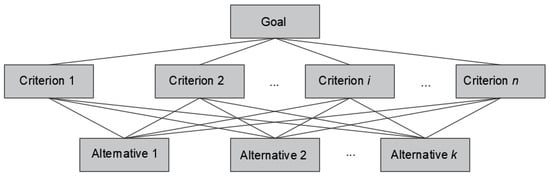
Figure 2.
Hierarchical structure of the case study.
Example of Matrices.
The methodology established for value determination by the experts is as follows. Each expert was provided with a criteria and alternatives matrix for assessment using the Saaty proposed scale. An example matrix (Table 7) is attached.
Table 7.
Criteria matrix. Example.
After each expert’s assessment, the following sequence of checks must be carried out:
- Limitation of CR value: For criteria matrices (rank 3), a CR value limit below 5.0% has been established, as shown in Table 3. In the case of alternatives matrices (rank 9), the CR limit value is 10.0%.
- Obtaining eigenvectors: Once it is verified that the established CR values are met, the weights of each expert for each criterion are calculated based on Saaty’s Analytic Hierarchy Process method.
- Obtaining consensus values: Since this technique cannot issue multiple assessments, it is essential to prepare a matrix of consensus values. In this case, having opinions from five experts, according to each expert’s criterion, all these judgments must be synthesized into one. For this purpose, the study by [53] can be used, demonstrating that the geometric mean complies with the reciprocal property. In contrast, if the arithmetic mean is used, this property does not hold.
- Final results: The results below (Table 8) used consistency values of 0.05 for criteria and 0.10 for alternatives as references.
Table 8. CR values for the expert panel.
Therefore, only the assessments of experts 1, 2, 3, and 5 will be considered since expert 4 obtained values of unacceptable inconsistency. After these checks, it is possible to obtain eigenvectors and resistance values that will be part of the irrigation pipes tracing process.
2.4. Use of GIS. Methodology Applied to Graphs
In this study, a combination of finding paths with minimal resistance and the use of Geographic Information Systems will be employed. This methodology is based on graph theory concepts, allowing the search for an optimal path to be solved as a graph search problem [54]. The algorithm obtains a path of minimum resistance from one vertex to each of the vertices composing the graph.
The strategy of the Dijkstra algorithm [55] consists of growing a tree, starting from a previously established origin node, by adding, in each iteration, a border edge whose vertex not belonging to the tree is as close as possible to the initial one.
The Dijkstra algorithm uses a strategy called “minimum cost search” to gradually determine the shortest path from the origin node to all other nodes. It starts by assigning an initial infinite cost to all nodes except the origin node, to which an initial cost of zero is assigned. Then, the node with the lowest cost is chosen, and all its adjacent edges are examined. If the total cost of reaching a neighbor node through the current node is lower than the currently assigned cost to that node, the cost is updated. This process is repeated until all nodes in the graph have been examined [56]. The following Figure 3 shows a series of algorithm iterations to find the path with the least resistance.
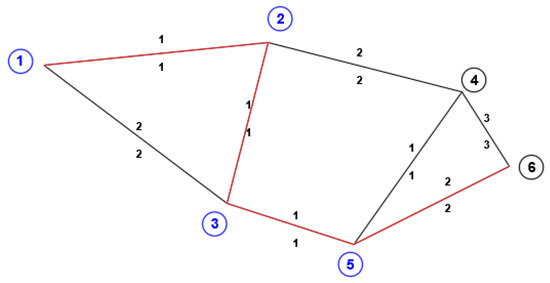
Figure 3.
Example of the course of the Dijkstra algorithm.
The resistance values obtained act as tracing resistances in the arcs that form each of the nodes. In this case, the nodes correspond to points already defined in the network, such as the collection point, multi-user hydrants (elements that provide service to a group of plots with flow and pressure measurement and/or regulation), and the final water outlet in each plot. Given the magnitude of data represented by the irrigation surfaces of the study cases or any network of this kind to be analyzed, it is essential to have computer tools that automate these processes. The goal is to achieve a tracing base that allows movement in any direction without isolated areas that lead to longer traces.
At a second methodological level, and for the graphical representation of resistances and to create the map, it was decided to use raster objects instead of vector objects. A raster is nothing more than an image where each of its pixels takes a different value based on its characteristics. In this case, the value of each pixel is derived from the resistance to the trace defined for that type of route. In this case, their use improves the traces and their logic, as it creates a network of points without gaps where the program can advance in any direction. In contrast, with vector objects, vertices are required, which are not always connected, leading to fewer logical traces. In the following image (Figure 4), it can be noticed how tracing with raster objects improves trace length and has a greater logic than with vector objects.
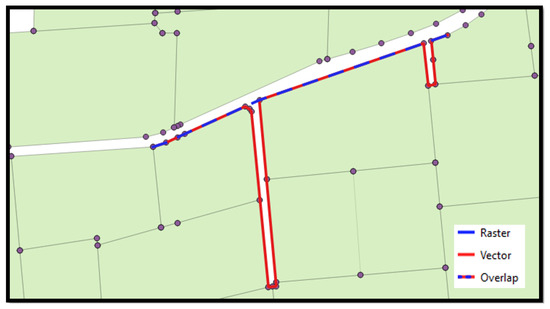
Figure 4.
Tracing with raster object vs. vectorial.
As observed, vector tracing is unable to cross the path since the vertices are disconnected, thus resulting in greater length. On the other hand, the raster object, without gaps, can follow the path of least resistance and offers better and more coherent results, so it was decided to use raster objects with the QGIS 3.X software.
Another value to be decided is the pixel size to use. In this work, three pixel sizes were tested, namely 2.0 m, 1.0 m, and 0.5 m. The pixel size influences both the execution time of the traces and their zig-zag effect. It was found that with a smaller pixel size (0.5 m side length), the trace generates more vertices, creating a zig-zag effect that is not representative of reality (Figure 5). On the other hand, larger pixel sizes, such as 2.0 m side length, result in almost no vertices, sometimes generating traces outside the paths or boundaries as their values need to be extrapolated.
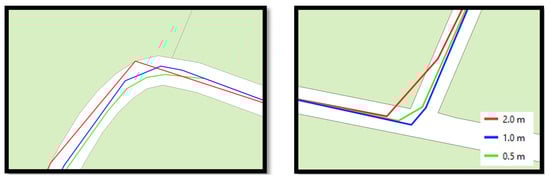
Figure 5.
Layout with different pixel sizes.
In the above figure, it is observed that tracing with pixel sizes of 1.0 m and 0.5 m is similar, following the course of the path and providing a representation of reality. The blue trace generates fewer vertices, thus reducing execution times for very similar results. A pixel size of 2.0 m is too large for this experiment, as it generates unrealistic traces with long straight sections not representing the actual trace of the pipes.
In the following graph (Figure 6), the average number of vertices generated per 100 m of tracing and its evolution based on the pixel size can be seen.
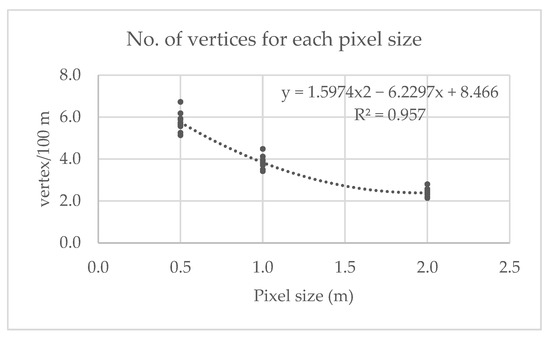
Figure 6.
No. of vertices for each pixel size.
On the other hand, the pixel size also influences the software execution time and the automatic tracing of pipes. With a smaller pixel size, execution times increase because the number of tracing possibilities between each pixel increases exponentially, as summarized in the following Figure 7.
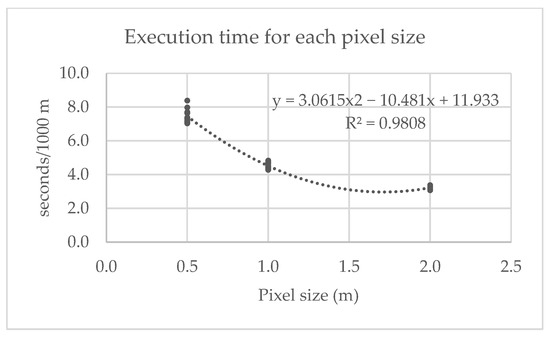
Figure 7.
Execution time for each pixel size.
Therefore, given the problem of representing reality that comes with a high pixel size, such as 2.0 m × 2.0 m, and the long execution times associated with a small pixel size, it is considered appropriate to use a medium pixel size, such as 1.0 m × 1.0 m (Figure 8).
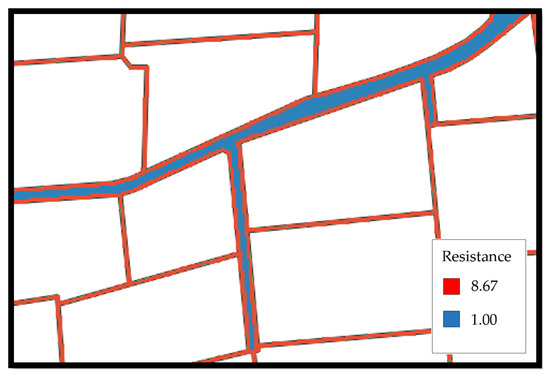
Figure 8.
Identification of roads and paths. Raster data.
Larger values create too many gaps, with the subsequent zig-zag pattern in the layout, while smaller values result in very heavy files that slow down the process without leading to better solutions.
Now, with the rasterized object, each pixel centroid acts as a node, which implies a large number of arcs through which the layout of pipes can pass. These nodes provide greater precision in the layout and prevent long layouts from nodes without adjacent elements.
With defined resistance values implemented on a raster object, it is now time to obtain the layout of each candidate intake between the defined water outlet and the candidate hydrants. This process is automated using the Model Builder tool of QGIS 3.X.
This tool allows, through a graphical interface, the assignment of different chained calculations where input data are introduced, and a final result is obtained with measurements and execution costs.
3. Results
3.1. Resistance Values
After applying the methodology proposed by Saaty, the eigenvectors are obtained first for each alternative (Table 9), and then the results relative to the lowest obtained value are converted, this being a value of 1.0 (Table 10).
Table 9.
Final eigenvector.
Table 10.
Resistance values for each type of road.
Therefore, the resistance indices to be used are transformed into values greater than 1 so that they become magnifying coefficients while maintaining the same relationship between them.
In the obtained values, it is observed that secondary and terminal rural roads, both paved and unpaved (601, 602, 701, and 702), have the lowest resistances and, therefore, the highest number of pipes will be laid. This is because obtaining work permissions on these types of roads is quick and easy, and the types of terrain encountered are not complex for pipe execution.
Primary rural roads (500) obtain slightly higher values than secondary roads because these roads have significant traffic in municipalities and connect strategic areas, sometimes making it difficult to close them for construction works.
Regarding regional and local roads (300 and 400), the obtained values are much higher, mainly because obtaining occupancy permissions for this type of road is complex. In addition, installing pipes on these roads requires special works such as horizontal drilling and greater safety and protection measures, ultimately increasing the cost of the work.
Plot boundaries (800) obtain a medium resistance value for laying. These areas are sometimes complex because executing the work requires occupying plots of private owners who are not always in agreement. On the other hand, regarding areas to be excavated, they are usually softer and easier to execute since they are cultivated lands.
The layout of non-natural watercourse channels (900) is a laborious process, as reflected in the result of their resistance. Crossing channels or ditches with an active water flow is complex because works on them involve cutting off the water supply, which is not always viable. Additionally, they require high-cost replacement works and are difficult to execute.
Finally, routes with special environmental or cultural protection receive low resistance for this type of work. The permissions to be obtained are for temporary occupancy since the pipes will be completely buried. Therefore, according to the results, it is a feasible option for laying pipes.
3.2. Cost Savings
After evaluating the costs of the irrigation network and comparing them with the results of the external design, a reduction in the total cost is obtained in all cases. This saving ranges from 1.8% in the Enguera_2 case to 14.8% in the Picassent_3 case. The average saving for the twelve case studies is 6.4%. This magnitude of saving can, at times, make a significant difference in whether the property decides to proceed with the project. The following Figure 9 graphically shows the savings produced by the application of the methodology in each case study.
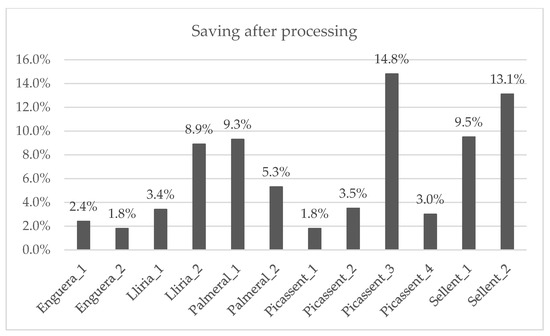
Figure 9.
Saving (%) after the application of the methodology.
Through the application of the AHP methodology, the resistance of the roads and paths in irrigable areas was evaluated to obtain the resistance of each of them. The average resistance of the twelve case studies has been obtained, with some cases having values close to 1.50 up to values exceeding 3.00.
Graphically, the average resistance can be seen in Figure 10.
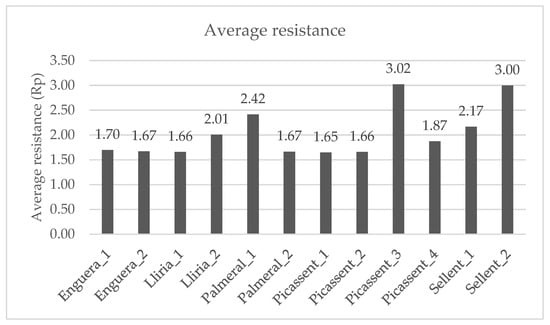
Figure 10.
Average resistance.
3.3. Graphic Result
The main result of the study is a global optimizated layout of the network in which everything is developed in a graphic and intuitive environment. The process of laying pipes is obtained in shp format, from which both plans for graphic composition and measurements of each type of material used can be achieved. The following image (Figure 11) shows the result of the Picassent_3 case study.
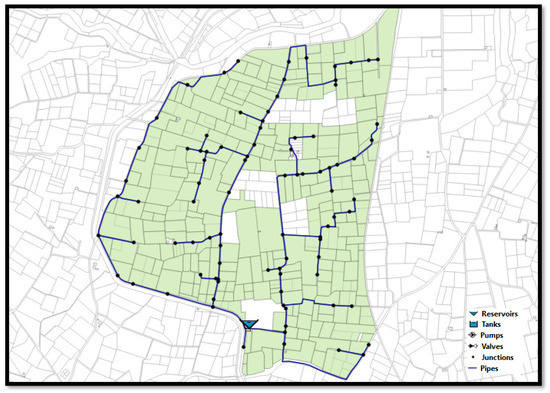
Figure 11.
Result of the pipe tracing in the Picassent_3 study case.
3.4. Prediction of Saving Based on Resistance
On the other hand, the possible interaction between the average resistance of irrigable areas and the obtained improvement factor is studied. The following regression is obtained.
The results of Figure 12 show three differentiated groups. Cases with lower improvement correspond to irrigable surfaces with low resistance. In these cases, unpaved roads, secondary roads, and terminals predominate. The obtained resistances fall within the range between 1.65 and 1.87.
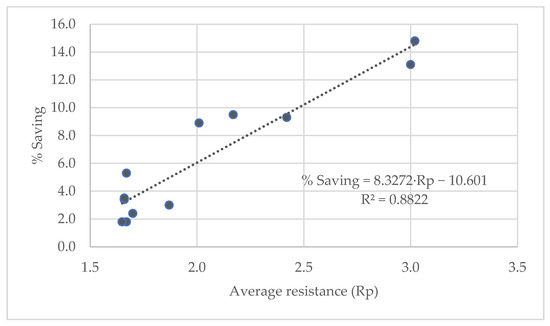
Figure 12.
Relationship between the improvement factor and the average resistance obtained using AHP.
Secondly, saving percentages of 9.0 to 10% are observed, with an average resistance between 2.01 and 2.42. In these cases, in addition to unpaved rural roads, there are some paved roads and sections with road crossings.
Finally, those cases where the savings are less than 12.0% correspond to average resistances exceeding 3.0. In these cases, paved roads and areas with roads predominate.
The regression that best fits is linear, obtaining an R2 value of 0.88, and the following regression equation:
where
- Rp: Average resistance of the irrigable area.
This implies that, knowing the average resistance of an irrigable surface, an approximation of the expected savings in the application of the method can be obtained. This factor can be useful to assess whether the method should be applied or, on the contrary, whether the savings are not significant and its application is not justified.
4. Conclusions
The automation of laying intakes to plots using the Dijkstra algorithm, based on a raster image generated from different resistances obtained from the AHP Multicriteria Analysis Method, allows for obtaining layouts with the least resistance for each section.
The use of the AHP multicriteria decision-making method adapted to the case study is useful for its application to the design of pressure irrigation networks. It prioritizes layouts in simpler areas, such as rural roads with or without pavement, leaving crossing channels, intersections, or parallels on roads or environmentally protected areas as the last options. This means that considering different criteria not only reduces installation costs but also the impacts and issues that may arise during the construction and operation phases. Cost reduction results range from 1.8% to 14.8%, representing significant savings in these types of projects.
In addition to the economic saving obtained, a possible working methodology is provided that, for the design of pressure irrigation networks, contributes to the standardization of criteria and results by eliminating intuitive or arbitrary factors from the design process and incorporating consensuses based on proven experience. This will help the overall design of the entire implementation process of a collective pressure irrigation network.
Everything is encompassed in a geographic information system with free licensing, so its application accessibility is total and can be extrapolated to other areas with different crops and irrigation technologies.
Author Contributions
Conceptualization, J.M.J.; Methodology, C.G.-P. and I.B.-P.; Formal analysis, C.V.P.; Investigation, C.G.-P.; Resources, S.G.-P.; Writing – original draft, C.G.-P., C.V.P. and J.M.J.; Supervision, V.E.-G. and I.B.-P. All authors have read and agreed to the published version of the manuscript.
Funding
This research received no external funding.
Data Availability Statement
Data are contained within the article.
Conflicts of Interest
The authors declare no conflict of interest.
References
- WWAP. The United Nations World Water Development Report 2015: Water for a Sustainable World; WWAP: Paris, France, 2015. [Google Scholar]
- Allan, T. Productive efficiency and allocative efficiency: Why better water management may not solve the problem. Agric. Water Manag. 1999, 40, 71–75. [Google Scholar] [CrossRef]
- Lecina, S.; Isidoro, D.; Playán, E.; Aragüés, R. Irrigation modernization and water conservation in Spain: The case of Riegos del Alto Aragón. Agric. Water Manag. 2010, 97, 1663–1675. [Google Scholar] [CrossRef]
- Playán, E.; Mateos, L. Modernization and optimization of irrigation systems to increase water productivity. Agric. Water Manag. 2006, 80, 100–116. [Google Scholar] [CrossRef]
- Chen, L.; Duan, Z.; Li, W.; Yang, G.; Jia, J.; Ma, L.; Li, M.; Zhong, Y.; Sun, H.; Jiang, C. Physical Properties and Boundary Influence of Singularity in Fluid Pipelines Based on Vibration Wave’s Transmission Characteristics. J. Pipeline Syst. Eng. Pract. 2022, 13, 4021066. [Google Scholar] [CrossRef]
- Gurung, T.R.; Stewart, R.A.; Beal, C.D.; Sharma, A.K. Smart meter enabled water end-use demand data: Platform for the enhanced infrastructure planning of contemporary urban water supply networks. J. Clean. Prod. 2015, 87, 642–654. [Google Scholar] [CrossRef]
- Bonet, L.; Ferrer, P.J.; Castel, J.R.; Intrigliolo, D.S. Soil capacitance sensors and stem dendrometers: Useful tools for irrigation scheduling of commercial orchards?-Dialnet. Spanish J. Agric. Res. 2010, 2, 52–65. [Google Scholar] [CrossRef]
- González Villa, F.; Garcia Prats, A. Using Location-Allocation Algorithms to Distribute Multioutlet Hydrants in Irrigation Networks Design. J. Irrig. Drain. Eng. 2011, 138, 304–309. [Google Scholar] [CrossRef]
- Jímenez-Bello, M.Á.; López-Pérez, E.; Manzano-Juárez, J.; Palau Estevan, C.V.; Royuela-Tomás, Á.; Intrigliolo-Molina, D.S. Assessing irrigation performance in a citrus irrigation district using geographic information systems and remote sensing data. Ital. J. Agrometeorol. 2015, 3, 104–109. [Google Scholar]
- Prieto, M.A.; Murado, M.A.; Bartlett, J.; Magette, W.L.; Curran, T.P. Mathematical model as a standard procedure to analyze small and large water distribution networks. J. Clean. Prod. 2015, 106, 541–554. [Google Scholar] [CrossRef]
- Tariq, S.; Hu, Z.; Zayed, T. Micro-electromechanical systems-based technologies for leak detection and localization in water supply networks: A bibliometric and systematic review. J. Clean. Prod. 2021, 289, 125751. [Google Scholar] [CrossRef]
- Cepal, N.U. Agenda 2030 y los Objetivos de Desarrollo Sostenible: Una Oportunidad para América Latina y el Caribe. 2018. Available online: https://repositorio.cepal.org/server/api/core/bitstreams/cb30a4de-7d87-4e79-8e7a-ad5279038718/content (accessed on 27 December 2023).
- Horst, L. The Dilemmas of Water Division: Considerations and Criteria for Irrigation System Design; International Water Management Institute: Colombo, Sri Lanka, 1998; ISBN 9290903651. [Google Scholar]
- Farshad, M. Plastic Pipe Systems: Failure Investigation and Diagnosis; Elsevier: Amsterdam, The Netherlands, 2011; ISBN 0080463932. [Google Scholar]
- Arviza Valverde, J. Diseño y dimensional de la red de transporte en un sistema de riego localizado. In Datos de Partida, Topología y Trazado; Universidad Politécnica de Valencia: Valencia, Spain, 2017. [Google Scholar]
- Lapo, C.M.; Pérez-García, R.; Aliod-Sebastián, R.; Martínez-Solano, F.J. Diseño óptimo de redes de riego a turnos y caracterización de su flexibilidad. Tecnol. Y Cienc. Del Agua 2020, 11, 266–314. [Google Scholar] [CrossRef]
- González-Cebollada, C.; Macarulla, B. Comparative analysis of design methods of pressurized irrigation networks. Irrig. Drain. 2012, 61, 1–9. [Google Scholar] [CrossRef]
- García Prats, A. Definición en Plzanta de Redes de Riego a Presión de Mínimo Coste de Implantación y Gestión Mediante Sistemas de Información Geográfica [Recurso Electrónico-CD-ROM]. Ph.D. Thesis, Univ. Politécnica de Valencia, Valencia, Spain, 2005. [Google Scholar]
- Abadía Sanchez, R. Optimización del Diseño y Gestión de Redes Colectivas de Distribución de Aguas Para Riego por Goteo de Cultivos Leñosos. Aplicación al Regadío de Mula (Murcia). Doctoral Dissertation, Univ. Miguel Hernández, Orihuela, Spain, 2003. [Google Scholar]
- Guillem Picó, S. Modelo Económico del Coste de Implantación de Redes de Riego a Presión Para Riego Localizado, Utilizando los Sistemas de Información Geográfica, Aplicación Para el Diseño Topográfico Óptimo de los Sectores o Zonas de Riego. Ph.D. Thesis, Universitat Politècnica de València, València, Spain, 2000. [Google Scholar]
- Labye, Y.; Olson, M.A.; Galand, A.; Tsiourtis, N. Design and Optimization of Irrigation Distribution Networks; FAO: Rome, Italy, 1988. [Google Scholar]
- Meijer, D.; Post, J.; van der Hoek, J.P.; Korving, H.; Langeveld, J.; Clemens, F. Identifying critical elements in drinking water distribution networks using graph theory. Struct. Infrastruct. Eng. 2021, 17, 347–360. [Google Scholar] [CrossRef]
- Prats, A.G.; Picó, S.G. Layout design of irrigation networks in highly parcelled territories using geographical information system. J. Irrig. Drain. Eng. 2007, 133, 573–582. [Google Scholar] [CrossRef]
- Khasan, A.F.; Rondhi, M.; Mori, Y.; Kondo, T. Geolocation data of irrigation network in water user association’s operation area under community-based and provider-based network governance. Data Br. 2020, 32, 106168. [Google Scholar] [CrossRef] [PubMed]
- Martínez Alzamora, F.; Lerma, N.; Bartolin, H.; Vegas Niño, O. Upgrade of the GISRed application for the free analysis of WDN under GIS environment. In Proceedings of the 17th International Computing & Control for the Water Industry Conference, Exeter, UK, 1–4 September 2019. [Google Scholar]
- Nibi, K.V.; Kumar, M.N.; Devidas, A.R.; Ramesh, M.V.; Thadathil, S.P. GIS based Urban Water Distribution Network Analysis: A Case Study in Kochi, India. In Proceedings of the 2022 International Conference on Computing, Communication, and Intelligent Systems (ICCCIS), Greater Noida, India, 4–5 November 2022; pp. 956–963. [Google Scholar]
- Masoumi, M.; Kashkooli, B.S.; Monem, M.J.; Montaseri, H. Multi-objective optimal design of on-demand pressurized irrigation networks. Water Resour. Manag. 2016, 30, 5051–5063. [Google Scholar] [CrossRef]
- Romero, C. Análisis de las Decisiones Multicriterio; Isdefe: Madrid, Spain, 1996; Volume 14. [Google Scholar]
- Saaty, T.L. The Analytic Hierachy Process; RWS Publications: Pittsburgh, PA, USA, 1990. [Google Scholar]
- Tsyganok, V.V.; Kadenko, S.V.; Andriichuk, O.V. Significance of expert competence consideration in group decision making using AHP. Int. J. Prod. Res. 2012, 50, 4785–4792. [Google Scholar] [CrossRef]
- Miller, G.A. The magical number seven, plus or minus two: Some limits on our capacity for processing information. Psychol. Rev. 1956, 63, 81. [Google Scholar] [CrossRef]
- Kabir, G.; Sadiq, R.; Tesfamariam, S. A review of multi-criteria decision-making methods for infrastructure management. Struct. Infrastruct. Eng. 2014, 10, 1176–1210. [Google Scholar] [CrossRef]
- Nosal, K.; Solecka, K. Application of AHP method for multi-criteria evaluation of variants of the integration of urban public transport. Transp. Res. Procedia 2014, 3, 269–278. [Google Scholar] [CrossRef]
- Podvezko, V. Application of AHP technique. J. Bus. Econ. Manag. 2009, 181–189. [Google Scholar] [CrossRef]
- Abudu, D.; Williams, M. GIS-based optimal route selection for oil and gas pipelines in Uganda. Adv. Comput. Sci. an Int. J. 2015, 4, 93–104. [Google Scholar]
- Choudhary, D.; Shankar, R. An STEEP-fuzzy AHP-TOPSIS framework for evaluation and selection of thermal power plant location: A case study from India. Energy 2012, 42, 510–521. [Google Scholar] [CrossRef]
- Tavakkoli, M.R.; Mousavi, S.M.; Heydar, M. An Integrated AHP-Vikormethodology For Plant Location Selection. 2011. Available online: https://www.ije.ir/article_71899.html (accessed on 27 December 2023).
- Büyüközkan, G.; Çifçi, G.; Güleryüz, S. Strategic analysis of healthcare service quality using fuzzy AHP methodology. Expert Syst. Appl. 2011, 38, 9407–9424. [Google Scholar] [CrossRef]
- Improta, G.; Russo, M.A.; Triassi, M.; Converso, G.; Murino, T.; Santillo, L.C. Use of the AHP methodology in system dynamics: Modelling and simulation for health technology assessments to determine the correct prosthesis choice for hernia diseases. Math. Biosci. 2018, 299, 19–27. [Google Scholar] [CrossRef]
- Wickramasinghe, V.S.K.; Takano, S. Application of combined SWOT and analytic hierarchy process (AHP) for tourism revival strategic marketing planning. In Proceedings of the Eastern Asia Society for Transportation Studies Vol. 7 (The 8th International Conference of Eastern Asia Society for Transportation Studies, 2009); Eastern Asia Society for Transportation Studies: Hiroshima, Japan, 2009; p. 189. [Google Scholar]
- Jorge-García, D.; Estruch-Guitart, V. Comparative analysis between AHP and ANP in prioritization of ecosystem services-A case study in a rice field area raised in the Guadalquivir marshes (Spain). Ecol. Inform. 2022, 70, 101739. [Google Scholar] [CrossRef]
- Jorge-García, D.; Estruch-Guitart, V. Economic valuation of ecosystem services by using the analytic hierarchy process and the analytic network process. comparative analysis between both methods in the Albufera Natural Park of València (Spain). Int. J. Des. Nat. Ecodynamics 2020, 15, 1–4. [Google Scholar] [CrossRef]
- Al-Harbi, K.M.A.-S. Application of the AHP in project management. Int. J. Proj. Manag. 2001, 19, 19–27. [Google Scholar] [CrossRef]
- Dano, U.L.; Balogun, A.-L.; Matori, A.-N.; Wan Yusouf, K.; Abubakar, I.R.; Said Mohamed, M.A.; Aina, Y.A.; Pradhan, B. Flood susceptibility mapping using GIS-based analytic network process: A case study of Perlis, Malaysia. Water 2019, 11, 615. [Google Scholar] [CrossRef]
- Effat, H.A.; Hassan, O.A. Designing and evaluation of three alternatives highway routes using the Analytical Hierarchy Process and the least-cost path analysis, application in Sinai Peninsula, Egypt. Egypt. J. Remote Sens. Sp. Sci. 2013, 16, 141–151. [Google Scholar] [CrossRef]
- Durmaz, A.I.; Ünal, E.Ö.; Aydın, C.C. Automatic pipeline route design with multi-criteria evaluation based on least-cost path analysis and line-based cartographic simplification: A case study of the mus project in Turkey. ISPRS Int. J. Geo-Inf. 2019, 8, 173. [Google Scholar] [CrossRef]
- Ministerio de Fomento. Orden FOM/3460/2003, de 28 de Noviembre, por la que se Aprueba la Norma 6.1-IC ‘Secciones de firme’, de la Instrucción de Carreteras. 2003. Available online: https://www.boe.es/buscar/doc.php?id=BOE-A-2003-22787 (accessed on 27 December 2023).
- Nouri, M.; Nooripoor, M. Analysis of the Reasons for Delay in Completion of Irrigation and Drainage Network Projects Using Problem Tree Tool: The Case of Kheyrabad. Iran. Agric. Ext. Educ. J. 2013, 9, 15–32. [Google Scholar]
- Sweis, G.; Sweis, R.; Hammad, A.A.; Shboul, A. Delays in construction projects: The case of Jordan. Int. J. Proj. Manag. 2008, 26, 665–674. [Google Scholar] [CrossRef]
- Arentze, T.A.; Borgers, A.W.; Timmermans, H.J. Multistop-Based Measurements of Accessibility in a GIS Environment. Int. J. Geogr. Inf. 1994, 8, 343–356. [Google Scholar] [CrossRef]
- MITMA Ministerio de Transportes, Movilidad y Agenda Urbana. 2018. Available online: https://www.mitma.gob.es/ (accessed on 27 December 2023).
- Aly, S.; Vrana, I. Evaluating the knowledge, relevance and experience of expert decision makers utilizing the Fuzzy-AHP. Agric. Econ. 2008, 54, 529–535. [Google Scholar] [CrossRef]
- Aczél, J.; Saaty, T.L. Procedures for synthesizing ratio judgements. J. Math. Psychol. 1983, 27, 93–102. [Google Scholar] [CrossRef]
- Miller, H.J.; Shaw, S.-L. Geographic Information Systems for Transportation: Principles and Applications; Spatial Information Systems; Oxford University Press: Oxford, UK, 2001; ISBN 0195123948. [Google Scholar]
- Dijkstra, E.W. A note on two problems in connection with graphs. Numer. Math. 1959, 1, 269–271. [Google Scholar] [CrossRef]
- Dijkstra, E.W. Solution of a problem in concurrent programming control. In Pioneers and Their Contributions to Software Engineering; Springer: Berlin/Heidelberg, Germany, 2001; pp. 289–294. [Google Scholar]
Disclaimer/Publisher’s Note: The statements, opinions and data contained in all publications are solely those of the individual author(s) and contributor(s) and not of MDPI and/or the editor(s). MDPI and/or the editor(s) disclaim responsibility for any injury to people or property resulting from any ideas, methods, instructions or products referred to in the content. |
© 2024 by the authors. Licensee MDPI, Basel, Switzerland. This article is an open access article distributed under the terms and conditions of the Creative Commons Attribution (CC BY) license (https://creativecommons.org/licenses/by/4.0/).