Article

Methodology for Exploring Water and Hydropower Operating Criteria That Simultaneously Improve Economic and Environmental Considerations

by
Quentin Ploussard
1,*,
Thomas Veselka
1 and
Thushara De Silva
2
1
Argonne National Laboratory, Lemont, IL 60439, USA
2
National Renewable Energy Laboratory, Denver, CO 80401, USA
*
Author to whom correspondence should be addressed.
Water 2024, 16(3), 371; https://doi.org/10.3390/w16030371
Submission received: 30 November 2023 / Revised: 20 January 2024 / Accepted: 20 January 2024 / Published: 23 January 2024
(This article belongs to the Section Water Resources Management, Policy and Governance)

Abstract

:
Despite the reliability and flexibility of hydropower, the operation of hydroelectric power plants may have significant impacts on the downstream river system, including its water stage, sediment transport, and water temperature, ultimately affecting the ecology. To address these challenges, there is a need to identify water scheduling patterns that improve both hydropower economics and the environment relative to current operations. This paper presents a new methodology to explore promising operational criteria/rules that can achieve such improvements. Typical environmental impact statements and relicensing processes generally perform detailed site-specific analyses of a few alternatives that focus on reservoir water release operating rules and their associated environmental impacts. In contrast, the methodology presented in this article uses a widely applicable approach that explores a much larger solution space. This large set of potential alternatives can be represented in a multidimensional space for which one axis represents the economic value and the other axis quantify individual environmental impacts (e.g., sediment transport and fish growth), and they are explored via two approaches: a Monte Carlo simulation that identifies “win–win” alternatives and a multi-objective optimization problem that identifies Pareto-optimal alternatives.

1. Introduction

Hydropower is a reliable and flexible energy source that accounts for more than 30% of the U.S.’s renewable electricity generation. It supports the national grid with capacity, long-term energy storage, and a multitude of ancillary services. Beyond power generation, hydropower reservoirs serve many other services and purposes, which include flood protection, recreation, irrigation, and potable water supply. Because hydropower operations affect both the power grid and water resources, reservoir management is typically bound by legal agreements that are informed by diverse stakeholders with diverse priorities and sometimes conflicting objectives [1]. Moreover, despite being one of the cleanest sources of electricity, hydropower affects the environment in several ways. For example, the construction of hydropower infrastructures is known to be responsible for environmental externalities, which include deforestation, the loss of fauna and flora species, and the destruction of historical remains [2]. The construction of the dam itself relies on several energy-intensive materials, such as steel and cement, and it is associated with a significant amount of carbon emissions [3]. Additionally, the degradation of the biomass inundated in the reservoir has been shown to be a notable source of greenhouse gas (GHG) emissions [4]. The environmental impacts of hydropower go beyond the construction phase of the hydropower facility. Long after an infrastructure has been built, hydropower operations continue to affect the environment surrounding the reservoir. For example, changes in the natural river flow affect the behavior and migration patterns of fish. Also, the sudden changes in water temperature and chemistry impact the health of aquatic habitats, including threatened and endangered species [5,6,7,8]. Although environmental issues due to dam construction are crucially important, the focus of the current work is on hydropower operations and how their environmental impact is balanced with economic performance.
Numerous studies have been conducted to assess the impacts of hydropower operations and to identify ways to mitigate these environmental impacts [9,10,11,12,13,14,15], including several biological opinions [16,17] and environmental impact statements (EISs) [18,19]. Proposed actions to mitigate these environmental externalities essentially translate to operational restrictions that comply with environmental flow targets [11]. These operational restrictions include, but are not limited to, specific volumes of water that can be released in given periods (e.g., in a given month, week, or day), the minimum and maximum flow rate at any given time, and the maximum change in the flow rate [18,19]. Proposed environmental actions also translate to regular experimental water releases carried out to monitor river conditions, enhance native fish habitats, and conserve fine sediment. Although beneficial for the environment, these environmental restrictions and experimental releases generally have a negative impact on the hydropower economics, which can amount to millions of dollars [20]. In other words, past studies and experiences show that difficult tradeoffs often need to be made between economic and environmental objectives.
However, most of the studies addressing the economic–environmental tradeoff of hydropower operations generally consider a limited number (less than 10) of alternative operating rulesets that do not capture a wide range of possible operational policies [19,21,22]. Moreover, in a few cases, the implementation of environmentally focused operational restrictions have proven to unexpectedly benefit hydropower economics [23,24], leading to what can be called “win–win” situations. These few cases suggest that there could be many more unexplored win–win operating rulesets, albeit less frequent than the win–lose ones. Because of the apparent scarcity of such operating rulesets, exploring them requires approaches that are more exhaustive and broadly applicable than the ones used in past studies.
Multicriteria decision analysis (MCDA) techniques are commonly applied to inform decision making for water resources planning that consider conflicting economic and environmental objectives [22,25]. MCDA aims to rank operating alternatives based on multiple evaluation criteria, whose importance is judged by assigned weights. However, MCDA techniques are not designed to explore and identify new alternatives but rather to evaluate a pre-existing set of operating alternatives. Operating alternatives that optimize both economic and environment objectives are called Pareto-optimal [26]. An operating alternative is considered Pareto-optimal when it is not possible to improve one objective without worsening another. Multi-objective optimization (MOO) [27] is a mathematical optimization method used to explore and identify Pareto-optimal solutions. However, the complex and non-linear relation between water operations and environmental objectives makes it difficult to implement MOE in water management [27]. To address this, heuristic methods such as multi-objective evolutionary algorithms (MOEAs) have been more commonly used to identify operating alternatives that optimize both hydropower economic and various environmental objectives, such as water for irrigation [28,29], flood control [29,30,31], ecological flows [32], and water storage volume [33].
Most of the studies described above are generally case-specific or address a specific type of environmental objective. They apply heuristic optimization methods that follow a narrow optimization path that does not explore the vast space of possible solutions that may be better than a reference solution without necessarily being optimal. Furthermore, the “optimal” solution identified with heuristic methods is not guaranteed to be a true Pareto-optimal solution.

2. Materials and Methods

2.1. General Methodology

This paper describes and demonstrates a novel methodology that identifies potential “win–win” reservoir operating criteria (i.e., rulesets) using Monte Carlo simulations [34]. These “win–win” rulesets simultaneously increase hydropower economics and improve the downstream riverine environment. This paper also proposes a mixed-interlinear programming (MILP) MOO approach to identify Pareto-optimal operating alternatives. Because it explores a large multidimensional solution space, by necessity, some simplifications are made in its calculation of power economics and environmental outcomes. Therefore, the results only suggest potentially better strategies that could be explored at a finer level of fidelity. In this regard, the proposed methodology complements or augments current methodologies because it helps identify potential strategies that warrant further investigation.
The methodology described in this paper is also widely applicable. As a proof-of-concept application, it was demonstrated at the Glen Canyon Dam. This site was selected because a number of extensive environmental studies conducted below this dam and its power plant have significantly contributed to the operation of the WI power grid. Its power economic value is primarily measured in terms of capacity, energy production, and the ancillary services that it provides to the grid. In addition, a few alternative operating rulesets and associated economic and environmental impacts at Glen Canyon Dam have already been investigated, as described in a publicly available EIS report [19].
The contributions of this paper are as follows:
  • To the best of our knowledge, the proposed methodology is the first one that considers operating rules, instead of hourly water release schedules, as decision variables when exploring hydropower operations that simultaneously improve economic and environmental values. There are two advantages to this:
    First, because of the curse of dimensionality, the decision space to explore in the Monte Carlo simulation explodes when considering hourly water releases as decision variables. Conversely, our method considers less than a dozen operating rules.
    Second, the Pareto-efficient solutions identified this way would result in detailed water release scheduling patterns that hydropower operators might find too inflexible. Instead, providing hydropower operators with more general operating rulesets gives them more flexibility in their decision about real-time operations.
  • We pre-process functions (or curves) that describe the link between aggregated release volumes and economic/environmental metric values. This simplification significantly accelerates the computation of the MILP problems in the MOO approach.

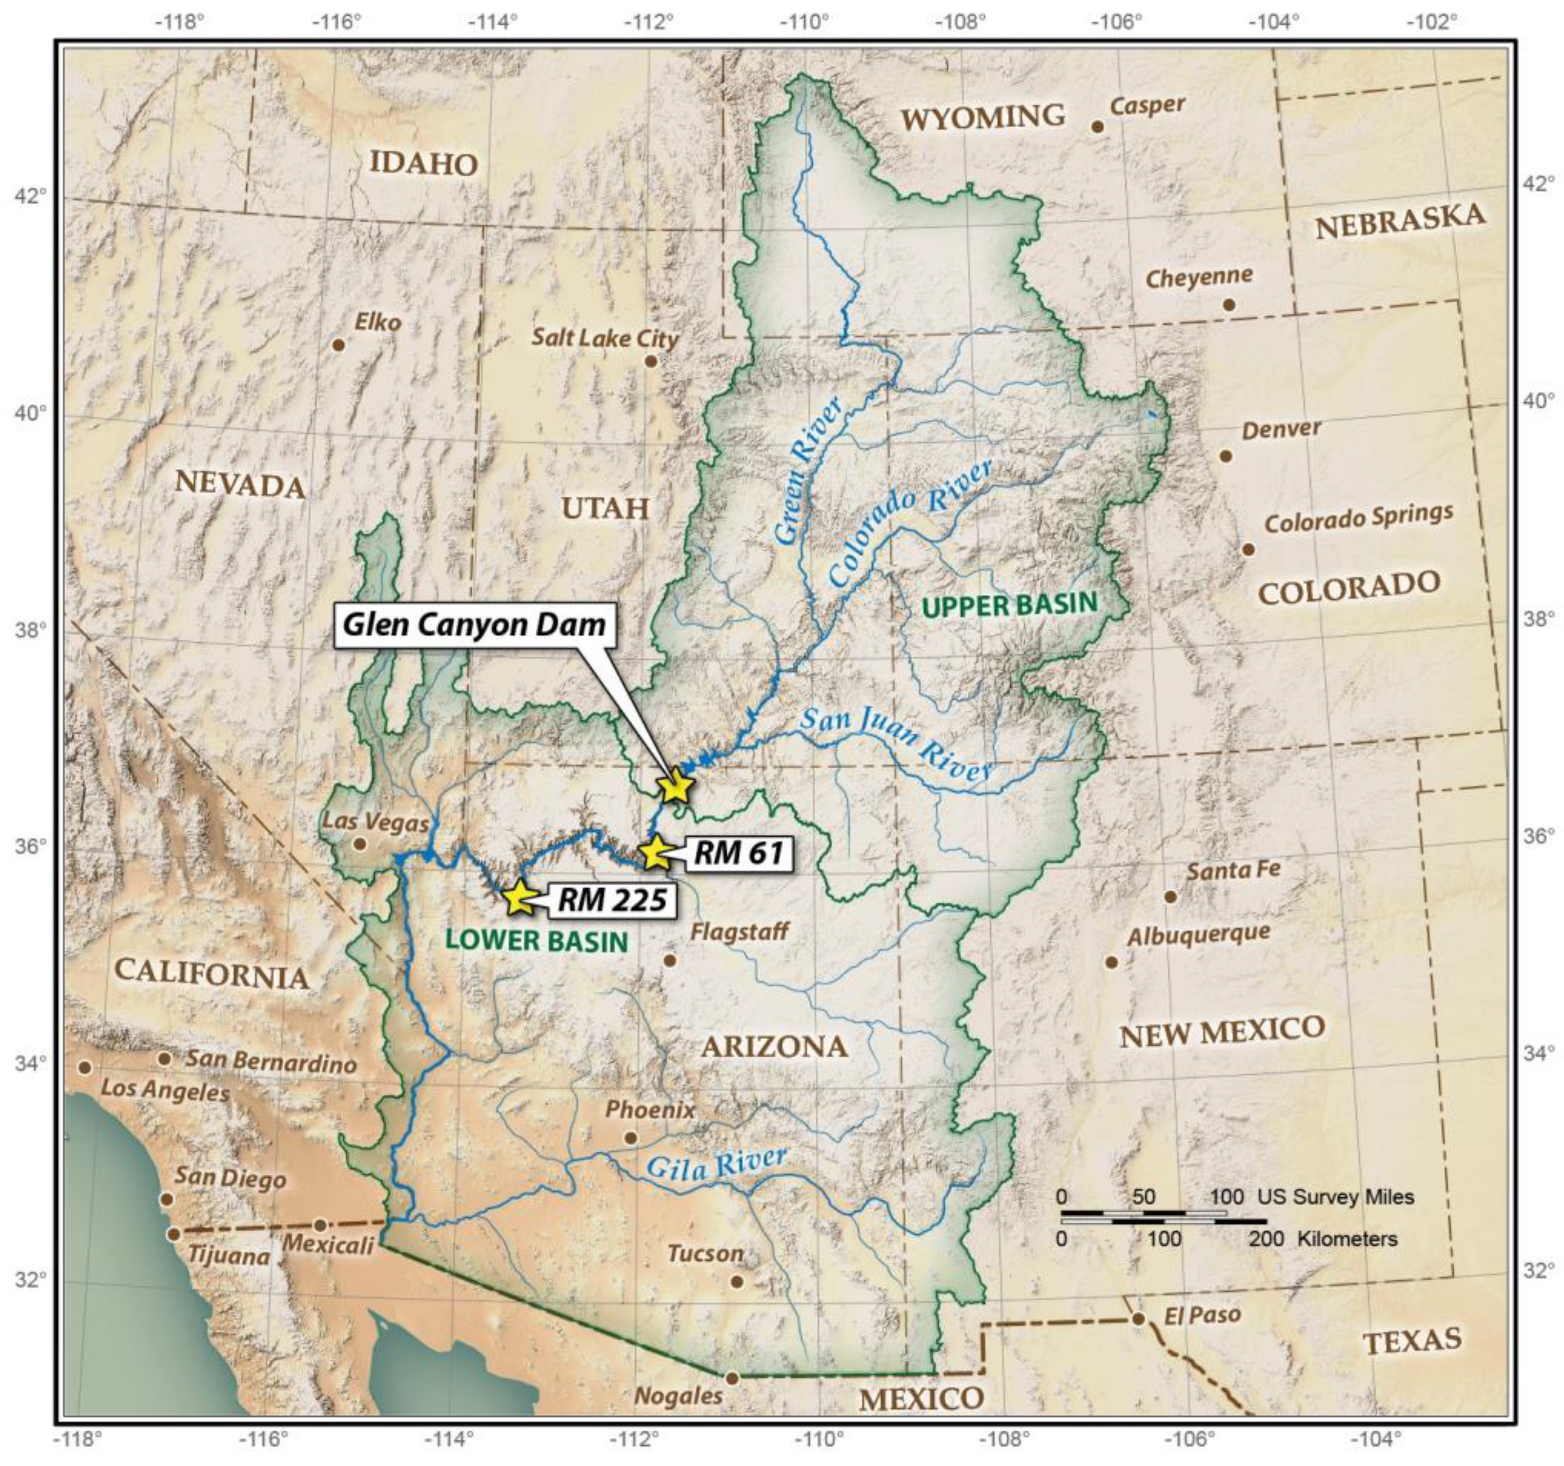
2.2. Colorado River and Glen Canyon Dam

The Colorado River Basin is a large river system in the western United States and Mexico, and it spans several states, including Colorado, Wyoming, Utah, New Mexico, Nevada, Arizona, and California. The headwaters are in the Rocky Mountains of Colorado and flow for over 1400 miles before emptying into the Gulf of California in Mexico. The Colorado River is a major source of water for irrigation, industry, and urban areas in the region. It is managed by the United States Bureau of Reclamation and is an important source of hydroelectric power, providing electricity to millions of people. The river system includes several major dams, including the Hoover Dam, Glen Canyon Dam, and Davis Dam, which regulate the river’s flow and provide flood control. The reservoir behind the Hoover Dam, Lake Mead, is the largest in the U.S., and Lake Powell, behind the Glen Canyon Dam, is the second largest in the nation. The system also includes several major tributaries, such as the Green River, the San Juan River, and the Little Colorado River.
The Glen Canyon Dam is located on the Colorado River in northern Arizona, United States. It was completed in 1963 and is a key component of the Colorado River Storage Project (CRSP), which provides water storage and hydroelectric power generation for the western United States. The Glen Canyon Dam is an important source of hydropower electricity in the Western Interconnection (WI), producing over 4 billion kilowatt-hours of energy annually, which is enough to power approximately 400,000 homes. The construction of the Glen Canyon Dam had significant environmental impacts on the surrounding area. The dam created Lake Powell, which flooded Glen Canyon. The dam also altered the flow of the Colorado River, changing the ecosystem and impacting the natural habitats of many native species of plants and animals. The loss of sediment and changes in both water temperature and flow have had noticeable impacts on the river and the surrounding ecosystem, including changes in water quality, erosion, and the loss of biodiversity. For example, the altered environment in some sections of the river is favorable for invasive species, such as smallmouth bass and trout, which compete with native fish species for food. In recent years, there have been efforts to address some of these environmental impacts. For example, the Glen Canyon Dam has been modified to release water at different temperatures and times of year to simulate natural river flows, which helps to restore some of the ecological processes that were disrupted by the dam. Currently, the management goal of dam releases is to balance the needs for hydroelectric power and the protection of the environment. A map of the Colorado River and the Glen Canyon Dam is depicted in Figure 1.
Even though the case study used in this article is inspired by the technical, environmental, and economic features of the Glen Canyon Dam, it is only for illustrative purposes. Case study results provide interesting insights, but extensive research and analysis would need to be conducted to validate its findings. That is, we do not purport that demonstration findings alone would lead to improved operating alternatives at the Glen Canyon Dam but rather that they point to potential promising strategies. Strategies that, without this tool, may not have otherwise been identified as good solutions.

2.3. Glen Canyon Dam Operating Rules

Flow restrictions, also called operating rules, have been put in place at numerous hydropower plants in order to mitigate environmental externalities and to comply with environmental flow targets [11]. For illustration purposes, this article focuses on the operating rules in place since 2017 at the Glen Canyon Dam and described in the Glen Canyon’s Long-Term Experimental and Management Plan (LTEMP) EIS [19]. The list of operating criteria is described by the LTEMP preferred alternative and imposes several operational constraints, such as monthly water release volumes, minimum and maximum hourly release rates, daily change limits, up-ramp rate limits, and down-ramp rate limits. The list of operating rules is shown in Table 1 below.
For this case study, we explore the large landscape of operating alternatives by allowing the Monte Carlo simulation and the MILP MOO approach to modify the values of these operating rules. For a given combination of operating rules, or an operating ruleset, it is assumed that hourly hydropower operations (hourly release rates) are driven by a typical hourly energy price profile. Based on these hourly hydropower operations, it is possible to evaluate the economic and environmental performances of the operating ruleset by using the economic and environmental metrics described below.

2.4. Economic Metric

There are several economic metrics that can be used to evaluate the economic performance of an operating ruleset. However, for the sake of simplicity, this article focuses on a single economic metric: the yearly value of energy production. The value of energy production is calculated as the sum of hourly energy revenues, and the energy revenue in a given hour is calculated by multiplying the hydropower production by the electricity price. In other words, the yearly revenue R is calculated as
R = h p h g h
where h is the hour of the year, p h is the energy price in hour h , and g h is the hydropower generation in hour h . The hourly electrical energy prices p h are locational marginal prices generated using the production cost model PLEXOS 8.1 [35]. The U.S. Western Interconnection power grid is modeled in PLEXOS using the WECC anchor data set for the year 2028 [36]. The PLEXOS model co-optimizes the generator schedule and dispatch to meet electric load and grid ancillary services similar to a system operator.

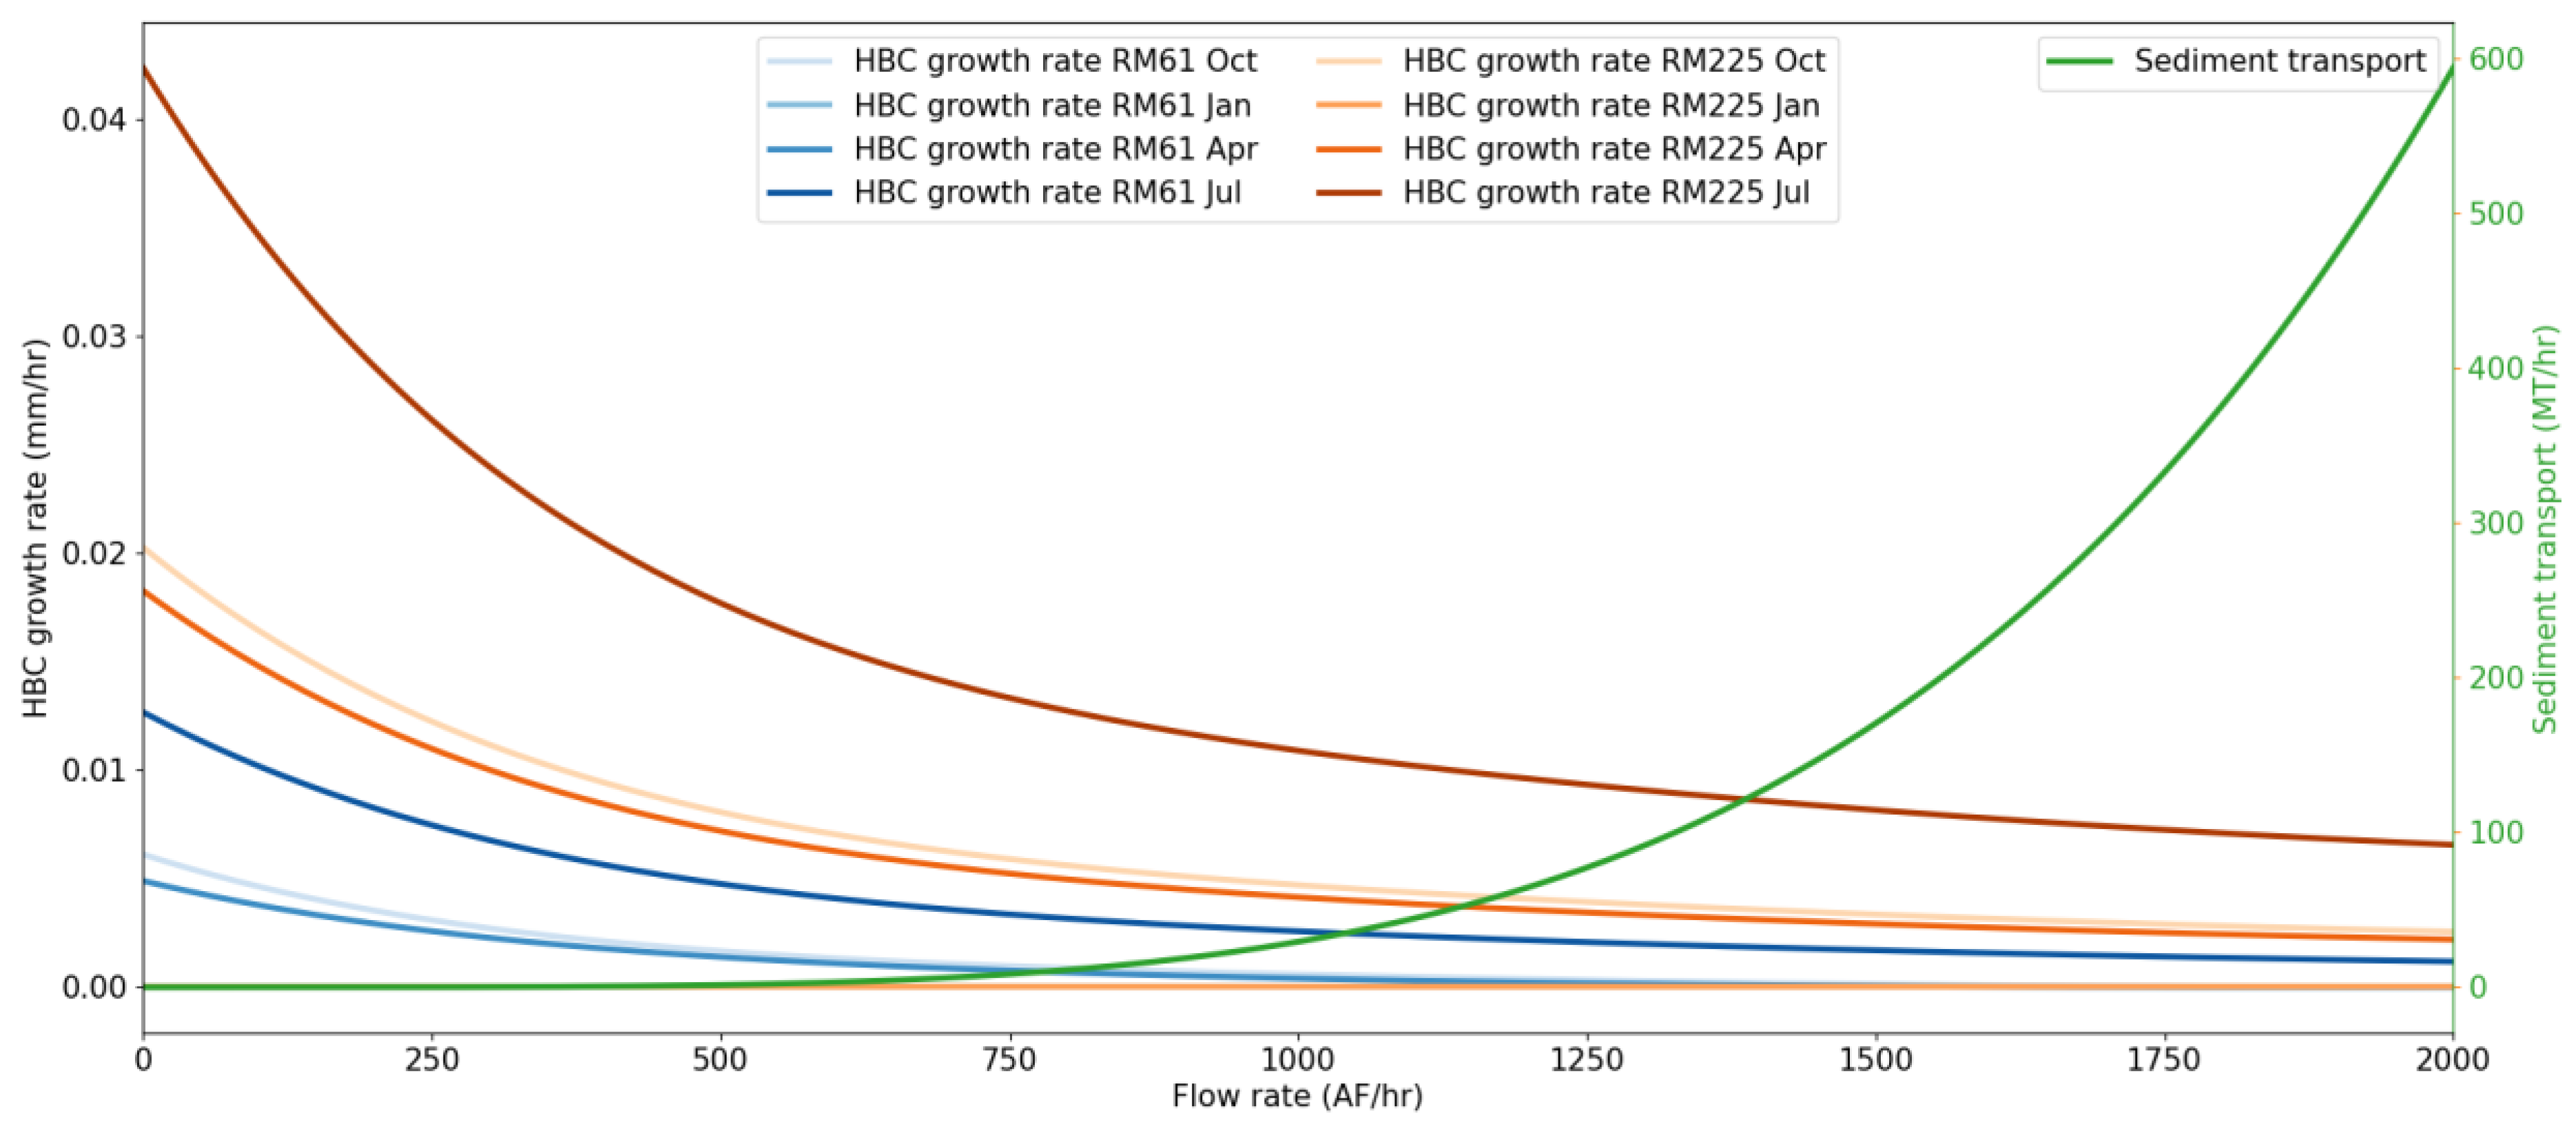
2.5. Environmental Metrics

There are several environmental metrics that can be used to evaluate the impact of a hydropower plant on the environment. Some of these metrics include water flow, water temperature, water composition, sediment transport, and the impact on aquatic ecosystems. The operation of a hydropower plant can affect water quality, both upstream and downstream of the dam. Changes in water flow, temperature, and sedimentation can alter the aquatic ecosystem and affect water quality, including the presence of dissolved oxygen, nutrients, and contaminants. Hydropower operations can also alter the natural habitats of plants and animals, including changes to the river channel. These changes can impact the biodiversity of the region, including the presence of endangered or threatened species. This article focuses on two environmental metrics that are used to evaluate the environmental impacts of the Glen Canyon Dam: the yearly humpback chub (HBC) growth rate and the yearly amount of sediment transport.
The HBC is a species of fish that is native to some river reaches in the Colorado River Basin. It was an endangered species protected under the Endangered Species Act since 1967 and was recently reclassified as “threatened” in 2021 [37]. The HBC has adapted to the unique conditions of the Colorado River ecosystem. It has a unique reproductive strategy, where it lays its eggs on the underside of rocks in the river, which helps to protect the eggs from predators and maintain a stable environment for hatching. The HBC faces a number of threats in the Colorado River ecosystem, including the altered water flow and sedimentation of the river by dam operations, and the introduction of non-native species that compete with the HBC for food and habitat. The loss of habitat and changes in the river ecosystem have caused a decline in the population of the HBC, making it one of the most endangered species in the Colorado River system. Efforts are currently underway to protect and restore the HBC population in the Colorado River. For this case study, we measure the impacts of the Glen Canyon Dam water release patterns on the HBC using fish growth rate metrics (in mm/h) at two key locations. These are located 61 river miles (RM) and 225 RM downstream of the Glen Canyon Dam. Both locations are within the Grand Canyon. In general, slower river flow rates result in warmer water temperatures that support faster HBC growth rates [38], especially during the warm/hot summer months. For this case study, we use the empirical HBC growth rate functions that were used in support of the Glen Canyon’s LTEMP EIS [19]. These functions estimate the HBC growth rate based on Glen Canyon’s water release rate for different months of the year. The HBC growth rate functions at RM 61 and 225 are depicted by the blue and orange lines in Figure 2. Due to the positive correlation between water temperature and the HBC growth rate [38], the growth rate is higher during warmer months such as July. Because higher water release rates lead to a cooler water temperature, the higher the flow rate, the lower the HBC growth rate. Because it is a threatened species, a higher HBC growth rate is considered to be a better environmental outcome.
The Colorado River is known for its sediment-rich waters, which play a vital role in shaping the landscape and supporting diverse ecosystems. The sediment in the Colorado River originates from the erosion of the surrounding mountains and riverbanks. As the river flows, it picks up sediment and transports it downstream. The amount and size of the sediment carried by the river vary depending on various factors such as the water flow rate, weather patterns, and dam operations. The sediment in the Colorado River plays a crucial role in the ecology of the river and the surrounding area. For example, the deposition of sediment on the riverbanks can create habitats for plants and animals, and the erosion of sediment can reshape the river channel, creating new habitats and altering the flow of the river. However, dam operations can disrupt the natural sediment transport processes and have significant impacts on the river ecology. For this case study, we estimate the hourly metric tons (MT) of sediment transport in the Lower Colorado River. The amount of sediment transport is primarily a function of water flow and increases with faster water flows. For this case study, we use the empirical sediment transport function that was used in support of the Glen Canyon’s LTEMP EIS [19]. This function estimates the amount of sediment transport based on Glen Canyon’s water release. It is depicted by the green line in Figure 2. Note that, contrary to the HBC growth rate, sediment transport does not depend on the temperature or the time of year. A higher flow rate leads to a higher amount of sediment transport, which alters the aquatic ecosystem and affects water quality, resulting in a negative impact on the environment. Therefore, contrary to the economic value and the HBC growth rate, the amount of sediment transport is a quantity that needs to be minimized.

2.6. Multiple-Criteria Decision Analysis and Pareto Front

This paper presents a general methodology to identify promising dam operating rules that warrant investigation at a finer level of granularity, that is, water scheduling rulesets that benefit both hydropower economics and the environment. Because the tool explores a very large landscape of potential solutions, it has the potential to point to win–win strategies that may not have otherwise been identified.
Economic and environmental objectives are often conflicting. For example, a steady water flow downstream of a hydropower plant may benefit the environment by improving the reproduction of some aquatic insects, but it is generally detrimental from an economic standpoint because it eliminates the operational flexibility of the hydropower plant. That is, plant operators cannot respond to electricity market prices by increasing turbine water release when prices are high to maximize hydropower economics. As a result, identifying criteria that improve both types of objectives is a multiple-criteria decision analysis (MCDA) problem that is very challenging to solve.
Such problems have a wide range of optimal solutions depending on the weight that is placed on each objective; that is, the preference for one solution over another depends on the importance given to each type of objective or criterion. In MCDA, the Pareto front refers to a set of optimal solutions that satisfy a set of conflicting criteria. Solutions are considered Pareto-optimal when no alternative solution can improve on one criterion without sacrificing performance on another criterion. In other words, a set of Pareto-optimal solutions comprises solutions that are not dominated by any other alternative. This paper presents a methodology to identify operational rulesets that are Pareto-optimal from both economic and environmental perspectives.

2.7. Monte Carlo Approach

The Monte Carlo approach is a simulation-based technique used to solve complex problems using random sampling. The approach involves generating a large number of random input samples and analyzing their corresponding output results. In the context of this paper, Monte Carlo simulations can be used to generate a large number of random operating rules, or alternatives, and evaluate their performances against multiple economic and environmental objectives. Using these operating rules as constraints and the price profile as a driver, a tailor-made algorithm developed by the authors rapidly computes the hourly water release schedule that maximizes hydropower revenues, i.e., the economic metric. This tailor-made algorithm mimics the process of an LP solver but with less numerical operations. Based on the computed water release schedule, the environmental values are calculated using the release-to-environmental-metric function. The data points associated with these operating rulesets are represented in the space of the economic–environmental objective values. For example, if an operating ruleset is associated with an economic value of USD 1,000,000, a fish growth rate of 10 mm/year, and a sediment transport of 100 MT/year, this operating ruleset can be represented by the point with coordinates (1,000,000, 10, 100) in the three-dimensional space where the economic value, the fish growth rate, and the sediment transport are represented by the x-axis, y-axis, and z-axis, respectively. The Pareto front is approximated by a set of solutions that are not simultaneously dominated in all objectives by other solutions. Note that the Pareto front is independent of the axis scale and the unit in which the objective values are expressed. The set of Pareto-optimal solutions is the same whether the economic value is expressed in $, $k, or $M.
The Monte Carlo approach is a simple tool for approximating the Pareto front in complex problems where analytical solutions are not available or are difficult to obtain. However, it requires a large number of samples to generate an approximated Pareto front that is close to the real Pareto front. More specifically, the number of random samples required to obtain a reasonably accurate Pareto front grows exponentially with the number of independent decisions, or operating rules, describing the water scheduling alternative.

2.8. Mathematical Optimization and Weighted Sum Approach

Another more accurate approach to identify Pareto-optimal operating alternatives is the weighted sum approach [39]. The weighted sum approach is a common method used in MOO to transform multiple conflicting objectives into a single objective function that can be optimized using traditional optimization techniques. In the weighted sum approach, each objective is assigned a weight or importance factor that reflects its relative importance compared to the other objectives. The objective functions are then combined into a single objective function by taking the weighted sum of the objectives. Mathematically, this can be expressed as
f x = w 1 f 1 x + w 2 f 2 x + + w n f n x
where x is the set of decision variables; f x is the single objective function to be optimized; f 1 x , f 2 x , …, f n x are the individual objective functions (e.g., economic value and fish growth rate); and w 1 , w 2 , …, w n are the weights assigned to each objective. The optimization problem can then be solved using traditional optimization techniques such as linear programming (LP) or MILP. The weights assigned to each objective determine the tradeoff between the objectives, and different weightings lead to different optimal solutions that are all Pareto-optimal; i.e., they all belong to the Pareto front. The larger the weight w i compared to other weights, the larger the optimal value of f i x .
The main drawback of this method, however, is that it cannot identify Pareto-optimal solutions in non-convex regions. However, this problem can be managed using adaptive techniques [39]. In summary, the convex regions of the Pareto front can be identified by calculating the optimal solution for a list of weightings w 1 , w 2 , , w n evenly distributed in the space described by
w 1 + w 2 + + w n = 1
w i 0 ,     i 1 , , n
The main advantage of the weighted sum approach compared to the Monte Carlo approach is that it guarantees the identification of solutions that belong to the Pareto front. However, each individual point of the Pareto front requires solving an individual optimization problem, and unveiling the entire Pareto front would require solving an optimization problem for a very large number of weight combinations, which is not feasible in practice. Note that this concern can be partially addressed using optimization tricks, such as warm-starting the optimization problem [40] with the optimal solution from previous problems with different weightings or with good-quality Monte Carlo solutions. However, if the objective functions are non-convex or non-linear, the optimization problem needs to be formulated with an MILP formulation, and the computation time required to solve an MILP problem can be significant. To address this, instead of modeling hourly water releases in MILP problems, we pre-process the functions describing the link between aggregated, i.e., monthly, water releases and aggregated economic/environmental values. These functions are non-linear and can be modeled as piecewise linear functions [41] in a simplified MILP model, which can be solved in a relatively short computational time. For this case study, the environmental functions depicted in Figure 2 are also non-linear but can also be modeled as piecewise linear functions in an MILP MOO problem.

3. Results

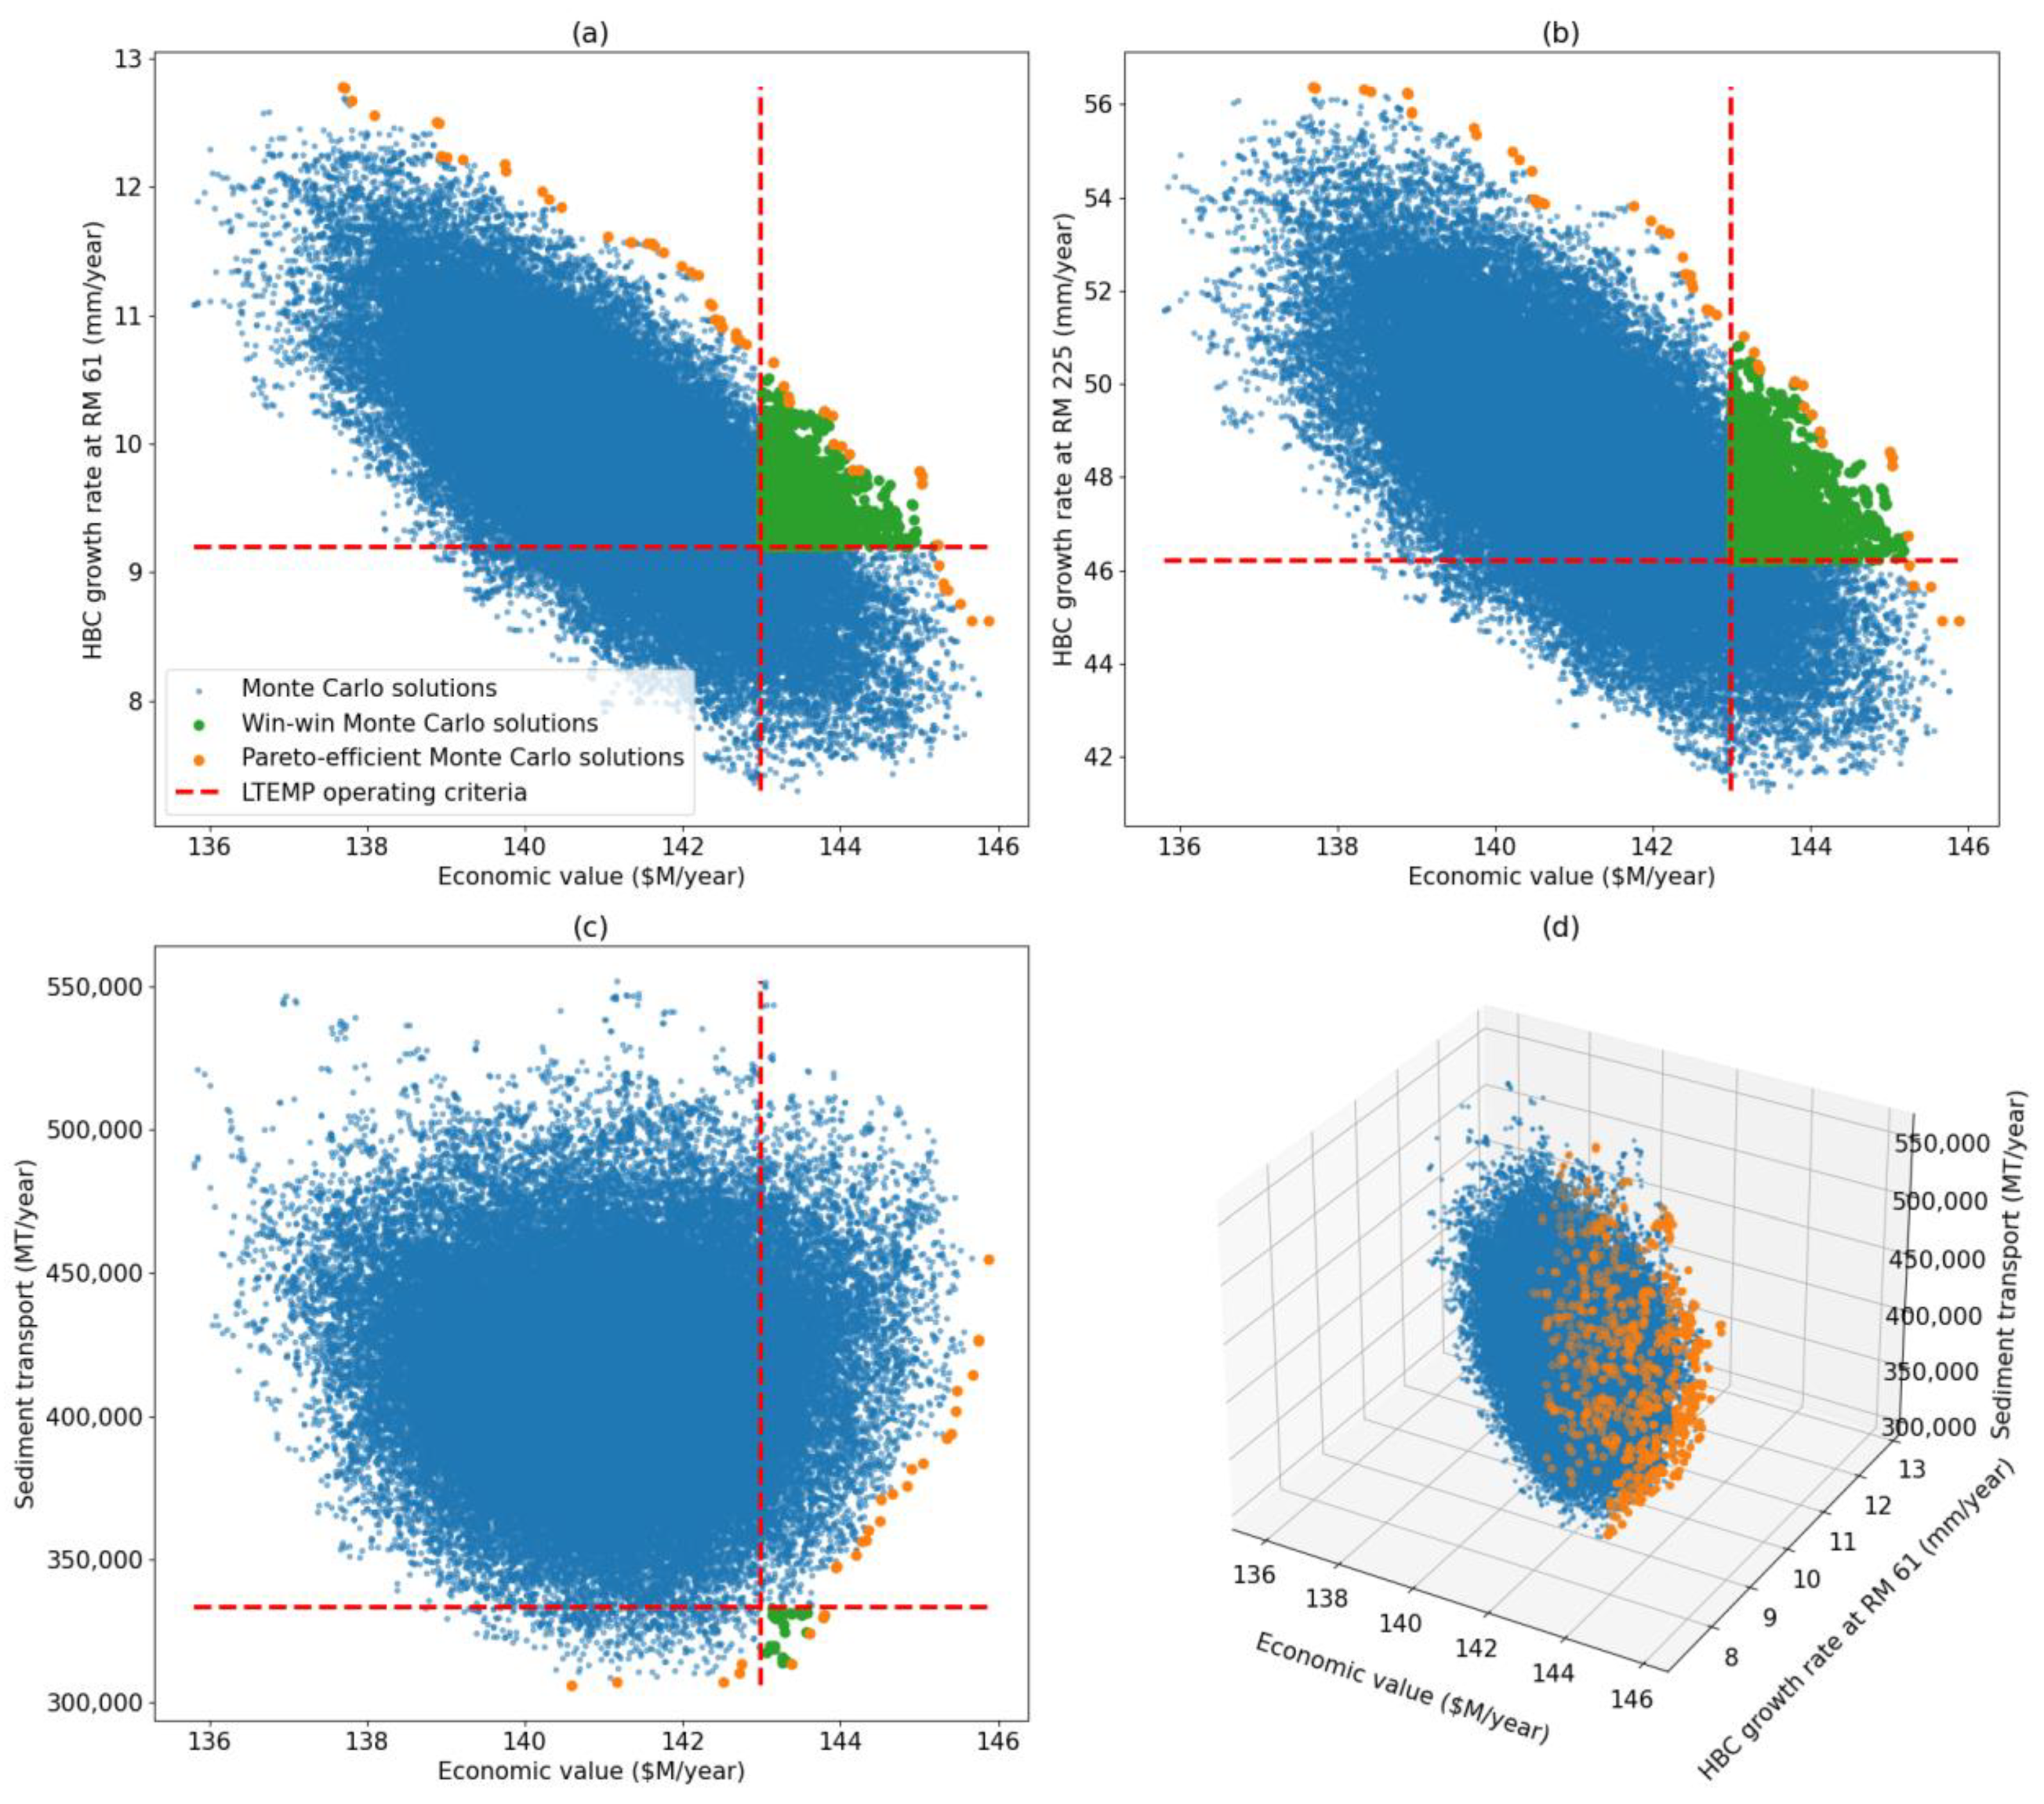
3.1. Results of the Monte Carlo Simulation

The Monte Carlo simulation is performed using 81,300 random combinations of operating rules (Table 1). This number of combinations was experimentally identified as a reasonable tradeoff between the computation time and the objective space explored. A higher number of combinations increased the computation time without a significant increase in the number of Pareto-efficient solutions. Each Monte Carlo sample takes around 0.10 s to compute. For each random combination, or Monte Carlo sample, the same yearly amount of water release equal to 8231 TAF is assumed. For each random combination, the economic value and the three environmental values (the HBC growth rate at RM 61, HBC growth rate at RM 225, and amount of sediment transport) are calculated. Herein, the HBC growth rates at RM 61 and RM 225 are referred to as HBC61 and HBC225, respectively. The economic and environmental values of the 81,300 random samples are depicted by the blue data points in Figure 3. Note that there is a visible, although not significant, negative correlation between the HBC61 and HBC225 values and the economic value (Figure 3a,b). This supports the general observation that hydropower operations that increase economic benefits have a negative effect on the environment, and vice versa. However, there is no clear correlation between the economic value and the amount of sediment transport (bottom left figure), suggesting a more complex relation between these two quantities.
The economic and environmental values of the current LTEMP operating criteria are depicted by the intersection of the red dashed lines. The “win–win” operating rulesets are defined as the rulesets that outperform the current LTEMP ruleset in terms of both economic and environmental values. They are depicted by the green data points in Figure 3. A higher HBC growth rate is considered to be an environmental benefit, and, therefore, win–win operating rulesets are located in the top-right quadrant of the red dashed intersection in Figure 3a,b. Conversely, a larger amount of sediment transport is considered to be an environmental loss, and, therefore, win–win operating rulesets are located in the bottom-right quadrant of the red dashed intersection in Figure 3c. These operating rules account for 2.8% of the Monte Carlo samples when considering the economic value and HBC61 as the environmental value (Figure 3a). This implies that, when selecting random operating criteria, there is approximately a 2.8% chance of identifying some that are better than the current LTEMP criteria (from the economic and HBC61 value standpoint). Win–win operating rules account for 3.7% of the samples when considering HBC225 as the environmental value (Figure 3b) and only 0.036% of the samples when considering sediment transport (Figure 3c). These results validate the existence, albeit scarce, of potentially better operating rules. The very low proportion of win–win rulesets when considering the economic and sediment transport values (Figure 3c) can be explained by the already low sediment transport value of the LTEMP operating criteria. Note that the more economic/environmental metrics considered, the less win–win rulesets identified. As a result, no operating rulesets simultaneously outperform LTEMP operating criteria when considering the economic, HBC61, and sediment transport values (bottom-right figure). The proportion of win–win rulesets for each combination of economic/environmental metrics considered is summarized in Table 2. Owing to the Monte Carlo simulation, we are able to identify operating rulesets with an economic value that is 1.6% higher than the LTEMP value for HBC61 that is greater than or equal to the LTEMP value. More remarkably, some operating rulesets have an HBC61 value that is 16% higher than the LTEMP value for economic values greater than or equal to the LTEMP value. The Pareto-efficient Monte Carlo samples are samples that are not simultaneously dominated by any other sample with respect to the economic and environmental metrics considered. They are depicted by the orange data points in Figure 3. The Pareto-efficient samples account for 0.075%, 0.065%, and 0.036% of the Monte Carlo samples when the environmental metric considered is HBC61, HBC225, and sediment transport, respectively. When both HBC61 and sediment transport are considered, the Pareto-efficient samples account for 0.90% of the Monte Carlo samples. Note that, contrary to the win–win operating rulesets, the more economic/environmental metrics considered, the more Pareto-efficient operating rulesets identified. The proportion of Pareto-efficient rulesets for each combination of economic/environmental metrics considered is summarized in Table 2.

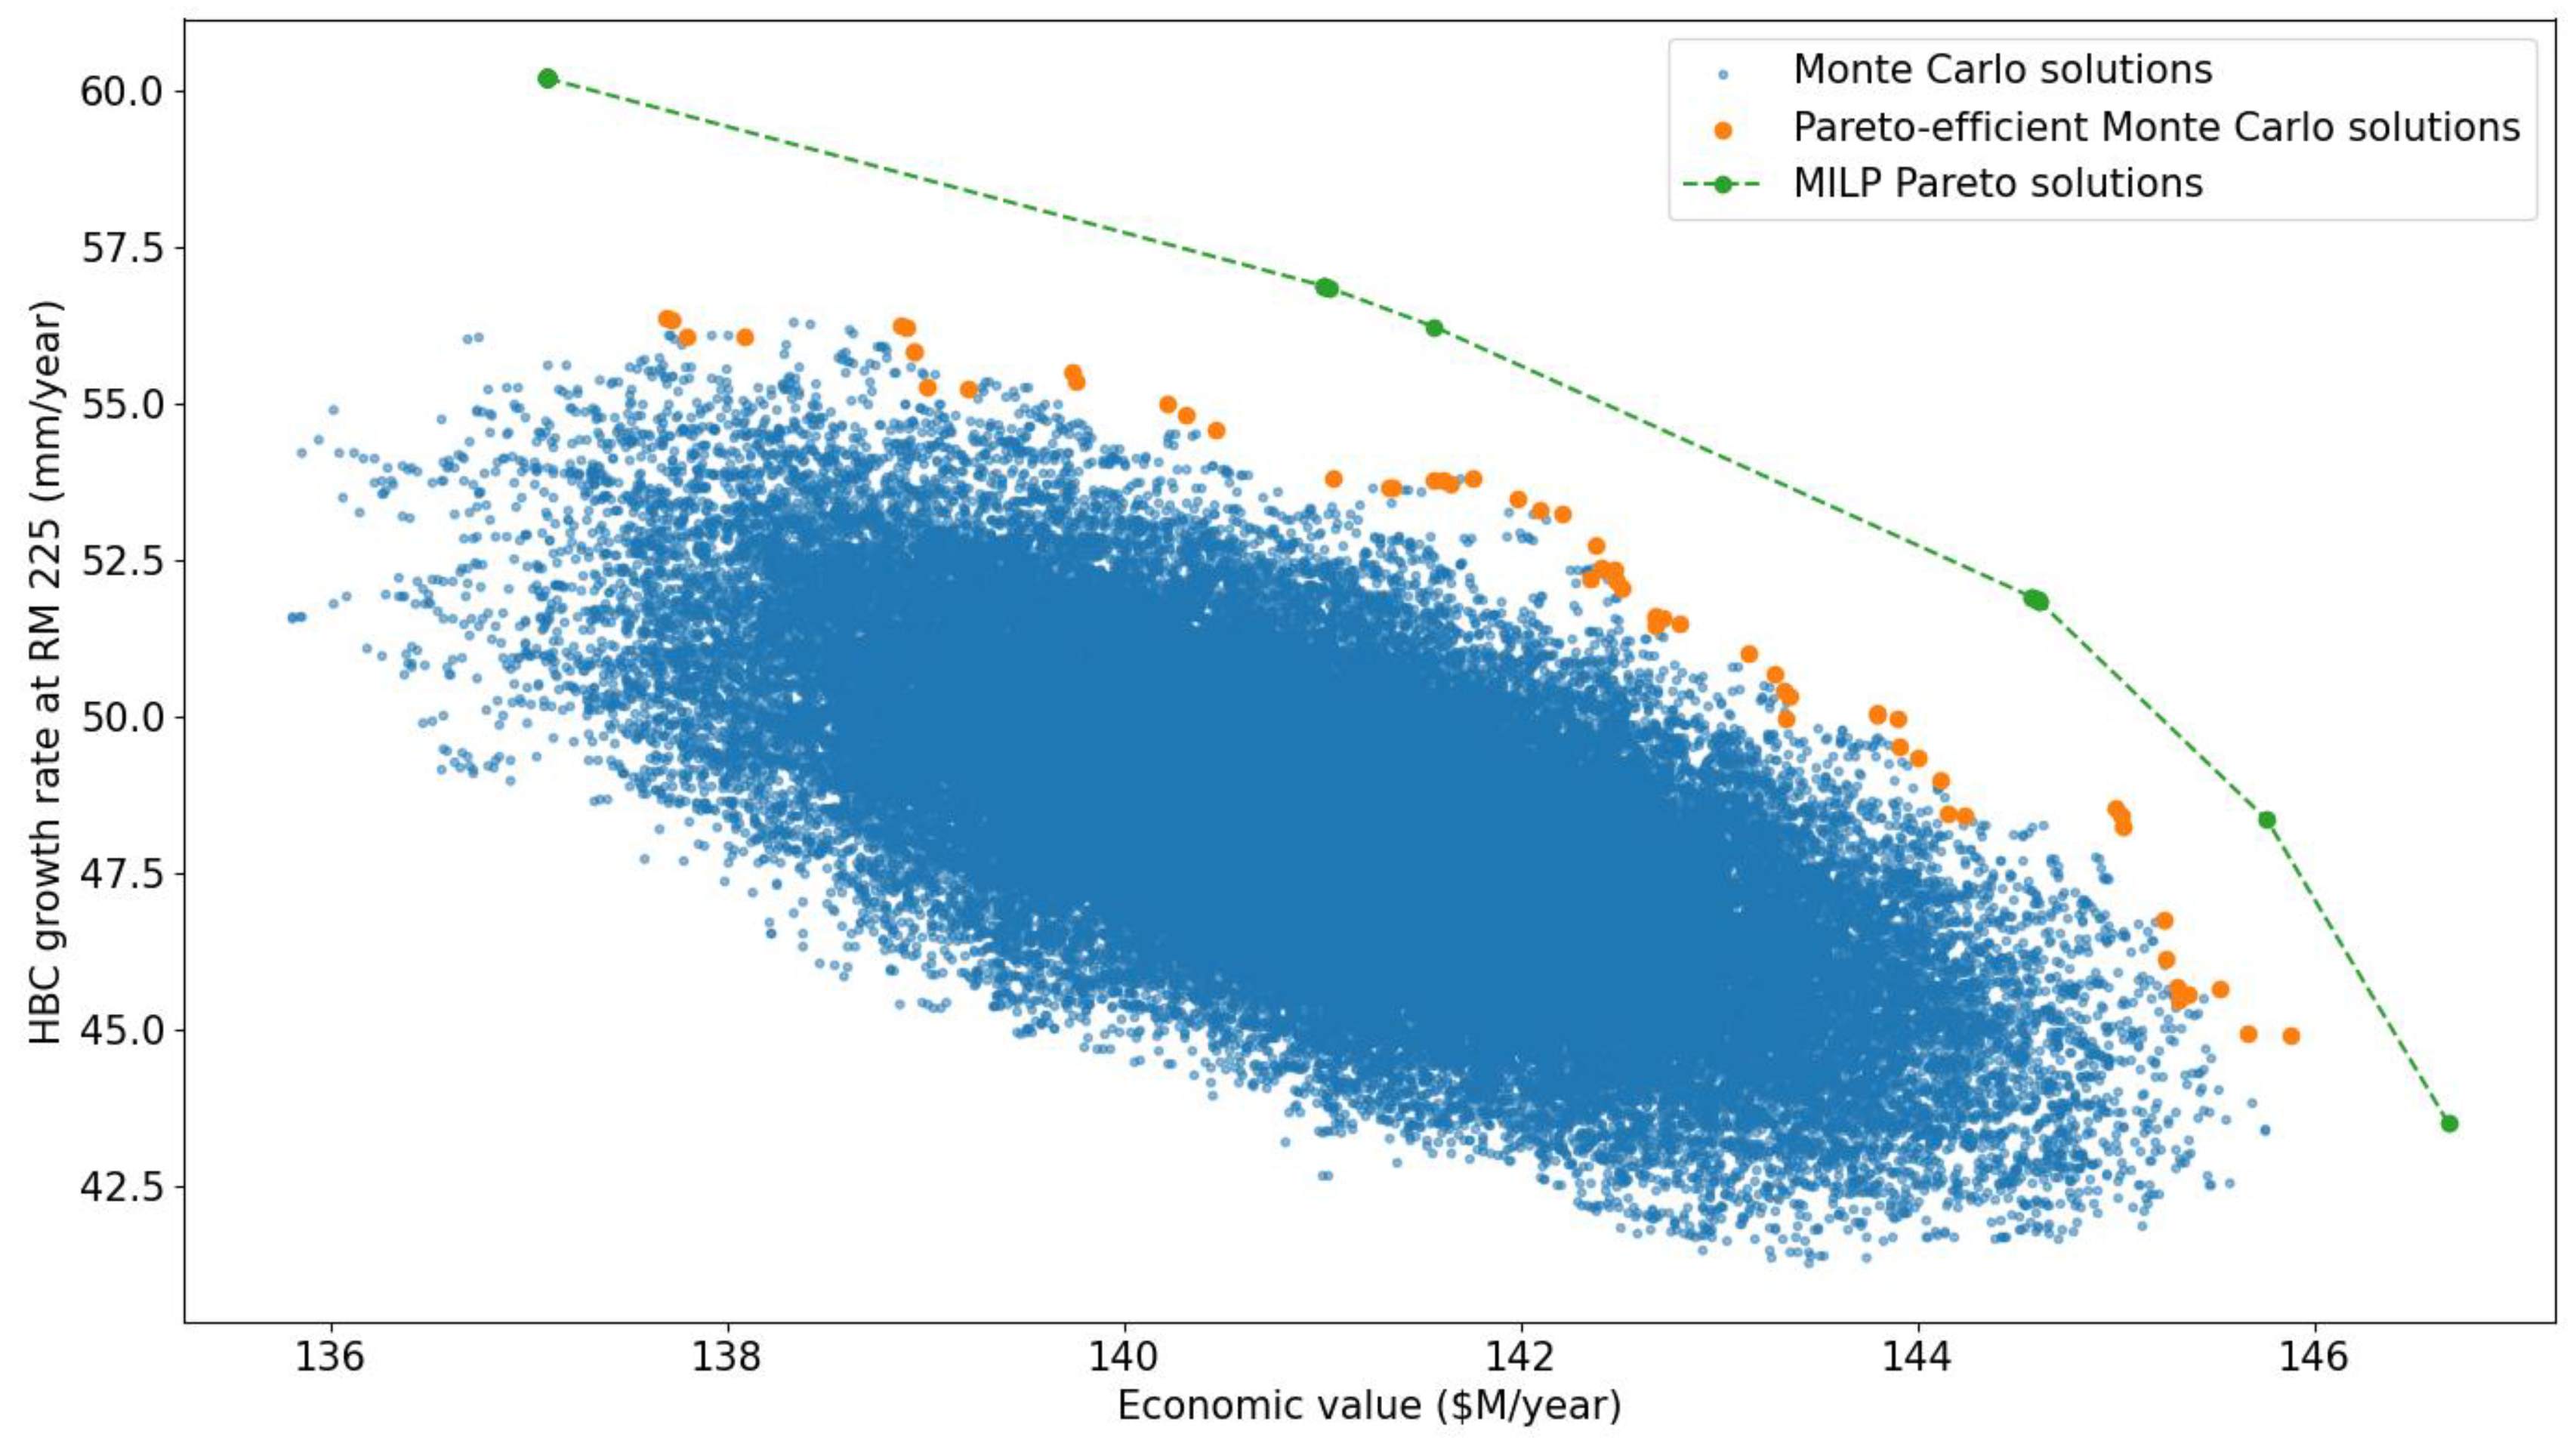
3.2. Results of the MILP MOO Problem

The MOO MILP problem described in Section 2.7 is solved for multiple combinations of weight values. For the sake of simplicity, only the economic and HBC225 objectives are considered, and the weight of the other environmental objectives is set to zero. Nine MOO MILP problems are solved with various combinations or weight values. Each MILP problem is solved in 0.15 s on average, owing to the pre-processed economic and environmental functions described in Section 2.8. The computation time needed to pre-process these functions is 200 s. The results are shown in Figure 4. The MILP solutions are depicted by the green data points, whereas the Pareto-efficient Monte Carlo samples are depicted by the orange data points. A green dashed line is drawn between the MILP solutions using linear interpolation in order to estimate the Pareto front. As explained in Section 2.7, the MILP solutions are true Pareto-optimal solutions, as it is not mathematically possible to identify operating rules that dominate those solutions with respect to both the economic and HBC225 metrics simultaneously. The interest of the MILP MOO method is evidenced by the visible gap between the Pareto-efficient Monte Carlo samples and the MILP solutions. Despite running more than 80,000 Monte Carlo simulations, no Monte Carlo sample seems to be relatively close to the Pareto front. Specifically, at comparable HBC225 values, the MILP solutions have an economic value that is 3.1% larger on average than the Monte Carlo samples with the largest economic value. Conversely, at comparable economic values, the MILP solutions have an HBC225 value that is 16% larger on average than the Monte Carlo sample with the largest HBC225 value.
The monthly water release values of the LTEMP operating ruleset and two MILP solutions are illustrated in Figure 5. The monthly water releases of the LTEMP ruleset are depicted by the blue line, whereas the monthly releases of the MILP solutions are depicted by the orange and green lines. The orange line represents the MILP solution with the largest HBC225 value (left-most green point in Figure 4), whereas the green line represents the MILP solution with the largest economic value (right-most green point in Figure 4). For the MILP solution with the largest economic value (green line), water release volumes are essentially allocated during the summer months, when electricity price levels and electricity price spreads are the largest. For the MILP solution with the largest HBC225 value (orange line), water release volumes are essentially allocated during the winter months, when cooler weather temperatures allow for higher releases and release variations with a limited impact on the HBC growth rate (see Figure 2).

4. Discussion

The Monte Carlo and MILP MOO approaches represent a promising path to explore hydropower operating alternatives that outperform current operating rulesets. The results show that, with a sufficiently large number of Monte Carlo samples, it is possible to identify a non-negligible number of “win–win” operating rulesets that outperform current operating alternatives with respect to both economic and environmental metrics. Moreover, the Monte Carlo approach enables the user to quickly explore a large space of potential alternatives, allowing them to have more options to choose from. However, this approach can be seen as naive in comparison to alternative methods, such as MOO approaches.
Contrary to the Monte Carlo approach, the MOO approach only focuses on the operating alternatives that are Pareto-optimal, that is, those that cannot be outperformed by economic and environmental metrics simultaneously. Experimentally, the MOO approach proves to identify significantly better alternatives than the Monte Carlo approach, without having to search through hundreds of thousands of operating alternatives. However, solving a MOO problem is known to be computationally intensive, especially when such problems can be modeled, at best, as MILP problems. Because of the non-linearities introduced by environmental objectives, MILP seems to be the most efficient way to formulate the MOO problem, as this type of problem is generally faster to solve than other problems, such as mixed-integer non-linear programming (MINLP) problems. The MILP solving time can also be mitigated in two ways. The first way is to warm-start the problem with solutions from previously solved MILP problems or from high-quality Monte Carlo solutions. The second way is to pre-process simplified functions that describe the link between water release volumes and economic/environmental values in aggregated time periods. This latter way significantly reduces the number of variables and the solving time. However, the modeling simplifications required to generate these simplified functions and to approximate non-linearities in the MILP formulation introduce some unavoidable inaccuracies in the MOO problem.
An important limitation of the proposed approaches is the ability to calculate or derive environmental values from water releases. The applicability of the proposed methodology is limited by the availability of release-to-environmental-value functions or the ability to derive such functions. Due to this, generalizing the approaches to some case studies might require extensive effort and numerous local adaptions as release-consequence values are often hard to find and justify.
Finally, neither the Monte Carlo approach nor the MILP MOO approach is able to identify the whole Pareto front of operating alternatives. Although the MILP MOO approach can identify data points that belong to convex regions of the Pareto front, it is not practically feasible to reveal the entire Pareto front.

5. Conclusions

This paper describes and demonstrates a novel methodology to identify operations that simultaneously benefit the economic and environmental values of hydropower reservoirs. Contrary to other methods that identify specific hourly water release schedules, the proposed method focuses on reservoir operating rulesets that provide more flexibility to hydropower operators. In the presented case study, both the MILP MOO and Monte Carlo approaches are able to provide valuable insights into promising operating rulesets. The experimental results suggest that the proposed methodology could be beneficial to hydropower and environmental experts in discovering promising rulesets. These promising rulesets could then be further investigated in greater detail in environmental studies, such as environmental impact statements.
However, generalization to other case studies might not be straightforward. Although the presented case study is a promising proof of concept, the proposed methodology needs to be tested in additional regions to further demonstrate its applicability. Moreover, further research work is needed to develop methods that combine the strength of both the Monte Carlo and the MOO approaches. For example, modern machine learning techniques such as reinforcement learning could rapidly and progressively identify better operating alternatives starting from a random population of operating rulesets.

Author Contributions

Conceptualization, Q.P. and T.V.; methodology, Q.P., T.V. and T.D.S.; software, T.V. and Q.P.; validation, T.V. and Q.P.; formal analysis, T.V. and Q.P.; investigation, T.V., T.D.S. and Q.P.; resources, Q.P., T.V. and T.D.S.; data curation, T.V. and Q.P.; writing—original draft preparation, Q.P. and T.V.; writing—review and editing, Q.P., T.V. and T.D.S.; visualization, Q.P. and T.D.S.; supervision, T.V.; project administration, Q.P. and T.V.; funding acquisition, T.V. and T.D.S. All authors have read and agreed to the published version of the manuscript.

Funding

This work was authored for the Department of Energy (DOE) Office of Energy Efficiency and Renewable Energy by Argonne National Laboratory, operated by UChicago Argonne LLC under contract number DE-AC02-06CH11357, and the National Renewable Energy Laboratory, operated by Alliance for Sustainable Energy LLC under contract number DE-AC36-08GO28308. This study was supported by the HydroWIRES Initiative of DOE’s Water Power Technologies Office.

Data Availability Statement

LTEMP operating constraint data are available in [19].

Conflicts of Interest

The authors declare no conflicts of interest. The funders had no role in the design of the study; in the collection, analyses, or interpretation of data; in the writing of the manuscript; or in the decision to publish the results.

References

  1. Frans, H. Koch Hydropower—The Politics of Water and Energy: Introduction and Overview. Energy Policy 2002, 30, 1207–1213. [Google Scholar] [CrossRef]
  2. Han, S.-Y.; Kwak, S.-J.; Yoo, S.-H. Valuing Environmental Impacts of Large Dam Construction in Korea: An Application of Choice Experiments. Environ. Impact Assess. Rev. 2008, 28, 256–266. [Google Scholar] [CrossRef]
  3. Ge, Z.; Geng, Y.; Wei, W.; Jiang, M.; Chen, B.; Li, J. Embodied Carbon Emissions Induced by the Construction of Hydropower Infrastructure in China. Energy Policy 2023, 173, 113404. [Google Scholar] [CrossRef]
  4. Lu, S.; Dai, W.; Tang, Y.; Guo, M. A Review of the Impact of Hydropower Reservoirs on Global Climate Change. Sci. Total Environ. 2020, 711, 134996. [Google Scholar] [CrossRef]
  5. Collier, M.; Webb, R.H.; Schmidt, J.C. Dams and Rivers: A Primer on the Downstream Effects of Dams; U.S. Department of the Interior, U.S. Geological Survey: Reston, VA, USA, 1996; ISBN 978-0-607-86100-6.
  6. Botelho, A.; Ferreira, P.; Lima, F.; Pinto, L.M.C.; Sousa, S. Assessment of the Environmental Impacts Associated with Hydropower. Renew. Sustain. Energy Rev. 2017, 70, 896–904. [Google Scholar] [CrossRef]
  7. Kuriqi, A.; Pinheiro, A.N.; Sordo-Ward, A.; Bejarano, M.D.; Garrote, L. Ecological Impacts of Run-of-River Hydropower Plants—Current Status and Future Prospects on the Brink of Energy Transition. Renew. Sustain. Energy Rev. 2021, 142, 110833. [Google Scholar] [CrossRef]
  8. Soukhaphon, A.; Baird, I.G.; Hogan, Z.S. The Impacts of Hydropower Dams in the Mekong River Basin: A Review. Water 2021, 13, 265. [Google Scholar] [CrossRef]
  9. Richter, B.D.; Baumgartner, J.V.; Powell, J.; Braun, D.P. A Method for Assessing Hydrologic Alteration within Ecosystems. Conserv. Biol. 1996, 10, 11634174. [Google Scholar] [CrossRef]
  10. Poff, N.L.; Allan, J.D.; Bain, M.B.; Karr, J.R.; Prestegaard, K.L.; Richter, B.D.; Sparks, R.E.; Stromberg, J.C. The Natural Flow Regime. BioScience 1997, 47, 769–784. [Google Scholar] [CrossRef]
  11. Poff, L.N.; Richter, B.D.; Arthington, A.H.; Bunn, S.E.; Naiman, R.J.; Kendy, E.; Acreman, M.; Apse, C.; Bledsoe, B.P. The Ecological Limits of Hydrologic Alteration (ELOHA): A New Framework for Developing Regional Environmental Flow Standards. Freshw. Biol. 2010, 55, 147–170. [Google Scholar] [CrossRef]
  12. Moeller, K.L.; Malinowski, L.M.; Hoffecker, J.F. Analysis of Potential Impacts of Flaming Gorge Dam Hydropower Operations on Archaeological Sites; Argonne National Lab. (ANL): Argonne, IL, USA, 1955. [Google Scholar]
  13. Bodi, F.L. Protecting Columbia River Salmon Under the Endangered Species Act. Environ. Law 1980, 10, 349–387. [Google Scholar]
  14. Pontius, D. Colorado River Basin Study. Report to the Western Water Policy Review Advisory Committee. Federal Documents. 1997. Available online: https://digitalcommons.law.ggu.edu/cgi/viewcontent.cgi?article=1006&context=federal_documents (accessed on 19 January 2024).
  15. Renöfält, B.M.; Jansson, R.; Nilsson, C. Effects of Hydropower Generation and Opportunities for Environmental Flow Management in Swedish Riverine Ecosystems. Freshw. Biol. 2010, 55, 49–67. [Google Scholar] [CrossRef]
  16. U.S. Fish and Wildlife Service. Final Biological Opinion on the Operation of Flaming Gorge Dam. 1992. Available online: http://www.riversimulator.org/Resources/LawOfTheRiver/HooverDamDocs/Supplements/1992FinalBOFlamingGorgeDam.pdf (accessed on 19 January 2024).
  17. U.S. Forest Service. Biological Opinion for the Effects to Bull Trout from Continued Implementation of Land and Resource Management Plans and Resource Management Plans as Amended by the Interim Strategy for Managing Fish-Producing Watersheds in Eastern Oregon and Washington, Idaho, Western Montana, and Portions of Nevada (INFISH), and the Interim Strategy for Managing Anadromous Fish-Producing Watersheds in Eastern Oregon and Washington, Idaho, and Portions of California (PACFISH). 1998. Available online: https://www.fs.usda.gov/Internet/FSE_DOCUMENTS/stelprdb5427694.pdf (accessed on 19 January 2024).
  18. U.S. Department of the Interior. Operation of Flaming Gorge Dam Draft Environmental Impact Statement Executive Summary. Reclamation Managing Water in the West. 2004. Available online: https://www.uintahwater.org/sites/g/files/vyhlif1341/f/uploads/eis_executive_summary_september_2005.pdf (accessed on 19 January 2024).
  19. U.S. Department of the Interior. Record of Decision for the Glen Canyon Dam Long-Term Experimental and Management Plan Final Environmental Impact Statement; U.S. Department of the Interior: Washington, DC, USA, 2016.
  20. Ploussard, Q.; Veselka, T.D.; Palmer, C.S. Economic Analysis of Changes in Hydropower Operations at the Flaming Gorge Dam and the Aspinall Unit Due to the Upper Colorado River Endangered Fish Recovery Program; Argonne National Lab. (ANL): Argonne, IL, USA, 2022. [Google Scholar]
  21. U.S. Department of the Interior. Glen Canyon Dam Long-Term Experimental and Management Plan Draft Environmental Impact Statement. Available online: https://parkplanning.nps.gov/document.cfm?parkID=442&projectID=39292&documentID=70123 (accessed on 24 May 2023).
  22. Manikkuwahandi, T.D.S.; Hornberger, G.M.; Baroud, H. Decision Analysis for Expansion of Mahaweli Multipurpose Reservoir System in Sri Lanka. Water Resour. Plan. Res. 2019, 145, 05019013. [Google Scholar] [CrossRef]
  23. Ploussard, Q.; Veselka, T.D. Financial Analysis of the 2018 Glen Canyon Dam Bug Flow Experiment; Argonne National Lab. (ANL): Argonne, IL, USA, 2019. [Google Scholar]
  24. Ploussard, Q.; Veselka, T.D. Financial Analysis of Experimental Releases Conducted at Glen Canyon Dam during Water Year 2021; Argonne National Lab. (ANL): Argonne, IL, USA, 2022. [Google Scholar]
  25. Giupponi, C.; Sgobbi, A. Decision Support Systems for Water Resources Management in Developing Countries: Learning from Experiences in Africa. Water 2013, 5, 798–818. [Google Scholar] [CrossRef]
  26. Chinchuluun, A.; Pardalos, P.M.; Migdalas, A.; Pitsoulis, L. (Eds.) Pareto Optimality, Game Theory and Equilibria; Springer Optimization and Its Applications; Springer: New York, NY, USA, 2008; Volume 17, ISBN 978-0-387-77246-2. [Google Scholar]
  27. Dhaubanjar, S.; Davidsen, C.; Bauer-Gottwein, P. Multi-Objective Optimization for Analysis of Changing Trade-Offs in the Nepalese Water–Energy–Food Nexus with Hydropower Development. Water 2017, 9, 162. [Google Scholar] [CrossRef]
  28. De Silva Manikkuwahandi, T.; Hornberger, G.M. Deriving Reservoir Cascade Operation Rules for Variable Streamflows by Optimizing Hydropower Generation and Irrigation Water Delivery. J. Water Resour. Plan. Manag. 2021, 147, 05021007. [Google Scholar] [CrossRef]
  29. Giuliani, M.; Quinn, J.D.; Herman, J.D.; Castelletti, A.; Reed, P.M. Scalable Multiobjective Control for Large-Scale Water Resources Systems Under Uncertainty. IEEE Trans. Control. Syst. Technol. 2018, 26, 1492–1499. [Google Scholar] [CrossRef]
  30. Giuliani, M.; Castelletti, A.; Pianosi, F.; Mason, E.; Reed, P.M. Curses, Tradeoffs, and Scalable Management: Advancing Evolutionary Multiobjective Direct Policy Search to Improve Water Reservoir Operations. J. Water Resour. Plan. Manag. 2016, 142, 04015050. [Google Scholar] [CrossRef]
  31. Zhou, Y.; Guo, S.; Chang, F.-J.; Liu, P.; Chen, A.B. Methodology That Improves Water Utilization and Hydropower Generation without Increasing Flood Risk in Mega Cascade Reservoirs. Energy 2018, 143, 785–796. [Google Scholar] [CrossRef]
  32. Feng, Z.K.; Niu, W.J.; Cheng, C.T. Optimization of Hydropower Reservoirs Operation Balancing Generation Benefit and Ecological Requirement with Parallel Multi-Objective Genetic Algorithm. Energy 2018, 153, 706–718. [Google Scholar] [CrossRef]
  33. Yang, T.; Gao, X.; Sellars, S.L.; Sorooshian, S. Improving the Multi-Objective Evolutionary Optimization Algorithm for Hydropower Reservoir Operations in the California Oroville–Thermalito Complex. Environ. Model. Softw. 2015, 69, 262–279. [Google Scholar] [CrossRef]
  34. Mooney, C.Z. Monte Carlo Simulation; SAGE: Thousand Oaks, CA, USA, 1997; ISBN 978-0-8039-5943-9. [Google Scholar]
  35. PLEXOS Energy Modeling Software. Available online: https://www.energyexemplar.com/plexos (accessed on 9 January 2024).
  36. Reliability Modeling Anchor Data Set (ADS). Available online: https://www.wecc.org:443/ReliabilityModeling/Pages/AnchorDataSet.aspx (accessed on 9 January 2024).
  37. U.S. Fish & Wildlife Service. Humpback Chub Reclassified from Endangered to Threatened: Collaboration by Partners Has Improved Conservation Status. Available online: https://www.fws.gov/press-release/2021-10/humpback-chub-reclassified-endangered-threatened-collaboration-partners-has (accessed on 8 November 2023).
  38. Robinson, A.T.; Childs, M.R. Juvenile Growth of Native Fishes in the Little Colorado River and in a Thermally Modified Portion of the Colorado River. N. Am. J. Fish. Manag. 2001, 21, 809–815. [Google Scholar] [CrossRef]
  39. Kim, I.Y.; de Weck, O.L. Adaptive Weighted Sum Method for Multiobjective Optimization: A New Method for Pareto Front Generation. Struct. Multidisc. Optim. 2006, 31, 105–116. [Google Scholar] [CrossRef]
  40. He, H.; Daume, H., III; Eisner, J.M. Learning to Search in Branch and Bound Algorithms. In Proceedings of the Advances in Neural Information Processing Systems, Montreal, QC, Canada, 8–13 December 2014; Curran Associates, Inc.: Red Hook, NY, USA, 2014; Volume 27. [Google Scholar]
  41. Ploussard, Q. Piecewise Linear Approximation with Minimum Number of Linear Segments and Minimum Error: A Fast Approach to Tighten and Warm Start the Hierarchical Mixed Integer Formulation. Eur. J. Oper. Res. 2023. [Google Scholar] [CrossRef]
Figure 1. Map of the Colorado River Basin. The Colorado River Basin is divided into the Lower Basin and the Upper Basin. The Glen Canyon Dam is located near the frontier between the two basins. The two locations where the HBC growth rates are measured, RM 61 and RM 225, are depicted on the map.
Water 16 00371 g001
Figure 2. Environmental objective functions used for the case study. The environmental functions measure the amount of sediment transport (green line), the HBC growth rate at 61 RM downstream of the Glen Canyon Dam (blue lines), and the HBC growth rate at 225 RM downstream of the Glen Canyon Dam (orange lines). The influence of weather temperature on the HBC growth rate is modeled using a different function for each month of the year. For the sake of clarity, only the months of October (Oct), January (Jan), April (Apr), and July (Jul) are represented.
Water 16 00371 g002
Figure 3. Economic and environmental values of the 81,300 Monte Carlo samples. All 2D figures represent the economic value on the x-axis. Panels (ac) represent HBC61, HBC225, and the amount of sediment transport on their y-axes, respectively. Panel (d) is a 3D representation of the economic value, HBC61, and sediment transport. The blue data points represent all Monte Carlo samples. In all 2D figures, the intersection of the two dashed red lines represents the economic and environmental values of the current LTEMP operating criteria (Table 1). The green data points represent the Monte Carlo samples that outperform the LTEMP operating criteria with respect to both the economic and represented environmental values. The orange data points represent the Monte Carlo samples that are Pareto-optimal with respect to both the economic and represented environmental values.
Water 16 00371 g003
Figure 4. Economic and HBC225 values of the MILP solutions. The economic value is represented on the x-axis, whereas the HBC225 value is represented on the y-axis. The blue data points represent all Monte Carlo samples. The orange data points represent the Pareto-efficient Monte Carlo samples that are Pareto-optimal with respect to both the economic and HBC225 values. The green data points represent the optimal MILP solutions. The green dashed line estimates the Pareto front by applying a linear interpolation between the MILP solutions.
Water 16 00371 g004
Figure 5. Monthly water releases of the LTEMP operating criteria and two MILP solutions. The monthly releases of the LTEMP ruleset are depicted by the blue line. The monthly releases of the MILP solution with the largest HBC225 value are depicted by the orange line. The monthly releases of the MILP solution with the largest economic value are depicted by the green line.
Water 16 00371 g005
Table 1. Operating rules at Glen Canyon Dam.
Operating RuleLTEMP Preferred Alternative
Monthly release volumesAs prescribed by [19]
Minimum release rate during the day (cfs)8000
Minimum release rate at night (cfs)5000
Maximum release rate (cfs)25,000
Daily change limit (cfs/24-h)Depends on the monthly release 1
Up-ramp rate limit (cfs/h)4000
Down-ramp rate limit (cfs/h)2500
Note(s): 1 Equal to 10 times the monthly volume (in TAF) from June to August and 9 times the monthly volume (in TAF) in other months; daily range not to exceed 8000 cfs/day.
Table 2. Proportion of win–win samples and Pareto-efficient samples in the Monte Carlo simulation.
Metric ConsideredProportion of Monte Carlo Samples
Economic ValueHBC Growth Rate at RM 61HBC Growth Rate at RM 225Sediment TransportWin–Win Samples (%)Pareto-Efficient Samples (%)
XX 2.80.075
X X 3.70.065
X X0.0360.036
XXX 2.70.087
X XX00.99
XX X00.90
XXXX01.2
Disclaimer/Publisher’s Note: The statements, opinions and data contained in all publications are solely those of the individual author(s) and contributor(s) and not of MDPI and/or the editor(s). MDPI and/or the editor(s) disclaim responsibility for any injury to people or property resulting from any ideas, methods, instructions or products referred to in the content.

