Article

Improved Agricultural Drought Monitoring with an Integrated Drought Condition Index in Xinjiang, China

1
State Key Laboratory of Tibetan Plateau Earth System, Resources and Environment, Institute of Tibetan Plateau Research, Chinese Academy of Sciences, Beijing 100101, China
2
Institute of Science and Technology Education, Beijing Union University, Beijing 100101, China
3
Key Laboratory of Environmental Evolution and Ecological Construction of Hebei Province, College of Resources and Environmental Sciences, Hebei Normal University, Shijiazhuang 050010, China
*
Author to whom correspondence should be addressed.
Water 2024, 16(2), 325; https://doi.org/10.3390/w16020325
Submission received: 24 December 2023 / Revised: 9 January 2024 / Accepted: 11 January 2024 / Published: 18 January 2024
(This article belongs to the Special Issue Drought Monitoring and Risk Assessment)

Abstract

:
Drought is a natural disaster with severe global agricultural and economic impacts. Accurate drought indices are needed for improved assessment and monitoring; however, most existing drought indices poorly represent agricultural drought due to complex interactions among meteorological factors, crop and soil conditions. Here, we compute an integrated drought condition index (IDCI) based on the 3-month standardized precipitation evapotranspiration index (SPEI3), vegetation cover index (VCI) and soil moisture condition index (SMCI). We apply the IDCI to monitoring agricultural drought in Xinjiang, China. After regional evaluations with soil moisture, precipitation and air temperature observations, as well as with the scaled crop yields index, the IDCI was used to describe spatiotemporal changes in regional drought in Xinjiang during 2000–2018, revealing adverse impacts on crop yield (beet, wheat and vegetables). The IDCI is strongly correlated with observed soil moisture and performs better than SMCI, VCI or SPEI3, demonstrating that the IDCI is suitable for agricultural drought monitoring. The most severe drought occurred in the spring to autumn of 2008. Droughts before 2008 were more serious than those after 2008, in terms of both severity and frequency. Droughts in northern, southern and eastern Xinjiang, as well as in the Tianshan Mountains, were generally increasing before 2008 and then weakened after 2008.

1. Introduction

Climate warming accelerates changes in precipitation and temperature, leading to extreme meteorological and hydrological events [1,2,3,4,5,6] such as droughts [7,8,9,10]. Drought is caused by a long-term lack of precipitation and leads to decreased soil moisture [11] and river flow [12], as well as reduced reservoir [13] and groundwater capacities [14]. Drought severely affects water resources, agricultural production, human health and ecosystems [15,16,17,18], but drought monitoring and forecasting is difficult because of its complex nature [19]. The American Meteorological Association classifies droughts into four categories: meteorological, agricultural, hydrological and socio-economic [20,21,22]. A meteorological drought is caused by a lack of precipitation. An agricultural drought is caused by insufficient effective water for crop growth [23]. A hydrological drought is caused by a decrease in river flow and reservoir storage, or a decrease in groundwater level. Finally, a socio-economic drought is related to a shortage of economic materials caused by drought. In China, the annual average non-harvest area was 2.5 × 10⁶ hm2 during 1989–2013, and the grain loss was 1.62 × 10¹⁰ kg; these factors lead to an average direct economic loss of 1.0 × 10¹¹ CNY per year [24]. Therefore, it is critically important to monitor drought.
Many studies have focused on drought indices, drought monitoring and drought-related impacts [23]. McKee et al. [25] proposed a standard precipitation index (SPI) based on the precipitation probability method. Hertig and Tramblay [26] analyzed 13 regions in the Mediterranean using the SPI and found that drought severity and frequency increased in all regions during 2070–2100. Vicente-Serrano et al. [27] proposed a standardized precipitation evapotranspiration index (SPEI) based on the cumulative probability of the difference in precipitation and potential evapotranspiration. Yu et al. [28] indicated a trend towards more severe droughts in China, based on the SPEI. Kogan [29] proposed the vegetation condition index (VCI); Gebrehiwot et al. [30] analyzed drought in the Northern highlands of Ethiopia with VCI and found the southern part of that region has suffered from a repeated drought cycle in the past decade. Palmer [31] proposed the Palmer drought severity index (PDSI) based on water balance and established the self-calibrated PDSI (SC-PDSI). Wang et al. [32] used the SC-PDSI to analyze spatiotemporal changes in drought in China during 1961–2009 and found a clear trend towards wetter conditions throughout the year. Zhang et al. [33] used the VIC to analyze drought on the Loess Plateau over the past decades, reporting that drought has become increasingly serious in the upper reaches of the Yellow River while drought has been alleviated in the middle reaches of the Yellow River. Vicente-Serrano et al. [34] proposed the standardized streamflow index (SSI), which was then used by Wang et al. [35] to analyze hydrological drought in northwestern China, revealing that the duration and severity of drought in Aibi Lake, Irtysh River, Kaidu River, Aksu River, Yarkand River and Horton River decreased with time; meanwhile, the duration and severity of drought in the Tarim River (upstream) was increasing. Bloomfield and Marchant [36] proposed a standardized groundwater level index (SGI), which was used by Feng et al. [37] to analyze drought in the Gaotai, Linze, Ganzhou region; this showed increasing drought from 1986 to 2010. Overall, these different drought indices lead to different conclusions because they consider different factors, resulting in inconsistent results. For example, the SPI and SPEI reflect drought from the perspective of precipitation and evapotranspiration. The PDSI and SC-PDSI reflect drought from the perspective of precipitation, evapotranspiration and soil moisture. The VCI, SMCI, SSI and SGI reflect drought only from the individual perspectives of vegetation conditions, soil moisture, streamflow and groundwater level, respectively. However, because of the complexity of drought occurrence in space and time, it is difficult to utilize a single index to monitor drought [38,39]. Integrated drought indices have been developed to overcome the limitations of individual drought indices and can accurately reflect the impact on agriculture [40]. Hao and Agha Kouchak [41] proposed a non-parametric multivariate drought multi-index to monitor the US drought, finding that the non-parametric multivariate drought multi-index performed better at drought detection than the individual indices. Peña-Gallardo et al. [42] noted that the positive correlation between a multi-scalar drought index and wheat yield was higher than that of an individual drought index. Shen et al. [43] analyzed agricultural drought monitoring across Inner Mongolia based on an integrated drought index and showed that the integrated drought index performed better than VCI, SMCI and SPEI3 (3-month SPEI). Rhee et al. [44] reported that the scaled drought condition index performed better than the existing individual indices. Ali et al. [45] proposed a novel multi-scalar drought index, which performed better than the SPEI. Zhang et al. [46] reported that the multi-sensor integrated drought index achieved a better correlation with wheat yield loss than the individual indices. Therefore, this study uses the integrated drought indices to monitor drought.
Xinjiang is located in northwest China, and it is a typical arid or semi-arid region. The region is mostly supplied by snow and ice melt, together with precipitation, and is thus very sensitive to climate-change-induced drought disasters [47]. A large area of cultivated land and grassland in Xinjiang is affected by drought every year. Meanwhile, agricultural drought has caused large economic losses. Consequently, drought monitoring and agricultural drought mitigation is crucial in Xinjiang. However, previous studies covering this region have mostly focused on meteorological drought and hydrological drought. For example, Zhang et al. [48] used SPI to analyze Xinjiang drought and found that the Xinjiang had a wetting tendency during 1961–2008. Wang et al. [49] reported continuous drought from 1960 to 1986, while the main wet conditions from 1987 to 2010 were in the arid area of northwestern China. Yao et al. [50] used SPEI to analyze multi-scale droughts in Xinjiang from 1961 to 2015, finding a wetting trend during 1961–1997 and a drying trend from 1998 to 2015. Li et al. [51] examined changes in drought and high temperature extremes in northwest China with SPEI, reporting increasing trends in both measures across most parts of northwest China. Meteorological and hydrological drought indices show lags and do not fully represent the true drought situation [52,53,54]; furthermore, they do not fully reflect the impacts on agriculture [40].
However, to date, there have been few studies of agricultural drought in the arid Xinjiang region of China. Therefore, this study uses the integrated drought index (IDCI) [43,55], which considers precipitation, evapotranspiration, soil moisture and vegetation status, to examine agricultural drought in Xinjiang.
The aim of this study is to assess whether the IDCI (as an integrated drought index) is suitable for monitoring regional agricultural drought, based on the case-study of a typical arid and semi-arid region (Xinjiang in China). This study could assist with the risk assessment of agricultural drought under climate change and help with agricultural drought relief in other areas of China. The main objectives are to (1) evaluate whether IDCI can be applied to agricultural drought monitoring in Xinjiang; (2) analyze the spatiotemporal distribution of drought in the study region; and (3) evaluate the impact of drought on crops.

2. Study Area and Data
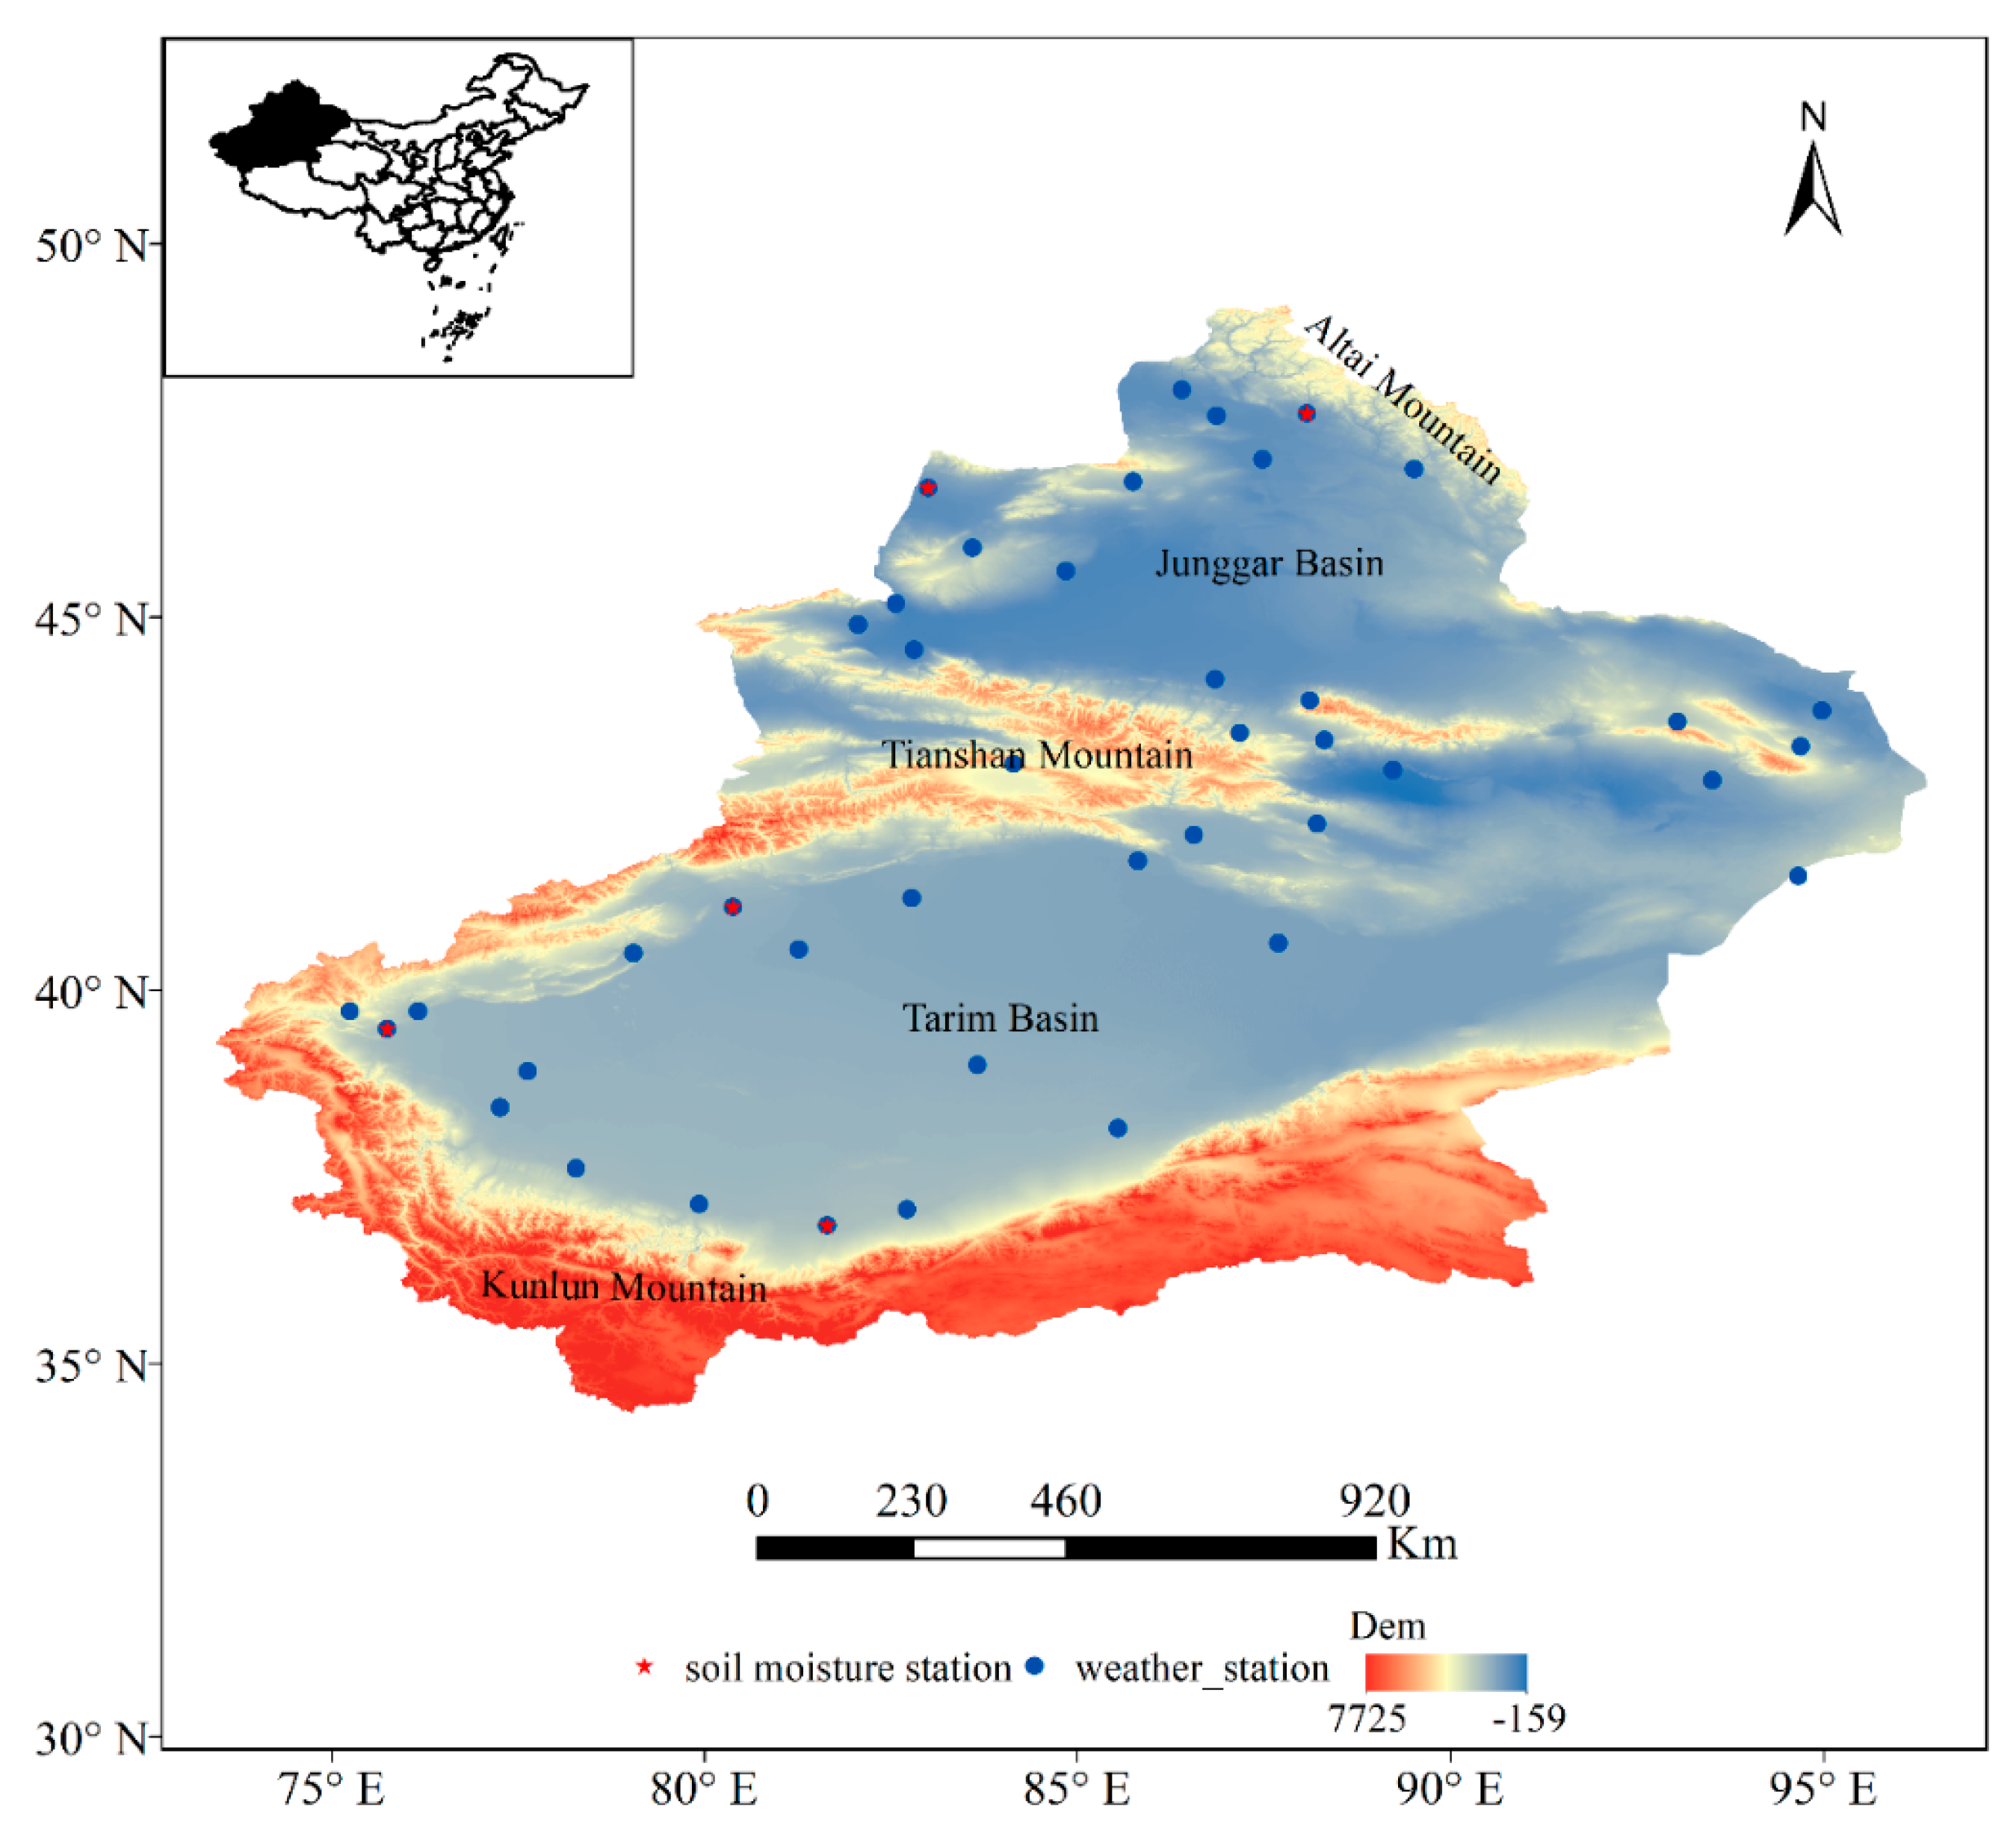
2.1. Study Area

Xinjiang (China) is located at 73°20′–96°25′ E, 34°15′–49°10′ N, in the center of Eurasia, and has a temperate continental climate. The total area of Xinjiang is 1.66 × 10⁶ km2. The region is bounded by the Altai Mountains in the north, and the Kunlun Mountains, Altai Mountains and Tianshan Mountains in the South. The Tianshan Mountains lie in the center of the region, dividing Xinjiang into two parts: the Tarim Basin (‘South Xinjiang’) and the Junggar Basin (‘North Xinjiang’), with the Hami and Turpan basins considered as ‘East Xinjiang’ (Figure 1) [56,57]. Due to its particular geographical location, the region mainly relies on humid air masses from the Atlantic Ocean to bring precipitation. During 2000–2018, the annual mean precipitation in Xinjiang was about 142.7 mm, and the annual mean temperature was about 8.9 °C. The seasonal and diurnal temperature variations are large, and the region is characterized by abundant sunshine as well as strong evaporation. The mean drought-affected area was approximately 3.98 × 10⁵ ha during 2000–2015.

2.2. Data

Daily meteorological station data from 2000 to 2018, including precipitation, maximum temperature, minimum temperature, 2 m wind speed, sunshine duration and monthly soil moisture data during 2000–2018 (we chose this period to match the timing of MODIS data) were collected from the National Climate Center (NCC) of the China Meteorological Administration (CMA) (http://data.cma.cn/ (accessed on 1 January 2020)). Daily meteorological station data and soil moisture data were quality controlled before publication. For this study, the Terra MODIS (Moderate Resolution Imaging Spectroradiometer) monthly synthesis NDVI (normalized difference vegetation index) data product with a spatial resolution of 1 km × 1 km (MOD13A3) from 2000 to 2018 for Xinjiang Province were downloaded from the National Aeronautics and Space Administration (https://ladsweb.modaps.eosdis.nasa.gov/ (accessed on 1 January 2020)). The GLDAS (Global Land Data Assimilation System) soil moisture data with a spatial resolution of 0.25° × 0.25° were provided by Goddard Earth Sciences Data and Information Services Center (GES DISC) (https://disc.gsfc.nasa.gov/ (accessed on 1 January 2020)). Crop yield data were downloaded from the China Statistical Yearbooks Database (http://tongji.cnki.net/kns55/index.aspx (accessed on 1 January 2020)). Drought-affected area data were provided by the China National Bureau of Statistics (http://data.stats.gov.cn/ (accessed on 1 January 2020)). There are 42 weather stations and 5 soil moisture stations in Xinjiang (Figure 1). The daily precipitation and temperature data were used to compute the SPEI3, the NDVI data were used to compute the VCI, the GLDAS soil moisture data were used to compute the SMCI and the crop yield data were used to compute the SCYI.

3. Methods

In this study, the integrated drought condition index calculation process is as follows (Figure 2). As Figure 2 shows, the downloaded MOD13A3 is spliced by MRT, the NDVI of the corresponding position of the meteorological stations is extracted and the VCI is calculated. The GLDAS soil moisture at the corresponding location of the meteorological station is extracted and the SMCI is calculated. We used the meteorological data calculating the potential evapotranspiration, then the SPEI was calculated based on precipitation and potential evapotranspiration. We applied the principal component analysis to calculate the integrated drought condition index.

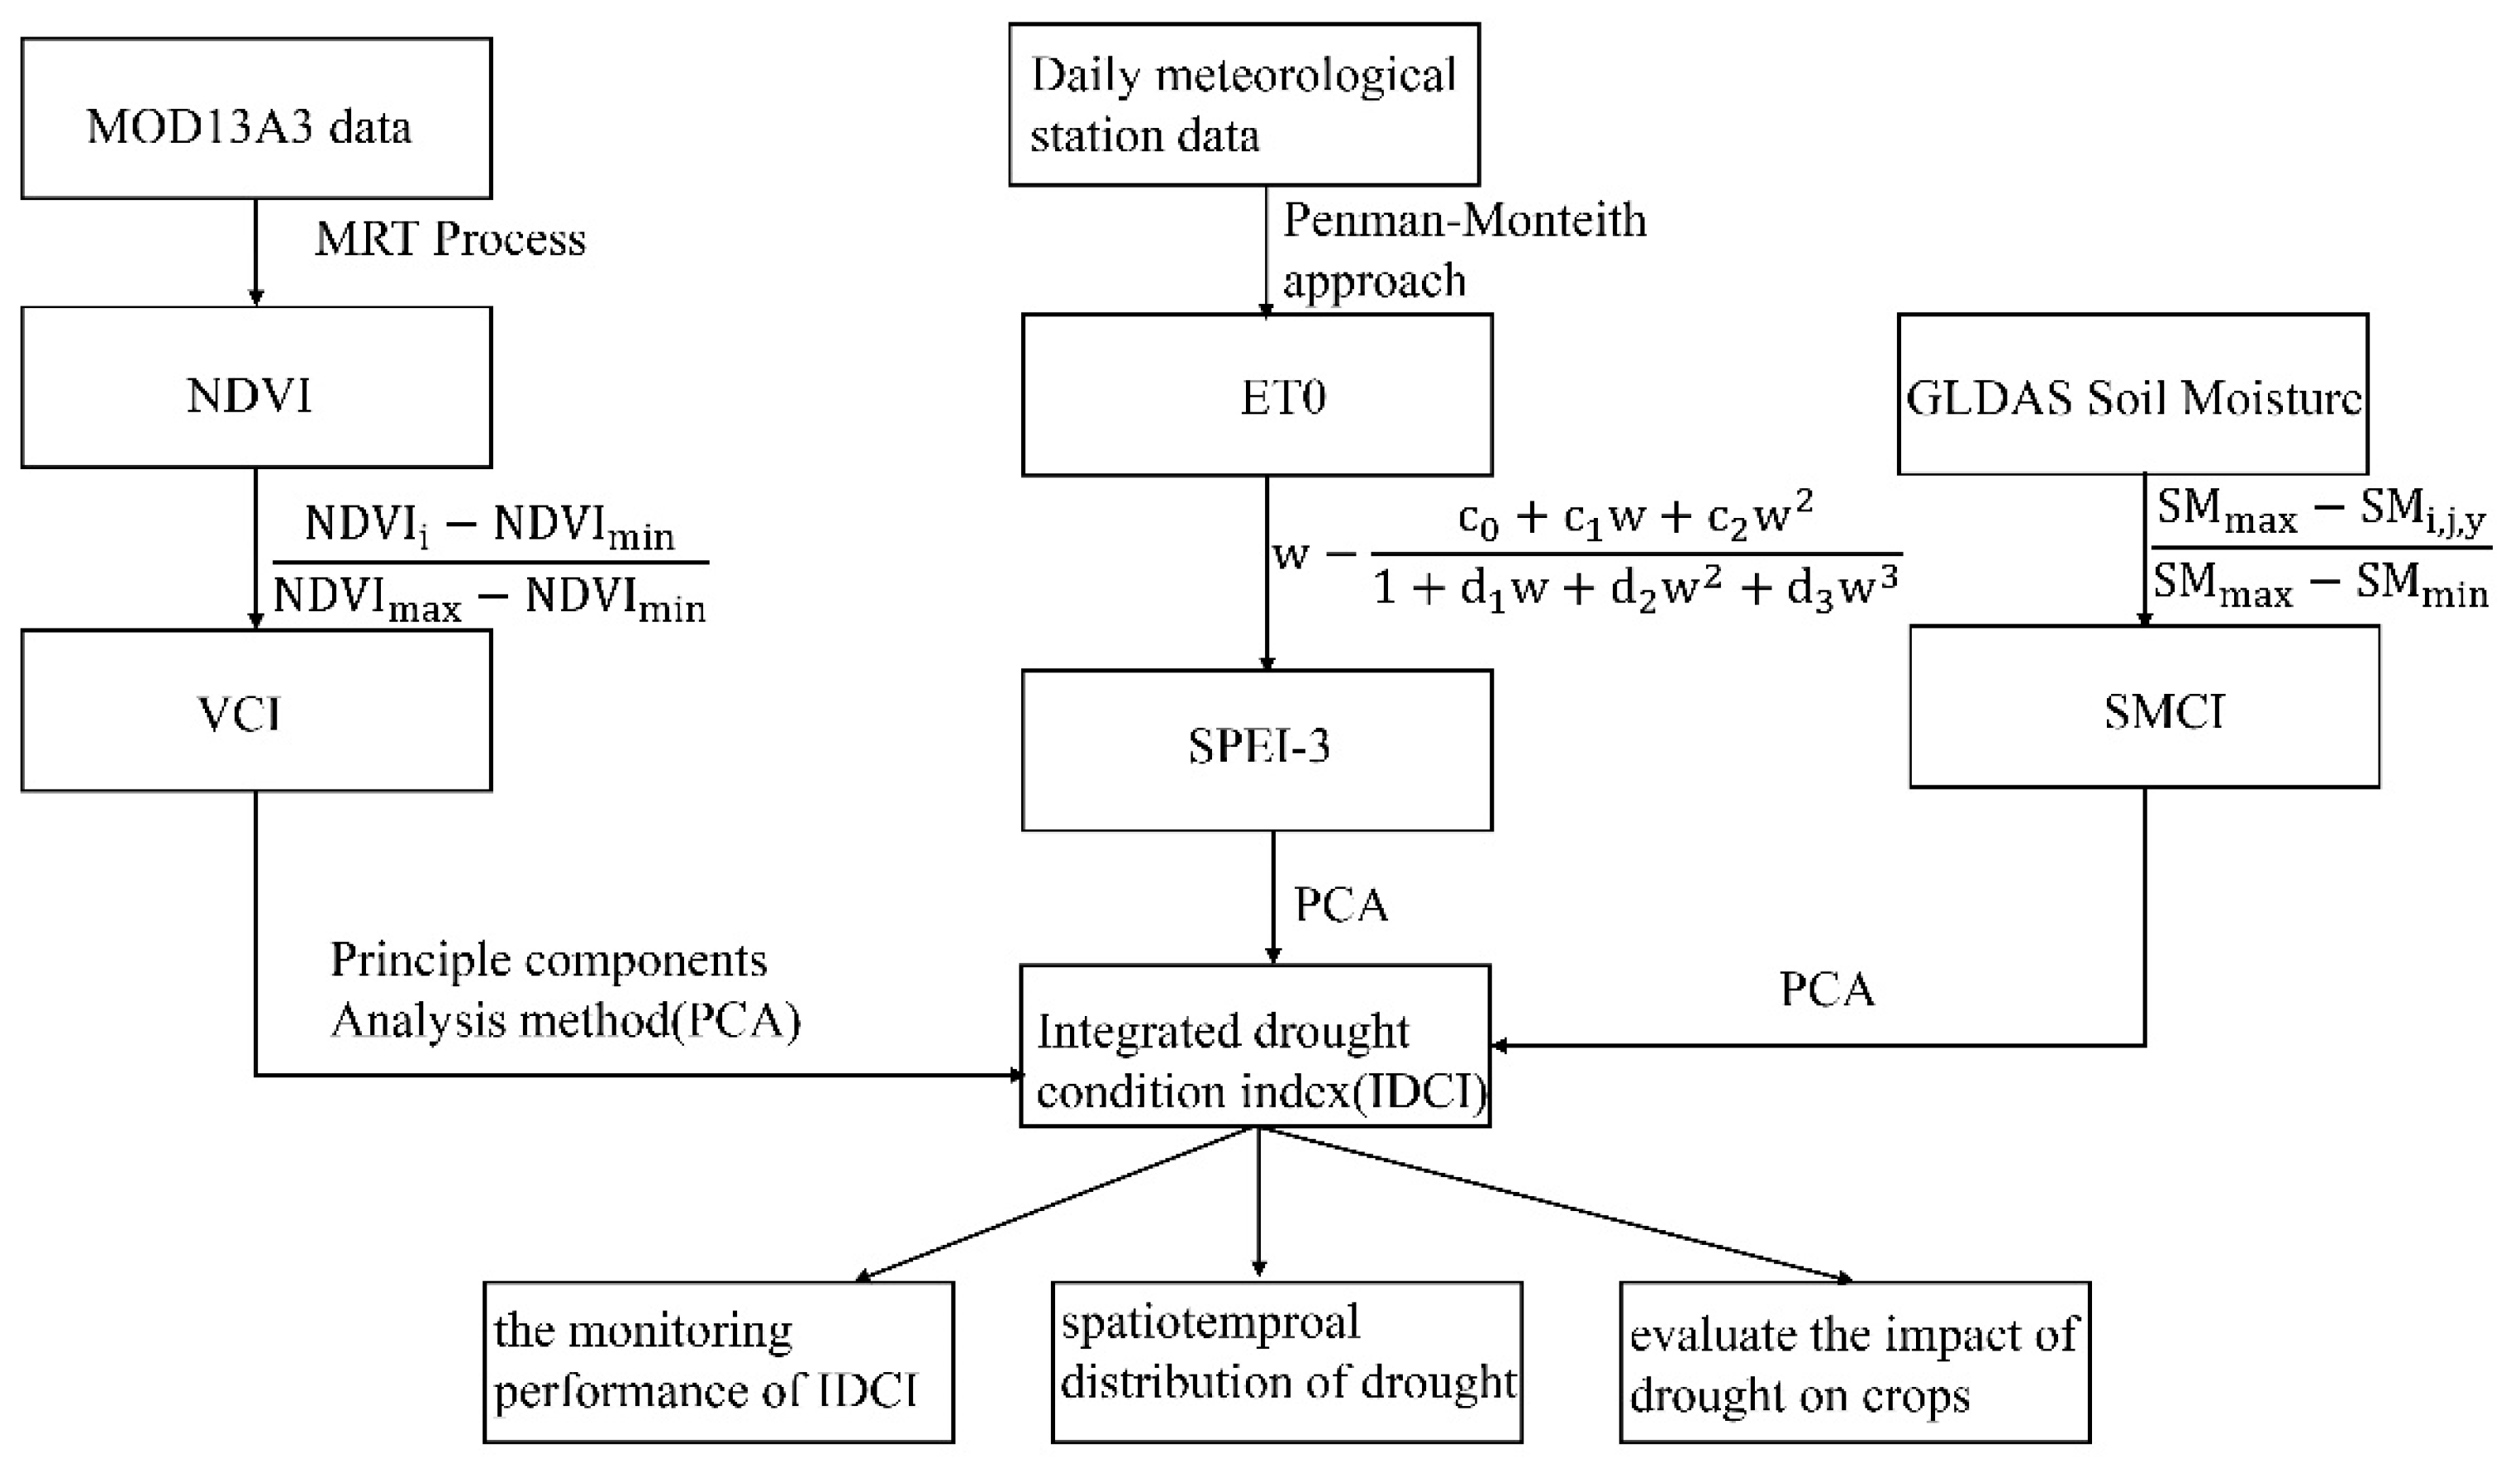
3.1. Integrated Drought Condition Index (IDCI)

In this study, we use principal components analysis (PCA) [55,58] to integrate information from the SPEI3, VCI and SMCI [43] and the corresponding coefficients (a, b and c) (Table 1) at different stations for different time periods. Specifically,
I D C I = a i × S M C I + b i × V C I + c i × S P E I 3
VCI is calculated by NDVI as follows [44]:
V C I = N D V I i N D V I m i n N D V I m a x N D V I m i n
where N D V I i is the monthly NDVI at meteorological station number i, while N D V I m i n and N D V I m a x are the absolute minimum and maximum values of NDVI at station i during 2000–2018.
SMCI is calculated as follows [59]:
S M C I = S M m a x S M i , j , y S M m a x S M m i n
where S M i , j , y is the reanalysis soil moisture at pixel i in the jth month of the yth year; S M m a x and S M m i n are the absolute maximum and minimum values of SMCI at pixel i from 2000 to 2018.
The SPEI is a new drought index established by Vicente-Serrano et al. [27,60] on the basis of the SPI and considering the influence of evapotranspiration. The SPEI is a normal standardized index based on the cumulative probability of the difference between precipitation and potential evapotranspiration. First, the potential evapotranspiration is calculated by the Penman–Monteith method [61], then the difference between monthly precipitation and evapotranspiration is calculated and the accumulation sequence of water profit and loss at different time scales is established. Since there may be negative values in the original data series, a log-logistic probability distribution with three parameters is used to standardize the cumulative probability density, and the SPEI value is finally calculated. First, potential evapotranspiration (PET) is calculated according to the FAO Penman–Monteith method [61]:
E T 0 = 0.408 Δ R n G + γ 900 T m e a n + 273 μ 2 ( e s e a ) Δ + γ ( 1 + 0.34 μ 2 )
where E T 0 is the potential evapotranspiration (mm/d), Δ is the slope of saturated water pressure curve (kPa/°C), γ is the psychometric constant (kPa/°C), μ 2 is the wind speed at 2 m height (m/s), R n is the surface net radiation (MJ/m2 · d), G is the soil heat flux (MJ/m2 · d) (which changes very little on diurnal time scales and can be ignored), T m e a n is the mean daily temperature (°C), e s is the average saturated vapor pressure (kPa) and e a is the actual vapor pressure (kPa).
The difference between annual monthly precipitation and evapotranspiration, Di, can be calculated as follows:
D i = P i E T i
where P i is the monthly precipitation (mm) and E T i is the monthly evapotranspiration (mm). The log-logistic probability distribution of three parameters is used to normalize the Di data series:
F x = [ 1 + ( α x γ ) β ] 1
The parameters ( α , γ and β ) are calculated as follows:
α = ( ω 0 2 ω 1 ) β Γ ( 1 + 1 β ) Γ ( 1 1 β )
β = 2 ω 1 ω 0 6 ω 1 ω 0 6 ω 2
γ = ω 0 α Γ ( 1 + 1 β ) Γ ( 1 1 β )
where Γ is the factorial function, and ω 0 , ω 1 , ω 2 are the probability weighted moments of the data sequence D i .
ω s = 1 N i = 1 N ( 1 F i ) s D i
F i = i 0.35 N
where N is the number of months counted for participation. Finally, the cumulative probability density is standardized:
P = 1 F ( x )
When the cumulative probability p ≤ 0.5:
ω = 2 ln ( P )
The SPEI index corresponding to each value is calculated as follows [27]:
S P E I = ω c 0 + c 1 ω + c 2 ω 2 1 + d 1 ω + d 2 ω 2 + d 3 ω 3
where c0 = 2.515517, c1 =0.802854, c2 = 0.010328, d1= 1.432788, d2 = 0.189269, d 3 = 0.001308.
Because this method is based on the assumption that the accumulated water deficit in a given month follows the log-logistic distribution, then to verify whether the accumulated water deficit in Xinjiang conforms to the log logistic distribution, the K-S (Kolmogorov–Smirnov) test was carried out here on the accumulated water deficit sequence and log-logistic distribution at the three-month scale. The results of this test show that the probability p = 0.167 of the K-S test is greater than the significance level α = 0.05 at the three-month scale, indicating that the samples of accumulated water deficit follow a log-logistic distribution. Therefore, the SPEI index based on this distribution has an appropriate mathematical and statistical theoretical basis in Xinjiang drought characterization.

3.2. Scaled Crop Yield Index (SCYI)

We used the SCYI to evaluate the monitoring performance of IDCI and analyzed the yields of wheat, maize, cotton, beet, vegetables and melon. The area of these six main crops accounted for the vast majority of the total crop area in Xinjiang Province. The SCYI is calculated as follows [43]:
S C Y I i , j = C Y i , j min ( C Y i ) max C Y i min ( C Y i )
where C Y i , j refers to the yield of the ith type of crop during the jth year; S C Y I i , j refers to the SCYI of the ith type of crop during the jth year.

3.3. Calculation of Drought Frequency

Drought frequency can also reflect the spatial and temporal distribution of drought [43]. In this study, we calculated the frequencies of droughts with severe and extremely severe drought intensities based on the IDCI, from 2000 to 2018:
P x , y = M n , x , y + M s , x , y M × 100 %
where P x , y is the total frequency of droughts with severe and extremely severe drought intensities at station x during month y in 2000–2018; M n , x , y , M s , x , y are the occurrence times of droughts with severe and extremely severe intensities during 2000 to 2018, respectively; M is the occurrence times of all drought events considered in this study during 2000–2018.

3.4. Rotated Empirical Orthogonal Function (REOF)

One limitation of the empirical orthogonal function (EOF) is that the separated spatial distribution structure cannot clearly represent the characteristics of different geographical regions. When the EOF is extended, the range of the selected region is different, and the spatial distribution of the eigenvector is also different, which hinders physical interpretation [49,62]. However, these limitations can be improved by using the REOF. The spatial mode obtained by the REOF is the load vector of the rotation factor, and each vectorization table contains the distribution structure of the spatial correlation. After the rotation operation, high loadings are concentrated in a small area, and loads in the remaining large areas are close to 0. If the symbols of each component of a vector are the same, then the vector represents a spatial distribution structure with the high load area at the center and the climate variable changes in that region are the same. If the component sign of a vector in one area is positive, but negative in another area, and if the high load is concentrated in the positive area or negative area, then the distribution structure represents a trend that is opposite and whose center lies in the area where the high load is located. Through the spatial distribution structure, not only can the regional structure of the climate variable field be analyzed, but also the region and the type of the climate variable field can be divided by the high load region of each vector. The corresponding calculation is as follows:
Z x , y , t = P C ( t ) × E O F ( x , y )
where Z x , y , t is the spatiotemporal field, P C is the principal component time series and E O F is the principal loading pattern [62]. In this study, maximum variance was used as the orthogonal rotation process to obtain the total variance contribution and cumulative variance contribution.

4. Results and Discussion

4.1. Agricultural Drought Monitoring Performance of the IDCI

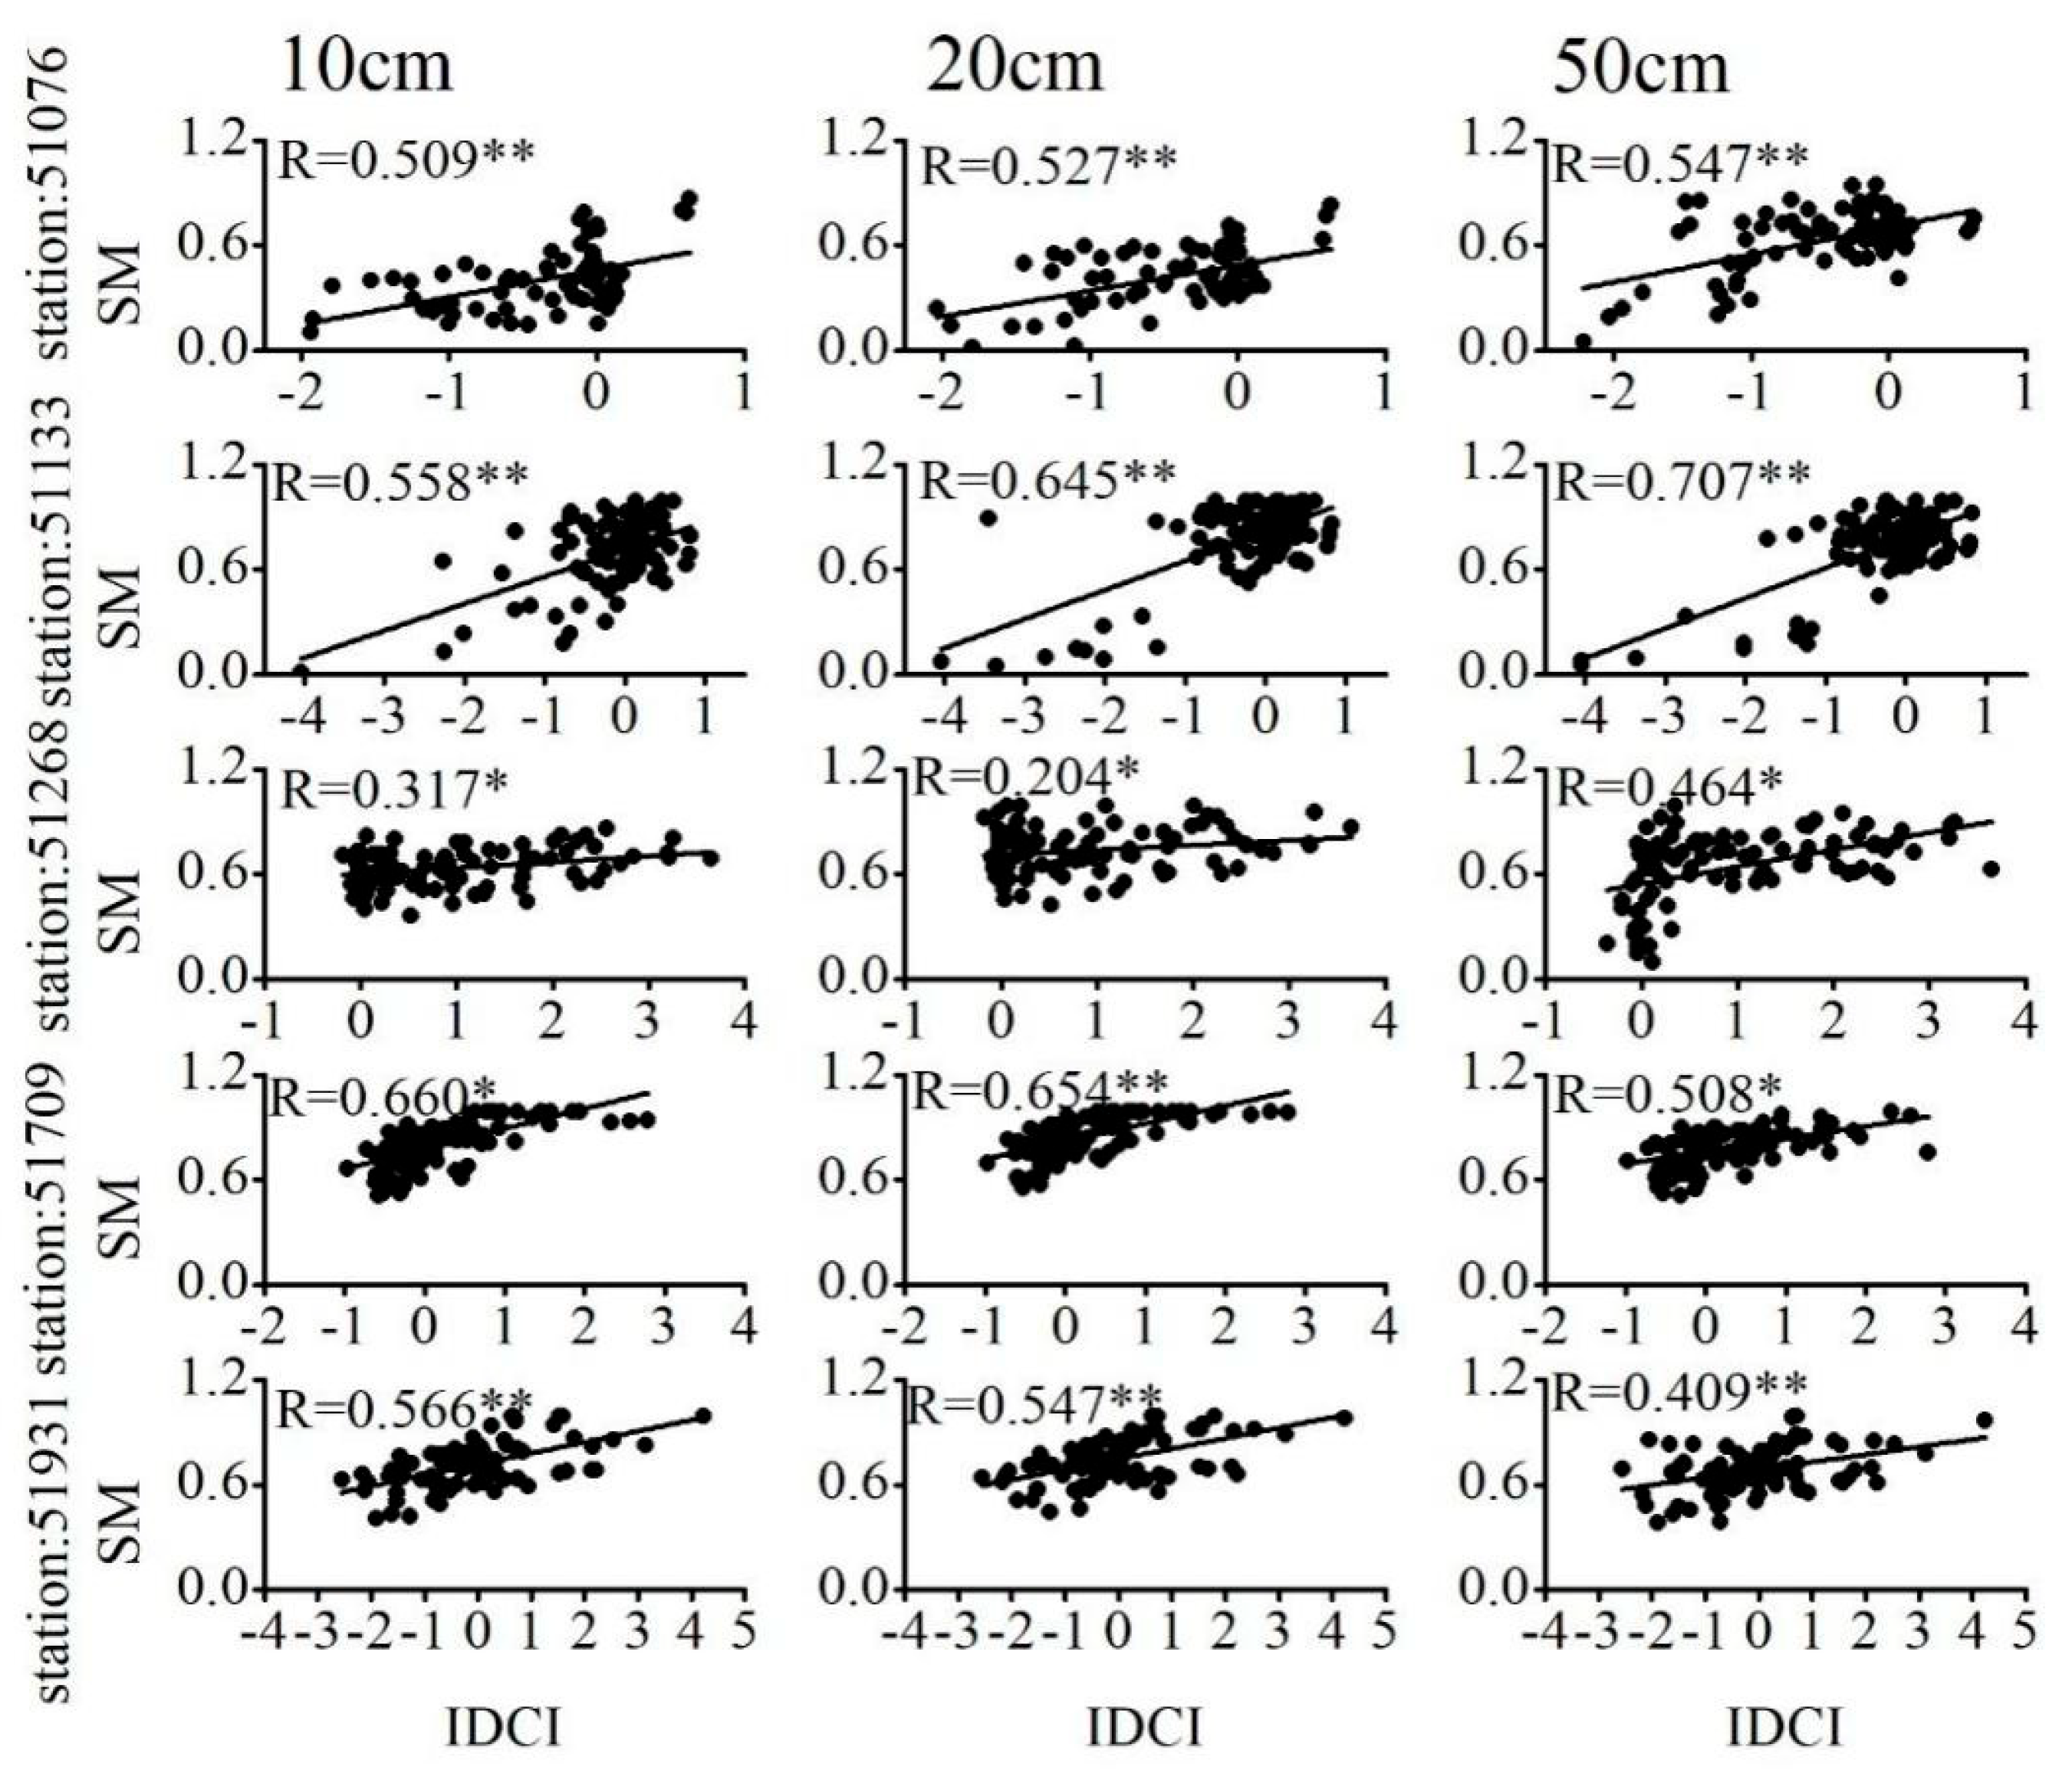
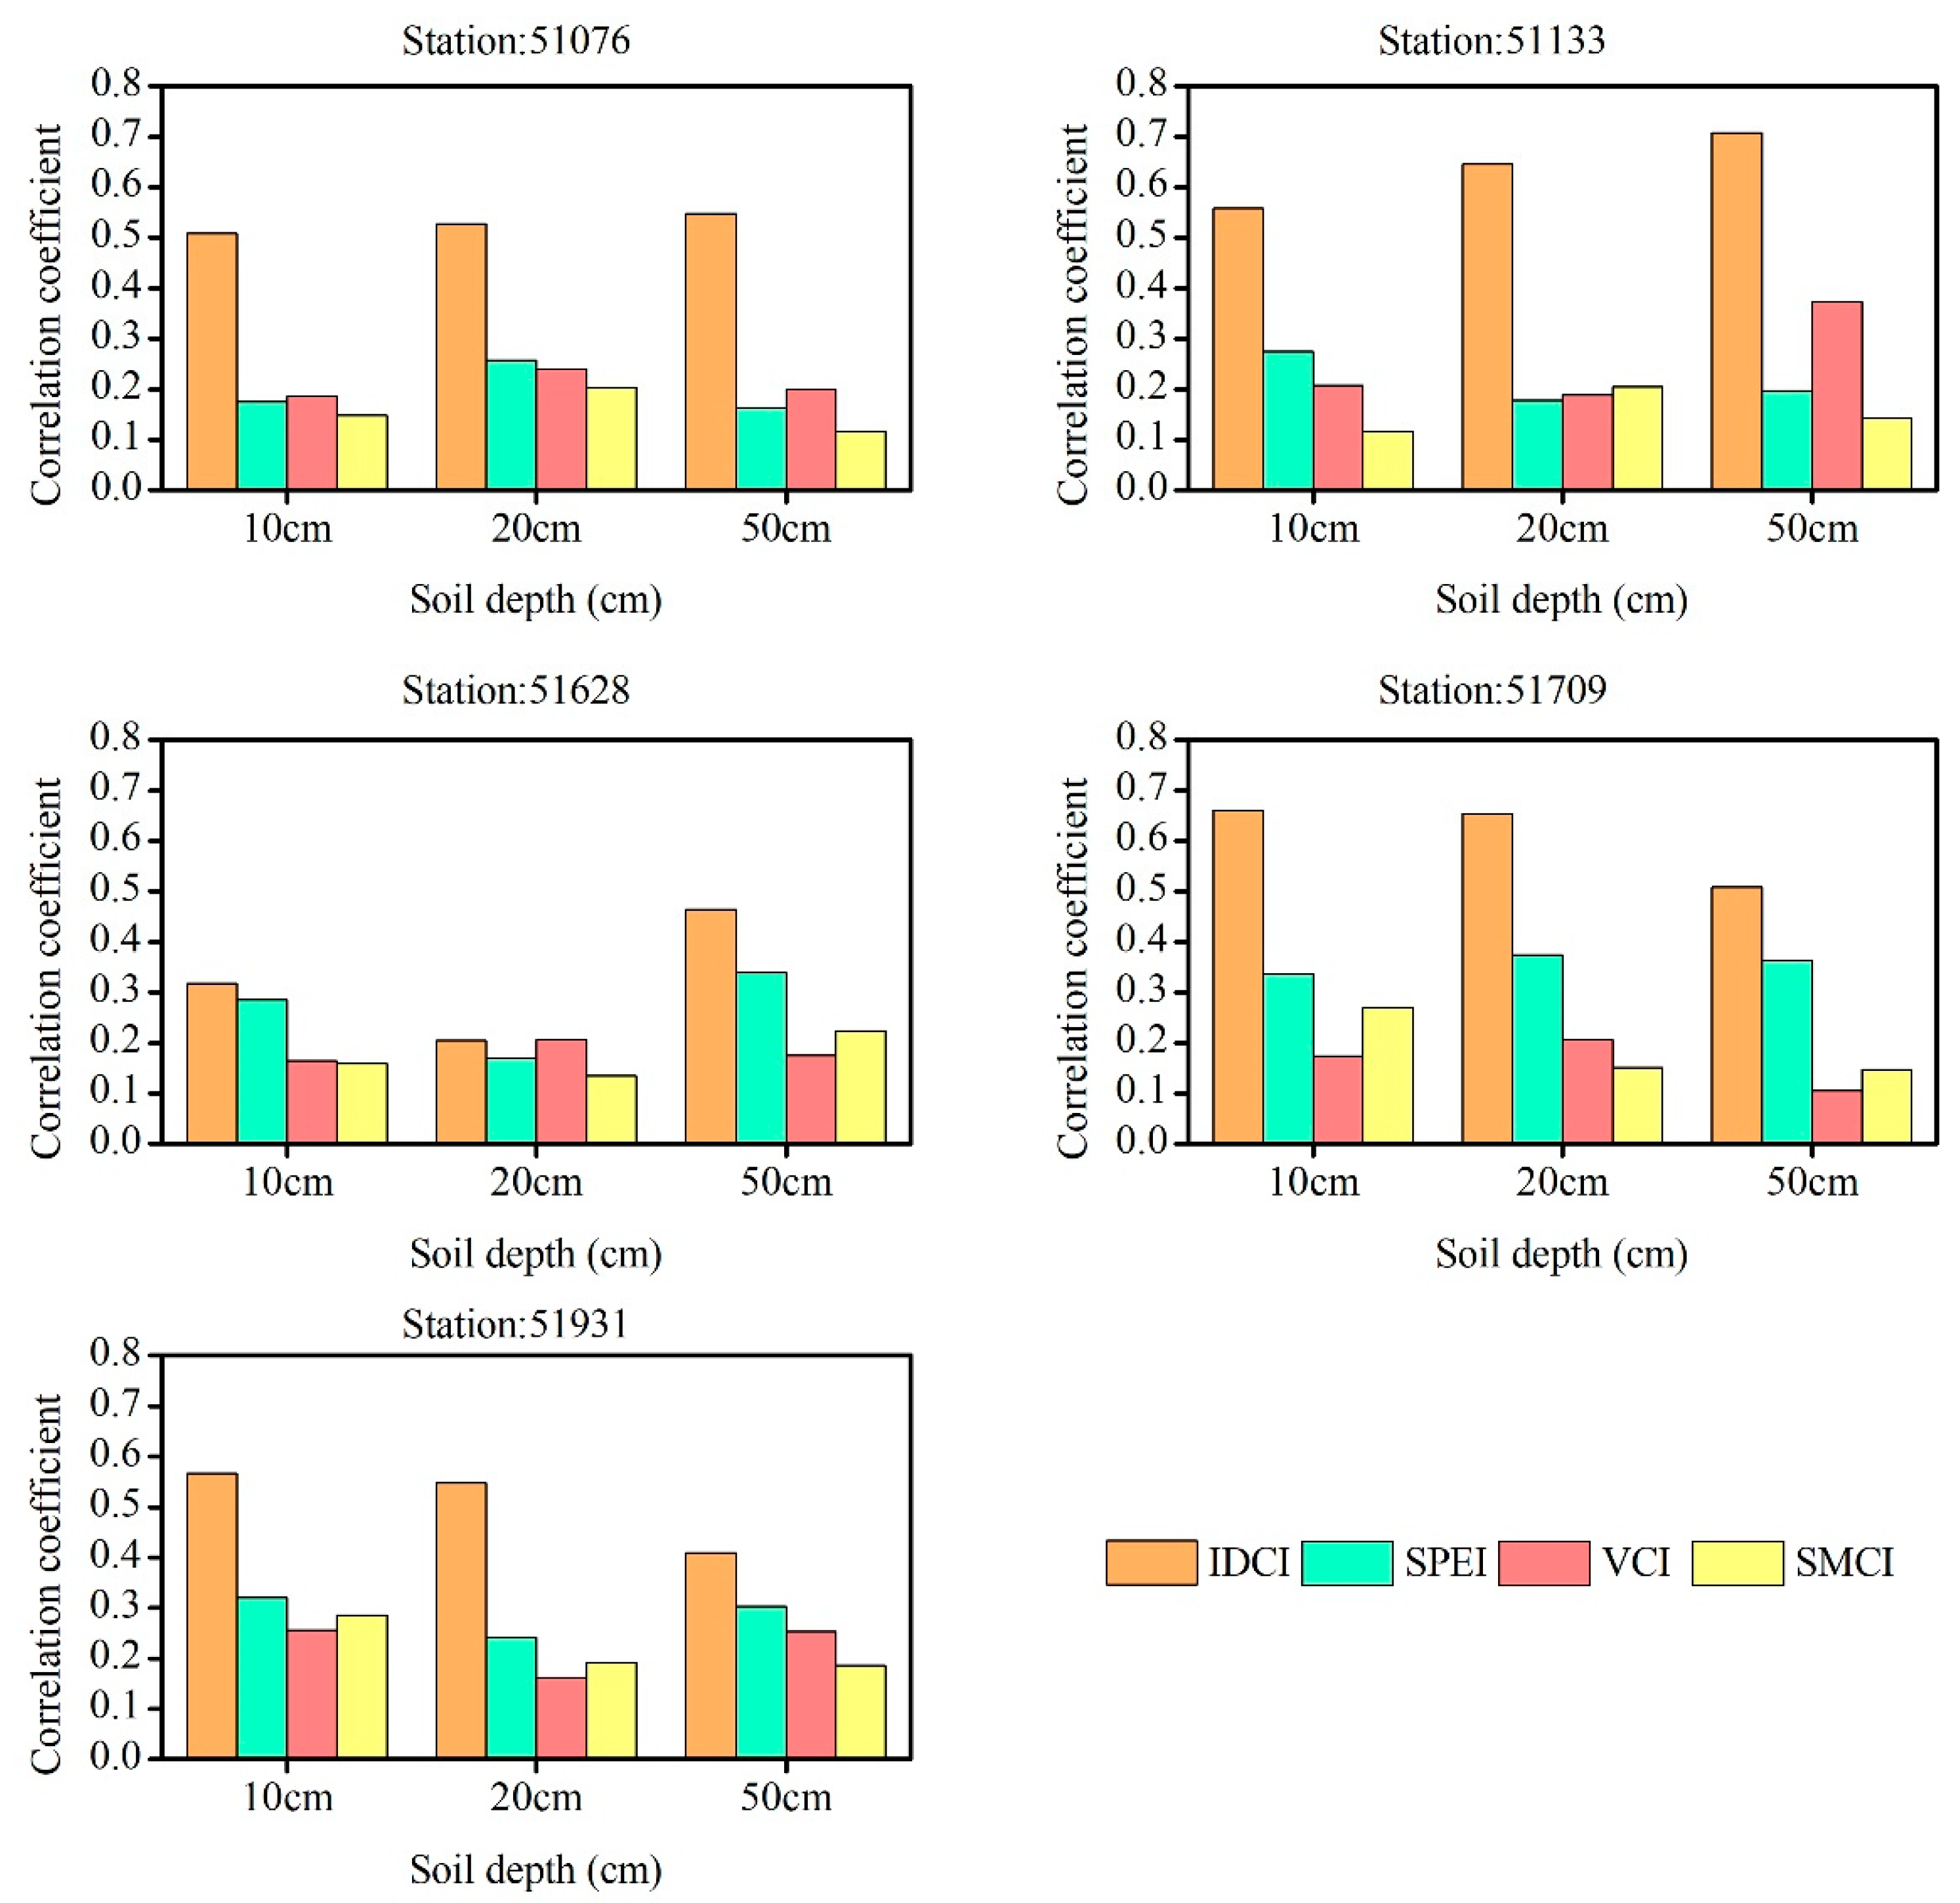
4.1.1. Correlations between the IDCI and Soil Moisture Observations

Soil moisture directly affects the growth and production of crops, and it can be used as the main factor to measure agricultural drought conditions [31,63]. To check whether the IDCI can monitor agricultural drought, five stations with high-quality soil moisture observations were selected to analyze the relationship between the IDCI and the observed soil moisture content under different soil depths (Figure 3). The results showed a significant correlation between the observed soil moisture content and IDCI in Xinjiang (see Figure 3); this correlation was significant at the 0.05 level at Station 51,268 and at the 0.01 level at all other stations. In addition, we can see from Figure 4 that the correlation coefficient between the observed soil moisture and the IDCI is higher than that of SPEI-3, VCI and SMCI at both the station scale and soil depth scale. This indicates that the performance of the IDCI in monitoring soil moisture is better than the single drought index (e.g., SPEI-3, VCI, SMCI), and the IDCI can accurately represent agricultural drought from the perspective of soil moisture change. Similar results have been found in previous studies. For example, Dai et al. [64] reported that the PDSI in most areas of China showed a significant correlation with soil moisture at a depth of 1 m. Mika et al. [65] showed that the correlation between soil moisture and the PDSI in the Great Hungarian Plain from November to April was higher than that in May to October. Shen et al. [43] also found a correlation between the IDCI and soil moisture content. These results demonstrate that the IDCI is an accurate and reliable index for drought monitoring in Xinjiang.

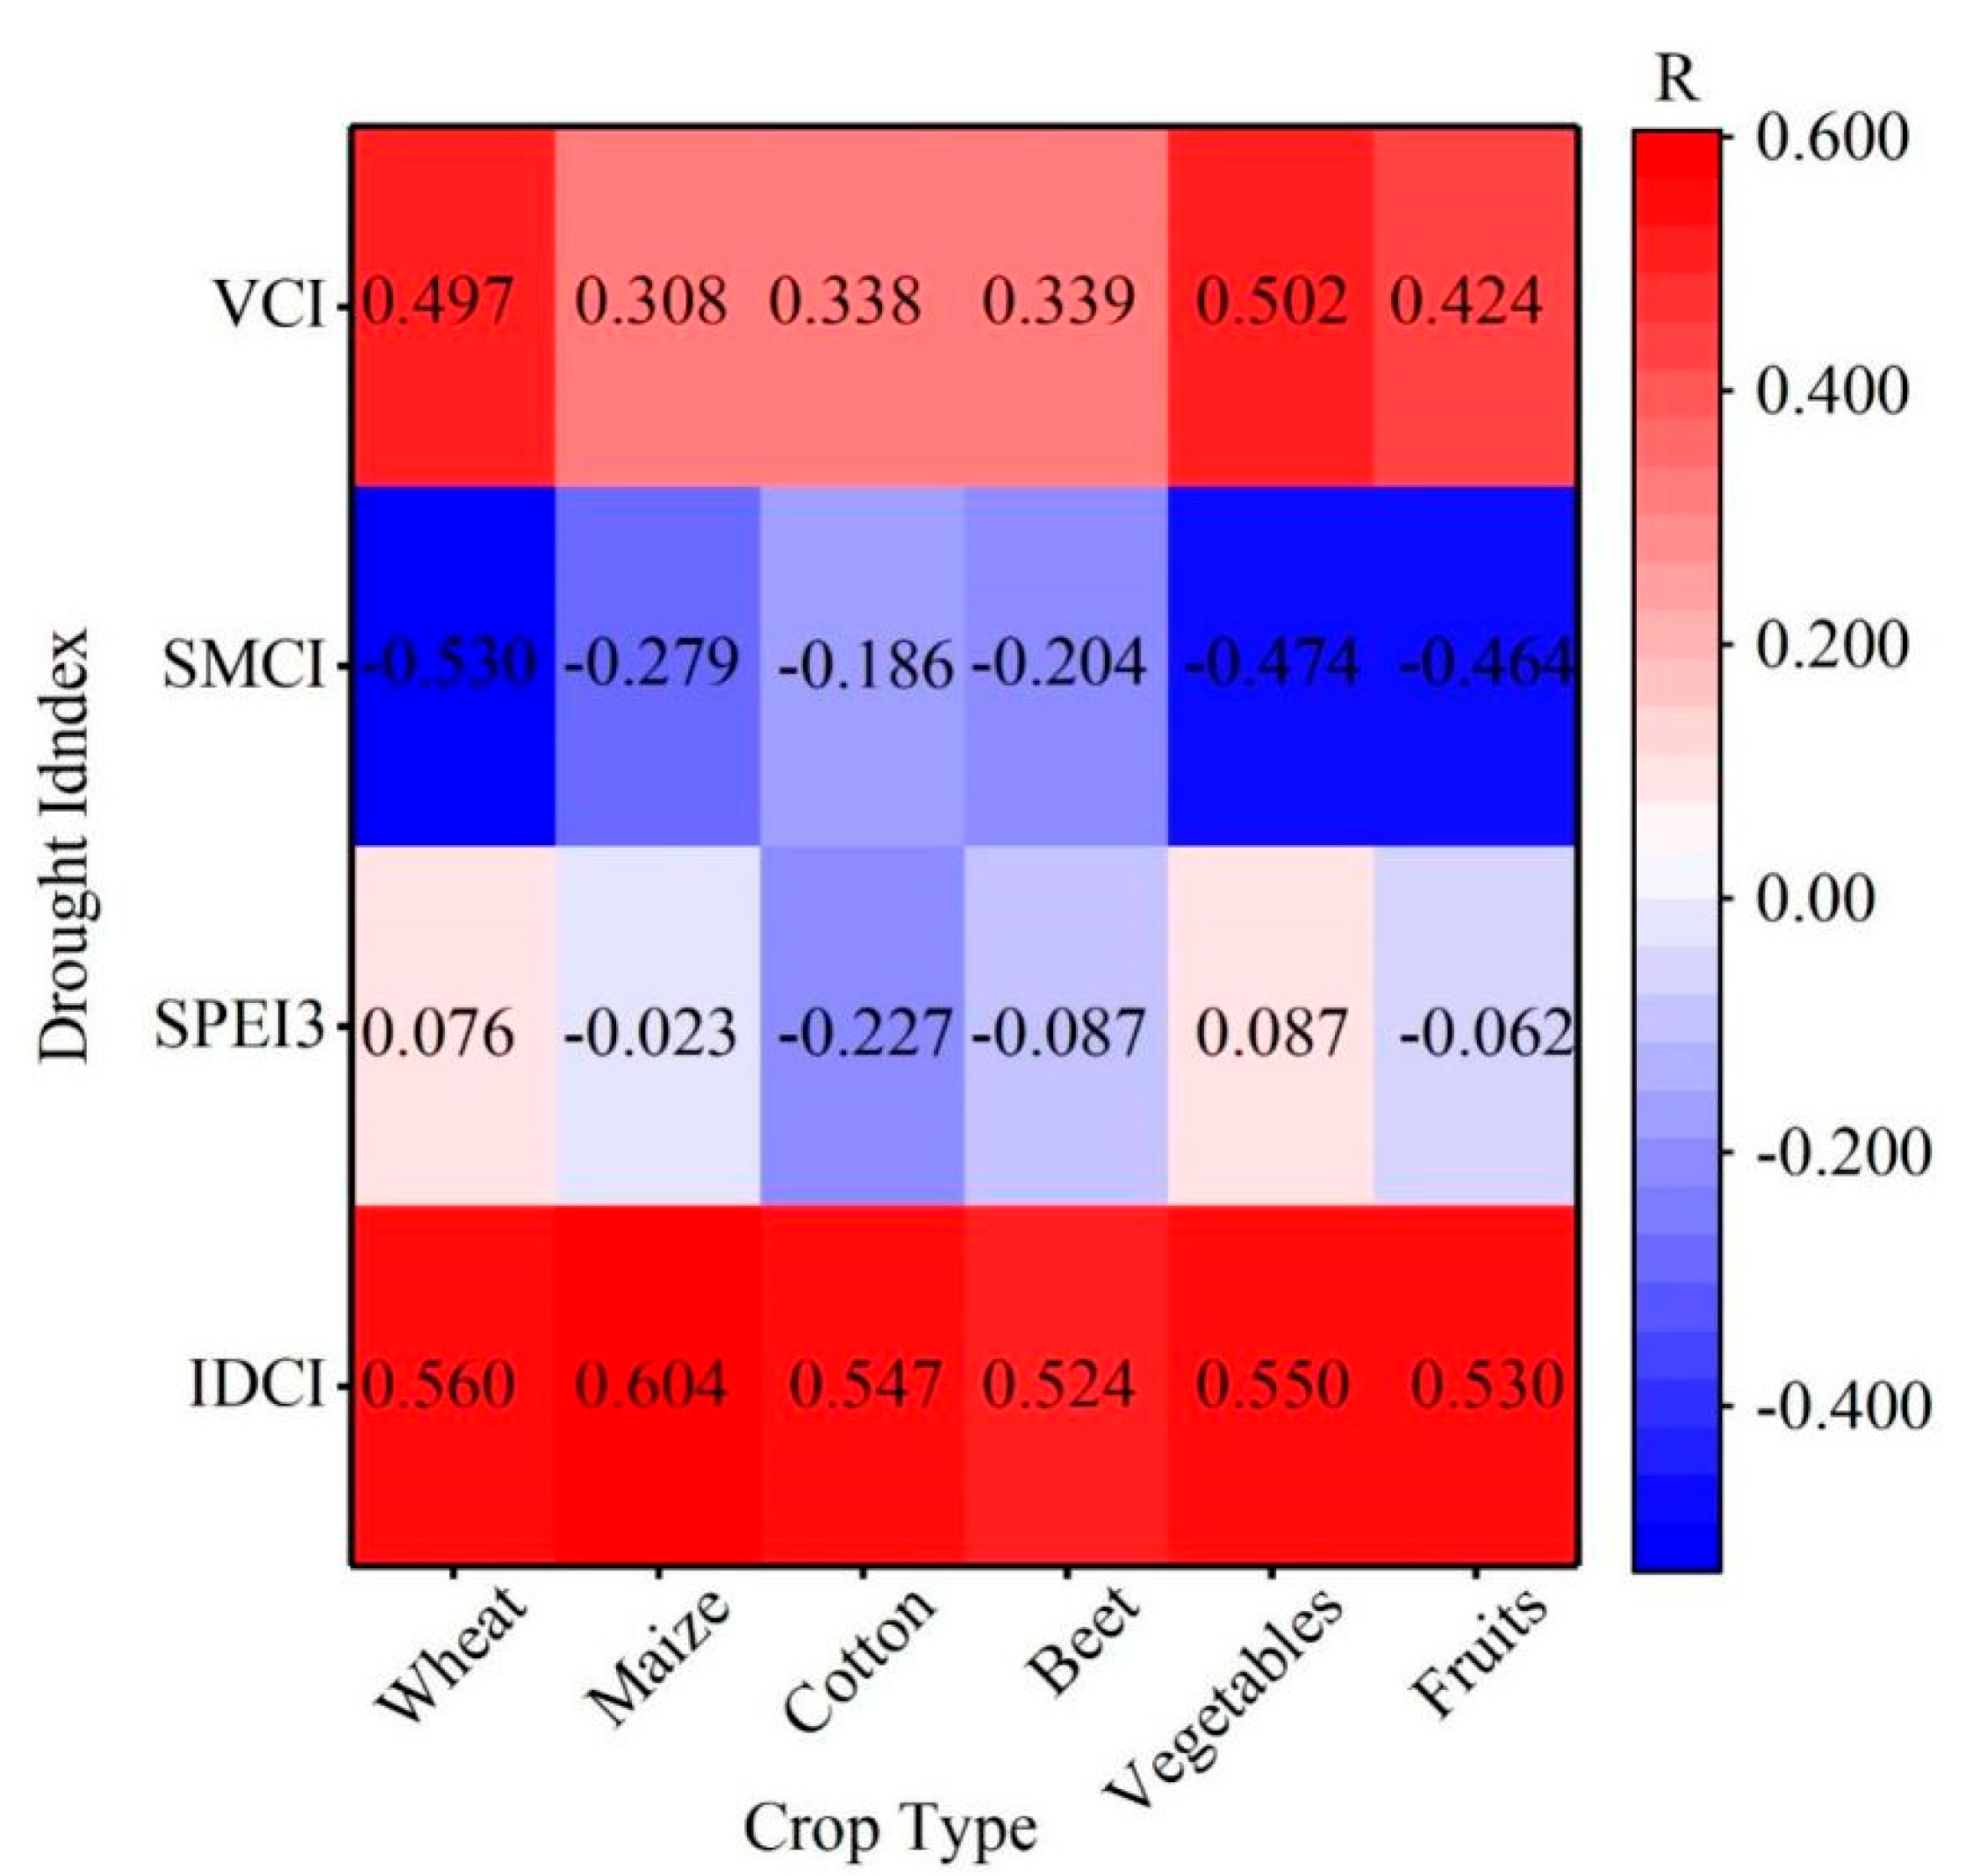
4.1.2. Correlations between Drought Index and SCYI

We selected six major crops (wheat, maize, cotton, beet, vegetables and fruits), which together constitute 80% of the total crop yield in Xinjiang. The area used for these six crops accounted for 75.25% of the cultivated land in 2000, 76.46% in 2010 and 79.77% in 2015. Consequently, we can use the yield of these six crops to evaluate the performance of the IDCI in monitoring agricultural drought. The correlation coefficient between the wheat SCYI and IDCI (0.560) was greater than that of SPEI3 (0.076), SMCI (−0.530) and VCI (0.497) (Figure 5). The IDCI performed better than other indices in evaluating the effect of drought on wheat yield in Xinjiang. The SCYI of maize was less affected by agricultural drought, since maize has a strong drought resistance [66]. The correlation coefficient between the maize SCYI and IDCI reached 0.604, higher than the other drought indexes such as SPEI3 (−0.023), SMCI (−0.279) and VCI (0.308). The correlation coefficient between the cotton SCYI and IDCI was 0.547, which was greater than that for VCI (0.338), SPEI3 (−0.227) and SMCI (−0.186). Cotton has a strong drought tolerance. The SCYIs of beet, vegetables and fruits were also correlated with the IDCI; their respective correlation coefficients reached 0.524, 0.550 and 0.530, which were higher than those of the other indices. In summary, the IDCI performed well in monitoring drought variations, consistent with previous studies [43].

4.2. Spatiotemporal Changes in IDCI

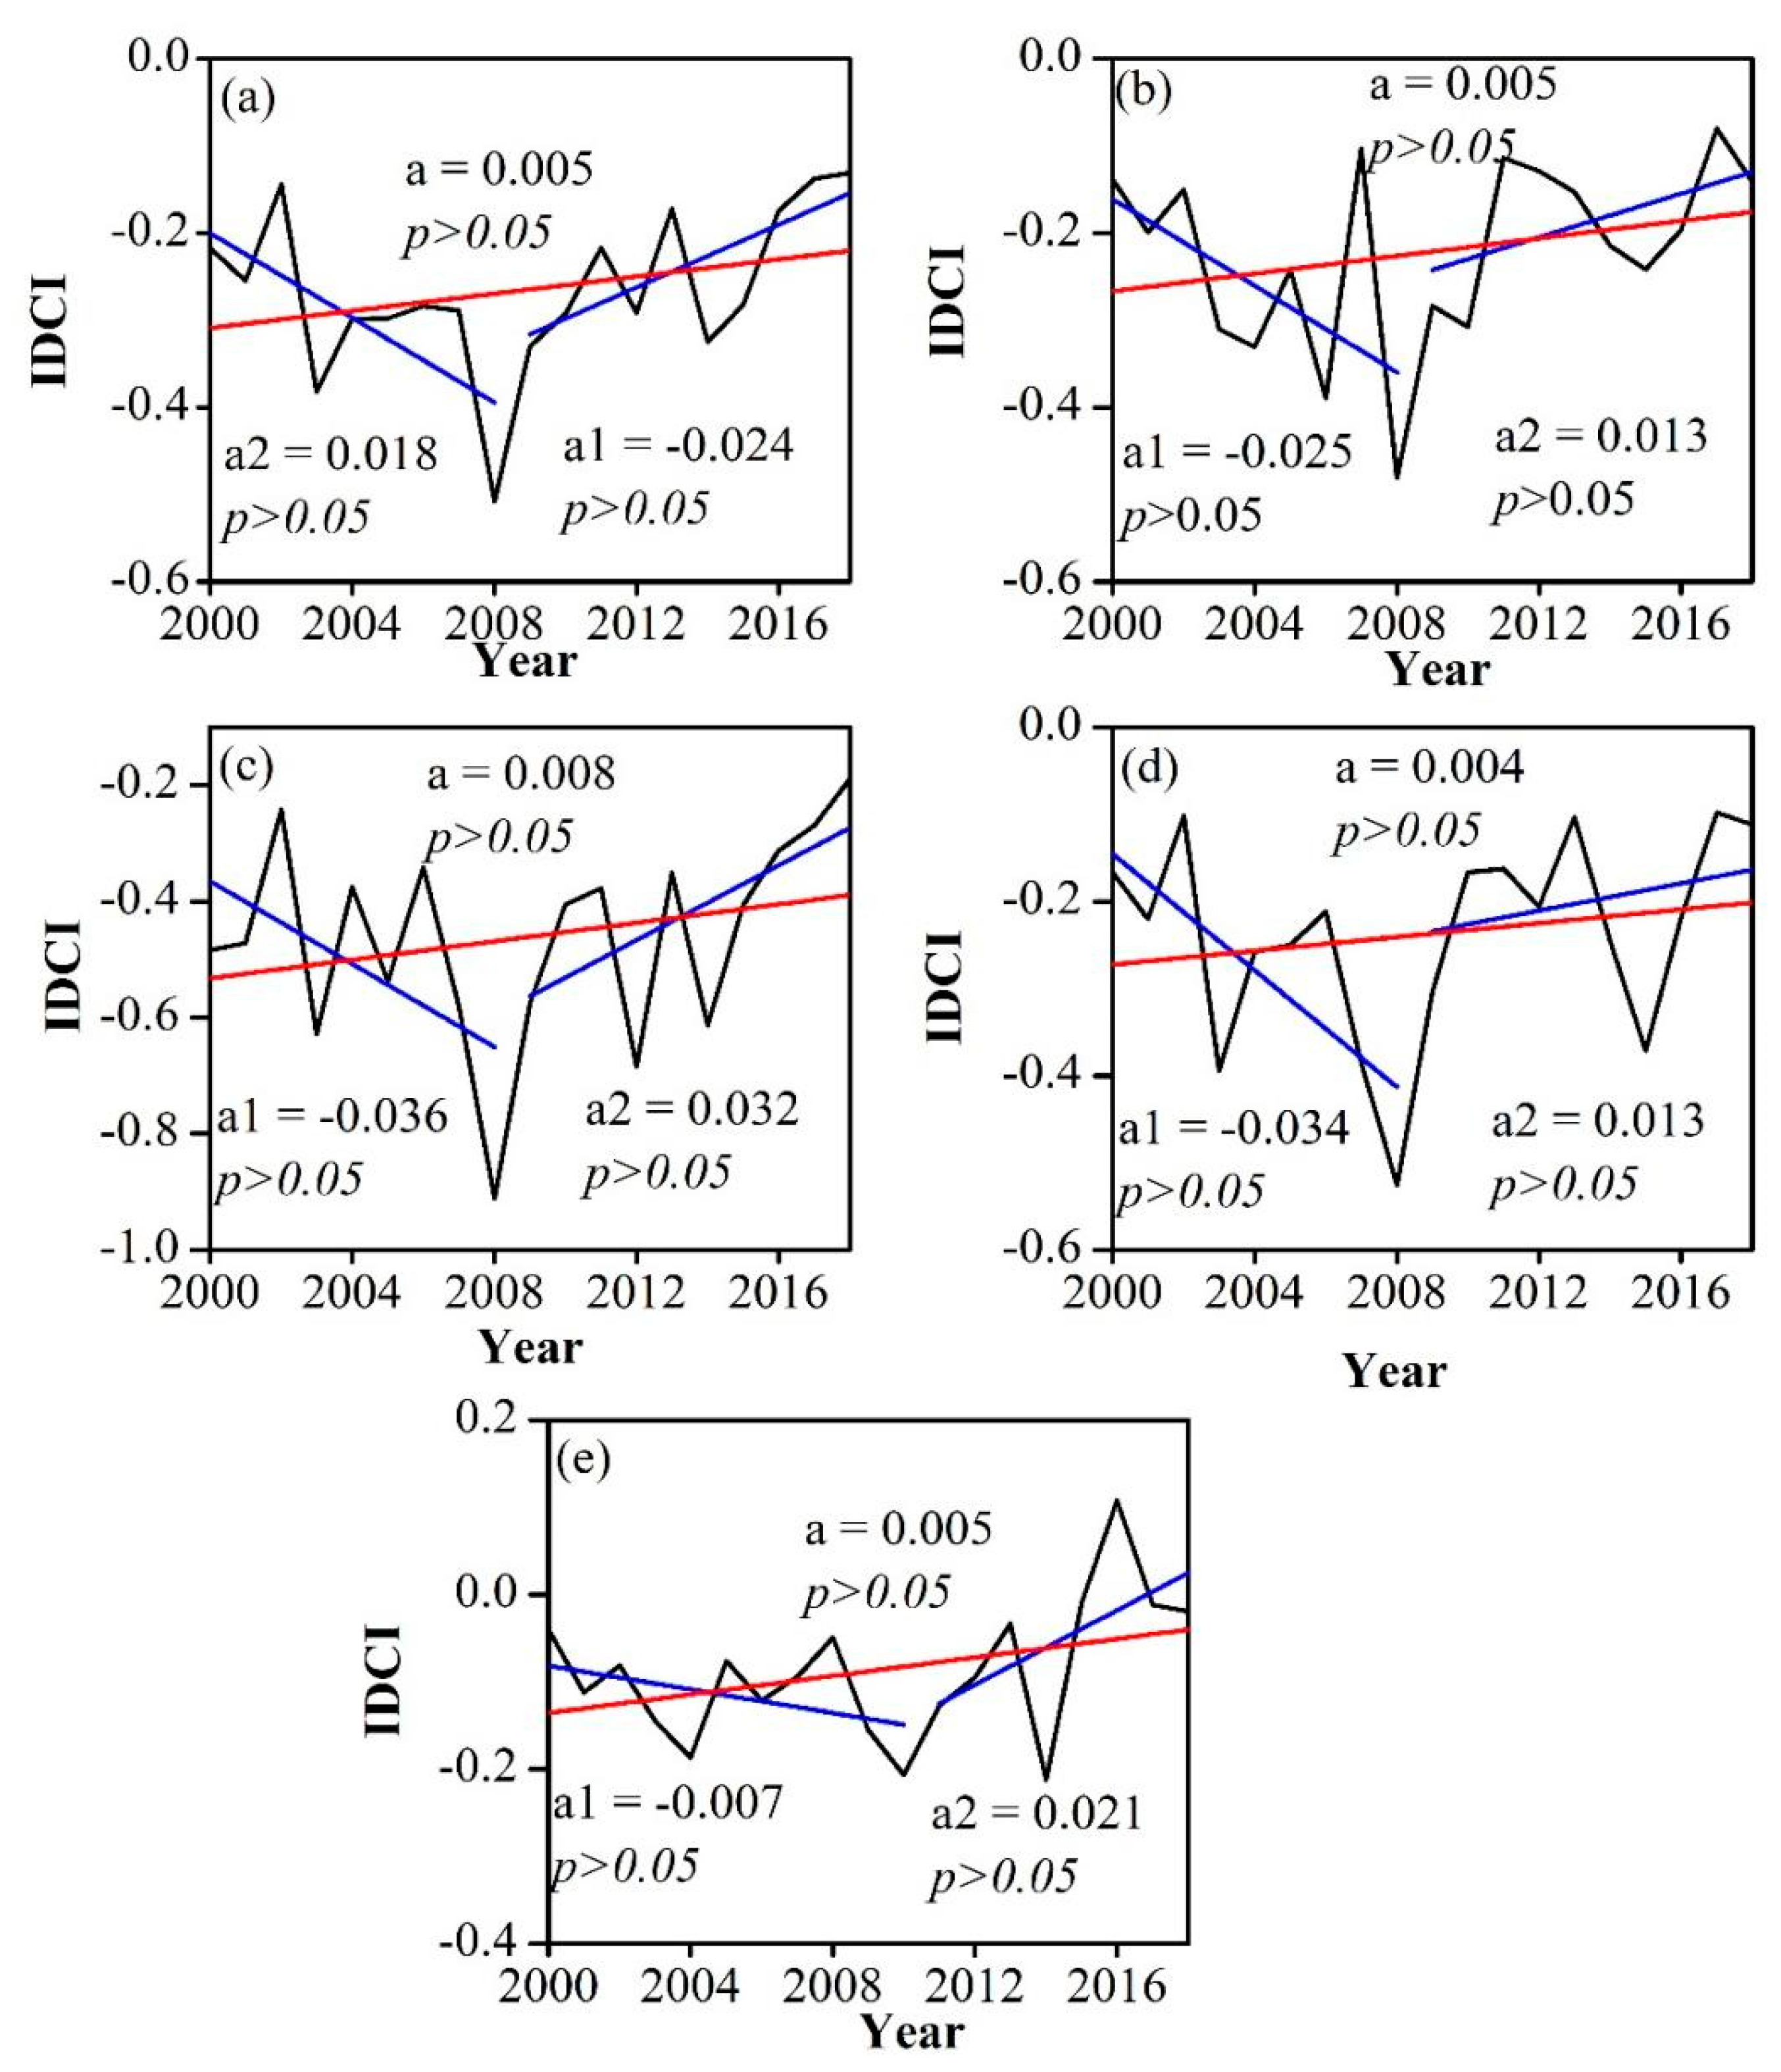
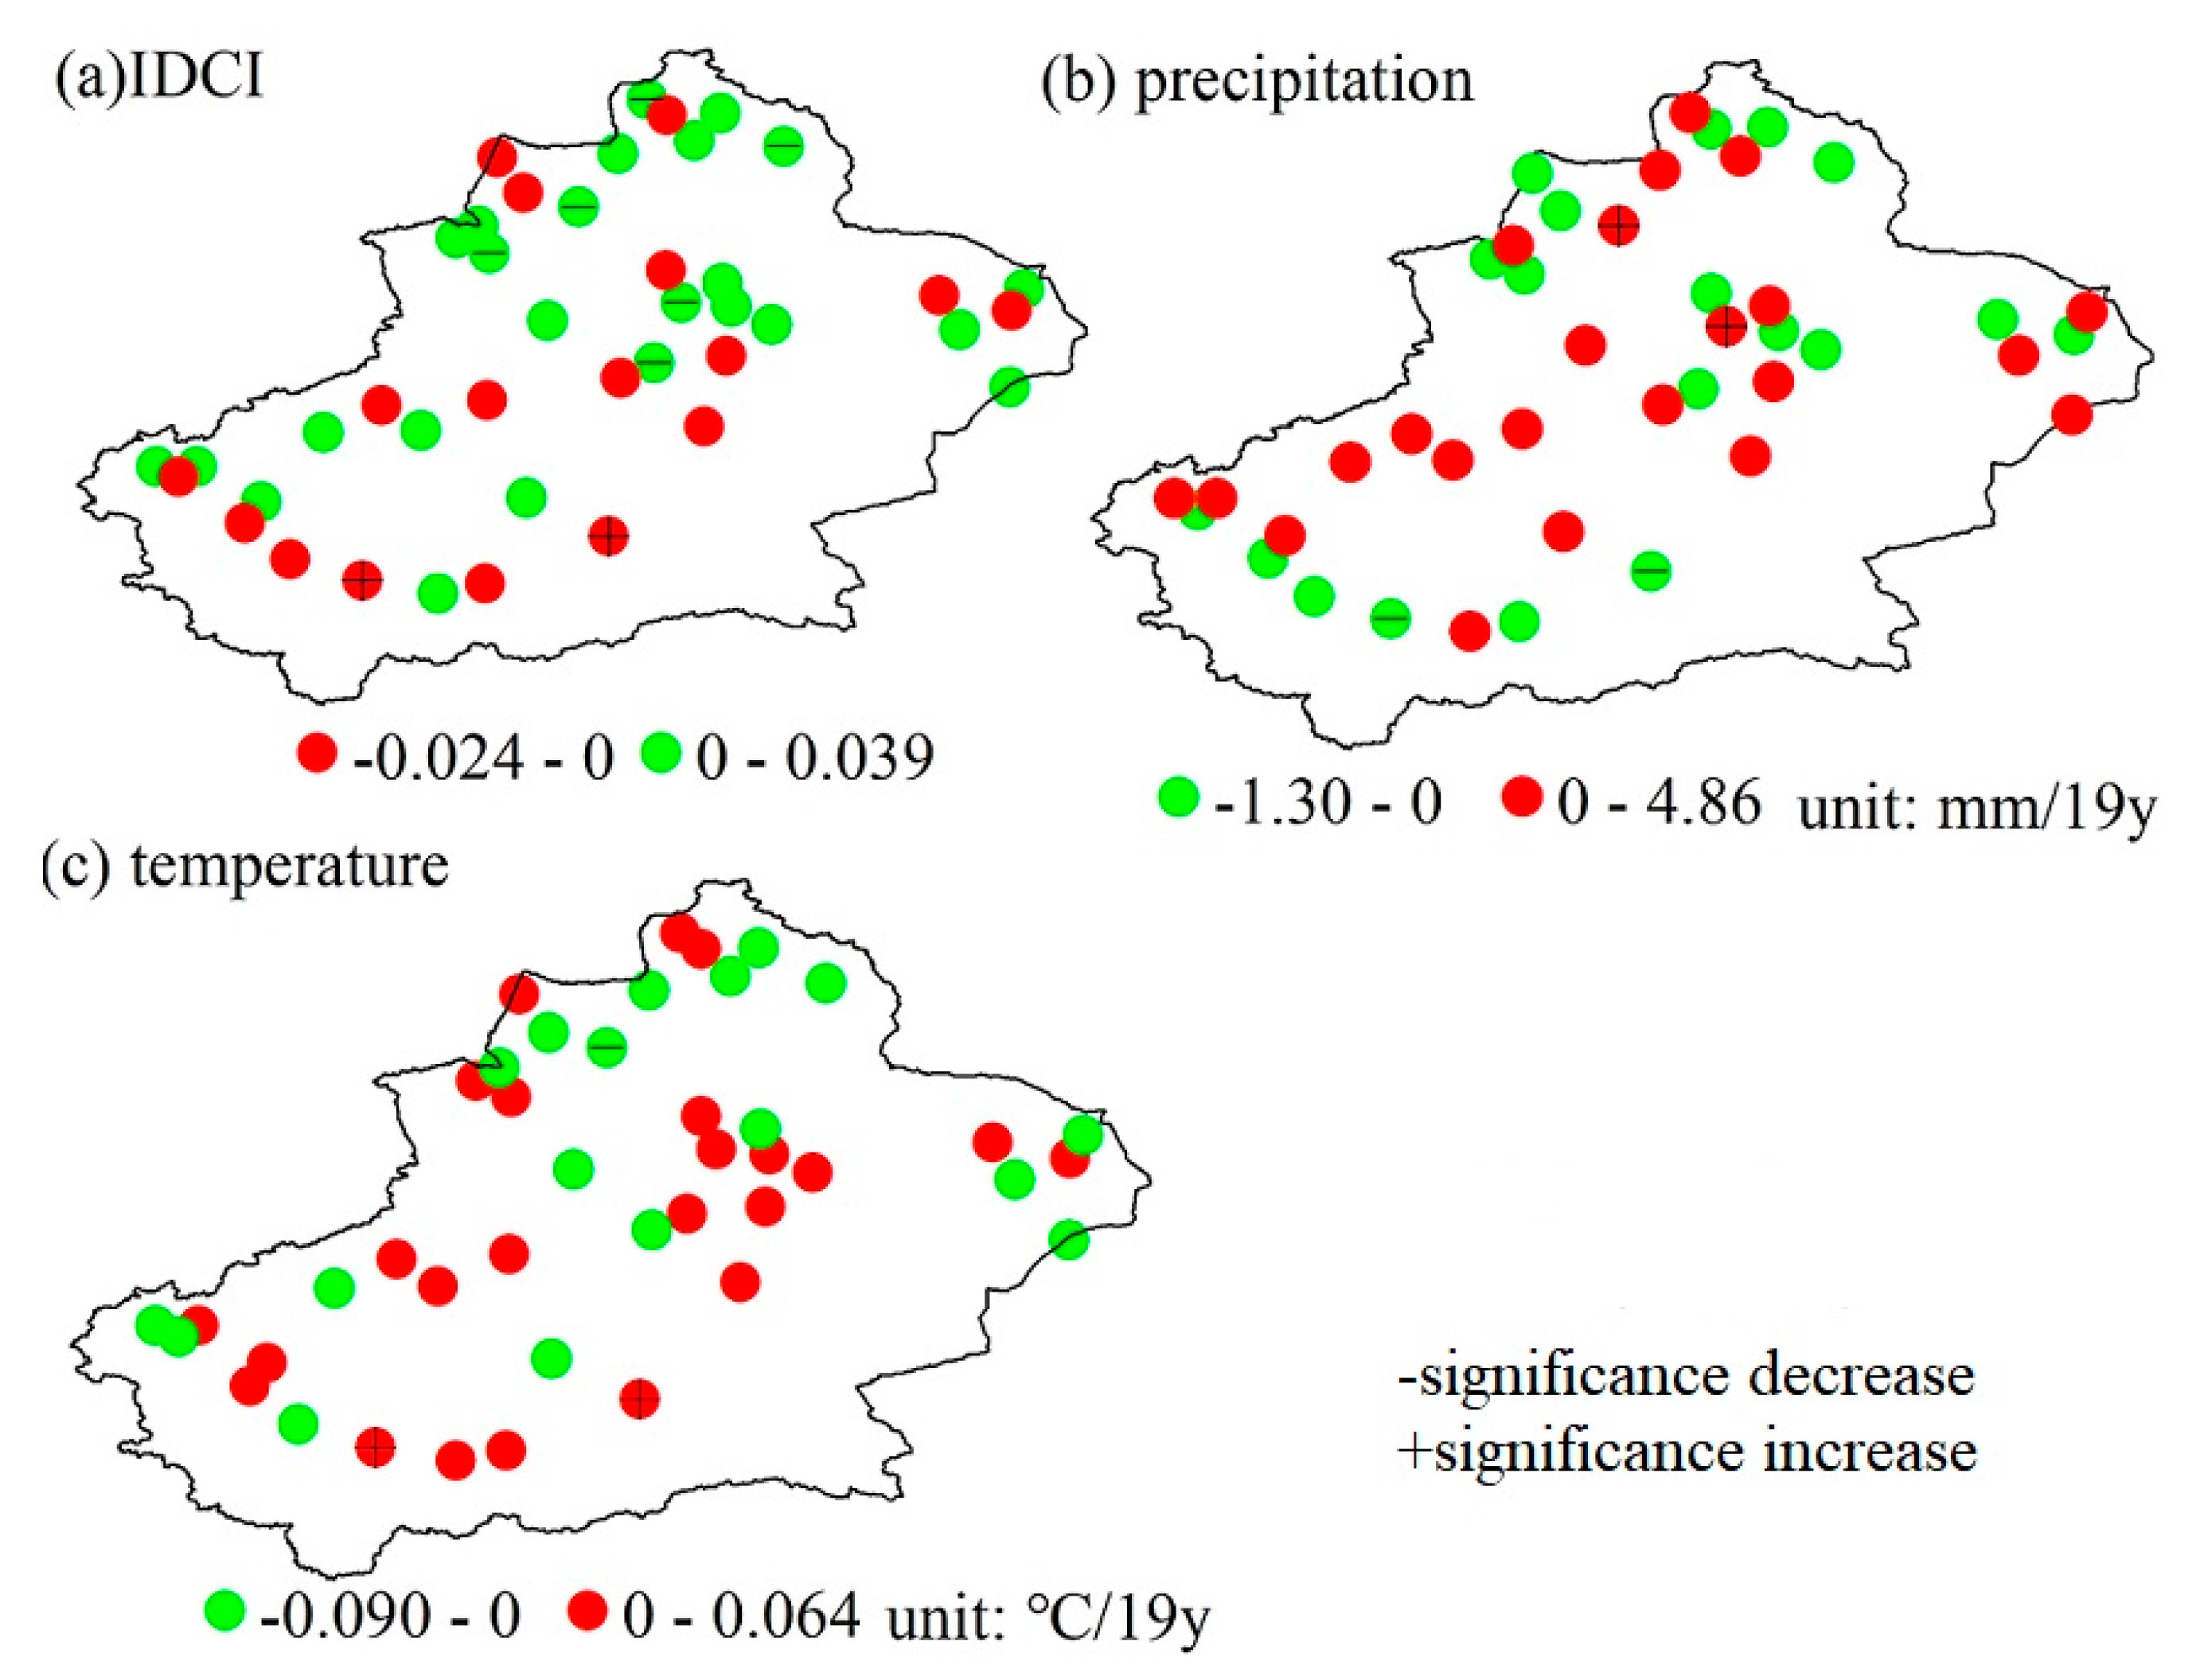
4.2.1. Temporal Changes in IDCI

It can be seen from Figure 6 that the percentage of stations not experiencing drought increased in spring, summer and autumn, but decreased in winter. The percentage of stations without drought was the least in summer. The percentage of mild drought stations decreased in summer and autumn, and increased in spring and winter. The percentage of moderate drought stations increased in all seasons, and it was greatest in summer. The percentage of severe drought stations decreased in spring and autumn, and increased in summer and winter. The percentage of extreme drought stations increased in spring and summer, decreased in autumn and winter and was greatest in summer. The percentage of stations without drought was greater than the percentage of stations with drought on an annual basis. The proportions of stations with severe drought and extremely severe drought in spring, summer and autumn was greatest in 2008, accounting for 33.3%, 43.7% and 33.3%, respectively, while that in winter was the most in 2004, accounting for 21.4%.
The IDCI increased insignificantly in 2000–2018, indicating that drought decreased from 2000 to 2018 (Figure 7a). Note that the IDCI gradually decreased (increasing drought) during 2000–2008, but gradually increased (decreasing drought) during 2009–2018 (Figure 7a). Precipitation and temperature showed similar trends during 2000–2018: precipitation insignificantly increased at a rate of 1.266 mm/a (Figure 8a); temperature insignificantly increased at a rate of 0.016 mm/a (Figure 8b). This is consistent with Li et al. (2012) [67], who found that increasing precipitation caused an obvious trend towards increasing humidity in the northwest region. As can be seen from Figure 9a–c, under increasing drought, the corresponding station temperatures were increasing and precipitation was decreasing; the opposite trends were observed under decreasing drought. Specifically, the IDCI and temperature followed the same trend, while the IDCI and precipitation followed opposing trends.
Droughts in spring, summer, autumn and winter showed decreasing trends during 2000–2018, with increasing trends from 2000 to 2008 and decreasing trends during 2009–2018 (Figure 7b–e). Therefore, 2008 was the change point, and was marked by an extreme drought in the summer of 2008. Some studies have reported a drying trend in China on the basis of the SPI/SPEI [28,68,69]. Other studies have noted increasing drought in central China, while the northwest of China has become wetter, according to the PDSI [49,70,71]. Our results are in support of the latter, in contrast to the former, for the reasons described in the introduction.

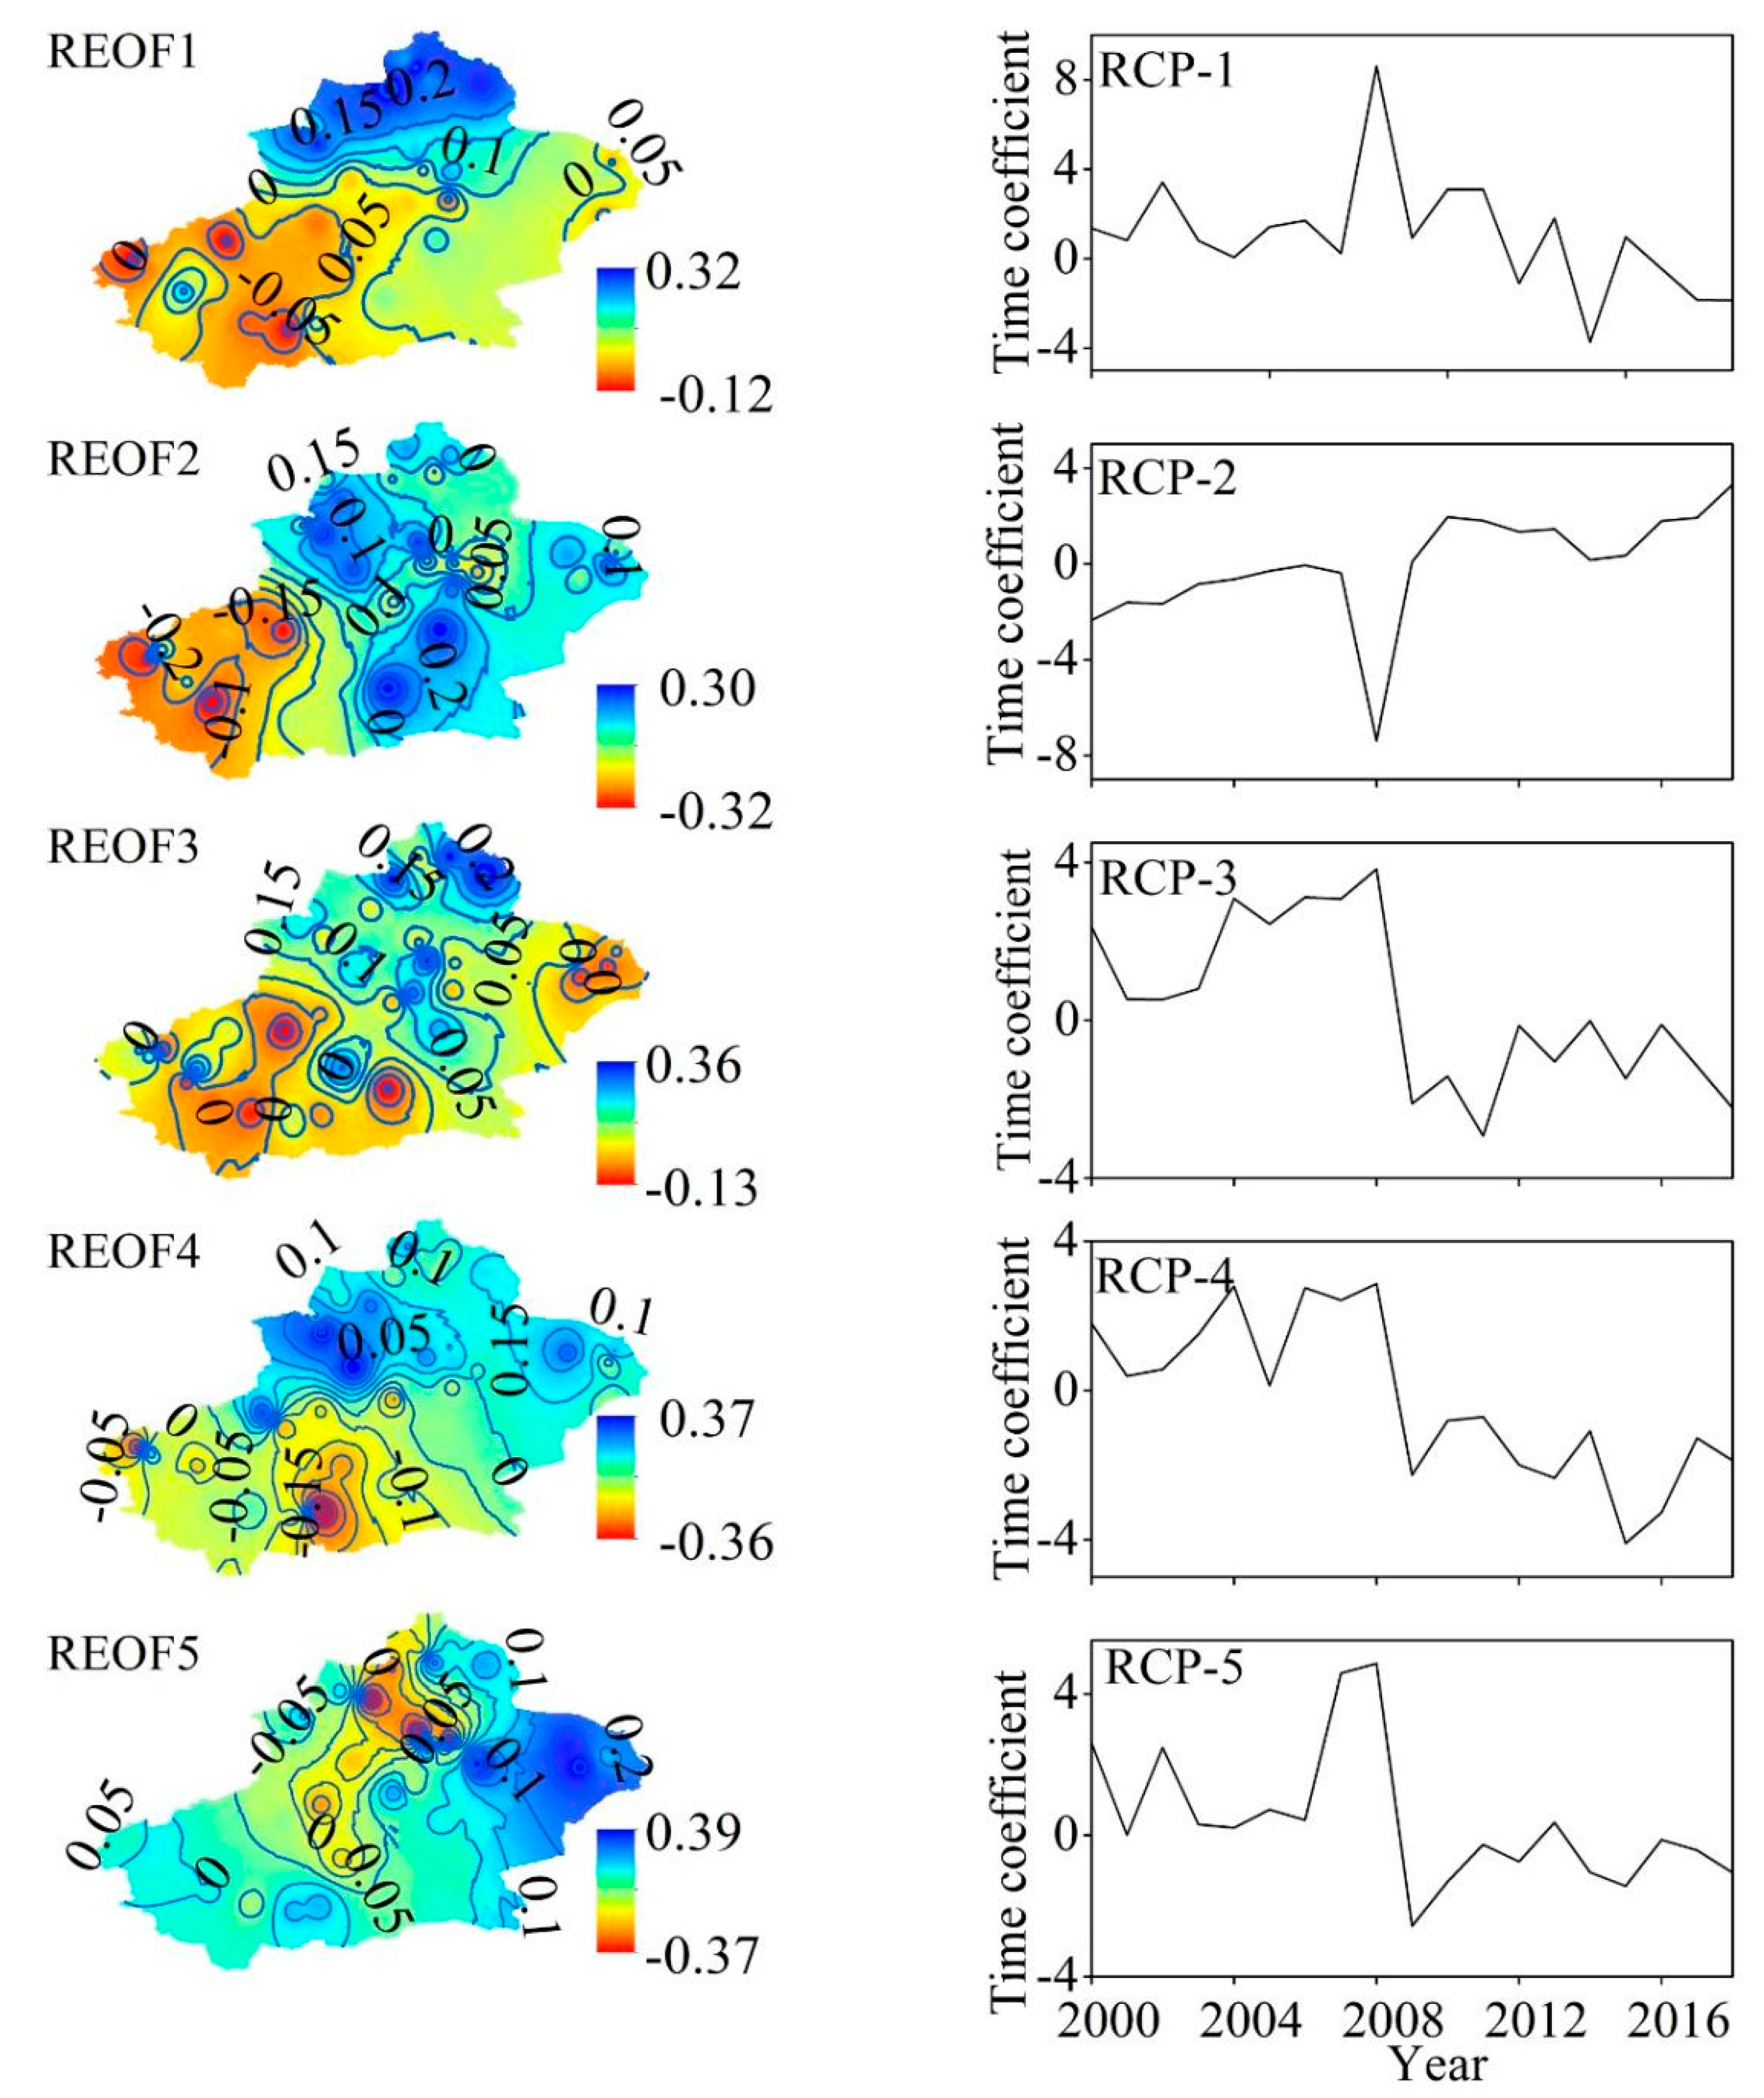
4.2.2. Spatial and Temporal Distributions of the IDCI Based on REOF Analysis

Before applying REOF, the IDCI datasets were dimensionally reduced by EOF analysis. The first 10 EOF modes were used as inputs in the REOF, which captured about 68% of the total variance. Considering the REOF and the variance described by each rotated component, we chose the five main REOFs in Xinjiang. These five REOFs demonstrate around 65.6% of the total variance in the 10 EOFs (Figure 10). REOF-1 highlights northern Xinjiang and explains 20.2% of the total variance (Figure 10). The second component, REOF-2, represents southern Xinjiang and explains 12.6% of the total variance. REOF-3 highlights northern Xinjiang (10.4% of the total variance); REOF-4 highlights the Tianshan Mountains (9.6% of the total variance); and REOF-5 highlights eastern Xinjiang (9.5% of the total variance).
REOF-1 was positive in northern Xinjiang, where RPC-1 increased in 2000–2008, indicating dry conditions during this period. REOF-2 was negative in southern Xinjiang, and the decreasing RPC-2 before 2008 indicated dry conditions from 2000 to 2008. REOF-3 was positive in northern Xinjiang, and the increasing RPC-3 before 2008 indicated dry conditions during 2000–2008. REOF-4 (Tianshan Mountains) was positive, with the gradually increasing RPC-4 indicating a gradual trend towards dry conditions before 2008. Combined with the positive value in REOF-5 in eastern Xinjiang, the increased RPC-5 before 2008 indicated dry conditions during 2000–2008; while after 2008, RPC-1 (RPC-3) showed a decreasing trend, indicating a trend towards a wetter climate in northern Xinjiang. In southern Xinjiang (REOF-2), the decreasing RPC-2 showed wet conditions in this period. The increasing RPC-4 indicated wetter conditions in the Tianshan Mountains after 2008. RPC-5 showed a decreasing trend indicating wetter conditions in eastern Xinjiang after 2008. These results are consistent with previous studies. For example, Wang et al. (2017) [49] divided northwest China into three areas based on SPEI-3 and found that Xinjiang experienced wet conditions from 1987 to 2010. Yang et al. [62] divided northwest China into six regions using SC-PDSI and reported that Xinjiang became wetter from 1948 to 2012. Zhang et al. [48] divided Xinjiang into three parts based on SPI and found that Xinjiang was becoming wet, particularly in northern Xinjiang. Zhai et al. [70] divided China into 10 areas, and showed that northeast China and central China had become dry while northwest China became wetter during 1961–2005.

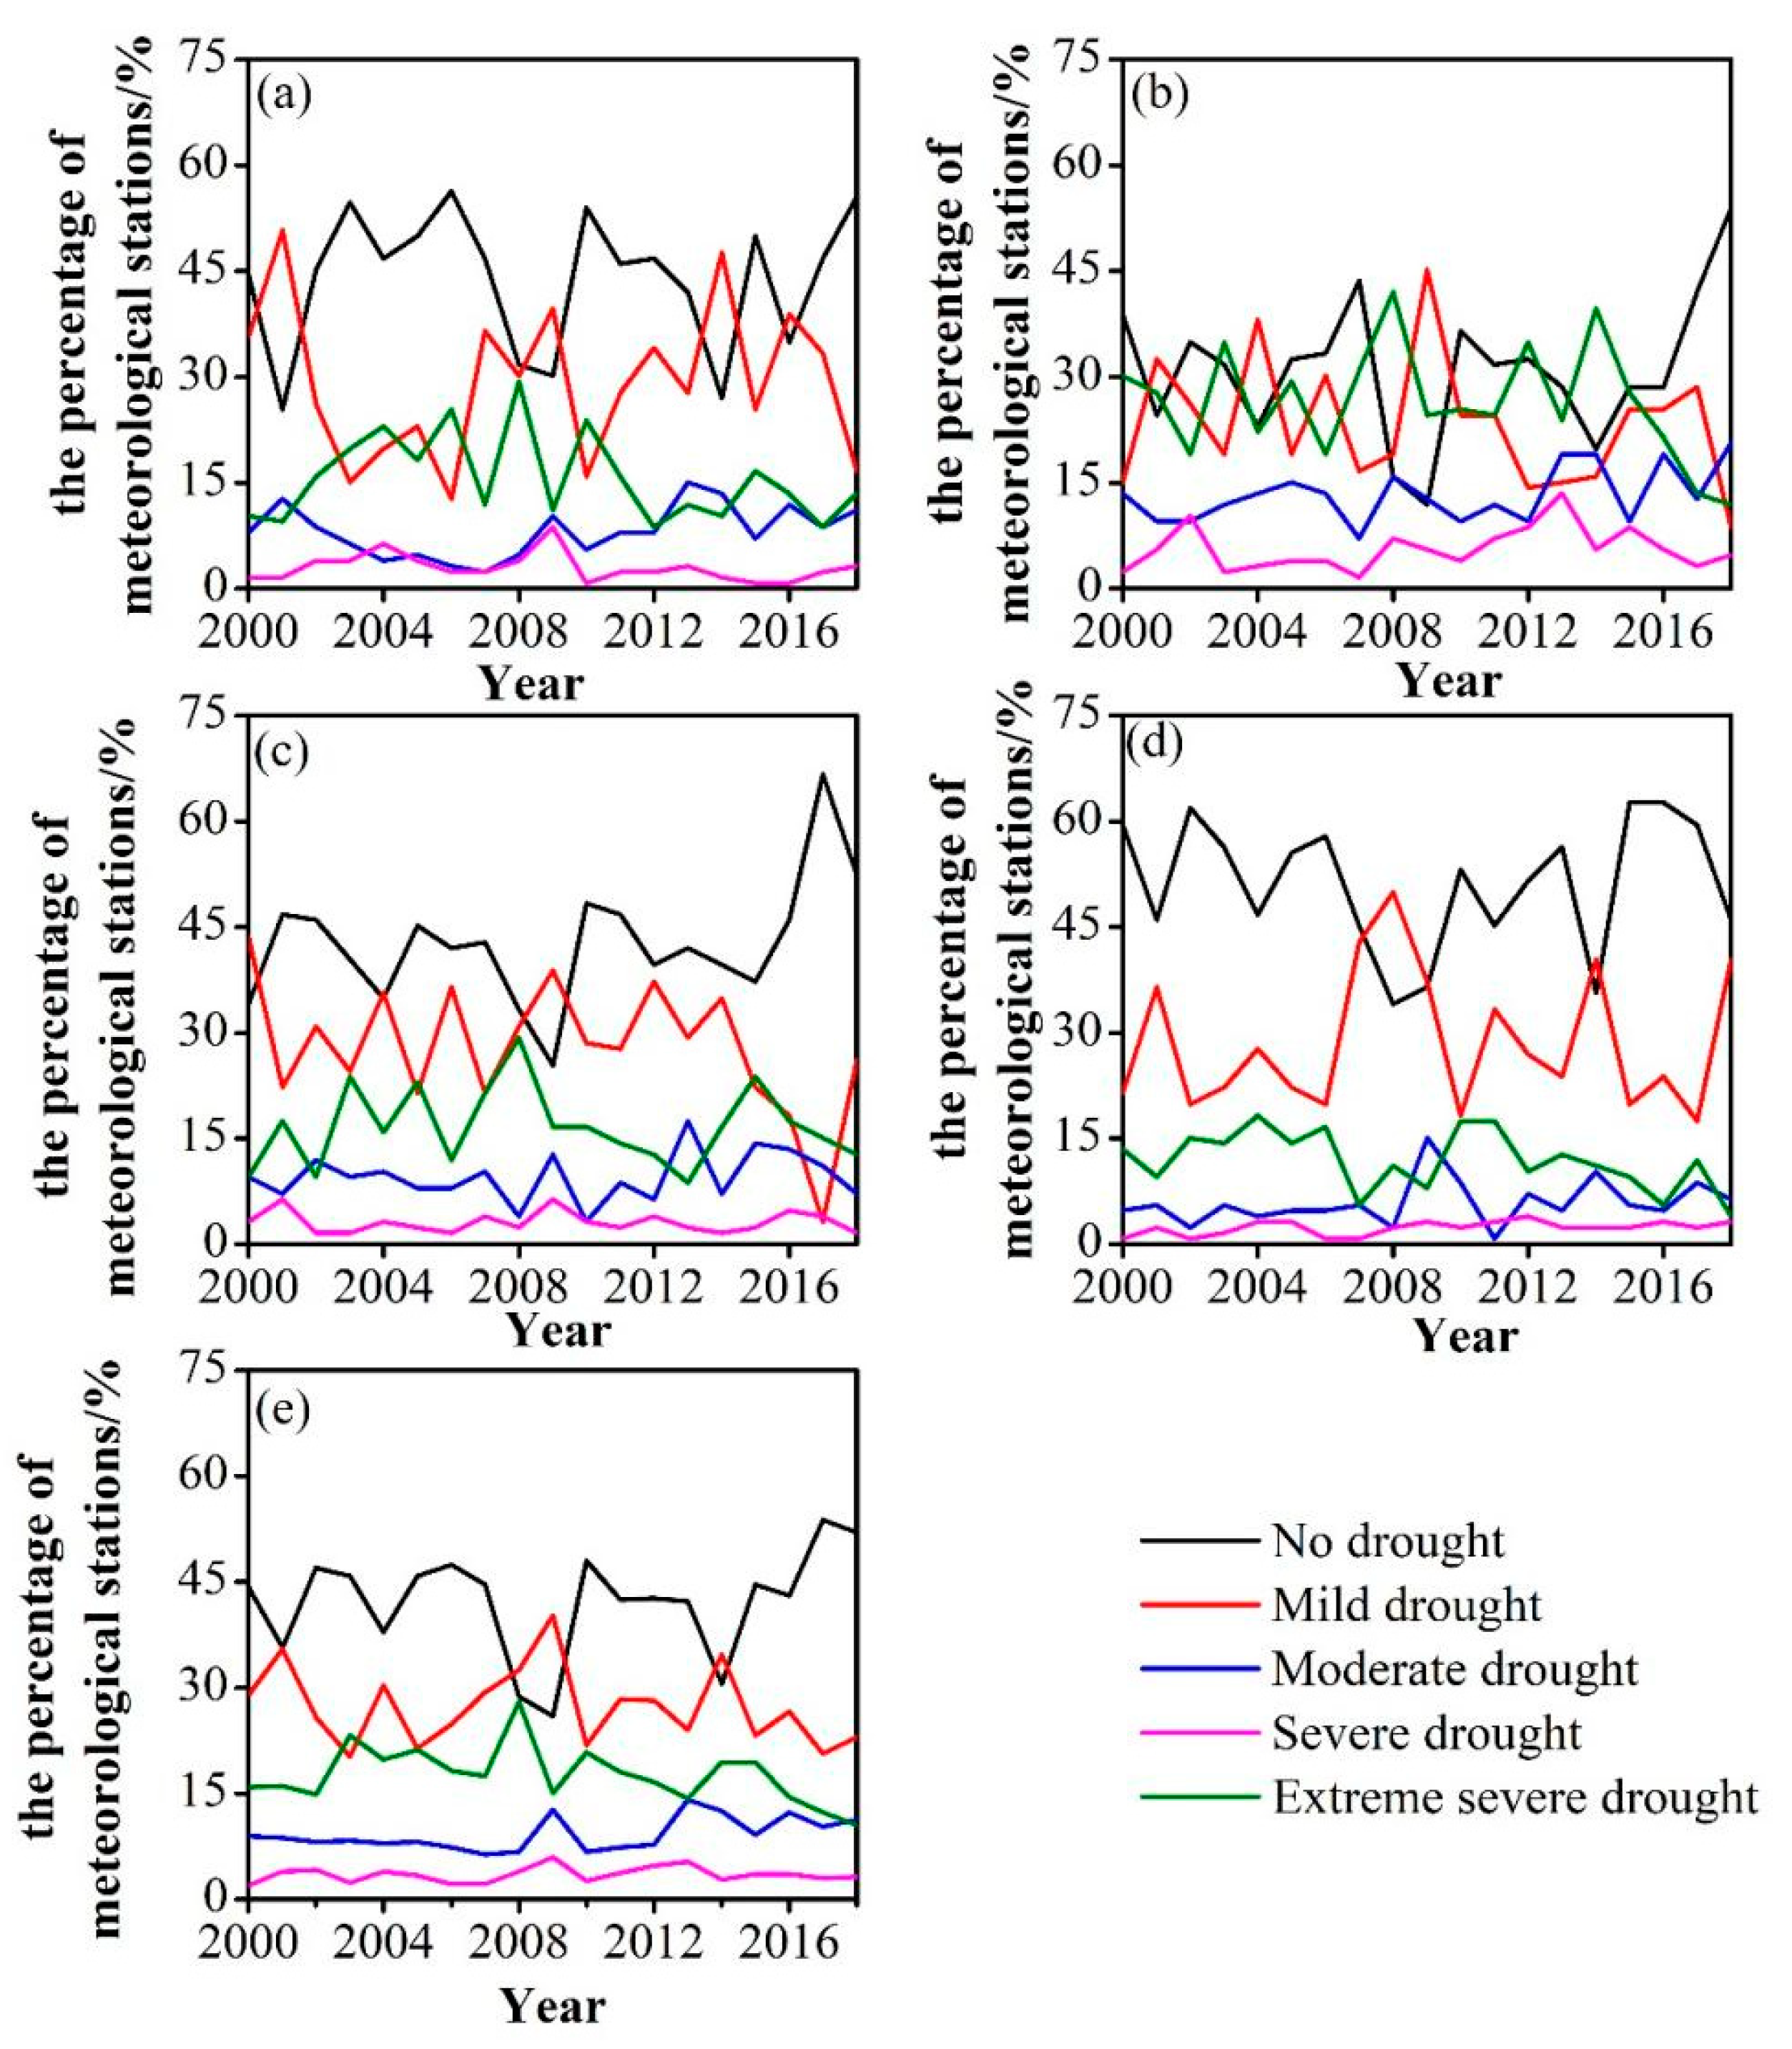
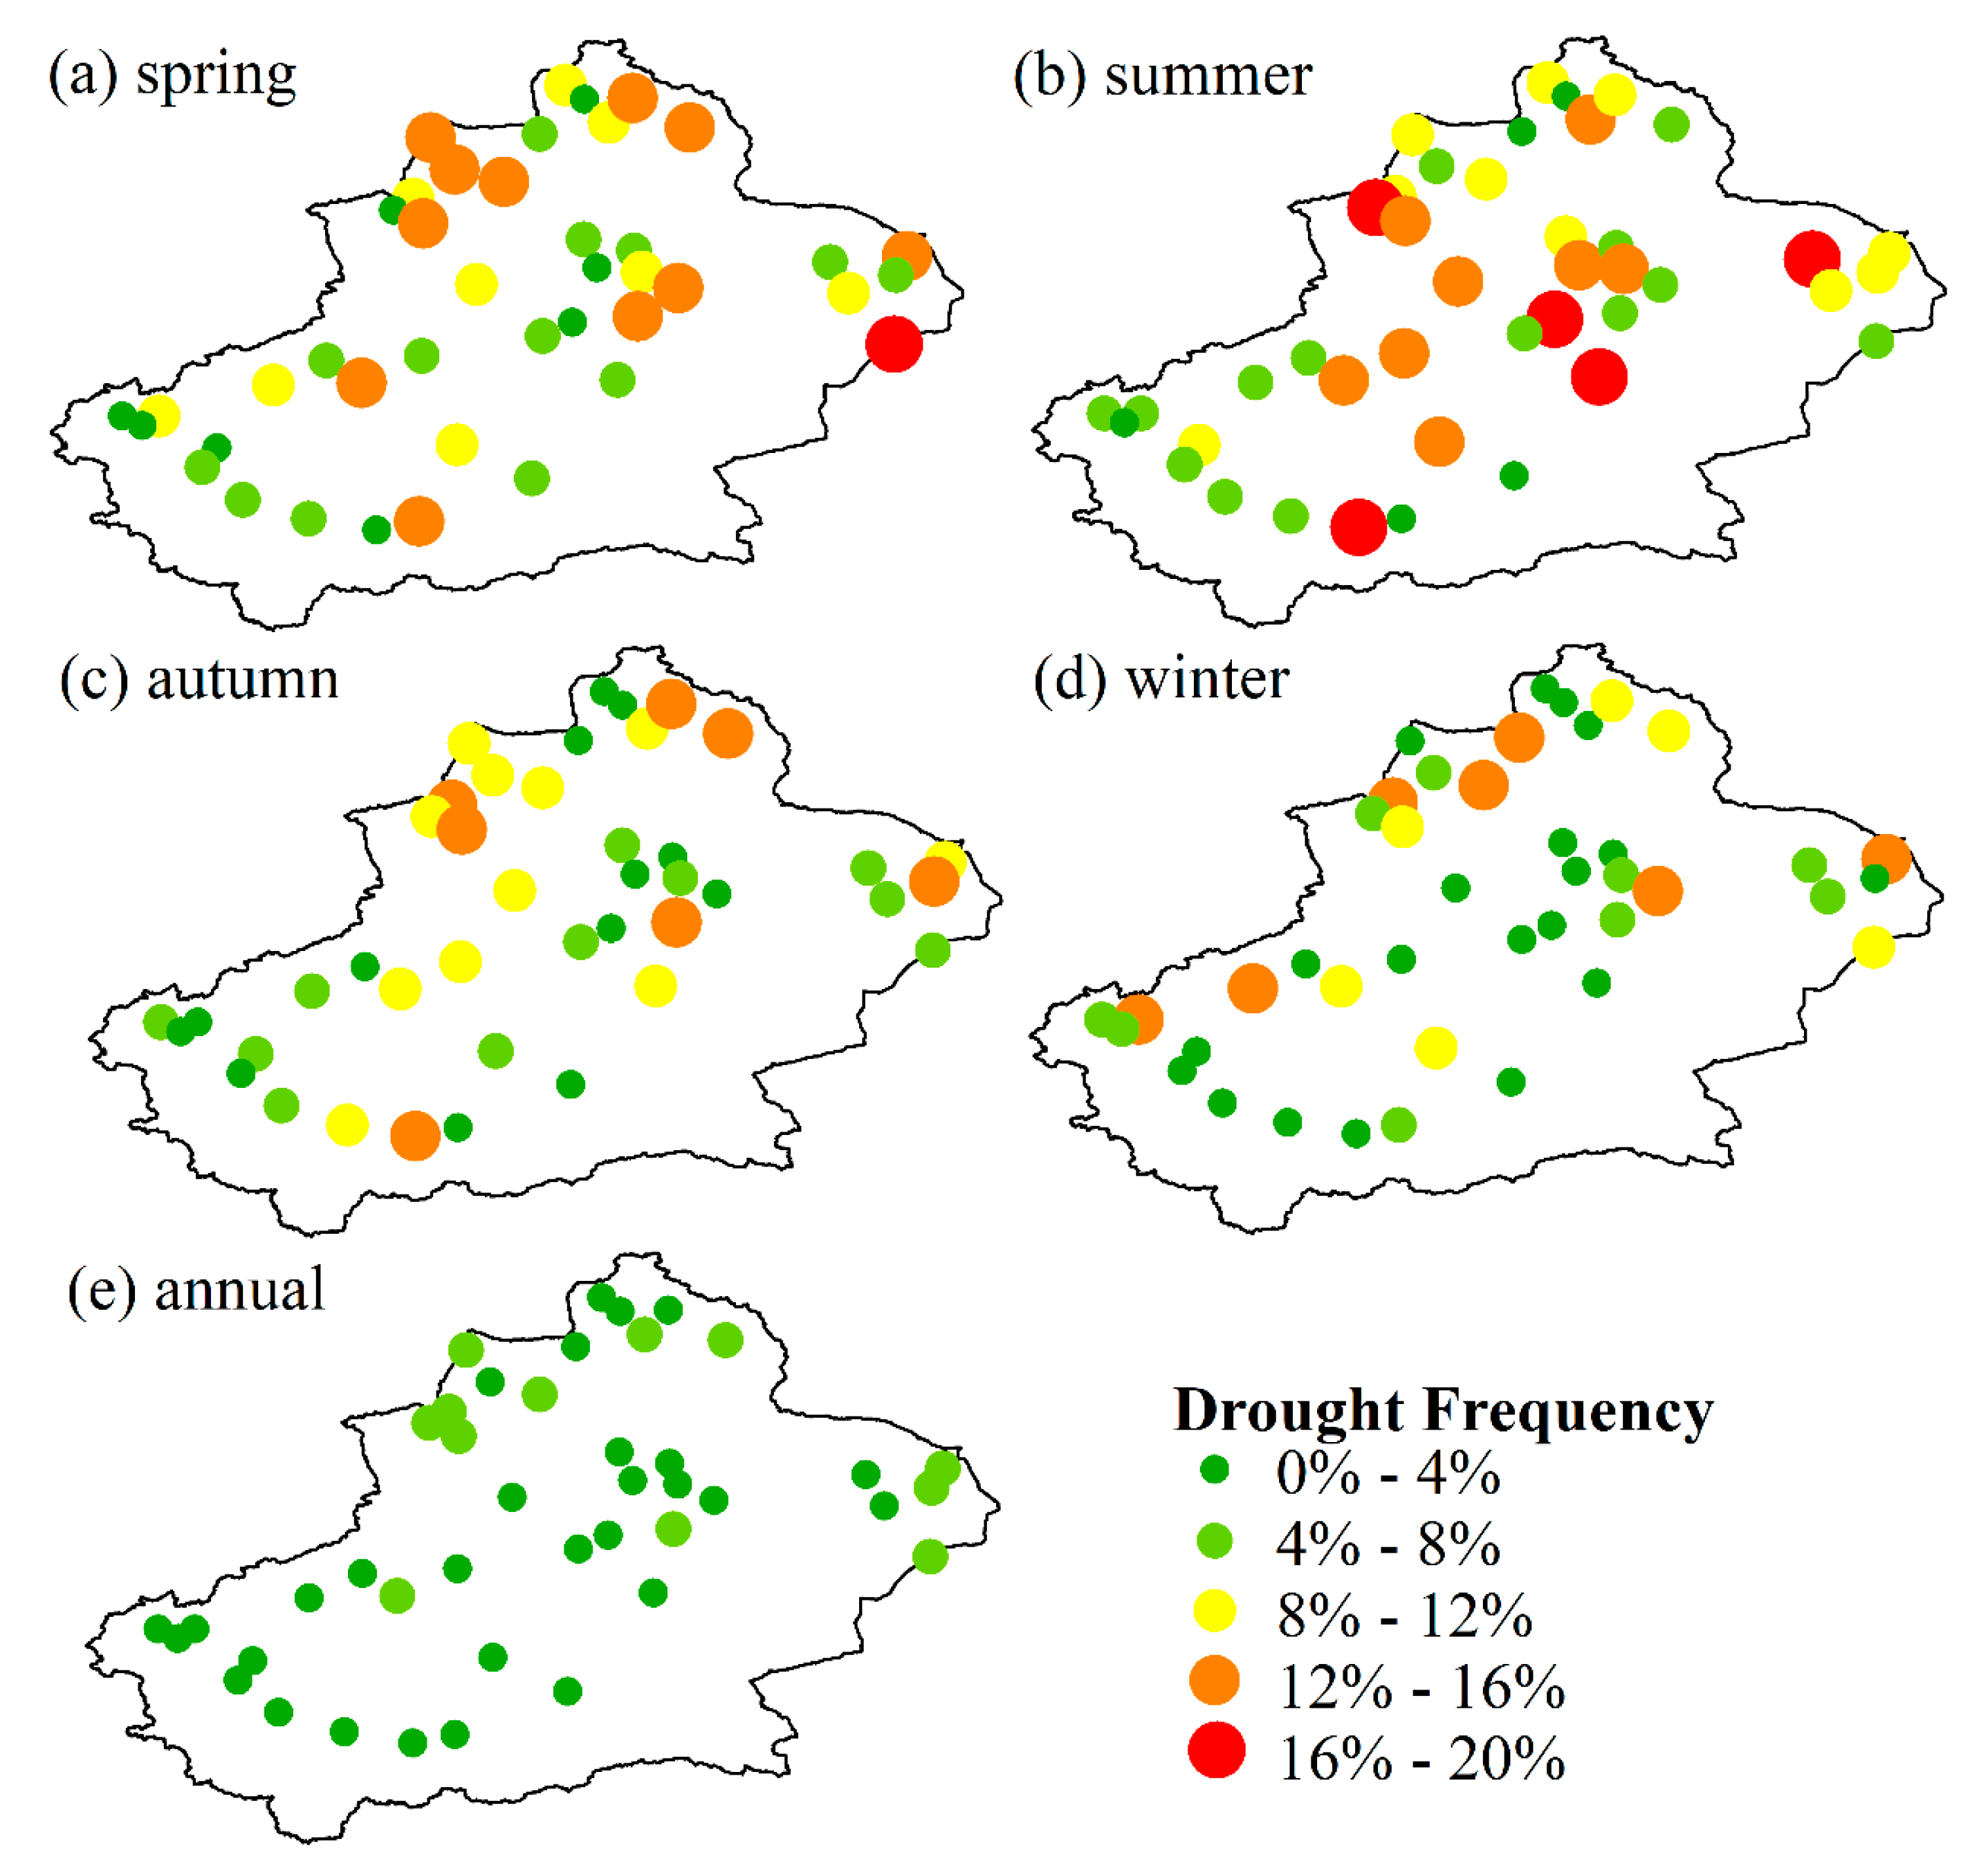
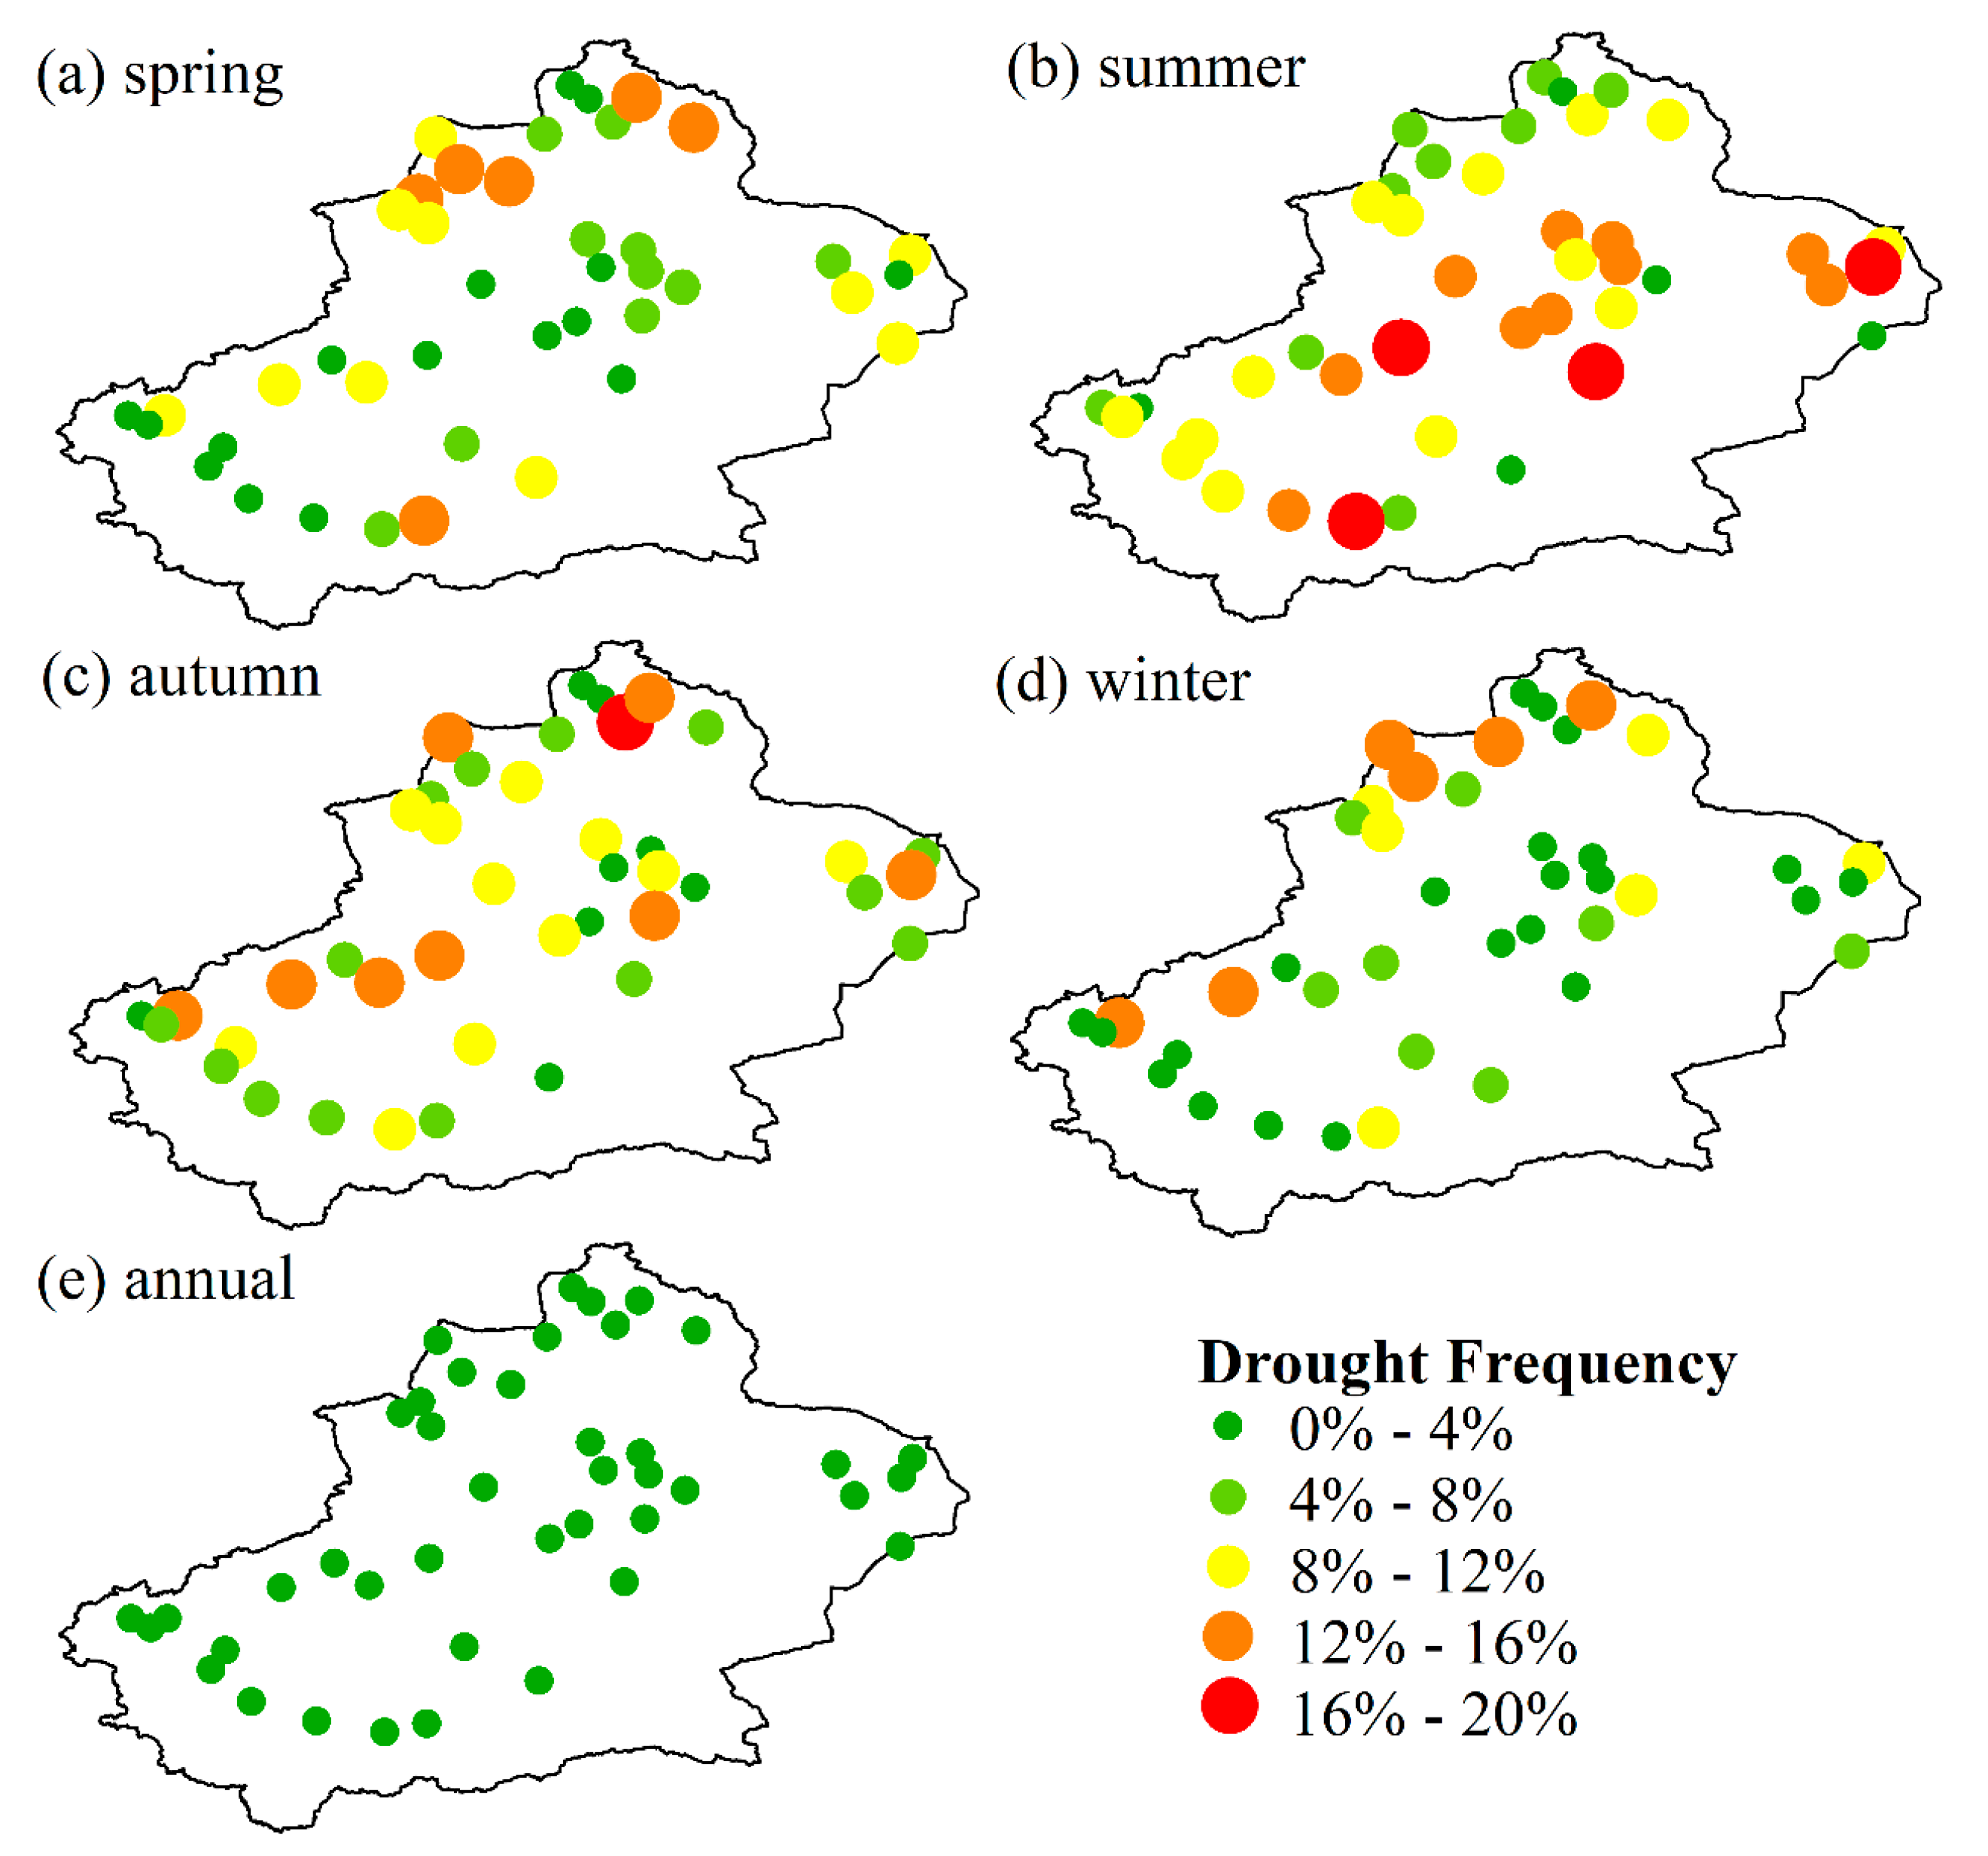
4.2.3. Spatial and Temporal Distribution of Severe and Extremely Severe Drought Frequency

Figure 9 shows that 2008 was the turning point between increasing and decreasing drought, motivating analysis of the severe and extremely severe drought frequency based on the IDCI before and after 2008. Before 2008, the number of stations with severe and extremely severe droughts in summer was greater than that in spring, autumn and winter (Figure 11). In spring, the proportions of stations with severe and extreme drought were 12–16%, 4–8% and 12–20% in northern Xinjiang, southern Xinjiang and eastern Xinjiang, respectively. In summer, 71.4% and 42% of the total number of stations in northern and southern Xinjiang, respectively, experienced drought 8–20% of the time. In autumn, most stations experienced drought 0–4% of the time, with fewer stations reaching 4–8% and fewer still at 8–12%. In winter, most stations (71.4%) experienced drought 0–4% of the time. Drought affected 0–8% of the whole year; spring, summer, autumn and winter droughts were all more frequent in northern Xinjiang than in southern and eastern Xinjiang.
After 2008, drought in summer was more frequent than in autumn, spring or winter (Figure 12). In spring, drought was more frequent in northern Xinjiang than in southern Xinjiang (0–4%) or eastern Xinjiang. In summer, drought was more frequent in eastern Xinjiang than in southern Xinjiang or northern Xinjiang. Autumn drought was more frequent after 2008 than before 2008, but there was little change in the winter drought occurrence. All stations in Xinjiang experienced drought for 0–4% of the year, and droughts became less frequent after 2008.

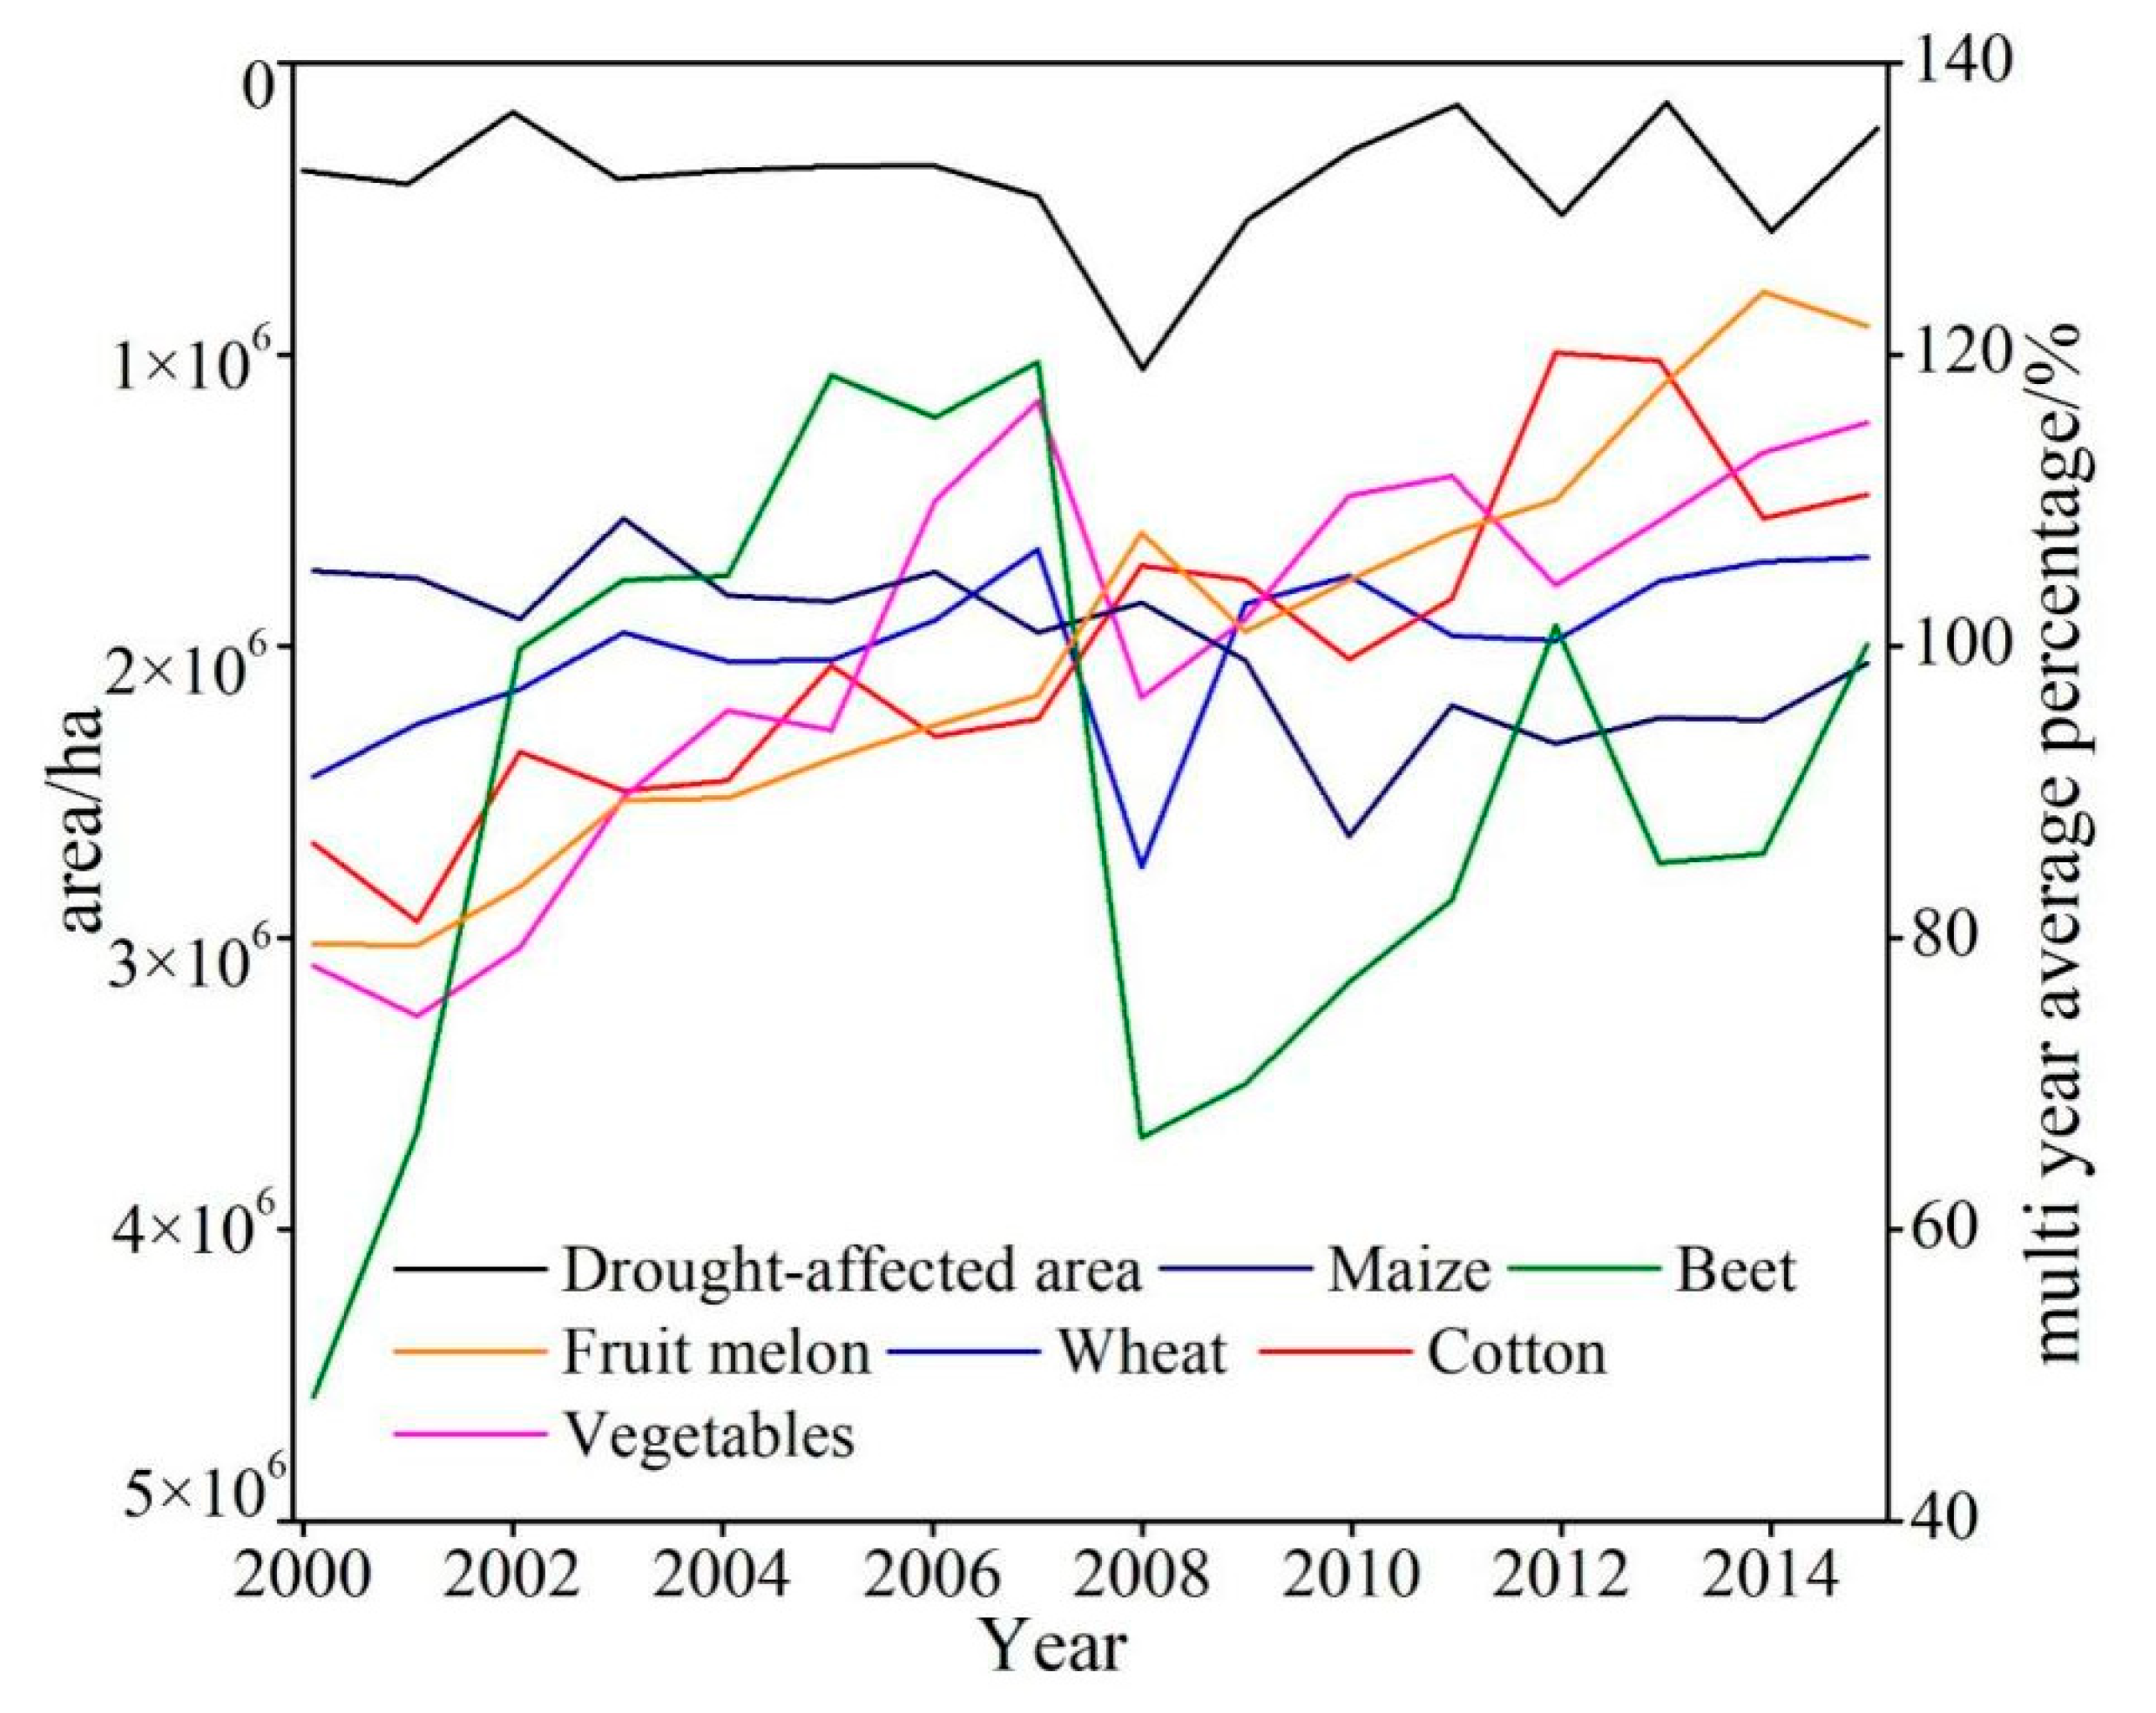
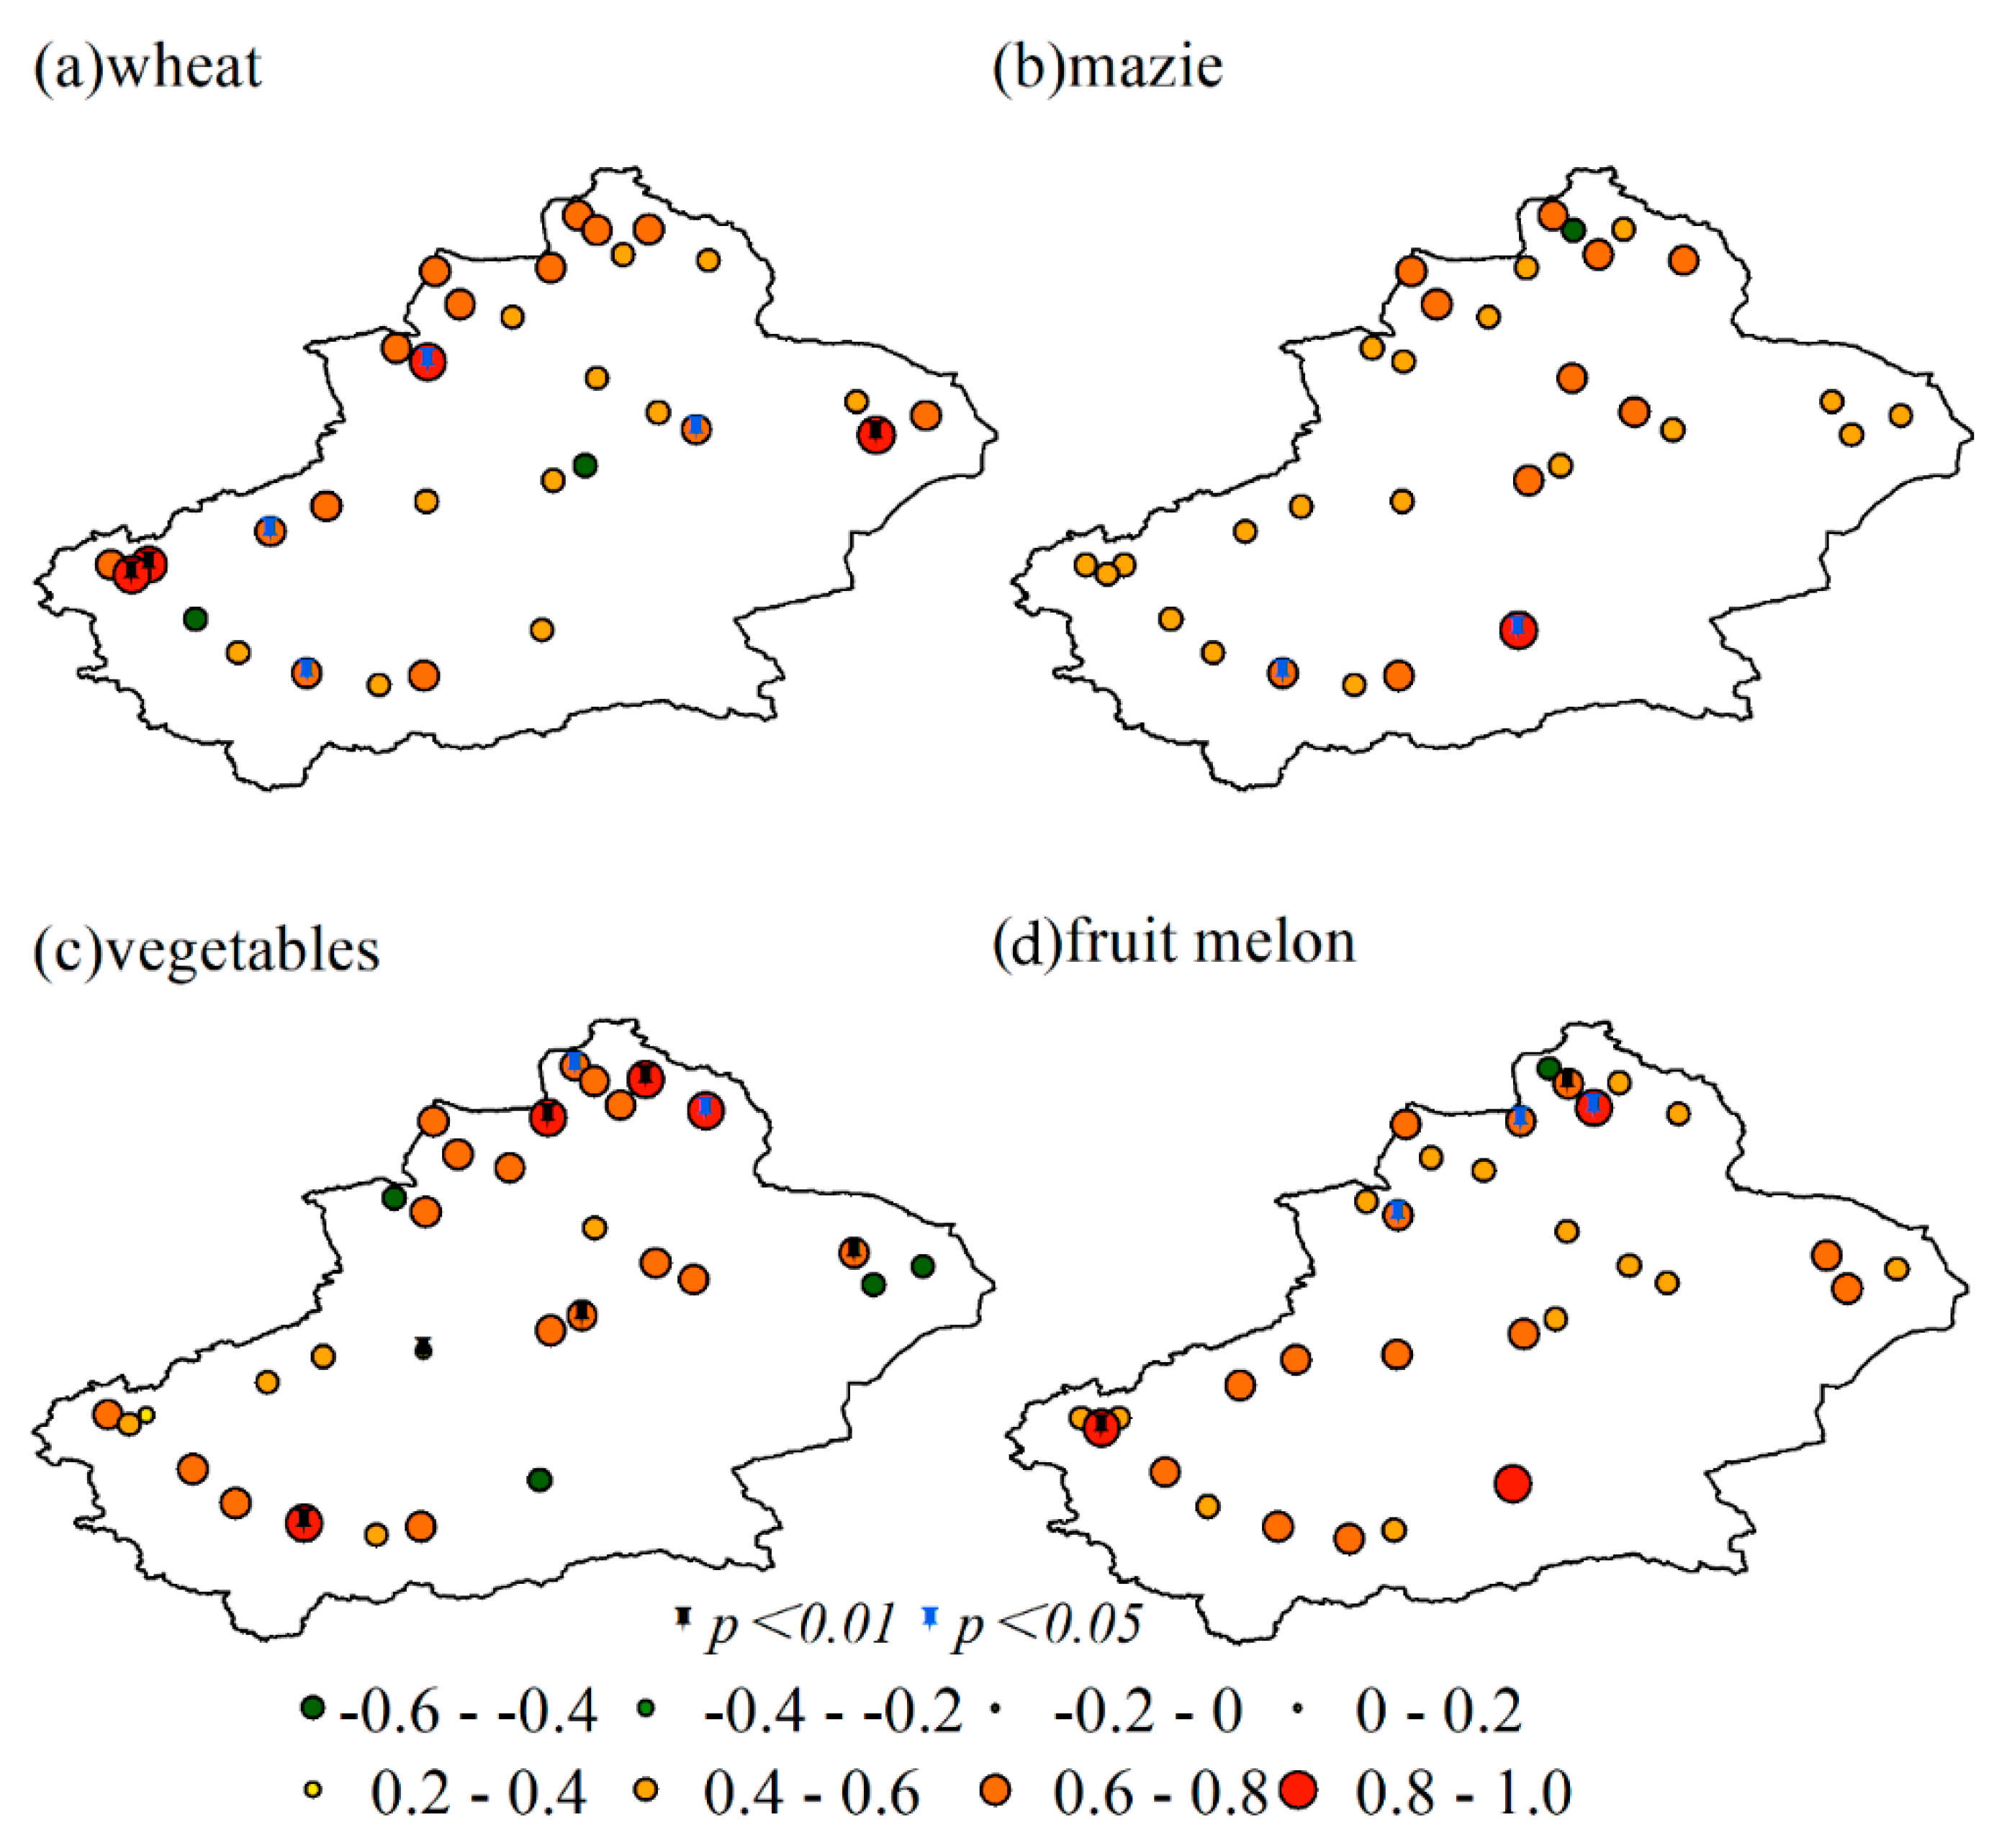
4.3. Effects of Drought on Crop Yields

In general, drought is more destructive during the cropping season [72]. The drought-affected area decreased by 0.045 hectares/year during 2000–2015, increased by 0.053 hectares/year during 2000–2008 and decreased by 0.014 hectares/year during 2009–2015. The drought-affected area was greatest in 2008, consistent with this year having a notably severe drought [73]. In 2008, the yields of beet, wheat and vegetables were most affected by the drought (Figure 13).
Many studies have used a multi-time-scale meteorological drought index to evaluate the relationship between drought and yield. Due to the different crop types and study sites, the time scale and month of the drought index and its relationship with varying yields will also be different, hindering the accurate assessment of the impact of agricultural drought on crops [74]. The purpose of applying the agricultural drought index (IDCI) to Xinjiang is to better describe the relationship between drought and crop yield in Xinjiang. The wheat, maize, fruits and vegetables were selected on the basis of data availability. We used Pearson correlation analysis to analyze the correlation between crop yield and the IDCI (Figure 14). There was no significant correlation between crop (wheat, maize, vegetables, fruits) yield and the IDCI at most stations. Five stations showed a significant correlation between wheat yield and the IDCI, among which the correlation coefficients at four stations were 0.8–1.0, and the correlation coefficient at one station was 0.6–0.8 (Figure 14a). Stations with a strong correlation were mainly distributed in northern Xinjiang, especially in Aletai and Tacheng, and in Tomsk. There was only one station with a significant correlation (between maize yield and IDCI; p < 0.05): this was located in the Altay area. Eight stations in Xinjiang showed a significant correlation between vegetable yield and the IDCI, of which six were significant at the 0.05 level and two were significant at the 0.01 level. Stations with a strong correlation and very strong correlation were distributed in the Altay area. In total, 11.9% of stations in Xinjiang showed significant correlation between fruit yield and the IDCI. Similar results have been reported in previous studies. For example, Peña-Gallardo et al. [42] reported a significant (p < 0.05) positive correlation between a multi-scalar drought index and wheat yield but a weaker, insignificant correlation between a uni-scalar drought index and wheat yield. Huang et al. [75] showed that the winter wheat yield was more strongly correlated with the temperature vegetation dryness index (TVDI) than with the vegetation health index (VHI).

5. Conclusions

Here, the climate drought index (SPEI3), vegetation cover index (VCI) and soil moisture condition index (SMCI) were combined to calculate the integrated drought index (IDCI). Significant correlation between the IDCI and soil moisture was found in different regional groups of CMA meteorological stations within Xinjiang, China. The trend in the IDCI was consistent with that of temperature, and contrary to that of precipitation. The following conclusions can be drawn.
(1) The correlation coefficients between the IDCI and the yields of six crops were higher than those of the other drought indices (SPEI3, VCI, SMCI). The correlation coefficient between cotton yield and the IDCI reached 0.547, while correlation coefficients of the IDCI with wheat, maize, beet, vegetable and fruit yields were 0.56, 0.604, 0.524, 0.550 and 0.530, respectively. These results demonstrate that the IDCI can be used to monitor agricultural drought in Xinjiang, and that the IDCI performed better than other individual drought indices (SPEI3, VCI, SMCI).
(2) From 2000 to 2018, the proportion of stations suffering drought decreased in spring, summer, autumn and annually, but increased in winter. Drought showed an increasing trend before 2008 and a weakening trend after 2008. Severe drought and extreme droughts were more frequent in summer than in spring, autumn or winter. Severe and extreme droughts in Xinjiang became less frequent after 2008. The spatial and temporal distributions of the IDCI revealed by REOF analysis showed that droughts in northern Xinjiang, southern Xinjiang, eastern Xinjiang, and the Tianshan Mountains were becoming more frequent before 2008, and less frequent after 2008.
(3) The drought-affected area decreased by 0.045 hectares/year during 2000–2015. The yields of beet, wheat and vegetables were most strongly affected by drought in 2008. There was no significant correlation between crop yield and the IDCI at most stations. Stations showing strong correlations between the yields of wheat, corn, vegetables and the IDCI were mainly located in northern Xinjiang, while stations with a strong correlation between the yield of fruits and IDCI were mostly located in southern Xinjiang.
Although the climate became wetter in Xinjiang during the study period, short-term precipitation does not imply a fundamental change, due to the region’s particular geographical location and climatic conditions. Climate changes also need to be verified more rigorously with a longer time series. The distribution of meteorological stations and soil water stations used in this study is very irregular, with fewer stations in the Tarim Basin and Junggar Basin. Further research should include more stations and a longer data time series.

Author Contributions

Conceptualization, H.L. and Y.Y.; methodology, H.L., Y.Y. and F.L.; writing—review and editing, Y.Y. and J.Z.; writing—original, H.L.; funding acquisition, Y.Y. All authors have read and agreed to the published version of the manuscript.

Funding

This research was jointly funded by the National Natural Science Foundation of China (42377461).

Data Availability Statement

Data is contained within the article.

Acknowledgments

The data used in this paper and their sources are as follows. Daily precipitation, soil moisture and temperature: the National Climate Center (NCC) of the China Meteorological Administration, http://data.cma.cn/ (accessed on 1 January 2020). NDVI data: the National Aeronautics and Space Administration website, https://ladsweb.modaps.eosdis.nasa.gov/search/ (accessed on 1 January 2020). GLDAS soil moisture data: Goddard Earth Sciences Data and Information Services Center, https://disc.gsfc.nasa.gov/ (accessed on 1 January 2020). Crop yield data: the China Statistical Yearbooks Database http://tongji.cnki.net/kns55/index.aspx (accessed on 1 January 2020). Drought-affected area data: China National Bureau of Statistics http://data.stats.gov.cn/ (accessed on 1 January 2020). We are pleased to acknowledge the anonymous reviewers’ and editor’s valuable comments and suggestions to improve this manuscript.

Conflicts of Interest

No potential conflict of interest was reported by the authors.

References

  1. Sánchez, N.; González-Zamora, Á.; Piles, M.; Martínez-Fernández, J. A new Soil Moisture Agricultural Drought Index (SMADI) integrating MODIS and SMOS products: A case of study over the Siberian Peninsula. Remote Sens. 2016, 8, 287. [Google Scholar] [CrossRef]
  2. Chen, Y.; Deng, H.; Li, B.; Li, Z.; Xu, C. Abrupt change of temperature and precipitation extremes in the arid region of Northwest China. Quatern. Int. 2014, 336, 35–43. [Google Scholar] [CrossRef]
  3. Rasmy, M.; Koike, T.; Lawfort, P.; Hara, M.; Fujita, M.; Kimura, F. Assessment of future water resources in the Tone river basin using a combined dynamical-statistical downscaling approach. J.-STAGE 2015, 71, I_73–I_78. [Google Scholar] [CrossRef] [PubMed]
  4. Hao, Z.; Xia, Y.; Luo, L. Toward a categorical drought prediction system based on U.S. Drought Monitor (USDM) and climate forecast. J. Hydrol. 2017, 551, 300–305. [Google Scholar] [CrossRef]
  5. Zhang, M.; Chen, Y.; Shen, Y.; Li, Y. Changes of precipitation extremes in arid Central Asia. Quatern. Int. 2017, 436, 16–27. [Google Scholar] [CrossRef]
  6. Duan, W.; Hanasaki, N.; Shiogama, H.; Chen, Y.; Zou, S.; Nover, D.; Zhou, B.; Wang, Y. Evaluation and Future Projection of Chinese Precipitation Extremes using Large Ensemble High-Resolution Climate Simulations. J. Clim. 2019, 32, 2169–2183. [Google Scholar] [CrossRef]
  7. Sung, J.H.; Chung, E.S. Development of streamflow drought severity-duration-frequency curves using the threshold level method. Hydrol. Earth. Syst. Sci. 2014, 18, 3341–3351. [Google Scholar] [CrossRef]
  8. Zhang, L.; Jiao, W.; Zhang, H.; Huang, C.; Tong, Q. Studying drought phenomena in the Continental United States in 2011 and 2012 using various drought indices. Remote Sens. Environ. 2017, 190, 96–106. [Google Scholar] [CrossRef]
  9. Liu, L.; Wang, Y.; You, N.; Liang, Z.; Qin, D.; Li, S. Changes in aridity and its driving factors in China during 1961–2016. Int. J. Climatol. 2018, 39, 50–60. [Google Scholar] [CrossRef]
  10. Wu, X.; Hao, Z.; Zhang, X.; Li, C.; Hao, F. Evaluation of severity changes of compound dry and hot events in China based on a multivariate multi-index approach. J. Hydrol. 2020, 583, 124580. [Google Scholar] [CrossRef]
  11. Mpelasoka, F.; Hennessy, K.; Jones, R.; Bates, B. Comparison of suitable drought indices for climate change impacts assessment over Australia towards resource management. Int. J. Climatol. 2008, 28, 1283–1292. [Google Scholar] [CrossRef]
  12. Akyuz, D.E.; Bayazit, M.; Onoz, B. Markov chain models for hydrological drought characteristics. J. Hydrometeorol. 2012, 13, 298–309. [Google Scholar] [CrossRef]
  13. Paneque, P. Drought management strategies in Spain. Water 2015, 7, 6689–6701. [Google Scholar] [CrossRef]
  14. Dubrovsky, M.; Svoboda, M.D.; Trnka, M.; Hayes, M.J.; Wilhite, D.A.; Zalud, Z.; Hlavinka, P. Application of relative drought indices in assessing climate-change impacts on drought conditions in Czechia. Theor. Appl. Climatol. 2009, 96, 155–171. [Google Scholar] [CrossRef]
  15. Piao, S.; Ciais, P.; Huang, Y.; Shen, Z.; Peng, S.; Li, J.; Zhou, L.; Liu, H.; Ma, Y.; Ding, Y.; et al. The impacts of climate change on water resources and agriculture in China. Nature 2010, 467, 43–51. [Google Scholar] [CrossRef] [PubMed]
  16. Li, K.; Wu, S.; Dai, E.; Xu, Z. Flood loss analysis and quantitative risk assessment in China. Nat. Hazarads 2012, 63, 737–760. [Google Scholar] [CrossRef]
  17. Zhang, Q.; Gu, X.; Singh, V.P.; Kong, D.; Chen, X. Spatiotemporal behavior of floods and droughts and their impacts on agriculture in China. Glob. Planet. Change 2015, 131, 63–72. [Google Scholar] [CrossRef]
  18. Han, Z.; Huang, S.; Huang, Q.; Leng, G.; Wang, H. Propagation dynamics from meteorological to groundwater drought and their possible influence factors. J. Hydrol. 2019, 578, 124102. [Google Scholar] [CrossRef]
  19. Tao, H.; Diop, L.; Bodian, A.; Djaman, K.; Ndiaye, P.M.; Yaseen, Z.M. Reference evapotranspiration prediction using hybridized fuzzy model with firefly algorithm: Regional case study in Burkina Faso. Agric. Water Manag. 2018, 208, 140–151. [Google Scholar] [CrossRef]
  20. Mishra, A.K.; Singh, V.P. A review of drought concepts. J. Hydrol. 2010, 391, 202–216. [Google Scholar] [CrossRef]
  21. Sheffield, J.; Wood, E.F.; Roderick, L.M. Little change in global drought over the past 60 years. Nature 2012, 491, 435–438. [Google Scholar] [CrossRef] [PubMed]
  22. Esfahanian, E.; Nejadhashemi, A.P.; Abouali, M.; Adhikari, U.; Zhang, Z.; Daneshvar, F.; Renani, A.A.; Herman, M.R.; Tang, Y. Defining drought in the context of stream health. Ecol. Eng. 2016, 94, 668–681. [Google Scholar] [CrossRef]
  23. Heim, R.R., Jr. A Review of Twentieth-Century Drought Indices Used in the United States. Bull. Am. Meteorol. Soc. 2002, 83, 1149–1166. [Google Scholar] [CrossRef]
  24. Cheng, Q.; Gao, L.; Chen, Y.; Liu, M.; Deng, H.; Chen, X. Temporal-Spatial Characteristics of Drought in Guizhou Province, China, Based on Multiple Drought Indices and Historical Disaster Records. Adv. Meteorol. 2018, 2018, 4721269. [Google Scholar] [CrossRef]
  25. McKee, T.B.; Doesken, N.J.; Kleist, J. The relationship of drought frequency and duration of time scales. In Proceedings of the Eighth Conference on Applied Climatology, Anaheim, CA, USA, 17–22 January 1993; pp. 179–186. [Google Scholar]
  26. Hertig, E.Y.; Tramblay, Y. Regional downscaling of Mediterranean droughts under past and future climatic conditions. Glob. Planet Change 2017, 151, 36–48. [Google Scholar] [CrossRef]
  27. Vicente-Serrano, S.M.; Beguería, S.; López-Moreno, J.I. A multiscalar drought index sensitive to global warming: The standardized precipitation evapotranspiration index. J. Clim. 2010, 23, 1696–1718. [Google Scholar] [CrossRef]
  28. Yu, M.; Li, Q.; Hayes, M.J.; Svoboda, M.D.; Heim, R.R. Are droughts becoming more frequent or severe in China based on the standardized precipitation evapotranspiration index: 1951–2010? Int. J. Climatol. 2014, 34, 545–558. [Google Scholar] [CrossRef]
  29. Kogan, K.N. Drought of the late 1980s in the United States as derived from NOAA polar-orbiting satellite data. Bull. Am. Meteorol. Soc. 1995, 76, 655–668. [Google Scholar] [CrossRef]
  30. Gebrehiwot, T.; van der Veen, A.; Maathuis, B. Spatial and temporal assessment of drought in the Northern highlands of Ethiopia. Int. J. Appl. Earth. Obs. 2011, 13, 309–321. [Google Scholar] [CrossRef]
  31. Palmer, W.C. Meteorological Drought; Research Paper, No. 45; United States Weather Bureau: Washington, DC, USA, 1965; pp. 1–56.
  32. Wang, Z.L.; Li, J.L.; Lai, C.G.; Zeng, Z.Y.; Zhong, R.D.; Chen, X.H.; Zhou, X.W.; Wang, M.Y. Does drought in China show a significant decreasing trend from 1961 to 2009? Sci. Total Environ. 2017, 579, 314–324. [Google Scholar] [CrossRef]
  33. Zhang, B.Q.; Wu, P.T.; Zhao, X.N.; Wang, Y.B.; Wang, J.W.; Shi, Y.G. Drought variation trends in different subregions of the Chinese Loess Plateau over the past four decades. Agric. Water Manag. 2012, 115, 167–177. [Google Scholar] [CrossRef]
  34. Vicente-Serrano, S.M.; Lopez-Moreno, J.I.; Begueria, S.; Lorenzo-Lacruz, J.; Azorin-Molina, C.; Moran-Tejeda, E. Accurate computation of a streamflow drought index. J. Hydrogen Energy 2012, 17, 318–332. [Google Scholar] [CrossRef]
  35. Wang, H.; Chen, Z.; Chen, Y.; Pan, Y.; Feng, R. Identification of the Space-Time Variability of Hydrological Drought in the Arid Region of Northwestern China. Water 2019, 11, 1051. [Google Scholar] [CrossRef]
  36. Bloomfield, J.P.; Marchant, B.P. Analysis of groundwater drought building on the standardized precipitation index approach. Hydrol. Earth Syst. Sci. 2013, 17, 4769–4787. [Google Scholar] [CrossRef]
  37. Feng, K.; Su, L.; Zhang, X.; Javed, T.; Zhang, Z.Z. Development of a new integrated hydrological drought index (SRGI) and its application in the Heihe River Basin, China. Theor. Appl. Climatol. 2020, 141, 43–59. [Google Scholar] [CrossRef]
  38. Karamouz, M.; Rasouli, K.; Nazif, S. Development of a hybrid index for drought prediction: Case study. J. Hydrogen Energy 2009, 14, 617–627. [Google Scholar] [CrossRef]
  39. Mu, Q.; Zhao, M.; Kimball, J.S.; McDowell, N.G.; Running, S.W. A remotely sensed global terrestrial drought severity index. Bull. Am. Meteorol. Soc. 2013, 94, 83–98. [Google Scholar] [CrossRef]
  40. Wu, X.; Wang, P.; Huo, Z.; Wu, D.; Yang, J. Crop Drought Identification Index for winter wheat based on evapotranspiration in the Huang-Huai-Hai Plain, China. Agric. Ecosyst. Environ. 2018, 263, 18–30. [Google Scholar] [CrossRef]
  41. Hao, Z.A.; Aghakouchak, A. A nonparametric multivariate multi-index drought monitoring framework. J. Hydrometeorol. 2014, 15, 89–101. [Google Scholar] [CrossRef]
  42. Peña-Gallardo, M.; Vicente-Serrano, S.M.; Domínguez-Castro, F.; Beguería, S. The impact of drought on the productivity of two rainfed crops in Spain. Nat. Hazard. Eart. 2019, 19, 1215–1234. [Google Scholar] [CrossRef]
  43. Shen, Z.; Zhang, Q.; Singh, V.P.; Sun, P.; Song, C.; Yu, H. Agricultural drought monitoring across Inner Mongolia, China: Model development, spatiotemporal patterns and impacts. J. Hydrol. 2019, 571, 793–804. [Google Scholar] [CrossRef]
  44. Rhee, J.; Im, J.; Carbone, G.J. Monitoring agricultural drought for arid and humid regions using multisensor remote sensing data. Remote Sens. Environ. 2010, 114, 2875–2887. [Google Scholar] [CrossRef]
  45. Ali, Z.; Hussain, I.; Faisal, M.; Nazir, H.; Abd-el Moemen, M.; Hussain, T.; Shamsuddin, S. A Novel Multi-Scalar Drought Index for Monitoring Drought: The Standardized Precipitation Temperature Index. Water Resour. Manag. 2017, 31, 4957–4969. [Google Scholar] [CrossRef]
  46. Zhang, X.; Chen, N.; Li, J.; Chen, Z.; Niyogi, D. Multi-sensor integrated framework and index for agricultural drought monitoring. Remote Sens. Environ. 2017, 188, 141–163. [Google Scholar] [CrossRef]
  47. Chen, Y.; Li, W.; Deng, H.; Fang, G.; Li, Z. Changes in Central Asia’s water tower: Past, present and future. Sci. Rep. 2016, 6, 35458. [Google Scholar] [CrossRef] [PubMed]
  48. Zhang, Q.; Sun, P.; Li, J.; Singh, V.P.; Liu, J. Spatiotemporal properties of droughts and related impacts on agriculture in Xinjiang, China. Int. J. Climatol. 2015, 35, 1254–1266. [Google Scholar] [CrossRef]
  49. Wang, H.; Pan, Y.; Chen, Y. Comparison of three drought indices and their evolutionary characteristics in the arid region of northwestern China. Atmos. Sci. Lett. 2017, 18, 132–139. [Google Scholar] [CrossRef]
  50. Yao, J.; Zhao, Y.; Chen, Y.; Yu, X.; Zhang, R. Multi-scale assessments of droughts: A case study in Xinjiang, China. Sci. Total Environ. 2018, 630, 444–452. [Google Scholar] [CrossRef] [PubMed]
  51. Li, X.; You, Q.; Ren, G.; Wang, S.; Zhang, Y.; Yang, J.; Zheng, G. Concurrent droughts and hot extremes in Northwest China from 1961 to 2017. Int. J. Climatol. 2018, 39, 2186–2196. [Google Scholar] [CrossRef]
  52. Duan, Y.; Wang, W.; Cai, X. Applied analyses on Palmer, SPEI and CI indices of drought process in Yangtze-Huaihe River Basins during winter of 2010/spring of 2011. Plateau Meteor. 2013, 32, 1126–1139. (In Chinese) [Google Scholar] [CrossRef]
  53. Huang, S.; Li, P.; Huang, Q.; Leng, G.; Hou, B.; Ma, L. The propagation from meteorological to hydrological drought and its potential influence factors. J. Hydrol. 2017, 547, 184–195. [Google Scholar] [CrossRef]
  54. Shin, J.Y.; Chen, S.; Lee, J.H.; Kim, T.W. Investigation of drought propagation in South Korea using drought index and conditional probability. Terr. Atmos. Ocean. 2018, 29, 231–241. [Google Scholar] [CrossRef]
  55. Meng, L.K.; Dong, T.; Zhang, W. Drought monitoring using an Integrated Drought Condition Index (IDCI) derived from multi-sensor remote sensing data. Nat. Hazards 2016, 80, 1135–1152. [Google Scholar] [CrossRef]
  56. Zhang, Q.; Li, J.; Singh, V.P.; Bai, Y. SPI-based evaluation of drought events in Xinjiang, China. Nat. Hazards 2012, 64, 481–492. [Google Scholar] [CrossRef]
  57. Zhang, R.; Yuan, Y.; Gou, X.; He, Q.; Shang, H.; Zhang, T.; Chen, F.; Ermenbaev, B.; Yu, S.; Qin, L.; et al. Tree-ring-based moisture variability in western Tianshan Mountains since A.D. 1882 and its possible driving mechanism. Agric. For. Meteorol. 2016, 218–219, 267–276. [Google Scholar] [CrossRef]
  58. Liu, Z.; Wang, Y.; Shao, M.; Jia, X.; Li, X. Spatiotemporal analysis of multiscalar drought characteristics across the Loess Plateau of China. J. Hydrol. 2016, 534, 281–299. [Google Scholar] [CrossRef]
  59. Khan, R.; Gilani, H.; Iqbal, N.; Shahid, I. Satellite-based (2000–2015) drought hazard assessment with indices, mapping, and monitoring of Potohar plateau, Punjab, Pakistan. Environ Earth Sci. 2020, 79, 23. [Google Scholar] [CrossRef]
  60. Beguería, S.; Vicente-Serrano, S.M.; Reig, F.; Latorre, B. Standardized precipitation evapotranspiration index (SPEI) revisited: Parameter fitting, evapotranspiration models, tools, datasets and drought monitoring. Int. J. Climatol. 2013, 34, 3001–3023. [Google Scholar] [CrossRef]
  61. Allen, R.G.; Pereira, L.S.; Raes, D.; Smith, M. FAO Irrigation and Drainage Paper No. 56; Food and Agriculture Organization of the United Nations: Rome, Italy, 1998; pp. 26–40. [Google Scholar]
  62. Yang, P.; Xia, J.; Zhang, Y.Y.; Zhan, C.S.; Qiao, Y.F. Comprehensive assessment of drought risk in the arid region of Northwest China based on the global palmer drought severity index gridded data. Sci. Total Environ. 2018, 627, 951–962. [Google Scholar] [CrossRef]
  63. Wang, H.S.; Rogers, J.C.; Munroe, D.K. Commonly Used Drought Indices as Indicators of Soil Moisture in China. J. Hydrometeorol. 2015, 16, 1397–1408. [Google Scholar] [CrossRef]
  64. Dai, A.; Trenberth, K.E.; Qian, T. A Global Dataset of Palmer Drought Severity Index for 1870-2002: Relationship with Soil Moisture and Effects of Surface Warming. J. Hydrometeorol. 2004, 5, 1117–1130. [Google Scholar] [CrossRef]
  65. Mika, J.; Horváth, S.; Makra, L.; Dunkel, Z. The Palmer Drought Severity Index (PDSI) as an indicator of soil moisture. Phys. Chem. Earth 2005, 30, 223–230. [Google Scholar] [CrossRef]
  66. Daryanto, S.; Wang, L.; Jacinthe, P.A. Global synthesis of drought effects on maize and wheat production. PLoS ONE 2016, 11, e0156362. [Google Scholar] [CrossRef] [PubMed]
  67. Li, B.; Chen, Y.; Shi, X.; Chen, Z.; Li, W. Temperature and precipitation changes in different environments in the arid region of Northwest China. Theor. Appl. Climatol. 2012, 112, 589–596. [Google Scholar] [CrossRef]
  68. Li, J.; Cook, E.R.; D’arrigo, R.; Chen, F.; Gou, X. Moisture variability across China and Mongolia: 1951–2005. Clim. Dynam. 2009, 32, 1173–1186. [Google Scholar] [CrossRef]
  69. Chen, H.; Sun, J. Changes in drought characteristics over China using the sta ndardised precipitation evapotranspiration index. J. Clim. 2015, 28, 5430–5447. [Google Scholar] [CrossRef]
  70. Zhai, J.; Su, B.; Krysanova, V.; Vetter, T.; Gao, C.; Jiang, T. Spatial variation and trends in PDSI and SPI indices and their relation to streamflow in 10 large regions of China. J. Clim. 2010, 23, 649–663. [Google Scholar] [CrossRef]
  71. Li, Z.; Chen, Y.; Fang, G.; Li, Y. Multivariate assessment and attribution of droughts in Central Asia. Sci. Rep. 2017, 7, 1316. [Google Scholar] [CrossRef]
  72. Mishra, V.; Cherkauer, K.A. Retrospective droughts in the crop growing season: Implications to corn and soybean yield in the Midwestern United States. Agric. Forest. Meteorol. 2010, 150, 1030–1045. [Google Scholar] [CrossRef]
  73. Ma, Y.; Ta, X.; Liu, X.; Lv, G. Application of Multitemporal SPOT satellite imagery to monitoring extraordinarily serious drought in 2008. Xinjiang Agric. Sci. 2009, 46, 1098–1102. (In Chinese) [Google Scholar]
  74. Sadat, N.S.M.; Liaghat, A.M.; Ebrahimi, K. Prediction of crop production using drought indices at different time scales and climatic factors to manage drought risk. J. Am. Water Resour. Association 2011, 48, 1–9. [Google Scholar] [CrossRef]
  75. Huang, J.; Zhuo, W.; Li, Y.; Huang, R.; Sedano, F.; Su, W.; Zhu, D.; Zhang, X. Comparison of three remotely sensed drought indices for assessing the impact of drought on winter wheat yield. Int. J. Digit. Earth 2020, 13, 504–526. [Google Scholar] [CrossRef]
Figure 1. Study area and the location of 42 weather stations and 5 soil moisture stations in Xinjiang (elevations are in meters).
Water 16 00325 g001
Figure 2. Flow chart of the calculation procedure.
Water 16 00325 g002
Figure 3. Scatter plots showing correlation between the IDCI and the observed soil moisture content (SM) at different soil depths (*/** represent significance at p < 0.05 and p < 0.01, respectively). SM unit: %.
Water 16 00325 g003
Figure 4. Correlation coefficients between the four drought indices and the observed soil moisture content (SM) at different soil depths.
Water 16 00325 g004
Figure 5. Correlation coefficients between the four drought indices and SCYI values of different crops.
Water 16 00325 g005
Figure 6. The percentages of meteorological stations experiencing various drought intensities during 2000–2018, for (a) spring, (b) summer, (c) autumn, (d) winter, and (e) annual mean.
Water 16 00325 g006
Figure 7. Temporal variations in the IDCI during 2000–2018: annual mean (a), spring (b), summer (c), autumn (d) and winter (e). a is the IDCI trend during 2000–2018, a1 and a2 are the IDCI trends before and after 2008.
Water 16 00325 g007
Figure 8. Temporal variations ((a) precipitation amount, and (b) temperature) during 2000–2018. Equations show their respective linear trends.
Water 16 00325 g008
Figure 9. Spatial patterns of trends ((a) IDCI; (b) precipitation amount; (c) temperature) during 2000–2018. Colored circles indicate increasing (red) or decreasing (green) trends, and those which are significant at p < 0.05.
Water 16 00325 g009
Figure 10. Spatial and temporal patterns of IDCI during 2000–2018, based on REOF analysis. The product of REOFi and PCRi represents the conditions in each zone: positive (negative) values indicate dry (wet) conditions.
Water 16 00325 g010
Figure 11. Spatial pattern of drought (severe drought, extremely severe drought) occurrence at seasonal and annual scales during 2000–2008.
Water 16 00325 g011
Figure 12. Spatial pattern of drought occurrence (severe drought, extremely severe drought) frequency at seasonal and annual scales during 2009–2018.
Water 16 00325 g012
Figure 13. Changes in the drought-affected area during 2000–2015 (left), compared to the crop yields in different years. The yield for each crop is described as its annual crop yield divided by its long-term mean (right).
Water 16 00325 g013
Figure 14. Correlation coefficients between IDCI and yields of various crops during 2005–2015: (a) wheat, (b) maize, (c) vegetables, (d) fruits.
Water 16 00325 g014
Table 1. The coefficients of SMCI (a), VCI (b) and SPEI3 (c) computed by principal components analysis.
Station IDabcStation IDabc
10.5290.3330.139230.5860.2970.118
20.5420.3310.127240.5930.3380.069
30.5170.3340.149250.5770.3300.092
40.5270.3300.144260.5780.3310.091
50.5540.3290.117270.5490.3370.114
60.4630.3170.220280.4170.3490.234
70.4360.3410.223290.4350.3170.249
80.4150.3450.240300.5710.2920.137
90.4700.3340.196310.5950.3330.072
100.4550.3330.212320.5590.3330.108
110.4640.3230.213330.5900.3260.085
120.5470.3280.126340.5120.3230.165
130.4910.3350.174350.4820.3560.162
140.4870.3330.180360.4750.3330.191
150.4890.3330.178370.4330.3220.245
160.5030.3360.161380.4860.3340.180
170.5050.3360.159390.5370.3130.150
180.4900.3340.177400.4910.3450.164
190.5080.3260.166410.5200.3350.145
200.4580.2850.257420.3770.3340.290
210.4560.3440.201
220.5010.2990.200
Note: IDCI is classified according to the standard SPI classification, as shown in Table 2.
Table 2. The classification of drought with IDCI.
Drought EventsIDCIOccurrence Frequency
No droughtIDCI > 070%
Mild drought−0.364 < IDCI ≤ 015%
Moderate drought−0.568 < IDCI ≤ −0.36410%
Severe drought−0.658 < IDCI ≤ −0.5685%
Extremely severe droughtIDCI ≤ −0.6582%
Disclaimer/Publisher’s Note: The statements, opinions and data contained in all publications are solely those of the individual author(s) and contributor(s) and not of MDPI and/or the editor(s). MDPI and/or the editor(s) disclaim responsibility for any injury to people or property resulting from any ideas, methods, instructions or products referred to in the content.

